money-laundering-and-countermeasures-a-critical-analysis-of ...
Upload
khangminh22Category
view
4download
0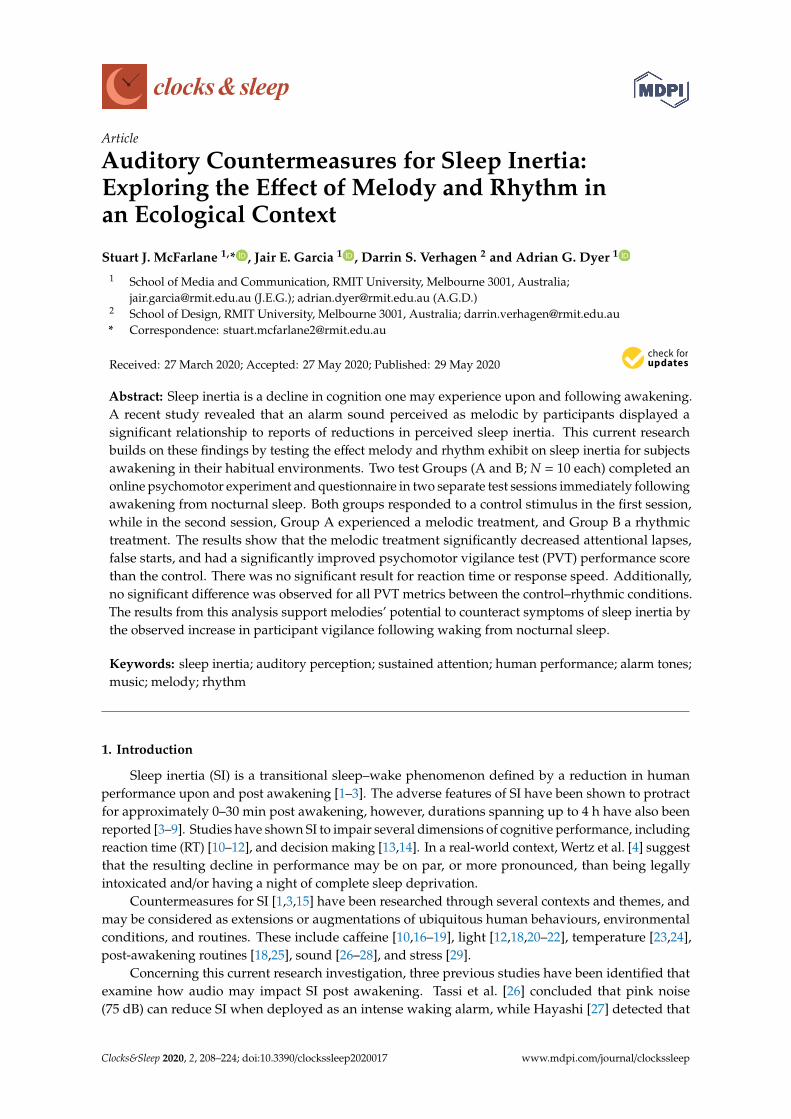
Article
Auditory Countermeasures for Sleep Inertia:Exploring the Effect of Melody and Rhythm inan Ecological Context
Stuart J. McFarlane 1,* , Jair E. Garcia 1 , Darrin S. Verhagen 2 and Adrian G. Dyer 1
1 School of Media and Communication, RMIT University, Melbourne 3001, Australia;[email protected] (J.E.G.); [email protected] (A.G.D.)
2 School of Design, RMIT University, Melbourne 3001, Australia; [email protected]* Correspondence: [email protected]
Received: 27 March 2020; Accepted: 27 May 2020; Published: 29 May 2020�����������������
Abstract: Sleep inertia is a decline in cognition one may experience upon and following awakening.A recent study revealed that an alarm sound perceived as melodic by participants displayed asignificant relationship to reports of reductions in perceived sleep inertia. This current researchbuilds on these findings by testing the effect melody and rhythm exhibit on sleep inertia for subjectsawakening in their habitual environments. Two test Groups (A and B; N = 10 each) completed anonline psychomotor experiment and questionnaire in two separate test sessions immediately followingawakening from nocturnal sleep. Both groups responded to a control stimulus in the first session,while in the second session, Group A experienced a melodic treatment, and Group B a rhythmictreatment. The results show that the melodic treatment significantly decreased attentional lapses,false starts, and had a significantly improved psychomotor vigilance test (PVT) performance scorethan the control. There was no significant result for reaction time or response speed. Additionally,no significant difference was observed for all PVT metrics between the control–rhythmic conditions.The results from this analysis support melodies’ potential to counteract symptoms of sleep inertia bythe observed increase in participant vigilance following waking from nocturnal sleep.
Keywords: sleep inertia; auditory perception; sustained attention; human performance; alarm tones;music; melody; rhythm
1. Introduction
Sleep inertia (SI) is a transitional sleep–wake phenomenon defined by a reduction in humanperformance upon and post awakening [1–3]. The adverse features of SI have been shown to protractfor approximately 0–30 min post awakening, however, durations spanning up to 4 h have also beenreported [3–9]. Studies have shown SI to impair several dimensions of cognitive performance, includingreaction time (RT) [10–12], and decision making [13,14]. In a real-world context, Wertz et al. [4] suggestthat the resulting decline in performance may be on par, or more pronounced, than being legallyintoxicated and/or having a night of complete sleep deprivation.
Countermeasures for SI [1,3,15] have been researched through several contexts and themes, andmay be considered as extensions or augmentations of ubiquitous human behaviours, environmentalconditions, and routines. These include caffeine [10,16–19], light [12,18,20–22], temperature [23,24],post-awakening routines [18,25], sound [26–28], and stress [29].
Concerning this current research investigation, three previous studies have been identified thatexamine how audio may impact SI post awakening. Tassi et al. [26] concluded that pink noise(75 dB) can reduce SI when deployed as an intense waking alarm, while Hayashi [27] detected that
Clocks&Sleep 2020, 2, 208–224; doi:10.3390/clockssleep2020017 www.mdpi.com/journal/clockssleep
Clocks&Sleep 2020, 2 209
excitatory music, particularly high-preference popular music (60 dB) as specified by participants hasthe potential to reduce the impact of SI after a short nap. Through an ecologically valid approach,McFarlane et al. [28] revealed that participant alarm sounds perceived as melodic showed a significantrelationship to reductions in perceived sleep inertia, as compared to their “neither unmelodic normelodic” counterparts. Additionally, it was shown that a melodic alarm sound is perceived to be morerhythmic than a neutral interpretation [28]. Taken together, the studies discussed above demonstratethat sound and music are plausible awakening countermeasures for SI, and, with additional research,we may establish a refined understanding of the auditory aesthetics and musical mechanisms requiredfor the best-practice design of such stimuli.
From an operational and end-user perspective, real-world circumstances may benefit from soundstimuli targeted at the reduction of SI, including occupational settings; where audio is employed toactivate employees immediately following awakening, and improved day-to-day awakening alarmtones, which are common within society and our auditory ecology [30].
In the current study, we examine the influence saliently melodic and rhythmic alarm tone treatmentshave on SI immediately post awakening in ecological conditions comparative to a non-melodic control.Through this investigation, we aim to build on initial findings by McFarlane et al. [28] to furtherunderstand whether and how melody may assist in counteracting SI, and the relationship rhythmmay have to SI reduction when tested in isolation. Within the broader context of auditory-assistedawakening, our goal is to provide evidence that may be expanded upon and referenced in thefuture development and testing of sound stimuli to counteract SI in both natural, auditory complexsurroundings and laboratory conditions.
2. Results
2.1. Test Group A: Melody Stimulus
Participants were aged between 18 and 49 (18–29 (n = 5), 30–39 (n = 2), 40–49 (n = 3)), consisted ofmales and females (40% female), with 40% of participants reporting consistent sleep epochs of 5–7 hper night, and 50% reporting 7+ hours respectively (3–5 h (n = 1), 5–7 h (n = 4), 7–9 h (n = 4), 9+ hours(n = 1)).
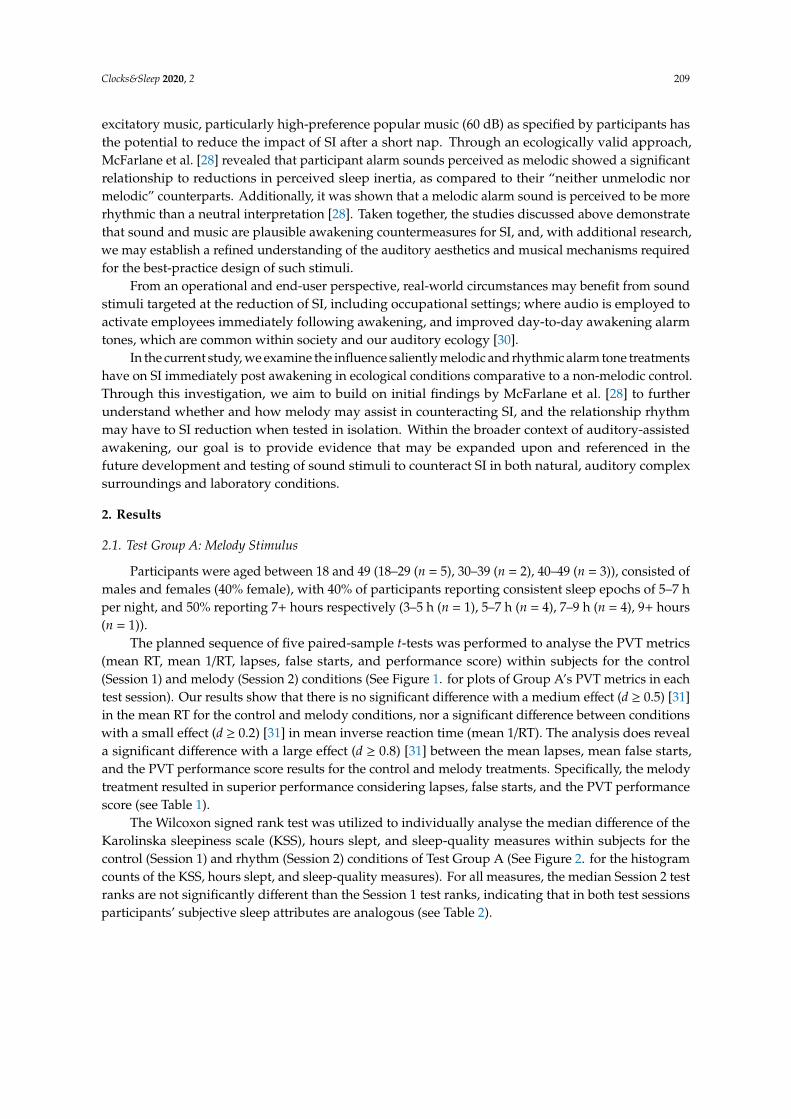
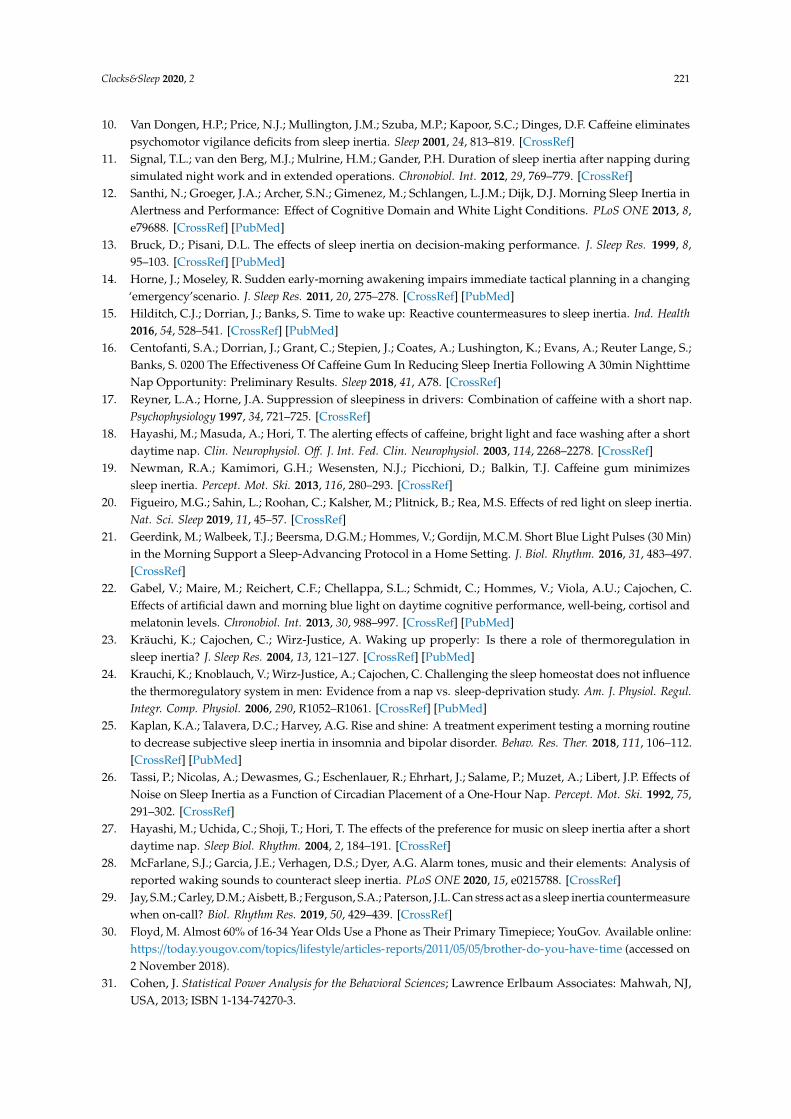
The planned sequence of five paired-sample t-tests was performed to analyse the PVT metrics(mean RT, mean 1/RT, lapses, false starts, and performance score) within subjects for the control(Session 1) and melody (Session 2) conditions (See Figure 1. for plots of Group A’s PVT metrics in eachtest session). Our results show that there is no significant difference with a medium effect (d ≥ 0.5) [31]in the mean RT for the control and melody conditions, nor a significant difference between conditionswith a small effect (d ≥ 0.2) [31] in mean inverse reaction time (mean 1/RT). The analysis does reveala significant difference with a large effect (d ≥ 0.8) [31] between the mean lapses, mean false starts,and the PVT performance score results for the control and melody treatments. Specifically, the melodytreatment resulted in superior performance considering lapses, false starts, and the PVT performancescore (see Table 1).
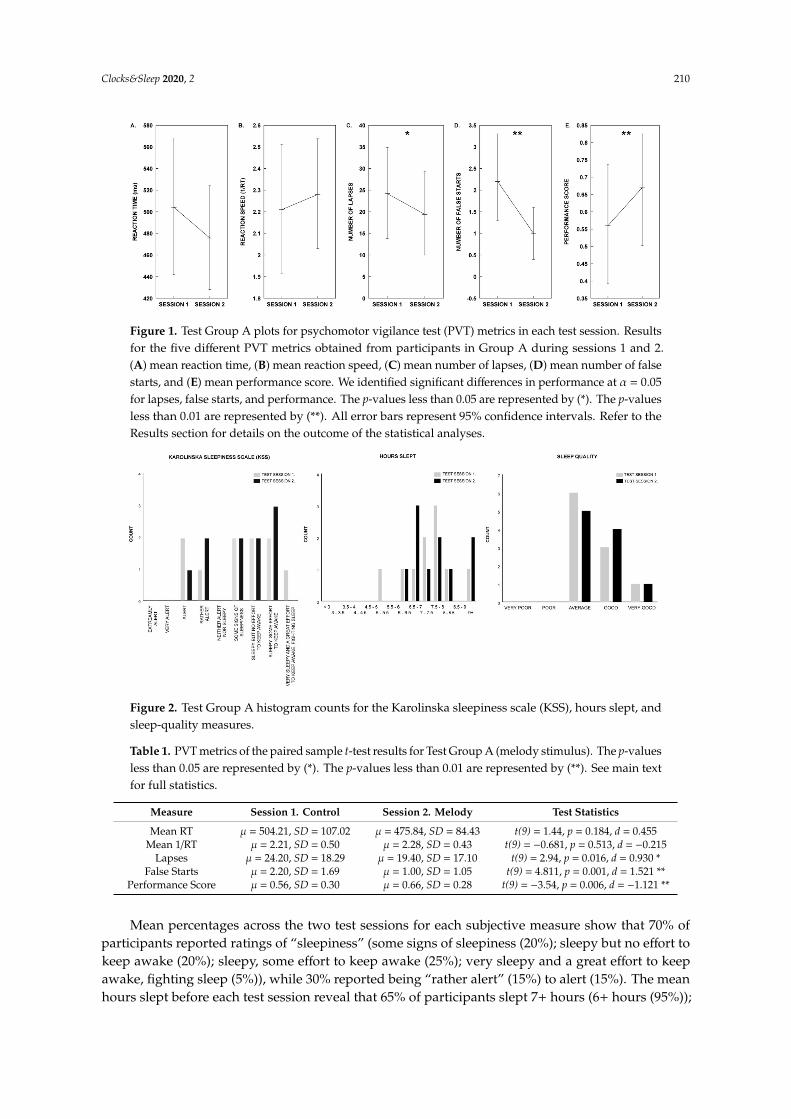
The Wilcoxon signed rank test was utilized to individually analyse the median difference of theKarolinska sleepiness scale (KSS), hours slept, and sleep-quality measures within subjects for thecontrol (Session 1) and rhythm (Session 2) conditions of Test Group A (See Figure 2. for the histogramcounts of the KSS, hours slept, and sleep-quality measures). For all measures, the median Session 2 testranks are not significantly different than the Session 1 test ranks, indicating that in both test sessionsparticipants’ subjective sleep attributes are analogous (see Table 2).
Clocks&Sleep 2020, 2 210
Clocks & Sleep 2020, 2 FOR PEER REVIEW 2
music, particularly high‐preference popular music (60 dB) as specified by participants has the
potential to reduce the impact of SI after a short nap. Through an ecologically valid approach,
McFarlane et al. [28] revealed that participant alarm sounds perceived as melodic showed a
significant relationship to reductions in perceived sleep inertia, as compared to their “neither
unmelodic nor melodic” counterparts. Additionally, it was shown that a melodic alarm sound is
perceived to be more rhythmic than a neutral interpretation [28]. Taken together, the studies
discussed above demonstrate that sound and music are plausible awakening countermeasures for SI,
and, with additional research, we may establish a refined understanding of the auditory aesthetics
and musical mechanisms required for the best‐practice design of such stimuli.
From an operational and end‐user perspective, real‐world circumstances may benefit from
sound stimuli targeted at the reduction of SI, including occupational settings; where audio is
employed to activate employees immediately following awakening, and improved day‐to‐day
awakening alarm tones, which are common within society and our auditory ecology [30].
In the current study, we examine the influence saliently melodic and rhythmic alarm tone
treatments have on SI immediately post awakening in ecological conditions comparative to a non‐
melodic control. Through this investigation, we aim to build on initial findings by McFarlane et al.
[28] to further understand whether and how melody may assist in counteracting SI, and the
relationship rhythm may have to SI reduction when tested in isolation. Within the broader context of
auditory‐assisted awakening, our goal is to provide evidence that may be expanded upon and
referenced in the future development and testing of sound stimuli to counteract SI in both natural,
auditory complex surroundings and laboratory conditions.
2. Results
2.1. Test Group A: Melody Stimulus
Participants were aged between 18 and 49 (18–29 (n = 5), 30–39 (n = 2), 40–49 (n = 3)), consisted
of males and females (40% female), with 40% of participants reporting consistent sleep epochs of 5–7
h per night, and 50% reporting 7+ hours respectively (3–5 h (n = 1), 5–7 h (n = 4), 7–9 h (n = 4), 9+ hours
(n = 1)).
Figure 1. Test Group A plots for psychomotor vigilance test (PVT) metrics in each test session. Results
for the five different PVT metrics obtained from participants in Group A during sessions 1 and 2. (A)
mean reaction time, (B) mean reaction speed, (C) mean number of lapses, (D) mean number of false
starts, and (E) mean performance score. We identified significant differences in performance at α =
0.05 for lapses, false starts, and performance. The p‐values less than 0.05 are represented by (*). The p‐
values less than 0.01 are represented by (**). All error bars represent 95% confidence intervals. Refer
to the Results section for details on the outcome of the statistical analyses.
The planned sequence of five paired‐sample t‐tests was performed to analyse the PVT metrics
(mean RT, mean 1/RT, lapses, false starts, and performance score) within subjects for the control
(Session 1) and melody (Session 2) conditions (See Figure 1. for plots of Group A’s PVT metrics in
Figure 1. Test Group A plots for psychomotor vigilance test (PVT) metrics in each test session. Resultsfor the five different PVT metrics obtained from participants in Group A during sessions 1 and 2.(A) mean reaction time, (B) mean reaction speed, (C) mean number of lapses, (D) mean number of falsestarts, and (E) mean performance score. We identified significant differences in performance at α = 0.05for lapses, false starts, and performance. The p-values less than 0.05 are represented by (*). The p-valuesless than 0.01 are represented by (**). All error bars represent 95% confidence intervals. Refer to theResults section for details on the outcome of the statistical analyses.
Clocks & Sleep 2020, 2 FOR PEER REVIEW 3
each test session). Our results show that there is no significant difference with a medium effect (d ≥
0.5) [31] in the mean RT for the control and melody conditions, nor a significant difference between
conditions with a small effect (d ≥ 0.2) [31] in mean inverse reaction time (mean 1/RT). The analysis
does reveal a significant difference with a large effect (d ≥ 0.8) [31] between the mean lapses, mean
false starts, and the PVT performance score results for the control and melody treatments.
Specifically, the melody treatment resulted in superior performance considering lapses, false starts,
and the PVT performance score (see Table 1).
Table 1. PVT metrics of the paired sample t‐test results for Test Group A (melody stimulus). The p‐
values less than 0.05 are represented by (*). The p‐values less than 0.01 are represented by (**). See
main text for full statistics.
Measure Session 1. Control Session 2. Melody Test Statistics
Mean RT μ = 504.21, SD = 107.02 μ = 475.84, SD = 84.43 t(9) = 1.44, p = 0.184, d = 0.455
Mean 1/RT μ = 2.21, SD = 0.50 μ = 2.28, SD = 0.43 t(9) = − 0.681, p = 0.513, d = − 0.215
Lapses μ = 24.20, SD = 18.29 μ = 19.40, SD = 17.10 t(9) = 2.94, p = 0.016, d = 0.930 *
False Starts μ = 2.20, SD = 1.69 μ = 1.00, SD = 1.05 t(9) = 4.811, p = 0.001, d = 1.521 **
Performance Score μ = 0.56, SD = 0.30 μ = 0.66, SD = 0.28 t(9) = − 3.54, p = 0.006, d = − 1.121 **
Figure 2. Test Group A histogram counts for the Karolinska sleepiness scale (KSS), hours slept, and
sleep‐quality measures.
The Wilcoxon signed rank test was utilized to individually analyse the median difference of the
Karolinska sleepiness scale (KSS), hours slept, and sleep‐quality measures within subjects for the
control (Session 1) and rhythm (Session 2) conditions of Test Group A (See Figure 2. for the histogram
counts of the KSS, hours slept, and sleep‐quality measures). For all measures, the median Session 2
test ranks are not significantly different than the Session 1 test ranks, indicating that in both test
sessions participants’ subjective sleep attributes are analogous (see Table 2).
Table 2. Wilcoxon signed rank test results for subjective measures of Test Group A. See main text for
full statistics.
Measure Session 1. Control Session 2. Melody Test Statistics
KSS M = 6.50 M = 6.50 z = 0.000, p = 1.000, r = 0.000
HOURS SLEPT M = 10.50 M = 10.50 z = ‐ 1.186, p = 0.236, r = ‐ 0.265
SLEEP QUALITY M = 3.00 M = 3.50 z = ‐ 0.378, p = 0.705, r = ‐ 0.085
Mean percentages across the two test sessions for each subjective measure show that 70% of
participants reported ratings of “sleepiness” (some signs of sleepiness (20%); sleepy but no effort to
keep awake (20%); sleepy, some effort to keep awake (25%); very sleepy and a great effort to keep
Figure 2. Test Group A histogram counts for the Karolinska sleepiness scale (KSS), hours slept, andsleep-quality measures.
Table 1. PVT metrics of the paired sample t-test results for Test Group A (melody stimulus). The p-valuesless than 0.05 are represented by (*). The p-values less than 0.01 are represented by (**). See main textfor full statistics.
Measure Session 1. Control Session 2. Melody Test Statistics
Mean RT µ = 504.21, SD = 107.02 µ = 475.84, SD = 84.43 t(9) = 1.44, p = 0.184, d = 0.455Mean 1/RT µ = 2.21, SD = 0.50 µ = 2.28, SD = 0.43 t(9) = −0.681, p = 0.513, d = −0.215
Lapses µ = 24.20, SD = 18.29 µ = 19.40, SD = 17.10 t(9) = 2.94, p = 0.016, d = 0.930 *False Starts µ = 2.20, SD = 1.69 µ = 1.00, SD = 1.05 t(9) = 4.811, p = 0.001, d = 1.521 **
Performance Score µ = 0.56, SD = 0.30 µ = 0.66, SD = 0.28 t(9) = −3.54, p = 0.006, d = −1.121 **
Mean percentages across the two test sessions for each subjective measure show that 70% ofparticipants reported ratings of “sleepiness” (some signs of sleepiness (20%); sleepy but no effort tokeep awake (20%); sleepy, some effort to keep awake (25%); very sleepy and a great effort to keepawake, fighting sleep (5%)), while 30% reported being “rather alert” (15%) to alert (15%). The meanhours slept before each test session reveal that 65% of participants slept 7+ hours (6+ hours (95%));
Clocks&Sleep 2020, 2 211
and 100% reported ratings from “average” to “very good” sleep quality (average (55%); good (35%);very good (10%)).
Table 2. Wilcoxon signed rank test results for subjective measures of Test Group A. See main text forfull statistics.
Measure Session 1. Control Session 2. Melody Test Statistics
KSS M = 6.50 M = 6.50 z = 0.000, p = 1.000, r = 0.000HOURS SLEPT M = 10.50 M = 10.50 z = −1.186, p = 0.236, r = −0.265
SLEEP QUALITY M = 3.00 M = 3.50 z = −0.378, p = 0.705, r = −0.085
2.2. Test Group B: Rhythm Stimulus
Participants were aged between 18 and 49 (18–29 (n = 4), 30–39 (n = 5), 40–49 (n = 1)), consistedof males and females (50% female), and reported a typical night’s sleep ranging from 5 to 9 h (5–7 h(n = 5; 50%), 7–9 h (n = 5, 50%)).
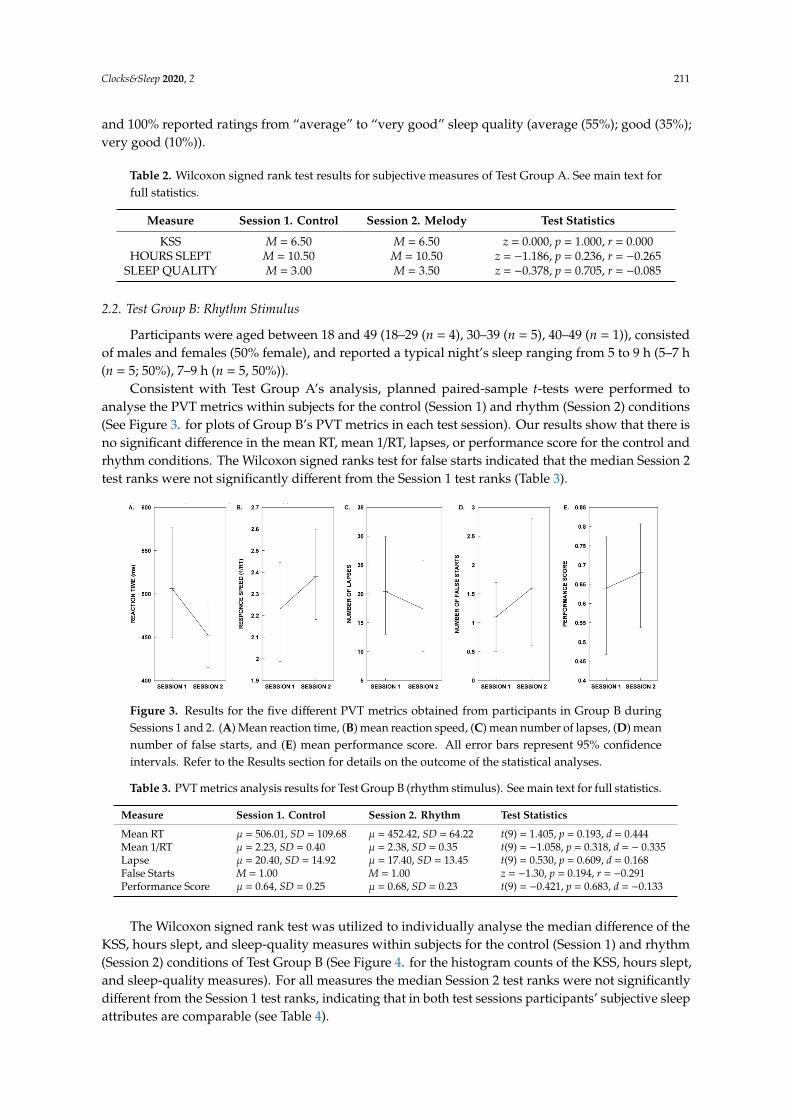
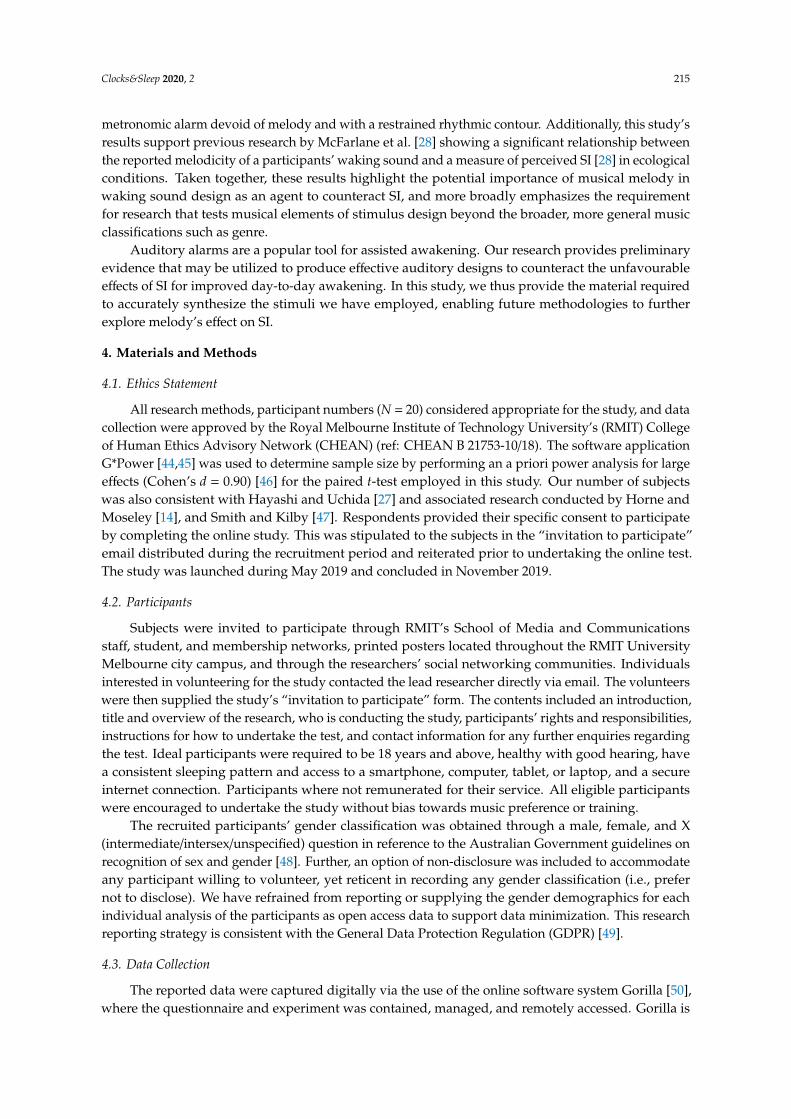
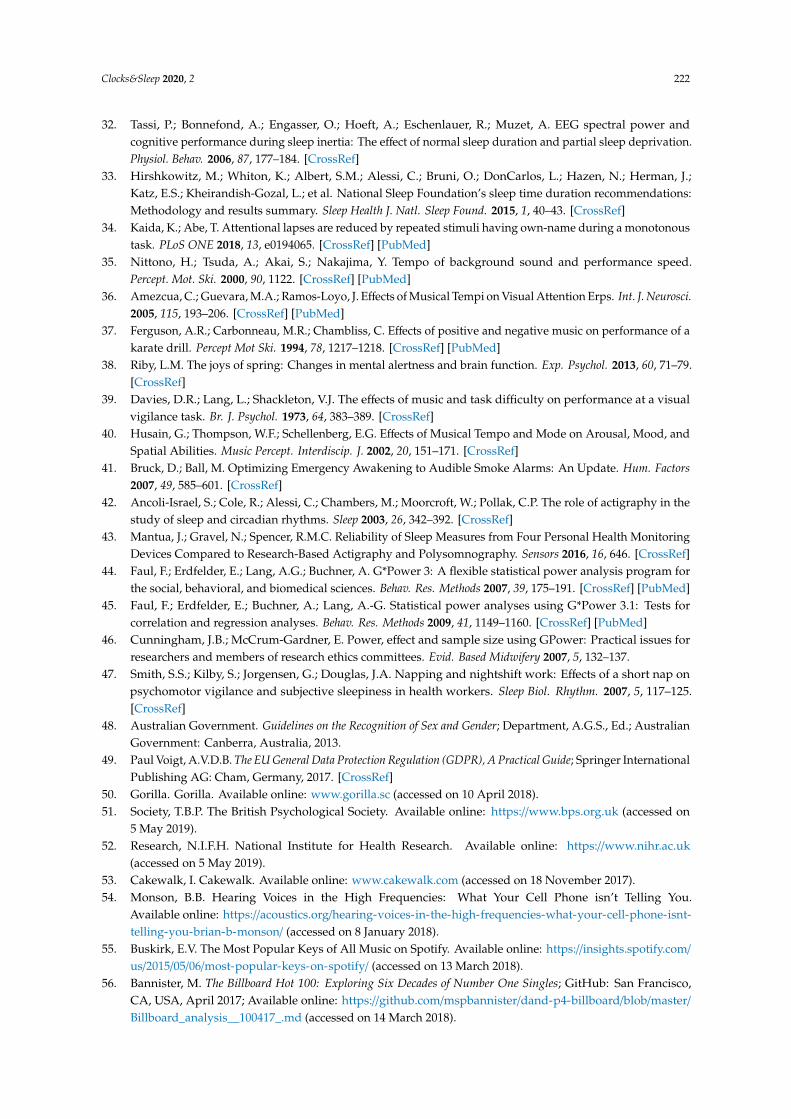
Consistent with Test Group A’s analysis, planned paired-sample t-tests were performed toanalyse the PVT metrics within subjects for the control (Session 1) and rhythm (Session 2) conditions(See Figure 3. for plots of Group B’s PVT metrics in each test session). Our results show that there isno significant difference in the mean RT, mean 1/RT, lapses, or performance score for the control andrhythm conditions. The Wilcoxon signed ranks test for false starts indicated that the median Session 2test ranks were not significantly different from the Session 1 test ranks (Table 3).
Clocks & Sleep 2020, 2 FOR PEER REVIEW 4
awake, fighting sleep (5%)), while 30% reported being “rather alert” (15%) to alert (15%). The mean
hours slept before each test session reveal that 65% of participants slept 7+ hours (6+ hours (95%));
and 100% reported ratings from “average” to “very good” sleep quality (average (55%); good (35%);
very good (10%)).
2.2. Test Group B: Rhythm Stimulus
Participants were aged between 18 and 49 (18–29 (n = 4), 30–39 (n = 5), 40–49 (n = 1)), consisted
of males and females (50% female), and reported a typical night’s sleep ranging from 5 to 9 h (5–7 h
(n = 5; 50%), 7–9 h (n = 5, 50%)).
Figure 3. Results for the five different PVT metrics obtained from participants in Group BA during
Sessions 1 and 2. (A) Mean reaction time, (B) mean reaction speed, (C) mean number of lapses, (D)
mean number of false starts, and (E) mean performance score. All error bars represent 95% confidence
intervals. Refer to the Results section for details on the outcome of the statistical analyses.
Consistent with Test Group A’s analysis, planned paired‐sample t‐tests were performed to
analyse the PVT metrics within subjects for the control (Session 1) and rhythm (Session 2) conditions
(See Figure 3. for plots of Group B’s PVT metrics in each test session). Our results show that there is
no significant difference in the mean RT, mean 1/RT, lapses, or performance score for the control and
rhythm conditions. The Wilcoxon signed ranks test for false starts indicated that the median Session
2 test ranks were not significantly different from the Session 1 test ranks (Table 3).
Table 3. PVT metrics analysis results for Test Group B (rhythm stimulus). See main text for full
statistics.
Measure Session 1. Control Session 2. Rhythm Test Statistics
Mean RT μ = 506.01, SD = 109.68 μ = 452.42, SD =
64.22
t(9) = 1.405, p = 0.193, d = 0.444
Mean 1/RT μ = 2.23, SD = 0.40 μ = 2.38, SD = 0.35 t(9) = ‐ 1.058, p = 0.318, d = − 0.335
Lapse μ = 20.40, SD = 14.92 μ = 17.40, SD = 13.45 t(9) = 0.530, p = 0.609, d = 0.168
False Starts M = 1.00 M = 1.00 z = − 1.30, p = 0.194, r = − 0.291
Performance Score μ = 0.64, SD = 0.25 μ = 0.68, SD = 0.23 t(9) = − 0.421, p = 0.683, d = − 0.133
Figure 3. Results for the five different PVT metrics obtained from participants in Group B duringSessions 1 and 2. (A) Mean reaction time, (B) mean reaction speed, (C) mean number of lapses, (D) meannumber of false starts, and (E) mean performance score. All error bars represent 95% confidenceintervals. Refer to the Results section for details on the outcome of the statistical analyses.
Table 3. PVT metrics analysis results for Test Group B (rhythm stimulus). See main text for full statistics.
Measure Session 1. Control Session 2. Rhythm Test Statistics
Mean RT µ = 506.01, SD = 109.68 µ = 452.42, SD = 64.22 t(9) = 1.405, p = 0.193, d = 0.444Mean 1/RT µ = 2.23, SD = 0.40 µ = 2.38, SD = 0.35 t(9) = −1.058, p = 0.318, d = − 0.335Lapse µ = 20.40, SD = 14.92 µ = 17.40, SD = 13.45 t(9) = 0.530, p = 0.609, d = 0.168False Starts M = 1.00 M = 1.00 z = −1.30, p = 0.194, r = −0.291Performance Score µ = 0.64, SD = 0.25 µ = 0.68, SD = 0.23 t(9) = −0.421, p = 0.683, d = −0.133
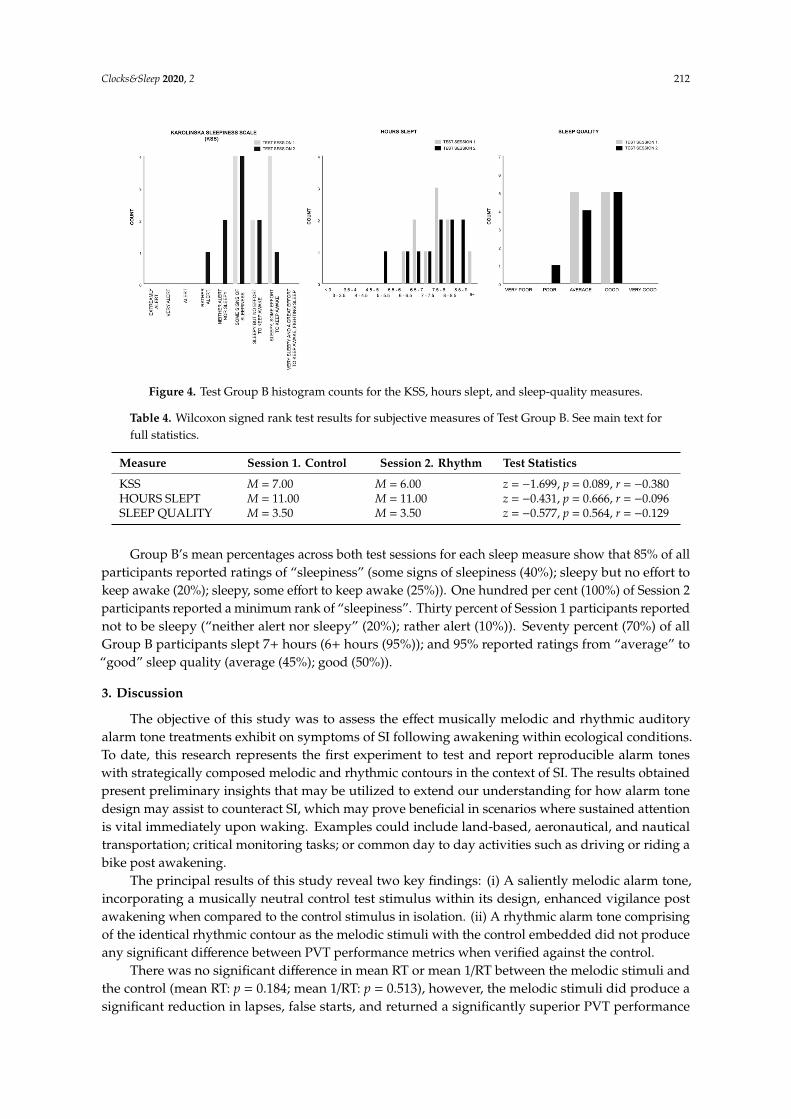
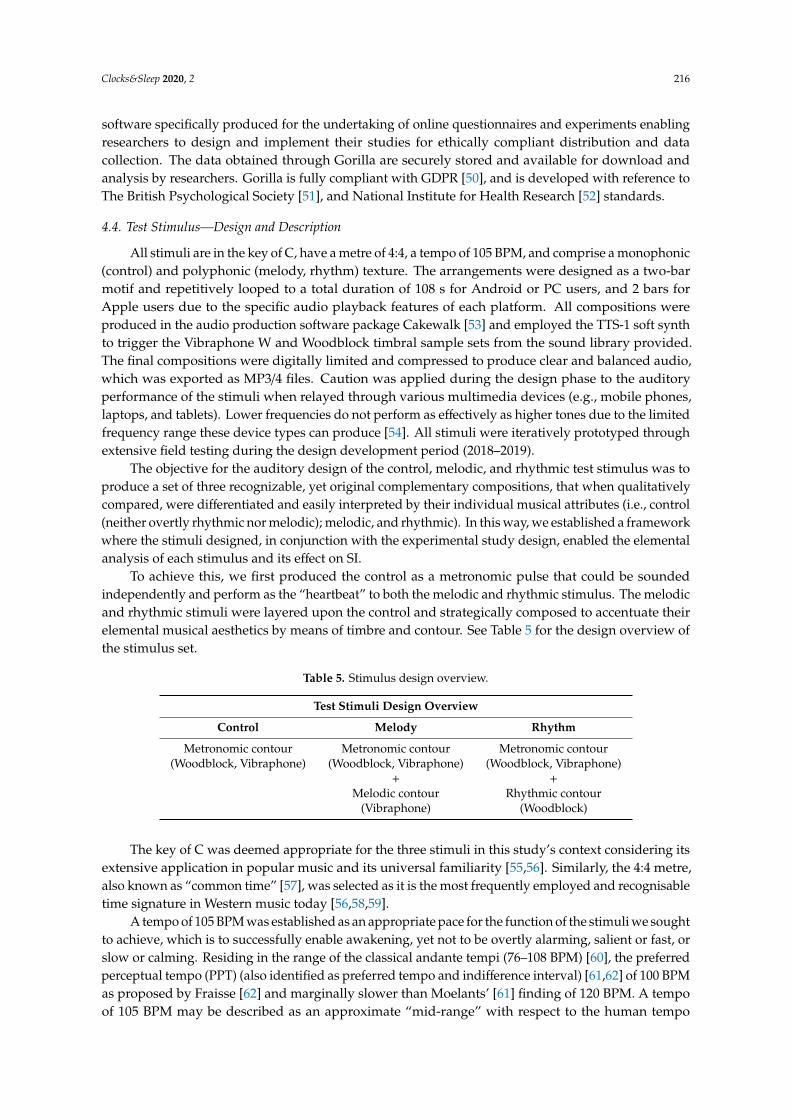
The Wilcoxon signed rank test was utilized to individually analyse the median difference of theKSS, hours slept, and sleep-quality measures within subjects for the control (Session 1) and rhythm(Session 2) conditions of Test Group B (See Figure 4. for the histogram counts of the KSS, hours slept,and sleep-quality measures). For all measures the median Session 2 test ranks were not significantlydifferent from the Session 1 test ranks, indicating that in both test sessions participants’ subjective sleepattributes are comparable (see Table 4).
Clocks&Sleep 2020, 2 212
Clocks & Sleep 2020, 2 FOR PEER REVIEW 5
Figure 4. Test Group B histogram counts for the KSS, hours slept, and sleep‐quality measures.
The Wilcoxon signed rank test was utilized to individually analyse the median difference of the
KSS, hours slept, and sleep‐quality measures within subjects for the control (Session 1) and rhythm
(Session 2) conditions of Test Group B (See Figure 4. for the histogram counts of the KSS, hours slept,
and sleep‐quality measures). For all measures the median Session 2 test ranks were not significantly
different from the Session 1 test ranks, indicating that in both test sessions participants’ subjective
sleep attributes are comparable (see Table 4).
Table 4. Wilcoxon signed rank test results for subjective measures of Test Group B. See main text for
full statistics.
Measure Session 1. Control Session 2. Rhythm Test Statistics
KSS M = 7.00 M = 6.00 z = ‐ 1.699, p = 0.089, r = − 0.380
HOURS SLEPT M = 11.00 M = 11.00 z = ‐ 0.431, p = 0.666, r = − 0.096
SLEEP QUALITY M = 3.50 M = 3.50 z = ‐ 0.577, p = 0.564, r = − 0.129
Group B’s mean percentages across both test sessions for each sleep measure show that 85% of
all participants reported ratings of “sleepiness” (some signs of sleepiness (40%); sleepy but no effort
to keep awake (20%); sleepy, some effort to keep awake (25%)). One hundred per cent (100%) of
Session 2 participants reported a minimum rank of “sleepiness”. Thirty percent of Session 1
participants reported not to be sleepy (“neither alert nor sleepy” (20%); rather alert (10%)). Seventy
percent (70%) of all Group B participants slept 7+ hours (6+ hours (95%)); and 95% reported ratings
from “average” to “good” sleep quality (average (45%); good (50%)).
3. Discussion
The objective of this study was to assess the effect musically melodic and rhythmic auditory
alarm tone treatments exhibit on symptoms of SI following awakening within ecological conditions.
To date, this research represents the first experiment to test and report reproducible alarm tones with
strategically composed melodic and rhythmic contours in the context of SI. The results obtained
present preliminary insights that may be utilized to extend our understanding for how alarm tone
design may assist to counteract SI, which may prove beneficial in scenarios where sustained attention
is vital immediately upon waking. Examples could include land‐based, aeronautical, and nautical
transportation; critical monitoring tasks; or common day to day activities such as driving or riding a
bike post awakening.
Figure 4. Test Group B histogram counts for the KSS, hours slept, and sleep-quality measures.
Table 4. Wilcoxon signed rank test results for subjective measures of Test Group B. See main text forfull statistics.
Measure Session 1. Control Session 2. Rhythm Test Statistics
KSS M = 7.00 M = 6.00 z = −1.699, p = 0.089, r = −0.380HOURS SLEPT M = 11.00 M = 11.00 z = −0.431, p = 0.666, r = −0.096SLEEP QUALITY M = 3.50 M = 3.50 z = −0.577, p = 0.564, r = −0.129
Group B’s mean percentages across both test sessions for each sleep measure show that 85% of allparticipants reported ratings of “sleepiness” (some signs of sleepiness (40%); sleepy but no effort tokeep awake (20%); sleepy, some effort to keep awake (25%)). One hundred per cent (100%) of Session 2participants reported a minimum rank of “sleepiness”. Thirty percent of Session 1 participants reportednot to be sleepy (“neither alert nor sleepy” (20%); rather alert (10%)). Seventy percent (70%) of allGroup B participants slept 7+ hours (6+ hours (95%)); and 95% reported ratings from “average” to“good” sleep quality (average (45%); good (50%)).
3. Discussion
The objective of this study was to assess the effect musically melodic and rhythmic auditoryalarm tone treatments exhibit on symptoms of SI following awakening within ecological conditions.To date, this research represents the first experiment to test and report reproducible alarm toneswith strategically composed melodic and rhythmic contours in the context of SI. The results obtainedpresent preliminary insights that may be utilized to extend our understanding for how alarm tonedesign may assist to counteract SI, which may prove beneficial in scenarios where sustained attentionis vital immediately upon waking. Examples could include land-based, aeronautical, and nauticaltransportation; critical monitoring tasks; or common day to day activities such as driving or riding abike post awakening.
The principal results of this study reveal two key findings: (i) A saliently melodic alarm tone,incorporating a musically neutral control test stimulus within its design, enhanced vigilance postawakening when compared to the control stimulus in isolation. (ii) A rhythmic alarm tone comprisingof the identical rhythmic contour as the melodic stimuli with the control embedded did not produceany significant difference between PVT performance metrics when verified against the control.
There was no significant difference in mean RT or mean 1/RT between the melodic stimuli andthe control (mean RT: p = 0.184; mean 1/RT: p = 0.513), however, the melodic stimuli did produce asignificant reduction in lapses, false starts, and returned a significantly superior PVT performance
Clocks&Sleep 2020, 2 213
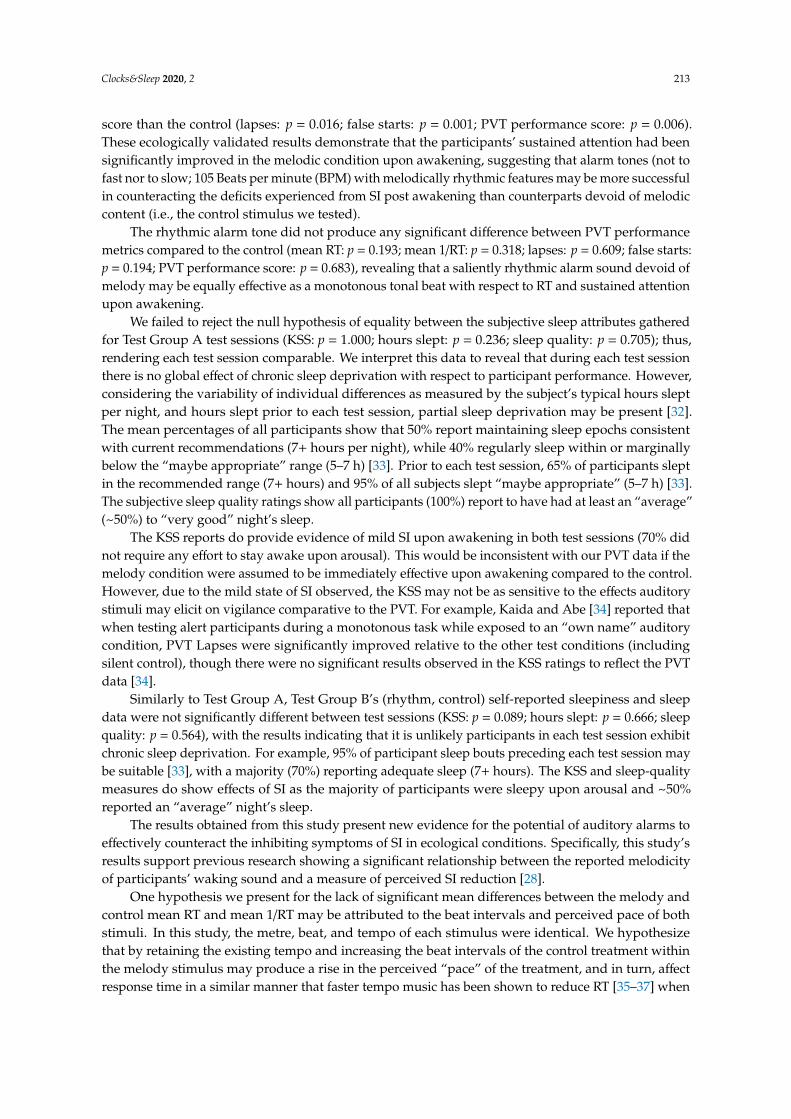
score than the control (lapses: p = 0.016; false starts: p = 0.001; PVT performance score: p = 0.006).These ecologically validated results demonstrate that the participants’ sustained attention had beensignificantly improved in the melodic condition upon awakening, suggesting that alarm tones (not tofast nor to slow; 105 Beats per minute (BPM) with melodically rhythmic features may be more successfulin counteracting the deficits experienced from SI post awakening than counterparts devoid of melodiccontent (i.e., the control stimulus we tested).
The rhythmic alarm tone did not produce any significant difference between PVT performancemetrics compared to the control (mean RT: p = 0.193; mean 1/RT: p = 0.318; lapses: p = 0.609; false starts:p = 0.194; PVT performance score: p = 0.683), revealing that a saliently rhythmic alarm sound devoid ofmelody may be equally effective as a monotonous tonal beat with respect to RT and sustained attentionupon awakening.
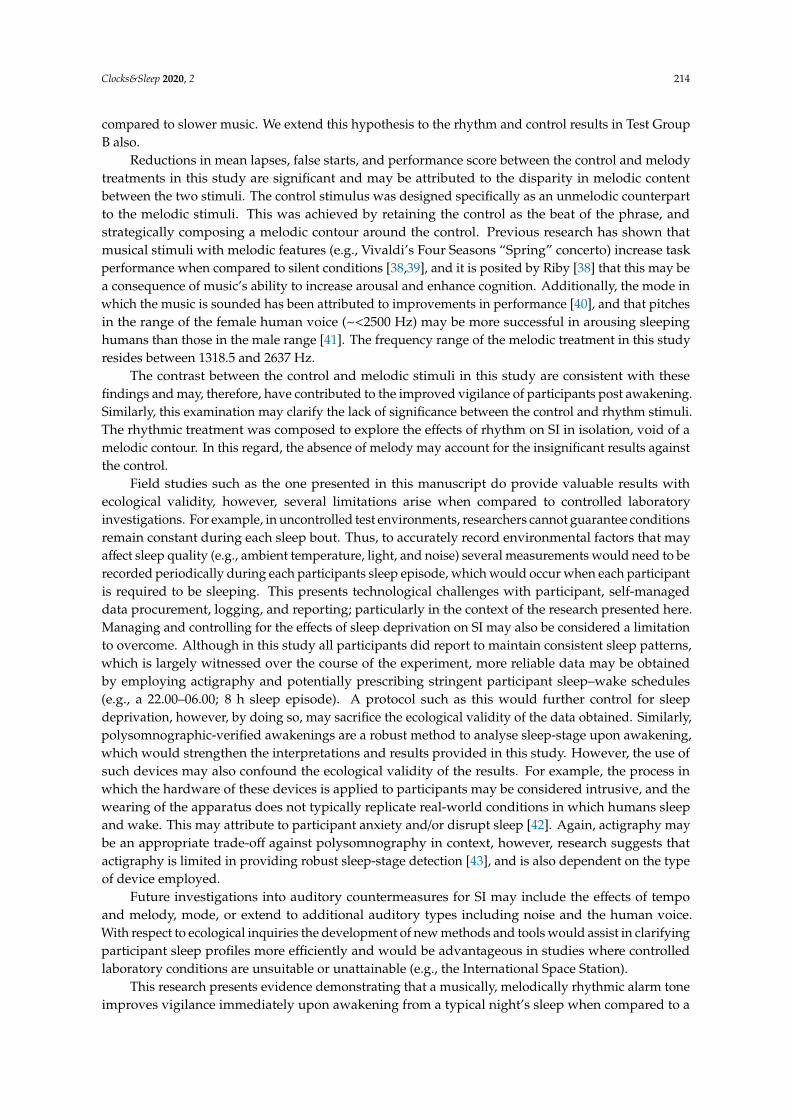
We failed to reject the null hypothesis of equality between the subjective sleep attributes gatheredfor Test Group A test sessions (KSS: p = 1.000; hours slept: p = 0.236; sleep quality: p = 0.705); thus,rendering each test session comparable. We interpret this data to reveal that during each test sessionthere is no global effect of chronic sleep deprivation with respect to participant performance. However,considering the variability of individual differences as measured by the subject’s typical hours sleptper night, and hours slept prior to each test session, partial sleep deprivation may be present [32].The mean percentages of all participants show that 50% report maintaining sleep epochs consistentwith current recommendations (7+ hours per night), while 40% regularly sleep within or marginallybelow the “maybe appropriate” range (5–7 h) [33]. Prior to each test session, 65% of participants sleptin the recommended range (7+ hours) and 95% of all subjects slept “maybe appropriate” (5–7 h) [33].The subjective sleep quality ratings show all participants (100%) report to have had at least an “average”(~50%) to “very good” night’s sleep.
The KSS reports do provide evidence of mild SI upon awakening in both test sessions (70% didnot require any effort to stay awake upon arousal). This would be inconsistent with our PVT data if themelody condition were assumed to be immediately effective upon awakening compared to the control.However, due to the mild state of SI observed, the KSS may not be as sensitive to the effects auditorystimuli may elicit on vigilance comparative to the PVT. For example, Kaida and Abe [34] reported thatwhen testing alert participants during a monotonous task while exposed to an “own name” auditorycondition, PVT Lapses were significantly improved relative to the other test conditions (includingsilent control), though there were no significant results observed in the KSS ratings to reflect the PVTdata [34].
Similarly to Test Group A, Test Group B’s (rhythm, control) self-reported sleepiness and sleepdata were not significantly different between test sessions (KSS: p = 0.089; hours slept: p = 0.666; sleepquality: p = 0.564), with the results indicating that it is unlikely participants in each test session exhibitchronic sleep deprivation. For example, 95% of participant sleep bouts preceding each test session maybe suitable [33], with a majority (70%) reporting adequate sleep (7+ hours). The KSS and sleep-qualitymeasures do show effects of SI as the majority of participants were sleepy upon arousal and ~50%reported an “average” night’s sleep.
The results obtained from this study present new evidence for the potential of auditory alarms toeffectively counteract the inhibiting symptoms of SI in ecological conditions. Specifically, this study’sresults support previous research showing a significant relationship between the reported melodicityof participants’ waking sound and a measure of perceived SI reduction [28].
One hypothesis we present for the lack of significant mean differences between the melody andcontrol mean RT and mean 1/RT may be attributed to the beat intervals and perceived pace of bothstimuli. In this study, the metre, beat, and tempo of each stimulus were identical. We hypothesizethat by retaining the existing tempo and increasing the beat intervals of the control treatment withinthe melody stimulus may produce a rise in the perceived “pace” of the treatment, and in turn, affectresponse time in a similar manner that faster tempo music has been shown to reduce RT [35–37] when
Clocks&Sleep 2020, 2 214
compared to slower music. We extend this hypothesis to the rhythm and control results in Test GroupB also.
Reductions in mean lapses, false starts, and performance score between the control and melodytreatments in this study are significant and may be attributed to the disparity in melodic contentbetween the two stimuli. The control stimulus was designed specifically as an unmelodic counterpartto the melodic stimuli. This was achieved by retaining the control as the beat of the phrase, andstrategically composing a melodic contour around the control. Previous research has shown thatmusical stimuli with melodic features (e.g., Vivaldi’s Four Seasons “Spring” concerto) increase taskperformance when compared to silent conditions [38,39], and it is posited by Riby [38] that this may bea consequence of music’s ability to increase arousal and enhance cognition. Additionally, the mode inwhich the music is sounded has been attributed to improvements in performance [40], and that pitchesin the range of the female human voice (~<2500 Hz) may be more successful in arousing sleepinghumans than those in the male range [41]. The frequency range of the melodic treatment in this studyresides between 1318.5 and 2637 Hz.
The contrast between the control and melodic stimuli in this study are consistent with thesefindings and may, therefore, have contributed to the improved vigilance of participants post awakening.Similarly, this examination may clarify the lack of significance between the control and rhythm stimuli.The rhythmic treatment was composed to explore the effects of rhythm on SI in isolation, void of amelodic contour. In this regard, the absence of melody may account for the insignificant results againstthe control.
Field studies such as the one presented in this manuscript do provide valuable results withecological validity, however, several limitations arise when compared to controlled laboratoryinvestigations. For example, in uncontrolled test environments, researchers cannot guarantee conditionsremain constant during each sleep bout. Thus, to accurately record environmental factors that mayaffect sleep quality (e.g., ambient temperature, light, and noise) several measurements would need to berecorded periodically during each participants sleep episode, which would occur when each participantis required to be sleeping. This presents technological challenges with participant, self-manageddata procurement, logging, and reporting; particularly in the context of the research presented here.Managing and controlling for the effects of sleep deprivation on SI may also be considered a limitationto overcome. Although in this study all participants did report to maintain consistent sleep patterns,which is largely witnessed over the course of the experiment, more reliable data may be obtainedby employing actigraphy and potentially prescribing stringent participant sleep–wake schedules(e.g., a 22.00–06.00; 8 h sleep episode). A protocol such as this would further control for sleepdeprivation, however, by doing so, may sacrifice the ecological validity of the data obtained. Similarly,polysomnographic-verified awakenings are a robust method to analyse sleep-stage upon awakening,which would strengthen the interpretations and results provided in this study. However, the use ofsuch devices may also confound the ecological validity of the results. For example, the process inwhich the hardware of these devices is applied to participants may be considered intrusive, and thewearing of the apparatus does not typically replicate real-world conditions in which humans sleepand wake. This may attribute to participant anxiety and/or disrupt sleep [42]. Again, actigraphy maybe an appropriate trade-off against polysomnography in context, however, research suggests thatactigraphy is limited in providing robust sleep-stage detection [43], and is also dependent on the typeof device employed.
Future investigations into auditory countermeasures for SI may include the effects of tempoand melody, mode, or extend to additional auditory types including noise and the human voice.With respect to ecological inquiries the development of new methods and tools would assist in clarifyingparticipant sleep profiles more efficiently and would be advantageous in studies where controlledlaboratory conditions are unsuitable or unattainable (e.g., the International Space Station).
This research presents evidence demonstrating that a musically, melodically rhythmic alarm toneimproves vigilance immediately upon awakening from a typical night’s sleep when compared to a
Clocks&Sleep 2020, 2 215
metronomic alarm devoid of melody and with a restrained rhythmic contour. Additionally, this study’sresults support previous research by McFarlane et al. [28] showing a significant relationship betweenthe reported melodicity of a participants’ waking sound and a measure of perceived SI [28] in ecologicalconditions. Taken together, these results highlight the potential importance of musical melody inwaking sound design as an agent to counteract SI, and more broadly emphasizes the requirementfor research that tests musical elements of stimulus design beyond the broader, more general musicclassifications such as genre.
Auditory alarms are a popular tool for assisted awakening. Our research provides preliminaryevidence that may be utilized to produce effective auditory designs to counteract the unfavourableeffects of SI for improved day-to-day awakening. In this study, we thus provide the material requiredto accurately synthesize the stimuli we have employed, enabling future methodologies to furtherexplore melody’s effect on SI.
4. Materials and Methods
4.1. Ethics Statement
All research methods, participant numbers (N = 20) considered appropriate for the study, and datacollection were approved by the Royal Melbourne Institute of Technology University’s (RMIT) Collegeof Human Ethics Advisory Network (CHEAN) (ref: CHEAN B 21753-10/18). The software applicationG*Power [44,45] was used to determine sample size by performing an a priori power analysis for largeeffects (Cohen’s d = 0.90) [46] for the paired t-test employed in this study. Our number of subjectswas also consistent with Hayashi and Uchida [27] and associated research conducted by Horne andMoseley [14], and Smith and Kilby [47]. Respondents provided their specific consent to participateby completing the online study. This was stipulated to the subjects in the “invitation to participate”email distributed during the recruitment period and reiterated prior to undertaking the online test.The study was launched during May 2019 and concluded in November 2019.
4.2. Participants
Subjects were invited to participate through RMIT’s School of Media and Communicationsstaff, student, and membership networks, printed posters located throughout the RMIT UniversityMelbourne city campus, and through the researchers’ social networking communities. Individualsinterested in volunteering for the study contacted the lead researcher directly via email. The volunteerswere then supplied the study’s “invitation to participate” form. The contents included an introduction,title and overview of the research, who is conducting the study, participants’ rights and responsibilities,instructions for how to undertake the test, and contact information for any further enquiries regardingthe test. Ideal participants were required to be 18 years and above, healthy with good hearing, havea consistent sleeping pattern and access to a smartphone, computer, tablet, or laptop, and a secureinternet connection. Participants where not remunerated for their service. All eligible participantswere encouraged to undertake the study without bias towards music preference or training.
The recruited participants’ gender classification was obtained through a male, female, and X(intermediate/intersex/unspecified) question in reference to the Australian Government guidelines onrecognition of sex and gender [48]. Further, an option of non-disclosure was included to accommodateany participant willing to volunteer, yet reticent in recording any gender classification (i.e., prefernot to disclose). We have refrained from reporting or supplying the gender demographics for eachindividual analysis of the participants as open access data to support data minimization. This researchreporting strategy is consistent with the General Data Protection Regulation (GDPR) [49].
4.3. Data Collection
The reported data were captured digitally via the use of the online software system Gorilla [50],where the questionnaire and experiment was contained, managed, and remotely accessed. Gorilla is
Clocks&Sleep 2020, 2 216
software specifically produced for the undertaking of online questionnaires and experiments enablingresearchers to design and implement their studies for ethically compliant distribution and datacollection. The data obtained through Gorilla are securely stored and available for download andanalysis by researchers. Gorilla is fully compliant with GDPR [50], and is developed with reference toThe British Psychological Society [51], and National Institute for Health Research [52] standards.
4.4. Test Stimulus—Design and Description
All stimuli are in the key of C, have a metre of 4:4, a tempo of 105 BPM, and comprise a monophonic(control) and polyphonic (melody, rhythm) texture. The arrangements were designed as a two-barmotif and repetitively looped to a total duration of 108 s for Android or PC users, and 2 bars forApple users due to the specific audio playback features of each platform. All compositions wereproduced in the audio production software package Cakewalk [53] and employed the TTS-1 soft synthto trigger the Vibraphone W and Woodblock timbral sample sets from the sound library provided.The final compositions were digitally limited and compressed to produce clear and balanced audio,which was exported as MP3/4 files. Caution was applied during the design phase to the auditoryperformance of the stimuli when relayed through various multimedia devices (e.g., mobile phones,laptops, and tablets). Lower frequencies do not perform as effectively as higher tones due to the limitedfrequency range these device types can produce [54]. All stimuli were iteratively prototyped throughextensive field testing during the design development period (2018–2019).
The objective for the auditory design of the control, melodic, and rhythmic test stimulus was toproduce a set of three recognizable, yet original complementary compositions, that when qualitativelycompared, were differentiated and easily interpreted by their individual musical attributes (i.e., control(neither overtly rhythmic nor melodic); melodic, and rhythmic). In this way, we established a frameworkwhere the stimuli designed, in conjunction with the experimental study design, enabled the elementalanalysis of each stimulus and its effect on SI.
To achieve this, we first produced the control as a metronomic pulse that could be soundedindependently and perform as the “heartbeat” to both the melodic and rhythmic stimulus. The melodicand rhythmic stimuli were layered upon the control and strategically composed to accentuate theirelemental musical aesthetics by means of timbre and contour. See Table 5 for the design overview ofthe stimulus set.
Table 5. Stimulus design overview.
Test Stimuli Design Overview
Control Melody Rhythm
Metronomic contour Metronomic contour Metronomic contour(Woodblock, Vibraphone) (Woodblock, Vibraphone) (Woodblock, Vibraphone)
+ +Melodic contour Rhythmic contour
(Vibraphone) (Woodblock)
The key of C was deemed appropriate for the three stimuli in this study’s context considering itsextensive application in popular music and its universal familiarity [55,56]. Similarly, the 4:4 metre,also known as “common time” [57], was selected as it is the most frequently employed and recognisabletime signature in Western music today [56,58,59].
A tempo of 105 BPM was established as an appropriate pace for the function of the stimuli we soughtto achieve, which is to successfully enable awakening, yet not to be overtly alarming, salient or fast, orslow or calming. Residing in the range of the classical andante tempi (76–108 BPM) [60], the preferredperceptual tempo (PPT) (also identified as preferred tempo and indifference interval) [61,62] of 100 BPMas proposed by Fraisse [62] and marginally slower than Moelants’ [61] finding of 120 BPM. A tempoof 105 BPM may be described as an approximate “mid-range” with respect to the human tempo
Clocks&Sleep 2020, 2 217
registration range (existence region) of 40–300 BPM [63]. This method was chosen to allow for thetargeted within-subject comparisons between the respective musical treatments without the influenceof tempo (slow-paced vs. fast-paced) on arousal.
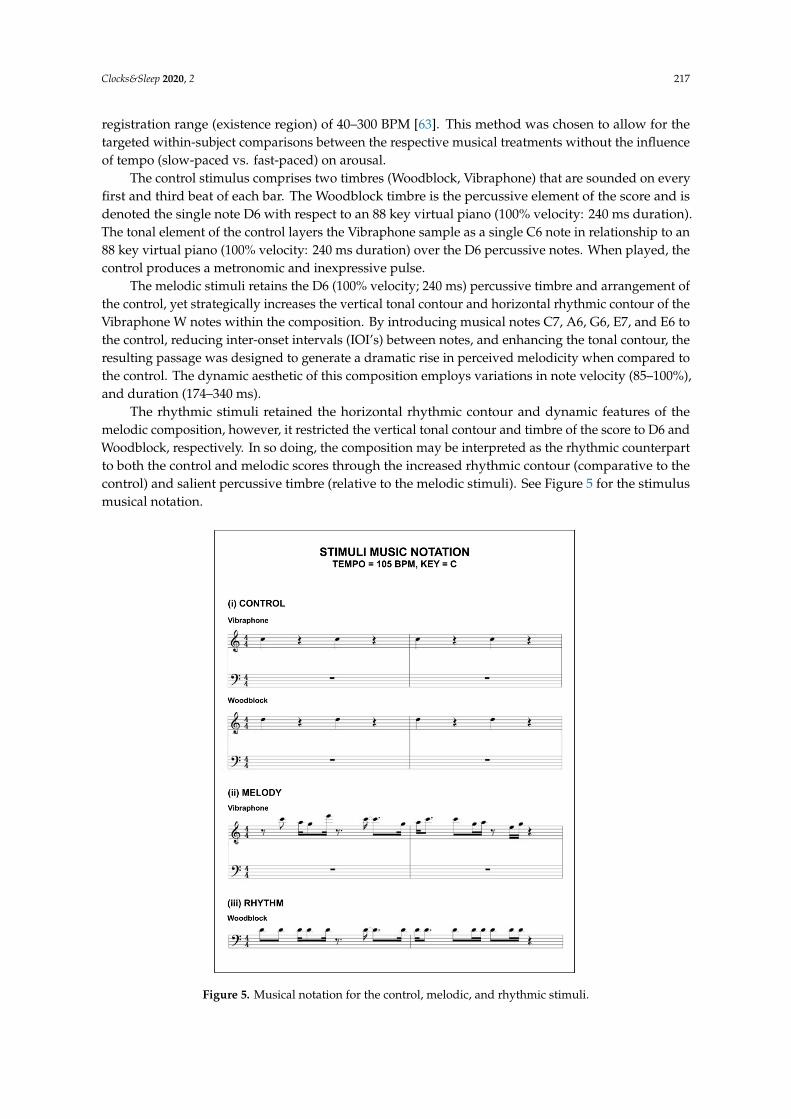
The control stimulus comprises two timbres (Woodblock, Vibraphone) that are sounded on everyfirst and third beat of each bar. The Woodblock timbre is the percussive element of the score and isdenoted the single note D6 with respect to an 88 key virtual piano (100% velocity: 240 ms duration).The tonal element of the control layers the Vibraphone sample as a single C6 note in relationship to an88 key virtual piano (100% velocity: 240 ms duration) over the D6 percussive notes. When played, thecontrol produces a metronomic and inexpressive pulse.
The melodic stimuli retains the D6 (100% velocity; 240 ms) percussive timbre and arrangement ofthe control, yet strategically increases the vertical tonal contour and horizontal rhythmic contour of theVibraphone W notes within the composition. By introducing musical notes C7, A6, G6, E7, and E6 tothe control, reducing inter-onset intervals (IOI’s) between notes, and enhancing the tonal contour, theresulting passage was designed to generate a dramatic rise in perceived melodicity when compared tothe control. The dynamic aesthetic of this composition employs variations in note velocity (85–100%),and duration (174–340 ms).
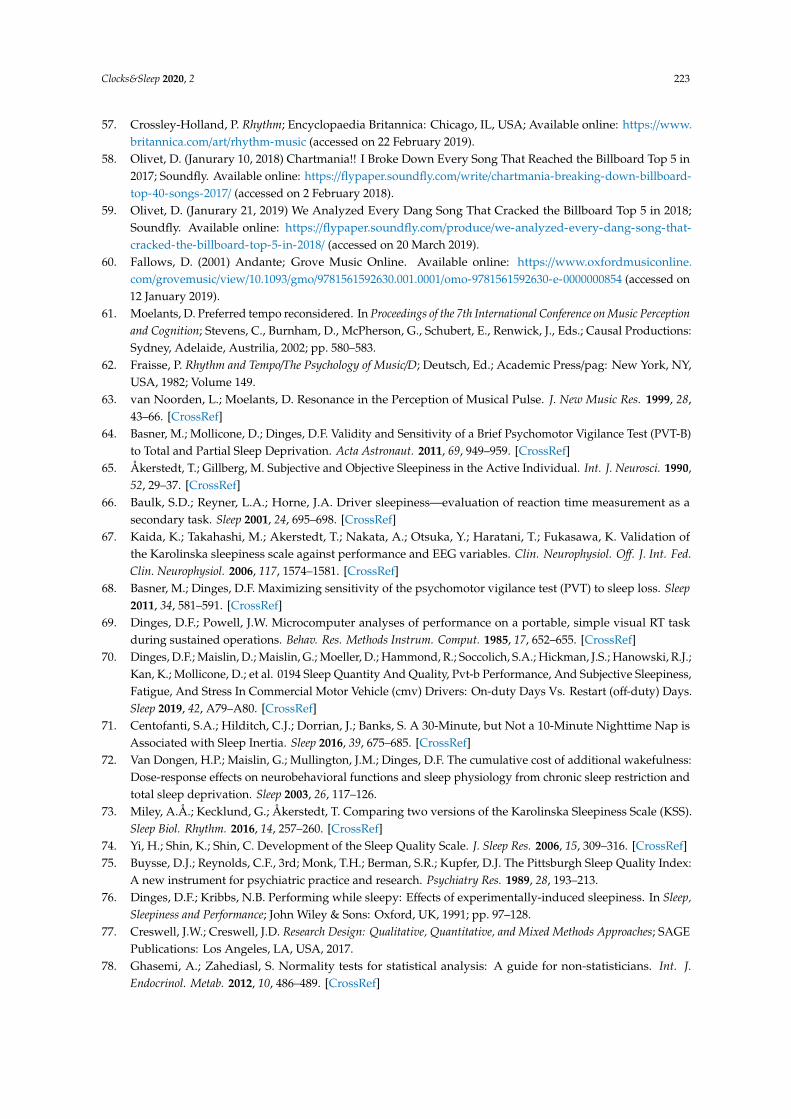
The rhythmic stimuli retained the horizontal rhythmic contour and dynamic features of themelodic composition, however, it restricted the vertical tonal contour and timbre of the score to D6 andWoodblock, respectively. In so doing, the composition may be interpreted as the rhythmic counterpartto both the control and melodic scores through the increased rhythmic contour (comparative to thecontrol) and salient percussive timbre (relative to the melodic stimuli). See Figure 5 for the stimulusmusical notation.Clocks & Sleep 2020, 2 FOR PEER REVIEW 11
Figure 5. Musical notation for the control, melodic, and rhythmic stimuli.
4.5. Study Design
The study comprised of two Groups (A and B) that were required to undertake two test sessions
(Session 1 and Session 2) conducted each week on a Tuesday and Wednesday morning, respectively,
during the data gathering window. All participants were required to complete each test immediately
after waking from an assigned stimulus that was supplied by the researchers as a replacement to their
usual alarm sound. The waking stimulus was deployed on the participants preferred electronic
device (desktop, laptop, tablet, or smartphone). Participants completed each test in their chosen
location and at their typical time of waking. This method was selected to maximize the natural
contextual environment in which subjects use auditory alarms for awakening in their daily routine,
ensuring the ecological validity of the findings. Each test session required approximately 5–10 min to
complete, being designed to collect high‐value data whilst minimizing disruption to participants.
The participants (N = 20) were pseudo‐randomly allocated and equally divided into two groups
(Group A, N = 10; Group B, N = 10). Session 1 (Tuesday) required both groups to complete the study
after awakening to the control stimulus. Session 2 (Wednesday) required Group A to complete the
test following awakening to the melodic stimuli, and Group B the rhythmic stimuli. Figure 6
illustrates the study protocol.
Figure 5. Musical notation for the control, melodic, and rhythmic stimuli.
Clocks&Sleep 2020, 2 218
4.5. Study Design
The study comprised of two Groups (A and B) that were required to undertake two test sessions(Session 1 and Session 2) conducted each week on a Tuesday and Wednesday morning, respectively,during the data gathering window. All participants were required to complete each test immediatelyafter waking from an assigned stimulus that was supplied by the researchers as a replacement to theirusual alarm sound. The waking stimulus was deployed on the participants preferred electronic device(desktop, laptop, tablet, or smartphone). Participants completed each test in their chosen locationand at their typical time of waking. This method was selected to maximize the natural contextualenvironment in which subjects use auditory alarms for awakening in their daily routine, ensuring theecological validity of the findings. Each test session required approximately 5–10 min to complete,being designed to collect high-value data whilst minimizing disruption to participants.
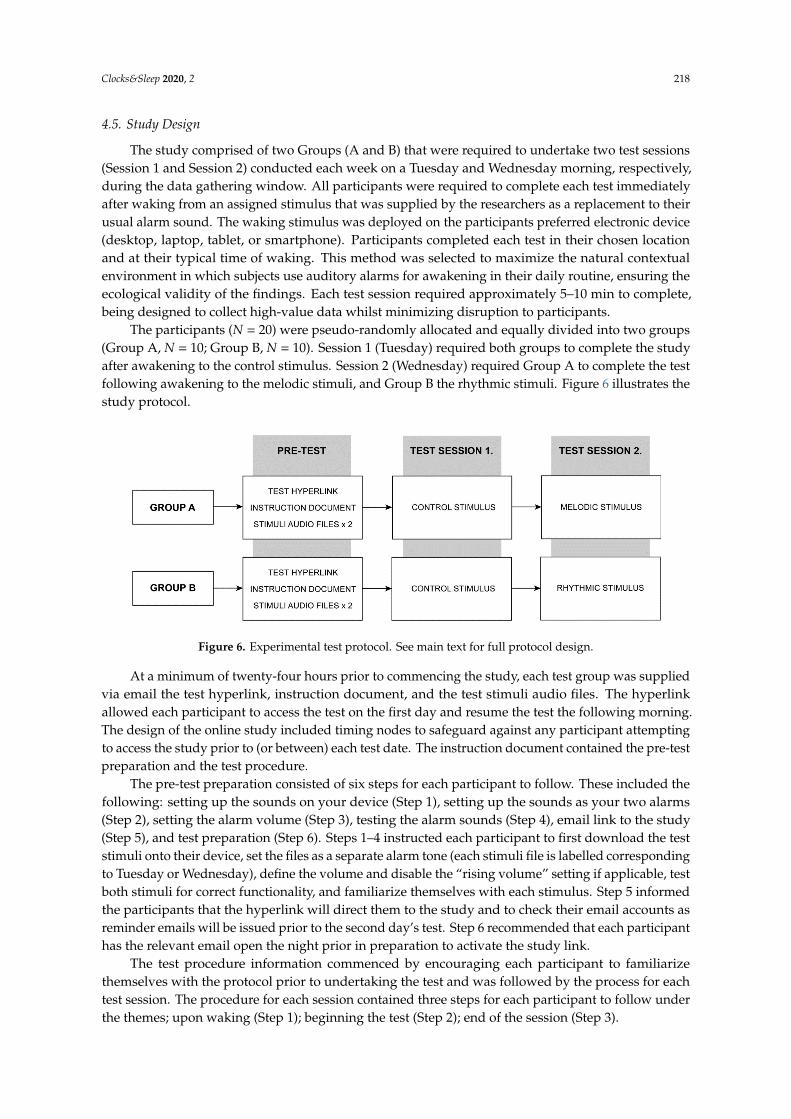
The participants (N = 20) were pseudo-randomly allocated and equally divided into two groups(Group A, N = 10; Group B, N = 10). Session 1 (Tuesday) required both groups to complete the studyafter awakening to the control stimulus. Session 2 (Wednesday) required Group A to complete the testfollowing awakening to the melodic stimuli, and Group B the rhythmic stimuli. Figure 6 illustrates thestudy protocol.
Clocks & Sleep 2020, 2 FOR PEER REVIEW 12
Figure 6. Experimental test protocol. See main text for full protocol design.
At a minimum of twenty‐four hours prior to commencing the study, each test group was
supplied via email the test hyperlink, instruction document, and the test stimuli audio files. The
hyperlink allowed each participant to access the test on the first day and resume the test the following
morning. The design of the online study included timing nodes to safeguard against any participant
attempting to access the study prior to (or between) each test date. The instruction document
contained the pre‐test preparation and the test procedure.
The pre‐test preparation consisted of six steps for each participant to follow. These included the
following: setting up the sounds on your device (Step 1), setting up the sounds as your two alarms
(Step 2), setting the alarm volume (Step 3), testing the alarm sounds (Step 4), email link to the study
(Step 5), and test preparation (Step 6). Steps 1–4 instructed each participant to first download the test
stimuli onto their device, set the files as a separate alarm tone (each stimuli file is labelled
corresponding to Tuesday or Wednesday), define the volume and disable the “rising volume” setting
if applicable, test both stimuli for correct functionality, and familiarize themselves with each
stimulus. Step 5 informed the participants that the hyperlink will direct them to the study and to
check their email accounts as reminder emails will be issued prior to the second day’s test. Step 6
recommended that each participant has the relevant email open the night prior in preparation to
activate the study link.
The test procedure information commenced by encouraging each participant to familiarize
themselves with the protocol prior to undertaking the test and was followed by the process for each
test session. The procedure for each session contained three steps for each participant to follow under
the themes; upon waking (Step 1); beginning the test (Step 2); end of the session (Step 3).
The test battery for each study included an adapted brief psychomotor vigilance task (PVT, 3
min (Item 1)) [64], the Karolinska sleepiness scale (KSS, Item 2) [65–67], and two custom‐designed
Likert scales (sleep duration (Item 3); sleep quality (Item 4)). Session 1 also recorded demographic
information (Gender (Item 5); age range (Item 6); hours typically slept (Item 7)). Please refer to the
supporting material Table S1) for a transcript of the questionnaire for each test session. All responses
were forced.
The PVT‐B [68] is a validated 3 min variation of the popular 10 min PVT developed by Dinges
and Powell [69], which records participant reaction time (RT) to random interval stimuli.
Interpretation of this data is extrapolated into several performance metrics (i.e., mean RT, lapses, and
false starts) as measures of behavioural alertness. Several research experiments have incorporated
the PVT‐B as an objective measure of a subject’s vigilance [70,71]. Benefits of using the PVT‐B in this
study’s context are that it can be undertaken remotely online and is intuitive for participants to
perform [72]. The PVT‐B is particularly suited to enquiries where the 10 min PVT is considered
overtly time consuming [64]. Our adapted PVT‐B was produced in the Gorilla task builder software
[50] with respect to Basner and Dinges [68] and Basner et al. [64]. The test required each participant
to either click a mouse controller, depress a keyboard key, or press a button icon on a screen
(dependant on which device the participant nominated) immediately as a visual stimuli transitioned
Figure 6. Experimental test protocol. See main text for full protocol design.
At a minimum of twenty-four hours prior to commencing the study, each test group was suppliedvia email the test hyperlink, instruction document, and the test stimuli audio files. The hyperlinkallowed each participant to access the test on the first day and resume the test the following morning.The design of the online study included timing nodes to safeguard against any participant attemptingto access the study prior to (or between) each test date. The instruction document contained the pre-testpreparation and the test procedure.
The pre-test preparation consisted of six steps for each participant to follow. These included thefollowing: setting up the sounds on your device (Step 1), setting up the sounds as your two alarms(Step 2), setting the alarm volume (Step 3), testing the alarm sounds (Step 4), email link to the study(Step 5), and test preparation (Step 6). Steps 1–4 instructed each participant to first download the teststimuli onto their device, set the files as a separate alarm tone (each stimuli file is labelled correspondingto Tuesday or Wednesday), define the volume and disable the “rising volume” setting if applicable, testboth stimuli for correct functionality, and familiarize themselves with each stimulus. Step 5 informedthe participants that the hyperlink will direct them to the study and to check their email accounts asreminder emails will be issued prior to the second day’s test. Step 6 recommended that each participanthas the relevant email open the night prior in preparation to activate the study link.
The test procedure information commenced by encouraging each participant to familiarizethemselves with the protocol prior to undertaking the test and was followed by the process for eachtest session. The procedure for each session contained three steps for each participant to follow underthe themes; upon waking (Step 1); beginning the test (Step 2); end of the session (Step 3).
Clocks&Sleep 2020, 2 219
The test battery for each study included an adapted brief psychomotor vigilance task (PVT, 3 min(Item 1)) [64], the Karolinska sleepiness scale (KSS, Item 2) [65–67], and two custom-designed Likertscales (sleep duration (Item 3); sleep quality (Item 4)). Session 1 also recorded demographic information(Gender (Item 5); age range (Item 6); hours typically slept (Item 7)). Please refer to the supportingmaterial Table S1) for a transcript of the questionnaire for each test session. All responses were forced.
The PVT-B [68] is a validated 3 min variation of the popular 10 min PVT developed by Dinges andPowell [69], which records participant reaction time (RT) to random interval stimuli. Interpretation ofthis data is extrapolated into several performance metrics (i.e., mean RT, lapses, and false starts) asmeasures of behavioural alertness. Several research experiments have incorporated the PVT-B as anobjective measure of a subject’s vigilance [70,71]. Benefits of using the PVT-B in this study’s context arethat it can be undertaken remotely online and is intuitive for participants to perform [72]. The PVT-Bis particularly suited to enquiries where the 10 min PVT is considered overtly time consuming [64].Our adapted PVT-B was produced in the Gorilla task builder software [50] with respect to Basnerand Dinges [68] and Basner et al. [64]. The test required each participant to either click a mousecontroller, depress a keyboard key, or press a button icon on a screen (dependant on which devicethe participant nominated) immediately as a visual stimuli transitioned from one assigned colour toanother. In our design, the subjects were instructed to respond as quickly as possible when a circularorange stimulus turned red. The interstimulus interval (ISI) between each coloured stimulus wasrandomized and varied between 1 and 4 s as specified by Basner et al. [64]. A timeout conditionwas included (≥1000 ms) to further ensure test duration was retained to a minimum while retainingresponsiveness. During analysis, timeouts were interpreted as lapses with a 1000 ms duration. One ofthree statements were displayed following each response as a fixation substitute and to inform theparticipant of their continual performance. These were: (i) Too Quick! (false start); (ii) Great Work!(correct response); and (iii) Too Slow! (timeout). Each statement extended for 1000 ms and wasdeducted from the total (ISI) as previously described.
The KSS [65] is a subjective nine-point bipolar Likert scale measure of sleepiness that exists in twoversions, A and B [73]. The original KSS A labelled the odd scales only (1 = extremely alert, 3 = alert,5 = neither alert nor sleepy, 7 = sleepy but no effort to keep awake, and 9 = very sleepy and a greateffort to keep awake, fighting sleep) while the KSS B [66] subsequently completed the even labels(2 = very alert, 4 = rather alert, 6 = some signs of sleepiness, and 8 = sleepy, some effort to keep awake).These two versions have been verified to be similar [73] and their results are comparable. In thisstudy, we implemented version B. The instructions request the participant to indicate their “level ofsleepiness during the 5 min before this rating by selecting the appropriate description”. We interpretedthe response of this rating to reflect the perceived sleepiness of participants upon waking prior to thecommencement of the PVT.
The custom-designed subjective measure of sleep duration (Item 3) is a self-report unipolar14-point Likert scale. This design requests each participant to rank their sleep duration as “accuratelyas possible” from the fourteen options supplied. Each sleep time category is measured in incrementsof 0.5 h between either end categories of the scale (0–3 h and 9+ hours), for example, 0–3, 3–3.5, 3.5–4,4–4.5, etc.
To record each participants’ subjective sleep quality, we developed a self-report five-point unipolarLikert scale. The scales options for selection contained, very poor, poor, average, good, and very good.The decision to design this single-item scale as opposed to utilizing the established Sleep Quality Scale(SQS, 5–10 min completion time) [74] or the Pittsburgh Sleep Quality Index (PSQI, 1 month reportingduration) [75], was to reduce potential time constraints of each participant. As the test was undertakenprior to each subject attending their employment obligations (if applicable), limiting the test durationwas a factor in the design of this study. To gather demographic data of the participants’ typical hoursslept each night we included a five-point unipolar Likert scale with the following options in hours, 0–3,3–5, 5–7, 7–9, and 9+.
Clocks&Sleep 2020, 2 220
4.6. Statistical Analysis
With reference to Basner and Dinges [68], the PVT performance metrics recorded in this studywere the mean RT, mean 1/RT (reciprocal response time or response speed calculated by dividing RT(ms) by 1000, then reciprocally transformed) [76], the number of lapses (≥500 ms), the number of falsestarts (RT ≤ 100 ms and responses prior to the red stimuli), and performance score (i.e., 1 minus thenumber of lapses and false starts divided by the number of valid stimuli including false starts) [68].
A planned sequence of five paired sample t-test’s [77] was completed to examine each vigilancemetric between conditions for the respective groups (Group A: control vs. melody; Group B: control vs.rhythm). Cohen’s d was the effect size employed for the analysis of the paired t-test’s and was calculatedby the mean of within-subject differences, divided by the standard deviation of the within-subjectdifferences [31]. The Shapiro–Wilk test was applied to asses normal distribution of the data [78].Datasets that rejected the normality hypothesis were analysed using the non-parametric Wilcoxonsigned rank test [79].
The Wilcoxon signed rank test was also employed to analyse the median rank within-subjectdifferences for the subjective measures (KSS, sleep duration, sleep quality) in each individual testgroup. The effect size selected for the analysis of each Wilcoxon signed rank test was calculated fromthe z-value reported by the test, divided by the square root of the number of observations recorded(i.e., N = 20) [80]. Additionally, percentage comparisons were undertaken for each subjective measureas an aggregate of both test sessions for each test group. An α = 0.05 was considered statisticallysignificant for the analysis and power calculations. Raw data were initially tabulated for analyses inMicrosoft Excel [81], and then imported to SPSS 26 [82] for statistical analysis.
Supplementary Materials: Supplementary materials can be found at http://www.mdpi.com/2624-5175/2/2/17/s1.Table S1. Online questionnaire for each test session.
Author Contributions: Conceptualization, S.J.M., D.S.V., and A.G.D.; methodology, S.J.M.; software, S.J.M.;validation, S.J.M. and J.E.G.; formal analysis, S.J.M.; investigation, S.J.M.; resources, S.J.M.; data curation, S.J.M.;writing—original draft preparation, S.J.M.; writing—review and editing, S.J.M., J.E.G., D.S.V., and A.G.D.;visualization, S.J.M. and J.E.G.; supervision, J.E.G., D.S.V., and A.G.D.; project administration, S.J.M.; fundingacquisition, S.J.M. All authors have read and agreed to the published version of the manuscript.
Funding: S.J.M. acknowledges the Australian Government’s support of his research through the “AustralianGovernment Research Training Program Scholarship”.
Conflicts of Interest: The authors declare no conflict of interest. The funder had no role in the design of the study;in the collection, analyses, or interpretation of data; in the writing of the manuscript; or in the decision to publishthe results.
References
1. Trotti, L.M. Waking up is the hardest thing I do all day: Sleep inertia and sleep drunkenness. Sleep Med. Rev.2017, 35, 76–84. [CrossRef] [PubMed]
2. Hilditch, C.J.; McHill, A.W. Sleep inertia: Current insights. Nat. Sci. Sleep 2019, 11, 155. [PubMed]3. Tassi, P.; Muzet, A. Sleep inertia. Sleep Med. Rev. 2000, 4, 341–353. [CrossRef] [PubMed]4. Wertz, A.T.; Ronda, J.M.; Czeisler, C.A.; Wright, K.P., Jr. EFfects of sleep inertia on cognition. JAMA 2006,
295, 163–164. [CrossRef] [PubMed]5. Wilkinson, R.T.; Stretton, M. Performance after awakening at different times of night. Psychon. Sci. 1971, 23,
283–285. [CrossRef]6. Sallinen, M.; HÄRmÄ, M.; ÅKerstedt, T.; Rosa, R.; Lillqvist, O. Promoting alertness with a short nap during
a night shift. J. Sleep Res. 1998, 7, 240–247. [CrossRef]7. Jewett, M.E.; Wyatt, J.K.; Ritz-De Cecco, A.; Khalsa, S.B.; Dijk, D.J.; Czeisler, C.A. Time course of sleep inertia
dissipation in human performance and alertness. J. Sleep Res. 1999, 8, 1–8. [CrossRef]8. Dinges, D.F. Are you awake? Cognitive performance and reverie during the hypnopompic state. In Sleep and
Cognition; American Psychological Association: Washington, DC, USA, 1990; pp. 159–175. [CrossRef]9. Brooks, A.; Lack, L. A brief afternoon nap following nocturnal sleep restriction: Which nap duration is most
recuperative? Sleep 2006, 29, 831–840. [CrossRef]
Clocks&Sleep 2020, 2 221
10. Van Dongen, H.P.; Price, N.J.; Mullington, J.M.; Szuba, M.P.; Kapoor, S.C.; Dinges, D.F. Caffeine eliminatespsychomotor vigilance deficits from sleep inertia. Sleep 2001, 24, 813–819. [CrossRef]
11. Signal, T.L.; van den Berg, M.J.; Mulrine, H.M.; Gander, P.H. Duration of sleep inertia after napping duringsimulated night work and in extended operations. Chronobiol. Int. 2012, 29, 769–779. [CrossRef]
12. Santhi, N.; Groeger, J.A.; Archer, S.N.; Gimenez, M.; Schlangen, L.J.M.; Dijk, D.J. Morning Sleep Inertia inAlertness and Performance: Effect of Cognitive Domain and White Light Conditions. PLoS ONE 2013, 8,e79688. [CrossRef] [PubMed]
13. Bruck, D.; Pisani, D.L. The effects of sleep inertia on decision-making performance. J. Sleep Res. 1999, 8,95–103. [CrossRef] [PubMed]
14. Horne, J.; Moseley, R. Sudden early-morning awakening impairs immediate tactical planning in a changing‘emergency’scenario. J. Sleep Res. 2011, 20, 275–278. [CrossRef] [PubMed]
15. Hilditch, C.J.; Dorrian, J.; Banks, S. Time to wake up: Reactive countermeasures to sleep inertia. Ind. Health2016, 54, 528–541. [CrossRef] [PubMed]
16. Centofanti, S.A.; Dorrian, J.; Grant, C.; Stepien, J.; Coates, A.; Lushington, K.; Evans, A.; Reuter Lange, S.;Banks, S. 0200 The Effectiveness Of Caffeine Gum In Reducing Sleep Inertia Following A 30min NighttimeNap Opportunity: Preliminary Results. Sleep 2018, 41, A78. [CrossRef]
17. Reyner, L.A.; Horne, J.A. Suppression of sleepiness in drivers: Combination of caffeine with a short nap.Psychophysiology 1997, 34, 721–725. [CrossRef]
18. Hayashi, M.; Masuda, A.; Hori, T. The alerting effects of caffeine, bright light and face washing after a shortdaytime nap. Clin. Neurophysiol. Off. J. Int. Fed. Clin. Neurophysiol. 2003, 114, 2268–2278. [CrossRef]
19. Newman, R.A.; Kamimori, G.H.; Wesensten, N.J.; Picchioni, D.; Balkin, T.J. Caffeine gum minimizessleep inertia. Percept. Mot. Ski. 2013, 116, 280–293. [CrossRef]
20. Figueiro, M.G.; Sahin, L.; Roohan, C.; Kalsher, M.; Plitnick, B.; Rea, M.S. Effects of red light on sleep inertia.Nat. Sci. Sleep 2019, 11, 45–57. [CrossRef]
21. Geerdink, M.; Walbeek, T.J.; Beersma, D.G.M.; Hommes, V.; Gordijn, M.C.M. Short Blue Light Pulses (30 Min)in the Morning Support a Sleep-Advancing Protocol in a Home Setting. J. Biol. Rhythm. 2016, 31, 483–497.[CrossRef]
22. Gabel, V.; Maire, M.; Reichert, C.F.; Chellappa, S.L.; Schmidt, C.; Hommes, V.; Viola, A.U.; Cajochen, C.Effects of artificial dawn and morning blue light on daytime cognitive performance, well-being, cortisol andmelatonin levels. Chronobiol. Int. 2013, 30, 988–997. [CrossRef] [PubMed]
23. Kräuchi, K.; Cajochen, C.; Wirz-Justice, A. Waking up properly: Is there a role of thermoregulation insleep inertia? J. Sleep Res. 2004, 13, 121–127. [CrossRef] [PubMed]
24. Krauchi, K.; Knoblauch, V.; Wirz-Justice, A.; Cajochen, C. Challenging the sleep homeostat does not influencethe thermoregulatory system in men: Evidence from a nap vs. sleep-deprivation study. Am. J. Physiol. Regul.Integr. Comp. Physiol. 2006, 290, R1052–R1061. [CrossRef] [PubMed]
25. Kaplan, K.A.; Talavera, D.C.; Harvey, A.G. Rise and shine: A treatment experiment testing a morning routineto decrease subjective sleep inertia in insomnia and bipolar disorder. Behav. Res. Ther. 2018, 111, 106–112.[CrossRef] [PubMed]
26. Tassi, P.; Nicolas, A.; Dewasmes, G.; Eschenlauer, R.; Ehrhart, J.; Salame, P.; Muzet, A.; Libert, J.P. Effects ofNoise on Sleep Inertia as a Function of Circadian Placement of a One-Hour Nap. Percept. Mot. Ski. 1992, 75,291–302. [CrossRef]
27. Hayashi, M.; Uchida, C.; Shoji, T.; Hori, T. The effects of the preference for music on sleep inertia after a shortdaytime nap. Sleep Biol. Rhythm. 2004, 2, 184–191. [CrossRef]
28. McFarlane, S.J.; Garcia, J.E.; Verhagen, D.S.; Dyer, A.G. Alarm tones, music and their elements: Analysis ofreported waking sounds to counteract sleep inertia. PLoS ONE 2020, 15, e0215788. [CrossRef]
29. Jay, S.M.; Carley, D.M.; Aisbett, B.; Ferguson, S.A.; Paterson, J.L. Can stress act as a sleep inertia countermeasurewhen on-call? Biol. Rhythm Res. 2019, 50, 429–439. [CrossRef]
30. Floyd, M. Almost 60% of 16-34 Year Olds Use a Phone as Their Primary Timepiece; YouGov. Available online:https://today.yougov.com/topics/lifestyle/articles-reports/2011/05/05/brother-do-you-have-time (accessed on2 November 2018).
31. Cohen, J. Statistical Power Analysis for the Behavioral Sciences; Lawrence Erlbaum Associates: Mahwah, NJ,USA, 2013; ISBN 1-134-74270-3.
Clocks&Sleep 2020, 2 222
32. Tassi, P.; Bonnefond, A.; Engasser, O.; Hoeft, A.; Eschenlauer, R.; Muzet, A. EEG spectral power andcognitive performance during sleep inertia: The effect of normal sleep duration and partial sleep deprivation.Physiol. Behav. 2006, 87, 177–184. [CrossRef]
33. Hirshkowitz, M.; Whiton, K.; Albert, S.M.; Alessi, C.; Bruni, O.; DonCarlos, L.; Hazen, N.; Herman, J.;Katz, E.S.; Kheirandish-Gozal, L.; et al. National Sleep Foundation’s sleep time duration recommendations:Methodology and results summary. Sleep Health J. Natl. Sleep Found. 2015, 1, 40–43. [CrossRef]
34. Kaida, K.; Abe, T. Attentional lapses are reduced by repeated stimuli having own-name during a monotonoustask. PLoS ONE 2018, 13, e0194065. [CrossRef] [PubMed]
35. Nittono, H.; Tsuda, A.; Akai, S.; Nakajima, Y. Tempo of background sound and performance speed.Percept. Mot. Ski. 2000, 90, 1122. [CrossRef] [PubMed]
36. Amezcua, C.; Guevara, M.A.; Ramos-Loyo, J. Effects of Musical Tempi on Visual Attention Erps. Int. J. Neurosci.2005, 115, 193–206. [CrossRef] [PubMed]
37. Ferguson, A.R.; Carbonneau, M.R.; Chambliss, C. Effects of positive and negative music on performance of akarate drill. Percept Mot Ski. 1994, 78, 1217–1218. [CrossRef] [PubMed]
38. Riby, L.M. The joys of spring: Changes in mental alertness and brain function. Exp. Psychol. 2013, 60, 71–79.[CrossRef]
39. Davies, D.R.; Lang, L.; Shackleton, V.J. The effects of music and task difficulty on performance at a visualvigilance task. Br. J. Psychol. 1973, 64, 383–389. [CrossRef]
40. Husain, G.; Thompson, W.F.; Schellenberg, E.G. Effects of Musical Tempo and Mode on Arousal, Mood, andSpatial Abilities. Music Percept. Interdiscip. J. 2002, 20, 151–171. [CrossRef]
41. Bruck, D.; Ball, M. Optimizing Emergency Awakening to Audible Smoke Alarms: An Update. Hum. Factors2007, 49, 585–601. [CrossRef]
42. Ancoli-Israel, S.; Cole, R.; Alessi, C.; Chambers, M.; Moorcroft, W.; Pollak, C.P. The role of actigraphy in thestudy of sleep and circadian rhythms. Sleep 2003, 26, 342–392. [CrossRef]
43. Mantua, J.; Gravel, N.; Spencer, R.M.C. Reliability of Sleep Measures from Four Personal Health MonitoringDevices Compared to Research-Based Actigraphy and Polysomnography. Sensors 2016, 16, 646. [CrossRef]
44. Faul, F.; Erdfelder, E.; Lang, A.G.; Buchner, A. G*Power 3: A flexible statistical power analysis program forthe social, behavioral, and biomedical sciences. Behav. Res. Methods 2007, 39, 175–191. [CrossRef] [PubMed]
45. Faul, F.; Erdfelder, E.; Buchner, A.; Lang, A.-G. Statistical power analyses using G*Power 3.1: Tests forcorrelation and regression analyses. Behav. Res. Methods 2009, 41, 1149–1160. [CrossRef] [PubMed]
46. Cunningham, J.B.; McCrum-Gardner, E. Power, effect and sample size using GPower: Practical issues forresearchers and members of research ethics committees. Evid. Based Midwifery 2007, 5, 132–137.
47. Smith, S.S.; Kilby, S.; Jorgensen, G.; Douglas, J.A. Napping and nightshift work: Effects of a short nap onpsychomotor vigilance and subjective sleepiness in health workers. Sleep Biol. Rhythm. 2007, 5, 117–125.[CrossRef]
48. Australian Government. Guidelines on the Recognition of Sex and Gender; Department, A.G.S., Ed.; AustralianGovernment: Canberra, Australia, 2013.
49. Paul Voigt, A.V.D.B. The EU General Data Protection Regulation (GDPR), A Practical Guide; Springer InternationalPublishing AG: Cham, Germany, 2017. [CrossRef]
50. Gorilla. Gorilla. Available online: www.gorilla.sc (accessed on 10 April 2018).51. Society, T.B.P. The British Psychological Society. Available online: https://www.bps.org.uk (accessed on
5 May 2019).52. Research, N.I.F.H. National Institute for Health Research. Available online: https://www.nihr.ac.uk
(accessed on 5 May 2019).53. Cakewalk, I. Cakewalk. Available online: www.cakewalk.com (accessed on 18 November 2017).54. Monson, B.B. Hearing Voices in the High Frequencies: What Your Cell Phone isn’t Telling You.
Available online: https://acoustics.org/hearing-voices-in-the-high-frequencies-what-your-cell-phone-isnt-telling-you-brian-b-monson/ (accessed on 8 January 2018).
55. Buskirk, E.V. The Most Popular Keys of All Music on Spotify. Available online: https://insights.spotify.com/
us/2015/05/06/most-popular-keys-on-spotify/ (accessed on 13 March 2018).56. Bannister, M. The Billboard Hot 100: Exploring Six Decades of Number One Singles; GitHub: San Francisco,
CA, USA, April 2017; Available online: https://github.com/mspbannister/dand-p4-billboard/blob/master/Billboard_analysis__100417_.md (accessed on 14 March 2018).
Clocks&Sleep 2020, 2 223
57. Crossley-Holland, P. Rhythm; Encyclopaedia Britannica: Chicago, IL, USA; Available online: https://www.britannica.com/art/rhythm-music (accessed on 22 February 2019).
58. Olivet, D. (Janurary 10, 2018) Chartmania!! I Broke Down Every Song That Reached the Billboard Top 5 in2017; Soundfly. Available online: https://flypaper.soundfly.com/write/chartmania-breaking-down-billboard-top-40-songs-2017/ (accessed on 2 February 2018).
59. Olivet, D. (Janurary 21, 2019) We Analyzed Every Dang Song That Cracked the Billboard Top 5 in 2018;Soundfly. Available online: https://flypaper.soundfly.com/produce/we-analyzed-every-dang-song-that-cracked-the-billboard-top-5-in-2018/ (accessed on 20 March 2019).
60. Fallows, D. (2001) Andante; Grove Music Online. Available online: https://www.oxfordmusiconline.com/grovemusic/view/10.1093/gmo/9781561592630.001.0001/omo-9781561592630-e-0000000854 (accessed on12 January 2019).
61. Moelants, D. Preferred tempo reconsidered. In Proceedings of the 7th International Conference on Music Perceptionand Cognition; Stevens, C., Burnham, D., McPherson, G., Schubert, E., Renwick, J., Eds.; Causal Productions:Sydney, Adelaide, Austrilia, 2002; pp. 580–583.
62. Fraisse, P. Rhythm and Tempo/The Psychology of Music/D; Deutsch, Ed.; Academic Press/pag: New York, NY,USA, 1982; Volume 149.
63. van Noorden, L.; Moelants, D. Resonance in the Perception of Musical Pulse. J. New Music Res. 1999, 28,43–66. [CrossRef]
64. Basner, M.; Mollicone, D.; Dinges, D.F. Validity and Sensitivity of a Brief Psychomotor Vigilance Test (PVT-B)to Total and Partial Sleep Deprivation. Acta Astronaut. 2011, 69, 949–959. [CrossRef]
65. Åkerstedt, T.; Gillberg, M. Subjective and Objective Sleepiness in the Active Individual. Int. J. Neurosci. 1990,52, 29–37. [CrossRef]
66. Baulk, S.D.; Reyner, L.A.; Horne, J.A. Driver sleepiness—evaluation of reaction time measurement as asecondary task. Sleep 2001, 24, 695–698. [CrossRef]
67. Kaida, K.; Takahashi, M.; Akerstedt, T.; Nakata, A.; Otsuka, Y.; Haratani, T.; Fukasawa, K. Validation ofthe Karolinska sleepiness scale against performance and EEG variables. Clin. Neurophysiol. Off. J. Int. Fed.Clin. Neurophysiol. 2006, 117, 1574–1581. [CrossRef]
68. Basner, M.; Dinges, D.F. Maximizing sensitivity of the psychomotor vigilance test (PVT) to sleep loss. Sleep2011, 34, 581–591. [CrossRef]
69. Dinges, D.F.; Powell, J.W. Microcomputer analyses of performance on a portable, simple visual RT taskduring sustained operations. Behav. Res. Methods Instrum. Comput. 1985, 17, 652–655. [CrossRef]
70. Dinges, D.F.; Maislin, D.; Maislin, G.; Moeller, D.; Hammond, R.; Soccolich, S.A.; Hickman, J.S.; Hanowski, R.J.;Kan, K.; Mollicone, D.; et al. 0194 Sleep Quantity And Quality, Pvt-b Performance, And Subjective Sleepiness,Fatigue, And Stress In Commercial Motor Vehicle (cmv) Drivers: On-duty Days Vs. Restart (off-duty) Days.Sleep 2019, 42, A79–A80. [CrossRef]
71. Centofanti, S.A.; Hilditch, C.J.; Dorrian, J.; Banks, S. A 30-Minute, but Not a 10-Minute Nighttime Nap isAssociated with Sleep Inertia. Sleep 2016, 39, 675–685. [CrossRef]
72. Van Dongen, H.P.; Maislin, G.; Mullington, J.M.; Dinges, D.F. The cumulative cost of additional wakefulness:Dose-response effects on neurobehavioral functions and sleep physiology from chronic sleep restriction andtotal sleep deprivation. Sleep 2003, 26, 117–126.
73. Miley, A.Å.; Kecklund, G.; Åkerstedt, T. Comparing two versions of the Karolinska Sleepiness Scale (KSS).Sleep Biol. Rhythm. 2016, 14, 257–260. [CrossRef]
74. Yi, H.; Shin, K.; Shin, C. Development of the Sleep Quality Scale. J. Sleep Res. 2006, 15, 309–316. [CrossRef]75. Buysse, D.J.; Reynolds, C.F., 3rd; Monk, T.H.; Berman, S.R.; Kupfer, D.J. The Pittsburgh Sleep Quality Index:
A new instrument for psychiatric practice and research. Psychiatry Res. 1989, 28, 193–213.76. Dinges, D.F.; Kribbs, N.B. Performing while sleepy: Effects of experimentally-induced sleepiness. In Sleep,
Sleepiness and Performance; John Wiley & Sons: Oxford, UK, 1991; pp. 97–128.77. Creswell, J.W.; Creswell, J.D. Research Design: Qualitative, Quantitative, and Mixed Methods Approaches; SAGE
Publications: Los Angeles, LA, USA, 2017.78. Ghasemi, A.; Zahediasl, S. Normality tests for statistical analysis: A guide for non-statisticians. Int. J.
Endocrinol. Metab. 2012, 10, 486–489. [CrossRef]

Clocks&Sleep 2020, 2 224
79. McDonald, J.H. Handbook of Biological Statistics; Sparky House Publishing: Baltimore, MD, USA, 2009; Volume 2.80. Rosenthal, R. Parametric measures of effect size. In The Handbook of Research Synthesis; Russell Sage
Foundation: New York, NY, USA, 1994; pp. 231–244.81. Microsoft. Microsoft Excel. Available online: www.microsoft.com (accessed on 2 July 2017).82. IBM. SPSS. Available online: www.ibm.com/analytics/spss-statistics-software (accessed on 11 July 2017).
© 2020 by the authors. Licensee MDPI, Basel, Switzerland. This article is an open accessarticle distributed under the terms and conditions of the Creative Commons Attribution(CC BY) license (http://creativecommons.org/licenses/by/4.0/).
Copyright © 2022 FDOKUMEN