Detection of auditory (cross-spectral) and auditory–visual (cross-modal) synchrony
20
Detection of Auditory (Cross Spectral) and Auditory-Visual (Cross Modal) Synchrony Ken W. Grant a , Virginie van Wassenhove b , David Poeppel b a Army Audiology and Speech Center Walter Reed Army Medical Center Washington, DC 20307-5001 USA b Neuroscience and Cognitive Science Program Cognitive Neuroscience of Language Laboratory University of Maryland, College Park, MD 20742 USA Corresponding Author: Ken W. Grant ([email protected] ) Work: 202-782-8596 Fax: 202-782-9228 Abstract Detection thresholds for temporal synchrony in auditory and auditory-visual sentence materials were obtained on normal-hearing subjects. For auditory conditions, thresholds were determined using an adaptive-tracking procedure to control the degree of temporal asynchrony of a narrow audio band of speech, both positive and negative in separate tracks, relative to three other narrow audio bands of speech. For auditory-visual conditions, thresholds were determined in a similar manner for each of four narrow audio bands of speech as well as a broadband speech condition, relative to a video image of a female speaker. Four different auditory filter conditions, as well as a broadband auditory- visual speech condition, were evaluated in order to determine whether detection thresholds were dependent on the spectral content of the acoustic speech signal. Consistent with previous studies of auditory-visual speech recognition which showed a broad, asymmetrical range of temporal synchrony for which intelligibility was basically unaffected (audio delays roughly between -40 ms and +240 ms), auditory-visual synchrony detection thresholds also showed a broad, asymmetrical pattern of similar magnitude (audio delays roughly between -45 ms and +200 ms). No differences in synchrony thresholds were observed for the different filtered bands of speech, or for broadband speech. In contrast, detection thresholds for audio-alone conditions were much smaller (between -17 ms and +23 ms) and symmetrical. These results suggest a fairly tight coupling between a subject's ability to detect cross-spectral (auditory) and cross-modal (auditory-visual) asynchrony and the intelligibility of auditory and auditory- visual speech materials. Keywords: Spectro-Temporal Asynchrony; Cross-Modal Asynchrony; Auditory- Visual Speech Processing * Abstract
-
Upload
independent -
Category
Documents
-
view
0 -
download
0
Transcript of Detection of auditory (cross-spectral) and auditory–visual (cross-modal) synchrony

Detection of Auditory (Cross Spectral) and Auditory-Visual (Cross Modal) Synchrony
Ken W. Granta, Virginie van Wassenhoveb, David Poeppelb aArmy Audiology and Speech Center Walter Reed Army Medical Center Washington, DC 20307-5001 USA
bNeuroscience and Cognitive Science Program
Cognitive Neuroscience of Language Laboratory University of Maryland, College Park, MD 20742 USA
Corresponding Author: Ken W. Grant ([email protected])
Work: 202-782-8596 Fax: 202-782-9228 Abstract Detection thresholds for temporal synchrony in auditory and auditory-visual sentence materials were obtained on normal-hearing subjects. For auditory conditions, thresholds were determined using an adaptive-tracking procedure to control the degree of temporal asynchrony of a narrow audio band of speech, both positive and negative in separate tracks, relative to three other narrow audio bands of speech. For auditory-visual conditions, thresholds were determined in a similar manner for each of four narrow audio bands of speech as well as a broadband speech condition, relative to a video image of a female speaker. Four different auditory filter conditions, as well as a broadband auditory-visual speech condition, were evaluated in order to determine whether detection thresholds were dependent on the spectral content of the acoustic speech signal. Consistent with previous studies of auditory-visual speech recognition which showed a broad, asymmetrical range of temporal synchrony for which intelligibility was basically unaffected (audio delays roughly between -40 ms and +240 ms), auditory-visual synchrony detection thresholds also showed a broad, asymmetrical pattern of similar magnitude (audio delays roughly between -45 ms and +200 ms). No differences in synchrony thresholds were observed for the different filtered bands of speech, or for broadband speech. In contrast, detection thresholds for audio-alone conditions were much smaller (between -17 ms and +23 ms) and symmetrical. These results suggest a fairly tight coupling between a subject's ability to detect cross-spectral (auditory) and cross-modal (auditory-visual) asynchrony and the intelligibility of auditory and auditory-visual speech materials. Keywords: Spectro-Temporal Asynchrony; Cross-Modal Asynchrony; Auditory-Visual Speech Processing
* Abstract

Detection of Auditory (Cross Spectral) and Auditory-Visual (Cross Modal) Synchrony
Ken W. Granta, Virginie van Wassenhoveb, David Poeppelb aArmy Audiology and Speech Center Walter Reed Army Medical Center Washington, DC 20307-5001 USA
bNeuroscience and Cognitive Science Program
Cognitive Neuroscience of Language Laboratory University of Maryland, College Park, MD 20742 USA
Corresponding Author: Ken W. Grant ([email protected])
Work: 202-782-8596 Fax: 202-782-9228
Abstract Detection thresholds for temporal synchrony in auditory and auditory-visual sentence materials were obtained on normal-hearing subjects. For auditory conditions, thresholds were determined using an adaptive-tracking procedure to control the degree of temporal asynchrony of a narrow audio band of speech, both positive and negative in separate tracks, relative to three other narrow audio bands of speech. For auditory-visual conditions, thresholds were determined in a similar manner for each of four narrow audio bands of speech as well as a broadband speech condition, relative to a video image of a female speaker. Four different auditory filter conditions, as well as a broadband auditory-visual speech condition, were evaluated in order to determine whether detection thresholds were dependent on the spectral content of the acoustic speech signal. Consistent with previous studies of auditory-visual speech recognition which showed a broad, asymmetrical range of temporal synchrony for which intelligibility was basically unaffected (audio delays roughly between -40 ms and +240 ms), auditory-visual synchrony detection thresholds also showed a broad, asymmetrical pattern of similar magnitude (audio delays roughly between -45 ms and +200 ms). No differences in synchrony thresholds were observed for the different filtered bands of speech, or for broadband speech. In contrast, detection thresholds for audio-alone conditions were much smaller (between -17 ms and +23 ms) and symmetrical. These results suggest a fairly tight coupling between a subject's ability to detect cross-spectral (auditory) and cross-modal (auditory-visual) asynchrony and the intelligibility of auditory and auditory-visual speech materials. Keywords: Spectro-Temporal Asynchrony; Cross-Modal Asynchrony; Auditory-Visual Speech Processing
* Manuscript

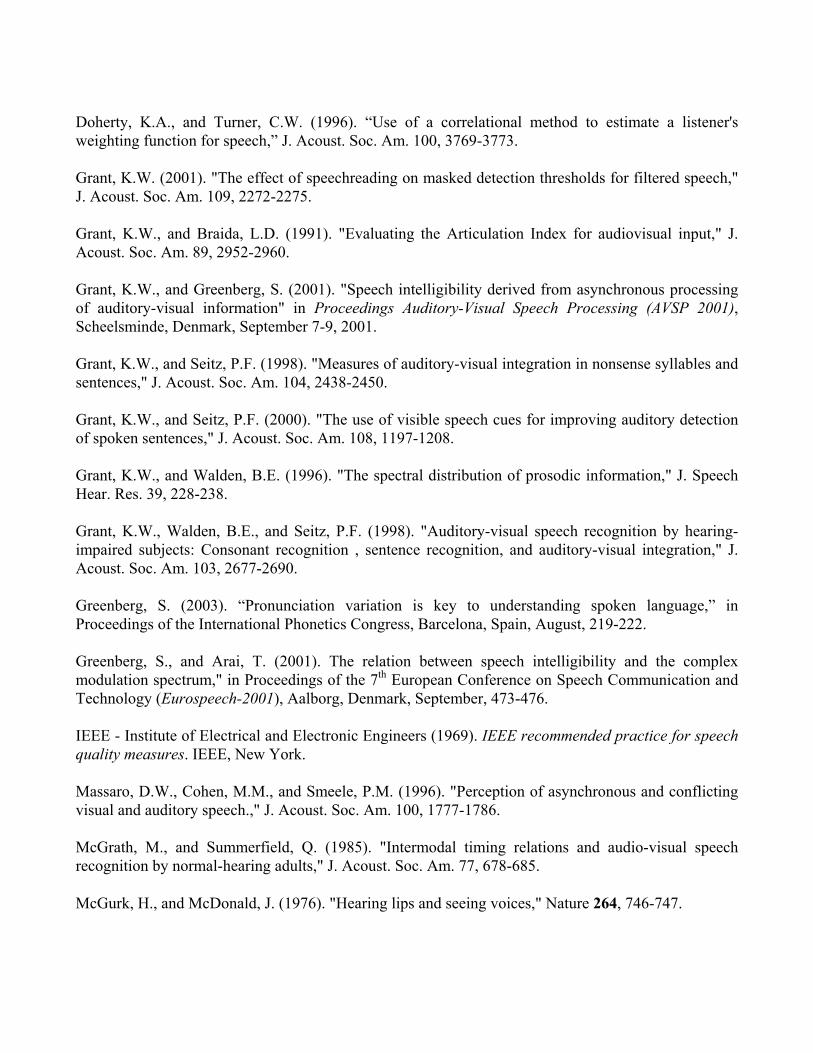
1. Introduction Speech perception requires that listeners be able to combine information from many different parts of the audio spectrum in order to effectively decode the incoming message. This is not always possible for listeners in noisy or reverberant environments or for listeners with significant hearing loss because some parts of the speech spectrum, usually the high frequencies, are partially or completely inaudible, and most probably, distorted. Signal processing algorithms that are designed to remove some of the deleterious effects of noise and reverberation from speech often apply different processing strategies to low- or high-frequency portions of the spectrum. Thus, different parts of the speech spectrum are subjected to different amounts of signal processing depending on the goals of the processor and the listening environment. Ideally, none of these signal processing operations would entail any significant processing delays, however, this may not always be the case. Recent studies by Silipo et al. (1999) and Stone and Moore (2003) have shown that relatively small across-channel delays (< 20 ms) can result in significant decrements in speech intelligibility. Data obtained from Silipo et al (1999) are displayed in Figure 1. In this figure, the speech signal consisted of four narrow spectral slits, each with an intelligibility of approximately 10%. The data shown are for the case when the lowest and highest bands were displaced in time relative to the two mid-frequency bands. When all four bands are played synchronously (0 ms delay), subjects are able to recognize approximately 90% of the words in TIMIT sentences (Zue et al., 1990). Note, however, that intelligibility suffers after very short cross-spectral delays on the order of 25 ms and performance drops to levels below that achieved when the two mid-frequency bands are played alone. Note further that the decline in intelligibility is symmetrical relative to the synchronous case and that spectro-temporal delays in the positive or negative direction are equally problematic. Since it is imperative for listeners to combine information across spectral channels in order to understand speech, compensation for any frequency-specific signal-processing delays would seem appropriate. FIGURE 1
But not all speech recognition takes place by hearing alone. In noisy and reverberant environments, speech recognition becomes difficult and sometimes impossible depending on the signal-to-noise ratio in the room or hall. Under these fairly common conditions, listeners often make use of visual speech cues (i.e., via speechreading) to provide additional support to audition, and in most cases, are able to restore intelligibility back to what it would have been had the speech been presented in the quiet (Sumby and Pollack, 1954; Grant and Braida, 1991). Thus, in many listening situations, individuals not only have to integrate information across audio spectral bands, but also across sensory modalities (Grant and Seitz, 1998). As with audio-alone input, the relative timing of audio and visual input in auditory-visual speech perception can have a pronounced and complex effect on intelligibility (Abry et al., 1996; Munhall et al., 1996; Munhall and Tohkura, 1998). And, because the bandwidth required for high fidelity video transmission is much broader than the bandwidth required for audio transmission (and therefore more difficult to transmit rapidly over traditional broadcast lines), there is more of an opportunity for the two sources of information to become misaligned. For example, in certain news broadcasts where foreign correspondents are shown as well as heard, it is often the case that the audio feed will precede the video feed resulting in a combined transmission that is out of sync and difficult

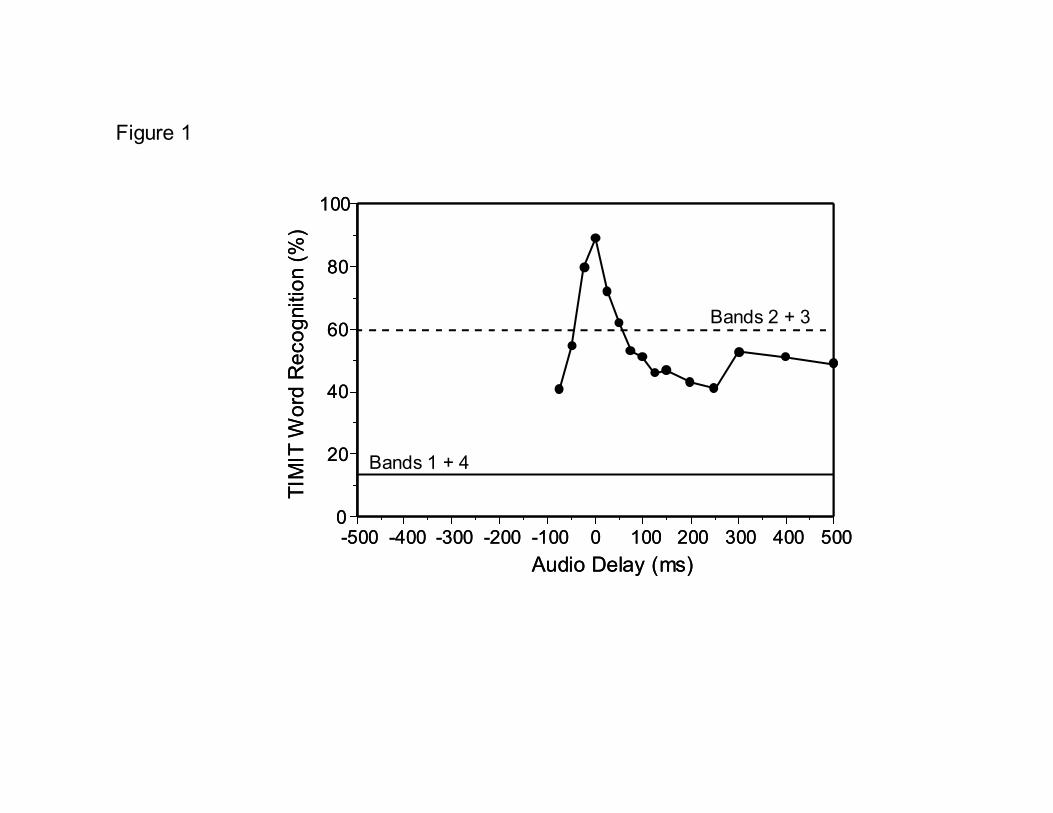
to understand. In fact, recent data reported by Grant and Greenberg (2001) showed that in cases where the audio signal (comprised of a low- and high-frequency band of speech) leads the video signal, the intelligibility falls precipitously with very small degrees of audio-visual asynchrony. In contrast, when the video speech signal leads the audio signal, intelligibility remains high over a large range of asynchronies, out to about 200 ms. Results obtained by Grant and Greenberg (2001) are shown below in Figure 2. In this experiment, two narrow bands of speech (the same low- and high-frequency bands used by Silipo et al., 1999) were presented in tandem with speechreading. Unlike the results shown in Figure 1, the data displayed in Figure 2 show a broad plateau between roughly 0-240 ms of audio delay where intelligibility is relatively constant. However, when the audio signal leads the visual signal (negative audio delays), performance declines in a similar manner as seen for audio-alone asynchronous speech recognition (Figure 1). FIGURE 2 Another example of these unusually long and asymmetric auditory-visual temporal windows of integration can be found in the work of van Wassenhove et al. (van Wassenhove et al., 2001). In that study, the McGurk illusion (McGurk and McDonald (1976) was used to estimate the temporal window of cross-modality integration. The subjects' task was to identify consonants from stimuli composed of either a visual /gA/ paired with an audio /bA/, or a visual /kA/ paired with an audio /pA/. The stimulus onset asynchrony between audio and video portions of each stimulus was manipulated between -467 and +467 ms. When presented in synchrony, the most likely fusion responses for these pairs of incongruent auditory-visual stimuli are /dA/ (or /DA/) and /tA/, respectively. However, when the audio and video components are made to be increasingly more asynchronous, fewer and fewer fusion responses are given and the auditory response dominates. This pattern is shown in Figure 3 for the incongruent pair comprised of audio /pA/ and visual /kA/. As with the date displayed in Figure 2, these data demonstrate a broad, asymmetric region of cross-modal asynchrony (-100 ms to 300 ms) where the most likely response is neither the audio nor video speech token, but rather the McGurk fusion response. FIGURE 3 One question that arises from these audio and auditory-visual speech recognition studies, and others like them (McGrath and Summerfield, 1985; Pandey et al., 1986; Massaro et al., 1996), is whether subjects are even aware of the asynchrony inherent in the signals presented for delays corresponding to the region where intelligibility is at a maximum. In other words, do the temporal windows of integration derived from studies of speech intelligibility correspond to the limits of synchrony perception? Or are subjects perceptually aware of small amounts of asynchrony that have no effect on intelligibility? Another important question is whether the perception of auditory and auditory-visual synchrony depends on the spectral content of the acoustic speech signal? For auditory-visual speech processing, Grant and Seitz (2000) and Grant (2001) have previously demonstrated that the cross-modal correlation between the visible movements of the lips (e.g., inter-lip distance or area of mouth) and the

acoustic speech envelope depends on the spectral region from which the envelope is derived. In general, a significantly greater correlation has been observed for mid-to-high-frequency regions, typically associated with place-of-articulation cues, than for low-frequency regions or even broadband speech (Figure 4). Because the spectral content of the acoustic speech signal effects the degree of cross-modal correlation, it is possible that a similar relation might be found for the detection of cross-modal asynchrony. Specifically, we hypothesized that subjects would be better at detecting cross-modal asynchrony for speech bands in the F2-F3 formant regions (mid-to-high frequencies) than for speech filter bands in the F1 formant region (low frequencies). Similarly, for audio-alone speech processing, different spectral regions are known to have differential importance with respect to overall energy as well as intelligibility. Frequency regions near 800 Hz have far greater amplitude than do higher frequency regions, and mid-frequencies between 1200-3000 Hz have far greater intelligibility that do lower or higher frequency regions (ANSI, 1969). With regard to audio-alone synchrony detection, it is not clear what role overall energy or intelligibility plays in determining synchrony thresholds. FIGURE 4 The purpose of the current study was to determine the limits of temporal integration over which speech information is combined, both within- and across-sensory channels. These limits are important because they govern how in time information from different spectral regions and auditory and visual modalities are combined for successful decoding of the speech signal. The study evaluated normal-hearing subjects using standard psychophysical methods that are likely to provide a more sensitive description of the limits of cross-modal temporal synchrony than those derived from speech identification experiments (McGrath and Summerfield, 1985; Pandey et al., 1986; Massaro et al., 1996; Silipo et al., 1999; Grant and Greenberg, 2001; van Wassenhove et al., 2001) or from subjective judgments of auditory-visual temporal asynchrony (van Wassenhove et al., 2001).
2. Experiment 1: Detection of Auditory-Visual, Cross-Modal Asynchrony
This experiment involved an adaptive, two-interval forced-choice detection task using band-pass filtered sentence materials presented under audio-video conditions. Normal-hearing subjects were asked to judge the synchrony between video and audio components of an audio-video speech stimulus. The video component was a movie of a female speaker producing one of two target sentences. The audio component was one of four different bandpass-filtered renditions of the target sentence. A fifth wide band speech condition was also tested. The degree of audio-video synchrony was adaptively manipulated until the subject's detection performance (comparing an audio-video signal that is synchronized to one that is out of sync) converged on a level of approximately 71% correct. Audio-video synchronization threshold determinations were repeated several times and for several different audio speech bands representing low-, mid-, and high-frequency speech energy.
2.1. Subjects Four adult listeners (35-49 years) with normal hearing participated in this study. The subject's hearing was measured by routine audiometric screening (i.e., audiogram) and quiet thresholds were

determined to be no greater than 20 dB HL at frequencies between 250 and 6000 Hz. All subjects had normal or corrected-to-normal vision (static visual acuity equal to or better than 20/30 as measured with a Snellen chart). Written informed consent was obtained prior to the start of the study.
2.2. Stimuli The speech materials consisted of sentences drawn from the Institute of Electrical and Electronic Engineers (IEEE) sentence corpus (IEEE, 1969) spoken by a female speaker. The full set contains 72 lists of ten phonetically balanced ‘low-context’ sentences each containing five key words (e.g., The birch canoe slid on the smooth planks). The sentences were recorded onto optical disc and the audio portions digitized and stored on computer. Two sentences from the IEEE corpus were selected for use as test stimuli. These were "The birch canoe slid on the smooth planks" and "Four hours of steady work faced us". The sentences were processed through a Matlab© software routine to create four filtered speech versions each comprised of one spectrally distinct 1/3-octave band (band 1: 298-375 Hz; band 2: 750-945 Hz; band 3: 1890-2381 Hz ; and band 4: 4762-6000 Hz). Finite impulse response (FIR) filters were used with attenuation rates exceeding 100 dB/octave. A fifth condition, comprised of the unfiltered wide band sentences, was also used.
2.3. Procedures Subjects were seated comfortably in a sound-treated booth facing a computer touch screen. The speech materials were presented diotically (same signal to both ears) over headphones at a comfortable listening level (approximately 75 dB SPL). A 21" video monitor positioned 5 feet from the subject displayed films of the female talker speaking the target sentence. An adaptive two-interval, forced-choice procedure was used in which one stimulus interval contained a synchronized audio-visual presentation and the other stimulus interval contained an asynchronous audio-visual presentation. The assignment of the standard and comparison stimuli to interval one or interval two was randomized. Subjects were instructed to choose the interval containing the speech signal that appeared to be "out of sync". The subject's trial-by-trial responses were recorded in a computer log. Correct-answer feedback was provided to the subject after each trial. The degree of audio-video asynchrony was controlled adaptively according to a two-down, one-up adjustment rule. Separate blocks were run for audio leading (negative delays) and audio lagging (positive delays) conditions. Two consecutive correct responses led to a decrease in audio-video asynchrony (task gets harder), whereas an incorrect response led to an increase in audio-video asynchrony (task gets easier). At the beginning of each adaptive block of trials, the amount of asynchrony was 390 ms which was obvious to the subjects. The initial step size was a factor of 2.0, doubling and halving the amount of asynchrony depending on the subject's responses. After three reversals in the direction of the adaptive track, the step size decreased to a factor of 1.2, representing a 20% change in asynchrony. The track continued in this manner until a total of ten reversals were obtained using the smaller step size. Thresholds for synchrony detection were computed as the geometric mean of these last ten reversals. A total of four to six adaptive blocks per filter condition were run representing both audio leading conditions and audio lagging conditions. Two different sentences per condition were used to improve the generalizability of the results.

2.4. Results and Discussion The results, averaged across subjects and sentences, are displayed in Figure 5. A three-way repeated measures ANOVA with sentence, temporal-order (audio lead versus audio lag), and filter-band condition as within subjects factors, showed a significant effect for temporal order [F(1,3) = 51.6, p = 0.006], but no effect for sentence, filter-band condition, or any of the interactions. For the purpose of this analysis, all thresholds were converted to their absolute value in order to directly compare audio leading versus audio lagging conditions. The significance of temporal order for auditory and visual modalities (audio leading or audio lagging) is easily seen in the highly asymmetric pattern displayed in Figure 5. FIGURE 5 The fact that there was no significant difference in detection thresholds for the various filter conditions was somewhat unexpected given previous data (Grant and Seitz, 2000; Grant, 2001) showing that the correlation between lip kinematics and audio envelope tends to be best in the mid-to-high spectral regions (bands 3 and 4). Our initial expectation was that audio signals that are more coherent with the visible movements of the speech articulators would produce the most sensitive detection thresholds. However, because the correlation between lip kinematics and acoustic envelope are modest at best and are sensitive to the particular speaker and phonetic makeup of the sentence, differences in the degree of audio-video coherence across filter conditions may have been too subtle to allow for threshold differences to emerge (see Figure 4). Although not significant, it is interesting that the thresholds for the mid-frequency band between 1890-2381 Hz were consistently smaller than those for the other frequency bands when the audio signal lagged the visual signal. Additional work with a larger number of sentences and subjects will be required to explore this issue further. The two most compelling aspects of the data shown in Figure 5 are the overall size of the temporal window for which asynchronous audio-video speech input is perceived as synchronous and the highly asymmetric shape to the window. As discussed earlier (see Figures 2 and 3), the temporal window for auditory-visual speech recognition, where intelligibility is roughly constant, is about 250 ms (~50 ms audio lead to ~220 ms visual lead). This corresponds roughly to the resolution needed for temporally fine-grained phonemic analysis on the one hand (< 50 ms) and coarse-grain syllabic analysis on the other (roughly 250 ms), which we interpret as reflecting the different roles played by auditory and auditory-visual speech processing. When speech is processed by eye (i.e., speechreading), it may be advantageous to integrate over long time windows of roughly syllabic lengths (200-300 ms) because visual speech cues are rather coarse (Seitz and Grant, 1999). At the segmental level, visual recognition of voicing and manner-of-articulation is generally poor (Grant et al., 1998), and while some prosodic cues are decoded at better-than-chance levels (e.g., syllabic stress, and phrase boundary location) accuracy is not very high (Grant and Walden, 1996). The primary information conveyed by speechreading is related to place of articulation, and these cues tend to be evident over fairly long intervals often spanning more than one phoneme (Greenberg, 2003). In contrast, acoustic processing of speech is much more robust and capable of fine-grained analyses using temporal window intervals between 10-40 ms (Stevens and Blumstein, 1978; Greenberg and Arai, 2001). What is interesting is that when acoustic and visual cues are combined asynchronously, the data suggest that there are multiple temporal windows of processing. That is, when visual cues lead acoustic cues, a long

temporal window seems to dominate whereas when acoustic cues lead visual cues, a short temporal window dominates. For the simple task used in the present study, one that does not require speech recognition, but simply detecting synchronous from asynchronous auditory-visual speech inputs, the results are essentially unchanged from that observed earlier in recognition tasks. Audio lags up to approximately 220 ms are indistinguishable from the synchronous condition, at least for these speech materials. For audio-leading stimuli, asynchronies less than approximately 50 ms went unnoticed, giving a result more consistent with audio-alone experiments. Thus, unlike many psychophysical tests comparing detection on the one hand to identification on the other (where detection thresholds are far better than identification), cross-modal synchrony detection and speech recognition of asynchronous auditory-visual input appear to be highly related. The asymmetry (auditory lags being less noticeable than auditory leads) appears to be an essential property of auditory-visual integration. One possible explanation makes note of the natural timing relations between audio and visual events in the real world, especially when it comes to speech. In nature, visible byproducts of speech articulation, including posturing and breath, almost always occur before acoustic output. This is also true for many non-speech events where visible movement precedes sound (e.g., a hammer moving and then striking a nail) (Dixon and Spitz, 1980). It is reasonable to assume that any learning network (such as our brains) exposed to repeated occurrences of visually leading events would adapt its processing to anticipate and tolerate multisensory events where visual input leads auditory input while maintaining the perception that the two events are bound together. Conversely, because acoustic cues rarely precede visual cues in the real world and carry sufficient information by themselves to recognize speech, the learning network might become fairly intolerant and unlikely to bind acoustic and visual input where acoustic cues lead visual cues. Thus, precise alignment of audio and visual speech components are not required for successful auditory-visual integration, but the preservation of the natural visual precedence is critical.
3. Experiment 2: Detection of Auditory, Cross-Spectral Asynchrony This experiment paralleled Experiment 1 in most respects except that the stimuli were audio-only. Normal-hearing subjects were asked to judge the synchrony between audio components of a multi-band acoustic speech stimulus. The acoustic stimulus was comprised of four sub-bands. On each block of trials, one sub-band was selected randomly and displaced in time (either leading or lagging) relative to the other three sub-bands. The degree of cross-spectral synchrony was adaptively manipulated until the subject's detection performance converged on a level of approximately 71% correct. Auditory synchronization threshold determinations were repeated several times for each sub-band and each direction of displacement.
3.1. Subjects Five adult listeners (35-49 years) with normal hearing participated in this study. Four of the subjects had previously participated in Experiment 1. All subjects had quiet tone thresholds less than 20 dB HL for frequencies between 250 and 6000 Hz. Written informed consent was obtained prior to the start of the study.

3.2. Stimuli The speech materials consisted of the same two sentences described in Experiment 1. The sentences were processed in the same manner as in Experiment 1 to create four filtered speech conditions each comprised of one spectrally distinct 1/3-octave band (band 1: 298-375 Hz; band 2: 750-945 Hz; band 3: 1890-2381 Hz; and band 4: 4762-6000 Hz). Finite impulse response (FIR) filters were used with attenuation rates exceeding 100 dB/octave. The main distinction between this experiment and Experiment 1 was that all four spectral bands of speech were presented on every trial.
3.3. Procedures Subjects were seated comfortably in a sound-treated booth facing a computer touch screen. The speech materials were presented diotically (same signal to both ears) over headphones at a comfortable listening level (approximately 75 dB SPL). An adaptive two-interval, forced-choice procedure was used in which one stimulus interval contained a synchronized audio presentation (all four bands presented in synchrony) and the other stimulus interval contained an asynchronous audio presentation in which one band, chosen randomly for each block of trials, was displaced in time relative to the remaining three spectral bands. Both positive and negative audio delays were tested in separate blocks. The assignment of the standard and comparison stimuli to interval one or interval two was randomized. Subjects were instructed to choose the interval containing the speech signal that appeared to be "out of sync". The subject's trial-by-trial responses were recorded in a computer log and correct-answer feedback was provided to the subject after each trial. The degree of audio asynchrony was controlled adaptively according to a two-down, one-up adjustment rule. As in Experiment 1, two consecutive correct responses led to a decrease in audio asynchrony, whereas an incorrect response led to an increase in audio asynchrony. At the beginning of each adaptive block of trials, the amount of asynchrony was 150 ms. The initial step size was a factor of 2.0, doubling and halving the amount of asynchrony depending on the subject's responses. After three reversals in the direction of the adaptive track, the step size decreased to a factor of 1.2, representing a 20% change in asynchrony. The track continued in this manner until a total of ten reversals were obtained using the smaller step size. Thresholds for synchrony detection were computed as the geometric mean of these last ten reversals. Two to four adaptive blocks per filter condition were run representing both leading (positive audio delays) and lagging conditions (negative audio delays).
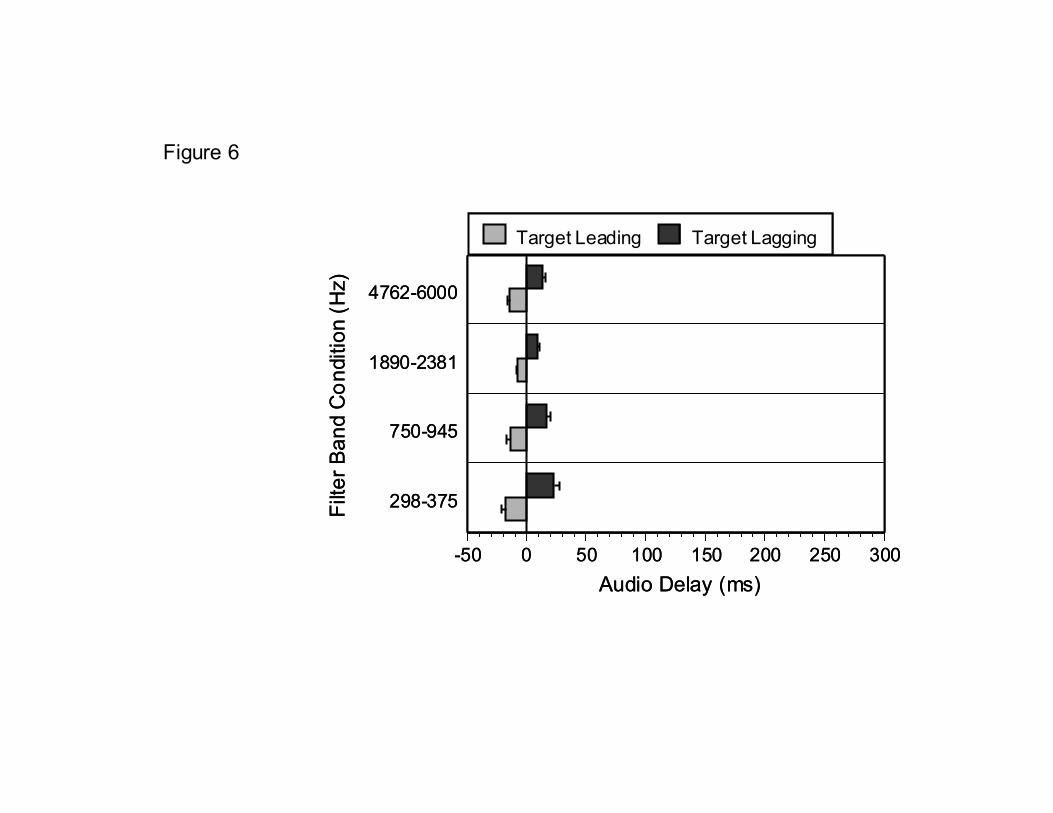
3.4. Results and Discussion The results, averaged across subjects and sentences, are displayed in Figure 6. The average thresholds for the four filter bands were 20.2, 15.0, 8.4, and 13.8 ms, respectively. A three-way repeated measures ANOVA with sentence, direction of the delay (spectral band leading versus lagging), and filter-band condition as within subjects factors, showed a significant effect for filter condition [F(3,12) = 5.8, p = 0.011], but no effect for sentence, direction of the delay, or any of the interactions. Comparisons across filter conditions using a paired samples t-test with Bonferonni adjusted probability revealed that the asynchrony thresholds for band 3 were significantly smaller than those for band 1 (t = 4.16, p = 0.003) or for band 4 (t = 3.52, p = 0.014). No other filter-band comparisons were significant.

FIGURE 6 Unlike the auditory-visual results shown in Figure 5, results for detection of cross-spectral asynchrony were symmetric and relatively small, ranging between approximately –17 ms and +23 ms. The smallest thresholds were obtained when band three (1890-2381 Hz) was displaced. Post-hoc analyses using multiple T-tests and Bonferroni corrections indicated that the detection threshold for this band was significantly smaller than all other bands, regardless of the direction of the temporal displacement. If subjects’ were basing their detection response on which stimulus interval sounded worst (both with respect to quality and intelligibility), movement of this particular band might have been more noticeable because this frequency region is known to be more intelligible than the other 1/3-octave band regions used in these experiments (ANSI, 1969). Another possible explanation for the greater sensitivity to displacements of band 3 relative to the other three bands is that normally-hearing subjects tend to assign more importance to this mid-frequency region than to other frequency regions when listening to broadband speech (Doherty and Turner, 1996; Turner et al., 1998).
4. General Discussion and Conclusion Auditory-visual integration of speech is highly tolerant of audio and visual asynchrony, but only
when the visual stimulus precedes the audio stimulus. When the audio stimulus precedes the visual stimulus, asynchrony across modality is readily perceived. This is true regardless of whether the subject's task is to recognize and identify words or syllables, or to simply detect which of two auditory-visual speech inputs is synchronized. This suggests that as soon as auditory-visual asynchrony is detected, the ability to integrate the two sources of information is affected. In other words, both speech recognition and asynchrony detection appear to be constrained by the same temporal window of integration. We recognize that this is a fairly unusual outcome in most psychophysical tests where the limit of sensitivity to a particular stimulus property (as measured by detection or discrimination) coincides with its use in higher-order decisions (e.g., recognition and identification). However, some degree of caution in interpreting these results is warranted because of the limited number of subjects and age range tested.
The range of auditory-visual temporal asynchronies which go apparently unnoticed in speech is fairly broad and highly asymmetrical (roughly -50 ms to +200 ms). It is suggested that tolerance to such a broad range arises from several possible sources. First, visual speech recognition is coarse at best. In cases where visual speech cues precede audio speech cues it is advantageous to delay the recognition response until enough acoustic data has been received. Second, the most significant contribution to speech perception made by visual speech cues relates to place of articulation. These cues are distributed over fairly long widows and are trans-segmental. Third, for the vast majority of naturally occurring events in the real world, visual motion precedes acoustic output. The functional significance of such constant exposure to auditory-visual events where vision precedes audition is to create perceptual processes that are capable of grouping auditory and visual events into a coherent, single object in spite significant temporal misalignments. For speech processing, it is not surprising, and probably fortunate, that the extent of the temporal window is roughly that of a syllable.
For the auditory detection of temporal synchrony, the situation is quite different. In this case, the sensitivity to cross-spectral asynchrony is much finer than that observed for auditory-visual speech processing (~20 ms as opposed to ~250 ms) and symmetric. Thus, multiple time constants appear to be

involved in auditory and auditory-visual speech processing, corresponding possibly to a coarse-grained syllabic analysis on the one hand, and a fine-grained phonemic analysis on the other.
One interesting question emerging from this study is whether the tolerance to long temporal asynchronies observed when visual speech precedes acoustic speech would be also seen in cases of both cross-modal and cross-spectral asynchrony. In other words, would an easily detectable auditory spectral asynchrony (for instance, 50 ms) become less noticeable and have a smaller effect on intelligibility if presented in an auditory-visual context? Judging from the results presented in this study, when the visual channel precedes the auditory channel, seemingly long delays go undetected. If so, this might suggest that one could get away with greater acoustic cross-spectral signal-processing delays (e.g., in advanced digital hearing aids) under auditory-visual conditions than for auditory-alone conditions. We have recently begun to explore this very question and preliminary pilot results suggest that detection of within-modality spectral asynchrony (audio alone) is roughly unchanged in the presence of visual speech cues, perhaps indicative of the much better temporal resolution for acoustic stimuli as compared to visual stimuli. What effect such cross-spectral asynchrony might have on auditory-visual intelligibility is currently unknown.
5. Acknowledgements This research was supported by the Clinical Investigation Service, Walter Reed Army Medical Center, under Work Unit #00-2501 and by grant numbers DC 000792-01A1 from the National Institute on Deafness and Other Communication Disorders to Walter Reed Army Medical Center, SBR 9720398 from the Learning and Intelligent Systems Initiative of the National Science Foundation to the International Computer Science Institute, and DC 004638-01 and DC 005660-01 from the National Institute on Deafness and Other Communication Disorders to the University of Maryland. A preliminary report of this work was presented at the International Speech Communication Association (ISCA) Tutorial and Research Workshop on Audio Visual Speech Processing (AVSP), St Jorioz France, 4-7 September, 2003. We would like to thank Dr. Steven Greenberg and Dr. Van Summers for their support and many fruitful discussions concerning this work. The opinions or assertions contained herein are the private views of the authors and should not be construed as official or as reflecting the views of the Department of the Army or the Department of Defense.
6. References Abry, C., Lallouache, M.-T., and Caithiard, M.-A. (1996). “How can coarticulation models account for speech sensitivity to audio-visual desynchronization?”, In D. Stork and M. Hennecke (Eds.), Speechreading by Humans ands Machines, NATO ASI Series F: Computer and Systems Sciences, 150, pp. 247-255. ANSI (1969). ANSI S3.5-1969, “American National Standard Methods for the Calculation of the Articulation Index,” (American National Standards Institute, New York). ANSI (1989). ANSI S3.6-1989, “American national standard specification for audiometers,” (American National Standards Institute, New York). Dixon, N., and Spitz, L. (1980). “The detection of audiovisual desynchrony,” Perception 9, 719-721.
Doherty, K.A., and Turner, C.W. (1996). “Use of a correlational method to estimate a listener's weighting function for speech,” J. Acoust. Soc. Am. 100, 3769-3773. Grant, K.W. (2001). "The effect of speechreading on masked detection thresholds for filtered speech," J. Acoust. Soc. Am. 109, 2272-2275. Grant, K.W., and Braida, L.D. (1991). "Evaluating the Articulation Index for audiovisual input," J. Acoust. Soc. Am. 89, 2952-2960. Grant, K.W., and Greenberg, S. (2001). "Speech intelligibility derived from asynchronous processing of auditory-visual information" in Proceedings Auditory-Visual Speech Processing (AVSP 2001), Scheelsminde, Denmark, September 7-9, 2001. Grant, K.W., and Seitz, P.F. (1998). "Measures of auditory-visual integration in nonsense syllables and sentences," J. Acoust. Soc. Am. 104, 2438-2450. Grant, K.W., and Seitz, P.F. (2000). "The use of visible speech cues for improving auditory detection of spoken sentences," J. Acoust. Soc. Am. 108, 1197-1208. Grant, K.W., and Walden, B.E. (1996). "The spectral distribution of prosodic information," J. Speech Hear. Res. 39, 228-238. Grant, K.W., Walden, B.E., and Seitz, P.F. (1998). "Auditory-visual speech recognition by hearing-impaired subjects: Consonant recognition , sentence recognition, and auditory-visual integration," J. Acoust. Soc. Am. 103, 2677-2690. Greenberg, S. (2003). “Pronunciation variation is key to understanding spoken language,” in Proceedings of the International Phonetics Congress, Barcelona, Spain, August, 219-222. Greenberg, S., and Arai, T. (2001). The relation between speech intelligibility and the complex modulation spectrum," in Proceedings of the 7th European Conference on Speech Communication and Technology (Eurospeech-2001), Aalborg, Denmark, September, 473-476. IEEE - Institute of Electrical and Electronic Engineers (1969). IEEE recommended practice for speech quality measures. IEEE, New York. Massaro, D.W., Cohen, M.M., and Smeele, P.M. (1996). "Perception of asynchronous and conflicting visual and auditory speech.," J. Acoust. Soc. Am. 100, 1777-1786. McGrath, M., and Summerfield, Q. (1985). "Intermodal timing relations and audio-visual speech recognition by normal-hearing adults," J. Acoust. Soc. Am. 77, 678-685. McGurk, H., and McDonald, J. (1976). "Hearing lips and seeing voices," Nature 264, 746-747.

Munhall, K.G., Gribble, P., Sacco, L., and Ward, M. (1996). “Temporal constraints on the McGurk effect,” Perception and Psychophysics 58, 351-362. Munhall, K.G., and Tohkura, Y. (1998). “Audiovisual gating and the time course of speech perception,” J. Acoust. Soc. Am. 104, 530-539. Pandey, P.C., Kunov, H., and Abel, S.M. (1986). "Disruptive effects of auditory signal delay on speech perception with lipreading," J. Aud. Res. 26, 27-41. Seitz, P.F., and K.W. Grant, K.W. (1999). "Modality, perceptual encoding speed, and time-course of phonetic information," AVSP'99 Proceedings, Aug, 7-9, 1999, Santa Cruz, CA. Silipo, R., Greenberg, S., and Arai, T. (1999). "Temporal constraints on speech intelligibility as deduced from exceedingly sparse spectral representations," in Proceedings of Eurospech 1999. Budepest, pp. 2687-2690. Stevens, K.N., and Blumstein, S.E. (1978). "Invariant cues for place of articulation in stop consonants," J. Acoust. Soc. Am., 64, 1358-1368. Stone, M.A., and Moore, B.C.J. (2003). "Tolerable hearing aid delays. III. Effects of speech production and perception of across-frequency variation in delay," Ear Hear. 24, 175-183. Sumby, W.H., and Pollack, I. (1954). "Visual contribution to speech intelligibility in noise," J. Acoust. Soc. Am. 26, 212-215. Turner, C.W., Kwon, B.J., Tanaka, C., Knapp, J., Hubbartt, J.L., and Doherty, K.A. (1998). “Frequency-weighting functions for broadband speech as estimated by a correlational method,” J. Acoust. Soc. Am. 104, 1580-1586. van Wassenhove, V., Grant, K.W., and Poeppel, D. (2001). Timing of Auditory-Visual Integration in the McGurk Effect. Presented at the Society of Neuroscience Annual Meeting, San Diego, CA, November, 488. Zue, V. Seneff, S., and Glass, J. (1990) “Speech database development at MIT: TIMIT and beyond,” Speech Communication, 9, 351-356.

FIGURE LEGENDS Figure 1. Average auditory intelligibility of TIMIT sentences as a function of cross-spectral asynchrony (see text for details). Note that word recognition performance declines in a fairly symmetric manner after small amounts of temporal asynchrony is introduced across spectral bands. Figure 2. Average auditory-visual intelligibility of IEEE sentences as a function of audio-video asynchrony. Note the substantial plateau region between -50 ms audio lead to +200 ms audio delay where intelligibility scores are high relative to the audio-alone or video-alone conditions. Adapted from Grant and Greenberg (2001). Figure 3. Labeling functions for the incongruent AV stimulus visual /kA/ and acoustic /pA/ as a function of audiovisual asynchrony (audio delay). Circles = probability of responding with the fusion response /tA/; squares = probability of responding with the acoustic stimulus /pA/; triangles = probability of responding with the visual response /kA/. Note the relatively long temporal window (-100 ms audio lead to +250 ms audio lag) where fusion responses are likely to occur. Adapted from van Wassenhove et al. (2001). Figure 4. Scatter plots showing the degree of correlation between area of mouth opening and the rms amplitude envelope for two sentences (“Watch the log float in the wide river” and “Both brothers wear the same size”). The different panels represent the spectral region from which the speech envelopes were derived. WB = wide band, F1 = 100-800 Hz, F2 = 800-2200 Hz, F3 = 2200-6500 Hz. Adapted from Grant and Seitz (2000). Figure 5. Average auditory-visual synchrony detection thresholds for unfiltered (wide band) speech and for four different bandpass-filtered speech conditions. Error bars indicate one standard error. Figure 6. Average auditory synchrony detection thresholds for four different bandpass-filtered speech conditions. Error bars indicate one standard error.
0
20
40
60
80
100
-500 -400 -300 -200 -100 0 100 200 300 400 500Audio Delay (ms)
Bands 2 + 3
Bands 1 + 4
TIM
IT W
ord
Rec
ogni
tion
(%)
0
20
40
60
80
100
-500 -400 -300 -200 -100 0 100 200 300 400 500Audio Delay (ms)
Bands 2 + 3
Bands 1 + 4
TIM
IT W
ord
Rec
ogni
tion
(%)
Figure 1

0
20
40
60
80
100
-500 -400 -300 -200 -100 0 100 200 300 400 500Audio Delay (ms)
IEE
E W
ord
Rec
ogni
tion
(%)
Audio AloneVideo Alone
0
20
40
60
80
100
-500 -400 -300 -200 -100 0 100 200 300 400 500Audio Delay (ms)
IEE
E W
ord
Rec
ogni
tion
(%)
Audio AloneVideo Alone
Figure 2
0
0.2
0.4
0.6
0.8
1
-500 -400 -300 -200 -100 0 100 200 300 400 500Audio Delay (ms)
/pa/ /ta/ /ka/R
espo
nse
Pro
babi
lity
Figure 3

WB100-6500 Hz
F1100-800 Hz
F2800-2200 Hz
F32200-6500 Hz
Sentence 3 Sentence 2
Lip Area Lip Area
RM
SEn
velo
peR
MS
Enve
lope
r=0.52
r=0.49
r=0.65
r=0.60
r=0.35
r=0.32
r=0.47
r=0.45
Figure 4

WB
298-375
750-945
1890-2381
4762-6000
-100 -50 0 50 100 150 200 250 300
Audio Delay (ms)
Audio Lead Audio Lag
Filte
r Ban
d C
ondi
tion
(Hz)
Figure 5
298-375
750-945
1890-2381
4762-6000
-50 0 50 100 150 200 250 300Audio Delay (ms)
Target Leading Target Lagging
Filte
r Ban
d C
ondi
tion
(Hz)
298-375
750-945
1890-2381
4762-6000
-50 0 50 100 150 200 250 300Audio Delay (ms)
Target Leading Target Lagging
Filte
r Ban
d C
ondi
tion
(Hz)
Figure 6