Auditory Perception of Motor Vehicle Travel Paths
27
Auditory Perception of Motor Vehicle Travel Paths Daniel H. Ashmead, Vanderbilt University, Nashville, Tennessee D. Wesley Grantham, Vanderbilt University, Nashville, Tennessee Erin S. Maloff, Cochlear Americas, Centennial, Colorado Benjamin Hornsby, Vanderbilt University, Nashville, Tennessee Takabun Nakamura, Okayama Prefectural University, Soja, Okayama, Japan Timothy J. Davis, Vanderbilt University, Nashville, Tennessee Faith Pampel, and Vanderbilt University, Nashville, Tennessee Erin G. Rushing Louisiana State University, New Orleans Abstract Objective—These experiments address concerns that motor vehicles in electric engine mode are so quiet that they pose a risk to pedestrians, especially those with visual impairments. Background—The “quiet car” issue has focused on hybrid and electric vehicles, although it also applies to internal combustion engine vehicles. Previous research has focused on detectability of vehicles, mostly in quiet settings. Instead, we focused on the functional ability to perceive vehicle motion paths. Method—Participants judged whether simulated vehicles were traveling straight or turning, with emphasis on the impact of background traffic sound. Results—In quiet, listeners made the straight-or-turn judgment soon enough in the vehicle’s path to be useful for deciding whether to start crossing the street. This judgment is based largely on sound level cues rather than the spatial direction of the vehicle. With even moderate background traffic sound, the ability to tell straight from turn paths is severely compromised. The signal-to- noise ratio needed for the straight-or-turn judgment is much higher than that needed to detect a vehicle. Conclusion—Although a requirement for a minimum vehicle sound level might enhance detection of vehicles in quiet settings, it is unlikely that this requirement would contribute to pedestrian awareness of vehicle movements in typical traffic settings with many vehicles present. Copyright © 2012, Human Factors and Ergonomics Society. Address correspondence to Daniel H. Ashmead, Department of Hearing and Speech Sciences, Vanderbilt University School of Medicine, 1215 21st Ave. South, MCE South Tower, Room 8310, Nashville, TN 37232-8242, [email protected]. NIH Public Access Author Manuscript Hum Factors. Author manuscript; available in PMC 2012 September 21. Published in final edited form as: Hum Factors. 2012 June ; 54(3): 437–453. NIH-PA Author Manuscript NIH-PA Author Manuscript NIH-PA Author Manuscript
-
Upload
vanderbilt -
Category
Documents
-
view
1 -
download
0
Transcript of Auditory Perception of Motor Vehicle Travel Paths
Auditory Perception of Motor Vehicle Travel Paths
Daniel H. Ashmead,Vanderbilt University, Nashville, Tennessee
D. Wesley Grantham,Vanderbilt University, Nashville, Tennessee
Erin S. Maloff,Cochlear Americas, Centennial, Colorado
Benjamin Hornsby,Vanderbilt University, Nashville, Tennessee
Takabun Nakamura,Okayama Prefectural University, Soja, Okayama, Japan
Timothy J. Davis,Vanderbilt University, Nashville, Tennessee
Faith Pampel, andVanderbilt University, Nashville, Tennessee
Erin G. RushingLouisiana State University, New Orleans
AbstractObjective—These experiments address concerns that motor vehicles in electric engine mode areso quiet that they pose a risk to pedestrians, especially those with visual impairments.
Background—The “quiet car” issue has focused on hybrid and electric vehicles, although it alsoapplies to internal combustion engine vehicles. Previous research has focused on detectability ofvehicles, mostly in quiet settings. Instead, we focused on the functional ability to perceive vehiclemotion paths.
Method—Participants judged whether simulated vehicles were traveling straight or turning, withemphasis on the impact of background traffic sound.
Results—In quiet, listeners made the straight-or-turn judgment soon enough in the vehicle’s pathto be useful for deciding whether to start crossing the street. This judgment is based largely onsound level cues rather than the spatial direction of the vehicle. With even moderate backgroundtraffic sound, the ability to tell straight from turn paths is severely compromised. The signal-to-noise ratio needed for the straight-or-turn judgment is much higher than that needed to detect avehicle.
Conclusion—Although a requirement for a minimum vehicle sound level might enhancedetection of vehicles in quiet settings, it is unlikely that this requirement would contribute topedestrian awareness of vehicle movements in typical traffic settings with many vehicles present.
Copyright © 2012, Human Factors and Ergonomics Society.
Address correspondence to Daniel H. Ashmead, Department of Hearing and Speech Sciences, Vanderbilt University School ofMedicine, 1215 21st Ave. South, MCE South Tower, Room 8310, Nashville, TN 37232-8242, [email protected].
NIH Public AccessAuthor ManuscriptHum Factors. Author manuscript; available in PMC 2012 September 21.
Published in final edited form as:Hum Factors. 2012 June ; 54(3): 437–453.
NIH
-PA Author Manuscript
NIH
-PA Author Manuscript
NIH
-PA Author Manuscript
Application—The findings are relevant to deliberations by government agencies and automobilemanufacturers about standards for minimum automobile sounds and, more generally, for solutionsto pedestrians’ needs for information about traffic, especially for pedestrians with sensoryimpairments.
Keywordspedestrian; traffic; quiet car; visual impairment
INTRODUCTIONPedestrians benefit from hearing traffic activity, including vehicles (Wiener et al., 1997) andaudible signals (Szeto, Valerio, & Novak, 1991; Wall, Ashmead, Bentzen, & Barlow, 2004).The field of orientation and mobility provides instruction for individuals who are visuallyimpaired to travel safely and efficiently in their environments (Wiener, Walsh, & Blasch,2010), including at street crossings (Hill & Ponder, 1976; LaGrow & Weessies, 1994). In aquiet area, a pedestrian may listen and then cross a street if no nearby vehicles are detected.In busier traffic, patterns of vehicle movements are important. For example, traffic flow canbe used to align oneself to the street (Guth, Hill, & Rieser, 1989), and traffic surge on agreen light often specifies the walk signal to cross the other street.
Some patterns of vehicle movement are readily heard, but others are problematic. In free-running traffic at unsignalized locations, pedestrians wait for gaps between vehicles. Studiesof such crossing decisions by blind pedestrians at roundabouts indicate that acousticguidance is unreliable and inefficient (Ashmead, Guth, Wall, Long, & Ponchillia, 2005;Guth, Ashmead, Long, Wall, & Ponchillia, 2005). Similarly, Wall Emerson and Sauerburger(2008) reported that pedestrians with visual impairments detected approaching vehicles wellin quiet but not with moderate background noise or when curves, hills, and roadside treesobscured sounds.
Quiet CarsVehicle sound comes from the power train (engine, etc.), tires, and aerodynamics. At speedsslower than about 32 km (20 miles) per hour, engine sound predominates, whereas tire andaerodynamic sound are prominent at higher speeds (Sandberg & Ejsmont, 2002). Vehiclesound has been regulated in many countries to reduce adverse effects of noise (Miedema,2007; U.S. Noise Pollution and Abatement Act of 1972). Sound levels from passengervehicles may have decreased by 5 to 10 dB in the past 40 years, but they are difficult tomonitor, and the reduction is mitigated by increased numbers of vehicles. In any event,vehicle noise regulation has until recently focused on limiting noise, not increasing it.
Since commercially viable hybrid vehicles appeared, around 2000, concern has beenexpressed that pedestrians may be at risk because of the low level of sound from vehiclestraveling in electric engine mode (National Federation of the Blind, 2010). In the presentarticle, the term gasoline refers to vehicles with internal combustion engines fueled bygasoline or diesel, electric refers to vehicles powered by electricity stored in batteries, andhybrid refers to vehicles powered by a combination of electricity and internal combustion.Government agencies and automobile manufacturers have responded to concern about quietvehicles, primarily by an arrangement to play add-on sound through loudspeakers mountedon the vehicle. This sound would occur when the vehicle is stopped and at speeds lower thanabout 32 km/h, since tire noise predominates at higher speeds. No standards for this systemexist currently, and various sounds and operation modes are under consideration.
Ashmead et al. Page 2
Hum Factors. Author manuscript; available in PMC 2012 September 21.
NIH
-PA Author Manuscript
NIH
-PA Author Manuscript
NIH
-PA Author Manuscript

The Pedestrian Safety Enhancement Act of 2010 directed federal transportation authoritiesto recommend standards for a minimum sound level to be emitted by vehicles. Althoughfocused on electric and hybrid vehicles, the legislation also stipulated consideration ofwhether a standard should apply to all. Existing research on the quiet-car issue consists ofcrash data, direct acoustic measurements, and assessment of detection of approachingvehicles in fairly quiet backgrounds. As reviewed here, this literature confirms that cars inelectric mode at low speeds tend to be quieter and less detectable than many cars in gasolinemode. However, a wider question is what sound level, if any, provides pedestrians withinformation needed to make safe road-crossing decisions.
Crash data—Hanna (2009) analyzed crash data from hybrid and gasoline vehicles onsimilar model platforms. Although only 0.6% of all accidents involved pedestrians, the oddsof pedestrian involvement were 1.44 times greater for hybrid than for gasoline vehicles.Similar odds ratios favoring gasoline vehicles held for subsets of crashes, such as when thevehicle turned before the crash, or in areas with speed limit lower than about 50 km/h. Thesefindings are consistent with the idea that pedestrians hear approaching hybrid vehicles lesswell than they do gasoline vehicles, although this finding is complicated by possibledifferences in driver behavior and frequency of driving in pedestrian settings.
Acoustical measures of vehicle sounds—Measurement of pass-by sound fromvehicles is standardized (e.g., Moore, 2006), although studies of hybrid and/or electriccompared with gasoline vehicles have varied from the standard, making comparisons moreconclusive within studies than between. In the standard procedure, a microphone ispositioned 1.5 m high and 7.5 m (2.5 m in some studies) from the travel centerline as thevehicle passes, either accelerating or at constant velocity. Wiener et al. (1997) reported thatas gasoline vehicles accelerated from a stop for 5 s, maximum sound level was 75 to 80 dB-A (the A-weighted decibel scale approximates human loudness perception). Sound levelfrom a gasoline vehicle approaching at moderate speed measured 67 dB-A from 33.5 maway, the distance needed to cross safely in typical pedestrian situations. Wiener,Naghshineh, Salisbury, and Rozema (2006) measured hybrid and gasoline cars built onsimilar body platforms. On acceleration to about 30 km/h, hybrids were quieter by 8 to 9 dBbut still audible. At low speeds, the hybrids, in electric mode, emitted sound quieter than thelow level of background noise. On approach from 33.5 m at moderate speed, hybrid andgasoline vehicles had similar sound levels, mostly from tire noise. When stopped, thehybrids emitted no measurable sound.
Garay-Vega, Hastings, Pollard, Zuschlag, and Stearns (2010) studied three hybrid and threegasoline vehicles. In decelerative pass-by, average sound level differed by less than 1 dB(54.2 dB-A, hybrid; 54.9 dB-A, gasoline). In slow (constant 10 km/h) pass-by, the hybridsound level was lower (49.0 and 53.7 dB-A for hybrid and gasoline, respectively), and inreverse gear, the hybrid level was much lower (46.2 and 54.1 dB-A for hybrid and gasoline,respectively). The sound levels did not differ across engine types at speeds higher than 25 to30 km/h, as expected because of tire noise. Although this report showed differences betweenvehicle types, even the gasoline vehicles had low sound levels, in the mid-50s dB-A. Incontrast, pedestrians routinely make roadcrossing decisions with background sound levels inthe 60s and 70s dB-A (Lawson & Wiener, 2010). Signal-to-noise ratio is a key factor inwhether a vehicle can be heard, so the quiet-car issue applies to vehicles of all engine types.
Wall Emerson, Naghshineh, Hapeman, and Wiener (2011) studied pedestrian road-crossingdecisions using gasoline vehicles from ambient traffic and hybrid vehicles operated by theinvestigators. Pass-by sound was only 2 to 3 dB-A lower for hybrid than for gasolinevehicles at 15 to 30 km/h and equivalent at higher speeds. Kim, Wall Emerson, Naghshineh,Pliskow, and Myers (2012) had listeners detect approaching vehicles of three types: hybrid
Ashmead et al. Page 3
Hum Factors. Author manuscript; available in PMC 2012 September 21.
NIH
-PA Author Manuscript
NIH
-PA Author Manuscript
NIH
-PA Author Manuscript
in electric mode, hybrid in electric mode with an add-on sound played through an onboardloudspeaker, and gasoline. At moderate speed, sound levels were 59.9, 63.3, and 59.7 dB-A,respectively (but the add-on sound was played louder than is likely to be done in practice).
The acoustical findings indicate that vehicles in electric mode are quieter than those ingasoline mode when stopped or at low speed. However, at moderate speeds typical ofpedestrian settings, sound level is similar across engine types and likewise at higher speedsbecause of tire noise. Besides overall sound level, the spectral composition of a vehicle’ssound relative to the background merits consideration because a distinct “signature” mightstand out. This possibility has not been investigated, but such an effect would be mitigatedas more vehicles have such a sound.
Detection of approaching vehicles—Robart and Rosenblum (2009) recorded hybrid(electric mode) and gasoline vehicles approaching at 8 km/h from the left or right. Listeningthrough headphones, participants reported the approach direction. The hybrid was reported 1to 3 s later than the gasoline vehicle, and with moderate background noise, not until justafter passing the listener. Even the gasoline vehicle was not reported until quite close,approximately 6 m, with background traffic noise, which could be dangerous.
Wall Emerson et al. (2011) studied roadcrossing decisions at an unsignalized intersectionwith hybrid and gasoline vehicles. Ratings of riskiness did not break down neatly betweenvehicle types. For speeds lower than 30 km/h, the odds of a risky crossing were close to zerofor two hybrids, 0.05 for gasoline engine vehicles, and 0.22 for one hybrid model. Detectionof the traffic surge on a green light at a signalized intersection was poor for one hybrid thataccelerates in electric mode, but even when gasoline vehicles were present, only two thirdsof surges were detected soon enough to afford safe crossing.
Garay-Vega et al. (2010) studied detection of approaching vehicles that were backing up,approaching at low speed, or approaching while slowing from 32 to 16 km/h, all in a veryquiet setting. For the backing-up and slow approaches, gasoline vehicles were detected fromabout 1.5 times farther than hybrids. For the decelerative approach, an opposite resultoccurred, with hybrid vehicles detected at about twice the distance of gasoline vehicles,mainly because of brake-related electrical conversion in one hybrid model. Even forgasoline vehicles, the range of times remaining until the vehicle would have reached thelistener was less than 6 s and just 2 or 3 s in some conditions. Given these short times, andthe quiet background, detection of approaching vehicles might be problematic in a real road-crossing situation.
Kim et al. (2012) found that vehicles approaching at about 15 km/h were detected at 38 mfor gasoline vehicles, 34 m for hybrids in electric mode with add-on sound, and 27 m forhybrids in electric mode. Using the same vehicles and test sites, Kim, Wall Emerson,Naghshineh, Pliskow, and Myers (2011) had vehicles stop for a random time and thenaccelerate, either continuing straight or turning rightward in front of the listener. Thelisteners, including blind persons accustomed to pedestrian travel, indicated when thevehicle started moving and when they judged that it had gone straight or turned. For thestraight-or-turn judgment, accuracy was 93%, but latency averaged 6.3 s and was similaracross vehicle types. At that latency, a turning vehicle was almost in front of the listener.Thus, even when listeners could hear a vehicle, judgments about turns were quite delayed.
In summary, detection studies suggest that vehicles in electric mode (with no added sound,at low speeds, in quiet backgrounds) must be closer to be detected, compared with similargasoline vehicles. However, even the detection distances for gasoline vehicles aresometimes too short to afford safe road crossing, especially considering that most tests have
Ashmead et al. Page 4
Hum Factors. Author manuscript; available in PMC 2012 September 21.
NIH
-PA Author Manuscript
NIH
-PA Author Manuscript
NIH
-PA Author Manuscript

had background traffic noise lower than pedestrians frequently encounter. This findingraises the possibility that a public policy to add sound to electric and hybrid vehicles, so asto match them to gasoline vehicles, might be of little help to pedestrians in many road-crossing situations.
Auditory Motion PerceptionBarlow, Bentzen, Sauerburger, and Franck (2010) summarized strategies used by blindpedestrians to navigate complex intersections, noting the importance of listening for subtlepatterns of vehicle movement. For example, listening to traffic in the near lane on the streetparallel to the pedestrian’s direction of crossing is useful, because vehicles often move thereduring the pedestrian walk interval. For the present study, we examined the ability to listenfor straight or turning vehicles from the near lane as a key auditory motion perception task.Even sighted pedestrians may benefit from hearing, especially when a vehicle comes frombehind. Pedestrian risk from turning vehicles is an important category of injuries (Lord,Smiley, & Haroun, 1998; Roudsari, Kaufman, & Koepsell, 2006). Pedestrians tend to lookin their own travel direction, and hearing provides an important extension of awareness.
Research on auditory motion perception provides clues about the perceptual capability fortracking vehicle paths, but the present study is the first we know of that focuses on motionpaths relevant to pedestrian activity. Auditory motion perception is somewhat crudecompared with localization of stationary sound sources. The minimum audible angle forstationary sound sources is often found by presenting two sounds consecutively fromdifferent horizontal directions, asking the listener to report whether the second sound wasleft or right of the first. In good conditions, a direction difference of 1° to 2° can be judgedcorrectly (Mills, 1958). By comparison, the minimum audible movement angle for circularpaths requires a larger change in direction for telling whether a sound in continuous motionwent leftward or rightward. For angular velocities comparable to traffic settings (45° persecond), a motion extent of 5° to 10° is required (Chandler & Grantham, 1992; Perrott &Tucker, 1988).
Research has also been conducted on sound sources moving on straight paths, includingdirect approach toward the listener (Bach, Neuhoff, Perrig, & Seifritz, 2009; Rosenblum,Wuestefeld, & Saldana, 1993) and transverse or “miss” paths (Kaczmarek, 2005; Lutfi &Wang, 1999). A distinction between the underlying cues for changing direction or distanceof a sound source is that direction is cued primarily by interaural differences, whereasdistance is cued by information available at either ear. Sound from off to one side arrivessooner and with greater level at the ear on that side, which specifies horizontal direction. Asa sound source changes in horizontal direction, the values of these interaural differences intime and level change, specifying motion. Sensitivity to continuous changes in these cues israther crude, leading to the phrase “binaural sluggishness” (Grantham, 1984).
The information for changing distance includes changes in sound level, because level variesinversely with distance, and the ratio of direct to reverberant sound (Coleman, 1963). Mostmotion paths that pedestrians listen for involve combinations of change in direction anddistance. Transverse motion, such as a car moving past a pedestrian standing at the side ofthe street, provides a predictable pattern of direction and distance change. If the vehicleturns, there is a different pattern of change in the underlying cues. Transverse motion alsointroduces a sound frequency change known as the Doppler shift (McBeath & Neuhoff,2002) caused by acceleration (during approach) in the distance component of motion,noticeable at fairly high velocities. Doppler shift can specify that a sound source isapproaching (or receding from) a listener, with some indication of the rate of approach.
Ashmead et al. Page 5
Hum Factors. Author manuscript; available in PMC 2012 September 21.
NIH
-PA Author Manuscript
NIH
-PA Author Manuscript
NIH
-PA Author Manuscript

Study OverviewWe simulated vehicle motion paths acoustically in a laboratory to provide control of factorssuch as speed, specific paths, and background noise. Two acoustic “signatures” wereconsidered, a gasoline engine idling and the add-on sound proposed for an electric vehiclebuilt on the same platform. In Experiment 1, the ability to distinguish between straight andturn paths was measured in a quiet background to determine thresholds in ideal listeningconditions. In Experiment 2, we evaluated the effect of background noise level usingrecordings of live traffic. In Experiment 3, we varied the vehicle sound levels adaptively todetermine signal-to-noise ratios necessary for making the straight-or-turn judgment in thepresence of moderate background traffic noise.
EXPERIMENT 1In this experiment, we measured listeners’ ability to distinguish straight from turn paths,compared performance for an electric vehicle add-on sound and a gasoline engine sound,and compared low and moderately high sound levels of the signals. The background soundlevel was very quiet.
MethodParticipants—The participants were four young adults, one woman and three men, withnormal vision by self-report and normal hearing in both ears at frequencies of 0.25, 0.5, 1, 2,4, and 8 kHz (ability to hear tones through earphones at sound level within 25 dB of idealthresholds).
Test setting—Testing occurred in a 4.6 × 6.4 × 6.7 m (width, length, height) full anechoicchamber (100 Hz lower frequency limit) with a horizontal circular (1.97-m radius) array of64 loudspeakers (RCA 40–5000, housing 4 in. wide × 6.5 in. tall × 4.25 in. deep, twospeaker cones upper 2.5 in. and lower 1 in. diameter), spaced at intervals of 5.625°. Theambient sound level was very low, 20 dB-A. The participant sat in a chair at the center ofthe loudspeaker array. Acoustic motion paths were simulated for motor vehicles going alongstraight or turn paths, as shown in Figure 1.
This setup simulates a pedestrian on the southeast corner of a perpendicular intersection oftwo streets, waiting to walk northward across the east-west street. The motion pathsoriginate behind and to the left of the pedestrian, with vehicles moving northward. The pathis either straight, as though the vehicle were headed north through the intersection, orturning right onto the east-west street.
Motion path simulation—The objective was to find out how far the motion path had togo for the listener to decide whether it was straight or turning. In Figure 1, consider thecoordinate (0,0) the intersection of north-south and eastwest traffic lanes. The path startedwith the vehicle 15.75 to 20.75 m south of the intersection. From there, a path of twice thestarting distance from the intersection was made. For example, if the path started at (0,−17)and the path were straight, it would go to (0,17). The path was divided into five segments,each with a distinct velocity so that there was deceleration before a turn and accelerationafterward. On average, each segment was 20% of the path, but that percentage variedrandomly between 15% and 25%.
Consider three velocities, with v1 > v2 and v3 > v2. For turn paths, velocity was as follows:constant at v1 in Segment 1, uniform deceleration from v1 to v2 in Segment 2, constant at v2in Segment 3 (where most of the turn occurred), uniform acceleration from v2 to v3 inSegment 4, and constant at v3 in Segment 5. Thus, the simulated vehicle started at constant
Ashmead et al. Page 6
Hum Factors. Author manuscript; available in PMC 2012 September 21.
NIH
-PA Author Manuscript
NIH
-PA Author Manuscript
NIH
-PA Author Manuscript

velocity, slowed down and held that speed through the turn, and then sped up. An overalllower or higher velocity range was randomly chosen on each trial: lower range (v1, 16.9 to21.7 km/h; v2, 10.5 to 15.3 km/h; v3, 16.9 to 21.7 km/h) or higher range (v1, 21.7 to 26.6km/h; v2, 13.7 to 18.5 km/h; v3, 21.7 to 26.6 km/h). Although v1 and v3 were both greaterthan v2, v1 and v3 had similar but not necessarily identical values. For straight paths, thesame scheme was used except that v1, v2, and v3 were all selected from either a low range of16.9 to 21.7 km/h or a high range of 21.7 to 26.6 km/h. This method created patterns ofacceleration and deceleration in the straight paths, which simulates driver behavior. Figure 2shows examples of velocity profiles for turn and straight paths in the lower and highervelocity ranges.
Although an entire path was created for each trial, as described previously, only the portionof the path up to the current psychophysical path length was presented. For the example of astraight path that began at (0,−17), and assuming a current path length of 7 m, the pathwould end at (0,−1), that is, 7 m beyond the nominal start position of (0,−8) from which pathlengths were measured psychophysically.
The velocity rules meant that turning paths were a little slower and longer lasting thanstraight paths. This difference was probably not a reliable cue. At the threshold path lengths,the straight paths lasted about 0.5 s less than the turn paths. However, the durations wererather long, about 3 to 5 s, and duration variability attributable to the random startinglocation was about 0.8 s. It is also unlikely that the deceleration during turns was a reliablecue, because about half of the straight paths included decelerating segments.
After being calculated, the motion path was converted to a set of directions and distancesrelative to the listener’s position and heading direction. This information was sent to afunction that presented the acoustic signal to the loudspeakers. For each time sample, wecoded direction by selecting a pair of loudspeakers (11.25° apart, that is, every otherloudspeaker) that bracketed the target direction and refined it further by amplitude panning.The panning algorithm apportioned amplitude between the two loudspeakers according to
the formula and A2 = 1 – A1, where the A terms are amplitude scaling factors forthe two loudspeakers (Pulkki & Karjalainen, 2001). For example, if Loudspeaker 2 is δ =11.25° to the left of Loudspeaker 1, and the current sound source direction is supposed to bedirectly at Loudspeaker 2, then θ = 0° and the amplitude is apportioned all to Loudspeaker 2
. If the source direction is 3° to the right of Loudspeaker2, then θ =3° and the scaling factors are A1 = 0.732 and A1 = 0.268.
In practice, the panning formula produces a linear trade-off of amplitude between theloudspeakers as the target direction moves between them. Although the panning procedure issometimes misunderstood to affect perceived sound direction by means of interaural soundlevel differences, it does so by introducing phase, or interaural time differences (Pulkki &Karjalainen, 2001). Distance was coded by appropriate scaling of the sound level (Coleman,1963), in decibels relative to a reference distance of 2 m. For example, a distance of 10 m
was dB from the sound level at 2 m. The distance coding allowed thesimulated motion paths to extend well beyond the actual loudspeaker array (see Figure 1).Signals were low passed at 5 kHz to remove artifacts from panning. The signal waspresented with a sampling rate of 44.1 kHz, but spatial updating for direction and distancewas done at 244.14 Hz, adequate for a sense of smooth motion. Figure 3 shows the directionand sound-level cues corresponding to the motion paths. Doppler shift was not included as adistance cue because it would be negligible in the low velocity range used (e.g., frequency
Ashmead et al. Page 7
Hum Factors. Author manuscript; available in PMC 2012 September 21.
NIH
-PA Author Manuscript
NIH
-PA Author Manuscript
NIH
-PA Author Manuscript

shift of 1.76% at 21.7 km/h, below detection threshold for frequency glides of nontonalsounds; Madden & Fire, 1997).
Psychophysical threshold procedure—On each trial, the participant was presentedwith a single motion path while looking straight ahead (north in Figure 1), then voted via aresponse box whether the path was straight or turning. Feedback lights showed the correctresponse after the vote. The one-interval task could allow response bias if, for example, aparticipant tended to vote straight more often than turning. To protect against this bias,participants were told that the occurrence of straight or turning paths was random with equalprobability on each trial and were presented with obvious examples of both paths prior toformal testing. All participants used the straight and turning response options with similarfrequency.
The psychophysical method was a threedown, one-up staircase (Levitt, 1971), tracking79.4% correct. After three consecutive correct responses, the path length was reduced,making the task more difficult. After each incorrect response, the path length was increased.The initial path length was 7 m. Decreases in path length were by a factor of 0.833;increases, by 1.2. The maximum path length was 10 m, which put the end of the turn pathwell to the listener’s right. Testing continued through eight reversals in the direction ofchange in path length. Thresholds were estimated by the geometric mean of path lengths onReversals 3 through 8.
Vehicle acoustic signatures—Two vehicle signals were used, electric and gasoline.Figure 4 shows the frequency spectra.
The electric vehicle signal was a proprietary sound provided by a manufacturer of electriccars. It has a whoosh or hum characteristic with mostly low pitch along with a higher-pitchtonal aspect, designed to sound somewhat futuristic. The gasoline vehicle signal was arecording of engine idling from a vehicle manufactured on the same body platform as theelectric vehicle. Two levels were used for the vehicle sounds, 52 dB-A and 65 dB-A,measured with a half-inch omnidirectional microphone positioned 2 m from theloudspeakers. The 52 dB-A level corresponds to the engine idling sound of the real gasolinevehicle, measured 2 m from the front of the vehicle. From two vehicle signals (electric,gasoline) and two sound levels (52, 65 dB-A), there were four experimental conditions.Each participant was tested at least three times in each condition. Testing occurred in blocks,such that all four conditions were run as separate psychophysical tracks in each block, inorders set by Latin squares. So practice or fatigue effects were distributed similarly acrossconditions. Statistical analyses were based on individual participants’ mean thresholdsacross multiple runs in each of the four experimental conditions.
Results and DiscussionFigure 5 shows mean threshold path lengths. We conducted analyses of variance using aunivariate repeated-measures approach, and for all analyses reported, no sphericitycorrection was required according to the Mauchly (1940) criterion. In an analysis ofvariance with vehicle type and sound level as repeated-measures factors, there were nosignificant effects. This finding was expected because both vehicle signals provide goodinformation for spatial hearing, and both sound levels are comfortably audible. Meanthreshold path length across conditions was 5.91 m (SD = 0.69). One can see this path lengthin Figure 1 by counting up 6 m from the nominal start position and in Figure 3 at the double-ended arrow. At this path length, the vehicle was positioned about 75° to the listener’s left,which was true for both the straight and turning paths. The finding that threshold pathlengths were the same for the lower and higher sound levels provides replication of the basic
Ashmead et al. Page 8
Hum Factors. Author manuscript; available in PMC 2012 September 21.
NIH
-PA Author Manuscript
NIH
-PA Author Manuscript
NIH
-PA Author Manuscript

finding and suggests that the range from 52 to 65 dB-A has little impact on distinguishingstraight from turning paths in a quiet background.
The threshold path length of 5.91 m implies that listeners used sound level, rather thandirection, as the primary basis for distinguishing straight from turning paths, and the salienceof sound level is what participants reported in debriefing. At this path length, the straightand turning paths differed in sound level by 4 to 5 dB but in direction by only 2° to 3°. Interms of the dynamic cue values, at threshold path length, the sound level kept increasing onturn paths because the sound source got closer to the listener, whereas the sound leveltapered off on straight paths as the source moved away from the listener (see Figure 3).Listeners might have attended to both the overall differences in sound level on straight andturning paths and to the pattern of change. Pilot work with one participant showed thatthresholds worsened by about 25% when the sound level cue was removed. Although soundlevel appeared to play a key role, directional change probably contributed to judgments. Forexample, participants may have waited until the vehicle reached about 90° to their leftbefore attending closely to sound level. Also, some participants had path lengthsapproaching 7 m, for which straight and turning paths differed by about 30°, so theseindividuals may have relied on directional information.
The threshold path lengths relate to practical decisions pedestrians make about whether tostart crossing the street when a vehicle is approaching. At the average threshold path length,the vehicle would arrive directly in front of the pedestrian (in the crosswalk) in another 2 to3 m. At the vehicle speeds used for the turns, 10.5 to 18.5 km/h, it would take less than 1 sfor the vehicle to travel that far. This time is not enough for the pedestrian to safely cross infront of a turning vehicle. However, it is short enough so that, if the pedestrian started tocross, he or she could hear the vehicle come through the crosswalk and pause or step back.Of course, in a real traffic setting, a pedestrian might have additional information to use indeciding whether a vehicle was going straight or turning, such as tire noise or activity byother pedestrians.
EXPERIMENT 2The second experiment assessed the effect of background noise on performance of thestraight-or-turning task. Experiment 1 was conducted in an extremely quiet background, nottypical of pedestrian road-crossing settings. For Experiment 2, we obtained roadsiderecordings of “live” traffic in two settings, a fairly quiet residential and light business area,and a busy roadway near a four-way intersection. These recordings were played asbackground noise (Figure 6 shows the spectrum).
The target vehicle signals were the same electric and gasoline ones used in Experiment 1,played at a reference level of 52 dB-A measured from 2 m away. This sound level is typicalfor a contemporary car with a fairly quiet internal combustion engine. The practical questionaddressed by this experiment is how well the motion paths of cars with typical sound levelare perceived in different levels of background traffic noise.
MethodThe participants were eight young adults with normal hearing according to screening as inExperiment 1 (two participants were in that experiment). Both the electric and gasolinevehicle signals were played at a reference level of 52 dB-A (at 2 m distance), with leveladjustments to simulate target distance. There were four background sound conditions: quiet(like Experiment 1), residential-like noise at 54 dB-A, moderate traffic noise at 60 dB-A,and busy traffic noise at 68 dB-A. These noise levels were based on sampling in varioustraffic locales and are consistent with levels reported by Lawson and Wiener (2010). For the
Ashmead et al. Page 9
Hum Factors. Author manuscript; available in PMC 2012 September 21.
NIH
-PA Author Manuscript
NIH
-PA Author Manuscript
NIH
-PA Author Manuscript
three conditions with background traffic noise, a 30-s “loop” of noise was played repeatedly.Copies of the loop were played continuously through two loudspeakers, with a 15-s offsetbetween them, producing two separate streams of traffic noise. The two loudspeakers (JBL8110, 4-in. cones) playing the background noise were located 5° and 175° to theparticipant’s left. This setup simulated an intersection scenario with most of the movingvehicles to the pedestrian’s left and parallel to the intended walking direction.
In pilot work, listeners had difficulty performing the task at the moderate and high levels oftraffic noise. This was not surprising, given the signal-to-noise ratios of −8 and −16 dB,respectively. However, it was important to include these conditions, because theycorrespond to the practical problem of listening to individual vehicle paths in a trafficsetting. It was necessary to devise a stopping rule in parallel with the staircasepsychophysical procedure to end the threshold search if the participant could not do the taskregardless of how far the motion path went. The rule was that if the path length reached themaximum allowable value of 10 m five times during a run, then the run ended with a“ceiling-reached” designation. As shown in Figure 3, if one counts 10 m along the motionpaths, both the level and direction differences between turn paths and straight paths are largefor a 10-m path length. In a quiet background, this discrimination would be extremely easy.When participants reached ceiling, they reported that they could not “hear out” the targetvehicle from the background noise.
Results and DiscussionAt the higher levels of background noise, participants had great difficulty performing thetask. The proportions of threshold runs successfully completed were calculated on the basisof three runs that each participant performed in each of the eight conditions (fourbackground noise levels by two vehicle signals). Figure 7 shows the mean proportions.
In an analysis of variance with vehicle and background noise level as repeated-measuresfactors, there was a significant effect of noise level, F(3, 21) = 35.445, p < .001, η2 = .835.The results were similar across vehicle signals, and the interaction was not significant. Forthe moderate and high traffic noise backgrounds, these findings suggest that the sound levelof the target vehicle was too low, relative to the background traffic noise, for participants toperform the task. In fact, they were often unaware that a target vehicle had come by—evenwhen it passed directly in front of them—until lights appeared on the response box,indicating it was time to vote.
For statistical analyses, a participant’s threshold for each condition (vehicle type by back-ground sound level) was calculated from any of the three threshold runs that were notdiscontinued or was assigned a value of 10 if all three runs were discontinued. An analysisof variance was conducted with vehicle signal (gasoline, electric) and background soundlevel (quiet, residential, moderate traffic, heavy traffic) as repeated-measures factors. Onlythe main effect of background sound level was significant, F(3, 21) = 18.995, p < .001, η2
= .731. This analysis is problematic because 13 of the 64 data points were assigned theceiling level of 10 m, all in the moderate and busy background traffic noise levels. Whenthose points were excluded as missing data, the background sound level was again the onlysignificant factor, F(3, 15) = 4.794, p < .016, η2 = .978.
Considering only the findings from complete threshold runs, and averaging across gasolineand electric vehicles, the mean path lengths were quiet, 6.78 m; residential, 7.54 m;moderate, 7.77 m; and busy, 7.75 m. Although this finding confirms that performanceworsened with increasing background sound level, the more salient finding was that in themoderate and busy traffic conditions, participants were often reduced to guessing. Only inthe quiet and residential background noise settings could all participants perform the task
Ashmead et al. Page 10
Hum Factors. Author manuscript; available in PMC 2012 September 21.
NIH
-PA Author Manuscript
NIH
-PA Author Manuscript
NIH
-PA Author Manuscript
consistently and with clear awareness of the target vehicle. Even in the residential noisecondition, however, the mean path length (averaged across electric and gasoline vehiclesounds) was significantly longer than in the quiet condition, F(1, 7) = 14.235, p < .007, η2
= .670.
These findings indicate that the acoustic signature of individual vehicles is too weak, inmoderately busy traffic settings, to enable listeners to track individual motion paths ofvehicles. In fact, even the noise in a quiet residential setting has a substantial impact on theability to make judgments about whether vehicles are turning or going straight. The findingswere very similar for the electric and gasoline vehicle signals, suggesting that the generalproblem is that moderate to high levels of background traffic noise mask the sound comingfrom individual vehicles, even those traveling near the pedestrian’s location.
EXPERIMENT 3The findings from Experiment 2 suggest that pedestrians have difficulty tracking individualvehicle motion paths in background traffic noise. In Experiment 3, we turned the questionaround by setting a fixed background noise level and asking how high the individual vehiclesignal needs to be for participants to distinguish straight from turning paths. The path lengthwas fixed to a range between 7 and 8 m (on each trial, the path length varied randomly inthat range). Instead of varying path length psychophysically across trials, we varied thesound level of the vehicle signal. The background traffic noise was the same as inExperiment 2, played at 60 dB-A, typical of a moderately busy street. An additional questionposed in this experiment was whether there is a difference in the sound level needed to justdetect a vehicle, compared with telling whether it is on a straight or turning path. Thisquestion matters because setting sound levels ample for detection might still leavepedestrians unable to perform subtle, yet critical, listening decisions.
MethodThe participants were eight young adults with normal hearing according to screening as inExperiment 1. Of the total participants, five were in Experiment 2 and were includedbecause they were well practiced on the task. The experimental conditions were thecombinations of two vehicle sounds (electric, gasoline) and two tasks (detection,discrimination between straight and turn path). Each participant performed in all fourconditions in a block of separate threshold runs, and this procedure was followed four times,for a total of 16 threshold runs. Orders within blocks were counterbalanced. The procedurewas like that in Experiments 1 and 2, except that the path length was fixed within a narrowrange, and the sound level in decibels of the target vehicle sound was variedpsychophysically (decreases by a factor of 0.833, increases by 1.2).
On each trial, the path length was chosen randomly in the range of 7 to 8 m, a length atwhich straight and turning paths are readily distinguished in a quiet background. The vehiclesound level was initially 67 dB-A, for a signal-to-noise ratio of +7 dB over the backgroundof 60 dB-A. On each trial in the detection task, the signal (i.e., vehicle sound) was randomlyassigned as present or absent, and the listener judged whether the signal was present orabsent. When the signal was present, the motion path was randomly straight or turn, but thelistener reported just whether there was a vehicle. In the straight-or-turn discrimination task,there was a vehicle on each trial, and the listener judged whether its path was straight orturning.
Results and DiscussionFigure 8 shows the average threshold signal-to-noise values.
Ashmead et al. Page 11
Hum Factors. Author manuscript; available in PMC 2012 September 21.
NIH
-PA Author Manuscript
NIH
-PA Author Manuscript
NIH
-PA Author Manuscript
In a two-factor, repeated-measures analysis of variance, there was a significant effect oftask, F(1, 7) = 52.104, p < .0002, η2 = .882, with the signal-to-noise ratio 11.1 dB lower forthe detection task than the straight-or-turn discrimination task. Thus, listeners required anadditional 11 dB above their detection thresholds to judge reliably whether the vehicle wason a straight or turning path. Even for the detection task, signal-to-noise ratio was high,about −2 dB for the gasoline vehicle signal, suggesting that in moderate background trafficnoise, some gasoline vehicles would not be detectable. There was also a significant effect ofvehicle, F(1, 7) = 24.743, p < .002, η2 = .779. Averaged across tasks, signal-to-noisethresholds were 3.2 dB lower for the electric sound than for the gasoline sound. This findingmay be because the electric vehicle sound was more distinct spectrally from the backgroundtraffic noise, which was overwhelmingly based on gasoline-powered vehicles. Theinteraction between task and vehicle was not significant.
Figure 8 shows that the task of distinguishing between straight and turn paths requires asignal-to-noise ratio of +6 to +8 dB. The background traffic noise was at 60 dB-A, typicalfor many nonresidential settings. This finding implies that judgments about vehicle pathsmade in moderately busy traffic settings require individual vehicles to emit very high soundlevels. Specifically, the sound level of the individual vehicle needed to be 65 to 70 dB-Ameasured from a distance of 2 meters. This level is far higher than contemporary vehiclesemit, even internal combustion engine cars. It is unlikely that such a high sound level wouldbe acceptable to drivers or in terms of community noise levels. If a large portion of thevehicle fleet had such a high sound level, then the background traffic noise level would behigher, leading to an untenable upward spiral of vehicle sound.
The discrepancy between the signal-to-noise ratios needed to detect a vehicle, as opposed tomaking a judgment about the vehicle’s motion path, was large, about 11 dB. This resultagrees with a classic finding that speech detection signal-to-noise thresholds are about 8 dBlower than speech recognition thresholds (Cambron, Wilson, & Shanks, 1991). Thisdiscrepancy is mirrored in clinical audiology practice: Someone can tell that a person istalking but cannot understand what he or she saying. Similarly, just detecting that a vehicleis in the area does not ensure that a listener can reliably perceive the vehicle’s motion path.This distinction is important in that much of the research literature on quiet cars has focusedon the rather simple scenario of detecting an approaching vehicle in a quiet setting.Detection by itself has limited value in situations in which pedestrians must make roadcrossings while there are moving vehicles in the immediate area.
General DiscussionAuditory Motion Perception
Our experiments were not designed to exhaustively analyze what perceptual cues were usedfor discriminating straight from turning paths, but the findings suggest that listeners attendedto a sound level cue. Figure 3 shows sound level and source direction plotted for straight andturn paths. At the threshold path length, the direction of the sound source had not yetdiverged much for the straight and turn paths. In contrast, the sound level was stillincreasing in the turn path, whereas it had peaked and started to decrease for the straightpath. The vehicle was still getting closer to the listener in the turn path, whereas it wasmoving farther away in the straight path. Indeed, participants reported that they attended tosound level. In Experiment 1, with a quiet background, participants could have attended tothe peak sound level, which was higher by several decibels for the turn path than for thestraight path starting at a nominal path length of about 5 m (see Figure 3). However, thispeak level cue was probably less noticeable in Experiments 2 and 3 because of naturalfluctuations in the background noise level, and in a real street setting, it would not be useful
Ashmead et al. Page 12
Hum Factors. Author manuscript; available in PMC 2012 September 21.
NIH
-PA Author Manuscript
NIH
-PA Author Manuscript
NIH
-PA Author Manuscript
because of variability in vehicle sound levels. For these reasons we favor the idea thatparticipants made judgments on the basis of the pattern of sound level change across time.
Lutfi and Wang (1999) compared various cues for perception of displacement, velocity, andacceleration of sound sources moving on headphone-simulated straight transverse paths,similar to the straight path in the present study. They reported that in their lower speedrange, which was most similar to our speeds, listeners were influenced strongly by soundlevel. However, the weight given to sound level, interaural time differences, and Dopplershift varied with overall velocity range, perceptual task, predictability of the fundamentalfrequency of the harmonic tone stimulus, and individual preference. They emphasized thatauditory motion perception has multiple perceptual components, with no single stimulusdimension predominating. It will be valuable in future work to explore these factors in thecontext of pedestrian decision making. We tentatively suggest that instructional strategiesfor distinguishing between straight and turning paths might focus on pedestrians listeningmore to the pattern of change in overall sound level than to direction per se.
It should be noted that the acoustic simulation was unrealistic in certain respects, such as theabsence of reflected sound and lack of spatial directivity of the vehicle signals. Morerealistic simulations might reveal variations in the ability to distinguish straight from turningpaths.
Effect of Background NoiseAlthough listeners could distinguish between straight and turn paths in quiet and low noisebackgrounds, this ability was greatly compromised by traffic noise levels typical of those inwhich pedestrians travel. These findings add to previous reports that auditory motionperception is of limited use for some of the decisions that pedestrians, especially those withvisual impairments, must make. At modern roundabouts, when crossing the exit lane(s) fromthe roundabout, pedestrians often need to decide whether a vehicle has turned into the exitlane or continued in the circulatory roadway. Even with visual support, it is difficult to makethis decision quickly, before the next vehicles approach. Without visual guidance, it is verydifficult to hear individual vehicles and decide whether they will exit the roundabout(Ashmead et al., 2005; Guth et al., 2005).
In Experiment 2, with several levels of background noise and a typical sound level for thetarget vehicle, most of the test sessions in moderate to heavy noise were terminated earlybecause listeners could not discriminate better than chance level (see Figure 7). InExperiment 3, with background traffic noise set at a moderate level of 60 dB-A, the signal-to-noise ratio needed for the straight-or-turn discrimination was +6 to +8 dB (see Figure 8).With that ratio, vehicle sound output would be about 10 to 15 dB higher than the level ofmost contemporary gasoline vehicles. Even if this sound level were acceptable, thenecessary signal-to-noise ratio could not be achieved because the background traffic soundlevel would rise. A caveat is that our traffic noise was from a 30-s recorded loop selected torepresent average levels. Across a longer term, traffic noise has highs and lows not fullyrepresented in our loops, and pedestrians might take advantage of lulls.
In all three experiments, comparisons were made between an idling gasoline engine signaland a signal being considered by an automobile manufacturer as a sound to be playedthrough a loudspeaker on an electric car. There were few differences between these signals,the main one being in Experiment 3, wherein the signal-to-noise ratio needed for the electricsignal to be detected was lower than for the gasoline signal (Figure 8). This differenceprobably occurred because the frequency spectrum (see Figure 4) of the gasoline enginesound was more similar to the background traffic noise than was that of the electric car
Ashmead et al. Page 13
Hum Factors. Author manuscript; available in PMC 2012 September 21.
NIH
-PA Author Manuscript
NIH
-PA Author Manuscript
NIH
-PA Author Manuscript

signal. If a substantial portion of the vehicle fleet were to emit a standardized add-on sound,this advantage would likely disappear.
Policy ImplicationsMost research related to the quiet-car issue has focused on relative differences betweenhybrid (or electric) and gasoline vehicles, with respect to how much sound they emit and atwhat approaching distance they can be detected. This work, reviewed in the Introduction,has shown that vehicles operating in electric mode at low speed tend to be quieter andtherefore detectable only from closer distances than vehicles on similar body platformsoperating in internal combustion mode. However, findings from the present article suggestthat in moderately busy traffic situations, it is very difficult to listen for the motion trajectoryof a single vehicle and even to detect the presence of one. Increasing the sound level fromindividual vehicles is unlikely to solve this problem, because the overall traffic sound levelwould increase commensurately.
The participants in these experiments were young adults with no visual or auditoryimpairments. Possibly persons with visual impairments would perform differently. Forexample, they might distinguish straight from turning paths better than sighted personsbecause of experience using hearing in traffic settings. In one relevant study by Kim et al.(2011), blind participants with experience as pedestrians judged whether real vehicles, afterstarting from a stop, went straight or turned in front of them. Given the latency to make thisjudgment, the turning vehicles tended to be directly in front of the participants when thejudgment was made. In contrast, participants in our experiments made the turn-or-straightdistinction when the simulated turning vehicles were much earlier in the turn, about 70° tothe side.
Although direct comparison across studies is complicated by differences in method, thefindings from Kim et al. (2011) do not support the idea that blind participants would dobetter than sighted participants. Similarly, Guth et al. (1989) reported that blind and sightedparticipants did not differ in their accuracy of alignment for a street crossing on the basis oftraffic sounds. Also, with respect to our finding that performance was adversely affected byeven moderate background traffic noise, it seems unlikely that blind and sighted personswould differ in basic signal-to-noise requirements.
Another consideration is that in real traffic settings, pedestrians may benefit from factorssuch as traffic surges in response to signals, sound reflections off of signs and other objects,and lulls in overall traffic noise. On the other hand, real-world settings also introducecompeting factors, such as ambient music and voices, wind noise, and cognitive demandsassociated with actual crossing of the street. In summary, one need in future work is tocompare performance of sighted and blind persons, ideally in both simulated and real trafficsettings, such as reporting on turning vehicles at intersections.
The signal-to-noise ratio required to detect whether a target vehicle was present was lowerthan that required for discriminating turn paths, by a difference of about 11 dB. This findingsuggests that a policy of increasing vehicle sound levels to achieve detectability mightprovide little benefit with respect to decisions that pedestrians must make about patterns ofvehicle movement. There might even be an unintended adverse impact if a requirement for aminimum vehicle sound level resulted in an increase in overall traffic noise. Public policyshould be informed by consideration of a wider range of pedestrian decision making thanjust detecting a single vehicle approaching in a quiet background. Making vehicles moredetectable in quiet settings will not necessarily translate into providing pedestrians withuseful acoustic information in situations in which many vehicles are operating.
Ashmead et al. Page 14
Hum Factors. Author manuscript; available in PMC 2012 September 21.
NIH
-PA Author Manuscript
NIH
-PA Author Manuscript
NIH
-PA Author Manuscript
Any recommendation to establish a standard for vehicle sound should be based on ademonstrable benefit to pedestrian safety. Current proposals to match electric vehicle soundlevel to that of gasoline vehicles have intuitive appeal but rest on the assumption that such asound level is very useful. The present findings, as well as interpretation of studies coveredin the Introduction to this article, suggest this assumption is questionable. Nevertheless, theconcept of adding sound to vehicles could provide opportunities to provide information notreadily available from gasoline vehicles.
For example, proposals for add-on sound include a provision for “pitch bending,” such thatthe overall frequency composition of the emitted sound covaries with vehicle speed. Thisfeature could not be included in our simulation for proprietary reasons, but it might serve asa more reliable cue to vehicle speed than does gasoline engine sound. Likewise, if therewere a unique sound when a vehicle is stationary, it could help cue that a driver is yieldingfor a pedestrian or that a traffic surge has begun (as the stationary signals switch to motionsignals). Still another possibility is that an identifiable sound event would occur when thesteering mechanism reaches a certain deviation from straight ahead. These kinds ofproposals would need to be standardized, would necessitate education about what thevarious sounds mean, and would require research to evaluate the potential to enhancepedestrian safety. A formidable challenge for any of these features is the signal-to-noiseissue. That is, in a traffic setting with many vehicles present, it is very difficult to hear whatis going on with a single vehicle.
There are alternative technological approaches to the quiet-car problem besides addingsound to vehicles. The principle of universal design suggests that technology should beavailable to the widest possible range of users, without the need for individuals to engage inatypical maneuvers or carry specialized devices (Barlow, Bentzen, & Franck, 2010). Trafficengineers use inductive ground loops and camera-based image processing to monitor vehicleactivity. Vehicle-to-vehicle short-range wireless communication (Biswas, Tatchikou, &Dion, 2006) is already in partial use and will be adapted to provide information for trafficcontrol, possibly including information for pedestrians. The widespread use of smartphonesand a culture for using applications on them will provide a way to communicate informationto pedestrians at their request.
Efforts based on these kinds of technology face two kinds of challenges. One is to providepedestrians with precise information needed to make decisions in busy traffic settings, whichrequires high spatial accuracy and rapid updating, in a context in which many vehicles mustbe monitored. The second challenge is the imperative to provide the full range of pedestrianswith information they need, in a form they can use, to help them make safe decisions.
AcknowledgmentsThis investigation was supported by Grant No. R01- EY12894 of the National Institutes of Health, National EyeInstitute. Support also came from a research contract, “Children’s Perception of Moving Sound Sources,” fromNissan Technical Center North America. The contents are solely the responsibility of the authors and do notnecessarily represent the official views of the National Institutes of Health or Nissan. Thanks to Heather Konet fordiscussions throughout the project and to the editor and three anonymous reviewers for helpful suggestions.
REFERENCESAshmead DH, Guth D, Wall RS, Long RG, Ponchillia PE. Street crossing by sighted and blind
pedestrians at a modern roundabout. Journal of Transportation Engineering. 2005; 131:812–821.
Bach DR, Neuhoff JG, Perrig W, Seifritz E. Looming sounds as warning signals: The function ofmotion cues. International Journal of Psychophysiology. 2009; 74:28–33. [PubMed: 19615414]
Ashmead et al. Page 15
Hum Factors. Author manuscript; available in PMC 2012 September 21.
NIH
-PA Author Manuscript
NIH
-PA Author Manuscript
NIH
-PA Author Manuscript

Barlow, JM.; Bentzen, BL.; Franck, L. Environmental accessibility for students with vision loss. In:Wiener, WR.; Walsh, RL.; Blasch, BB., editors. Foundations of orientation and mobility: Vol.1.History and theory. 3rd ed. New York, NY: AFB Press; 2010. p. 324-385.
Barlow, JM.; Bentzen, BL.; Sauerburger, D.; Franck, L. Teaching travel at complex intersections. In:Wiener, WR.; Walsh, RL.; Blasch, BB., editors. Foundations of orientation and mobility: Vol. 2.Instructional strategies and practical applications. 3rd ed. New York, NY: American Foundation forthe Blind; 2010. p. 352-419.
Biswas S, Tatchikou R, Dion F. Vehicle-to-vehicle wireless communication protocols for enhancinghighway traffic safety. IEEE Communications Magazine. 2006; 44(1):74–82.
Cambron NK, Wilson RH, Shanks JE. Spondaic word detection and recognition functions for femaleand male speakers. Ear and Hearing. 1991; 12:64–70. [PubMed: 2026291]
Chandler DW, Grantham DW. Minimum audible movement angle in the horizontal plane as a functionof stimulus frequency and bandwidth, source azimuth, and velocity. Journal of the AcousticalSociety of America. 1992; 91:1624–1636. [PubMed: 1564199]
Coleman PD. An analysis of cues to auditory depth perception in free space. Psychological Bulletin.1963; 60:302–315. [PubMed: 14022252]
Garay-Vega, L.; Hastings, A.; Pollard, JK.; Zuschlag, M.; Stearns, MD. Quieter cars and the safety ofblind pedestrians: Phase I(DOT HS 811 304). Washington, DC: National Highway Traffic SafetyAdministration; 2010.
Grantham DW. Discrimination of dynamic interaural intensity differences. Journal of the AcousticalSociety of America. 1984; 76:71–76. [PubMed: 6747114]
Guth D, Ashmead D, Long R, Wall R, Ponchillia P. Blind and sighted pedestrians’ judgments of gapsin traffic at roundabouts. Human Factors. 2005; 47:314–331. [PubMed: 16170941]
Guth DA, Hill EW, Rieser JJ. Tests of blind pedestrians’ use of traffic sounds for street-crossingalignment. Journal of Visual Impairment and Blindness. 1989; 83:461–468.
Hanna, R. Incidence of pedestrian and bicyclist crashes by hybrid electric passenger vehicles (DOT HS811 204). Washington, DC: National Highway Traffic Safety Administration; 2009.
Hill, E.; Ponder, P. Techniques of orientation and mobility. New York, NY: American Foundation forthe Blind; 1976.
Hollands J, Jarmasz J. Revisiting confidence intervals for repeated measures designs. PsychonomicBulletin & Review. 2010; 17:135–138. [PubMed: 20081174]
Kaczmarek T. Auditory perception of sound source velocity. Journal of the Acoustical Society ofAmerica. 2005; 117:3149–3156. [PubMed: 15957782]
Kim DS, Wall Emerson R, Naghshineh K, Pliskow J, Myers K. Vehicle surge detection and pathwaydiscrimination by pedestrians who are blind: Effect of adding an alert sound to hybrid electricvehicles on performance. 2011 Manuscript under review.
Kim DS, Wall Emerson R, Naghshineh K, Pliskow J, Myers K. Impact of adding an artificiallygenerated alert sound to hybrid electric vehicles on their detectability by pedestrians who areblind. Journal of Rehabilitation Research & Development. 2012
LaGrow, S.; Weessies, M. Orientation and mobility: Techniques for independence. Palmerston North,New Zealand: Dunmore Press; 1994.
Lawson, GD.; Wiener, WR. Audition for students with vision loss. In: Wiener, WR.; Walsh, RL.;Blasch, BB., editors. Foundations of orientation and mobility: Vol.3 History and theory. 3rd ed.New York, NY: AFB Press; 2010. p. 84-137.
Levitt H. Transformed up-down methods in psychoacoustics. Journal of the Acoustical Society ofAmerica. 1971; 49:467–477. [PubMed: 5541744]
Lord, D.; Smiley, A.; Haroun, A. Pedestrian accidents with left-turning traffic at signalizedintersections: Characteristics, human factors, and unconsidered issues. Washington, DC:Transportation Research Board, National Research Council; 1998.
Lutfi RA, Wang W. Correlational analysis of acoustic cues for the discrimination of auditory motion.Journal of the Acoustical Society of America. 1999; 106:919–928. [PubMed: 10462797]
Madden JP, Fire KM. Detection and discrimination of frequency glides as a function of direction,duration, frequency span, and center frequency. Journal of the Acoustical Society of America.1997; 102:2920–2924. [PubMed: 9373978]
Ashmead et al. Page 16
Hum Factors. Author manuscript; available in PMC 2012 September 21.
NIH
-PA Author Manuscript
NIH
-PA Author Manuscript
NIH
-PA Author Manuscript

Mauchly JW. Significance test for sphericity of a normal n-variate distribution. Annals ofMathematical Statistics. 1940; 11:204–209.
McBeath MK, Neuhoff JG. The Doppler effect is not what you think it is: Dramatic pitch change dueto dynamic intensity change. Psychonomic Bulletin Review. 2002; 9:306–313. [PubMed:12120793]
Miedema HME. Annoyance caused by environmental noise: Elements for evidence-based noisepolicies. Journal of Social Issues. 2007; 63:41–57.
Mills AW. On the minimum audible angle. Journal of the Acoustical Society of America. 1958;30:237–246.
Moore DB. The revised ISO 362 standard for vehicle exterior noise measurement. Sound andVibration. 2006 Oct.:19–23.
National Federation of the Blind. Committee on Automobile and Pedestrian Safety/Quiet Cars. 2010.Retrieved from http://quietcars.nfb.org/
Pedestrian Safety Enhancement Act of 2010, Pub. L. 2010:111–373.
Perrott DR, Tucker J. Minimum audible movement angle as a function of signal frequency and thevelocity of the source. Journal of the Acoustical Society of America. 1988; 83:1522–1527.[PubMed: 3372867]
Pulkki V, Karjalainen M. Localization of amplitude-panned virtual sources: 1. Stereophonic panning.Journal of the Audio Engineering Society. 2001; 49:739–752.
Robart RL, Rosenblum LD. Are hybrid cars too quiet? Journal of the Acoustical Society of America.2009; 125:2774.
Rosenblum LD, Wuestefeld AP, Saldana HM. Auditory looming perception: Influences onanticipatory judgments. Perception. 1993; 22:1467–1482. [PubMed: 8090622]
Roudsari B, Kaufman R, Koepsell T. Turning at intersections and pedestrian injuries. Traffic InjuryPrevention. 2006; 7:283–289. [PubMed: 16990243]
Sandberg, U.; Ejsmont, JA. Tyre/Road noise reference book. Kisa, Sweden: Informex; 2002.
Szeto AY, Valerio NC, Novak RE. Audible pedestrian signals: Part 3. Detectability. Journal ofRehabilitation Research and Development. 1991; 28:71–78. [PubMed: 1829762]
U.S. Noise Pollution and Abatement Act of 1972, Pub. L. 86 Stat. 1234, 42 U.S.C. § 4901–42 U.S.C. §4918. 1972
Wall RS, Ashmead DH, Bentzen BL, Barlow J. Directional guidance from audible pedestrian signalsfor street crossing. Ergonomics. 2004; 47:1318–1338. [PubMed: 15370850]
Wall Emerson R, Naghshineh K, Hapeman J, Wiener W. A pilot study of pedestrians with visualimpairments detecting traffic gaps and surges containing hybrid vehicles. Transportation ResearchPart F. 2011; 14:117–127.
Wall Emerson R, Sauerburger D. Detecting approaching vehicles at streets with no traffic control.Journal of Visual Impairment & Blindness. 2008; 102:747–760. [PubMed: 20126414]
Wiener WR, Lawson G, Naghshineh K, Brown J, Bischoff A, Toth A. The use of traffic sounds tomake street crossings by persons who are visually impaired. Journal of Visual Impairment &Blindness. 1997; 91:435–445.
Wiener WR, Naghshineh K, Salisbury B, Rozema J. The impact of hybrid vehicles on street crossings.Journal of RE:view: Rehabilitation and Education for Blindness and Visual Impairment. 2006;38(2):65–78.
Wiener, WR.; Walsh, RL.; Blasch, BB., editors. Foundations of orientation and mobility: Vol. 2,Instructional strategies and practical applications. 3rd ed. New York, NY: AFB Press; 2010.
BiographiesDaniel H. Ashmead is a professor in the Department of Hearing and Speech Sciences atVanderbilt University School of Medicine. He received a PhD in developmental psychologyfrom the University of Minnesota in 1983.
Ashmead et al. Page 17
Hum Factors. Author manuscript; available in PMC 2012 September 21.
NIH
-PA Author Manuscript
NIH
-PA Author Manuscript
NIH
-PA Author Manuscript

D. Wesley Grantham is a professor in the Department of Hearing and Speech Sciences atVanderbilt University School of Medicine. He received a PhD in psychology from IndianaUniversity in 1975.
Erin S. Maloff is a clinical applications specialist at Cochlear Americas. She received a PhDin audiology from Vanderbilt University in 2010.
Benjamin Hornsby is an assistant professor in the Department of Hearing and SpeechSciences at Vanderbilt University School of Medicine. He received a PhD in hearing sciencefrom Vanderbilt University in 2002.
Takabun Nakamura is an associate professor in the Department of Welfare System andHealth Science, Faculty of Health and Welfare Science, at Okayama Prefectural University,Japan. He received a PhD in electronic engineering from Shizuoka University, Japan, in1981.
Timothy J. Davis is an audiology graduate student at Vanderbilt University School ofMedicine. He received a BA in communication sciences and disorders from WesternWashington University in 2009.
Faith Pampel is a graduate student in the Department of Hearing and Speech Sciences atVanderbilt University School of Medicine. She received a BA in linguistics fromSwarthmore College in 2009.
Erin G. Rushing is a graduate student in the audiology program in the Department ofCommunication Disorders, School of Allied Health, at Louisiana State University HealthSciences Center. She received an MS in biology from the University of Louisiana atLafayette in 2007.
Ashmead et al. Page 18
Hum Factors. Author manuscript; available in PMC 2012 September 21.
NIH
-PA Author Manuscript
NIH
-PA Author Manuscript
NIH
-PA Author Manuscript

KEY POINTS
• Quiet cars include vehicles of all engine types, and concern has been expressedthat low sound emissions may make it difficult for pedestrians to make saferoad-crossing decisions.
• In listening situations typical of moderately busy traffic settings, it is verydifficult to perceive whether an individual vehicle is traveling straight orturning, even for internal combustion engine vehicles.
• The signal-to-noise ratio required to make decisions about a vehicle’s travelpath is substantially higher than the ratio needed just to detect the vehicle.
• Increasing vehicle sound output to a minimum standard would not necessarilyenhance pedestrian safety in situations in which multiple vehicles are present,because doing so would tend to increase the overall traffic noise level.
Ashmead et al. Page 19
Hum Factors. Author manuscript; available in PMC 2012 September 21.
NIH
-PA Author Manuscript
NIH
-PA Author Manuscript
NIH
-PA Author Manuscript
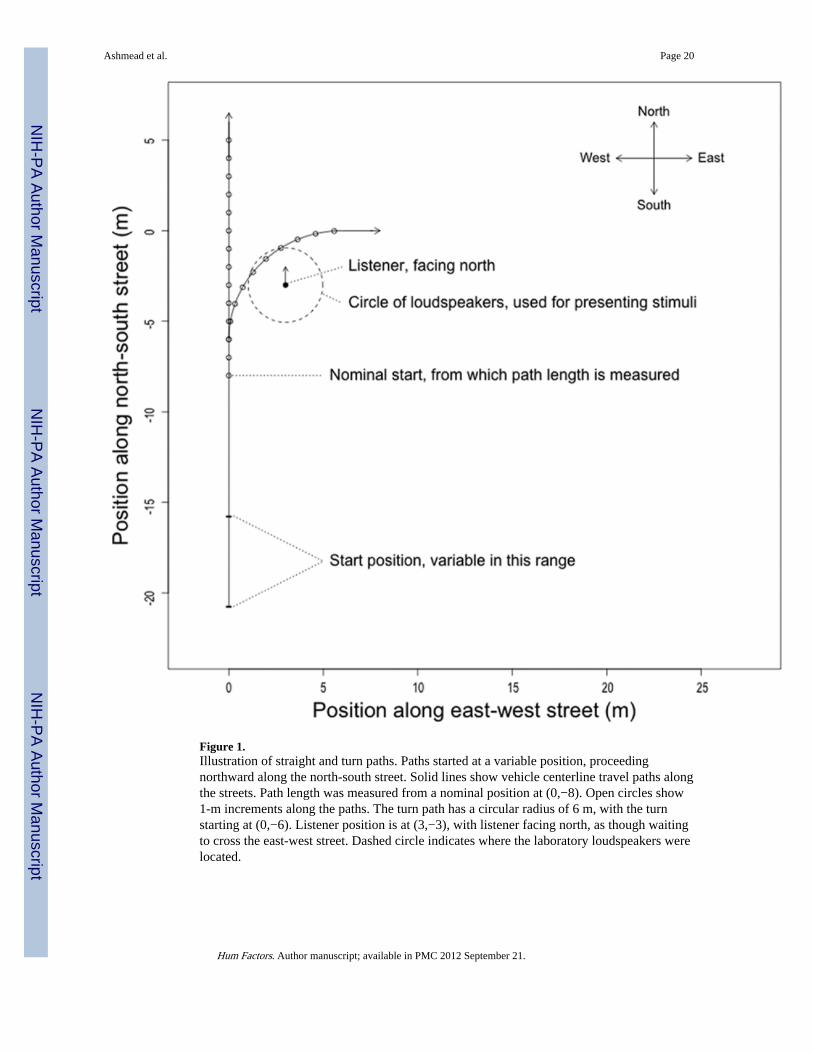
Figure 1.Illustration of straight and turn paths. Paths started at a variable position, proceedingnorthward along the north-south street. Solid lines show vehicle centerline travel paths alongthe streets. Path length was measured from a nominal position at (0,−8). Open circles show1-m increments along the paths. The turn path has a circular radius of 6 m, with the turnstarting at (0,−6). Listener position is at (3,−3), with listener facing north, as though waitingto cross the east-west street. Dashed circle indicates where the laboratory loudspeakers werelocated.
Ashmead et al. Page 20
Hum Factors. Author manuscript; available in PMC 2012 September 21.
NIH
-PA Author Manuscript
NIH
-PA Author Manuscript
NIH
-PA Author Manuscript
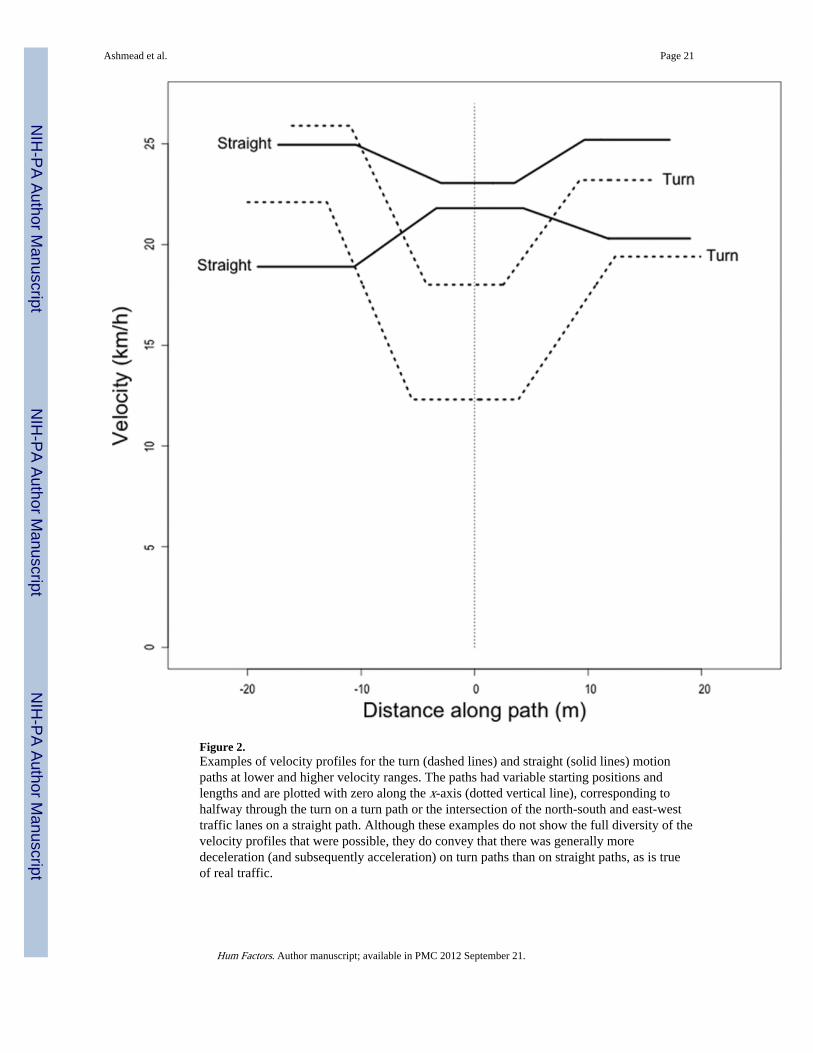
Figure 2.Examples of velocity profiles for the turn (dashed lines) and straight (solid lines) motionpaths at lower and higher velocity ranges. The paths had variable starting positions andlengths and are plotted with zero along the x-axis (dotted vertical line), corresponding tohalfway through the turn on a turn path or the intersection of the north-south and east-westtraffic lanes on a straight path. Although these examples do not show the full diversity of thevelocity profiles that were possible, they do convey that there was generally moredeceleration (and subsequently acceleration) on turn paths than on straight paths, as is trueof real traffic.
Ashmead et al. Page 21
Hum Factors. Author manuscript; available in PMC 2012 September 21.
NIH
-PA Author Manuscript
NIH
-PA Author Manuscript
NIH
-PA Author Manuscript
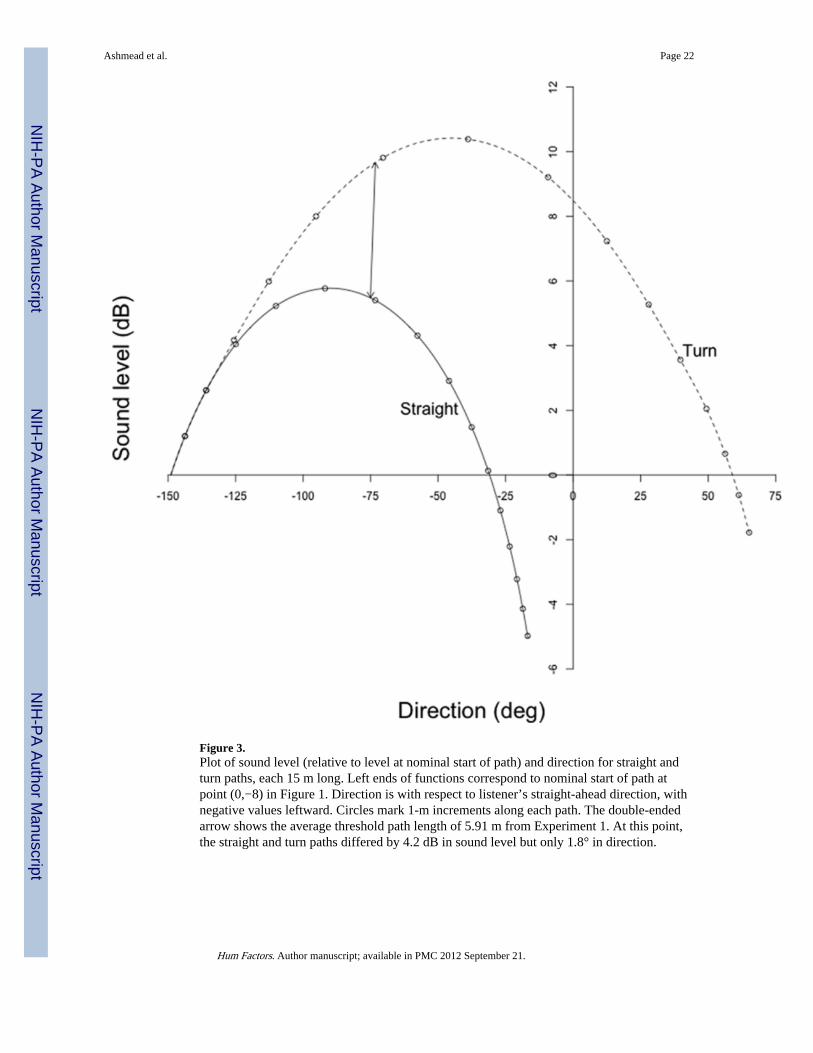
Figure 3.Plot of sound level (relative to level at nominal start of path) and direction for straight andturn paths, each 15 m long. Left ends of functions correspond to nominal start of path atpoint (0,−8) in Figure 1. Direction is with respect to listener’s straight-ahead direction, withnegative values leftward. Circles mark 1-m increments along each path. The double-endedarrow shows the average threshold path length of 5.91 m from Experiment 1. At this point,the straight and turn paths differed by 4.2 dB in sound level but only 1.8° in direction.
Ashmead et al. Page 22
Hum Factors. Author manuscript; available in PMC 2012 September 21.
NIH
-PA Author Manuscript
NIH
-PA Author Manuscript
NIH
-PA Author Manuscript
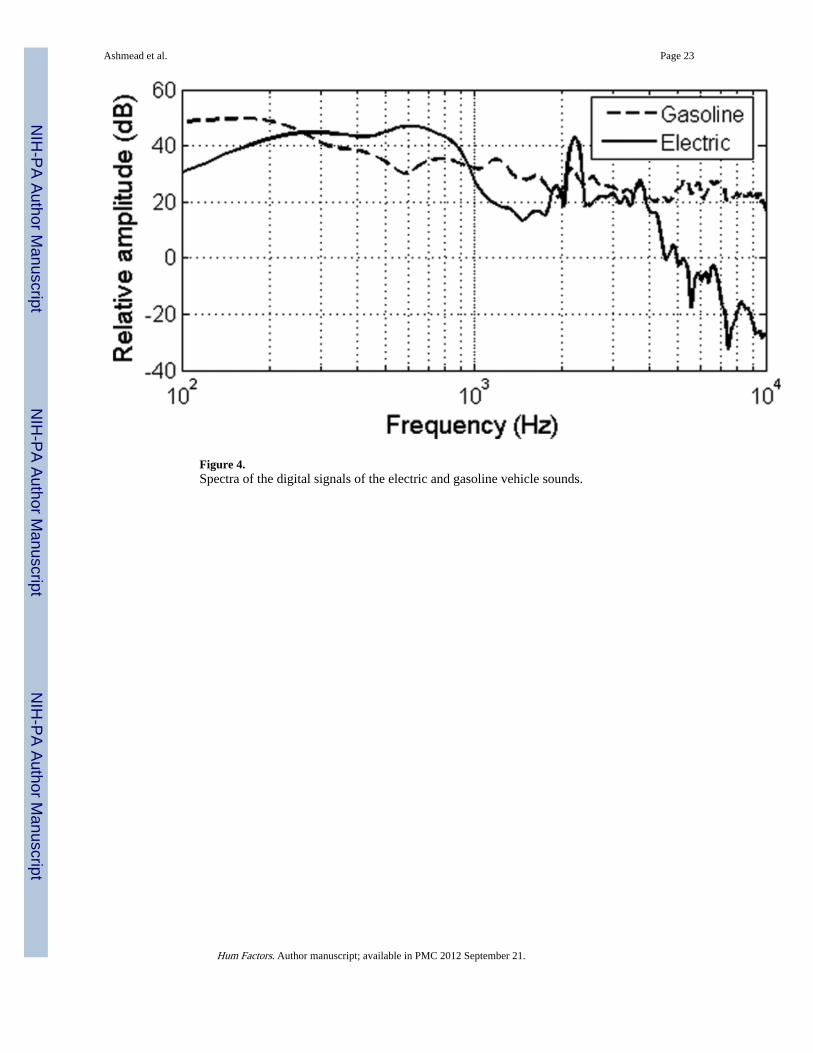
Figure 4.Spectra of the digital signals of the electric and gasoline vehicle sounds.
Ashmead et al. Page 23
Hum Factors. Author manuscript; available in PMC 2012 September 21.
NIH
-PA Author Manuscript
NIH
-PA Author Manuscript
NIH
-PA Author Manuscript

Figure 5.Experiment 1 mean threshold path lengths for discriminating between straight and turningvehicle paths in a quiet background. Signal conditions were the electric or gasoline vehiclesounds, played at levels of 52 or 65 dB, A-scale (sound levels are offset slightly to separateplot symbols for vehicle types). Error bars show 95% confidence intervals based on theapproach of Hollands and Jarmasz (2010).
Ashmead et al. Page 24
Hum Factors. Author manuscript; available in PMC 2012 September 21.
NIH
-PA Author Manuscript
NIH
-PA Author Manuscript
NIH
-PA Author Manuscript
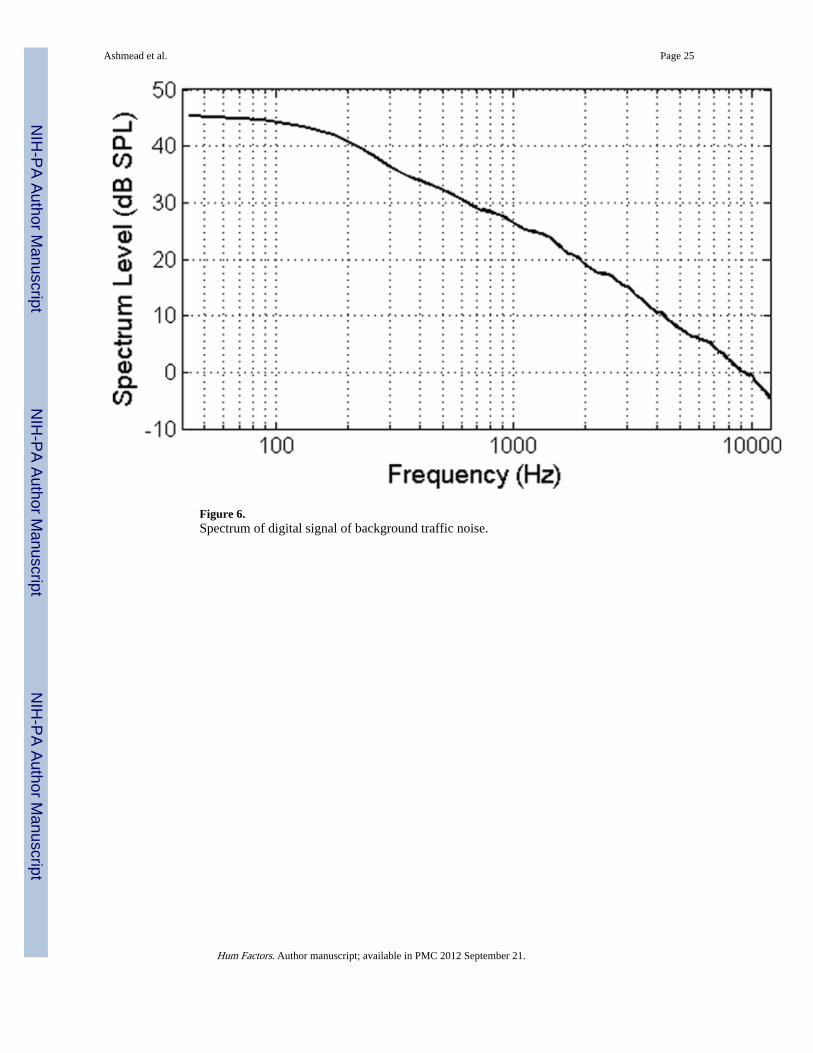
Figure 6.Spectrum of digital signal of background traffic noise.
Ashmead et al. Page 25
Hum Factors. Author manuscript; available in PMC 2012 September 21.
NIH
-PA Author Manuscript
NIH
-PA Author Manuscript
NIH
-PA Author Manuscript
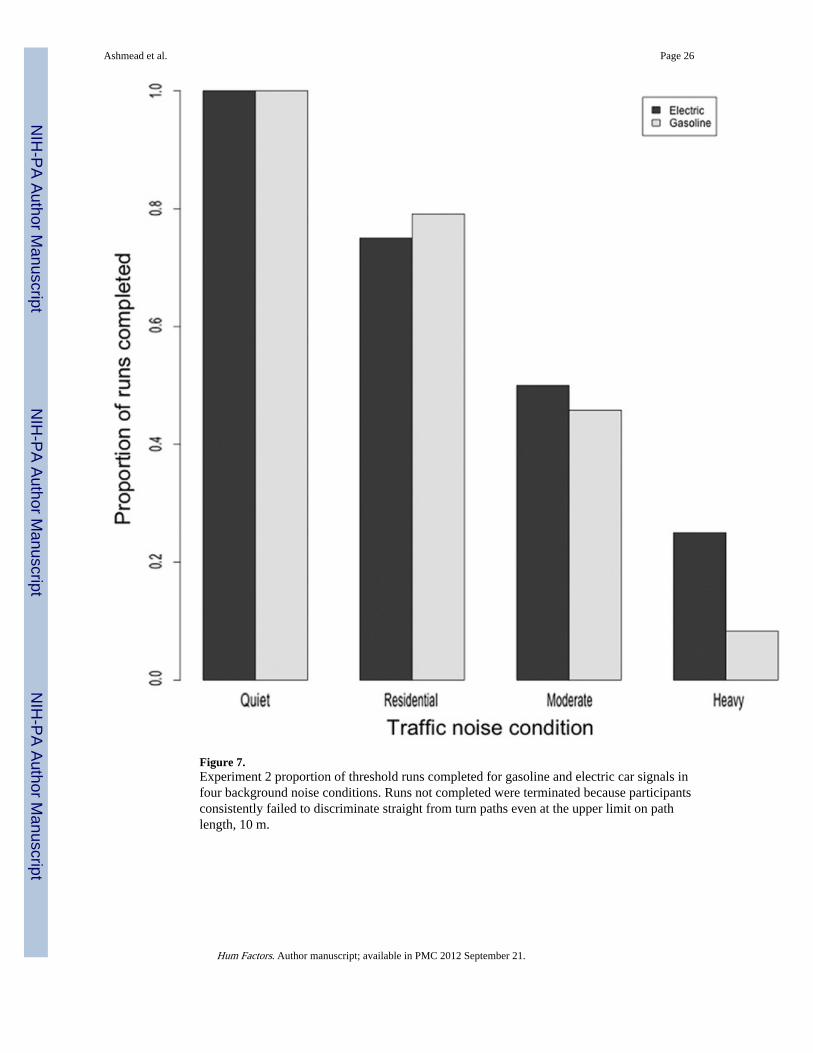
Figure 7.Experiment 2 proportion of threshold runs completed for gasoline and electric car signals infour background noise conditions. Runs not completed were terminated because participantsconsistently failed to discriminate straight from turn paths even at the upper limit on pathlength, 10 m.
Ashmead et al. Page 26
Hum Factors. Author manuscript; available in PMC 2012 September 21.
NIH
-PA Author Manuscript
NIH
-PA Author Manuscript
NIH
-PA Author Manuscript
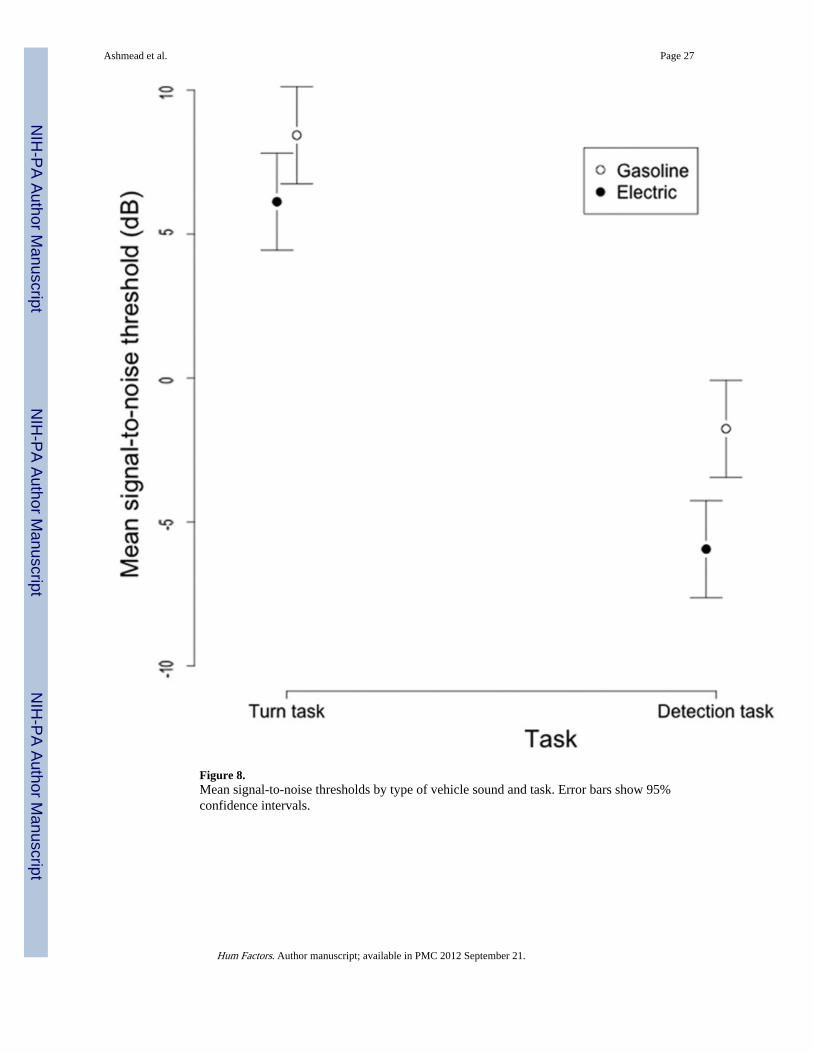
Figure 8.Mean signal-to-noise thresholds by type of vehicle sound and task. Error bars show 95%confidence intervals.
Ashmead et al. Page 27
Hum Factors. Author manuscript; available in PMC 2012 September 21.
NIH
-PA Author Manuscript
NIH
-PA Author Manuscript
NIH
-PA Author Manuscript