
Interregional alpha-band synchrony supports temporal cross-modal integration
12
Interregional alpha-band synchrony supports temporal cross-modal integration Joram van Driel a,b, ⁎, Tomas Knapen c , Daniel M. van Es c , Michael X Cohen a a Department of Psychology, University of Amsterdam, The Netherlands b The Amsterdam Brain and Cognition Center, University of Amsterdam, The Netherlands c Department of Cognitive Psychology, VU University Amsterdam, The Netherlands abstract article info Article history: Accepted 14 July 2014 Available online 17 July 2014 Keywords: Cross-modal integration Time perception Alpha-band Functional connectivity Phase synchrony In a continuously changing environment, time is a key property that tells us whether information from the dif- ferent senses belongs together. Yet, little is known about how the brain integrates temporal information across sensory modalities. Using high-density EEG combined with a novel psychometric timing task in which human subjects evaluated durations of audiovisual stimuli, we show that the strength of alpha-band (8–12 Hz) phase synchrony between localizer-defined auditory and visual regions depended on cross-modal attention: during encoding of a constant 500 ms standard interval, audiovisual alpha synchrony decreased when subjects attended audition while ignoring vision, compared to when they attended both modalities. In addition, alpha connectivity during a variable target interval predicted the degree to which auditory stimulus duration biased time estimation while attending vision. This cross-modal interference effect was estimated using a hierarchical Bayesian model of a psychometric function that also provided an estimate of each individual's tendency to exhibit attention lapses. This lapse rate, in turn, was predicted by single-trial estimates of the stability of interregional alpha synchrony: when attending to both modalities, trials with greater stability in patterns of connectivity were characterized by reduced contamination by lapses. Together, these results provide new insights into a functional role of the coupling of alpha phase dynamics between sensory cortices in integrating cross-modal information over time. © 2014 Elsevier Inc. All rights reserved. Introduction When the sound coming from a television gets out-of-sync with what is visually displayed, you immediately feel that something is wrong. Multimodal processing is ubiquitous in perception: different senses provide us with complementary evidence about external events, which can aid our responses to these events (McDonald et al., 2000; Yang et al., 2013), or can result in perceptual illusions (Alais and Burr, 2004; McGurk and MacDonald, 1976). Over the past several decades, neuroscience of multisensory processing has shifted from a strict hierar- chical view of unisensory signals converging onto higher supramodal areas (Meredith and Stein, 1983; Stein and Stanford, 2008), to a grow- ing consensus that cross-modal integration can occur even at early stages of sensory processing (Foxe et al., 2000; Ghazanfar and Chandrasekaran, 2007; Ghazanfar and Schroeder, 2006; Giard and Peronnet, 1999; Kayser and Logothetis, 2007; Martuzzi et al., 2007; Molholm et al., 2002). However, how these early-stage interactive pro- cesses are neurophysiologically organized remains a topic of active ex- ploration (Klemen and Chambers, 2012; Sarko et al., 2013). One proposed mechanism of neural interaction is “binding through coherence” (Fries, 2005; Varela et al., 2001; Ward, 2003; Womelsdorf et al., 2007), or the idea that effective windows of cortico-cortical com- munication may arise by transiently synchronized electrophysiological oscillations of the involved neural populations. Evidence is accumulat- ing that this principle may apply to the integration of multisensory in- formation as well (Doesburg et al., 2008; Hummel and Gerloff, 2005; Sarko et al., 2013; Senkowski et al., 2008; von Stein et al., 1999). For ex- ample, a stimulus of one modality can modulate the processing of a con- currently delivered stimulus of another modality, through the phase resetting of ongoing oscillatory activity in the corresponding primary sensory region (Diederich et al., 2012; Kayser et al., 2008; Lakatos et al., 2007). This results in increased cortical excitability, and thus improved behavioral performance towards the bimodal stimulus. Attention seems to determine which modality “controls” the phase- resetting (Lakatos et al., 2009). Given the tight link between alpha- band (8–12 Hz) activity and attentional processing (Jensen and Mazaheri, 2010; Klimesch et al., 2007), we hypothesized that during cross-modal attention, alpha phase synchrony may be an important mediator of large-scale communication between distant sensory re- gions (Hummel and Gerloff, 2005; Palva and Palva, 2011). Although several frequency bands have been implicated in multisensory integra- tion (Senkowski et al., 2008), it has been proposed that phase NeuroImage 101 (2014) 404–415 ⁎ Corresponding author at: Department of Psychology, The University of Amsterdam, 1018 XA Amsterdam, The Netherlands. E-mail address: [email protected] (J. van Driel). http://dx.doi.org/10.1016/j.neuroimage.2014.07.022 1053-8119/© 2014 Elsevier Inc. All rights reserved. Contents lists available at ScienceDirect NeuroImage journal homepage: www.elsevier.com/locate/ynimg
Transcript of Interregional alpha-band synchrony supports temporal cross-modal integration

NeuroImage 101 (2014) 404–415
Contents lists available at ScienceDirect
NeuroImage
j ourna l homepage: www.e lsev ie r .com/ locate /yn img
Interregional alpha-band synchrony supports temporalcross-modal integration
Joram van Driel a,b,⁎, Tomas Knapen c, Daniel M. van Es c, Michael X Cohen a
a Department of Psychology, University of Amsterdam, The Netherlandsb The Amsterdam Brain and Cognition Center, University of Amsterdam, The Netherlandsc Department of Cognitive Psychology, VU University Amsterdam, The Netherlands
⁎ Corresponding author at: Department of Psychology1018 XA Amsterdam, The Netherlands.
E-mail address: [email protected] (J. van Driel).
http://dx.doi.org/10.1016/j.neuroimage.2014.07.0221053-8119/© 2014 Elsevier Inc. All rights reserved.
a b s t r a c t
a r t i c l e i n f oArticle history:Accepted 14 July 2014Available online 17 July 2014
Keywords:Cross-modal integrationTime perceptionAlpha-bandFunctional connectivityPhase synchrony
In a continuously changing environment, time is a key property that tells us whether information from the dif-ferent senses belongs together. Yet, little is known about how the brain integrates temporal information acrosssensory modalities. Using high-density EEG combined with a novel psychometric timing task in which humansubjects evaluated durations of audiovisual stimuli, we show that the strength of alpha-band (8–12 Hz) phasesynchrony between localizer-defined auditory and visual regions depended on cross-modal attention: duringencoding of a constant 500ms standard interval, audiovisual alpha synchrony decreasedwhen subjects attendedaudition while ignoring vision, compared towhen they attended both modalities. In addition, alpha connectivityduring a variable target interval predicted the degree towhich auditory stimulus duration biased time estimationwhile attending vision. This cross-modal interference effectwas estimated using a hierarchical Bayesianmodel ofa psychometric function that also provided an estimate of each individual's tendency to exhibit attention lapses.This lapse rate, in turn, was predicted by single-trial estimates of the stability of interregional alpha synchrony:when attending to both modalities, trials with greater stability in patterns of connectivity were characterizedby reduced contamination by lapses. Together, these results provide new insights into a functional role of thecoupling of alpha phase dynamics between sensory cortices in integrating cross-modal information over time.
, The University of Amsterdam,
© 2014 Elsevier Inc. All rights reserved.
Introduction
When the sound coming from a television gets out-of-sync withwhat is visually displayed, you immediately feel that something iswrong. Multimodal processing is ubiquitous in perception: differentsenses provide us with complementary evidence about external events,which can aid our responses to these events (McDonald et al., 2000;Yang et al., 2013), or can result in perceptual illusions (Alais and Burr,2004; McGurk and MacDonald, 1976). Over the past several decades,neuroscience ofmultisensory processing has shifted froma strict hierar-chical view of unisensory signals converging onto higher supramodalareas (Meredith and Stein, 1983; Stein and Stanford, 2008), to a grow-ing consensus that cross-modal integration can occur even at earlystages of sensory processing (Foxe et al., 2000; Ghazanfar andChandrasekaran, 2007; Ghazanfar and Schroeder, 2006; Giard andPeronnet, 1999; Kayser and Logothetis, 2007; Martuzzi et al., 2007;Molholm et al., 2002). However, how these early-stage interactive pro-cesses are neurophysiologically organized remains a topic of active ex-ploration (Klemen and Chambers, 2012; Sarko et al., 2013).
One proposed mechanism of neural interaction is “binding throughcoherence” (Fries, 2005; Varela et al., 2001; Ward, 2003; Womelsdorfet al., 2007), or the idea that effective windows of cortico-cortical com-munication may arise by transiently synchronized electrophysiologicaloscillations of the involved neural populations. Evidence is accumulat-ing that this principle may apply to the integration of multisensory in-formation as well (Doesburg et al., 2008; Hummel and Gerloff, 2005;Sarko et al., 2013; Senkowski et al., 2008; von Stein et al., 1999). For ex-ample, a stimulus of onemodality canmodulate the processing of a con-currently delivered stimulus of another modality, through the phaseresetting of ongoing oscillatory activity in the corresponding primarysensory region (Diederich et al., 2012; Kayser et al., 2008; Lakatoset al., 2007). This results in increased cortical excitability, and thusimproved behavioral performance towards the bimodal stimulus.Attention seems to determine which modality “controls” the phase-resetting (Lakatos et al., 2009). Given the tight link between alpha-band (8–12 Hz) activity and attentional processing (Jensen andMazaheri, 2010; Klimesch et al., 2007), we hypothesized that duringcross-modal attention, alpha phase synchrony may be an importantmediator of large-scale communication between distant sensory re-gions (Hummel and Gerloff, 2005; Palva and Palva, 2011). Althoughseveral frequency bands have been implicated in multisensory integra-tion (Senkowski et al., 2008), it has been proposed that phase

405J. van Driel et al. / NeuroImage 101 (2014) 404–415
synchronization in the alpha-band may be especially important for coor-dinating functional integration between cortical regions (Doesburg et al.,2009) of relatively longer inter-areal distances (Palva and Palva, 2007;Palva et al., 2005). This active role of alpha activity has been shown in avariety of cognitive and perceptual tasks, such as spatial attention(Doesburg et al., 2009), working memory (Palva et al., 2005), object rec-ognition (Bar et al., 2006), and error-processing (van Driel et al., 2012),and may thus represent a general mechanism of coherent network func-tioning. Importantly, increases in interregional alpha-band phase syn-chrony can co-occur with local decreases in alpha-band power (Palvaand Palva, 2007, 2011),where the lattermay reflect attention-related “ac-tive inhibition” of task-irrelevant areas (Jensen and Mazaheri, 2010). Inthis study, we were in particular interested in the role of interregionalalpha phase dynamics during cross-sensory integration.
Most studies onmultisensory processing use brief, momentary stim-uli, and focus on the spatial domain (Driver and Spence, 1998, 2000;Macaluso and Driver, 2005), or on judgments of successiveness versussimultaneity (Jaekl and Harris, 2007; Keetels and Vroomen, 2007).However, multisensory events in a continuous environment are morelikely to be prolonged (Ghazanfar and Chandrasekaran, 2007), and arenot necessarily linked to one spatial location; in these more naturalisticsituations, correlated temporal durations can provide key evidence forintegration. Moreover, it is especially interesting to study cross-modalintegration of elapsed time, because the perception of auditory durationis superior to that of visual duration. This is in contrast to the more fre-quently investigated spatial domain, in which visual spatial localizationis superior to auditory spatial localization (Burr et al., 2009; Fendrichand Corballis, 2001; Pick et al., 1969).
The purpose of the present study was to investigate the potentialneural mechanisms of multimodal integration via duration perception.We here report novel evidence that inter-regional phase synchrony inthe alpha-band supports multimodal duration judgments in humans.Through time–frequency decomposition of high-density EEG activity,we found that alpha synchrony was modulated by cross-modal atten-tion and correlated with subject-specific Bayesian estimated parame-ters of distractor interference and lapsing.
Materials and methods
Subjects
Nineteen subjects (age range 18–29, M = 22.4; 13 females) fromthe University of Amsterdam community participated in this study inexchange for €14 or course credits. All subjects signed an informedconsent form before participation and reported to have normal orcorrected-to-normal vision, and normal hearing. The study was ap-proved by the local ethics committee; all procedures complied with rel-evant laws and institutional guidelines. Data of one subject wereexcluded from further analyses due to a programming error duringdata collection. Thus, the final dataset existed of data taken from eigh-teen subjects (12 females).
Bimodal duration discrimination task
Subjects performed a psychophysical duration discrimination task.In each trial they were presented with a “standard” 500 ms stimulusfollowed by a target stimulus whose duration was always shorter orlonger than the standard (determined on a trial-to-trial basis by anadaptive staircase procedure; see below). After the target, they indicat-ed with a button press whether they perceived its duration as shorter(left thumb) or longer (right thumb) than the duration of the standard.Both standard and target were composed of a concurrently presentedtone (500 Hz sine wave with a 5 ms ramp-up/down envelope, playedby speakers left and right from the screen) and a red LED (fixed at thecenter of a computer screen). During the standard, the auditory and
visual stimuli had the same onset and offset times (i.e. always a perfect-ly simultaneous 500 ms combined audiovisual stimulus).
For the target intervals, stimuli had equal onset times. Offset times,as well as instruction on attention, were manipulated in three differentconditions (see Fig. 1a). In the Audiovisual condition, the auditory andvisual stimuli had the same offset time, and subjects were instructedto attend tobothmodalities, and to regard the twomodalities as belong-ing to one coherent stimulus. In this condition, both the standard andtarget intervals thus consisted of a perfectly simultaneous auditoryand visual stimulus. In two distractor conditions we manipulated thecross-modal offset of target intervals, thereby introducing “temporalconflict”. That is, the target started simultaneously in both modalities,but the distractor modality ended earlier or later. We reasoned thatthe simultaneous onset initially triggers cross-sensory integration (asin the Audiovisual condition), but the unequal offset time results in abias in responding to the duration of one or the other modality. Specif-ically, in the Attend Auditory condition, the visual stimulus had an ear-lier or later offset than the auditory stimulus, and subjects wereinstructed to attend to the auditory (target) and ignore the visual(distractor) modality. In the Attend Visual condition this was theother way around: subjects were instructed to attend to the visual tar-get and ignore the auditory distractor stimulus that had an earlier orlater offset time. For both Attend Auditory and AttendVisual conditions,distractor stimuli had a duration of 50% (short distractor) or 150% (longdistractor) of the target interval, which was counterbalanced acrossshort and long targets. Thus, for example, a target shorter than the stan-dard could be accompanied by a distractor that was shorter or longerthan this target. Similarly, a target longer than the standard could be ac-companied by a distractor that was shorter or longer than this target.We hypothesized that, given the ubiquitous influence of cross-modalintegration, this manipulation would bias the responses of the subjecttowards the duration of the distractor, which could be correct (e.g.responding “long” to a long target accompanied by a longer distractor),or incorrect (e.g. responding “short” to a long target accompanied by ashorter distractor).
Each trial started with a standard stimulus of 500 ms, followed by a1000 ms inter-stimulus-interval, after which the target was presented.After target-offset, subjectswere required to respondwithin 1500ms. Tri-als ended upon responding, or when the 1500 ms response window hadpassed in which case feedback on response speed (“Respond faster!”)was presented for 500 ms at the center of the screen. A response (orresponse-feedback) was followed by a 1500 ms inter-trial interval.
The duration of the target was titrated trial-by-trial by means of anadaptive staircase procedure.Within each block, two staircases of 36 tri-als were randomly interleaved: one with durations shorter than thestandard (starting at 398 ms, with a minimum of 333 ms), and onewith durations longer than the standard (starting at 654 ms, with amaximum of 750 ms). Titration followed a 2-up-1-down rule, suchthat after two consecutive correct responses to the same target, its dura-tion approached the standard with a particular step size (0.15 times thedifference between the target duration and 500 ms standard duration),and after one error, the target duration moved away from the standardwith the same step size. With a 2-up-1-down staircase procedure,subjects will converge to ~71% accuracy level, i.e. around the just-noticeable difference (Leek, 2001). We took the proportional distance-to-standard step size approach to be able to account for Weber's law,or the scalar property of variation in interval timing (Buhusi andMeck, 2005; Gibbon, 1977; Grondin, 2010). This law predicts that, forexample, a 500–750 ms difference is harder to perceive than a 500–250 ms difference. With our approach, step sizes were always greaterfor the long compared to the short staircases, and decreased proportion-ally as the staircase approached the standard duration.We chose to usea constant 500 ms standard to be able to use this titration procedure;this decision was based on extensive piloting. Further, we were in par-ticular interested in the subsecond interval range, as this is thought totrigger automatic, rather than cognitively controlled (suprasecond)

406 J. van Driel et al. / NeuroImage 101 (2014) 404–415
timing; this has been shown to rely on different neural mechanisms(Lewis and Miall, 2003).
Each staircase sequence consisted of 72 trials, and eachof the three ex-perimental conditions consistedof three of these trial blocks. This resultedin a total of nine blocks, presented in pseudo-random order (no same-condition blocks presented in succession; subjects always started withan Audiovisual block). Subjects first performed a short practice block of10 trials with the same staircase procedure, but with additional feedbackon accuracy presented after the button press, at the center of the screen.
Behavioral analysis: the psychometric function
In this study we wanted to identify latent psychophysical processesthat governed the subjects' observed accuracy. We fitted psychometricGumbel functions (also known as the log–log function) on the behavior-al data using hierarchical Bayesian graphical modeling (Lee andWagenmakers, 2013; Rouder and Lu, 2005; Shiffrin et al., 2008) withWinBUGS software (Ntzoufras, 2009). This model of the psychometricfunction is largely based on the model described in van Driel et al.(2013), and is further explained in detail in the Supplemental Methods.We chose the Gumbel function because of its asymmetric shape: it issteeper at the left than the right side of the sigmoid curve (and thus dif-ferent from the symmetric logistic function, and mirroring the Weibullfunction; Kuss et al., 2005), making it especially suitable for modelingduration discrimination because of the aforementioned scalar propertyof interval timing (Buhusi and Meck, 2005; Gibbon, 1977).
From this Bayesian analysis we obtained for each subject the poste-rior distributions of the slope and intercept of the Gumbel function, anda lapse rate parameter, of which we took point-estimates (the maxi-mum a posteriori of the distribution). From the slope and intercept,the “just noticeable difference” (JND) and “point of subjective equality”(PSE) of the psychometric functionswere derived. The JND is thought toreflect precision (the smaller the difference that can be reliably discrim-inated, themore precise the subject's perception). The PSE is thought toreflect accuracy (the more often the subject perceives two physicallyidentical stimuli as similar, the more accurate that subject is), or bias(when the subject has a tendency to give one response more oftenthan the other response, the PSE moves away from objective equality).The JND was defined as the distance on the x-axis of the psychometricfunction between the 25% and 75% point on the y-axis, and thus reflectsthe “width” of the function (Kuss et al., 2005). The PSE was defined asthe value on the x-axis at the 50% point of the y-axis. The lapse ratewas estimated for each subject, through capturing “contaminated” aver-age responses at the stimulus level by an independent guessing process(see also Supplemental Methods). With “contamination”wemean thatthemodel decides by means of a Bernoulli process whether the propor-tion of “long” responses to a particular target duration is more likely tobe described by the subject's psychometric function, or whether it ismore likely to be driven by a non-psychometric process (modeled bya uniform probability distribution). The rate of this Bernoulli decisionprocess of the model is termed the lapse rate. Importantly, we do notclaim per se that the lapse rate unambiguously reflects “lapses of atten-tion” (e.g. O'Connell et al., 2009; Weissman et al., 2006). In fact, it couldalso be described as an outlier detectionmethod (see Fig. S2a). The lapserate in our model was initially meant to get a cleaner estimate of thepsychometric function andwe did thus not have strong a priori hypoth-eses as to how the lapse ratewould differ across conditions orwould re-late to EEG measures of connectivity.
These subject-specific point-estimates were analyzed at the group-level with repeated measures ANOVAs with the factor Condition (3levels). For an analysis of distractor interference (see Results), we re-peated the model fitting procedure for trials that were separatedbased on distractor type (longer or shorter than target). Here, we sim-ilarly subjected the resulting point-estimates of JND, PSE and lapse ratederived from the posterior distributions to a 3 (attention condition) by3 (short distractors, long distractors, all trials) ANOVA. To test whether
these latent variables met the normality assumption, we performed aKolmogorov–Smirnov analysis, revealing non-normality of the lapserate in all conditions (all ps b 0.05), which were driven by outlier sub-jects (different subject in each condition). We identified these outliersby means of Tukey's box-and-whisker plots; removing these subjectsmade the variables normally distributed (Kolmogorov–Smirnov test:all ps N 0.15). We performed the same ANOVAs as described abovewithout these outlier subjects, which did not change the results. Forthe main Results section we thus decided to leave in all subjects.
Localizer task
To constrain our a priori selection of channels of interest in the EEGanalyses, we conducted a separate task-independent localizer proce-dure. The purpose of this localizer was to identify modality-specificelectrodes independent of task processing. During EEG recording, butbefore the start of the actual experiment, subjects passively perceivedthe 500 Hz tone 50 consecutive times, followed by the LED 50 consecu-tive times. Auditory and visual stimuli lasted 2000 ms, with a 2000 msinter-stimulus-interval. Subjects were instructed to attend to the stimu-lus; no responses were required.
EEG data collection & preprocessing
Electroencephalographic data were acquired with Netstation soft-ware using a high-density 256 electrode net (Electrical Geodesics,Inc.) and a sampling rate of 1000 Hz. During recording, a 257th elec-trode at the “Cz” location of the international 10–20 system served asa reference. Offline, the 48 channels covering the cheek were removedin all subjects due to excessive EMG artifacts. Data of the remaining209 channels were high-pass filtered at 0.5 Hz and epoched at −1.5to 4 s surrounding the onset of the standard in each trial (−1.5 to 3 sfor the localizer). We performed linear baseline correction on the rawepoched data with a −200 pre-standard interval serving as baseline.Next, bad channels were detected and temporarily set to zero (toavoid reduced ranking of the data for ICA, see below). First we plottedtopographicalmaps of standard deviation over time of the z-scored con-tinuous data, to visualize channels with high variability (indicative ofnoise). Initial selection of bad channels was subsequently confirmedby visual inspection of the time-series data. This procedure resulted inan average of 4.11 rejected channels (minimum/maximum acrosssubjects: 0/11). Next, all epochs were visually inspected and those con-taining EMG or other artifacts not related to eye-blinks were manuallyremoved (average: 9.85%, minimum/maximum across subjects: 0.77/25.31%). In addition,we performed single-trial interpolation of channelsthat showed strong but short-lasting spurious activity, which wouldotherwise result in too many epochs and/or too many channels beingremoved. PCA-based independent components analysis was performedon the remaining epochs using the eeglab package (Delorme andMakeig, 2004) in Matlab (The MathWorks), by first reducing the datato 30 principal components, which were subsequently transformedinto 30 independent components. Components that contained oculo-motor artifacts (e.g. blinks) or other artifacts that could be clearly distin-guished from brain-driven EEG signals were subtracted from the data,which were then back-transformed to 209 channel time-series. Next,the rejected channels were interpolated and the data were re-referenced to the average reference. Finally, all EEG data were spatiallyfiltered by applying a surface Laplacian (Perrin et al., 1989), which isequivalent to the current source density (CSD) approach (Kayser andTenke, 2006). This method has previously been applied to sharpeningEEG topography and performing synchronization analyses (Cavanaghet al., 2010; van Driel et al., 2012). The Laplacian accentuates local ef-fects while filtering out distant effects due to volume conduction(deeper brain sources that project ontomultiple electrodes, thereby ob-scuring neurocognitively modulated long-range functional connectivi-ty; Oostendorp and Oosterom, 1996; Winter et al., 2007; Srinivasan

407J. van Driel et al. / NeuroImage 101 (2014) 404–415
et al., 2007). For estimating the surface Laplacian we used a 10th orderLegendre polynomial and lambda was set at 10−5.
EEG time–frequency decomposition
The epoched EEG time series were decomposed into their time–fre-quency representationswith customwrittenMatlab scripts, by convolv-ing themwith a set of Morlet wavelets with frequencies ranging from 1to 40 Hz in 25 logarithmically scaled steps. These complex waveletswere created by multiplying perfect sine waves (sine wave = ei2πft,where i is the complex operator, f is frequency, ranging from 1 to50 Hz, and t is time) with a Gaussian (Gaussian = e−t2 / 2s2, where s isthe width of the Gaussian). The width of the Gaussian ranged from 3to 12 cycles [s = c / (2πf), where c is the number of cycles], to have agood trade-off between temporal and frequency resolution. The fastFourier transform (FFT) was applied to both the EEG data and theMorlet wavelets, and these were then multiplied in the frequency do-main (equivalent to convolution in the time domain), after which theinverse FFT was applied. From the resulting complex signal Zt (down-sampled to 40 Hz), an estimate of frequency-specific power at eachtime point was defined as [real(Zt)2 + imag(Zt)2], and an estimate offrequency-specific phase at each time point was defined as arctan[imag(Zt) / real(Zt)]. Trial averaged power was decibel normalized [dBPowertf=10 ∗ Log10(Powertf / Baseline Powerf)], where for each chan-nel and frequency the condition specific power signal during an intervalof−400 to−100ms relative to standard stimulus onset served as base-line activity. Inter-trial phase clustering (ITPC) reflects the consistencyof phase angles over time across trials, which was calculated by averag-ing the phase vectors over trials:
ITPCtf ¼1N�XN
n¼1ei ϕtfð Þ
�����;�����
where N is the number of trials, n is the trial index, and φ is the phaseangle at a particular time–frequency point. ITPC can range from 0 (nophase clustering over trials) to 1 (perfect phase clustering over trials)for each time–frequency point.
We estimated inter-site phase clustering (a measure of phase-basedfunctional connectivity between regions), by means of the debiasedweighted phase-lag index (dwPLI; Vinck et al., 2011; see also Stamet al., 2007). By taking the absolute value of the sum (over time or overtrials, see below) of the sign of phase-angle differences between channels,the PLImetric reflects the degree towhich the time series at two channelsshow an asymmetry in the distribution of phase leads and lags. It thuspartials out randomaswell as zero phase-lag, thereby controlling for spu-riously inflated connectivity due to volume conducted common sourceactivity (Nunez et al., 1997). The de-biased weighted version of the PLI(dwPLI) in addition weights the phase angle difference vectors accordingto their distance from the real axis, and controls for a positive bias for lowPLI values (Vinck et al., 2011).We used the dwPLI function as implement-ed in the Fieldtrip toolbox (Oostenveld et al., 2011) for Matlab. Here, wefirst applied the summation over trials for the group-level analysis of con-dition differences, thereby retaining information of dwPLI over time.Based on the group-level condition-averaged results we picked twotime windows of interest (the first 50–400 ms during the standard andtarget stimulus) to be able to compute single-trial dwPLI, where the sum-mation is done over time. As with ITPC, PLI can take a value between 0(perfect synchronization with zero phase-lag due to volume conduction,or complete random phase-angle differences) and 1 (a perfect inter-channel phase-lag relationship).
Localizer-based channel-cluster selection
Our a priori regions of interests were those channels maximally re-sponsive to the auditory and visual stimulus. We based our selection of
these channels on the data from the localizer task (see above), whichelicited inter-trial phase clustering activity in the theta (4–8 Hz) bandfor the auditory, and alpha (8–12 Hz) band for the visual stimuli, duringa 100 to 300 ms post-stimulus time window. To select clusters of chan-nels, we first computed the p-value of significant average ITPC in thesetime–frequency windows, at each channel: p = e−N ∗ itpc, where N de-notes the average number of trials (42 for auditory, 41 for visual). Next,we selected those channels that showed a (uncorrected) p-value below0.01. This resulted in two right-lateralized clusters of channels: onemid-central cluster for auditory and one parieto-occipital cluster for vi-sual stimuli. Because we did not have any a priori hypotheses about lat-eralization, we mirrored these channels around the anterior–posterioraxis, which gave us the sensory channel-clusters depicted in Fig. 2a.Our main analyses of task data were based on these clusters.
Statistical analyses of EEG data
At the group level, we took the following procedure for statisticaltesting of condition differences. First, we visually inspected condition-averaged time–frequency plots of the predefined clusters of visual andauditory channels (based on the localizer data, see above), both forpower and for ITPC within these clusters (Fig. 2b) and dwPLI betweenthese clusters (Fig. 3a). These revealed clear time–frequency windowswhich we selected for our further analysis steps. Because our mainhypothesis of this study concerned phase synchrony in situations ofcross-modal integration, we conducted a repeated measures ANOVAonly for dwPLI, where we took the average of 8–12 Hz in two timewindows: 50–400 ms after standard and after target stimuli. Thesevalues were entered into a repeated measures ANOVA with factorsCondition (3 levels: Audiovisual, Attend Auditory, Attend Visual)and Interval (2 levels: Standard and Target). Because our selectionof time–frequency windows was based on a condition-average,this procedure is orthogonal to and thus unbiased by potentialcondition differences.
Second, to test for possible condition differences in power and ITPC,we performed exploratory cluster-based permutation testing routines(Maris and Oostenveld, 2007) implemented in the Fieldtrip toolbox(Oostenveld et al., 2011). Here we averaged over several time–frequen-cy windows that we selected based on Fig. 2b, and evaluated non-parametrically whether there were channel-clusters of conditiondifferences. In addition, to confirm the spatial specificity of connectivitybetween our predefined clusters, we also performed a seeded-synchrony analysis with cluster-based permutation testing. In this anal-ysis, we first used the visual cluster as a seed and computed connectivitywith every other channel (in the same time–frequency windows aswritten above), which we entered into the non-parametric test. Nextwe repeated this step with the auditory cluster as seed. In these permu-tation analyses we reduce dimensionality by averaging over time andfrequency, and correct for multiple-comparisons of testing across 209channels by shuffling condition labels in 1000permutations. This proce-dure creates a distribution of possible condition-difference values underthe null-hypothesis of no actual condition differences. For all analyses,we used a minimum number of neighboring channels of 2 and a mini-mum inter-channel distance of 2.56 cm. For power, we set the cluster-alpha threshold at 0.05; for ITPC, this value was set to 0.001, and fordwPLI to 0.1. Importantly, these values are not statistical thresholds ofthe permutation testing, but denote the threshold at which a channelis considered a candidate member of a cluster. The different valuesacross measures reflect the differences in signal-to-noise ratio (SNR).That is, a cluster-alpha threshold of 0.1 for ITPCwill result in one clusterconsisting of the entire scalp, and a threshold of 0.001 for dwPLIwill notgive any clusters. The actual permutation testing is done after thiscluster-selection procedure. Importantly, we would like to stress thatthese analyses are supplemental and were meant to further explore ef-fects beyond our predefined clusters of channels.
408 J. van Driel et al. / NeuroImage 101 (2014) 404–415
Single-trial based inter-stimulus connectivity similarity analysis
To connect single-trial phase synchronization dynamics more di-rectly to psychophysical performance, we first calculated dwPLI valuesduring a fixed time window of each standard and target presentationbetween the localizer-based auditory and visual channel clusters, aver-aged over the alpha (8–12 Hz) band. To increase frequency resolutionand SNR for this analysis, we performed an additional wavelet con-volution using 0.5 Hz bins from 8 to 12 Hz. After phase extraction anddwPLI calculation, this yielded for each trial a value of connectivity dur-ing standard and target, of which we took the absolute difference (Fig.4a). Thus, the closer to zero, the more similar connectivity was duringstandard and target presentation. Next, each attention conditionwas di-vided, based on a median split of these values, in a group of trials with“low similarity” and a group of trials with “high similarity.” Finally, psy-chometric Gumbel functions were refitted on the behavioral responseson these connectivity-based split trials, where we used the samemodel, point-estimate inference and ANOVA approach as describedabove. The distribution of the connectivity-difference values over trialswas not bimodal, which may not validate a median split approach. Ide-ally, one would divide the trials into several bins. However, this wouldhave resulted in too few trials per bin for the fitting procedure.
Audiovisual
0 500 1500
Time (ms)
0 500 1500
Attend Auditory
2000
2000
0 500 1500
Attend Visual
2000
Short tarLong dist
Short disLong targ
Long targ
b d
a
0.0
0.1
0.2
0.3
0.4
0.5
0.6
JND
AudvisAtt AudAtt Vis
***
−0.
30−
0.20
−0.
100.
00
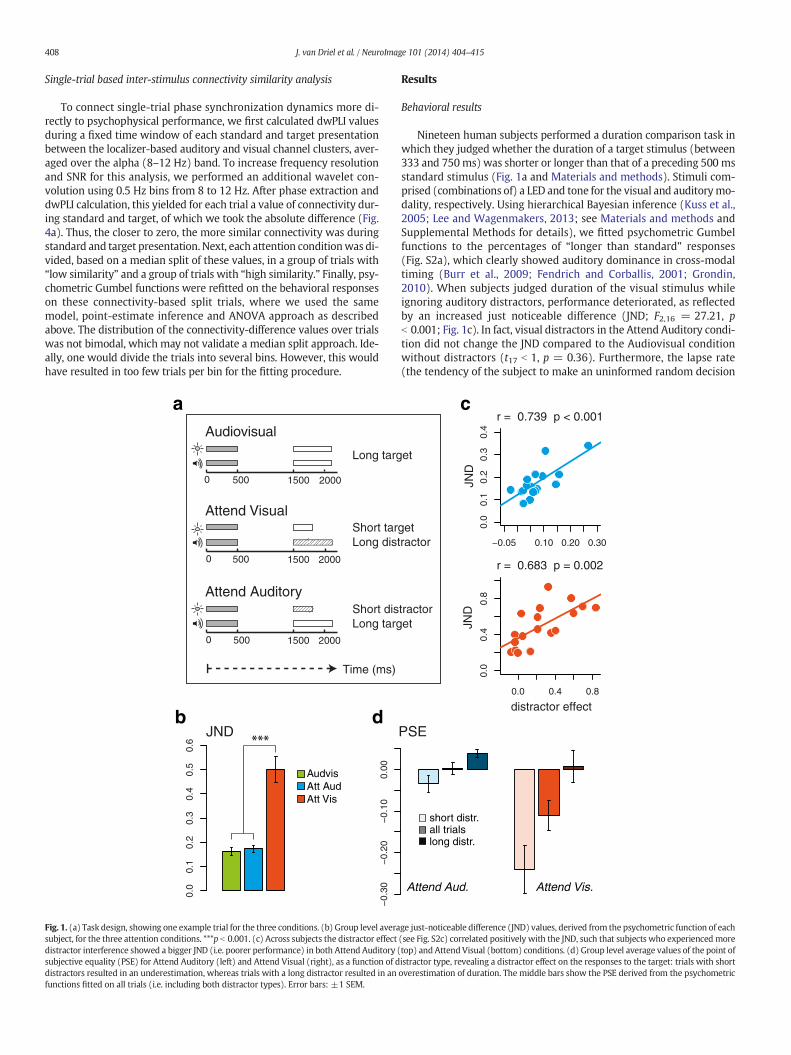
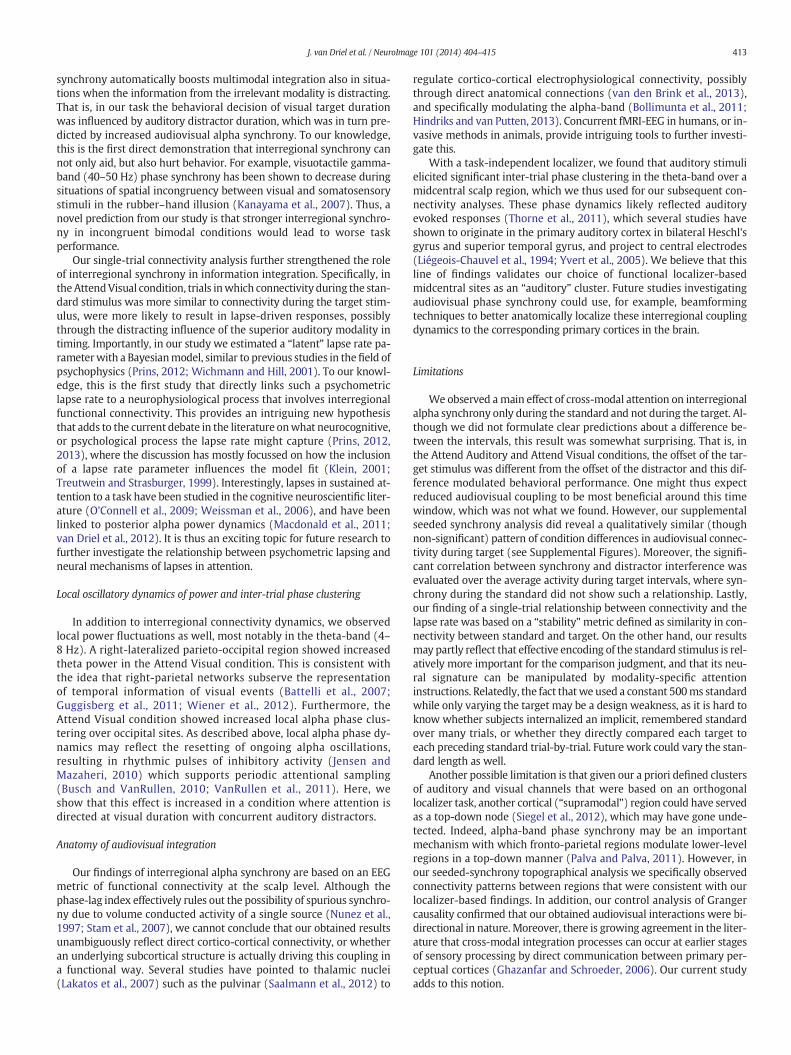
Fig. 1. (a) Task design, showing one example trial for the three conditions. (b) Group level averasubject, for the three attention conditions. ***p b 0.001. (c) Across subjects the distractor effectdistractor interference showed a bigger JND (i.e. poorer performance) in both Attend Auditory (subjective equality (PSE) for Attend Auditory (left) and Attend Visual (right), as a function of ddistractors resulted in an underestimation, whereas trials with a long distractor resulted in anfunctions fitted on all trials (i.e. including both distractor types). Error bars: ±1 SEM.
Results
Behavioral results
Nineteen human subjects performed a duration comparison task inwhich they judged whether the duration of a target stimulus (between333 and 750ms) was shorter or longer than that of a preceding 500 msstandard stimulus (Fig. 1a and Materials and methods). Stimuli com-prised (combinations of) a LED and tone for the visual and auditorymo-dality, respectively. Using hierarchical Bayesian inference (Kuss et al.,2005; Lee and Wagenmakers, 2013; see Materials and methods andSupplemental Methods for details), we fitted psychometric Gumbelfunctions to the percentages of “longer than standard” responses(Fig. S2a), which clearly showed auditory dominance in cross-modaltiming (Burr et al., 2009; Fendrich and Corballis, 2001; Grondin,2010). When subjects judged duration of the visual stimulus whileignoring auditory distractors, performance deteriorated, as reflectedby an increased just noticeable difference (JND; F2,16 = 27.21, pb 0.001; Fig. 1c). In fact, visual distractors in the Attend Auditory condi-tion did not change the JND compared to the Audiovisual conditionwithout distractors (t17 b 1, p = 0.36). Furthermore, the lapse rate(the tendency of the subject to make an uninformed random decision
get ractor
tractoret
et
c
distractor effect
JND
JND
PSE
Attend Aud. Attend Vis.
short distr.
long distr.all trials
−0.05 0.10 0.20 0.30
0.0
0.1
0.2
0.3
0.4
r = 0.739 p < 0.001
0.0 0.4 0.8
0.0
0.4
0.8
r = 0.683 p = 0.002
ge just-noticeable difference (JND) values, derived from the psychometric function of each(see Fig. S2c) correlated positively with the JND, such that subjects who experienced moretop) and Attend Visual (bottom) conditions. (d) Group level average values of the point ofistractor type, revealing a distractor effect on the responses to the target: trials with shortoverestimation of duration. The middle bars show the PSE derived from the psychometric
409J. van Driel et al. / NeuroImage 101 (2014) 404–415
in a particular trial) increased substantially in the Attend Visual condi-tion (F2,16 = 38.14, p b 0.001), together with a strong shift in thepoint of subjective equality (PSE; F2,16 = 9.67, p b 0.005; Fig. S2b).
This pattern of results may indicate that subjects often based theirjudgments purely on auditory duration, even in the Audiovisual condi-tion in which the simultaneous visual stimuli of equal duration couldhave been helpful in providing more sensory evidence of elapsed time.However, the observation that reaction times were fastest in the Audio-visual condition (F2,16 = 8.87, p = 0.003; Audiovisual faster thanAttend Auditory: t17 = 2.98, p= 0.008; Audiovisual faster than AttendVisual: t17= 3.12, p= 0.005; no difference in RT betweenAttendAudi-tory and Attend Visual: t17 = 1.3, p = 0.21), suggests that attending tothe bimodal simultaneous audiovisual stimuli did give a behavioral ben-efit. Moreover, we observed in both Attend Visual and Attend Auditoryconditions a distractor-dependent shift in the PSE (F2,16 = 19.63,p b 0.001; Fig. 1d), which is implicative of an interference effect ofdistractor duration on the perceptual judgment of target duration. Forexample, subjects were more likely to respond with “shorter than stan-dard” at visual targets (both short and long) that were accompanied bya shorter auditory distractor (Fig. S2c). Although this interference effectwas stronger in degree for auditory distractors in the Attend Visualcondition (again reflecting auditory dominance in timing; F2,16 =7.92, p = 0.011), it was significant, and qualitatively similar, in theAttend Auditory condition (F2,16 = 14.22, p = 0.001). In addition,distractor interference explained variance in both conditions (Fig. 1b):subjects that were more influenced by a visual or auditory distractor
Auditory localizer4−8 Hz
Visual loca8–12 H
1
2
4
8
16
32
0 1000 20001
2
4
8
16
32
0 1000
Freq
uenc
y (H
z)
Time (ms)
standard target standard ta
Condition averaged task data
0
0.35
ITP
Ca
bAud cluster
Aud cluster
Vis cluster
Vis cluster
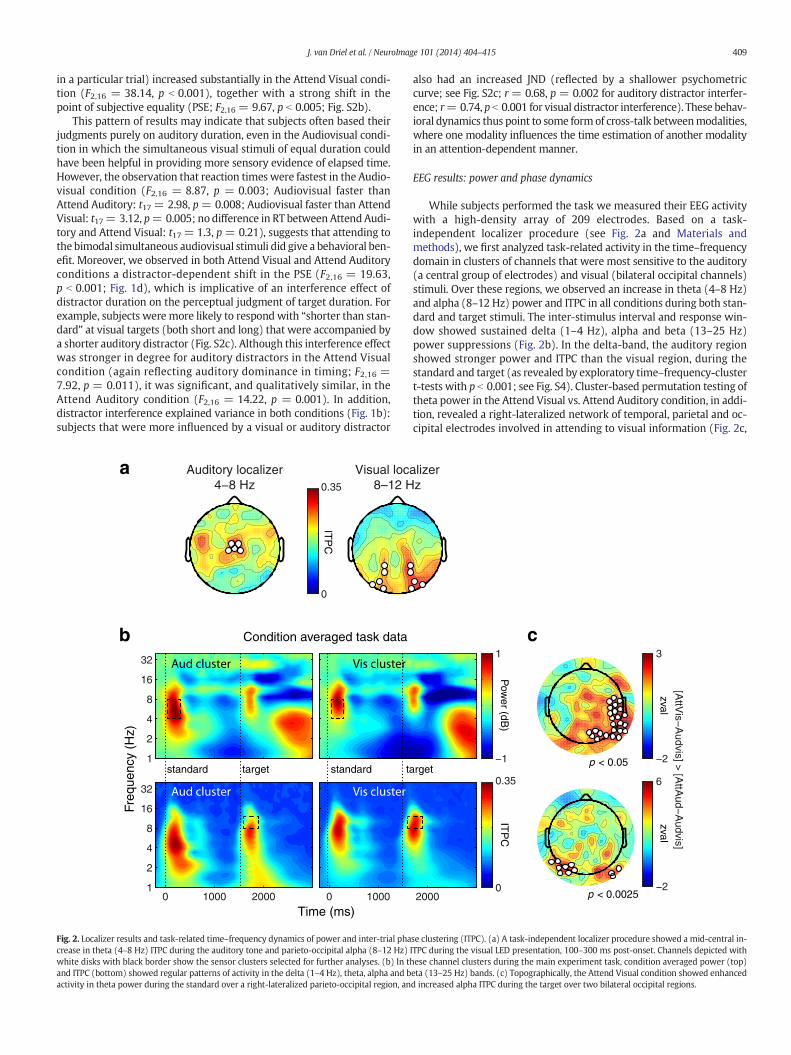
Fig. 2. Localizer results and task-related time–frequency dynamics of power and inter-trial phacrease in theta (4–8 Hz) ITPC during the auditory tone and parieto-occipital alpha (8–12 Hz)white disks with black border show the sensor clusters selected for further analyses. (b) In thand ITPC (bottom) showed regular patterns of activity in the delta (1–4 Hz), theta, alpha and bactivity in theta power during the standard over a right-lateralized parieto-occipital region, an
also had an increased JND (reflected by a shallower psychometriccurve; see Fig. S2c; r = 0.68, p = 0.002 for auditory distractor interfer-ence; r= 0.74, p b 0.001 for visual distractor interference). These behav-ioral dynamics thus point to some formof cross-talk betweenmodalities,where one modality influences the time estimation of another modalityin an attention-dependent manner.
EEG results: power and phase dynamics
While subjects performed the task we measured their EEG activitywith a high-density array of 209 electrodes. Based on a task-independent localizer procedure (see Fig. 2a and Materials andmethods), we first analyzed task-related activity in the time–frequencydomain in clusters of channels that were most sensitive to the auditory(a central group of electrodes) and visual (bilateral occipital channels)stimuli. Over these regions, we observed an increase in theta (4–8 Hz)and alpha (8–12 Hz) power and ITPC in all conditions during both stan-dard and target stimuli. The inter-stimulus interval and response win-dow showed sustained delta (1–4 Hz), alpha and beta (13–25 Hz)power suppressions (Fig. 2b). In the delta-band, the auditory regionshowed stronger power and ITPC than the visual region, during thestandard and target (as revealed by exploratory time–frequency-clustert-tests with p b 0.001; see Fig. S4). Cluster-based permutation testing oftheta power in the Attend Visual vs. Attend Auditory condition, in addi-tion, revealed a right-lateralized network of temporal, parietal and oc-cipital electrodes involved in attending to visual information (Fig. 2c,
lizerz
−1
1
20000
0.35
Pow
er (dB)
ITP
C
rget
[AttV
is−A
udvis] > [A
ttAud−
Audvis]
−2
3
zval
−2
6
zval
p < 0.05
p < 0.0025
c
se clustering (ITPC). (a) A task-independent localizer procedure showed a mid-central in-ITPC during the visual LED presentation, 100–300 ms post-onset. Channels depicted withese channel clusters during the main experiment task, condition averaged power (top)eta (13–25 Hz) bands. (c) Topographically, the Attend Visual condition showed enhancedd increased alpha ITPC during the target over two bilateral occipital regions.

410 J. van Driel et al. / NeuroImage 101 (2014) 404–415
top), consistentwith a right hemisphere dominance for processing tem-poral information (Battelli et al., 2007). In addition, alpha ITPC duringthe target was also stronger for Attend Visual, in two bilateral clustersof occipital channels (Fig. 2c, bottom). This is most likely explained bythe attention manipulation (Palva and Palva, 2011): even though visualinformation was present in all conditions, specifically attending to thisinformation increased occipital alpha phase consistency.
EEG results: interregional phase synchrony
Weused the debiasedweighted phase-lag index (dwPLI; Vinck et al.,2011) to measure volume-conduction-independent inter-regional con-nectivity. We first computed dwPLI between our predefined auditoryand visual channel clusters (based on the localizer, see Fig. 2a). Thecondition-averaged plot revealed sustained alpha-band synchrony aswell as stimulus-related transient increases (Fig. 3a). Evaluated over afixed interval of 50–400 ms that invariably fell within stimulus presen-tations for the standard, and within most targets (average: 92%; min:84%; max: 97% of trials), connectivity between these clusters was mar-ginally affected by condition (F2,16 = 2.90, p= 0.084). Yet, there was a
Condition averaged phase-lag index
0 1000 2000
2
4
8
16
32
Freq
uenc
y (H
z)
Time (ms)
stan
dard
targ
et
p < 0.025
−33
p < 0.05
zval
Aud
itory
see
dV
isua
l see
d
Audvis > AttAud Audvis > AttV
a
c
Fig. 3. Interregional connectivity analysis revealed attention- and distractor-dependent changeaged phase-lag index showed robust increases in alpha (8–12Hz) band phase synchronization bthe standard stimulus, this connectivity was reduced in the Attend Auditory condition. *p b 0.0nectivity between central and posterior regions to be modulated by attention, in that it was strtions (statistical thresholding via cluster-basedpermutation testing). Cyan channels: auditory sein connectivitywith these seeds. (d) In the Attend Visual condition, subjectswith stronger alphaby auditory distractors. This was not the case for visual distractors in the Attend Auditory cond
significant difference during the standard between the Audiovisual andAttend Auditory condition (t17 = 2.41, p = 0.028). Thus, in the AttendAuditory condition, where subjects were less influenced by distractors(as indicated by the behavioral results), these responses were precededby a decrease in alpha phase synchrony between auditory and visual re-gions during the standard (Fig. 3b).
To confirm the spatial specificity of the effects tested in thehypothesis-driven ANOVA-based analysis, we computed alpha phasesynchrony between each electrode and the auditory and visual channelclusters and tested for topographical effects of increased connectivity inAudiovisual relative to Attend Auditory or Attend Visual. The resultsindeed supported our initial finding of increased audiovisual alpha syn-chronization in the Audiovisual condition, particularly during the stan-dard (Fig. 3c and Fig. S3): The auditory cluster showed connectivity inoccipital channels while the visual cluster showed connectivity inmidcentral channels (albeit with sub-threshold significance).
In the Attend Visual condition, the degree of the distractor effectover subjects (see Fig. 1c) was predicted by the strength of alphasynchrony during the target between the auditory and visual channelclusters (Fig. 3d): subjects that experienced more auditory distractor
Standard Target0
0.02
0.04
0.06
aud-
vis
alph
a dw
PLI
AudvisAtt AudAtt Vis
0.02
0.04
0.06
dwP
LI
p < 0.05
n.s.
is
0
0.05
0.1
−0.5 0 0.5 1
0
0.05
0.1
Attend Auditory
−0.5 0 0.5 1visual distractor effect
auditory distractor effect
aud-
vis
alph
a dw
PLI
r = 0.59 p = 0.011
n.s.
Attend Visual
b
d
*
s in alpha phase synchronization between auditory and visual regions. (a) Condition aver-etween the predefined auditory and visual channel clusters. (b) During the presentation of5. (c) A follow-up seed-to-all channel alpha synchronization analysis confirmed the con-onger during the standard in the Audiovisual condition compared to the other two condi-ed;magenta channels: visual seed;white channels showed significant condition differencephase synchrony between auditory and visual regions during targetweremore influencedition.
411J. van Driel et al. / NeuroImage 101 (2014) 404–415
interference while attending vision showed stronger alpha connectivitybetween auditory and visual regions (r = 0.59, p = 0.011). This rela-tionship did not hold during the standard, nor during the Attend Audi-tory condition, probably due to the small shifts in PSE by the lessinfluential visual distractors in this condition. Together, these resultsare in line with a functional role for alpha connectivity supportingcross-modal information integration.
An alternative interpretation of our results is that the mid-centralelectrodes identified in the independent localizer task could still reflecta non-auditory region that exerted top-downmodulatory control over vi-sual regions, expressed in alpha-band connectivity. To address this possi-bility, we conducted an additional effective connectivity analysis usingGranger causality. Thismeasure is definedas the log of a ratio of error var-iances from a univariate autoregression model (current values of, for ex-ample, time domain activity in visual channels are predicted frompreceding values from the same channels), and a bivariate autoregressionmodel (current values of visual channel activity are predicted from bothactivities from visual channels and auditory channels). The resulting re-gression coefficients thus reflect how past activity in one region predictsfuture activity in another region (Seth, 2008). If our finding of audiovisualalpha-band coupling reflected top-down directed influence from centralto occipital channels, one would expect Granger causality only in this di-rection. However, we observed Granger causality in both directions, dur-ing the standard and target, in all three conditions (no main andinteraction effects; all Fs b 0.5; see Fig. S5), confirming bidirectional func-tional connectivity between our predefined clusters hypothesized to re-flect primary sensory regions.
Another issue that needs to be raised is that the frequency withinwhich we observed audiovisual connectivity (~10 Hz) is somewhathigher than the power and ITPC alpha dynamics observed locally at
stan
dard
targ
et
abs –
1 Trial
absolute dif
0Trial 1...N
Single trial connectivity similarita
b
single-trial dwPLI
JNPSE
−0.
20−
0.10
0.00
0.05
0.0
0.2
0.4
0.6
0.8
AudvisAttAudAttVis
Low siHigh s
*
abs
dwP
LI d
iff
0.6
stan
dard
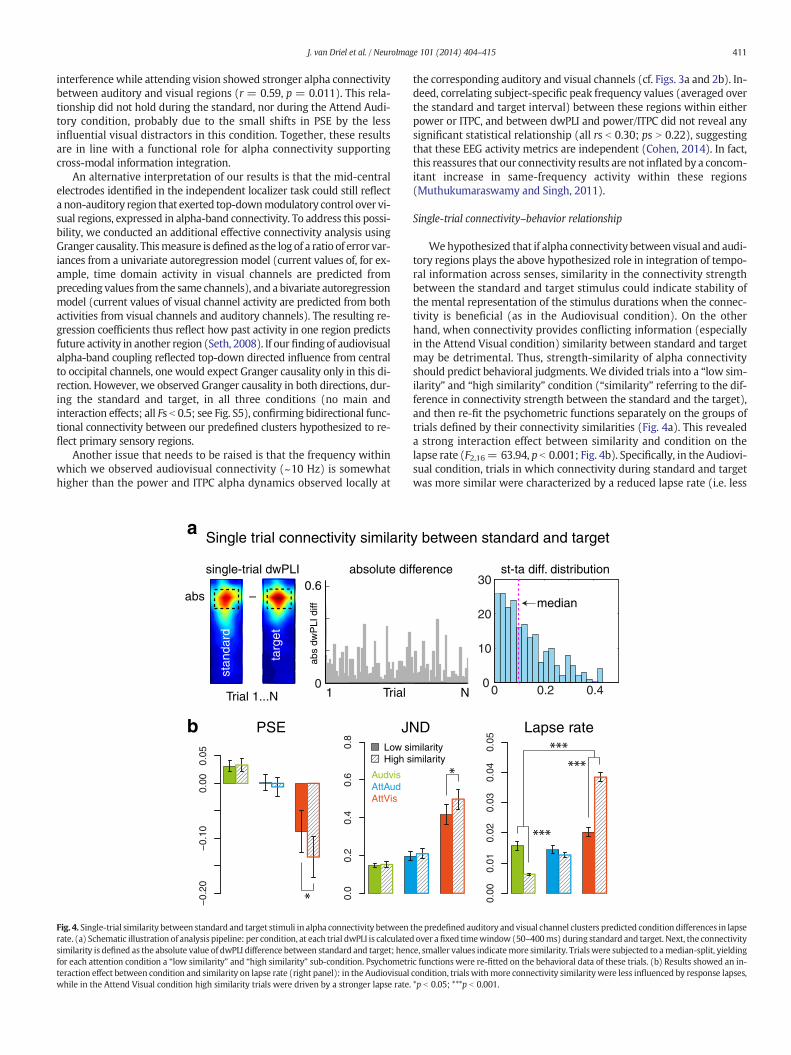
Fig. 4. Single-trial similarity between standard and target stimuli in alpha connectivity betweenrate. (a) Schematic illustration of analysis pipeline: per condition, at each trial dwPLI is calculatedsimilarity is defined as the absolute value of dwPLI difference between standard and target; henfor each attention condition a “low similarity” and “high similarity” sub-condition. Psychometrteraction effect between condition and similarity on lapse rate (right panel): in the Audiovisualwhile in the Attend Visual condition high similarity trials were driven by a stronger lapse rate.
the corresponding auditory and visual channels (cf. Figs. 3a and 2b). In-deed, correlating subject-specific peak frequency values (averaged overthe standard and target interval) between these regions within eitherpower or ITPC, and between dwPLI and power/ITPC did not reveal anysignificant statistical relationship (all rs b 0.30; ps N 0.22), suggestingthat these EEG activity metrics are independent (Cohen, 2014). In fact,this reassures that our connectivity results are not inflated by a concom-itant increase in same-frequency activity within these regions(Muthukumaraswamy and Singh, 2011).
Single-trial connectivity–behavior relationship
Wehypothesized that if alpha connectivity between visual and audi-tory regions plays the above hypothesized role in integration of tempo-ral information across senses, similarity in the connectivity strengthbetween the standard and target stimulus could indicate stability ofthe mental representation of the stimulus durations when the connec-tivity is beneficial (as in the Audiovisual condition). On the otherhand, when connectivity provides conflicting information (especiallyin the Attend Visual condition) similarity between standard and targetmay be detrimental. Thus, strength-similarity of alpha connectivityshould predict behavioral judgments. We divided trials into a “low sim-ilarity” and “high similarity” condition (“similarity” referring to the dif-ference in connectivity strength between the standard and the target),and then re-fit the psychometric functions separately on the groups oftrials defined by their connectivity similarities (Fig. 4a). This revealeda strong interaction effect between similarity and condition on thelapse rate (F2,16= 63.94, p b 0.001; Fig. 4b). Specifically, in the Audiovi-sual condition, trials in which connectivity during standard and targetwas more similar were characterized by a reduced lapse rate (i.e. less
ference
N
st-ta diff. distribution
y between standard and target
Lapse rate
0 0.2 0.40
10
20
30
median
D
0.00
0.01
0.02
0.03
0.04
0.05
milarityimilarity
***
***
****
the predefined auditory and visual channel clusters predicted condition differences in lapseover afixed timewindow (50–400ms) during standard and target. Next, the connectivity
ce, smaller values indicatemore similarity. Trialswere subjected to amedian-split, yieldingic functions were re-fitted on the behavioral data of these trials. (b) Results showed an in-condition, trials withmore connectivity similarity were less influenced by response lapses,*p b 0.05; ***p b 0.001.
412 J. van Driel et al. / NeuroImage 101 (2014) 404–415
lapse driven responses; t17= 6.45, p b 0.001). The oppositewas true forthe Attend Visual condition. In general, this condition showed a higherlapse rate (see also Fig. S2b), but the interaction with similarity showedrelatively stronger lapsing for trialswithmore similarity in interregionalalpha connectivity during standard and target (t17=−8.32, p= .025).In addition, although there were nomain and interaction effects of sim-ilaritywith respect to JND and PSE, post-hoc t-tests revealed that only inthe Attend Visual condition both these measures increased in magni-tude for high compared to low similarity trials (PSE: t17 = 2.26, p =0.037; JND: t17 = 2.17, p= 0.045), again reflecting worse performancefor those trials in which audiovisual synchrony was more stable. Thesefindings show that phase coupling of sensory regions in the alpha-band during cross-modal stimuli can provide the ground for perceptualcomparisons, especially when the duration of these stimuli provide acue for integration.
Discussion
Themain aimof this studywas to investigate the electrophysiologicaldynamics of cross-sensory communication during the perception ofmultisensory temporal information. Based on previous literature(Hummel and Gerloff, 2005; Klemen and Chambers, 2012; Senkowskiet al., 2008), we hypothesized that phase synchronization may be a keymechanism bywhich early sensory regions could be transiently coupled,thus providing temporal “windows” of cross-modal integration.
Our results are in line with the above hypothesis: attending to theduration of simultaneously presented auditory and visual stimuli elicit-ed transient bursts of alpha (8–12 Hz) phase synchrony between audi-tory and visual systems.Moreover, when attending to auditory durationwhile ignoring distracting visual duration, the strength of functionalalpha connectivity was reduced, together with reduced behavioral in-terference of the visual distractors. In turn, attending to visual durationwhile ignoring distracting auditory duration showed a degree of audio-visual alpha synchrony that was comparable to attending both modali-ties, andwhich predicted auditory distractor interference: subjects whoexhibited stronger interference also showed stronger interregionalalpha synchrony. In these cases, cross-modal combination of sensory in-formation through coupling between auditory and visual regions thushampered task performance.
Furthermore, we found an interaction between cross-modal atten-tion, tendency of lapsing, and single-trial estimated stability of alphasynchrony. That is, similar connectivity strength across two intervalsprovided sensory evidence for duration comparison, which led tofewer attentional lapses when attending to both modalities withoutdistractors, and tomore attentional lapses when attending to visual tar-gets with auditory distractors. Together, these results point to alphaphase synchrony between sensory regions as a putative neural under-pinning of cross-sensory temporal integration.
Psychophysical evidence of cross-modal integration versus distractorinterference
Using a hierarchical Bayesian modeling approach (Shiffrin et al.,2008) in fitting a psychometric function on the behavioral data ofeach subject, we found strong evidence for the auditory modalitybeing superior over the visual modality in estimating elapsed time.This finding is consistent with a large body of literature implicating au-ditory dominance in timing (Burr et al., 2009; de Haas et al., 2013;Fendrich and Corballis, 2001; Welch and Warren, 1980). Specifically,the psychophysical parameters of just-noticeable difference and lapserate did not differ between the Audiovisual and Attend Auditory condi-tions, and performance was clearly compromised in the Attend Visualcondition only. This could be explained by subjects relying exclusivelyon the auditory modality, even in the Audiovisual condition thatallowed for temporal integration (because of absence of irrelevant anddistracting temporal information), and in the Attend Visual condition
leading to biased performance (due to presence of such auditorydistractors). However, given that we found a numerically smaller butstatistically reliable visual distractor interference effect in the AttendAuditory condition, this extreme interpretation is unlikely. Rather, inline with other studies, cross-modal effects in timing are asymmetric(van Wassenhove et al., 2008; Wada et al., 2003), and are task- andcontext-dependent. For example, duration judgment of an auditorystimulus can be influenced by co-occurring visual moving stimuli(Hass et al., 2012). Thus, when confronted with simultaneousmultisen-sory input, even though one modality is in general superior over theother, cross-modal interactions seem to be ubiquitous but may vary indegree.
Long-range alpha-band phase synchronization reflected low-level sensoryinteractions
Our EEG findings of interregional alpha phase coupling confirmedthat cross-modal interaction in situations of bimodal stimuli is a robustphenomenon. Indeed, phase synchrony was present in all conditionsand was strongly concentrated in the alpha-band, reflecting continuouscross-talk between our a priori localized sensory regions. This generalfinding fits within the proposed framework of “binding through coher-ence” (Engel et al., 1999; Fries, 2005; von derMalsburg, 1995), and addsto accumulating evidence that synchronized phase dynamics across re-gions may be a key mechanism of integration (Klemen and Chambers,2012; Sarko et al., 2013; Senkowski et al., 2008).
The frequency bands implicated in cross-modal integration varyfrom delta (Luo et al., 2010; Sakowitz et al., 2005) up to gamma(Doesburg et al., 2008; Kanayama et al., 2007), and phase synchroniza-tion effects have been found across a wide range of paradigms, record-ing techniques and data analyses (for a review, see Senkowski et al.,2008). Thus, interregional phase synchrony is a likely candidate forthe role of a general integration principle, where the exact frequencyband could be highly task-specific. Here, we exclusively observed con-nectivity effects in the alpha-band, after using the conservative methodof the phase-lag index (Stam et al., 2007; Vinck et al., 2011). A growingbody of findings has tied decreases in local alpha power to suppressionof task-irrelevant activity, and local alpha phase coherence to “pulsedgating” of task-relevant activity, in perceptual and attentional tasks(Klimesch et al., 2007; Mathewson et al., 2009; Spaak et al., 2014). Re-cently it has been shown that these local effects need not be restrictedto visual or sensorimotor cortex, but extend to auditory regions in thecase of auditory stimuli (Mazaheri et al., 2014). In relation to multisen-sory processing, research has revealed that sound-locked periodicity inperception of TMS-induced visual phosphenes follows the alpharhythm, which correlates with EEG alpha activity (Romei et al., 2012).Such alpha-phase-driven audiovisual interactions may even arise withtask-irrelevant acoustic noise facilitating visual perception (Gleiss andKayser, 2014), highlighting the automaticity and ubiquitousness ofongoing time-dependent coupling of the auditory and visual domain.Although fewer studies have investigated long-range interactions inalpha phase synchrony (Palva and Palva, 2011), an earlier study(Hummel and Gerloff, 2005) linked cross-site alpha synchrony tovisuotactile integration. Moreover, more recent studies (Cohen andvan Gaal, 2012; van Driel et al., 2012; Wang et al., 2012) have shownalpha phase synchrony to reflect large-scale functional network interac-tions. Our study is in accordance with such a coordinating active role ofalpha phase synchrony, linking it to cross-modal attention effects andpsychophysical performance.
Alpha synchrony predicted psychophysical performance within- andacross-subjects
Alpha phase synchrony correlated with task performance: subjectswith stronger audiovisual connectivity were more susceptible to audi-tory interference. This provides evidence that interregional phase
413J. van Driel et al. / NeuroImage 101 (2014) 404–415
synchrony automatically boosts multimodal integration also in situa-tions when the information from the irrelevant modality is distracting.That is, in our task the behavioral decision of visual target durationwas influenced by auditory distractor duration, which was in turn pre-dicted by increased audiovisual alpha synchrony. To our knowledge,this is the first direct demonstration that interregional synchrony cannot only aid, but also hurt behavior. For example, visuotactile gamma-band (40–50 Hz) phase synchrony has been shown to decrease duringsituations of spatial incongruency between visual and somatosensorystimuli in the rubber–hand illusion (Kanayama et al., 2007). Thus, anovel prediction from our study is that stronger interregional synchro-ny in incongruent bimodal conditions would lead to worse taskperformance.
Our single-trial connectivity analysis further strengthened the roleof interregional synchrony in information integration. Specifically, intheAttendVisual condition, trials inwhich connectivity during the stan-dard stimulus was more similar to connectivity during the target stim-ulus, were more likely to result in lapse-driven responses, possiblythrough the distracting influence of the superior auditory modality intiming. Importantly, in our study we estimated a “latent” lapse rate pa-rameterwith a Bayesianmodel, similar to previous studies in thefield ofpsychophysics (Prins, 2012; Wichmann and Hill, 2001). To our knowl-edge, this is the first study that directly links such a psychometriclapse rate to a neurophysiological process that involves interregionalfunctional connectivity. This provides an intriguing new hypothesisthat adds to the current debate in the literature onwhat neurocognitive,or psychological process the lapse rate might capture (Prins, 2012,2013), where the discussion has mostly focussed on how the inclusionof a lapse rate parameter influences the model fit (Klein, 2001;Treutwein and Strasburger, 1999). Interestingly, lapses in sustained at-tention to a task have been studied in the cognitive neuroscientific liter-ature (O'Connell et al., 2009; Weissman et al., 2006), and have beenlinked to posterior alpha power dynamics (Macdonald et al., 2011;van Driel et al., 2012). It is thus an exciting topic for future research tofurther investigate the relationship between psychometric lapsing andneural mechanisms of lapses in attention.
Local oscillatory dynamics of power and inter-trial phase clustering
In addition to interregional connectivity dynamics, we observedlocal power fluctuations as well, most notably in the theta-band (4–8 Hz). A right-lateralized parieto-occipital region showed increasedtheta power in the Attend Visual condition. This is consistent withthe idea that right-parietal networks subserve the representationof temporal information of visual events (Battelli et al., 2007;Guggisberg et al., 2011; Wiener et al., 2012). Furthermore, theAttend Visual condition showed increased local alpha phase clus-tering over occipital sites. As described above, local alpha phase dy-namics may reflect the resetting of ongoing alpha oscillations,resulting in rhythmic pulses of inhibitory activity (Jensen andMazaheri, 2010) which supports periodic attentional sampling(Busch and VanRullen, 2010; VanRullen et al., 2011). Here, weshow that this effect is increased in a condition where attention isdirected at visual duration with concurrent auditory distractors.
Anatomy of audiovisual integration
Our findings of interregional alpha synchrony are based on an EEGmetric of functional connectivity at the scalp level. Although thephase-lag index effectively rules out the possibility of spurious synchro-ny due to volume conducted activity of a single source (Nunez et al.,1997; Stam et al., 2007), we cannot conclude that our obtained resultsunambiguously reflect direct cortico-cortical connectivity, or whetheran underlying subcortical structure is actually driving this coupling ina functional way. Several studies have pointed to thalamic nuclei(Lakatos et al., 2007) such as the pulvinar (Saalmann et al., 2012) to
regulate cortico-cortical electrophysiological connectivity, possiblythrough direct anatomical connections (van den Brink et al., 2013),and specifically modulating the alpha-band (Bollimunta et al., 2011;Hindriks and van Putten, 2013). Concurrent fMRI-EEG in humans, or in-vasive methods in animals, provide intriguing tools to further investi-gate this.
With a task-independent localizer, we found that auditory stimulielicited significant inter-trial phase clustering in the theta-band over amidcentral scalp region, which we thus used for our subsequent con-nectivity analyses. These phase dynamics likely reflected auditoryevoked responses (Thorne et al., 2011), which several studies haveshown to originate in the primary auditory cortex in bilateral Heschl'sgyrus and superior temporal gyrus, and project to central electrodes(Liégeois-Chauvel et al., 1994; Yvert et al., 2005). We believe that thisline of findings validates our choice of functional localizer-basedmidcentral sites as an “auditory” cluster. Future studies investigatingaudiovisual phase synchrony could use, for example, beamformingtechniques to better anatomically localize these interregional couplingdynamics to the corresponding primary cortices in the brain.
Limitations
We observed amain effect of cross-modal attention on interregionalalpha synchrony only during the standard and not during the target. Al-though we did not formulate clear predictions about a difference be-tween the intervals, this result was somewhat surprising. That is, inthe Attend Auditory and Attend Visual conditions, the offset of the tar-get stimulus was different from the offset of the distractor and this dif-ference modulated behavioral performance. One might thus expectreduced audiovisual coupling to be most beneficial around this timewindow, which was not what we found. However, our supplementalseeded synchrony analysis did reveal a qualitatively similar (thoughnon-significant) pattern of condition differences in audiovisual connec-tivity during target (see Supplemental Figures). Moreover, the signifi-cant correlation between synchrony and distractor interference wasevaluated over the average activity during target intervals, where syn-chrony during the standard did not show such a relationship. Lastly,our finding of a single-trial relationship between connectivity and thelapse rate was based on a “stability”metric defined as similarity in con-nectivity between standard and target. On the other hand, our resultsmay partly reflect that effective encoding of the standard stimulus is rel-atively more important for the comparison judgment, and that its neu-ral signature can be manipulated by modality-specific attentioninstructions. Relatedly, the fact thatwe used a constant 500ms standardwhile only varying the target may be a design weakness, as it is hard toknow whether subjects internalized an implicit, remembered standardover many trials, or whether they directly compared each target toeach preceding standard trial-by-trial. Future work could vary the stan-dard length as well.
Another possible limitation is that given our a priori defined clustersof auditory and visual channels that were based on an orthogonallocalizer task, another cortical (“supramodal”) region could have servedas a top-down node (Siegel et al., 2012), which may have gone unde-tected. Indeed, alpha-band phase synchrony may be an importantmechanism with which fronto-parietal regions modulate lower-levelregions in a top-down manner (Palva and Palva, 2011). However, inour seeded-synchrony topographical analysis we specifically observedconnectivity patterns between regions that were consistent with ourlocalizer-based findings. In addition, our control analysis of Grangercausality confirmed that our obtained audiovisual interactions were bi-directional in nature. Moreover, there is growing agreement in the liter-ature that cross-modal integration processes can occur at earlier stagesof sensory processing by direct communication between primary per-ceptual cortices (Ghazanfar and Schroeder, 2006). Our current studyadds to this notion.
414 J. van Driel et al. / NeuroImage 101 (2014) 404–415
Conclusions
Simultaneously presented stimuli of differentmodalities are likely tobelong together when their durations match. In this study, we showedthat alpha phase synchrony between auditory and visual regions is a ro-bust phenomenon that supports the integration of such a temporalmatch when attending to audiovisual durations. Our findings supportthe view of multisensory processing being non-hierarchical, wheresensory regions can be directly coupled through phase-synchronizedoscillations. In addition, we were able to show that this connectivityfluctuated depending on whether attention was directed to onemodal-ity or both. Studying long-range, in addition to local, neurophysiologicalinteractions thus provides a key avenue for advancing our understand-ing of how spatially segregated regions in the brain continuously inte-grate a continuously changing environment.
Acknowledgments
J. v. D. andM.X. C. are, and the presentworkwas, supported by a Vidigrant from theNetherlands Organisation for Scientific Research (NWO),awarded to M. X. C. (452-09-003). The authors thank Eric-JanWagenmakers and Ruud Wetzels for assistance in developing theBayesian graphical model, and the reviewers, Marlies Vissers, and Rich-ard Ridderinkhof for their critical comments on an earlier version of thismanuscript.
Conflict of interest
The authors declare no competing financial interests.
Appendix A. Supplementary data
Supplementary data to this article can be found online at http://dx.doi.org/10.1016/j.neuroimage.2014.07.022.
References
Alais, D., Burr, D., 2004. The ventriloquist effect results from near-optimal bimodal inte-gration. Curr. Biol. 14, 257–262.
Bar, M., Kassam, K.S., Ghuman, A.S., Boshyan, J., Schmid, A.M., Dale, A.M., Hämäläinen, M.S.,Marinkovic, K., Schacter, D.L., Rosen, B.R., Halgren, E., 2006. Top-down facilitation of vi-sual recognition. Proc. Natl. Acad. Sci. U. S. A. 103, 449–454.
Battelli, L., Pascual-Leone, A., Cavanagh, P., 2007. The “when” pathway of the right parietallobe. Trends Cogn. Sci. 11, 204–210.
Bollimunta, A., Mo, J., Schroeder, C.E., Ding, M., 2011. Neuronal mechanisms and atten-tional modulation of corticothalamic α oscillations. J. Neurosci. 31, 4935–4943.
Buhusi, C.V., Meck, W.H., 2005. What makes us tick? Functional and neural mechanismsof interval timing. Nat. Rev. Neurosci. 6, 755–765.
Burr, D., Banks, M.S., Morrone, M.C., 2009. Auditory dominance over vision in the percep-tion of interval duration. Exp. Brain Res. 198, 49–57.
Busch, N.A., VanRullen, R., 2010. Spontaneous EEG oscillations reveal periodic sampling ofvisual attention. Proc. Natl. Acad. Sci. U. S. A. 107, 16048–16053.
Cavanagh, J.F., Frank, M.J., Klein, T.J., Allen, J.J.B., 2010. Frontal theta links prediction errorsto behavioral adaptation in reinforcement learning. NeuroImage 49, 3198–3209.
Cohen, M.X., 2014. Analyzing Neural Time Series Data: Theory and Practice. The MITPress, Cambridge.
Cohen, M.X., van Gaal, S., 2012. Dynamic interactions between large-scale brain networkspredict behavioral adaptation after perceptual errors. Cereb. Cortex 23, 1061–1072.
de Haas, B., Cecere, R., Cullen, H., Driver, J., Romei, V., 2013. The duration of a co-occurringsound modulates visual detection performance in humans. PLoS ONE 8, e54789.
Delorme, A., Makeig, S., 2004. EEGLAB: an open source toolbox for analysis of single-trialEEG dynamics including independent component analysis. J. Neurosci. Methods 134,9–21.
Diederich, A., Schomburg, A., Colonius, H., 2012. Saccadic reaction times to audiovisualstimuli show effects of oscillatory phase reset. PLoS ONE 7, e44910.
Doesburg, S.M., Emberson, L.L., Rahi, A., Cameron, D., Ward, L.M., 2008. Asynchrony fromsynchrony: long-range gamma-band neural synchrony accompanies perception ofaudiovisual speech asynchrony. Exp. Brain Res. 185, 11–20.
Doesburg, S.M., Green, J.J., McDonald, J.J., Ward, L.M., 2009. From local inhibition to long-range integration: a functional dissociation of alpha-band synchronization across cor-tical scales in visuospatial attention. Brain Res. 1303, 97–110.
Driver, J., Spence, C., 1998. Cross-modal links in spatial attention. Philos. Trans. R. Soc.Lond. B Biol. Sci. 353, 1319–1331.
Driver, J., Spence, C., 2000.Multisensory perception: beyondmodularity and convergence.Curr. Biol. 10, R731–R735.
Engel, A.K., Fries, P., König, P., Brecht, M., Singer, W., 1999. Temporal binding, binocular ri-valry, and consciousness. Conscious. Cogn. 8, 128–151.
Fendrich, R., Corballis, P.M., 2001. The temporal cross-capture of audition and vision. Per-cept. Psychophys. 63, 719–725.
Foxe, J.J., Morocz, I.A., Murray, M.M., Higgins, B.A., Javitt, D.C., Schroeder, C.E., 2000. Mul-tisensory auditory–somatosensory interactions in early cortical processing revealedby high-density electrical mapping. Cogn. Brain Res. 10, 77–83.
Fries, P., 2005. A mechanism for cognitive dynamics: neuronal communication throughneuronal coherence. Trends Cogn. Sci. 9, 474–480.
Ghazanfar, A.A., Chandrasekaran, C.F., 2007. Paving the way forward: integrating thesenses through phase-resetting of cortical oscillations. Neuron 53, 162–164.
Ghazanfar, A.A., Schroeder, C.E., 2006. Is neocortex essentially multisensory? Trends Cogn.Sci. 10, 278–285.
Giard, M.H., Peronnet, F., 1999. Auditory–visual integration duringmultimodal object rec-ognition in humans: a behavioral and electrophysiological study. J. Cogn. Neurosci.11, 473–490.
Gibbon, J., 1977. Scalar expectancy theory andWeber's law in animal timing. Psychol. Rev.84, 279–325.
Gleiss, S., Kayser, C., 2014. Acoustic noise improves visual perception and modulates oc-cipital oscillatory states. J. Cogn. Neurosci. 26, 699–711.
Grondin, S., 2010. Timing and time perception: a review of recent behavioral andneuroscience findings and theoretical directions. Atten. Percept. Psychophys. 72,561–582.
Guggisberg, A.G., Dalal, S.S., Schnider, A., Nagarajan, S.S., 2011. The neural basis of event-time introspection. Conscious. Cogn. 20, 1899–1915.
Hass, J., Blaschke, S., Herrmann, J.M., 2012. Cross-modal distortion of time perception:demerging the effects of observed and performed motion. PLoS ONE 7, e38092.
Hindriks, R., van Putten, M.J.A.M., 2013. Thalamo-cortical mechanisms underlyingchanges in amplitude and frequency of human alpha oscillations. NeuroImage 70,150–163.
Hummel, F., Gerloff, C., 2005. Larger interregional synchrony is associated with greaterbehavioral success in a complex sensory integration task in humans. Cereb. Cortex15, 670–678.
Jaekl, P.M., Harris, L.R., 2007. Auditory–visual temporal integration measured by shifts inperceived temporal location. Neurosci. Lett. 417, 219–224.
Jensen, O., Mazaheri, A., 2010. Shaping functional architecture by oscillatory alpha activi-ty: gating by inhibition. Front. Hum. Neurosci. 4, 186.
Kanayama, N., Sato, A., Ohira, H., 2007. Crossmodal effect with rubber hand illusion andgamma-band activity. Psychophysiology 44, 392–402.
Kayser, C., Logothetis, N.K., 2007. Do early sensory cortices integrate cross-modal infor-mation? Brain Struct. Funct. 212, 121–132.
Kayser, J., Tenke, C.E., 2006. Principal components analysis of Laplacian waveforms as ageneric method for identifying ERP generator patterns: I. Evaluation with auditoryoddball tasks. Clin. Neurophysiol. 117, 348–368.
Kayser, C., Petkov, C.I., Logothetis, N.K., 2008. Visual modulation of neurons in auditorycortex. Cereb. Cortex 18, 1560–1574.
Keetels, M., Vroomen, J., 2007. No effect of auditory–visual spatial disparity on temporalrecalibration. Exp. Brain Res. 182, 559–565.
Klein, S.A., 2001. Measuring, estimating, and understanding the psychometric function: acommentary. Percept. Psychophys. 63, 1421–1455.
Klemen, J., Chambers, C.D., 2012. Current perspectives and methods in studying neuralmechanisms of multisensory interactions. Neurosci. Biobehav. Rev. 36, 111–133.
Klimesch, W., Sauseng, P., Hanslmayr, S., 2007. EEG alpha oscillations: the inhibition-timing hypothesis. Brain Res. Rev. 53, 63–88.
Kuss, M., Jäkel, F., Wichmann, F.A., 2005. Bayesian inference for psychometric functions. J.Vis. 5, 478–492.
Lakatos, P., Chen, C.-M., O'Connell, M.N., Mills, A., Schroeder, C.E., 2007. Neuronal oscilla-tions and multisensory interaction in primary auditory cortex. Neuron 53, 279–292.
Lakatos, P., Connell, M.N.O., Barczak, A., Mills, A., Javitt, D.C., Schroeder, C.E., 2009. Theleading sense: supramodal control of neurophysiological context by attention. Neu-ron 64, 419–430.
Lee, M.D., Wagenmakers, E.-.J., 2013. Bayesian Graphical Modeling: A Practical Course.University Press, Cambridge.
Leek, M.R., 2001. Adaptive procedures in psychophysical research. Percept. Psychophys.63, 1279–1292.
Lewis, P.A., Miall, R.C., 2003. Distinct systems for automatic and cognitively controlledtimemeasurement: evidence fromneuroimaging. Curr. Opin. Neurobiol. 13, 250–255.
Liégeois-Chauvel, C., Musolino, A., Badier, J.M., 1994. Evoked potentials recorded from theauditory cortex in man: evaluation and topography of the middle latency compo-nents. Electroencephalogr. Clin. Neurophysiol. 92, 204–214.
Luo, H., Liu, Z., Poeppel, D., 2010. Auditory cortex tracks both auditory and visual stimulusdynamics using low-frequency neuronal phase modulation. PLoS Biol. 8, e1000445.
Macaluso, E., Driver, J., 2005. Multisensory spatial interactions: a window onto functionalintegration in the human brain. Trends Neurosci. 28, 264–271.
Macdonald, J.S., Mathan, S., Yeung, N., 2011. Trial-by-trial variations in subjective atten-tional state are reflected in ongoing prestimulus EEG alpha oscillations. Front.Psychol. 2, 82.
Maris, E., Oostenveld, R., 2007. Nonparametric statistical testing of EEG- and MEG-data. J.Neurosci. Methods 164, 177–190.
Martuzzi, R., Murray, M.M., Michel, C.M., Thiran, J.P., Maeder, P.P., Clarke, S., Meuli, R.A.,2007. Multisensory interactions within human primary cortices revealed by BOLDdynamics. Cereb. Cortex 17, 1672–1679.
Mathewson, K.E., Gratton, G., Fabiani, M., Beck, D.M., Ro, T., 2009. To see or not to see:prestimulus alpha phase predicts visual awareness. J. Neurosci. 29, 2725–2732.

415J. van Driel et al. / NeuroImage 101 (2014) 404–415
Mazaheri, A., van Schouwenburg, M., Dimitrijevic, A., Denys, D., Cools, R., Jensen, O., 2014.Region-specific modulations in oscillatory alpha activity serve to facilitate processingin the visual and auditory modalities. NeuroImage 87, 356–362.
McDonald, J.J., Teder-Sälejärvi, W.A., Hillyard, S.A., 2000. Involuntary orienting to soundimproves visual perception. Nature 407, 906–908.
McGurk, H., MacDonald, J., 1976. Hearling lips and seeing voices. Nature 264, 746–748.Meredith, M.A., Stein, B.E., 1983. Interactions among converging sensory inputs in the
superior colliculus. Science 221, 389–391.Molholm, S., Ritter, W., Murray, M.M., Javitt, D.C., Schroeder, C.E., Foxe, J.J., 2002. Multisen-
sory auditory–visual interactions during early sensory processing in humans: a high-density electrical mapping study. Cogn. Brain Res. 14, 115–128.
Muthukumaraswamy, S.D., Singh, K.D., 2011. A cautionary note on the interpretation ofphase-locking estimates with concurrent changes in power. Clin. Neurophysiol.122, 2324–2325.
Ntzoufras, I., 2009. Bayesian Modeling Using WinBUGS. Wiley, Hoboken, NJ.Nunez, P.L., Srinivasan, R., Westdorp, A.F., 1997. EEG coherency: I: statistics, reference
electrode, volume conduction, Laplacians, cortical imaging, and interpretation atmul-tiple scales. Electroencephalogr. Clin. Neurophysiol. 103, 499–515.
O'Connell, R.G., Dockree, P.M., Robertson, I.H., Bellgrove, M.A., Foxe, J.J., Kelly, S.P., 2009.Uncovering the neural signature of lapsing attention: electrophysiological signalspredict errors up to 20 s before they occur. J. Neurosci. 29, 8604–8611.
Oostendorp, T.F., Oosterom, A., 1996. The surface Laplacian of the potential: theory andapplication. IEEE Trans. Biomed. Eng. 43, 394–405.
Oostenveld, R., Fries, P., Maris, E., Schoffelen, J.-M., 2011. FieldTrip: open source softwarefor advanced analysis of MEG, EEG, and invasive electrophysiological data. Comput.Intell. Neurosci. 156869, 1–9.
Palva, S., Palva, J.M., 2007. New vistas for alpha-frequency band oscillations. TrendsNeurosci. 30, 150–158.
Palva, S., Palva, J.M., 2011. Functional roles of alpha-band phase synchronization in localand large-scale cortical networks. Front. Psychol. 2, 204.
Palva, J.M., Palva, S., Kaila, K., 2005. Phase synchrony among neuronal oscillations in thehuman cortex. J. Neurosci. 25, 3962–3972.
Perrin, F., Pernier, J., Bertrand, O., Echallier, J.F., 1989. Spherical splines for scalp potentialand current density mapping. Electroencephalogr. Clin. Neurophysiol. 72, 184–187.
Pick Jr., H.L., Warren, D.H., Hay, J.C., 1969. Sensory conflicts in judgments of spatialdirection. Percept. Psychophys. 6, 203–205.
Prins, N., 2012. The psychometric function: the lapse rate revisited. J. Vis. 12, 25–40.Prins, N., 2013. The psi-marginal adaptive method: how to give nuisance parameters the
attention they deserve (no more, no less). J. Vis. 13, 3–19.Romei, V., Gross, J., Thut, G., 2012. Sounds reset rhythms of visual cortex and correspond-
ing human visual perception. Curr. Biol. 22, 807–813.Rouder, J.N., Lu, J., 2005. An introduction to Bayesian hierarchical models with an applica-
tion in the theory of signal detection. Psychon. Bull. Rev. 12, 573–604.Saalmann, Y.B., Pinsk, M.A., Wang, L., Li, X., Kastner, S., 2012. The pulvinar regulates infor-
mation transmission between cortical areas based on attention demands. Science337, 753–756.
Sakowitz, O.W., Quian Quiroga, R., Schürmann, M., Başar, E., 2005. Spatio-temporal fre-quency characteristics of intersensory components in audiovisually evoked poten-tials. Cogn. Brain Res. 23, 316–326.
Sarko, D.K., Ghose, D., Wallace, M.T., 2013. Convergent approaches toward the study ofmultisensory perception. Front. Syst. Neurosci. 7, 81.
Senkowski, D., Schneider, T.R., Foxe, J.J., Engel, A.K., 2008. Crossmodal binding through neuralcoherence: implications for multisensory processing. Trends Neurosci. 31, 401–409.
Seth, A.K., 2008. Causal networks in simulated neural systems. Cogn. Neurodyn. 2, 49–64.Shiffrin, R.M., Lee, M.D., Kim,W.,Wagenmakers, E.-J., 2008. A survey of model evaluation ap-
proaches with a tutorial on hierarchical Bayesian methods. Cogn. Sci. 32, 1248–1284.Siegel, M., Donner, T.H., Engel, A.K., 2012. Spectral fingerprints of large-scale neuronal in-
teractions. Nat. Rev. Neurosci. 13, 121–134.Spaak, E., de Lange, F.P., Jensen, O., 2014. Local entrainment of alpha oscillations by visual
stimuli causes cyclic modulation of perception. J. Neurosci. 34, 3536–3544.Srinivasan, R., Winter, W.R., Ding, J., Nunez, P.L., 2007. EEG andMEG coherence: measures
of functional connectivity at distinct spatial scales of neocortical dynamics. J.Neurosci. Methods 166, 41–52.
Stam, C.J., Nolte, G., Daffertshofer, A., 2007. Phase lag index: assessment of functional con-nectivity from multi channel EEG and MEG with diminished bias from commonsources. Hum. Brain Mapp. 28, 1178–1193.
Stein, B.E., Stanford, T.R., 2008. Multisensory integration: current issues from the perspec-tive of the single neuron. Nat. Rev. Neurosci. 9, 255–266.
Thorne, J.D., De Vos, M., Viola, F.C., Debener, S., 2011. Cross-modal phase reset predicts au-ditory task performance in humans. J. Neurosci. 31, 3853–3861.
Treutwein, B., Strasburger, H., 1999. Fitting the psychometric function. Percept.Psychophys. 61, 87–106.
van den Brink, R.L., Cohen, M.X., Van der Burg, E., Talsma, D., Vissers, M.E., Slagter, H.A.,2013. Subcortical, modality-specific pathways contribute to multisensory processingin humans. Cereb. Cortex. http://dx.doi.org/10.1093/cercor/bht069.
van Driel, J., Ridderinkhof, K.R., Cohen, M.X., 2012. Not all errors are alike: theta and alphaEEG dynamics relate to differences in error-processing dynamics. J. Neurosci. 32,16795–16806.
van Driel, J., Lee, M.D., Wagenmaker, E.-.J., 2013. Psychophysical functions. In: Lee, M.D.,Wagenmakers, E.-J. (Eds.), Bayesian Cognitive Modeling: A Practical Course. Universi-ty Press, Cambridge, pp. 168–175.
van Wassenhove, V., Buonomano, D.V., Shimojo, S., Shams, L., 2008. Distortions of subjec-tive time perception within and across senses. PLoS ONE 3, e1437.
VanRullen, R., Busch, N.A., Drewes, J., Dubois, J., 2011. Ongoing EEG phase as a trial-by-trial predictor of perceptual and attentional variability. Front. Psychol. 2, 60.
Varela, F., Lachaux, J.P., Rodriguez, E., Martinerie, J., 2001. The brainweb: phase synchroni-zation and large-scale integration. Nat. Rev. Neurosci. 2, 229–239.
Vinck, M., Oostenveld, R., van Wingerden, M., Battaglia, F., Pennartz, C.M.A., 2011. Animproved index of phase-synchronization for electrophysiological data in thepresence of volume-conduction, noise and sample-size bias. NeuroImage 55,1548–1565.
von der Malsburg, C., 1995. Binding in models of perception and brain function. Curr.Opin. Neurobiol. 5, 520–526.
von Stein, A., Rappelsberger, P., Sarnthein, J., Petsche, H., 1999. Synchronization betweentemporal and parietal cortex during multimodal object processing in man. Cereb.Cortex 9, 137–150.
Wada, Y., Kitagawa, N., Noguchi, K., 2003. Audio-visual integration in temporal percep-tion. Int. J. Psychophysiol. 50, 117–124.
Wang, L., Saalmann, Y.B., Pinsk, M.A., Arcaro, M.J., Kastner, S., 2012. Electrophysiologicallow-frequency coherence and cross-frequency coupling contribute to BOLD connec-tivity. Neuron 76, 1010–1020.
Ward, L.M., 2003. Synchronous neural oscillations and cognitive processes. Trends Cogn.Sci. 7, 553–559.
Weissman, D.H., Roberts, K.C., Visscher, K.M., Woldorff, M.G., 2006. The neural bases ofmomentary lapses in attention. Nat. Neurosci. 9, 971–978.
Welch, R.B., Warren, D.H., 1980. Immediate perceptual response to intersensory discrep-ancy. Psychol. Bull. 88, 638–667.
Wichmann, F.A., Hill, N.J., 2001. The psychometric function: I. Fitting, sampling, and good-ness of fit. Percept. Psychophys. 63, 1293–1313.
Wiener, M., Kliot, D., Turkeltaub, P.E., Hamilton, R.H., Wolk, D.A., Coslett, H.B., 2012. Pari-etal influence on temporal encoding indexed by simultaneous transcranial magneticstimulation and electroencephalography. J. Neurosci. 32, 12258–12267.
Winter, W.R., Nunez, P.L., Ding, J., Srinivasan, R., 2007. Comparison of the effect of volumeconduction on EEG coherence with the effect of field spread on MEG coherence. Stat.Med. 26, 3946–3957.
Womelsdorf, T., Schoffelen, J.M., Oostenveld, R., Singer, W., Desimone, R., Engel, A.K., Fries,P., 2007. Modulation of neuronal interactions through neuronal synchronization. Sci-ence 316, 1609–1612.
Yang, W., Li, Q., Ochi, T., Yang, J., Gao, Y., Tang, X., Takahashi, S., Wu, J., 2013. Effects of au-ditory stimuli in the horizontal plane on audiovisual integration: an event-related po-tential study. PLoS ONE 8, e66402.
Yvert, B., Fischer, C., Bertrand, O., Pernier, J., 2005. Localization of human supratemporalauditory areas from intracerebral auditory evoked potentials using distributed sourcemodels. NeuroImage 28, 140–153.