Materials Selection for Catalyst Supports - TRACE: Tennessee ...
27
University of Tennessee, Knoxville University of Tennessee, Knoxville TRACE: Tennessee Research and Creative TRACE: Tennessee Research and Creative Exchange Exchange Chancellor’s Honors Program Projects Supervised Undergraduate Student Research and Creative Work 5-2016 Materials Selection for Catalyst Supports Materials Selection for Catalyst Supports Connor G. Carr University of Tennessee, Knoxville, [email protected] Brianna L. Musicó University of Tennessee, Knoxville, [email protected] Andre Z. Shibata University of Tennessee, Knoxville, [email protected] Willie Kemp University of Tennessee, Knoxville, [email protected] Follow this and additional works at: https://trace.tennessee.edu/utk_chanhonoproj Part of the Materials Science and Engineering Commons Recommended Citation Recommended Citation Carr, Connor G.; Musicó, Brianna L.; Shibata, Andre Z.; and Kemp, Willie, "Materials Selection for Catalyst Supports" (2016). Chancellor’s Honors Program Projects. https://trace.tennessee.edu/utk_chanhonoproj/1996 This Dissertation/Thesis is brought to you for free and open access by the Supervised Undergraduate Student Research and Creative Work at TRACE: Tennessee Research and Creative Exchange. It has been accepted for inclusion in Chancellor’s Honors Program Projects by an authorized administrator of TRACE: Tennessee Research and Creative Exchange. For more information, please contact [email protected].
-
Upload
khangminh22 -
Category
Documents
-
view
1 -
download
0
Transcript of Materials Selection for Catalyst Supports - TRACE: Tennessee ...

University of Tennessee, Knoxville University of Tennessee, Knoxville
TRACE: Tennessee Research and Creative TRACE: Tennessee Research and Creative
Exchange Exchange
Chancellor’s Honors Program Projects Supervised Undergraduate Student Research and Creative Work
5-2016
Materials Selection for Catalyst Supports Materials Selection for Catalyst Supports
Connor G. Carr University of Tennessee, Knoxville, [email protected]
Brianna L. Musicó University of Tennessee, Knoxville, [email protected]
Andre Z. Shibata University of Tennessee, Knoxville, [email protected]
Willie Kemp University of Tennessee, Knoxville, [email protected]
Follow this and additional works at: https://trace.tennessee.edu/utk_chanhonoproj
Part of the Materials Science and Engineering Commons
Recommended Citation Recommended Citation Carr, Connor G.; Musicó, Brianna L.; Shibata, Andre Z.; and Kemp, Willie, "Materials Selection for Catalyst Supports" (2016). Chancellor’s Honors Program Projects. https://trace.tennessee.edu/utk_chanhonoproj/1996
This Dissertation/Thesis is brought to you for free and open access by the Supervised Undergraduate Student Research and Creative Work at TRACE: Tennessee Research and Creative Exchange. It has been accepted for inclusion in Chancellor’s Honors Program Projects by an authorized administrator of TRACE: Tennessee Research and Creative Exchange. For more information, please contact [email protected].
¹Department of Materials Science & Engineering, University of Tennessee, Knoxville, TN 37996
² Advanced Catalyst Systems, Maryville, TN 37801
Materials Selection for Catalyst Supports
Company: Advanced Catalyst Systems, Maryville, TN
Final Report
C. Carr¹, W. Kemp¹, B. Musicó¹, A. Shibata¹
MSE 489: Capstone Senior Design
May 6, 2016
Advisors:
Chris Wetteland¹
David Keffer¹
Industry Contact:
Greg Wagner²
ii
Acknowledgements
We want to thank our industry contact Dr. Greg Wagner from Advanced Catalyst Systems,
LLC for his patience and extensive cooperation throughout our project. We also wish to express
our gratitude to our advisors Prof. David Keffer and Chris Wetteland from the Materials Science
& Engineering department at The University of Tennessee for their technical assistance and
immense support through our work. We also would like to thank Josh Arnold, J.R. Creekmore,
Matthew Loyd and Josh Turan of 2015’s MSE489 Capstone Senior design for their work with ACS
in characterizing FeCrAl, which our project built upon, as well as Dr. John Dunlap and Dr. Maulik
Patel for their assistance with the focused ion beam and the x-ray diffraction instruments,
respectively.
iii
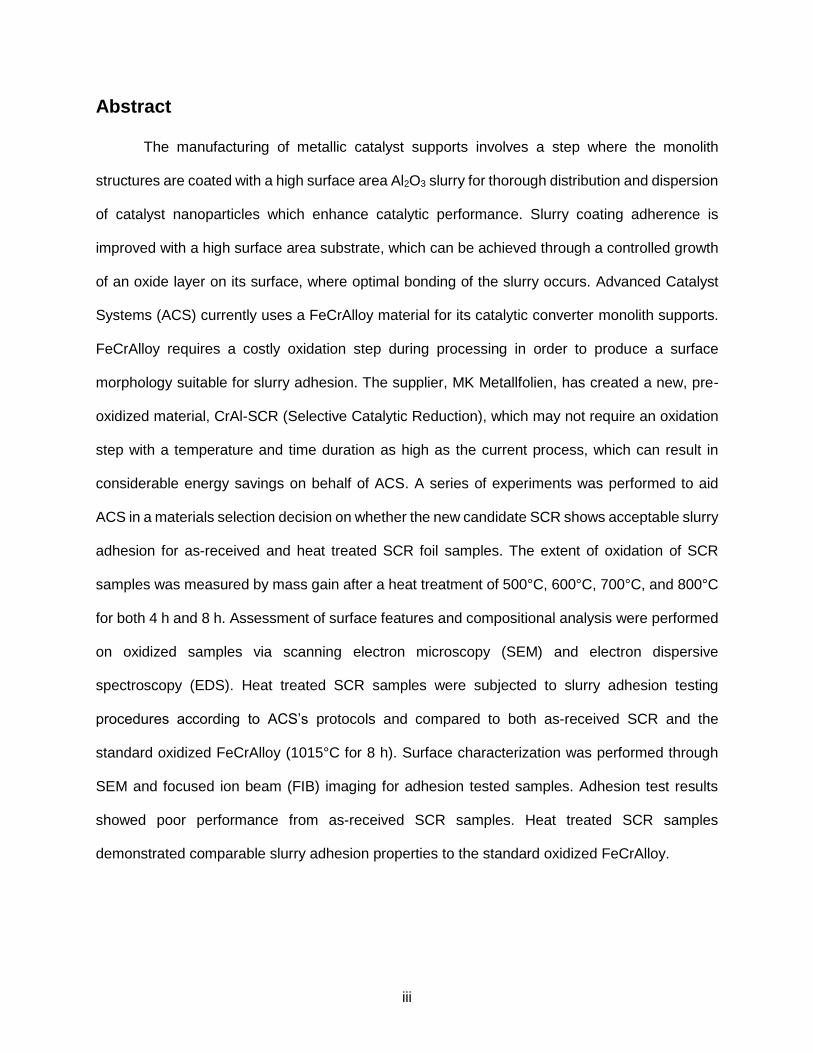
Abstract
The manufacturing of metallic catalyst supports involves a step where the monolith
structures are coated with a high surface area Al2O3 slurry for thorough distribution and dispersion
of catalyst nanoparticles which enhance catalytic performance. Slurry coating adherence is
improved with a high surface area substrate, which can be achieved through a controlled growth
of an oxide layer on its surface, where optimal bonding of the slurry occurs. Advanced Catalyst
Systems (ACS) currently uses a FeCrAlloy material for its catalytic converter monolith supports.
FeCrAlloy requires a costly oxidation step during processing in order to produce a surface
morphology suitable for slurry adhesion. The supplier, MK Metallfolien, has created a new, pre-
oxidized material, CrAl-SCR (Selective Catalytic Reduction), which may not require an oxidation
step with a temperature and time duration as high as the current process, which can result in
considerable energy savings on behalf of ACS. A series of experiments was performed to aid
ACS in a materials selection decision on whether the new candidate SCR shows acceptable slurry
adhesion for as-received and heat treated SCR foil samples. The extent of oxidation of SCR
samples was measured by mass gain after a heat treatment of 500°C, 600°C, 700°C, and 800°C
for both 4 h and 8 h. Assessment of surface features and compositional analysis were performed
on oxidized samples via scanning electron microscopy (SEM) and electron dispersive
spectroscopy (EDS). Heat treated SCR samples were subjected to slurry adhesion testing
procedures according to ACS’s protocols and compared to both as-received SCR and the
standard oxidized FeCrAlloy (1015°C for 8 h). Surface characterization was performed through
SEM and focused ion beam (FIB) imaging for adhesion tested samples. Adhesion test results
showed poor performance from as-received SCR samples. Heat treated SCR samples
demonstrated comparable slurry adhesion properties to the standard oxidized FeCrAlloy.
iv
Table of Contents
Acknowledgements ..................................................................................................................... ii
Abstract...................................................................................................................................... iii
Table of Contents ....................................................................................................................... iv
1. Introduction ......................................................................................................................... 1
1.1. Catalysts and Catalytic Converters .................................................................................. 1
1.2. Advanced Catalyst Systems (ACS) Process .................................................................... 3
1.3. Material Selection for Catalytic converters ....................................................................... 4
1.4. Basis for Materials Testing .............................................................................................. 5
2. Experimental .......................................................................................................................... 7
2.1. Surface Characterization ................................................................................................. 7
2.2. Oxidation Heat Treatment Matrix ..................................................................................... 7
2.3. Slurry Coating Adhesion Test .......................................................................................... 8
2.4. Data Collection and Sample Geometry ............................................................................ 9
3. Results/ Discussion ...............................................................................................................10
3.1. Oxidation Heat Treatment Study .....................................................................................10
3.2. Scanning Electron Micrographs ......................................................................................11
3.3. EDS Line Scan ...............................................................................................................14
3.4. Three-Dimensional Roughness Mapping ........................................................................15
3.5. SCR Structure ................................................................................................................15
3.6. Slurry Coating Adhesion Results ....................................................................................16
3.6.1. Mass gain due to slurry coating ................................................................................17
3.6.2. Mass loss due to agitation .......................................................................................18
3.6.3. Total mass change ...................................................................................................19
3.7. Focused Ion Beam (FIB) Imaging ...................................................................................20
4. Conclusions ..........................................................................................................................21
References ...............................................................................................................................22
1
1. Introduction
1.1. Catalysts and Catalytic Converters
A catalyst is any substance with the ability to speed up the rate of a chemical reaction
without being consumed during the course of the reaction [1]. It is neither a reactant nor a product,
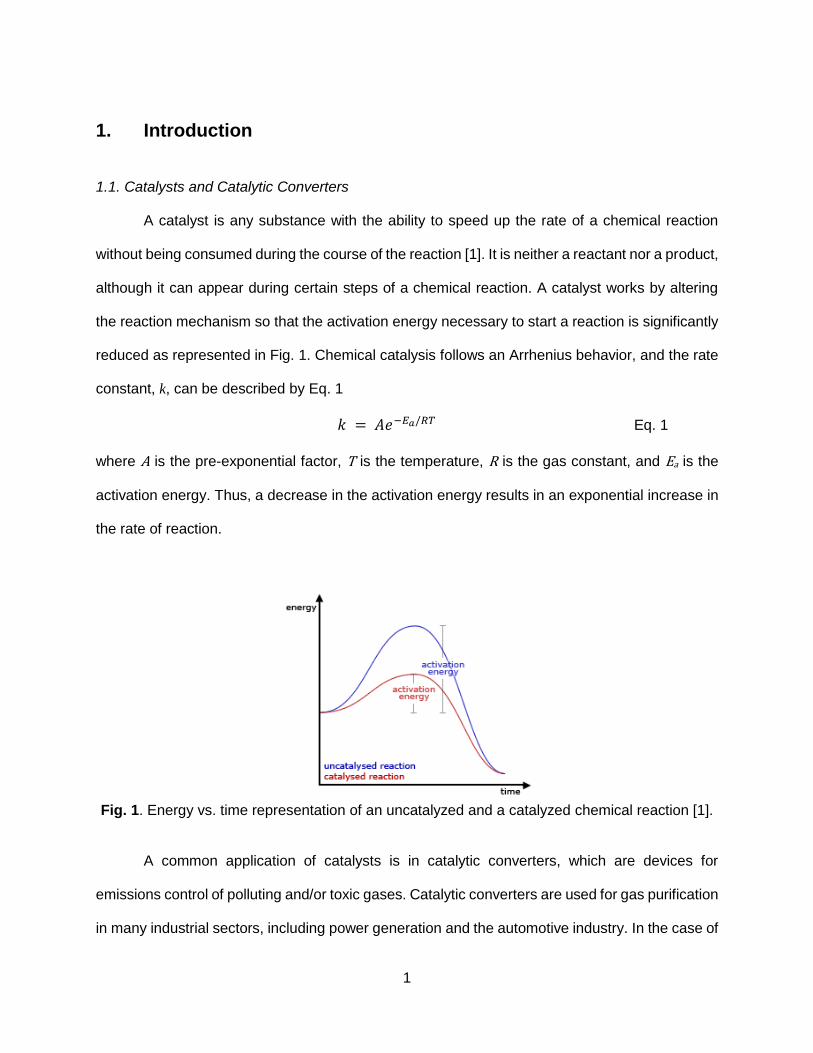
although it can appear during certain steps of a chemical reaction. A catalyst works by altering
the reaction mechanism so that the activation energy necessary to start a reaction is significantly
reduced as represented in Fig. 1. Chemical catalysis follows an Arrhenius behavior, and the rate
constant, k, can be described by Eq. 1
𝑘 = 𝐴𝑒−𝐸𝑎/𝑅𝑇 Eq. 1
where A is the pre-exponential factor, T is the temperature, R is the gas constant, and Ea is the
activation energy. Thus, a decrease in the activation energy results in an exponential increase in
the rate of reaction.
Fig. 1. Energy vs. time representation of an uncatalyzed and a catalyzed chemical reaction [1].
A common application of catalysts is in catalytic converters, which are devices for
emissions control of polluting and/or toxic gases. Catalytic converters are used for gas purification
in many industrial sectors, including power generation and the automotive industry. In the case of
2
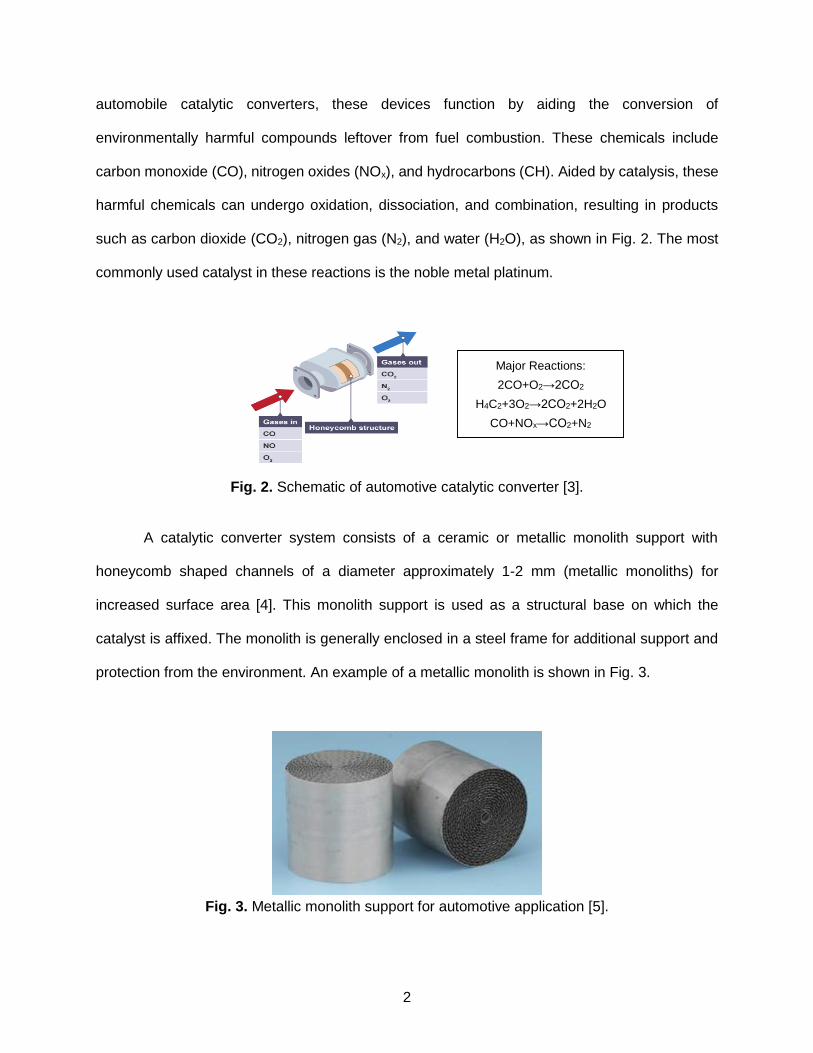
automobile catalytic converters, these devices function by aiding the conversion of
environmentally harmful compounds leftover from fuel combustion. These chemicals include
carbon monoxide (CO), nitrogen oxides (NOx), and hydrocarbons (CH). Aided by catalysis, these
harmful chemicals can undergo oxidation, dissociation, and combination, resulting in products
such as carbon dioxide (CO2), nitrogen gas (N2), and water (H2O), as shown in Fig. 2. The most
commonly used catalyst in these reactions is the noble metal platinum.
Fig. 2. Schematic of automotive catalytic converter [3].
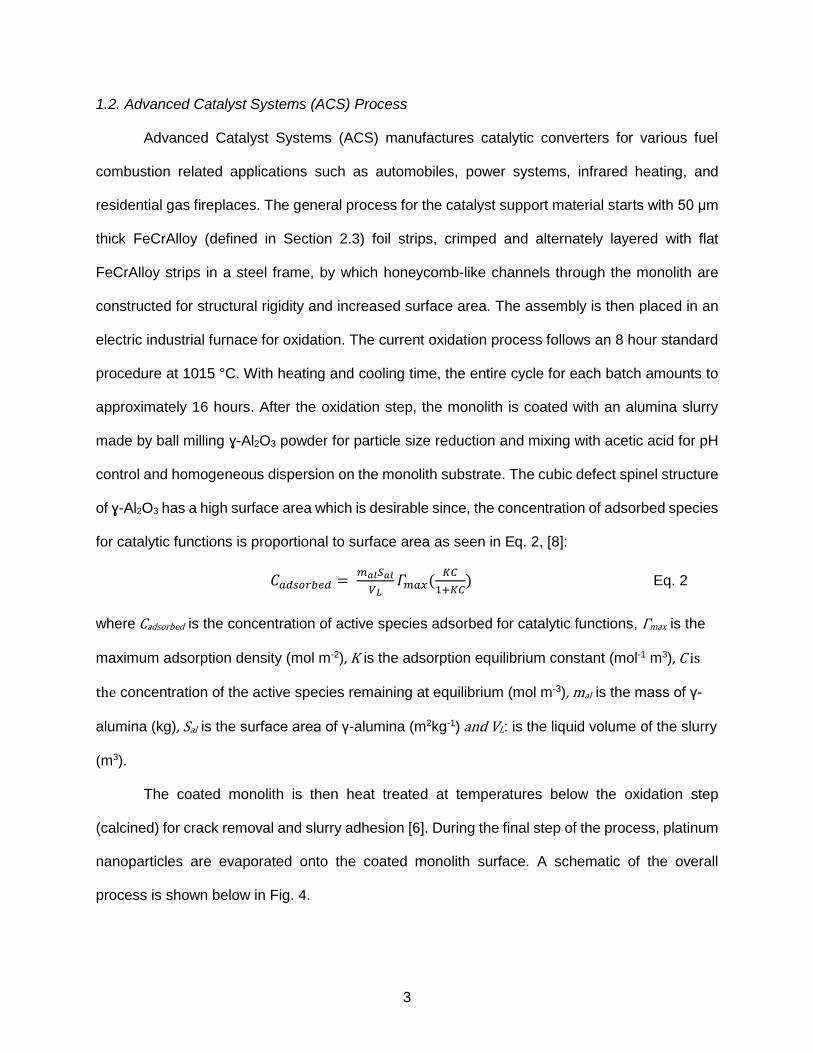
A catalytic converter system consists of a ceramic or metallic monolith support with
honeycomb shaped channels of a diameter approximately 1-2 mm (metallic monoliths) for
increased surface area [4]. This monolith support is used as a structural base on which the
catalyst is affixed. The monolith is generally enclosed in a steel frame for additional support and
protection from the environment. An example of a metallic monolith is shown in Fig. 3.
Fig. 3. Metallic monolith support for automotive application [5].
Major Reactions:
2CO+O2→2CO2
H4C2+3O2→2CO2+2H2O
CO+NOx→CO2+N2
3
1.2. Advanced Catalyst Systems (ACS) Process
Advanced Catalyst Systems (ACS) manufactures catalytic converters for various fuel
combustion related applications such as automobiles, power systems, infrared heating, and
residential gas fireplaces. The general process for the catalyst support material starts with 50 μm
thick FeCrAlloy (defined in Section 2.3) foil strips, crimped and alternately layered with flat
FeCrAlloy strips in a steel frame, by which honeycomb-like channels through the monolith are
constructed for structural rigidity and increased surface area. The assembly is then placed in an
electric industrial furnace for oxidation. The current oxidation process follows an 8 hour standard
procedure at 1015 °C. With heating and cooling time, the entire cycle for each batch amounts to
approximately 16 hours. After the oxidation step, the monolith is coated with an alumina slurry
made by ball milling ɣ-Al2O3 powder for particle size reduction and mixing with acetic acid for pH
control and homogeneous dispersion on the monolith substrate. The cubic defect spinel structure
of ɣ-Al2O3 has a high surface area which is desirable since, the concentration of adsorbed species
for catalytic functions is proportional to surface area as seen in Eq. 2, [8]:
𝐶𝑎𝑑𝑠𝑜𝑟𝑏𝑒𝑑 = 𝑚𝑎𝑙𝑆𝑎𝑙
𝑉𝐿𝛤𝑚𝑎𝑥(
𝐾𝐶
1+𝐾𝐶) Eq. 2
where Cadsorbed is the concentration of active species adsorbed for catalytic functions, Γmax is the
maximum adsorption density (mol m-2), K is the adsorption equilibrium constant (mol-1 m3), C is
the concentration of the active species remaining at equilibrium (mol m-3), mal is the mass of γ-
alumina (kg), Sal is the surface area of γ-alumina (m2kg-1) and VL: is the liquid volume of the slurry
(m3).
The coated monolith is then heat treated at temperatures below the oxidation step
(calcined) for crack removal and slurry adhesion [6]. During the final step of the process, platinum
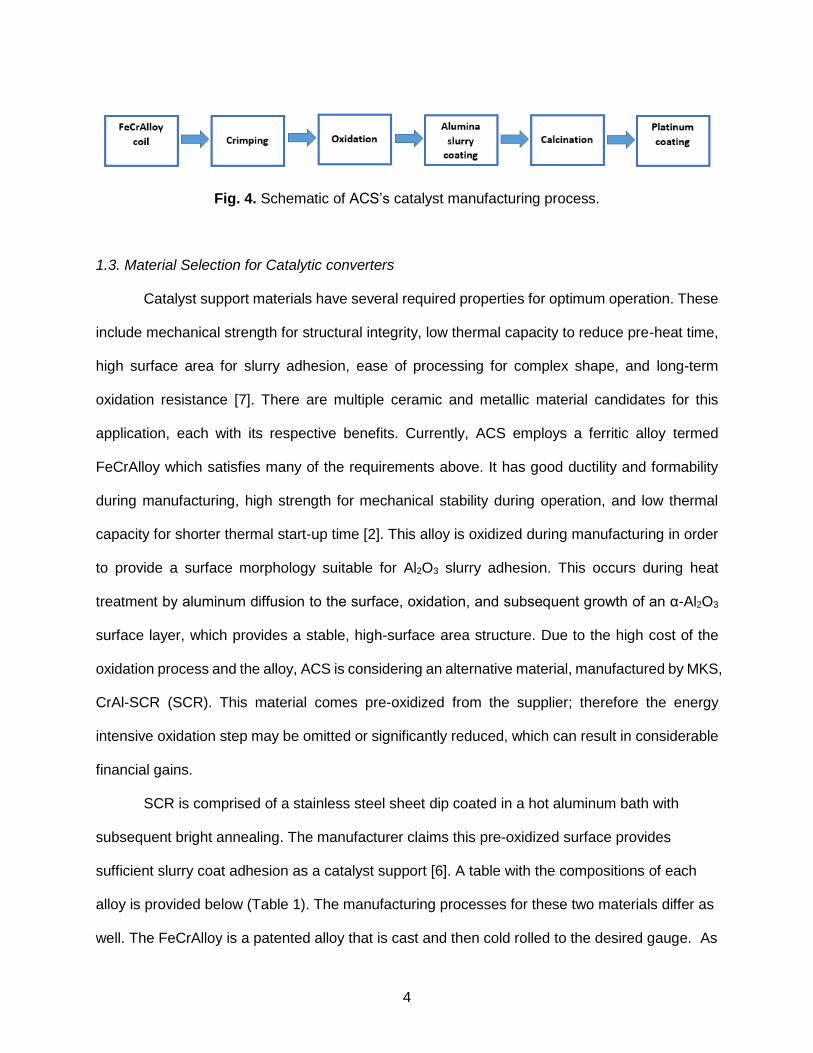
nanoparticles are evaporated onto the coated monolith surface. A schematic of the overall
process is shown below in Fig. 4.
4
Fig. 4. Schematic of ACS’s catalyst manufacturing process.
1.3. Material Selection for Catalytic converters
Catalyst support materials have several required properties for optimum operation. These
include mechanical strength for structural integrity, low thermal capacity to reduce pre-heat time,
high surface area for slurry adhesion, ease of processing for complex shape, and long-term
oxidation resistance [7]. There are multiple ceramic and metallic material candidates for this
application, each with its respective benefits. Currently, ACS employs a ferritic alloy termed
FeCrAlloy which satisfies many of the requirements above. It has good ductility and formability
during manufacturing, high strength for mechanical stability during operation, and low thermal
capacity for shorter thermal start-up time [2]. This alloy is oxidized during manufacturing in order
to provide a surface morphology suitable for Al2O3 slurry adhesion. This occurs during heat
treatment by aluminum diffusion to the surface, oxidation, and subsequent growth of an α-Al2O3
surface layer, which provides a stable, high-surface area structure. Due to the high cost of the
oxidation process and the alloy, ACS is considering an alternative material, manufactured by MKS,
CrAl-SCR (SCR). This material comes pre-oxidized from the supplier; therefore the energy
intensive oxidation step may be omitted or significantly reduced, which can result in considerable
financial gains.
SCR is comprised of a stainless steel sheet dip coated in a hot aluminum bath with
subsequent bright annealing. The manufacturer claims this pre-oxidized surface provides
sufficient slurry coat adhesion as a catalyst support [6]. A table with the compositions of each
alloy is provided below (Table 1). The manufacturing processes for these two materials differ as
well. The FeCrAlloy is a patented alloy that is cast and then cold rolled to the desired gauge. As
5
mentioned before, the SCR material process involves a Fe-Cr alloy sheet that is then dipped
through a hot aluminum bath, dried, rolled to gauge and recoiled.
In this study, SCR will be investigated in order to inform ACS under what conditions, if any,
this new candidate material should be thermally processed to produce slurry adhesive surface
rivaling those of FeCrAlloy. This can be done by providing a fundamental understanding of this
material’s processing-structure-property relation with sufficient experimental data to determine
whether proper slurry coating adhesion can be achieved.
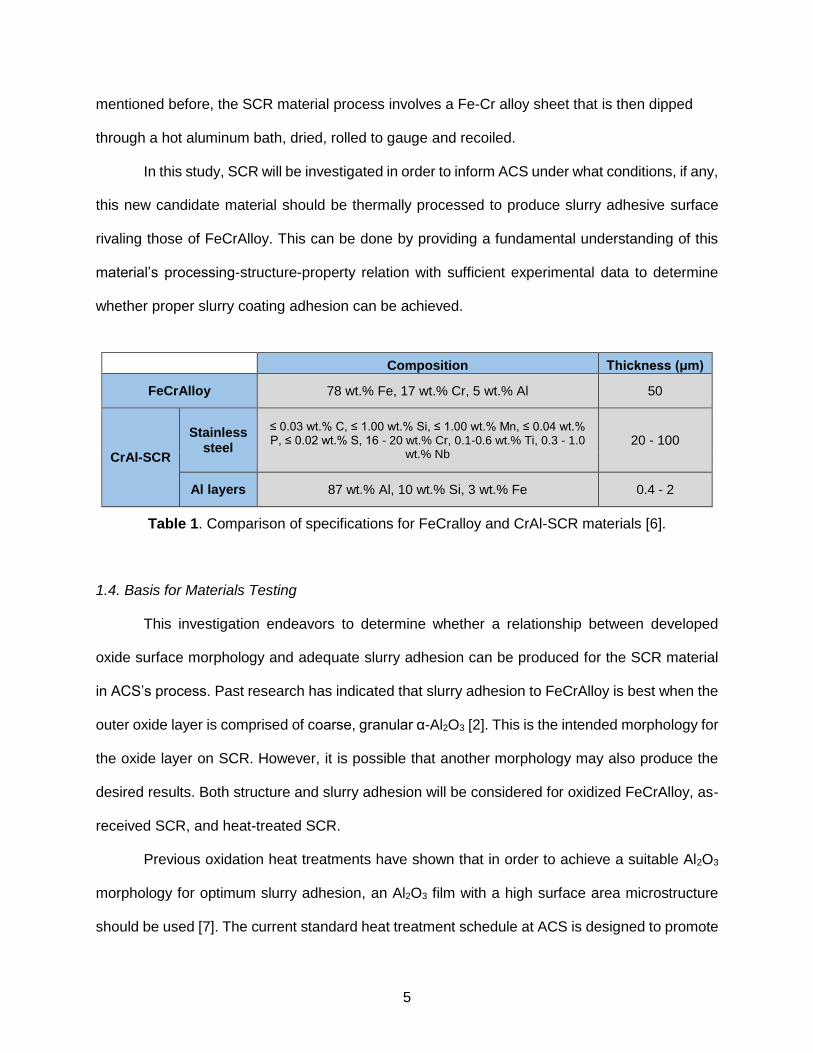
Composition Thickness (μm)
FeCrAlloy 78 wt.% Fe, 17 wt.% Cr, 5 wt.% Al 50
CrAl-SCR
Stainless steel
≤ 0.03 wt.% C, ≤ 1.00 wt.% Si, ≤ 1.00 wt.% Mn, ≤ 0.04 wt.% P, ≤ 0.02 wt.% S, 16 - 20 wt.% Cr, 0.1-0.6 wt.% Ti, 0.3 - 1.0
wt.% Nb 20 - 100
Al layers 87 wt.% Al, 10 wt.% Si, 3 wt.% Fe 0.4 - 2
Table 1. Comparison of specifications for FeCralloy and CrAl-SCR materials [6].
1.4. Basis for Materials Testing
This investigation endeavors to determine whether a relationship between developed
oxide surface morphology and adequate slurry adhesion can be produced for the SCR material
in ACS’s process. Past research has indicated that slurry adhesion to FeCrAlloy is best when the
outer oxide layer is comprised of coarse, granular α-Al2O3 [2]. This is the intended morphology for
the oxide layer on SCR. However, it is possible that another morphology may also produce the
desired results. Both structure and slurry adhesion will be considered for oxidized FeCrAlloy, as-
received SCR, and heat-treated SCR.
Previous oxidation heat treatments have shown that in order to achieve a suitable Al2O3
morphology for optimum slurry adhesion, an Al2O3 film with a high surface area microstructure
should be used [7]. The current standard heat treatment schedule at ACS is designed to promote
6
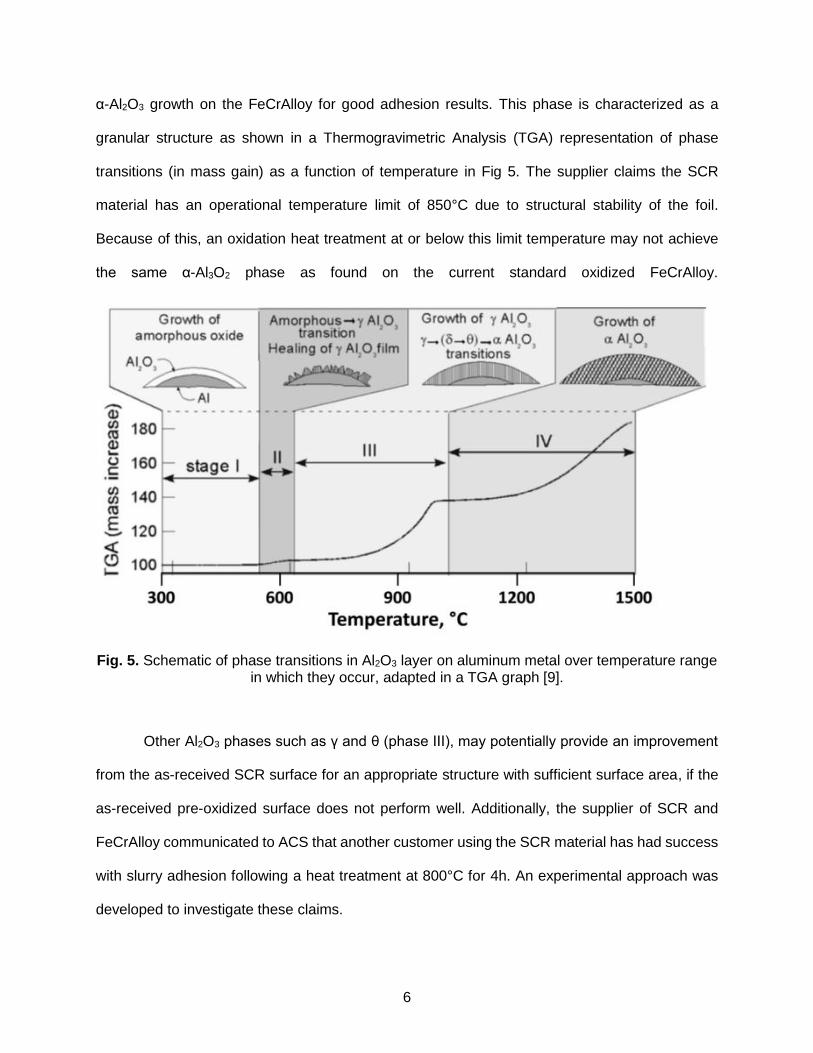
α-Al2O3 growth on the FeCrAlloy for good adhesion results. This phase is characterized as a
granular structure as shown in a Thermogravimetric Analysis (TGA) representation of phase
transitions (in mass gain) as a function of temperature in Fig 5. The supplier claims the SCR
material has an operational temperature limit of 850°C due to structural stability of the foil.
Because of this, an oxidation heat treatment at or below this limit temperature may not achieve
the same α-Al3O2 phase as found on the current standard oxidized FeCrAlloy.
Fig. 5. Schematic of phase transitions in Al2O3 layer on aluminum metal over temperature range in which they occur, adapted in a TGA graph [9].
Other Al2O3 phases such as γ and θ (phase III), may potentially provide an improvement
from the as-received SCR surface for an appropriate structure with sufficient surface area, if the
as-received pre-oxidized surface does not perform well. Additionally, the supplier of SCR and
FeCrAlloy communicated to ACS that another customer using the SCR material has had success
with slurry adhesion following a heat treatment at 800°C for 4h. An experimental approach was
developed to investigate these claims.
7
2. Experimental
The experimental approach relied on three general areas: surface characterization, heat
treatment, and adhesion studies. The methodology for each is described in greater detail in the
following subsections.
2.1. Surface Characterization
Surface characterization was conducted using Scanning Electron Microscopy (SEM),
energy dispersive spectroscopy (EDS) and Focused Ion Beam (FIB). SEM and EDS were
conducted using a Phenomn ProX desktop microscope, while FIB was performed with a Jeol Dual
Beam Auriga to expose a cross-sectional profile of the slurry coated layer. Both SEM and FIB
micrographs were obtained using backscattered electron detectors.
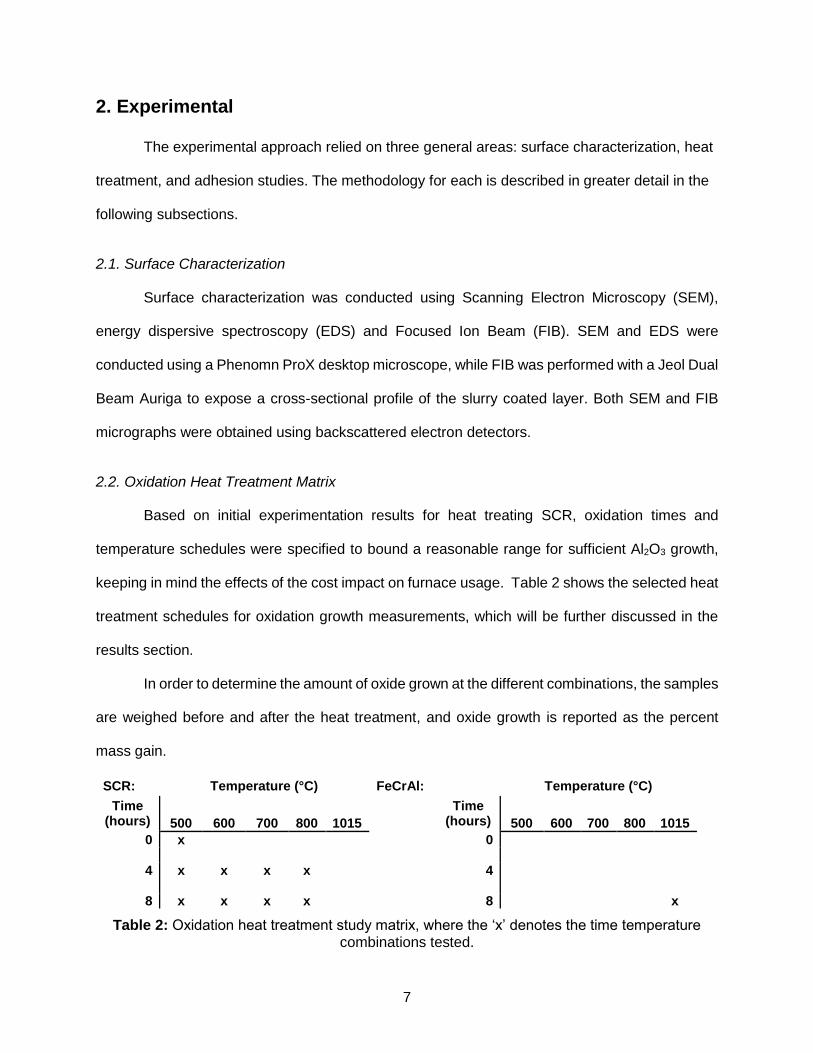
2.2. Oxidation Heat Treatment Matrix
Based on initial experimentation results for heat treating SCR, oxidation times and
temperature schedules were specified to bound a reasonable range for sufficient Al2O3 growth,
keeping in mind the effects of the cost impact on furnace usage. Table 2 shows the selected heat
treatment schedules for oxidation growth measurements, which will be further discussed in the
results section.
In order to determine the amount of oxide grown at the different combinations, the samples
are weighed before and after the heat treatment, and oxide growth is reported as the percent
mass gain.
SCR: Temperature (°C) FeCrAl: Temperature (°C)
Time (hours) 500 600 700 800 1015
Time (hours) 500 600 700 800 1015
0 x 0
4 x x x x 4
8 x x x x 8 x
Table 2: Oxidation heat treatment study matrix, where the ‘x’ denotes the time temperature combinations tested.
8
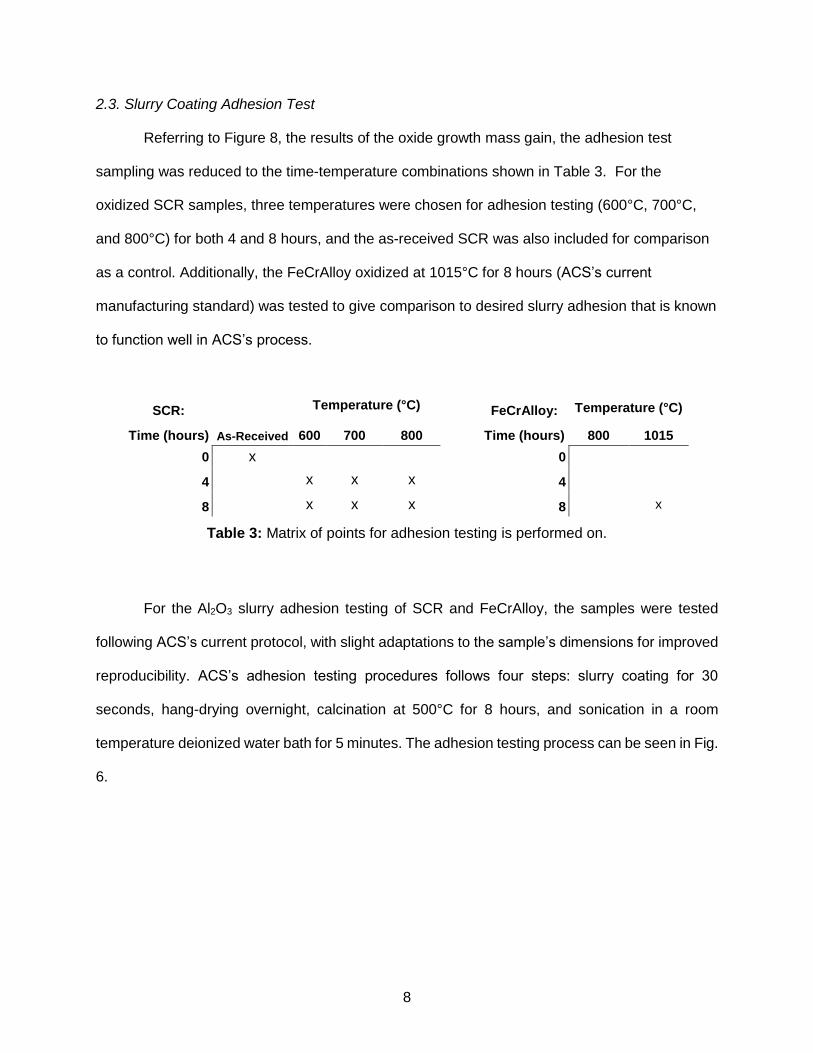
2.3. Slurry Coating Adhesion Test
Referring to Figure 8, the results of the oxide growth mass gain, the adhesion test
sampling was reduced to the time-temperature combinations shown in Table 3. For the
oxidized SCR samples, three temperatures were chosen for adhesion testing (600°C, 700°C,
and 800°C) for both 4 and 8 hours, and the as-received SCR was also included for comparison
as a control. Additionally, the FeCrAlloy oxidized at 1015°C for 8 hours (ACS’s current
manufacturing standard) was tested to give comparison to desired slurry adhesion that is known
to function well in ACS’s process.
SCR: Temperature (°C) FeCrAlloy: Temperature (°C)
Time (hours) As-Received 600 700 800 Time (hours) 800 1015
0 x 0
4 x x x 4
8 x x x 8 x
Table 3: Matrix of points for adhesion testing is performed on.
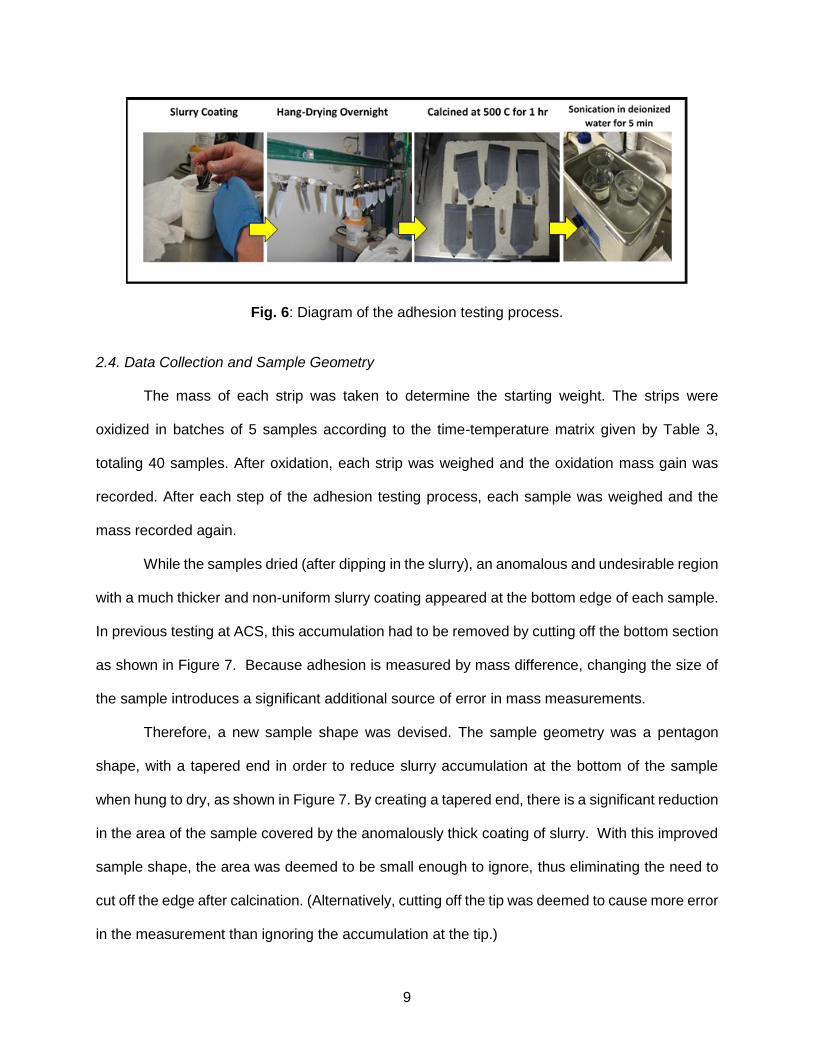
For the Al2O3 slurry adhesion testing of SCR and FeCrAlloy, the samples were tested
following ACS’s current protocol, with slight adaptations to the sample’s dimensions for improved
reproducibility. ACS’s adhesion testing procedures follows four steps: slurry coating for 30
seconds, hang-drying overnight, calcination at 500°C for 8 hours, and sonication in a room
temperature deionized water bath for 5 minutes. The adhesion testing process can be seen in Fig.
6.
9
Fig. 6: Diagram of the adhesion testing process.
2.4. Data Collection and Sample Geometry
The mass of each strip was taken to determine the starting weight. The strips were
oxidized in batches of 5 samples according to the time-temperature matrix given by Table 3,
totaling 40 samples. After oxidation, each strip was weighed and the oxidation mass gain was
recorded. After each step of the adhesion testing process, each sample was weighed and the
mass recorded again.
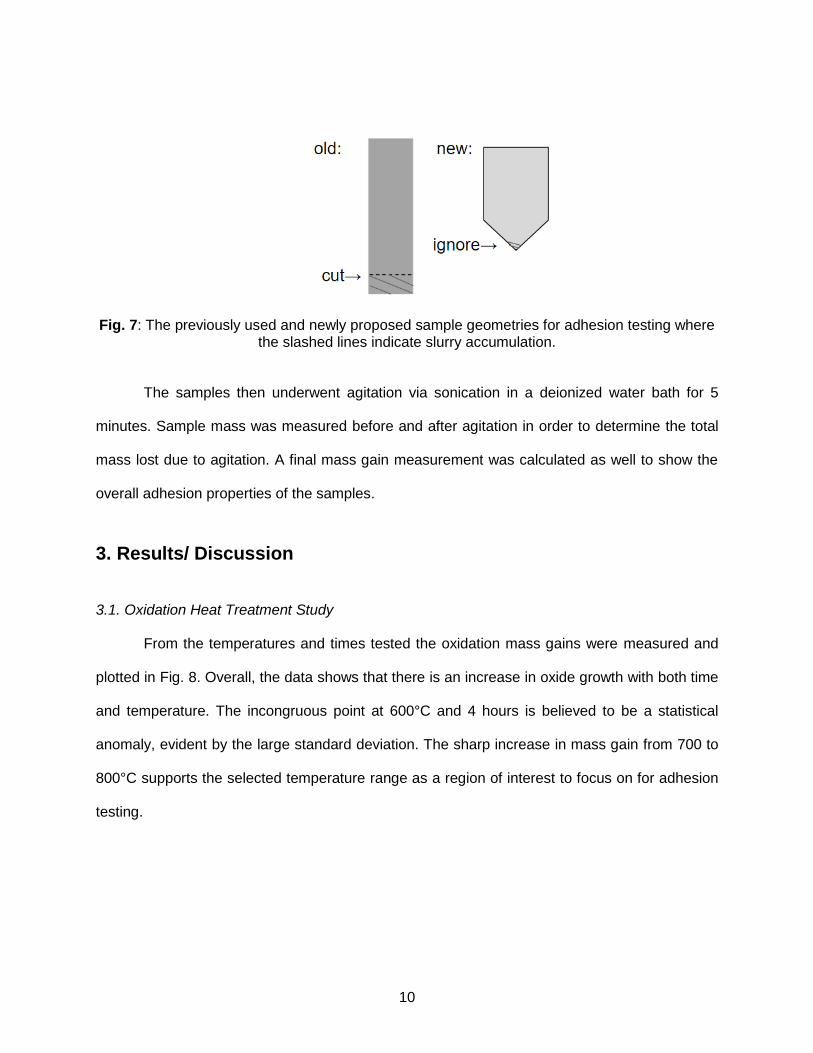
While the samples dried (after dipping in the slurry), an anomalous and undesirable region
with a much thicker and non-uniform slurry coating appeared at the bottom edge of each sample.
In previous testing at ACS, this accumulation had to be removed by cutting off the bottom section
as shown in Figure 7. Because adhesion is measured by mass difference, changing the size of
the sample introduces a significant additional source of error in mass measurements.
Therefore, a new sample shape was devised. The sample geometry was a pentagon
shape, with a tapered end in order to reduce slurry accumulation at the bottom of the sample
when hung to dry, as shown in Figure 7. By creating a tapered end, there is a significant reduction
in the area of the sample covered by the anomalously thick coating of slurry. With this improved
sample shape, the area was deemed to be small enough to ignore, thus eliminating the need to
cut off the edge after calcination. (Alternatively, cutting off the tip was deemed to cause more error
in the measurement than ignoring the accumulation at the tip.)
10
Fig. 7: The previously used and newly proposed sample geometries for adhesion testing where the slashed lines indicate slurry accumulation.
The samples then underwent agitation via sonication in a deionized water bath for 5
minutes. Sample mass was measured before and after agitation in order to determine the total
mass lost due to agitation. A final mass gain measurement was calculated as well to show the
overall adhesion properties of the samples.
3. Results/ Discussion
3.1. Oxidation Heat Treatment Study
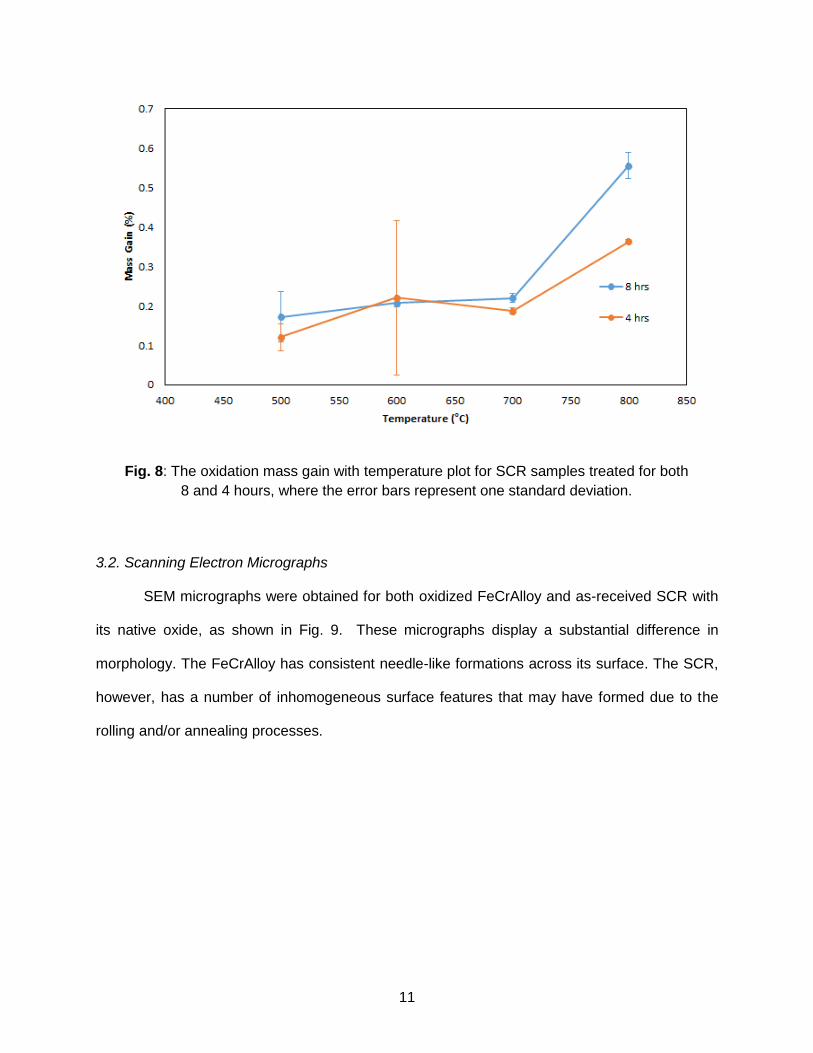
From the temperatures and times tested the oxidation mass gains were measured and
plotted in Fig. 8. Overall, the data shows that there is an increase in oxide growth with both time
and temperature. The incongruous point at 600°C and 4 hours is believed to be a statistical
anomaly, evident by the large standard deviation. The sharp increase in mass gain from 700 to
800°C supports the selected temperature range as a region of interest to focus on for adhesion
testing.
11
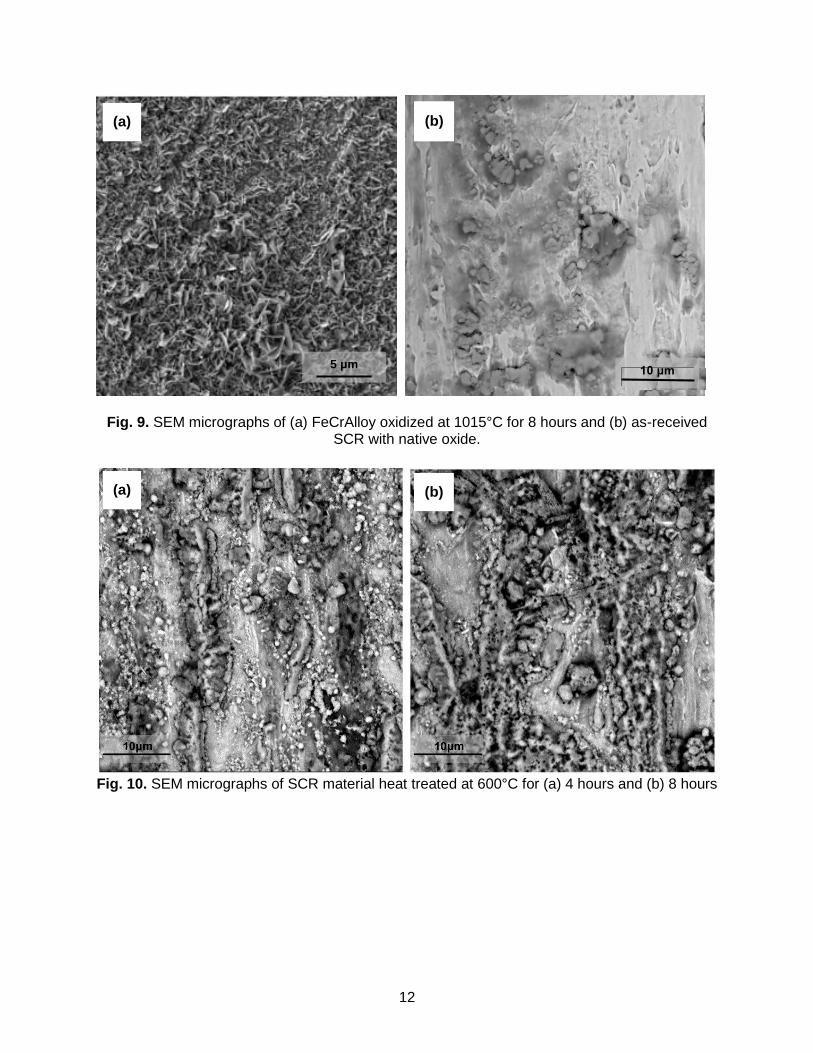
3.2. Scanning Electron Micrographs
SEM micrographs were obtained for both oxidized FeCrAlloy and as-received SCR with
its native oxide, as shown in Fig. 9. These micrographs display a substantial difference in
morphology. The FeCrAlloy has consistent needle-like formations across its surface. The SCR,
however, has a number of inhomogeneous surface features that may have formed due to the
rolling and/or annealing processes.
Fig. 8: The oxidation mass gain with temperature plot for SCR samples treated for both
8 and 4 hours, where the error bars represent one standard deviation.
12
Fig. 9. SEM micrographs of (a) FeCrAlloy oxidized at 1015°C for 8 hours and (b) as-received SCR with native oxide.
Fig. 10. SEM micrographs of SCR material heat treated at 600°C for (a) 4 hours and (b) 8 hours
(a) (b)
(a) (b)
10 μm 5 μm
13
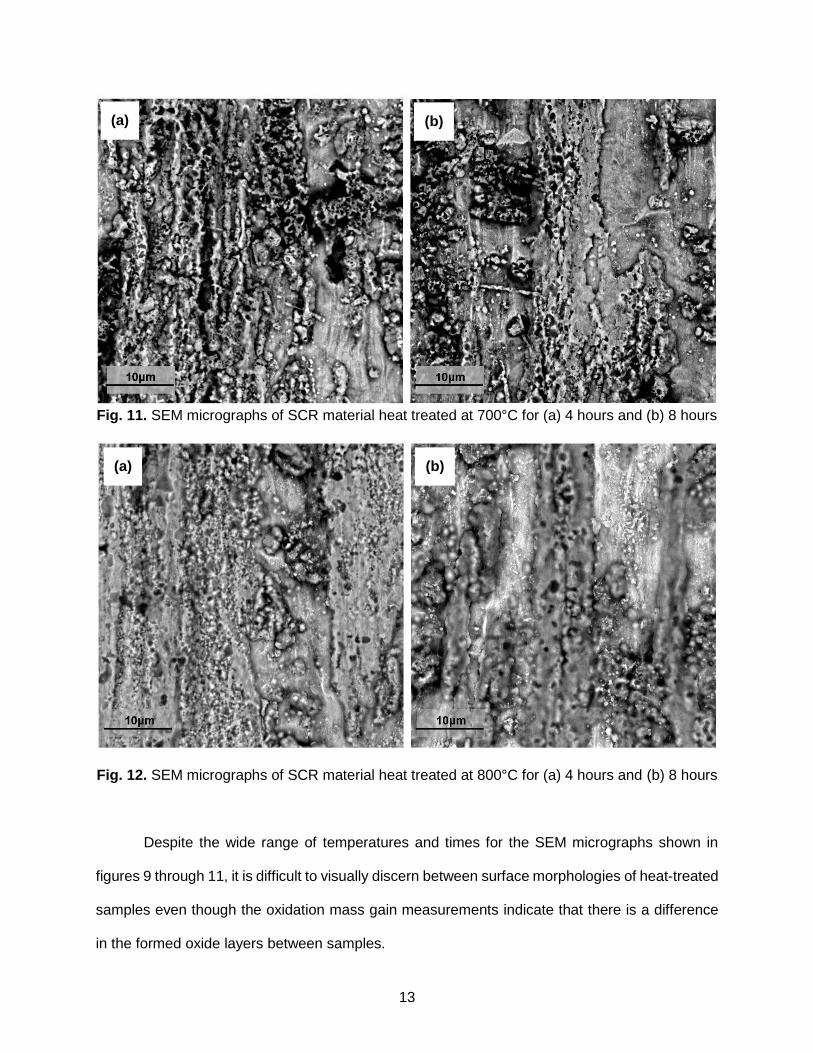
Fig. 11. SEM micrographs of SCR material heat treated at 700°C for (a) 4 hours and (b) 8 hours
Fig. 12. SEM micrographs of SCR material heat treated at 800°C for (a) 4 hours and (b) 8 hours
Despite the wide range of temperatures and times for the SEM micrographs shown in
figures 9 through 11, it is difficult to visually discern between surface morphologies of heat-treated
samples even though the oxidation mass gain measurements indicate that there is a difference
in the formed oxide layers between samples.
(a) (b)
(a) (b)
14
We note that we were motivated to perform a thorough suite of investigations using SEM
based on previously published work on the FeCrAlloy that showed significant morphological
changes as a function of time and temperature of oxidation [2]. Our results for SCR indicate that
SEM is not the definitive characterization technique for all oxide surfaces.
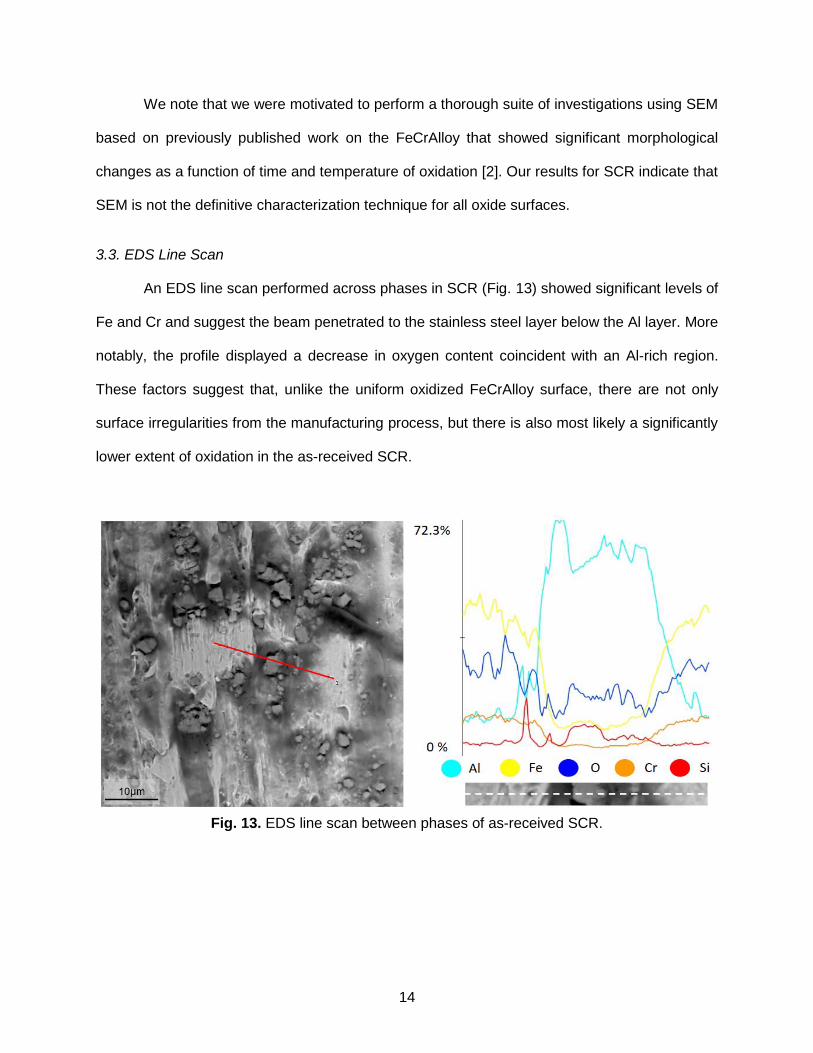
3.3. EDS Line Scan
An EDS line scan performed across phases in SCR (Fig. 13) showed significant levels of
Fe and Cr and suggest the beam penetrated to the stainless steel layer below the Al layer. More
notably, the profile displayed a decrease in oxygen content coincident with an Al-rich region.
These factors suggest that, unlike the uniform oxidized FeCrAlloy surface, there are not only
surface irregularities from the manufacturing process, but there is also most likely a significantly
lower extent of oxidation in the as-received SCR.
Fig. 13. EDS line scan between phases of as-received SCR.
15
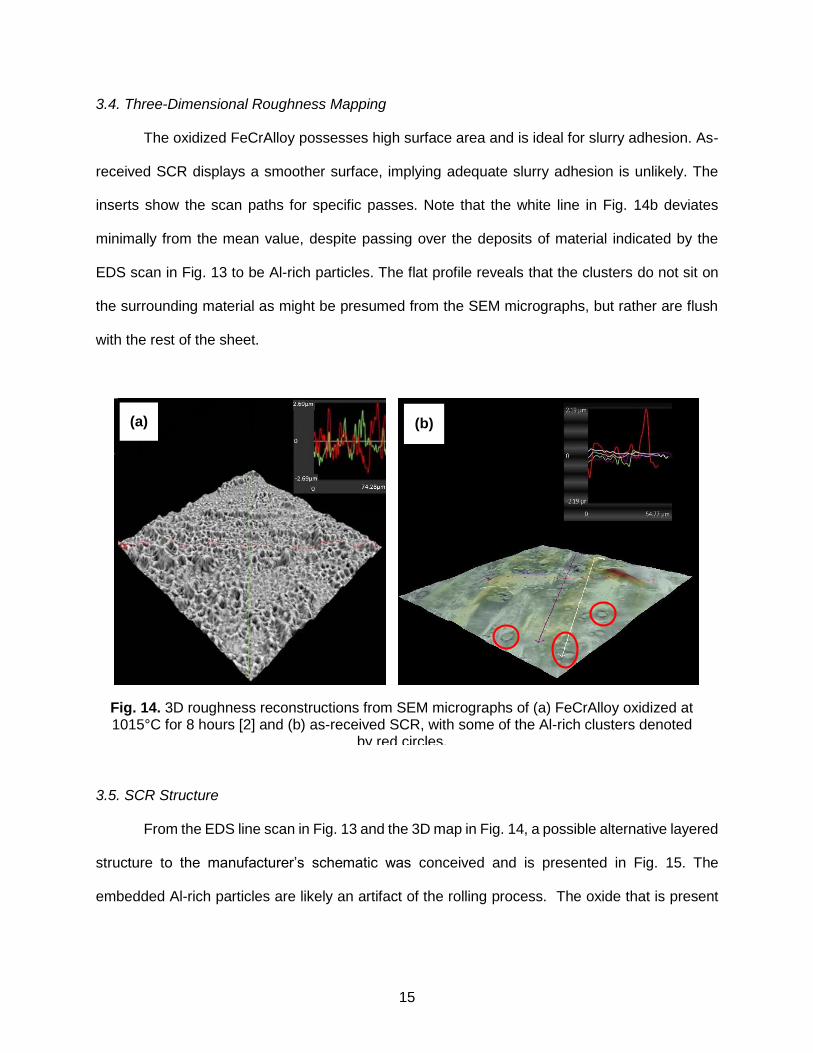
3.4. Three-Dimensional Roughness Mapping
The oxidized FeCrAlloy possesses high surface area and is ideal for slurry adhesion. As-
received SCR displays a smoother surface, implying adequate slurry adhesion is unlikely. The
inserts show the scan paths for specific passes. Note that the white line in Fig. 14b deviates
minimally from the mean value, despite passing over the deposits of material indicated by the
EDS scan in Fig. 13 to be Al-rich particles. The flat profile reveals that the clusters do not sit on
the surrounding material as might be presumed from the SEM micrographs, but rather are flush
with the rest of the sheet.
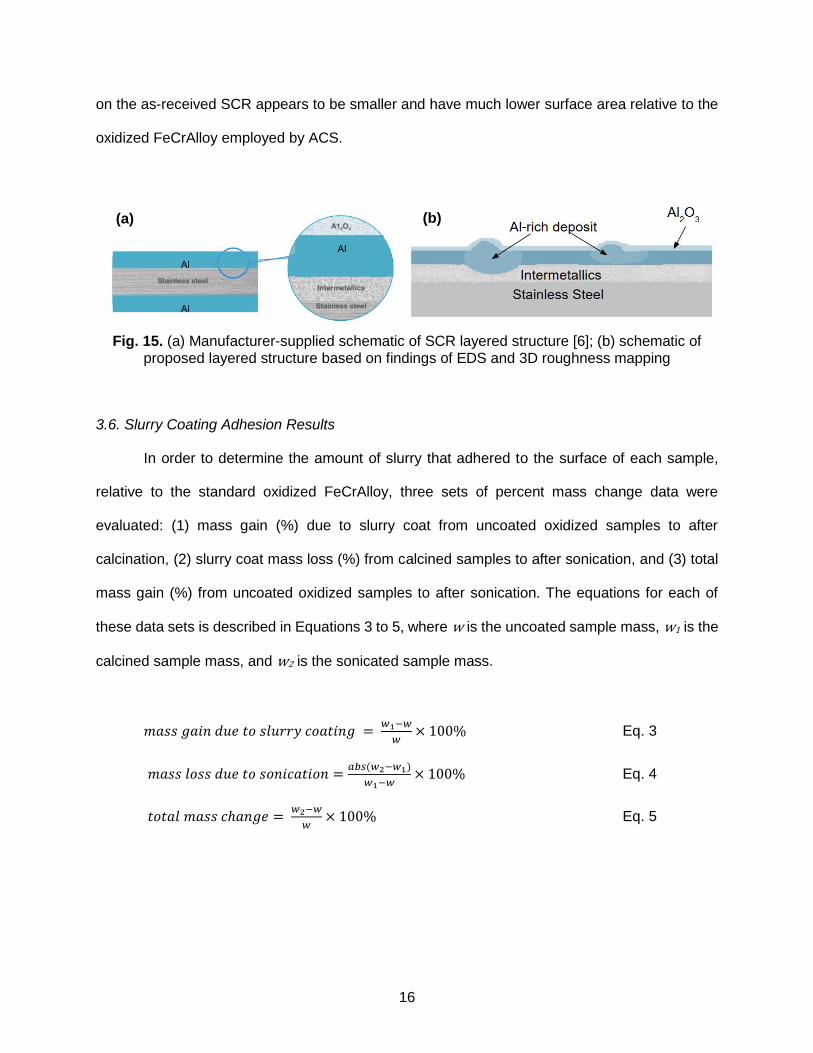
3.5. SCR Structure
From the EDS line scan in Fig. 13 and the 3D map in Fig. 14, a possible alternative layered
structure to the manufacturer’s schematic was conceived and is presented in Fig. 15. The
embedded Al-rich particles are likely an artifact of the rolling process. The oxide that is present
Fig. 14. 3D roughness reconstructions from SEM micrographs of (a) FeCrAlloy oxidized at 1015°C for 8 hours [2] and (b) as-received SCR, with some of the Al-rich clusters denoted
by red circles.
(a) (b)
16
on the as-received SCR appears to be smaller and have much lower surface area relative to the
oxidized FeCrAlloy employed by ACS.
Fig. 15. (a) Manufacturer-supplied schematic of SCR layered structure [6]; (b) schematic of proposed layered structure based on findings of EDS and 3D roughness mapping
3.6. Slurry Coating Adhesion Results
In order to determine the amount of slurry that adhered to the surface of each sample,
relative to the standard oxidized FeCrAlloy, three sets of percent mass change data were
evaluated: (1) mass gain (%) due to slurry coat from uncoated oxidized samples to after
calcination, (2) slurry coat mass loss (%) from calcined samples to after sonication, and (3) total
mass gain (%) from uncoated oxidized samples to after sonication. The equations for each of
these data sets is described in Equations 3 to 5, where w is the uncoated sample mass, w1 is the
calcined sample mass, and w2 is the sonicated sample mass.
𝑚𝑎𝑠𝑠 𝑔𝑎𝑖𝑛 𝑑𝑢𝑒 𝑡𝑜 𝑠𝑙𝑢𝑟𝑟𝑦 𝑐𝑜𝑎𝑡𝑖𝑛𝑔 = 𝑤1−𝑤
𝑤× 100% Eq. 3
𝑚𝑎𝑠𝑠 𝑙𝑜𝑠𝑠 𝑑𝑢𝑒 𝑡𝑜 𝑠𝑜𝑛𝑖𝑐𝑎𝑡𝑖𝑜𝑛 =𝑎𝑏𝑠(𝑤2−𝑤1)
𝑤1−𝑤× 100% Eq. 4
𝑡𝑜𝑡𝑎𝑙 𝑚𝑎𝑠𝑠 𝑐ℎ𝑎𝑛𝑔𝑒 = 𝑤2−𝑤
𝑤× 100% Eq. 5
(a) (b)
17
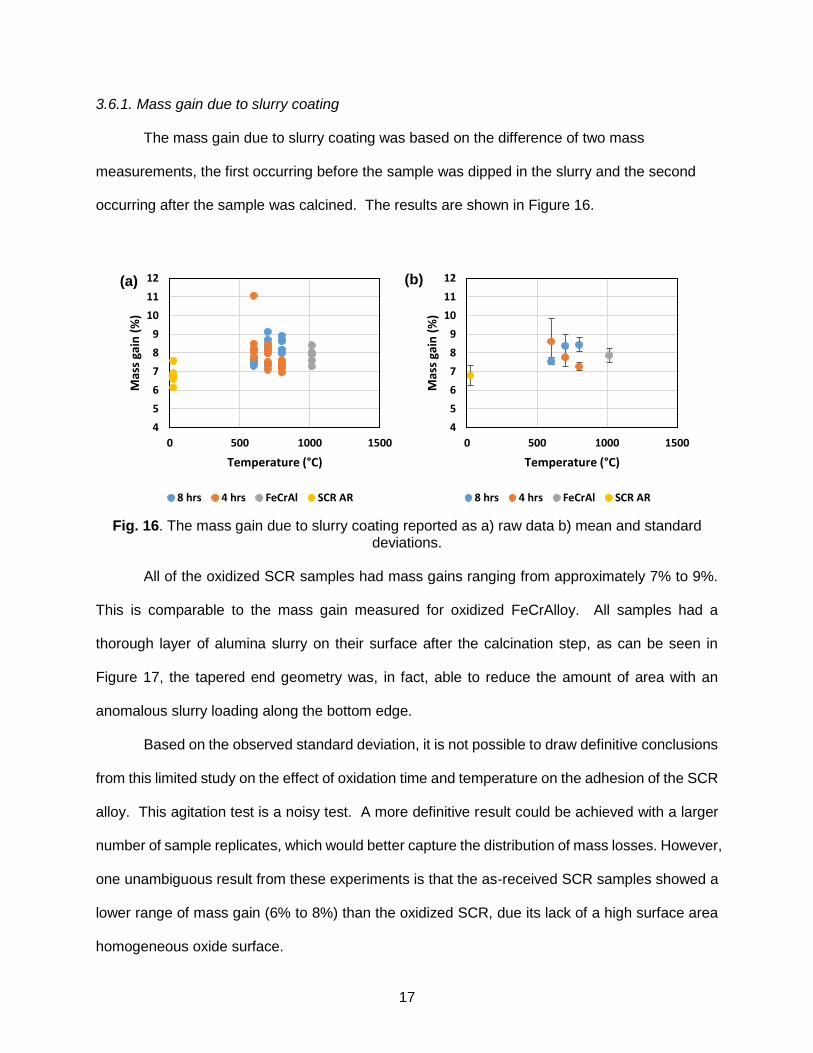
3.6.1. Mass gain due to slurry coating
The mass gain due to slurry coating was based on the difference of two mass
measurements, the first occurring before the sample was dipped in the slurry and the second
occurring after the sample was calcined. The results are shown in Figure 16.
Fig. 16. The mass gain due to slurry coating reported as a) raw data b) mean and standard
deviations.
All of the oxidized SCR samples had mass gains ranging from approximately 7% to 9%.
This is comparable to the mass gain measured for oxidized FeCrAlloy. All samples had a
thorough layer of alumina slurry on their surface after the calcination step, as can be seen in
Figure 17, the tapered end geometry was, in fact, able to reduce the amount of area with an
anomalous slurry loading along the bottom edge.
Based on the observed standard deviation, it is not possible to draw definitive conclusions
from this limited study on the effect of oxidation time and temperature on the adhesion of the SCR
alloy. This agitation test is a noisy test. A more definitive result could be achieved with a larger
number of sample replicates, which would better capture the distribution of mass losses. However,
one unambiguous result from these experiments is that the as-received SCR samples showed a
lower range of mass gain (6% to 8%) than the oxidized SCR, due its lack of a high surface area
homogeneous oxide surface.
4
5
6
7
8
9
10
11
12
0 500 1000 1500
Mas
s ga
in (
%)
Temperature (°C)
8 hrs 4 hrs FeCrAl SCR AR
4
5
6
7
8
9
10
11
12
0 500 1000 1500M
ass
gain
(%
)
Temperature (°C)
8 hrs 4 hrs FeCrAl SCR AR
(a) (b)
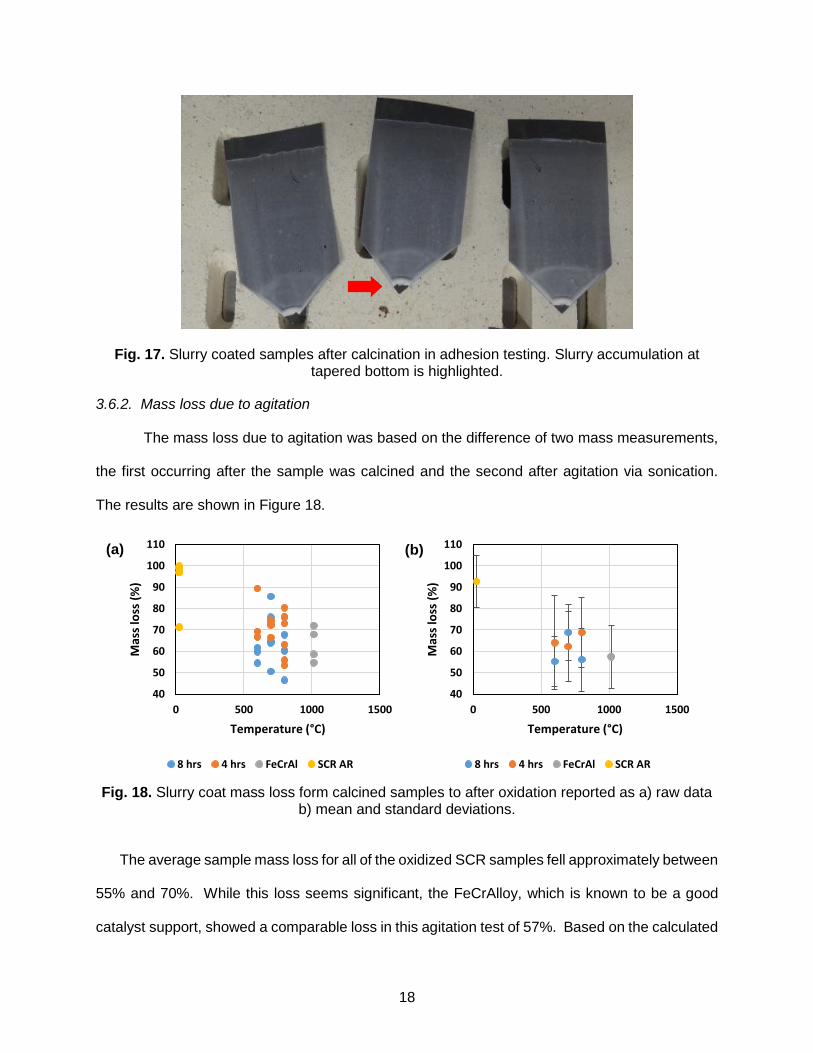
18
Fig. 17. Slurry coated samples after calcination in adhesion testing. Slurry accumulation at tapered bottom is highlighted.
3.6.2. Mass loss due to agitation
The mass loss due to agitation was based on the difference of two mass measurements,
the first occurring after the sample was calcined and the second after agitation via sonication.
The results are shown in Figure 18.
Fig. 18. Slurry coat mass loss form calcined samples to after oxidation reported as a) raw data
b) mean and standard deviations.
The average sample mass loss for all of the oxidized SCR samples fell approximately between
55% and 70%. While this loss seems significant, the FeCrAlloy, which is known to be a good
catalyst support, showed a comparable loss in this agitation test of 57%. Based on the calculated
40
50
60
70
80
90
100
110
0 500 1000 1500
Mas
s lo
ss (
%)
Temperature (°C)
8 hrs 4 hrs FeCrAl SCR AR
40
50
60
70
80
90
100
110
0 500 1000 1500
Mas
s lo
ss (
%)
Temperature (°C)
8 hrs 4 hrs FeCrAl SCR AR
(a) (b)
19
standard deviations, it is, again, doubtful that a reliable indication of the effect of oxidation time
and temperature on mass loss after agitation can be observed. More samples are required for a
characterization process as noisy as this process appears to be.
The behavior of the as-received SCR is markedly different from all the other samples. Where
one could argue that the amount of slurry gained by the as-received samples (6% to 8%) was in
the same range as that of the oxidized samples (7% to 9%), the amount of that slurry that is lost
from the as-received SCR samples is much higher (over 90% of the slurry is lost) than the oxidized
samples. Clearly, whatever scant pre-oxidation existed on the as-received SCR, it is not sufficient
to provide a surface to which the alumina particles can adhere.
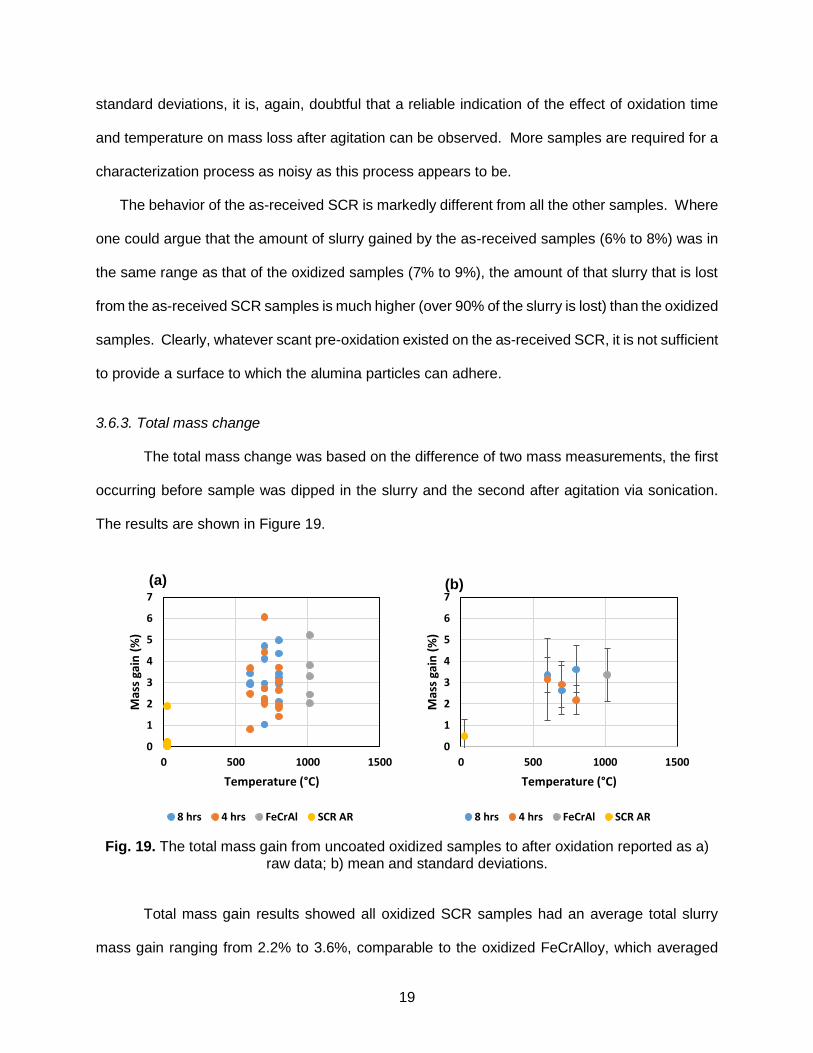
3.6.3. Total mass change
The total mass change was based on the difference of two mass measurements, the first
occurring before sample was dipped in the slurry and the second after agitation via sonication.
The results are shown in Figure 19.
Fig. 19. The total mass gain from uncoated oxidized samples to after oxidation reported as a)
raw data; b) mean and standard deviations.
Total mass gain results showed all oxidized SCR samples had an average total slurry
mass gain ranging from 2.2% to 3.6%, comparable to the oxidized FeCrAlloy, which averaged
0
1
2
3
4
5
6
7
0 500 1000 1500
Mas
s ga
in (
%)
Temperature (°C)
8 hrs 4 hrs FeCrAl SCR AR
0
1
2
3
4
5
6
7
0 500 1000 1500
Mas
s ga
in (
%)
Temperature (°C)
8 hrs 4 hrs FeCrAl SCR AR
(a) (b)
20
3.4% total slurry mass gain. There were no observable effects of oxidation time temperature on
the amount of slurry that remained after completion of the adhesion test; a larger sample size
may be required for more conclusive observations. Similar to the previous measurements, the as-
received SCR showed poor adhesion performance as indicated by a minimal mass gain (average
of 0.4%). This emphasizes the requirement for additional oxidation beyond the native oxide
developed during the Al coating and bright annealing step performed by MK.
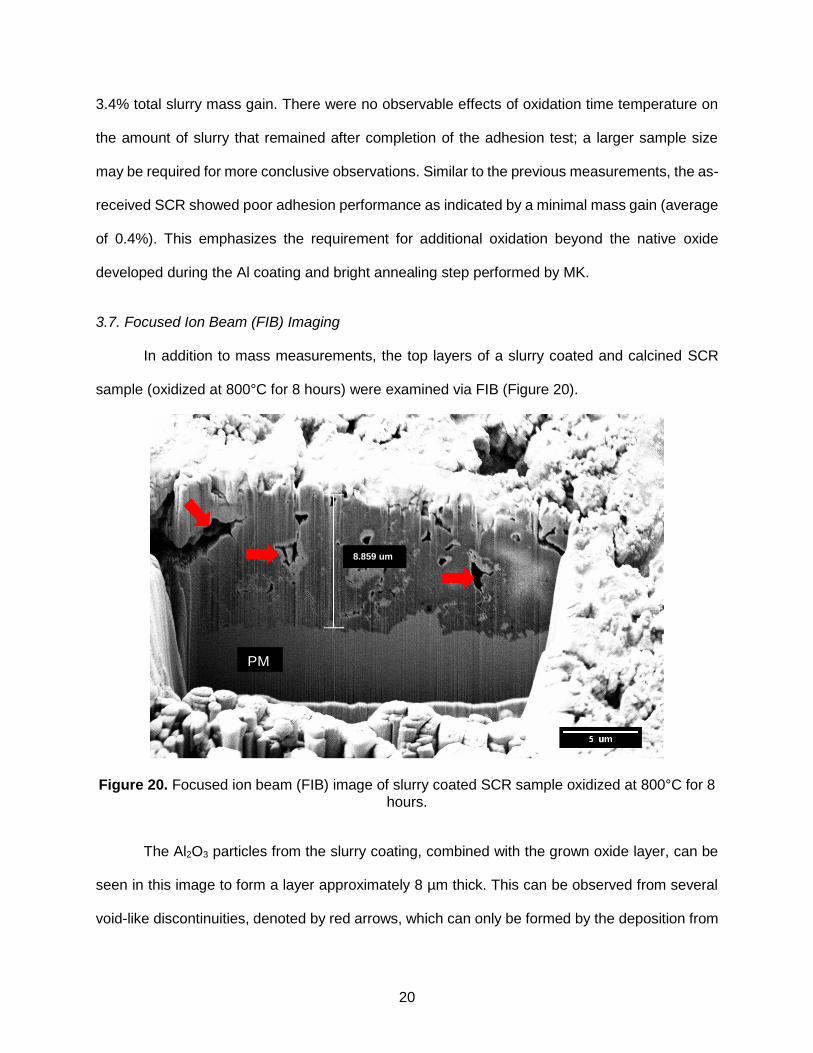
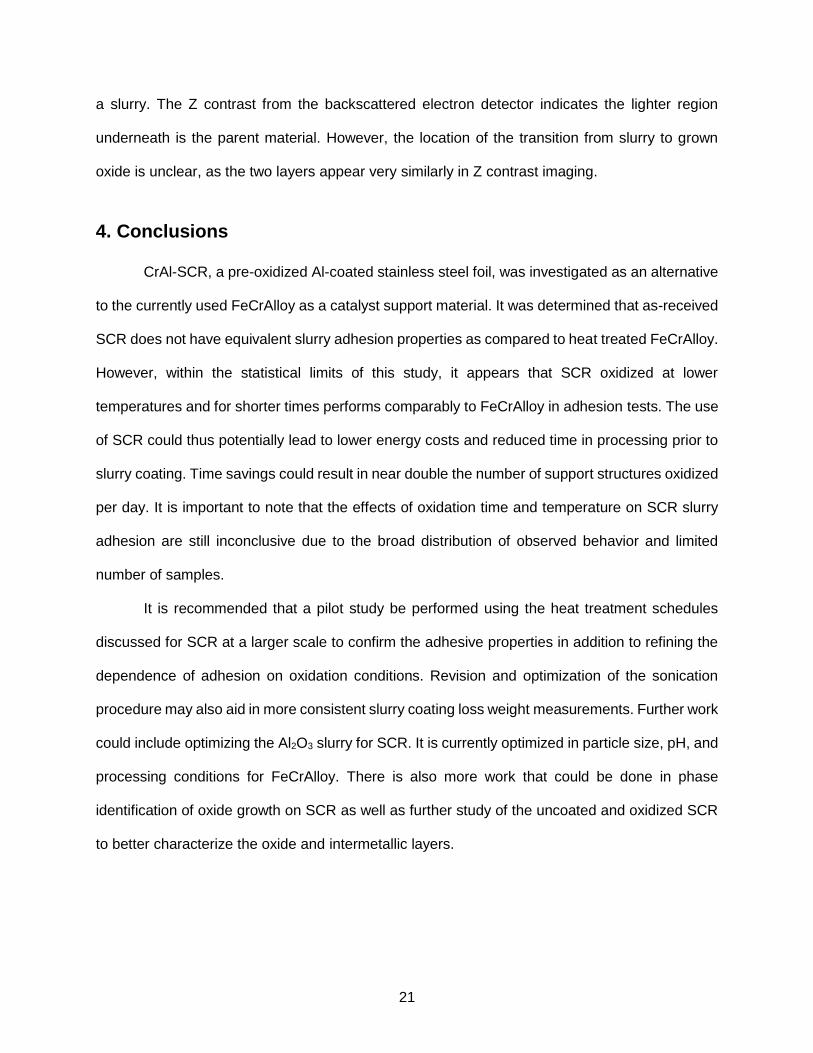
3.7. Focused Ion Beam (FIB) Imaging
In addition to mass measurements, the top layers of a slurry coated and calcined SCR
sample (oxidized at 800°C for 8 hours) were examined via FIB (Figure 20).
Figure 20. Focused ion beam (FIB) image of slurry coated SCR sample oxidized at 800°C for 8 hours.
The Al2O3 particles from the slurry coating, combined with the grown oxide layer, can be
seen in this image to form a layer approximately 8 µm thick. This can be observed from several
void-like discontinuities, denoted by red arrows, which can only be formed by the deposition from
8.859 um
PM
21
a slurry. The Z contrast from the backscattered electron detector indicates the lighter region
underneath is the parent material. However, the location of the transition from slurry to grown
oxide is unclear, as the two layers appear very similarly in Z contrast imaging.
4. Conclusions
CrAl-SCR, a pre-oxidized Al-coated stainless steel foil, was investigated as an alternative
to the currently used FeCrAlloy as a catalyst support material. It was determined that as-received
SCR does not have equivalent slurry adhesion properties as compared to heat treated FeCrAlloy.
However, within the statistical limits of this study, it appears that SCR oxidized at lower
temperatures and for shorter times performs comparably to FeCrAlloy in adhesion tests. The use
of SCR could thus potentially lead to lower energy costs and reduced time in processing prior to
slurry coating. Time savings could result in near double the number of support structures oxidized
per day. It is important to note that the effects of oxidation time and temperature on SCR slurry
adhesion are still inconclusive due to the broad distribution of observed behavior and limited
number of samples.
It is recommended that a pilot study be performed using the heat treatment schedules
discussed for SCR at a larger scale to confirm the adhesive properties in addition to refining the
dependence of adhesion on oxidation conditions. Revision and optimization of the sonication
procedure may also aid in more consistent slurry coating loss weight measurements. Further work
could include optimizing the Al2O3 slurry for SCR. It is currently optimized in particle size, pH, and
processing conditions for FeCrAlloy. There is also more work that could be done in phase
identification of oxide growth on SCR as well as further study of the uncoated and oxidized SCR
to better characterize the oxide and intermetallic layers.
22
References
[1] "Catalysis." University of Texas - CM, n.d. Web. 05 Feb. 2016.
<http://ch302.cm.utexas.edu/kinetics/catalysts/catalysts-all.php>.
[2] Arnold, J., Creekmore, J., Loyd, M., Turan, Josh. “Design of Catalyst Supports.”
(Unpublished Capstone Report). Department of Materials Science and Engineering.
University of Tennessee. 2015.
[3] "Reactions and Catalysts." BBC News. BBC, n.d. Web. 08 Feb. 2016.
<http://www.bbc.co.uk/education/guides/zqd2mp3/revision/6>.
[4] Mazumder, S. "Modeling Full-Scale Monolithic Catalytic Converters: Challenges and
Possible Solutions." J. Heat Transfer Journal of Heat Transfer 129.4.: 526. Web. 2007
[5] "Air Pollution Control Catalysts." Applied Catalysts – Product Families – Air Pollution Control.
Applied Catalysts, n.d. Web. 08 Feb. 2016.
<http://www.appliedcatalysts.com/product_control.htm>.
[6] “Adegbite, S.A., et al. “Coating of Catalyst Supports: Links Between Slurry Characteristics,
Coating Process and Final Coating Quality”. United Kingdom, Birmingham. 2010.
[7] "Coated Stainless Steel Sheet." Metal Finishing 94.4 (1996): 95. MK Metallfolien. Web.
[8] Cybulski, A. and Moulijn, J. A., Structured catalysis and reactors, 2nd ed. Taylor & Francis,
London. 2006
[9] Trunov, M.A., Schoenitz, M. and Dreizin, E.L., “Effect of polymorphic phase
transformations in alumina layer on ignition of aluminium particles.” Combustion Theory
and Modelling, 10(4), 603-23. 2006