Cortical Plasticity Induced by Spike-Triggered Microstimulation in Primate Somatosensory Cortex
Upload
independentCategory
view
2download
0
www.elsevier.com/locate/ynimg
NeuroImage 35 (2007) 185–193Somatosensory dynamic gamma-band synchrony: A neural code ofsensorimotor dexterity
Franca Tecchio,a,b,⁎ Sara Graziadio,c Giulia Barbati,b Roberto Sigismondi,d
Filippo Zappasodi,a,b Camillo Porcaro,b Giancarlo Valente,e
Marco Balsi,d and Paolo Maria Rossinib,f,g
aISTC-CNR, Unità MEG, Fatebenefratelli Hospital, Isola Tiberina, Roma, ItalybAFaR, Fatebenefratelli Hospital, Isola Tiberina, Roma, ItalycDevelopmental Neurosciences, Dept. of Child Health, Univ. Newcastle upon Tyne, UKdDept. of Electronic Engineering, ‘La Sapienza’ University, Roma, ItalyeDept. of Cognitive Neuroscience, University of Maastricht, The NetherlandsfNeurology, ‘Campus Biomedico’ University, Roma, ItalygIRCCS ‘Centro S. Giovanni di Dio-Fatebenefratelli’, Brescia, Italy
Received 28 October 2006; revised 6 December 2006; accepted 7 December 2006Available online 16 January 2007
To investigate neural coding characteristics in the human primarysomatosensory cortex, two fingers with different levels of functionalskill were studied. Their dexterity was scored by the Fingertip writingtest. Each finger was separately provided by a passive simple sensorystimulation and the responsiveness of each finger cortical representa-tion was studied by a novel source extraction method applied tomagnetoencephalographic signals recorded in a 14 healthy righthanded subject cohort. In the two hemispheres, neural oscillatoryactivity synchronization was analysed in the three characteristic alpha,beta and gamma frequency bands by two dynamic measures, oneisolating the phase locking between neural network components, theother reflecting the total number of synchronous recruited neurons. Inthe dominant hemisphere, the gamma band phase locking was higherfor the thumb than for the little finger and it correlated with thecontra-lateral finger dexterity. Neither in the dominant nor in the non-dominant hemisphere, any effect was observed in the alpha and betabands. In the gamma band, the amplitude showed similar tendency tothe phase locking, without reaching statistical significance. Thesefindings suggest the dynamic gamma band phase locking as a code forfinger dexterity, in addition to the magnification of somatotopic centralmaps.© 2006 Elsevier Inc. All rights reserved.
Introduction
Robust and mutually coherent findings support the theory thatthe synchronization between recruited – also distant – neuronal
⁎ Corresponding author. ISTC-CNR, Unità MEG, Dip. Neuroscienze,Osp. Fatebenefratelli, Isola Tiberina 39, 00186 Roma, Italy. Fax: +39 066837 360.
E-mail address: [email protected] (F. Tecchio).Available online on ScienceDirect (www.sciencedirect.com).
1053-8119/$ - see front matter © 2006 Elsevier Inc. All rights reserved.doi:10.1016/j.neuroimage.2006.12.002
pools activities can dynamically form functionally coherentassemblies in sensorimotor contexts, with spatially distributed setof cells activated in a coherent fashion becoming part of the samerepresentation (Roskies, 1999; Singer, 1999; Engel et al., 2001,2005). In the motor system, motor and premotor neurons engage insynchronous firing during preparatory delay periods (Sanes andDonoghue, 1993; Riehle et al., 1997, 2000), with growing stimulusexpectancy paralleling growing synchronization of networkactivity; as well, the level of synchronization clearly predicts theperformance and the reaction times. Data obtained in sensorycortex areas indicate that synchronicity occurs also in parietal areasduring reaching movements (MacKay and Mendonca, 1995) andongoing oscillations contribute to sensory processing by biasingthe coherence of stimulus-induced neuronal discharges (Hercula-no-Houzel et al., 1999; Roy and Alloway, 1999; Roy et al., 2001).Together, the data indicate that ongoing neural synchrony andoscillatory patterning can modulate the functional performance ofsensorimotor networks. In the case of motor preparation, they seemto reflect the dynamic organization of distributed populations ofmotor and premotor neurons. On the sensory side, the establish-ment of selective temporal relations before stimulus onset couldlead to the priming of particular stimulus constellations, to whichthe organism will then respond faster and with greater reliability.
Intra-cortical single and multiunit recordings from multipleareas, as well as extra-cephalic electrophysiological studies, havedocumented the functional relevance of oscillations and synchro-nization phenomena in the gamma frequency band. They haveshown the enhancement of high-frequency synchrony components,resulting from intrinsic dynamic interactions in the involvedsensorimotor loops, during attention to stimuli (Womelsdorf et al.,2006), visual search (Tallon-Baudry et al., 1997), object recogni-tion (Rodriguez et al., 1999; Tallon-Baudry and Bertrand, 1999),
186 F. Tecchio et al. / NeuroImage 35 (2007) 185–193
attentive listening (Tiitinen et al., 1993), learning (Lutzenberger etal., 2002; Kaiser and Lutzenberger, 2005). Gamma bandsynchronization not only drives cognitive processing arising inwidespread neural networks, but takes place locally in somatosen-sory areas clearly enhancing perception acuity (Crone et al., 1998a;Meador et al., 2002; Palva et al., 2005a).
In electro- and magneto-encephalographic (EEG and MEG)studies, signals from recording channels are often used to estimatesynchronization phenomena: if synchronization across relativelydistant brain areas is studied, this method is reliable (Gerloff et al.,1998; Simoes et al., 2003; Palva et al., 2005b); but investigatingthe primary hand sensorimotor cortex, all the recording channelsare significantly sensitive to the activity from the same neuronalpools. Here, it is mandatory to identify activities of involvedneuronal sources to accurately estimate synchronization levels.Recently, we proposed a modified blind source separation (BSS)algorithm (Functional Source Separation, FSS, Barbati et al.,2006), providing cerebral sources activity along different cerebralprocessing phases. BSS techniques (for a review see Cichocki andAmari, 2002) model the given observation (sensor data in our case)as a linear mixture of source activities and estimate completesource time courses on the basis of the statistical properties of thegenerated signal, without taking into account the physical nature ofthe generating phenomenon.
In the present MEG work, by assessing intra-cerebral activityusing FSS, the dynamics of rhythmic activity synchronizationphenomena was estimated within the primary finger corticalrepresentations within the first 50 ms after simple sensorystimulation. The objective was to investigate whether specificsynchronization phenomena differentiated representation of dis-tricts with different levels of functional skill. The thumb,considered as highly dexterous, and the little finger, consideredas having low dexterity, were studied. A higher level ofsynchronization in the more dexterous finger was expected(Tecchio et al., 2003, 2004). Possible inter-hemispheric differencesowing to hand dexterity were considered, thus both the dominantand non-dominant hemispheres were examined. Possible synchro-nization band-related specificity was taken into account byobserving the whole range of reactive frequencies, characteristicof the sensorimotor areas activity (Crone et al., 1998a,b). Both theextracted sources amplitude – increasing with the number ofrecruited neurons and their degree of synchronization (Pfurtschellerand Lopes da Silva, 1999) – and phase locking – isolating thesimilarity of involved signal phases (Quiroga et al., 2002) – wereinvestigated, to identify the most relevant synchronization feature.
To quantify the level of differential dexterity of thumb and littlefinger of both two hands, the ‘Fingertip writing’ test (Lezak, 1976)was used. Although we would prefer a test based on a puresensorimotor task, independent of any cognitive component,‘Fingertip writing’ was to our knowledge the only neuropsycho-logical standardized test differentiating different fingers (Russell etal., 1970; Lezak, 1976; Harley and Grafman, 1983).
Materials and methods
Subjects
Fourteen healthy volunteers (mean age 31±2 years, 7 femalesand 7 males) were enrolled for the study. All subjects were right-handed with an average Edinburgh Manuality Test (Oldfield, 1971)score of 83±14.
Experimental setup
The little finger and the thumb of both hands were stimulatedseparately (via ring electrodes) for 3 min by 0.2 ms electric pulses,with an interstimulus interval of 631 ms. Stimulus intensities wereset at about two times the subjective threshold of perception.
Finger dexterity assessmentTo quantitatively estimate the sensory perception skill for each
finger separately, the ‘Fingertip writing’ test (Lezak, 1976) wasused. After having a letter “written” onto a fingertip by theexperimenter, the subject had to tell which letter was written. Asthe test was introduced to evaluate neurological damage effects, thetest score is assigned counting the number of errors; in our case, ashealthy subjects were involved, and little skill differences wereexpected between different fingers, the score was the time requiredto recognize the letters; in the case of difficulty in recognizing aletter, it was repeated until recognized. In particular, for eachfinger, i.e. the thumb and little finger of right and left hands, thesame 10 letters were written in random order with a sharpenedpencil, according to the natural speed of the experimenter. Toexclude task learning effects, 5 letters were provided for eachfinger and other 5 were given in inverse finger order (e.g. thumb L,little finger L, thumb R, little finger R, little finger R, thumb R,little finger L, thumb L). Before starting the task, the subject wasprovided by the 10 letters written on the four fingertips, to adapt tothe experimenter's way of writing specific letters. The average timerequired between the two 5 letter sequences was assigned as thescore for each finger; accordingly, higher dexterity corresponds tolower Fingertip writing test score.
The experimental protocol followed the standard ethicaldirectives of the declaration of Helsinki and was approved by thelocal Ethics Committee. Full informed consent was acquired fromall enrolled subjects.
Recordings
Measurements were performed inside a magnetically shieldedroom (Vacuumschmelze GmBH), using a 28-channel system(Foglietti et al., 1991; Tecchio et al., 1997), the active channelsbeing regularly distributed on a spherical surface (13.5 cm ofcurvature radius) and covering a total area of about 180 cm2. Out ofthe 28 channels, inner 16 are axial gradiometers — 8 cm baselineand 9 mm pick-up coil diameter, peripheral 9 are squared magneto-meters — 9 mm pick-up coil edge, 3 balancing magnetometers aredevoted to noise reduction. The noise spectral density of eachmagnetic sensor was 5–7 fT/Hz1/2 above 1 Hz.
Brain magnetic fields were recorded in left and right hemispherevia a single positioning of the sensors on the scalp contra-lateral tothe stimulated side, by centering the MEG recording apparatus overthe hand sensorimotor cortex (corresponding to the C3/C4 site of theInternational 10–20 electroencephalographic system). The entireprocedure (preparation and recording) lasted 45 min.
Data were filtered through a 0.16–250-Hz bandpass andgathered at 1000-Hz sampling rate for off-line processing.
Data analysis
Functional source separation (FSS)The FSS procedure developed by our group (Barbati et al.,
2006) was applied to extract the activity from the two cortical
187F. Tecchio et al. / NeuroImage 35 (2007) 185–193
neural networks representing the contra-lateral thumb (FST) andlittle finger (FSL). In the published paper, the two sources wereobtained in the left hemisphere. Here the extraction was performedalso in the right hemisphere in all subjects.
Dynamic intra-regional synchrony indexes: the phase lockingindex
The network phase locking dynamic measure was obtainedaccordingly with the procedure previously applied by our group(Tecchio et al., 2004). After the extraction of sources related to theactivity of thumb (FST(t)) and little finger (FSL(t)) neuronalnetwork (Barbati et al., 2006), the network phase locking indexwas obtained by the following steps:
1) the FST(t) and FSL(t) signals were forward–backward bandpass filtered in the classical alpha (α=[7 to 13]Hz), beta (β=[14 to 32]Hz) and gamma (γ=[33 to 45]Hz) bands by aButterworth filter of the second order, obtaining FSX
b (t)signals, where X=T, L; b=α, β, γ;
2) the analytic signals of FSXb(t) were calculated in each band:
abxðtÞ ¼ FSbX ðtÞ þ ihbX ðtÞ ð1Þ
where hXb(t) is the FSX
b(t) Hilbert transform. The analyticsignal was studied rather than the signal itself, to separatelyexpress amplitude and phase of FSX, maintaining the sametime resolution of the original signal;
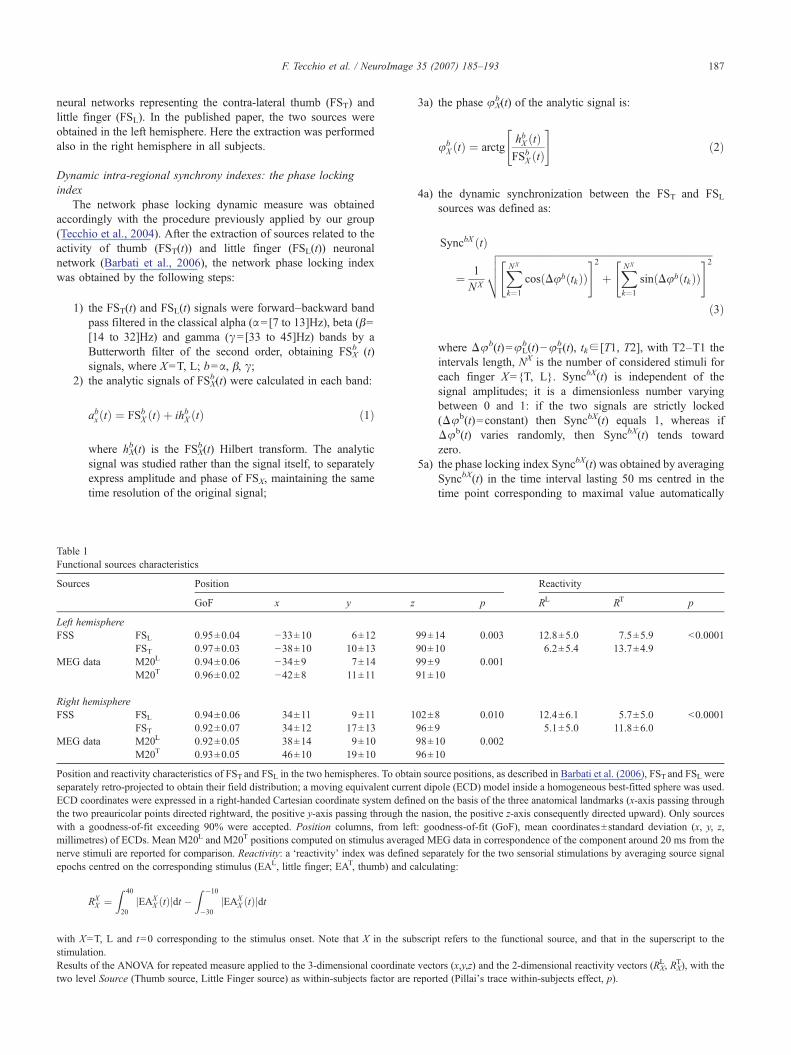
Table 1Functional sources characteristics
Sources Position
GoF x y
Left hemisphereFSS FSL 0.95±0.04 −33±10 6±12
FST 0.97±0.03 −38±10 10±13MEG data M20L 0.94±0.06 −34±9 7±14
M20T 0.96±0.02 −42±8 11±11
Right hemisphereFSS FSL 0.94±0.06 34±11 9±11
FST 0.92±0.07 34±12 17±13MEG data M20L 0.92±0.05 38±14 9±10
M20T 0.93±0.05 46±10 19±10
Position and reactivity characteristics of FST and FSL in the two hemispheres. To obseparately retro-projected to obtain their field distribution; a moving equivalent curECD coordinates were expressed in a right-handed Cartesian coordinate system dethe two preauricolar points directed rightward, the positive y-axis passing throughwith a goodness-of-fit exceeding 90% were accepted. Position columns, from lmillimetres) of ECDs. Mean M20L and M20T positions computed on stimulus avernerve stimuli are reported for comparison. Reactivity: a ‘reactivity’ index was defiepochs centred on the corresponding stimulus (EAL, little finger; EAT, thumb) and
RXX ¼
Z 40
20jEAX
X ðtÞjdt �Z �10
�30jEAX
X ðtÞjdt
with X=T, L and t=0 corresponding to the stimulus onset. Note that X in the sstimulation.Results of the ANOVA for repeated measure applied to the 3-dimensional coordinatwo level Source (Thumb source, Little Finger source) as within-subjects factor ar
3a) the phase φXb(t) of the analytic signal is:
ubX tð Þ ¼ arctg
hbX ðtÞFSbX ðtÞ
" #ð2Þ
4a) the dynamic synchronization between the FST and FSLsources was defined as:
SyncbX tð Þ
¼ 1NX
ffiffiffiffiffiffiffiffiffiffiffiffiffiffiffiffiffiffiffiffiffiffiffiffiffiffiffiffiffiffiffiffiffiffiffiffiffiffiffiffiffiffiffiffiffiffiffiffiffiffiffiffiffiffiffiffiffiffiffiffiffiffiffiffiffiffiffiffiffiffiffiffiffiffiffiffiffiffiffiffiffiffiffiffiffiffiXNX
k¼1
cosðDubðtkÞÞ" #2
þXNX
k¼1
sinðDubðtkÞÞ" #2
vuutð3Þ
where Δφb(t)=φLb(t)−φT
b(t), tk∈ [T1, T2], with T2–T1 theintervals length, NX is the number of considered stimuli foreach finger X={T, L}. SyncbX(t) is independent of thesignal amplitudes; it is a dimensionless number varyingbetween 0 and 1: if the two signals are strictly locked(Δφb(t)=constant) then SyncbX(t) equals 1, whereas ifΔφb(t) varies randomly, then SyncbX(t) tends towardzero.
5a) the phase locking index SyncbX(t) was obtained by averagingSyncbX(t) in the time interval lasting 50 ms centred in thetime point corresponding to maximal value automatically
Reactivity
z p RL RT p
99±14 0.003 12.8±5.0 7.5±5.9 <0.000190±10 6.2±5.4 13.7±4.999±9 0.00191±10
102±8 0.010 12.4±6.1 5.7±5.0 <0.000196±9 5.1±5.0 11.8±6.098±10 0.00296±10
tain source positions, as described in Barbati et al. (2006), FST and FSL wererent dipole (ECD) model inside a homogeneous best-fitted sphere was used.fined on the basis of the three anatomical landmarks (x-axis passing throughthe nasion, the positive z-axis consequently directed upward). Only sourceseft: goodness-of-fit (GoF), mean coordinates±standard deviation (x, y, z,aged MEG data in correspondence of the component around 20 ms from thened separately for the two sensorial stimulations by averaging source signalcalculating:
ubscript refers to the functional source, and that in the superscript to the
te vectors (x,y,z) and the 2-dimensional reactivity vectors (RXL, RX
T), with thee reported (Pillai's trace within-subjects effect, p).
188 F. Tecchio et al. / NeuroImage 35 (2007) 185–193
found between 20 and 100 ms after the stimulus onset(tMAX):
SyncbX ¼XtMAXþ25
t¼tMAX�25
SyncbX ðtÞ ð4Þ
To be noted, the time dependent behaviour of the phase lockingindex was obtained in the two different conditions of thumb and littlefinger stimulations. In conclusion, the index SyncbX estimates thephase synchronization between the two finger source rhythmicactivities in each frequency band (b=alpha, beta, gamma) whilestimulating each of two contra-lateral fingers (X=thumb, little finger).
Dynamic intra-regional synchrony indexes: the amplitude indexSimilarly to the phase locking index, an amplitude index AmplbX
was calculated separately in alpha, beta and gamma frequency bandsand during separate stimulation of each finger by the following steps:
1) and 2) as above defined;3b) the modulus |aX
b(t)| of the analytic signal is:
jabX ðtÞj ¼ffiffiffiffiffiffiffiffiffiffiffiffiffiffiffiffiffiffiffiffiffiffiffiffiffiffiffiffiffiffiffiffiffiffihbX ðtÞ2 þ FSbX ðtÞ2
qð5Þ
4b) the modulus of the analytical signals from FST(t) and FSL(t)in each band were calculated and averaged across all stimuliepochs separately as:
AmplbXX tð Þ ¼ 1NX
XNX
k¼1
jabX tkð Þj ð6Þ
Again, X in the subscript refers to the functional source, andin the superscript to the stimulation condition.
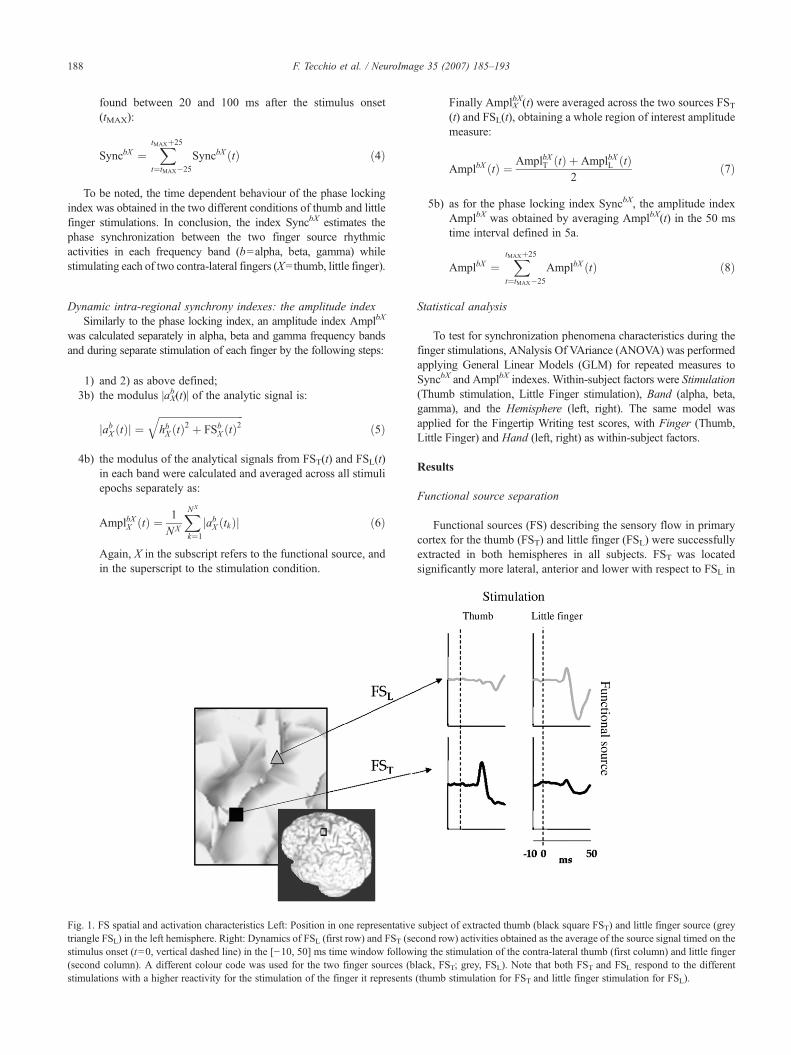
Fig. 1. FS spatial and activation characteristics Left: Position in one representativetriangle FSL) in the left hemisphere. Right: Dynamics of FSL (first row) and FST (sestimulus onset (t=0, vertical dashed line) in the [−10, 50] ms time window follow(second column). A different colour code was used for the two finger sources (bstimulations with a higher reactivity for the stimulation of the finger it represents
Finally AmplXbX(t) were averaged across the two sources FST
(t) and FSL(t), obtaining a whole region of interest amplitudemeasure:
AmplbX tð Þ ¼ AmplbXT ðtÞ þ AmplbXL ðtÞ2
ð7Þ
5b) as for the phase locking index SyncbX, the amplitude indexAmplbX was obtained by averaging AmplbX(t) in the 50 mstime interval defined in 5a.
AmplbX ¼XtMAXþ25
t¼tMAX�25
AmplbX ðtÞ ð8Þ
Statistical analysis
To test for synchronization phenomena characteristics during thefinger stimulations, ANalysis Of VAriance (ANOVA) was performedapplying General Linear Models (GLM) for repeated measures toSyncbX and AmplbX indexes. Within-subject factors were Stimulation(Thumb stimulation, Little Finger stimulation), Band (alpha, beta,gamma), and the Hemisphere (left, right). The same model wasapplied for the Fingertip Writing test scores, with Finger (Thumb,Little Finger) and Hand (left, right) as within-subject factors.
Results
Functional source separation
Functional sources (FS) describing the sensory flow in primarycortex for the thumb (FST) and little finger (FSL) were successfullyextracted in both hemispheres in all subjects. FST was locatedsignificantly more lateral, anterior and lower with respect to FSL in
subject of extracted thumb (black square FST) and little finger source (greycond row) activities obtained as the average of the source signal timed on theing the stimulation of the contra-lateral thumb (first column) and little fingerlack, FST; grey, FSL). Note that both FST and FSL respond to the different(thumb stimulation for FST and little finger stimulation for FSL).
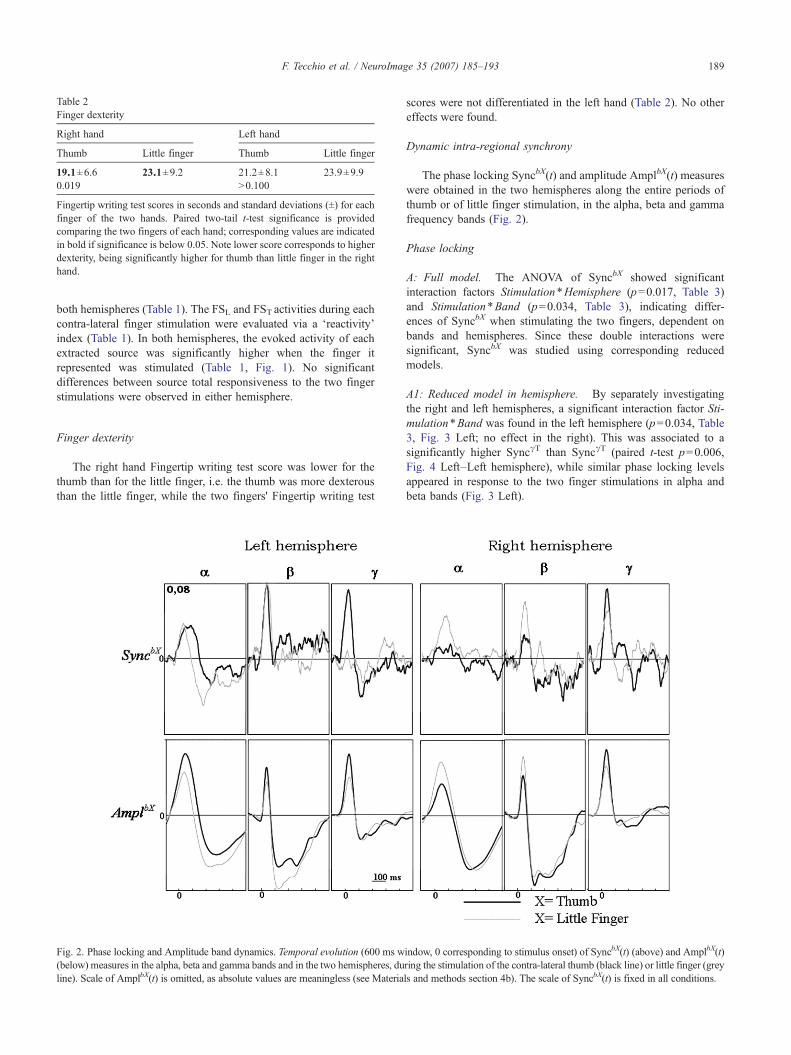
Table 2Finger dexterity
Right hand Left hand
Thumb Little finger Thumb Little finger
19.1±6.6 23.1±9.2 21.2±8.1 23.9±9.90.019 >0.100
Fingertip writing test scores in seconds and standard deviations (±) for eachfinger of the two hands. Paired two-tail t-test significance is providedcomparing the two fingers of each hand; corresponding values are indicatedin bold if significance is below 0.05. Note lower score corresponds to higherdexterity, being significantly higher for thumb than little finger in the righthand.
189F. Tecchio et al. / NeuroImage 35 (2007) 185–193
both hemispheres (Table 1). The FSL and FST activities during eachcontra-lateral finger stimulation were evaluated via a ‘reactivity’index (Table 1). In both hemispheres, the evoked activity of eachextracted source was significantly higher when the finger itrepresented was stimulated (Table 1, Fig. 1). No significantdifferences between source total responsiveness to the two fingerstimulations were observed in either hemisphere.
Finger dexterity
The right hand Fingertip writing test score was lower for thethumb than for the little finger, i.e. the thumb was more dexterousthan the little finger, while the two fingers' Fingertip writing test
Fig. 2. Phase locking and Amplitude band dynamics. Temporal evolution (600 ms w(below) measures in the alpha, beta and gamma bands and in the two hemispheres, duline). Scale of AmplbX(t) is omitted, as absolute values are meaningless (see Materia
scores were not differentiated in the left hand (Table 2). No othereffects were found.
Dynamic intra-regional synchrony
The phase locking SyncbX(t) and amplitude AmplbX(t) measureswere obtained in the two hemispheres along the entire periods ofthumb or of little finger stimulation, in the alpha, beta and gammafrequency bands (Fig. 2).
Phase locking
A: Full model. The ANOVA of SyncbX showed significantinteraction factors Stimulation*Hemisphere (p=0.017, Table 3)and Stimulation*Band (p=0.034, Table 3), indicating differ-ences of SyncbX when stimulating the two fingers, dependent onbands and hemispheres. Since these double interactions weresignificant, SyncbX was studied using corresponding reducedmodels.
A1: Reduced model in hemisphere. By separately investigatingthe right and left hemispheres, a significant interaction factor Sti-mulation*Band was found in the left hemisphere (p=0.034, Table3, Fig. 3 Left; no effect in the right). This was associated to asignificantly higher SyncγT than SyncγT (paired t-test p=0.006,Fig. 4 Left–Left hemisphere), while similar phase locking levelsappeared in response to the two finger stimulations in alpha andbeta bands (Fig. 3 Left).
indow, 0 corresponding to stimulus onset) of SyncbX(t) (above) and AmplbX(t)ring the stimulation of the contra-lateral thumb (black line) or little finger (greyls and methods section 4b). The scale of SyncbX(t) is fixed in all conditions.
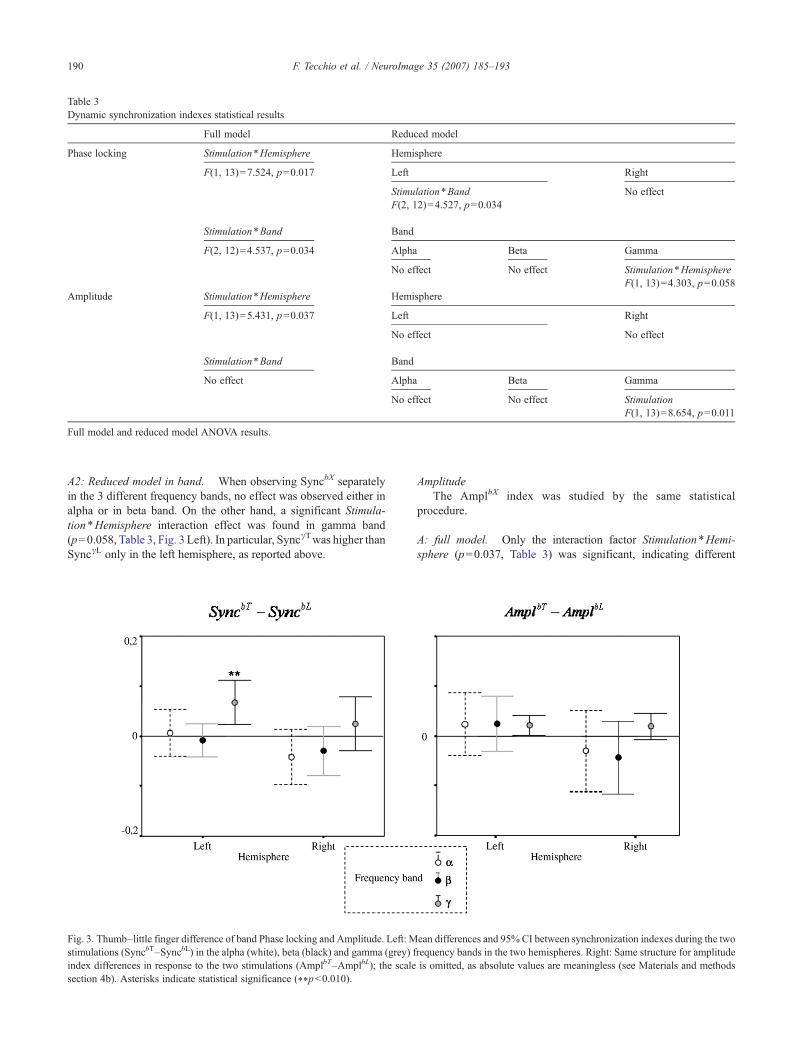
Table 3Dynamic synchronization indexes statistical results
Full model Reduced model
Phase locking Stimulation*Hemisphere Hemisphere
F(1, 13)=7.524, p=0.017 Left Right
Stimulation*BandF(2, 12)=4.527, p=0.034
No effect
Stimulation*Band Band
F(2, 12)=4.537, p=0.034 Alpha Beta Gamma
No effect No effect Stimulation*HemisphereF(1, 13)=4.303, p=0.058
Amplitude Stimulation*Hemisphere Hemisphere
F(1, 13)=5.431, p=0.037 Left Right
No effect No effect
Stimulation*Band Band
No effect Alpha Beta Gamma
No effect No effect StimulationF(1, 13)=8.654, p=0.011
Full model and reduced model ANOVA results.
190 F. Tecchio et al. / NeuroImage 35 (2007) 185–193
A2: Reduced model in band. When observing SyncbX separatelyin the 3 different frequency bands, no effect was observed either inalpha or in beta band. On the other hand, a significant Stimula-tion*Hemisphere interaction effect was found in gamma band(p=0.058, Table 3, Fig. 3 Left). In particular, SyncγTwas higher thanSyncγL only in the left hemisphere, as reported above.
Fig. 3. Thumb–little finger difference of band Phase locking and Amplitude. Left: Mstimulations (SyncbT–SyncbL) in the alpha (white), beta (black) and gamma (grey) findex differences in response to the two stimulations (AmplbT–AmplbL); the scalesection 4b). Asterisks indicate statistical significance (⁎⁎p<0.010).
AmplitudeThe AmplbX index was studied by the same statistical
procedure.
A: full model. Only the interaction factor Stimulation*Hemi-sphere (p=0.037, Table 3) was significant, indicating different
ean differences and 95% CI between synchronization indexes during the tworequency bands in the two hemispheres. Right: Same structure for amplitudeis omitted, as absolute values are meaningless (see Materials and methods

Fig. 4. Gamma band Phase locking and Amplitude. In the gamma band, mean and 95% confidence interval of the synchronization index (SyncγX, Left) andamplitude index (AmplγX, Right), following thumb (square) and little finger (triangle) stimulation in the two hemispheres.
Table 4Relationship between finger dexterity and gamma phase locking
Right hand Left hand
Thumb Little finger Thumb Little finger
r −0.35 −0.56 0.10 −0.05p <0.001 <0.001 >0.100 >0.100
Correlation index (r) and significance (p) corresponding to the best fittingcurve SyncγX=a+bln(FtW) of gamma phase locking as a function of contra-lateral finger dexterity. The sign of the coefficient b in the equation isattributed to r, indicating the direction of the correlation. For thumb and littlefinger of the right hand, higher finger dexterity (lower Fingertip Writing testscore) significantly correlated with higher gamma band phase locking.
191F. Tecchio et al. / NeuroImage 35 (2007) 185–193
AmplbX behaviours in the two hemispheres when stimulating thethumb and the little finger, averaged across the three bands.
A1: Reducedmodel in hemisphere. No significant effect was found.
A2: Reduced model in band. Although in the full model theinteraction effect Stimulation * Band was not significant(p=0.473), to fully compare the two indexes, also AmplbX
was studied separately in each band. No effect was observedeither in alpha or in beta bands; on the contrary in the gammaband a significant Stimulation effect was found (p=0.011, Table3), associated to higher AmplγT than AmplγL averaging thevalues in the left and right hemispheres (Fig. 4 Right).Although no interaction with hemisphere was found, it can beobserved that only in the left hemisphere AmplγT wassignificantly higher than AmplγL (paired t-test p=0.039 left,0.170 right hemisphere).
Relationship between finger dexterity and dynamic intra-regionalsynchrony
Since the Fingertip writing test scores displayed hemisphericand district-related properties similar to the gamma band phaselocking, a correlation analysis was performed. However weobserved that linear correlation was not appropriate, being gammaphase locking levels close to zero in correspondence to longerdiscrimination times. For this reason we tried to fit an exponentialmodel. The best goodness-of-fit was obtained by SyncγX=a+bln(FtW). The 4 fits of the gamma phase locking index in left andright hemispheres for thumb and little finger stimulation wereobtained as a function of the corresponding contra-lateral fingerFingertip writing test score. Higher levels of gamma phaselocking corresponded to higher finger dexterity for both thumband little finger in the right hand, while no significant relationshipwas present between the left hand fingers and the gammasynchronization (Table 4).
Discussion
Selectively high gamma band phase locking within the primarysomatosensory neural network devoted to the more dexterous fingerwas found in the dominant hemisphere. Moreover, the gamma bandphase locking in the dominant hemisphere correlated with thecontra-lateral hand finger dexterity. In fact, in the left hemisphere theneural network devoted to thumb control was much more phase-locked in gamma band than the little finger representation did, underthe same sensory stimulation to the two fingers. This property wasnot present in the other oscillatory frequency bands characteristic ofthe network responsiveness. Also, the effect was definitely strongerfor phase locking than for amplitude, revealing that the functionalmeaning is carried by the synchronization, and it is masked in theamplitudemeasure, where synchronization levels are hidden by theirintricate interplay with the number of involved neurons. Finally, inthe left hemisphere the phase locking indexwas positively correlatedwith finger dexterity. None of these properties was present in thenon-dominant hemisphere.
These findings properly fit modelling proposed by the ‘temporalbinding’ theory of perception (Singer, 1999; Engel and Singer,2001; Varela et al., 2001). This model assumes that neural
192 F. Tecchio et al. / NeuroImage 35 (2007) 185–193
synchrony with precision in the millisecond range is crucial notonly for object representation, response selection, attention andsensorimotor integration, but it is supposed to enhance the saliencyof neural responses (Alonso et al., 1996; Wallace et al., 1996; Baueret al., 2006). A crucial ingredient of the model is that synchrony canbe modulated by intrinsic signals that reflect experience,contextual influences and action goals (Riehle et al., 2000;Von Stein et al., 2000; Lutzenberger et al., 2002; Kaiser and Lut-zenberger, 2005). Present results indicate that this key mechan-ism, active in goal definition, action planning and selectiveattention (Tiitinen et al., 1993; Tallon-Baudry et al., 1997;Rodriguez et al., 1999, Tallon-Baudry and Bertrand, 1999), become‘structural’ of the network devoted to the most dexterous dis-trict. In agreement, the ‘dynamicist’ top-down theory (Engel etal., 2001) proposes that the role played by synchronizationphenomena in long-term memory includes not only declarativememories but also the procedural knowledge stored in the functionalarchitecture of sensorimotor networks, where the topology of lateralconnections within cortical areas is known to embody storedpredictions that have been acquired both during evolution andthrough experience-dependent learning (Hebb, 1949; Von Stein etal., 2000; Petersen and Sakmann, 2001). The present results suggestthat not only between two different executions of the same task, anetwork performs better when synchronizes more in the gammaband (Sanes and Donoghue, 1993; MacKay and Mendonca, 1995;Riehle et al., 1997, 2000; Herculano-Houzel et al., 1999; Roy et al.,2001), but also between two networks executing the same task, themore intrinsically skilful synchronizes more in the gamma band.
Central information coding relies on the existence of neurallinks between peripheral receptors and specific cortical neuronalpools, resulting in the somatotopic, tonotopic-, retinotopic-representations (Kandel and Schwartz, 1985). Present findingscomplement classical and unfailingly confirmed knowledge that thesomatotopic representation follows the well known principle ofcortical magnification, i.e. the area of the cortical surface devoted toa unit area of body surface parallels the functional importance of thislatter (Penfield and Rasmussen, 1953; Corsi, 1991). Thus, the thumbis represented by larger cortical areas than the little finger(Nakamura et al., 1998; Hlustik et al., 2001; Shoham and Grinvald,2001), as well the dominant hand cortical area is larger with respectto the non-dominant (LaMendola and Bever, 1997; Triggs et al.,1999; Zappasodi et al., 2006). The phase locking index is completelyindependent of the number of recruited neurons, and it was higher inthe gamma band for the finger with higher functional importance,under the same sensory stimuli impinging on the different fingercentral representations. Activations emerging from the same passivestimuli allowed comparison of intrinsic network properties. The newfinding is that a network more skilled than another intrinsicallyresponds with higher synchronization in gamma bandwith respect toa less skilled network to the same simple stimuli.
By our new source extraction procedure, it was possible tostudy finger cortical representations while stimulating differentfingers. Not only were Functional Sources proven to describenetworks of complex nature with specific district related properties(Barbati et al., 2006), but also they permitted a more profoundunderstanding of intra-regional synchronization phenomena.
In conclusion, these results suggest the dynamic intra-regionalphase locking in the gamma band as a coding mechanism forfunctional prevalence, in addition to the magnification principle ofthe somatotopic central maps. We suggest that a highly developedneural network uses by default the activation properties for better
performance (i.e. high gamma band synchronization), even inresponse to simple stimuli.
Acknowledgments
This work has been partially supported by the IST/FET Integ-rated Project NEUROBOTICS — The fusion of NEUROscienceand roBOTICS, Project no. 001917 under the 6th FrameworkProgramme, FIRB 2003060892 and PRIN 2005027850 of theItalian Department of University and Education (MIUR).
The authors thank Professor Gian Luca Romani, ProfessorVittorio Pizzella, Dr. Patrizio Pasqualetti and TNFP MatildeErcolani for their continuous support; Dr. Filomena Moffa for hersuggestions about finger-specific sensory testing.
References
Alonso, J.M., Usrey, W.M., Reid, R.C., 1996. Precisely correlated firing incells of the lateral geniculate nucleus. Nature 383, 815–819.
Barbati, G., Sigismondi, R., Zappasodi, F., Porcaro, C., Graziadio, S.,Valente, G., Balsi, M., Rossini, P.M., Tecchio, F., 2006. Functionalsource separation from magnetoencephalographic signals. Hum. BrainMapp. 27, 925–934.
Bauer, M., Oostenveld, R., Peeters, M., Fries, P., 2006. Tactile spatial attentionenhances gamma-band activity in somatosensory cortex and reduces low-frequency activity in parieto-occipital areas. J. Neurosci. 26, 490–501.
Cichocki, A., Amari, S., 2002. Adaptive Blind Signal and Image Processing.Wiley.
Corsi, P., 1991. The Enchanted Loom: Chapters in the History ofNeuroscience. Oxford Univ. Press, New York.
Crone, N.E., Miglioretti, D.L., Gordon, B., Lesser, R.P., 1998a. Functionalmapping of human sensorimotor cortex with electrocorticographicspectral analysis: II. Event-related synchronization in the gamma band.Brain 121, 2301–2315.
Crone, N.E., Miglioretti, D.L., Gordon, B., Sieracki, J.M., Wilson, M.T.,Uematsu, S., Lesser, R.P., 1998b. Functional mapping of humansensorimotor cortex with electrocorticographic spectral analysis. I.Alpha and beta event-related desynchronization. Brain 121, 2271–2299.
Engel, A.K., Singer, W., 2001. Temporal binding and the neural correlates ofsensory awareness. Trends Cogn. Sci. 5, 16–25.
Engel, A.K., Fries, P., Singer, W., 2001. Dynamic predictions: oscillationsand synchrony in top-down processing. Nat. Rev., Neurosci. 2,704–716.
Engel, A.K., Moll, C.K., Fried, I., Ojemann, G.A., 2005. Invasive recordingsfrom the human brain: clinical insights and beyond. Nat. Rev., Neurosci.6, 35–47.
Foglietti, V., Del Gratta, C., Pasquarelli, A., Pizzella, V., Torrioni, G.,Romani, G.L., Gallagher, W., Ketchen, M.B., Kleinasser, A.W.,Sandrom, R.L., 1991. 28-Channel hybrid system for neuro-magneticmeasurements. IEEE Trans. MG 27, 2959–2962.
Gerloff, C., Richard, J., Hadley, J., Schulman, A.E., Honda, M., Hallett, M.,1998. Functional coupling and regional activation of human corticalmotor areas during simple, internally paced and externally paced fingermovements. Brain 121, 1513–1531.
Harley, J.P., Grafman, J., 1983. Fingertip number writing errors inhospitalized non-neurologic patients. Percept. Mot. Skills 56, 551–554.
Hebb, D.O., 1949. The Organization of Behavior. Wiley, New York.Herculano-Houzel, S., Munk, M.H., Neuenschwander, S., Singer, W., 1999.
Precisely synchronized oscillatory firing patterns require electroence-phalographic activation. J. Neurosci. 19, 3992–4010.
Hlustik, P., Solodkin, A., Gullapalli, R.P., Noll, D.C., Small, S.L., 2001.Somatotopy in human primary motor and somatosensory handrepresentations revisited. Cereb. Cortex 11, 312–321.
193F. Tecchio et al. / NeuroImage 35 (2007) 185–193
Kaiser, J., Lutzenberger, W., 2005. Cortical oscillatory activity and thedynamics of auditory memory processing. Rev. Neurosci. 16, 239–254.
Kandel, E.R., Schwartz, J.H., 1985. Principles of Neural Science, New York:Elsevier, pp. 316–300; 366–383.
LaMendola, N.P., Bever, T.G., 1997. Peripheral and cerebral asymmetries inthe rat. Science 278, 483–486.
Lezak, M.D., 1976. Neuropsychological Assessment. Oxford Univ. Press,New York.
Lutzenberger, W., Ripper, B., Busse, L., Birbaumer, N., Kaiser, J., 2002.Dynamics of gamma-band activity during an audiospatial workingmemory task in humans. J. Neurosci. 22, 5630–5638.
MacKay, W.A., Mendonca, A.J., 1995. Field potential oscillatory bursts inparietal cortex before and during reach. Brain Res. 704, 167–174.
Meador, K.J., Ray, P.G., Echauz, J.R., Loring, D.W., Vachtsevanos, G.J.,2002. Gamma coherence and conscious perception. Neurology 59,847–854.
Nakamura, A., Yamada, T., Goto, A., Kato, T., Ito, K., Abe, Y., Kachi, T.,Kakigi, R., 1998. Somatosensory homunculus as drawn by MEG.NeuroImage 7, 377–386.
Oldfield, R.C., 1971. The assessment and analysis of handedness: theEdinburgh inventory. Neuropsychologia 9, 97–113.
Palva, S., Linkenkaer-Hansen, K., Naatanen, R., Palva, J.M., 2005a. Earlyneural correlates of conscious somatosensory perception. J. Neurosci.25, 5248–5258.
Palva, J.M., Palva, S., Kaila, K., 2005b. Phase synchrony among neuronaloscillations in the human cortex. J. Neurosci. 25, 3962–3972.
Penfield, W., Rasmussen, T., 1953. The Cerebral Cortex of Man: AClinical Study of Localization of Function. Macmillan, New York,p. 14.
Petersen, C.C., Sakmann, B., 2001. Functionally independent columns of ratsomatosensory barrel cortex revealed with voltage-sensitive dyeimaging. J. Neurosci. 21, 8435–8446.
Pfurtscheller, G., Lopes da Silva, F.H., 1999. Event-related EEG/MEGsynchronization and desynchronization: basic principles. Clin. Neuro-physiol. 110, 1842–1857.
Quiroga, Q.R., Kraskov, A., Kreuz, T., Grassberger, P., 2002. Performanceof different synchronization measures in real data: a case study onelectroencephalographic signals. Phys. Rev., E 65, 041903.
Riehle, A., Gruen, S., Diesmann, M., Aertsen, A., 1997. Spike synchroniza-tion and rate modulation differentially involved in motor corticalfunction. Science 278, 1950–1953.
Riehle, A., Grammont, F., Diesmann, M., Grün, S., 2000. Dynamicalchanges and temporal precision of synchronized spiking activity inmonkey motor cortex during movement preparation. J. Physiol. 94,569–582.
Rodriguez, E., George, N., Lachaux, J.P., Martinerie, J., Renault, B., Varela,F.J., 1999. Perception's shadow: long-distance synchronization ofhuman brain activity. Nature 397, 430–433.
Roskies, A., 1999. The binding problem: special issue. Neuron 24, 7–125.Roy, S., Alloway, K.D., 1999. Synchronization of local neural networks in
the somatosensory cortex: a comparison of stationary and movingstimuli. J. Neurophysiol. 81, 999–1013.
Roy, S.A., Dear, S.P., Alloway, K.D., 2001. Long-range corticalsynchronization without concomitant oscillations in the somatosensorysystem of anesthetized cats. J. Neurosci. 21, 1795–1808.
Russell, E.W., Neuringer, C., Glodstein, G., 1970. Assessment of BrainDamage, A Neuropsychological Key Approach. Wiley-Interscience,New York.
Sanes, J.N., Donoghue, J.P., 1993. Oscillations in local field potentials of theprimate motor cortex during voluntary movement. Proc. Natl. Acad. Sci.U. S. A. 90, 4470–4474.
Shoham, D., Grinvald, A., 2001. The cortical representation of the hand inmacaque and human area S-I: high resolution optical imaging. J. Neurosci.21, 6820–6835.
Simoes, C., Jensen, O., Parkkonen, L., Hari, R., 2003. Phase lockingbetween human primary and secondary somatosensory cortices. Proc.Natl. Acad. Sci. U. S. A. 100, 2691–2694.
Singer, W., 1999. Neuronal synchrony: a versatile code for the definition ofrelations? Neuron 24, 49–65.
Tallon-Baudry, C., Bertrand, O., 1999. Oscillatory gamma activity inhumans and its role in object representation. Trends Cogn. Sci. 3,151–162.
Tallon-Baudry, C., Bertrand, O., Peronnet, F., Pernier, J., 1997. Oscillatoryγ-band (30–70 Hz) activity induced by a visual search task in humans.J. Neurosci. 17, 722–734.
Tecchio, F., Rossini, P.M., Pizzella, V., Cassetta, E., Romani, G.L., 1997.Spatial properties and interhemispheric differences of the sensory handcortical representation: a neuromagnetic study. Brain Res. 29,100–108.
Tecchio, F., Babiloni, C., Zappasodi, F., Vecchio, F., Pizzella, V., Romani,G.L., Rossini, P.M., 2003. Gamma synchronization in human primarysomatosensory cortex as revealed by somatosensory evoked neuro-magnetic fields. Brain Res. 906, 63–70.
Tecchio, F., De Lucia, M., Palustri, C., Babiloni, C., Bottaccio, M.,Montuosi, M., Pietronero, L., Zappasodi, F., Rossini, P.M., 2004.District-related frequency specificity in hand cortical representation:dynamics of regional activation and intra-regional functional connectiv-ity. Brain Res. 1014, 80–86.
Tiitinen, H., Sinkkonen, J., Reinikainen, K., Alho, K., Lavikainen, J.,Naatanen, R., 1993. Selective attention enhances the auditory 40-Hztransient response in humans. Nature 364, 59–60.
Triggs, W.J., Subramanium, B., Rossi, F., 1999. Hand preference andtranscranial magnetic stimulation asymmetry of cortical motor repre-sentation. Brain Res. 835, 324–329.
Varela, F., Lachaux, J.-P., Rodriguez, E., Martinerie, J., 2001. The brainweb:phase synchronization and large-scale integration. Nat. Rev., Neurosci.2, 229–239.
Von Stein, A., Chiang, C., König, P., 2000. Top-down processing mediatedby interareal synchronization. Proc. Nat. Acad. Sci. U. S. A. 97,14748–14753.
Wallace, M.T., Wilkinson, L.K., Stein, B.E., 1996. Representation and integ-ration of multiple sensory inputs in primate superior colliculus. J. Neu-rophysiol. 76, 1246–1266.
Womelsdorf, T., Fries, P., Mitra, P.P., Desimone, R., 2006. Gamma-bandsynchronization in visual cortex predicts speed of change detection.Nature 439, 733–736.
Zappasodi, F., Pasqualetti, P., Ercolani, M., Pizzella, V., Rossini, P.M.,Tecchio, F., 2006. Hand cortical representation at rest and duringactivation: gender and age effects in the two hemispheres. Clin.Neurophysiol. 117, 1518–1528.
Copyright © 2022 FDOKUMEN