Climatically driven synchrony of gerbil populations allows large-scale plague outbreaks
7
Climatically driven synchrony of gerbil populations allows large-scale plague outbreaks Kyrre Linne ´ Kausrud 1 , Hildegunn Viljugrein 1 , Arnoldo Frigessi 2 , Mike Begon 3 , Stephen Davis 4 , Herwig Leirs 4,5 , Vladimir Dubyanskiy 6 and Nils Chr. Stenseth 1, * 1 Centre for Ecological and Evolutionary Synthesis (CEES), Department of Biology, University of Oslo, PO Box 1066, 0316 Oslo, Norway 2 Statistics for Innovation, University of Oslo, 0317 Oslo, Norway 3 School of Biological Sciences, University of Liverpool, Liverpool L69 7ZB, UK 4 Department of Biology, University of Antwerp, Groenenborgerlaan 171, 2020 Antwerp, Belgium 5 Faculty of Agricultural Sciences, University of Aarhus, PO Box 50, 8830 Tjele, Kongens Lyngby, Denmark 6 Kazakh Scientific Centre for Quarantine and Zoonotic Diseases, 14 Kapalskaya Street, Almaty 480074, Republic of Kazakhstan In central Asia, the great gerbil (Rhombomys opimus) is the main host for the bacterium Yersinia pestis, the cause of bubonic plague. In order to prevent plague outbreaks, monitoring of the great gerbil has been carried out in Kazakhstan since the late 1940s. We use the resulting data to demonstrate that climate forcing synchronizes the dynamics of gerbils over large geographical areas. As it is known that gerbil densities need to exceed a threshold level for plague to persist, synchrony in gerbil abundance across large geographical areas is likely to be a condition for plague outbreaks at similar large scales. Here, we substantiate this proposition through autoregressive modelling involving the normalized differentiated vegetation index as a forcing covariate. Based upon predicted climate changes, our study suggests that during the next century, plague epizootics may become more frequent in central Asia. Keywords: climate change; Yersinia pestis; normalized differentiated vegetation index; central Asia; black death; Moran effect 1. INTRODUCTION The great gerbil (Rhombomys opimus) is a major host ( Pollitzer 1966; Gage & Kosoy 2004) of the plague bacterium (Yersinia pestis) in the central Asian deserts. Great gerbils are facultatively social rodents ( Randall et al. 2005) where one or more family groups inhabit one burrow system. The number of burrow systems and their size remain fairly stable, especially the large, complex burrow systems in high-quality habitat ( Naumov & Lobachev 1975). As population densities increase, empty burrow systems of lower quality become reoccupied. While adults may visit colonies up to 400 m away, dispersal movements seem limited to approximately 5 km ( Rothschild 1978; Randall & Rogovin 2002). The intensity of reproduction is highest in early summer, with females usually having one but occasionally up to three litters per year ( Naumov & Lobachev 1975). The gerbils spend most of the winter in the burrows in a largely inactive state, living off plant material stored during the summer. The climate of the central Asian desert is arid continental, with summer temperatures frequently above 358C, winter temperatures below K208C, large diurnal temperature variation and a mean annual precipitation of less than 200 mm. The study region consists mostly of scrubland, with a few more productive regions close to the rivers Ili and Karatal (figure 1b). A number of arthropod parasites inhabit the burrows, and fleas (mostly of the genus Xenopsylla) act as the primary vectors of Y. pestis infection ( Pollitzer 1966; Gage & Kosoy 2004). It has been shown ( Davis et al. 2004) that gerbil abundance must be above a threshold level for sylvatic plague to spread in the population. Thus, the spatial structure of gerbil population syn- chrony over large areas is of special interest since it is of fundamental importance for the frequency, scale and magnitude of the plague epizootics. Our ability to predict plague epizootics, and thereby the risk of transmission to humans, will be improved by increasing our understanding of the dynamics of the great gerbils at large spatial scales. To this end, we use monitoring data on gerbil dynamics covering the period from the late 1940s until the present, together with remotely sensed environmental data, to quantify the role of climate in determining and synchroni- zing the dynamics of great gerbil populations. 2. MATERIAL AND METHODS (a) Population and prevalence data Our study area is the PreBalkhash plague focus of south- eastern Kazakhstan (748–788 E and 448–478 N). For moni- toring purposes, the focus has been divided into 10!10 km 2 , referred to as sectors. Four sectors constitute a 20!20 km primary square ( PSQ), and four PSQs constitute a large square Proc. R. Soc. B (2007) 274, 1963–1969 doi:10.1098/rspb.2007.0568 Published online 5 June 2007 Electronic supplementary material is available at http://dx.doi.org/10. 1098/rspb.2007.0568 or via http://www.journals.royalsoc.ac.uk. * Author for correspondence ([email protected]). Received 22 October 2006 Accepted 30 April 2007 1963 This journal is q 2007 The Royal Society
-
Upload
independent -
Category
Documents
-
view
3 -
download
0
Transcript of Climatically driven synchrony of gerbil populations allows large-scale plague outbreaks

Proc. R. Soc. B (2007) 274, 1963–1969
doi:10.1098/rspb.2007.0568
Climatically driven synchrony of gerbil populationsallows large-scale plague outbreaks
Kyrre Linne Kausrud1, Hildegunn Viljugrein1, Arnoldo Frigessi2, Mike Begon3,
Stephen Davis4, Herwig Leirs4,5, Vladimir Dubyanskiy6
and Nils Chr. Stenseth1,*1Centre for Ecological and Evolutionary Synthesis (CEES), Department of Biology, University of Oslo,
PO Box 1066, 0316 Oslo, Norway2Statistics for Innovation, University of Oslo, 0317 Oslo, Norway
3School of Biological Sciences, University of Liverpool, Liverpool L69 7ZB, UK4Department of Biology, University of Antwerp, Groenenborgerlaan 171, 2020 Antwerp, Belgium
5Faculty of Agricultural Sciences, University of Aarhus, PO Box 50, 8830 Tjele, Kongens Lyngby, Denmark6Kazakh Scientific Centre for Quarantine and Zoonotic Diseases, 14 Kapalskaya Street, Almaty 480074,
Republic of Kazakhstan
Published online 5 June 2007
Electron1098/rsp
*Autho
ReceivedAccepted
In central Asia, the great gerbil (Rhombomys opimus) is the main host for the bacterium Yersinia pestis, the
cause of bubonic plague. In order to prevent plague outbreaks, monitoring of the great gerbil has been
carried out in Kazakhstan since the late 1940s. We use the resulting data to demonstrate that climate
forcing synchronizes the dynamics of gerbils over large geographical areas. As it is known that gerbil
densities need to exceed a threshold level for plague to persist, synchrony in gerbil abundance across large
geographical areas is likely to be a condition for plague outbreaks at similar large scales. Here, we
substantiate this proposition through autoregressive modelling involving the normalized differentiated
vegetation index as a forcing covariate. Based upon predicted climate changes, our study suggests that
during the next century, plague epizootics may become more frequent in central Asia.
Keywords: climate change; Yersinia pestis; normalized differentiated vegetation index; central Asia;
black death; Moran effect
1. INTRODUCTION
The great gerbil (Rhombomys opimus) is a major host
(Pollitzer 1966; Gage & Kosoy 2004) of the plague
bacterium (Yersinia pestis) in the central Asian deserts.
Great gerbils are facultatively social rodents (Randall et al.
2005) where one or more family groups inhabit one burrow
system.The number ofburrow systems and their size remain
fairly stable, especially the large, complex burrow systems in
high-quality habitat (Naumov & Lobachev 1975). As
population densities increase, empty burrow systems of
lower quality become reoccupied. While adults may visit
colonies up to 400 m away, dispersal movements seem
limited to approximately 5 km (Rothschild 1978; Randall &
Rogovin 2002). The intensity of reproduction is highest in
early summer, with females usually having one but
occasionally up to three litters per year (Naumov &
Lobachev 1975). The gerbils spend most of the winter in
the burrows in a largely inactive state, living off plantmaterial
stored during the summer. The climate of the central Asian
desert is arid continental, with summer temperatures
frequently above 358C, winter temperatures below
K208C, large diurnal temperature variation and a mean
annual precipitation of less than 200 mm. The study region
ic supplementary material is available at http://dx.doi.org/10.b.2007.0568 or via http://www.journals.royalsoc.ac.uk.
r for correspondence ([email protected]).
22 October 200630 April 2007
1963
consists mostly of scrubland, with a few more productive
regions close to the rivers Ili and Karatal (figure 1b).
A number of arthropod parasites inhabit the burrows,
and fleas (mostly of the genus Xenopsylla) act as the
primary vectors ofY. pestis infection (Pollitzer 1966; Gage &
Kosoy 2004). It has been shown (Davis et al. 2004) that
gerbil abundance must be above a threshold level for sylvatic
plague to spread in the population.
Thus, the spatial structure of gerbil population syn-
chrony over large areas is of special interest since it is of
fundamental importance for the frequency, scale and
magnitude of the plague epizootics. Our ability to predict
plague epizootics, and thereby the risk of transmission to
humans, will be improved by increasing our understanding
of the dynamics of the great gerbils at large spatial scales. To
this end, we use monitoring data on gerbil dynamics
covering the period from the late 1940s until the present,
together with remotely sensed environmental data, to
quantify the role of climate in determining and synchroni-
zing the dynamics of great gerbil populations.
2. MATERIAL AND METHODS(a) Population and prevalence data
Our study area is the PreBalkhash plague focus of south-
eastern Kazakhstan (748–788 E and 448–478 N). For moni-
toring purposes, the focus has been divided into 10!10 km2,
referred to as sectors. Four sectors constitute a 20!20 km
primary square (PSQ), and four PSQs constitute a large square
This journal is q 2007 The Royal Society

Figure 1. (a) Map of central Asia showing the PreBalkhashplague focus. (b) Satellite image of the research area dividedinto the 20!20 km PSQs. The false colours indicate the(smoothed) Spearman correlation between the great gerbilpopulation densities in each PSQ and its eight adjacentsquares (the central pixel is the average of the others). Yellowdenotes high local correlation, and blue denotes low localcorrelation. No colour indicates no data. Numbers denote(1) Lake Balkhash, (2) the Ili River, and (3) the Karatal River.
1964 K. L. Kausrud et al. Large-scale plague outbreaks by gerbils
(figure 1b). Here, we use data aggregated at the PSQ scale as a
trade-off between obtaining spatial resolution without losing
temporal continuity. Figure 2 depicts the observed great
gerbil density fluctuations.
Great gerbil density estimates (N ) were calculated as the
product of the number of burrows per hectare in the PSQ (A ),
the proportion of inhabited burrows (O) and direct count
observations of the number of gerbils per burrow from several
(10 per sector counted) of the inhabited burrows (C; Frigessi
et al. 2005). Each spring (May–June) and autumn (September–
October) during the period 1949–1995,O andC were recorded
for 1–78 (median 54) PSQs.
There are also independent data on plague prevalence,
where a mean of 201 gerbils (min 1, max 4734) were trapped
during spring and autumn. Those gerbils caught were tested
for plague through isolation of Y. pestis from blood, spleen or
liver smears. These data overlap for about 79% of the
population estimates at the PSQ scale. Gerbils infected with
plague normally develop a detectable bacteraemia only briefly
and sometimes intermittently (Gage & Kosoy 2004), and
hence the data will underestimate the prevalence of, or even
fail to detect, plague.
(b) The normalized difference vegetation index data
The normalized difference vegetation index (NDVI; Los et al.
2000; Hall et al. 2005) is based on the difference between
near-infrared and visible light reflected from the ground,
thereby giving an index of light absorbed by chlorophyll on
Proc. R. Soc. B (2007)
the ground from approximately 0 (bare rock) to 0.8 (rain-
forest). For a discussion of its use in ecological studies, see
Pettorelli et al. (2005).
As high-quality NDVI data were not available prior to
1983, the April NDVI was modelled from the observed post-
1983 spatial mean values and between-year differences in
regional air pressure (the latter being available pre-1983; see
electronic supplementary material) to obtain proxy data for
NDVI for 1948–1982. Such pressure indices provide the
direction and strength of the prevailing winds, often reflecting
weather conditions. The commonly used NAO and ENSO
indices (Stenseth et al. 2003) are calculated from such
pressure measures, and more local indices are also used for
modelling local climatic conditions (Hanssen-Bauer 1999).
(c) Spatial population structure
The spatial synchrony was measured by the pair-wise
correlation between (logged) PSQ population densities, also
calculated at time lags of 0–6 seasons (Bjørnstad & Falck
2001). The local synchrony (figure 1b) was measured by the
Spearman correlation between a PSQ and its eight immediate
neighbours (or fewer if data from a neighbouring PSQ were
not available).
The complex spatiotemporal autocorrelation structure in
the data causes the loss of a number of degrees of freedom for
several of the statistical tests performed, and no formal method
for determining the correct reduction factor is currently
available for a number of the tests and models. Hence, reported
p-values should be viewed as approximations, but estimated
95% confidence intervals are provided where appropriate. To
be conservative, we have based our conclusions only on
relationships being significant after halving the degrees of
freedom (had there been no spatio-temporal autocorrelation).
We based our model selection procedure primarily on the
models’ ability to predict the first 32 years of data after having
been fitted to the last 13 years only. For more details on model
selection, see electronic supplementary material.
The selected models were then used for assessing the effect
of climate, as indicated by the NDVI, on the seasonal
dynamics and predicted densities of the great gerbil (see
electronic supplementary material).
(d) Simulation of population synchrony
In order to investigate the effects of population synchrony on
plague prevalence, we simulated plague dynamics at different
scales of host synchrony. The host population dynamics were
represented by the Moran–Ricker equation (see eqn 7 in the
electronic supplementary material) for each cell k in an s!s
grid-based simulation. In each simulation run, the grid was
divided into a number of sub-areas of size a2 (areas along the
edges being fractions thereof when s/a was a non-integer).
The value of the population growth rate r is drawn only once
per area per year, only adding a small, uniformly distributed
noise term t with mean 0, and is thus highly correlated within
each sub-area a, since
rkt ePoissonðkÞat Ctkt : ð2:1Þ
Thus, when aZ1, all r values are independent and spatial
synchrony is nil, and when aZs, only the noise term differs
between cells and spatial synchrony approaches one, over the
whole area. k was selected to give values of r mainly within
the domain corresponding to stable population cycles. As
there is evidence for transmission (Davis et al. in press) as
well as host density affecting plague dynamics at these scales,
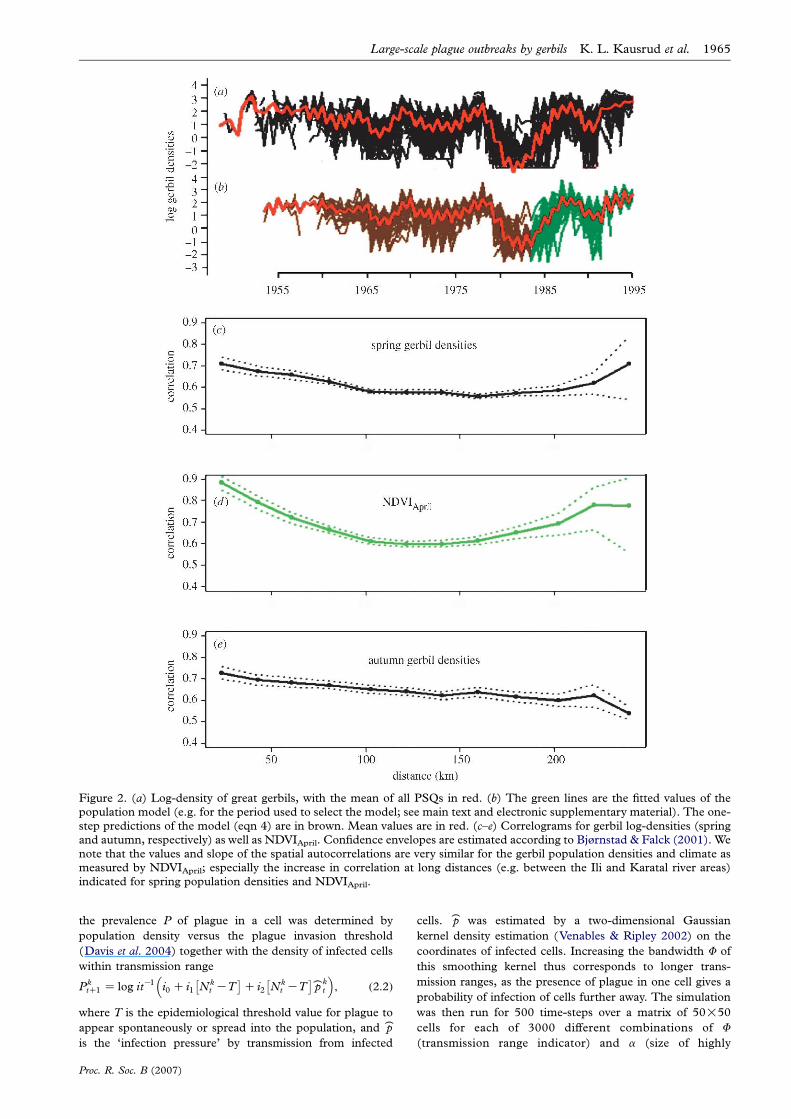
Figure 2. (a) Log-density of great gerbils, with the mean of all PSQs in red. (b) The green lines are the fitted values of thepopulation model (e.g. for the period used to select the model; see main text and electronic supplementary material). The one-step predictions of the model (eqn 4) are in brown. Mean values are in red. (c–e) Correlograms for gerbil log-densities (springand autumn, respectively) as well as NDVIApril. Confidence envelopes are estimated according to Bjørnstad & Falck (2001). Wenote that the values and slope of the spatial autocorrelations are very similar for the gerbil population densities and climate asmeasured by NDVIApril; especially the increase in correlation at long distances (e.g. between the Ili and Karatal river areas)indicated for spring population densities and NDVIApril.
Large-scale plague outbreaks by gerbils K. L. Kausrud et al. 1965
the prevalence P of plague in a cell was determined by
population density versus the plague invasion threshold
(Davis et al. 2004) together with the density of infected cells
within transmission range
PktC1 Z log itK1 i0 C i1 Nk
t KT� �
C i2 Nkt KT
� �_p kt
� �; ð2:2Þ
where T is the epidemiological threshold value for plague to
appear spontaneously or spread into the population, and _p
is the ‘infection pressure’ by transmission from infected
Proc. R. Soc. B (2007)
cells. _p was estimated by a two-dimensional Gaussian
kernel density estimation (Venables & Ripley 2002) on the
coordinates of infected cells. Increasing the bandwidth F of
this smoothing kernel thus corresponds to longer trans-
mission ranges, as the presence of plague in one cell gives a
probability of infection of cells further away. The simulation
was then run for 500 time-steps over a matrix of 50!50
cells for each of 3000 different combinations of F
(transmission range indicator) and a (size of highly

1966 K. L. Kausrud et al. Large-scale plague outbreaks by gerbils
correlated subareas). Parameters are given in table 5 of the
electronic supplementary material.
3. RESULTS(a) The spatio-temporal population structure
The PSQ gerbil densities are positively spatially correlated
across the entire focus. The mean correlation between
autumn log densities decreases almost linearly from rZ0.74 [0.60, 0.87] between adjacent PSQs to rZ0.66
[0.35, 0.96] at 250 km. This is large compared to the
yearly dispersal distance of the gerbils (Rothschild 1978),
but similar to the spatial autocorrelation in between-year
variation in NDVIApril, which decreases from approxi-
mately rZ0.83 [0.75, 0.91] between adjacent PSQs to
approximately rZ0.65 [0.50, 0.80] at more than 200 km
(refer to figure 2 and electronic supplementary material).
April NDVI improves the predictive power of our
population model, and may thus be expected to contribute
to synchronizing abundances across space (Moran 1953).
There were no indications of lagged correlations being
greater than non-lagged correlations at any distance (see
electronic supplementary material). Nor were they
significantly greater in any particular direction.
In the southern part of the focus, there seems to be a
breakdown of local synchrony (figure 1b), roughly corre-
sponding to the landscape ecological region of the Akdala
plain. The gerbil densities of the two other regions (the
Bakanas (west) and Saryesikotrau (northeast) plains) seem
to be highly synchronized both internally and with each
other. Also, mean gerbil density does not vary between the
Akdala/Bakanas/Saryesikotrau plains (factorial regression,
rZ0.01, d.f.Z81, pO0.35). Altogether our results suggest a
synchronizing exogenous factor (Moran 1953; Bjørnstad
et al. 1999).
(b) Effects of vegetation cover
We ask next whether the mean or variance in gerbil density
or population growth rates is related to mean vegetation
cover (as measured by the NDVI) or variability in NDVI
(s.d.). Exploratory analysis suggested that April was the
most informative monthly composite NDVI, i.e.
NDVIApril, for predicting gerbil dynamics (see electronic
supplementary material). Deviations from the mean
NDVIApril within a PSQ for a particular year correlate
weakly with population growth rate over the following
winter (rZ0.18, [K0.21, 0.52]). This suggests that more-
than-usual vegetation cover in a PSQ gives rise to relatively
high population growth. However, the mean gerbil density
in a PSQ seems clearly independent of its mean NDVIApril
(rZ0.02, [K0.36, 0.40]). The standard deviation of the
population growth rate (logged) from one season to the
next is uncorrelated with mean gerbil density (rZK0.07,
[K0.44, 0.32]), but it is negatively correlated with the
mean NDVIApril of the PSQ (autumn–spring: rZK0.56
[K0.75, K0.29], spring–autumn: rZK0.45 [K0.67,
0.15]) and, less strongly, with the standard deviation of
the NDVIApril (autumn–spring: rZK0.42 [K0.65,
K0.12], spring–autumn: rZK0.29 [K0.65, 0.03]).
(Note, though, that the standard deviation of the
NDVIApril is strongly dependent on the mean (rZ0.87
[0.78, 0.92]).) Thus, gerbil density fluctuations are
greater in the drier, less productive areas, despite their
lesser absolute fluctuations in NDVIApril.
Proc. R. Soc. B (2007)
The whole-focus mean gerbil density shows between-
year autocorrelation for lags of up to 3 years for both
spring and autumn, but there is no between-year
autocorrelation in the mean NDVIApril of the focus (see
electronic supplementary material). This autoregressive
structure in population densities seems to overshadow the
short-term effect of mean NDVIApril on the mean gerbil
density of the focus (correlation r!0.05), but this
correlation increases consistently as periods of greater
length are compared, up to a moving-average period of 15
years, where rz0.60, r!0.05 (see also electronic
supplementary material). Thus, over moderately large
time-frames, gerbils are more abundant during periods
when there is more vegetation.
(c) The gerbil population model
By model selection (see above and electronic supple-
mentary material), we arrived at a log-linear autoregres-
sive seasonal population model (see eqn 4 of the electronic
supplementary material) providing good predictions on
the PSQ scale up to two seasons ahead. In addition to one-
and two-seasonal lag population densities, it included the
mean difference in density from adjacent squares, the
mean NDVIApril of the PSQ, as well as the yearly deviation
from this. The plague prevalence detected in the previous
season (averaged over adjacent squares) was also selected.
The model coefficients are given in table 1 of the electronic
supplementary material.
Combining the one-step predicted values of the spring
and autumn into one time-series for each PSQ, they
correlate closely (mean rZ0.85, [0.75, 0.93]) with
observations before 1983. For the period on which the
model is fitted (1983–1995), the correlation is 0.87. In
total, the model explains about 73% of the total variation
in the log-population density. Its interaction terms provide
a nonlinear relationship between climate variables and
predicted densities. The model captures the greater
variability in the drier (low NDVI) areas, exhibiting a
correlation of rZK0.40 [K0.60, K0.12] at the PSQ scale
between mean NDVIApril and the standard deviation of
predicted log-population density.
Observed versus predicted time-series are shown in
figure 1b (see also electronic supplementary material).
(d) The plague dynamics
The chance of plague being observed in a PSQ is
significantly increased if it, or its immediate neighbours,
were observed to have plague in the previous season (c2-test
p!0.001). In addition, when plague is present, prevalence
levels depend on the registered prevalence levels in the
preceding season (correlation between logit prevalence
spring versus previous autumn: rZ0.54 [0.31, 0.71],
autumn versus spring same year: rZ0.51 [0.27, 0.69]).
Plague prevalence alone was found to explain a
significant but modest part of the logarithmic population
growth rate (autumn–spring R2Z0.03, spring–autumn
R2Z0.04, autumn–autumn R2Z0.06, all p!0.05) at the
PSQ scale. Prevalence was thus kept in the population
model (as also indicated by the VAIC criterion; see
electronic supplementary material) despite the effect of
observed prevalence contributing a modest 1% to
explained variation in the full model.
We calculated ‘epizootic magnitude’ as the product of
plague prevalence and gerbil density for each PSQ at each
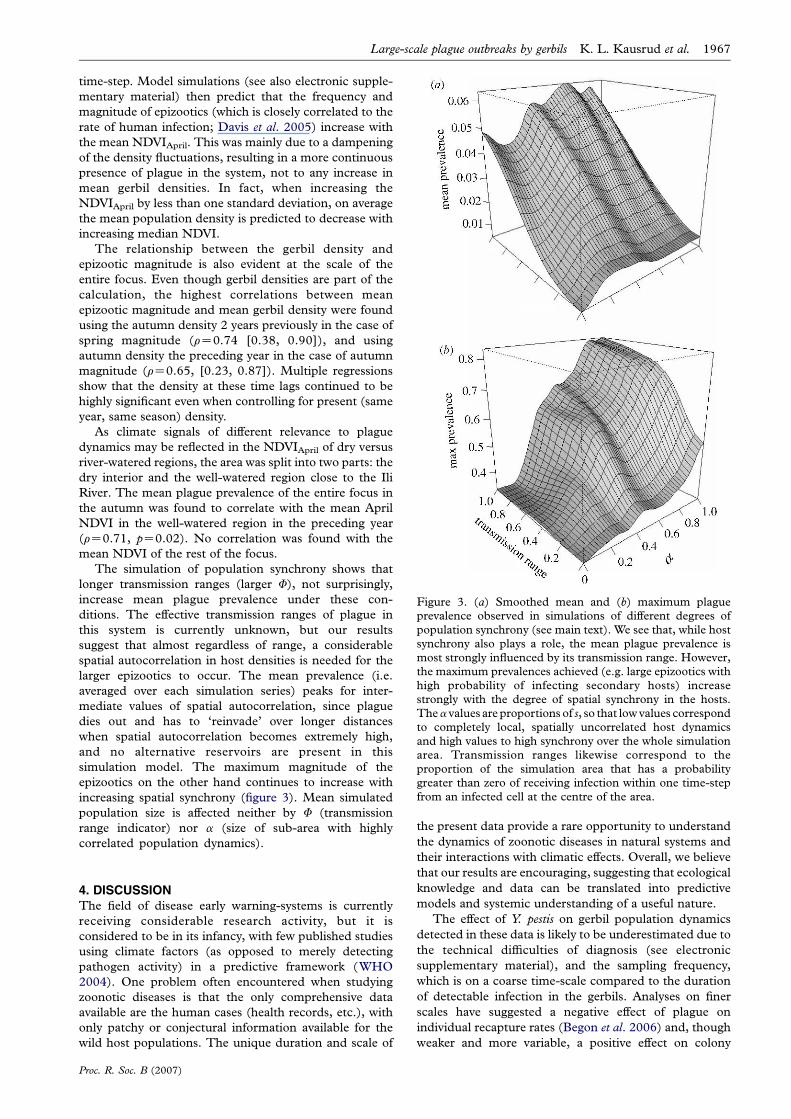
Figure 3. (a) Smoothed mean and (b) maximum plagueprevalence observed in simulations of different degrees ofpopulation synchrony (see main text). We see that, while hostsynchrony also plays a role, the mean plague prevalence ismost strongly influenced by its transmission range. However,the maximum prevalences achieved (e.g. large epizootics withhigh probability of infecting secondary hosts) increasestrongly with the degree of spatial synchrony in the hosts.Thea values are proportions of s, so that low values correspondto completely local, spatially uncorrelated host dynamicsand high values to high synchrony over the whole simulationarea. Transmission ranges likewise correspond to theproportion of the simulation area that has a probabilitygreater than zero of receiving infection within one time-stepfrom an infected cell at the centre of the area.
Large-scale plague outbreaks by gerbils K. L. Kausrud et al. 1967
time-step. Model simulations (see also electronic supple-
mentary material) then predict that the frequency and
magnitude of epizootics (which is closely correlated to the
rate of human infection; Davis et al. 2005) increase with
the mean NDVIApril. This was mainly due to a dampening
of the density fluctuations, resulting in a more continuous
presence of plague in the system, not to any increase in
mean gerbil densities. In fact, when increasing the
NDVIApril by less than one standard deviation, on average
the mean population density is predicted to decrease with
increasing median NDVI.
The relationship between the gerbil density and
epizootic magnitude is also evident at the scale of the
entire focus. Even though gerbil densities are part of the
calculation, the highest correlations between mean
epizootic magnitude and mean gerbil density were found
using the autumn density 2 years previously in the case of
spring magnitude (rZ0.74 [0.38, 0.90]), and using
autumn density the preceding year in the case of autumn
magnitude (rZ0.65, [0.23, 0.87]). Multiple regressions
show that the density at these time lags continued to be
highly significant even when controlling for present (same
year, same season) density.
As climate signals of different relevance to plague
dynamics may be reflected in the NDVIApril of dry versus
river-watered regions, the area was split into two parts: the
dry interior and the well-watered region close to the Ili
River. The mean plague prevalence of the entire focus in
the autumn was found to correlate with the mean April
NDVI in the well-watered region in the preceding year
(rZ0.71, pZ0.02). No correlation was found with the
mean NDVI of the rest of the focus.
The simulation of population synchrony shows that
longer transmission ranges (larger F), not surprisingly,
increase mean plague prevalence under these con-
ditions. The effective transmission ranges of plague in
this system is currently unknown, but our results
suggest that almost regardless of range, a considerable
spatial autocorrelation in host densities is needed for the
larger epizootics to occur. The mean prevalence (i.e.
averaged over each simulation series) peaks for inter-
mediate values of spatial autocorrelation, since plague
dies out and has to ‘reinvade’ over longer distances
when spatial autocorrelation becomes extremely high,
and no alternative reservoirs are present in this
simulation model. The maximum magnitude of the
epizootics on the other hand continues to increase with
increasing spatial synchrony (figure 3). Mean simulated
population size is affected neither by F (transmission
range indicator) nor a (size of sub-area with highly
correlated population dynamics).
4. DISCUSSIONThe field of disease early warning-systems is currently
receiving considerable research activity, but it is
considered to be in its infancy, with few published studies
using climate factors (as opposed to merely detecting
pathogen activity) in a predictive framework (WHO
2004). One problem often encountered when studying
zoonotic diseases is that the only comprehensive data
available are the human cases (health records, etc.), with
only patchy or conjectural information available for the
wild host populations. The unique duration and scale of
Proc. R. Soc. B (2007)
the present data provide a rare opportunity to understand
the dynamics of zoonotic diseases in natural systems and
their interactions with climatic effects. Overall, we believe
that our results are encouraging, suggesting that ecological
knowledge and data can be translated into predictive
models and systemic understanding of a useful nature.
The effect of Y. pestis on gerbil population dynamics
detected in these data is likely to be underestimated due to
the technical difficulties of diagnosis (see electronic
supplementary material), and the sampling frequency,
which is on a coarse time-scale compared to the duration
of detectable infection in the gerbils. Analyses on finer
scales have suggested a negative effect of plague on
individual recapture rates (Begon et al. 2006) and, though
weaker and more variable, a positive effect on colony

1968 K. L. Kausrud et al. Large-scale plague outbreaks by gerbils
extinction rates (Davis et al. 2007). Thus, despite being
relatively asymptomatic to plague (Gage & Kosoy 2004),
an effect of plague on gerbils has now been shown on
scales from the individual to the whole landscape.
However, the effect seems weaker, or at least harder to
detect, as spatial scale increases. While our observations
are consistent with Y. pestis infections contributing to
gerbil population declines, the limited predictive value of
prevalence, and the highly restricted presence of plague in
1979–1981, when there was a focus-wide decline of
gerbils, indicates that plague is far from being the main
driving force in the great gerbil density fluctuations. It may
well be that infections only appear with detectable
prevalence in weakened, already declining, populations.
In arid scrubland with a simple vegetation structure,
the NDVI reflects vegetation cover closely (Los et al.
2000; Pettorelli et al. 2005). The absence of correlation
between mean gerbil abundance and mean NDVI is
consistent with the assumption (Naumov & Lobachev
1975) that mean great gerbil densities are most strongly
related to soil conditions (suitable patches for burrow-
ing). In this light, the fact that we found a higher
variability in gerbil densities in less-productive habitats
should not be unexpected, as the impact of between-year
fluctuations in resources is likely to be greater in less-
productive environments when mean population densities
are the same.
The high degree of spatial synchrony in gerbil density is
striking. While migration may play some role in this, its
effect at distances up to 10 times the recorded maximum
yearly migration seems unlikely without a time lag. At
these scales, climatic fluctuations are much more likely to
play a major synchronizing role, generating a ‘Moran
effect’ (Moran 1953). This may be mediated through
several mechanisms, such as weather conditions affecting
food availability, temperature stress, parasite (flea) density
and plague transmission (Cavanaugh & Marshall 1972;
Stenseth et al. 2006). Some avian predators of the steppe
(Buteo rufinus, Falco tinnunculus, Aquila nipalensis, Aquila
heliaca and others; Sanchez-Zapata et al. 2003; Sludsky
1978) may range over distances comparable to our study
scale, and their abundance would be expected to respond
to climate forcing on their prey, linking the synchronizing
effects of climate and predation.
As the climatic factors affecting gerbil dynamics (and
possibly those of other rodent hosts) in part reflect large-
scale fluctuations (Todd & Mackay 2003; Treydte et al.
2006), the observed processes seem likely to continue into
similar ecosystems in the region. The presence of spatially
continuous host populations whose population densities
exhibit large-scale autocorrelation seems very likely to be a
key factor in allowing large-scale plague epizootics in the
region. The co-dependency between NDVIApril, gerbil
densities and plague, together with predictions from
historical climate records (Stenseth et al. 2006; K.L.
Kausrud et al. 2007, unpublished data), suggests that
periods of relatively warm and/or moist conditions give rise
to periods of high gerbil densities and large epizootics in
otherwise dry areas. Global change is predicted to continue
towards a warmer climate in arid central Asia, while the
heightened intensity of the hydrological cycle increases the
variability of monsoon-related climates extending into this
region (IPCC 2001). Epizootic magnitude can thus be
expected to increase, as the highest prevalence levels seem
Proc. R. Soc. B (2007)
to occur in the most arid areas and after warm springs. This
is supported by the model simulations that suggest greater
and more frequent epizootics when spring NDVI increase
and population synchrony is high. While extremely warm
summers have negative impacts on plague prevalence, this
seems likely to be outweighed by the synchronizing effect of
extreme climate events and the effect of large rainfalls (and
increased glacier runoff ) when these occur. On somewhat
longer time-scales, the ranges of desert-adapted plaguehosts
in the area, whose mean densities are relatively insensitive to
the degree of aridity, seem likely to expand. When coupled
with sporadic bursts of wetter conditions, this is likely to
cause plague epizootics to increase in scale.
To summarize, we draw five main conclusions from
these analyses.
(i) Great gerbil density fluctuations are highly corre-
lated over large areas, suggesting a climatic forcing
as a synchronizing agent. This is probably an
important factor causing large-scale plague epizoo-
tics in the region.
(ii) Great gerbil population densities at large spatial
scales can be well predicted 6–12 months ahead
when combining spatial environmental effects and
intrinsic dynamics. This is important for predicting
plague dynamics.
(iii) While great gerbil population growth rates exhibit
greater variability in areas with low NDVIApril,
average population density is not strongly related to
average vegetation productivity. This suggests that
the gerbils will be capable of maintaining popu-
lation densities where plague can persist over most
of their range even if, as predicted, the climate in
central Asia gets increasingly arid.
(iv) While the presence of plague infection in an area is
associated with population decrease over the
following months, plague seems unlikely to be the
main driving force behind great gerbil density
fluctuations.
(v) The magnitude of plague epizootics associated with
the great gerbil may be expected to increase under
predicted effects of ongoing climate change.
This work was supported by the Norwegian ResearchCouncil, the European Union project STEPICA (ICA2-CT2000-10046) as well as the CEES and the Centre forBiostatistical Modelling in the Medical Sciences (BMMS).Discussions with Tamara Ben Ari, Kung-Sik Chan andDorothee Ehrich, who also provided valuable help translatingbetween Russian and English, have been greatly appreciated.This project would have been impossible without thecooperation of Vladimir S. Ageyev, Nikolay L. Klassovskiyand Sergey B. Pole as well as hundreds of other Kazakhscientists who collected this vast amount of data over onehundred years. We thank Jan Esper for advice on palaeocli-matology. Finally, we wish to thank the anonymousreviewers who provided valuable feedback on an early versionof this paper.
REFERENCESBegon, M., Klassovskiy, N., Ageyev, V., Suleimenov, B.,
Atshabar, B. & Bennett, M. 2006 Epizootiologic para-meters for plague in Kazakhstan. Emerg. Infect. Dis. 12,268–273.
Bjørnstad, O. N. & Falck, W. 2001 Nonparametric spatialcovariance functions: estimation and testing. Environ.Ecol. Stat. 8, 53–70. (doi:10.1023/A:1009601932481)

Large-scale plague outbreaks by gerbils K. L. Kausrud et al. 1969
Bjørnstad, O. N., Ims, R. A. & Lambin, X. 1999 Spatialpopulation dynamics: analyzing patterns and processes ofpopulation synchrony. Trends Ecol. Evol. 14, 427–432.(doi:10.1016/S0169-5347(99)01677-8)
Cavanaugh, D. C. & Marshall Jr, J. D. 1972 The influence ofclimate on the seasonal prevalence of plague in therepublic of Vietnam. J. Wildl. Dis. 8, 85–94.
Davis, S., Begon, M., De Bruyn, L., Ageyev, V., Viljugrein,H., Stenseth, N. & Leirs, H. 2004 Predictive thresholdsfor plague in Kazakhstan. Science 304, 736–738. (doi:10.1126/science.1095854)
Davis, S., Calvet, E. & Leirs, H. 2005 Fluctuating rodentpopulations and risk to humans from rodent-bornezoonoses. Vector-borne Zoonot. Dis. 5, 305–314. (doi:10.1089/vbz.2005.5.305)
Davis, S., Leirs, H., Viljugrein, H., Stenseth, N. C.,De Bruyn, L., Klassovskiy, N., Ageyev, V. & Begon, M.2007 Empirical assessment of a threshold model forsylvatic plague. J. R. Soc. Interface. (doi:10.1098/rsif.2006.0208)
Davis, S., Klassikovskiy, N., Ageyev, V., Suleimenov, B.,Atshabar, B., Klassovskaya, A., Bennett, M., Leirs, H. &Begon, M. In press. Plague metapopulation dynamics in anatural reservoir: the burrow-system as the unit of study.Epidemiol. Infect. (doi:10.1017/S095026880600759X)
Frigessi, A., Marshall, C., Holden, M., Viljugrein, H.,Stenseth, N. C., Holden, L., Ageyev, V. & Klassovskiy,N. L. 2005 Bayesian population dynamics of interactingspecies: great gerbils and fleas in Kazakhstan. Biometrics61, 230–238. (doi:10.1111/j.0006-341X.2005.030536.x)
Gage, K. L. & Kosoy, M. Y. 2004 Natural history of plague:perspectives from more than a century of research. Annu.Rev. Entomol. 50, 505–528. (doi:10.1146/annurev.ento.50.071803.130337)
Hall, F. G., Collatz, G. J., Los, S., Brown de Colstoun, E. &Landis, D. 2005 ISLSCP initiative II. NASA.
Hanssen-Bauer, I. 1999 Downscaling of temperature andprecipitation in Norway based upon multiple regression ofthe principal components in the SLP field. In Regclim:regional climate development under global warming. Oslo,Norway: The Norwegian Institute of Meteorology.
IPCC 2001 Climate change 2001: impacts, adaptation andvulnerability. IPCC third assessment report. Arendal, Nor-way: GRID.
Los, S. O. et al. 2000 A global 9-year biophysical land-surfacedata set from NOAA AVHRR data. J. Hydrometeorol. 1,183–199. (doi:10.1175/1525-7541(2000)001!0183:AGYBLSO2.0.CO;2)
Moran, P. A. P. 1953 The statistical analysis of the Canadianlynx cycle II. Synchronization and meteorology. Aust.J. Zool. 1, 291–298. (doi:10.1071/ZO9530291)
Naumov, N. P. & Lobachev, V. S. 1975 Ecology of desertrodents of the U.S.S.R. (jerboas and gerbils). In Rodents in
Proc. R. Soc. B (2007)
desert environments, vol. 28 (eds I. Prakash & P. K. Gosh),
pp. 465–598. Hague, The Netherlands: Dr. W. Junk
Publishers.
Pettorelli, N., Vik, J. O., Mysterud, A., Gaillard, J. M.,
Tucker, C. J. & Stenseth, N. C. 2005 Using the satellite-
derived NDVI to assess ecological responses to environ-
mental change. Trends Ecol. Evol. 20, 503–510. (doi:10.
1016/j.tree.2005.05.011)
Pollitzer, R. 1966 Plague and plague control in the Soviet Union.
Bronx, NY: Fordham University.
Randall, J. A. & Rogovin, K. A. 2002 Variation in and
meaning of alarm calls in a social desert rodent Rhombomys
opimus. Ethology 108, 513–527. (doi:10.1046/j.1439-0310.
2002.00797.x)
Randall, J. A., Rogovin, K., Parker, P. G. & Eimes, J. A. 2005
Flexible social structure of a desert rodent, Rhombomys
opimus: philopatry, kinship, and ecological constraints.
Behav. Ecol. 16, 961–973. (doi:10.1093/beheco/ari078)
Rothschild, V. E. 1978 Spatial structure of plague natural focus
and methods of its study. Moscow, Russia: Publishing House
of Moscow University.
Sanchez-Zapata, J., Carrete, M., Gravilov, A., Sklyarenko, S.,
Ceballos, O., Donazar, J. & Hiraldo, F. 2003 Land use
changes and raptor conservation in steppe habitats of
eastern Kazakhstan. Biol. Conserv. 111, 71–77. (doi:10.
1016/S0006-3207(02)00251-3)
Sludsky, A. (ed.) 1978 Mammals of Kazakhstan, Almaty,
Kazakhstan: Nauka. [In Russian.]
Stenseth, N. C., Ottersen, G., Hurrell, J. W., Mysterud, A.,
Lima, M., Chan, K.-S., Yoccoz, N. G. & Adlandsvik, B.
2003 Review article. Studying climate effects on ecology
through the use of climate indices: the North Atlantic
Oscillation, El Nino Southern Oscillation and beyond.
Proc. R. Soc. B 270, 2087–2096. (doi:10.1098/rspb.2003.
2415)
Stenseth, N. C. et al. 2006 Plague dynamics are driven by
climate variation. Proc. Natl Acad. Sci. USA 103,
13 110–13 115. (doi:10.1073/pnas.0602447103)
Todd, M. C. & Mackay, A. W. 2003 Large-scale climatic
controls on Lake Baikal ice cover. J. Clim. 16, 3186–3199.
(doi:10.1175/1520-0442(2003)016!3186:LCCOLBO2.0.
CO;2)
Treydte, K., Schleser, G., Helle, G., Winiger, M., Frank, D.,
Haug, G. & Esper, J. 2006 Millennium-long precipitation
record from tree-ring oxygen isotopes in northern
Pakistan. Nature 440, 1179–1182. (doi:10.1038/nature
04743)
Venables, W. N. & Ripley, B. D. F. 2002 Modern applied
statistics with S, 4th edn. Berlin, Germany: Springer.
WHO 2004 Using climate to predict disease outbreaks: a
review (eds K. Kuhn, D. Campbell-Lendrum, A. Haines
& J. Cox), World Health Organization.