Sandalwood spike disease: a brief synthesis - Environmental ...
Upload
independentCategory
view
5download
0
Cortical Plasticity Induced by Spike-TriggeredMicrostimulation in Primate Somatosensory CortexWeiguo Song1, Cliff C. Kerr1,2*, William W. Lytton1,3,4,5, Joseph T. Francis1,4,5
1 Departments of Physiology and Pharmacology, SUNY Downstate Medical Center, Brooklyn, New York, United States of America, 2 School of Physics, University of
Sydney, Sydney, New South Wales, Australia, 3 Department of Neurology, Kings County Hospital, Brooklyn, New York, United States of America, 4 The Robert Furchgott
Center for Neural and Behavioral Science, SUNY Downstate Medical Center, Brooklyn, New York, United States of America, 5 Joint Graduate Program in Biomedical
Engineering SUNY Downstate and NYU-POLY, Brooklyn, New York, United States of America
Abstract
Electrical stimulation of the nervous system for therapeutic purposes, such as deep brain stimulation in the treatment ofParkinson’s disease, has been used for decades. Recently, increased attention has focused on using microstimulation torestore functions as diverse as somatosensation and memory. However, how microstimulation changes the neural substrateis still not fully understood. Microstimulation may cause cortical changes that could either compete with or complementnatural neural processes, and could result in neuroplastic changes rendering the region dysfunctional or even epileptic. Aspart of our efforts to produce neuroprosthetic devices and to further study the effects of microstimulation on the cortex, westimulated and recorded from microelectrode arrays in the hand area of the primary somatosensory cortex (area 1) in twoawake macaque monkeys. We applied a simple neuroprosthetic microstimulation protocol to a pair of electrodes in the area1 array, using either random pulses or pulses time-locked to the recorded spiking activity of a reference neuron. This setupwas replicated using a computer model of the thalamocortical system, which consisted of 1980 spiking neurons distributedamong six cortical layers and two thalamic nuclei. Experimentally, we found that spike-triggered microstimulation inducedcortical plasticity, as shown by increased unit-pair mutual information, while random microstimulation did not. In addition,there was an increased response to touch following spike-triggered microstimulation, along with decreased neuralvariability. The computer model successfully reproduced both qualitative and quantitative aspects of the experimentalfindings. The physiological findings of this study suggest that even simple microstimulation protocols can be used toincrease somatosensory information flow.
Citation: Song W, Kerr CC, Lytton WW, Francis JT (2013) Cortical Plasticity Induced by Spike-Triggered Microstimulation in Primate Somatosensory Cortex. PLoSONE 8(3): e57453. doi:10.1371/journal.pone.0057453
Editor: Maurice J. Chacron, McGill University, Canada
Received September 17, 2012; Accepted January 24, 2013; Published March 5, 2013
Copyright: � 2013 Song et al. This is an open-access article distributed under the terms of the Creative Commons Attribution License, which permitsunrestricted use, distribution, and reproduction in any medium, provided the original author and source are credited.
Funding: This work was supported by DARPA REPAIR Contract #N66001-10-C-2008. The funders had no role in study design, data collection and analysis,decision to publish, or preparation of the manuscript.
Competing Interests: The authors would like to confirm that the fact that co-author William Lytton is a PLOS ONE editorial board member does not alter theiradherence to all the PLOS ONE policies on sharing data and materials.
* E-mail: [email protected]
Introduction
Electrical neural stimulation has been used in a wide variety of
clinical and experimental applications [1–4]. Microstimulation in
primary somatosensory cortex (S1) has been used to deliver
behaviorally relevant information to both humans [5] and animals
[1,6–13]. Thus, sensations lost due to disease, injury, or trauma
could be restored by microstimulation in primary somatosensory
cortex [6,7,9,12,14] or thalamus [15–19]. For example, Leal-
Campanario et al. [20] showed that rabbits were unable to
distinguish between physical whisker stimulation and electrical
stimulation of the vibrissae area of primary sensory cortex. Sensory
feedback thus achieved could be used in conjunction with neurally
controlled prosthetic limbs properly fitted with joint and touch
sensors. However, microstimulation may cause cortical changes
that could compete with natural neural processing or potentiation
[8,10,21–26]. For example, microstimulation has recently been
shown to ‘‘hijack’’ natural motor intent [27].
Closed-loop and time-dependent microstimulation have been
used in deep brain stimulation [28], sensory neuroprosthetics [29],
and for treatment of neural disorders such as epilepsy [30]. It is
well-known that long-term potentiation (LTP) and long-term
depression (LTD) can be induced by Hebbian-type paired
microstimulation or high/low frequency microstimulation
[31,32]. The association between LTP and learning has been
known for some time [33]; for example, excessive LTP may
‘‘saturate’’ synapses and thus prevent future learning [34],
suggesting that behavioral improvements following microstimula-
tion may be related to a balancing of LTP and LTD. In addition,
spike-timing-dependent plasticity has been observed in acute slice
recordings [35], in vivo preparations [31,36], and in behaving
animals [37]; this might promote synchronized firing among cells
[38]. Cells in motor cortex used to control an actuator in closed-
loop BMIs demonstrate plasticity and reorganization [39–41], and
functional connectivity changes have also been observed after
time-dependent stimulation [21,37]. However, little is known
about how microstimulation in S1 may modify neural activity,
how different microstimulation protocols may affect neural
responses in S1, and how such changes influence neural
information processing.
Our aim was to address these questions by exploring the effect
of microstimulation on network reorganization and sensory
PLOS ONE | www.plosone.org 1 March 2013 | Volume 8 | Issue 3 | e57453

information encoding of S1. We hypothesized that spike-triggered
microstimulation should lead to Hebbian plasticity if the activity at
the recording and stimulating electrodes is synchronous. To test
this hypothesis, we implanted multi-electrode arrays in the hand
representation region of S1 (Brodmann area 1), and analyzed the
neural responses evoked by natural touch before and after
microstimulation. Both spike-triggered and random stimulus
sequences were used. We tested for changes in neural firing rates,
variability, and changes in neural synchrony, as measured by unit-
pair mutual information and multi-information. To avoid
confounds associated with motivation and reward that can affect
cortical plasticity, we conducted this microstimulation in quiet,
awake animals.
While microstimulation can be a highly informative experi-
mental technique, it has two major drawbacks. First, the number
of neurons that can be reliably recorded from and stimulated in a
given experiment is small: typically fewer than 100. Second, since
the amplitude, polarity, and duration of the stimulation can be
independently controlled at each electrode, the parameter space of
possible stimulation protocols is extremely large. It is not feasible
to explore this space thoroughly with in vivo experimentation. To
overcome these limitations, we developed a computer model of
microstimulation in the thalamocortical system, based on a
recently developed spiking-neuron network model [42]. We briefly
introduce and present results from this model, and show that these
results are broadly consistent with the in vivo findings. In future, we
will explore the possibility of using this model as a supplement to
experimental investigations of microstimulation, particularly with
respect to the development of a somatosensory neuroprosthesis
[17,19,43].
Materials and Methods
Animal WelfareThis study was performed in accordance with the recommen-
dations in the Guide for the Care and Use of Laboratory Animals
of the National Institutes of Health. The protocol was approved by
the Institutional Animal Care and Use Committee of SUNY
Downstate Medical Center.
Overall care was managed by the Division of Laboratory
Animal Resources (DLAR). Subjects were looked after daily by the
senior DLAR staff. The in-house veterinary doctor checked the
subjects before they were put on the study, and performed blood
tests and physical examinations as needed. Subjects were given
weekly fruit or dry treats as a means of enrichment and novelty.
There were daily observations of the subject’s body weight, urine
color, mucosa and skin turgor, awakeness and alertness, and
overall behavior; any abnormal changes were immediately
reported to a veterinary doctor. The headpost was used for head
restraint 6 weeks after implantation. The subjects resumed normal
behavior in the cage a few days after headpost implantation.
Microelectrode implantation and connection of headstages with
the array connectors did not result in any permanent changes in
the subjects’ behavior. In collaboration with DLAR, we have
attempted to offer as humane treatment of our subjects as possible,
and we believe that the standard of animal care and welfare in our
lab exceeds national guidelines.
Surgical ProcedureTwo macaques (JK: male, 3.9 kg; AC8: female, 4.1 kg) were
used in these experiments. These animals were primarily trained
for and used in other studies on brain-machine interface
development that will be published separately. Two types of
surgeries were performed on the subjects: headpost mounting
surgery and microelectrode array implant surgery. Surgeries were
performed in a dedicated operating room suite in an aseptic
manner. Anesthesia and initial preparations of the surgery were
done by the in-house veterinary doctor personally or under her
direct supervision. Isofluorane anesthesia was used throughout the
surgery. Injectable steroids were used to minimize brain edema
and swelling and mannitol and diuretics like furosemide were kept
on side if needed. Surgeries were performed by researchers with
formal array implantation training and/or human surgical
experience. Subjects were given appropriate analgesics, antibiotics
and other needed medications by injection throughout the course
of surgery and in the post-operative convalescence (commonly 2
weeks). The subjects were observed hourly or 2-hourly for the first
12 hours after surgery by the lab personnel and were inspected
daily or twice daily by the DLAR personnel.
Head-posts were implanted at least 6 weeks before microelec-
trode array implantation. The detailed procedure for head-post
and cortical implantations has been described previously [44].
Briefly, monkeys were initially anesthetized by using ketamine
(20 mg/kg) followed by intubation and ventilation with isoflurane
gas (0.75–2%) and oxygen, then a midline incision was made and
the skin was retracted to expose the skull. Two 20 mm by 20 mm
bone flaps were removed on each side of the midline over the S1/
M1 hand region. After a dura flap was cut and open, four 100-
electrode platinum-iridium arrays (Blackrock Microsystems) were
pneumatically inserted in the hand representation area of both the
primary motor cortex (M1) and S1 bilaterally. The S1 implant was
placed as close as possible to the central sulcus on the postcentral
gyrus (as shown in Figure 1C), to ensure that we were recording
from area 1. We only present the data from the left S1
(contralateral right hand) in this report. The somatotopy in S1
was tested by touching and manipulating the hand and fingers;
however, we did not specifically identify purely cutaneous or
proprioceptive units for this work, and instead concentrated on
units that responded to our tactile stimulator. Following the
surgery, analgesics (Buprenex, 0.02 mg/kg; RimadyI, 2 mg/kg)
and antibiotics (Baytril, 6 mg/kg) were administered to the
recovering animals for 3 and 5 days, respectively. Bicillin (1 ml/
20 lbs) was administered every other day for 14 days. Recording
began at least three weeks after cortical implantation.
Neural Recording and Offline SortingNeural data were recorded with multichannel acquisition
processors (MAP, Plexon Inc.). Unity-gain preamplifier head-
stages (Plexon Inc.) were connected to the ICS-96 array
connectors (Blackrock Microsystems) via flexible wires. Neural
signals were band-pass filtered (154 Hz to 8.8 kHz) and digitized
at a sampling frequency of 40 kHz. Spikes were detected online
when they passed a threshold level (roughly 3 standard deviations
[SD] above background level), which was manually set and then
kept unchanged throughout the day. The detected spikes were
automatically classified online by using waveform sorting methods
based on either principal component analysis or template
matching (Plexon Inc.). The detected spiking times and spike
waveforms were saved for offline analysis. Units (single units and
multi-units) were isolated offline using the Offline Sorter (Plexon
Inc.). Single units were defined if there were clear waveform
shapes, well-separated in a feature space, with interspike intervals
greater than 1.6 ms. We took poorly isolated units to be multi-
units (see Figure 1E); however, we did not differentiate between
single and multi-units for the purposes of this work. Up to 50
simultaneous channels of usable neural activity were recorded
from the array, and one or two individual units from several of the
channels could be isolated.
Microstimulation in Primate Somatosensory Cortex
PLOS ONE | www.plosone.org 2 March 2013 | Volume 8 | Issue 3 | e57453

Stimulation ProtocolsThe stimulation system and protocol are shown in Figure 1.
Subjects were seated comfortably in a non-human primate chair
(BKIN Technologies) in a sound-proof recording room with their
right arms and hands restrained to the KINARM (BKIN
Technologies). The finger to undergo tactile stimulation was fixed
in a finger cast (which was customized based on the individual
finger and subject) just above the solenoid plunger (Figure 1A).
The monkeys were trained to be seated in the chair quietly; they
did not perform any behavioral task. Each daily training session
was composed of three phases (Figure 1D): 3 min of tactile
stimulation, 30 min of microstimulation (either spike-triggered or
random), then 3 min of tactile stimulation. Ten stimulation sites in
the two subjects (four in JK and six in AC8) were recorded from
during 15 different sessions.
Tactile StimulatorTactile stimulation was produced using a push-type solenoid
actuator (STA-195201, Ladex Inc.), which was mounted under a
finger cast (Figure 1A). The finger and hand casts were attached to
an exoskeletal robotic system KINARM (BKIN Technologies).
The KINARM was locked in place during tactile stimulation to
keep the arm in the same configuration across sessions. The
solenoid was controlled by a personal computer and digital card
(PCI-6229, National Instruments Inc.) using a customized
program written in MATLAB (The MathWorks Inc.). A return
spring was used to pull the plunger back after each stroke. The
diameter of the solenoid plunger, which indents the skin, was
1 mm. The tactile stimuli could be applied to different digits. The
system latency from tactile stimulation control pulse to the time of
solenoid plunger touching skin was calibrated with a force sensor
(Figure 1B). Each tactile stimulation control pulse produced skin
Figure 1. Training protocols and general observations. (A) Monkeys were seated comfortably in a non-human primate chair with their rightarm and hand restrained in a KINARM. The finger to undergo tactile stimulation was fixed in a finger cast (customized based on individual finger andmonkey) just above the solenoid plunger. (B) The delay from the solenoid control pulse to the plunger touching the skin was calibrated with a forcesensor (error bars show SD). (C) Multi-electrode arrays were implanted close to the central sulcus (CS), in the hand representation area (S1 area 1). (D)Daily training sessions were comprised of three segments: tactile stimulation, microstimulation, and tactile stimulation. Each tactile stimulus had aduration of 0.3 s and indented the skin by 1 mm, and was applied with a mean frequency of 0.5 Hz. Microstimulation consisted of two biphasicpulses of amplitude 50 mA, and were triggered by spikes recorded from the reference unit, subject to a 5 ms delay. (E) Typical waveforms and inter-spike intervals (ISIs) of single and multi-units. (F) Activation maps show firing rate as a function of electrode position; each square corresponds to oneelectrode in the 10610 array. There were broad cortical responses to tactile stimulation. The stimulating source is shown by the upward triangle, thestimulating sink by the downward triangle, and the triggering reference unit by the circle.doi:10.1371/journal.pone.0057453.g001
Microstimulation in Primate Somatosensory Cortex
PLOS ONE | www.plosone.org 3 March 2013 | Volume 8 | Issue 3 | e57453

displacement around 1 mm for 0.3 s, and the tactile stimulus was
applied randomly with a mean frequency of 0.5 Hz, as shown in
Figure 1D. Peristimulus intervals were calculated relative to skin
touch time.
Electrical Microstimulation ProtocolSpike-triggered microstimulation was based on a reference unit
recorded from the S1 hand region, since this microstimulation
paradigm has previously been shown to induce plasticity
[22,35,37,45]. These triggering units (which could be either
single- or multi-units) had an average spontaneous firing rate of
,10 Hz, and hence roughly 18000 spike-triggered microstimula-
tion pulses were applied in each 30 min session. No tactile
stimulation was applied during the microstimulation period. In
addition, we tested random microstimulation, with the mean and
standard deviation of this random input set to match the statistical
properties of previously recorded spike-triggered sequences. As a
further control, we used previously recorded spike recordings in
subsequent sessions; there were no obvious differences between
these and the random input.
Microstimulation pulses were delivered a short delay (5 ms)
after each spike recorded from the reference channel (conditioning
unit) on the S1 array. A delay of 5 ms was used since this latency
has previously been shown to induce potentiation [37]. The
conditioning unit was chosen randomly from the subset of touch-
responsive units, but was not specifically classified as propriocep-
tive or cutaneous. The spike timing of the conditioning unit was
taken from the MAP system (Plexon Inc.) and used to control a
digital IO card (PCI-6229, National Instruments Inc.) to trigger
the microstimulation. The microstimulation was delivered via an
isostimulator (Model 2200, A-M Systems Inc.) to a bipolar pair of
adjacent electrodes taken at random from the electrode array. The
stimulating electrodes were chosen to be an adjacent pair to
reduce current spread. The real-time control program for the
digital card was written in C (LabWindows/CVI, National
Instruments Inc.) and ran on a personal computer. It was capable
of producing any arbitrary stimulation pattern (including variables
Figure 2. Ensemble (network level) responses and dynamics before and after microstimulation. (A) Example response patterns, showingnormalized firing rate as a function of peristimulus time and unit number. (B) Ensemble firing rates increase following microstimulation in bothexperiment (session averages shown) and simulation; however, the simulation provides access to 100 times as many units. (C) Peristimulus timehistograms. Similar response shapes are seen in the experiment and simulation, including increased prestimulus activity and increased peak firingrate. (D) Changes in the Fano factor averaged across all units. Neural variability decreases during tactile response, an effect enhanced followingmicrostimulation in both the experimental and simulated conditions. (E) Stimulus-induced reductions in the Fano factor before and afterexperimental microstimulation across sessions. A larger post-stimulus decrease in the Fano factor is seen following microstimulation. Circles and dotsshow data from subjects JK and AC8, respectively. * = p,0.05.doi:10.1371/journal.pone.0057453.g002
Microstimulation in Primate Somatosensory Cortex
PLOS ONE | www.plosone.org 4 March 2013 | Volume 8 | Issue 3 | e57453

such as pulse width, amplitude, and frequency). The stimulation
parameters were chosen based on previous reports [21,37] and our
preliminary results [46]. Thus, cathode-leading biphasic double-
pulse stimuli were used for the stimulation pulse, as shown in
Figure 1D. These pulses had an amplitude of 50 mA, pulse width
of 200 ms per phase, and a pulse interval of 2 ms. This pulse
sequence was motivated by its similarity to the high-frequency
doublets often seen in S1 in response to natural touch [47].
Data AnalysisFiring rate modulation. In order to test the effect of
microstimulation on firing rate changes during tactile stimulation,
peristimulus time histograms (PSTHs) were constructed for the
tactile stimulation trials both before and after microstimulation.
The PSTHs were smoothed with a Gaussian density kernel with a
20 ms window to obtain the firing rate (Figure 2C). Then, the peak
firing rate and the area under the response curve were calculated
from the PSTHs for the 0–70 ms poststimulus time window, with
baseline defined by the time window starting 250 ms before the
stimulus and up to but not including 0 ms prestimulus time. These
windows were chosen based on the observed neural responses to
touch stimulation. If the peak firing rate in the response window
was above 3 SD of the baseline firing rate, the cell was classified as
touch responsive; otherwise it was classified as nonresponsive.
Neural response sharpness was defined as the ratio of the peak
firing rate to the temporal width of the response curve at a height
of 3 SD above baseline. We did not analyze the off responses
(neural responses due to the retraction of tactile stimulation).
Fano factor analysis. The Fano factor characterizes the
variability of neural activity, with a Fano factor of one
corresponding to a purely Poisson process. The firing rate and
the Fano factor, when combined, provide estimates of the
dynamics of neural firing [48]. The Fano factor is defined as
F~s2=m
where s2 and m are the variance and mean of spike counts within a
given 20 ms window. These windows were then shifted in 3 ms
increments to produce Figure 2D.
Unit pair mutual information and multi-
information. To determine how much information was
encoded or shared between units before and after microstimula-
tion, we calculated the mutual information for pairs and small
ensembles of cells. Mutual information has been successfully used
for analyzing statistical dependencies between spiking neural
systems [49]. Unlike the traditional linear cross-correlation
method, mutual information tests for both linear and nonlinear
dependences between pairs of units. In order to estimate the
mutual information between unit pairs, spike trains were binned in
10 ms windows, which resulted in values of either zero or one for
most bins. Shorter and longer time bins were tested, and gave
similar results with respect to changes observed before vs. after
microstimulation. The absolute value of the mutual information
increased with bin size, as did the statistical power of the findings,
but a relatively short bin size was used to reduce the potential for
bias. The mutual information of unit pairs was calculated as
I(x1x2)~Xx1
Xx2
p(x1,x2) logp(x1,x2)
p(x1)p(x2)
� �
where p(x1,x2) is the joint probability distribution function of x1
and x2, which are spike counts of a pair of units, with p(x1) and
p(x1,x2) being the marginal probability distribution functions of
units x1 and x2, respectively.
Parallel to the unit-pair mutual information, the multi-
information was used as a measure of the total ensemble, as an
alternative to looking at all possible mutual information unit pairs.
The multi-information expresses the amount of redundancy or
dependency existing among a set of variables. An increase in
multi-information indicates that there is an increase in information
shared between the ensemble units and thus a higher dependency
among its members. The multi-information of the ensemble units
was calculated as
C(x1,x2, � � � ,xn)
~Xx1
Xx2
� � �Xxn
p(x1,x2, � � � ,xn) logp(x1,x2, � � � ,xn)
p(x1)p(x2) � � � p(xn)
� �
where p(x1,x2, � � � ,xn) is the joint probability distribution function
of x1,x2, � � � ,xn, and p(x1)p(x2) � � � p(xn) are the marginal
probability distribution functions of x1,x2, � � � ,xn, respectively.
Information calculated by using the empirical probability
distribution will most likely have a bias when the number of
samples is limited, but this bias problem can be alleviated by the
use of bias correction techniques. When the number of trials is
large enough that every possible response occurs many times,
analytical approximations to the bias can be estimated [50]. In the
absence of knowledge about specific features of the neural
response statistics that favor one specific procedure over another,
we estimated the mutual information by using a shuffling bias
reduction procedure. Thus the estimated information was bias-
corrected after subtracting the shuffled information, as imple-
mented in an information-breakdown toolkit [51].
Statistical analysis. In order to evaluate the effect of
microstimulation on the network, we defined the percentage
change PC as
PC~Apost{Apre
Apre
|100%
where Apre and Apost were parameters before and after micro-
stimulation, respectively.
For the ensemble or network-level analysis, we found there were
some differences between the two subjects, such as one subject
having a higher firing rate and unit-pair correlation than the other.
However, the effects of microstimulation on the percentage
changes were similar, with no statistically significant differences
between the subjects, so we pooled the data from the two subjects
by considering each session as an observation for consideration in
our statistical testing. Then the following statistics were used: (1)
non-parametric Wilcoxon signed-rank tests were used to test
whether the percentage changes (of firing rates, Fano factor, mean
mutual information, and multi-information) were significantly
changed after microstimulation; and (2) two-sample Kolmogorov-
Smirnov tests were performed to compare whether pre- and post-
microstimulation condition variables were likely to have come
from the same distribution or not. All significance levels of the
above tests were set at 0.05, unless stated otherwise. All data
analyses were performed using MATLAB (The MathWorks Inc.).
Computer ModelThe computer model used here was based closely on Kerr et al.
[42], following earlier work by Lytton, Neymotin, and others [52–
55]. This model of the thalamocortical system uses leaky integrate-
Microstimulation in Primate Somatosensory Cortex
PLOS ONE | www.plosone.org 5 March 2013 | Volume 8 | Issue 3 | e57453

and-fire neurons. These neurons are capable of capturing much of
the phenomenology of real neurons (such as bursting, adaptation,
and depolarization blockade), while still being simple enough to
connect into large networks. The dynamics of each neuron is a
function of a single state variable representing the membrane
voltage. This voltage is updated based on one of three events:
1. Synaptic input: Vn(t)~Vn(t0)zws 1{ Vn(t0)Ei
� �e(t0{t)=ti , where
Vn is the membrane voltage of neuron n; t0 is the synaptic
event time (i.e., t{t0 is the time since the event); ws is the
weight of synaptic connection s; Ei is the reversal potential of
ion channel i, relative to resting membrane potential (where
i = AMPA, NMDA, or GABAA, and Eiw0 for depolarizing
inputs and Eiv0 for hyperpolarizing); and ti is the receptor
time constant. Synaptic weight ws is incremented via spike-
t i m i n g - d e p e n d e n t p l a s t i c i t y a c c o r d i n g t o
wfs ~wi
szaj Dtð Þe{DDtD=tL , where wis and wf
s are the initial
and final weights of the synapse, respectively; a is the plasticity
increment (equivalent to a learning rate); Dt is the temporal
difference between synaptic input and neuronal firing; j is a
sign function that specifies potentiation or depression via
j Dt§0ð Þ~1 and j Dtv0ð Þ~{1; and tL is the learning
window (10 ms). Maximal synaptic weights were 5 times the
synaptic weight at baseline, in line with experimentally
observed results [35].
2. Action potential: a neuron fires an action potential at time t if
BnwVn(t)wTn(t), where Bn, Vn, and Tn are the blockade
voltage, membrane voltage, and threshold voltage, respectively,
for neuron n. Action potentials arrive at target neurons at time
t2~t1ztszl n1,n2ð Þ=v, where t1 is the time the first neuron
fired, ts is the delay due to synaptic conduction effects, l n1,n2ð Þis the axon length between neurons n1 and n2, and v is the
axonal conduction velocity.
3. Refractory period: after firing, a neuron cannot fire during the
absolute refractory period, tA. Firing is reduced during the
relative refractory period by two effects: first, an increase in
threshold potential, Tn(t)~Tn(t0)zRet0{t
tR , where R is the
relative refractory change in threshold voltage and tR is its time
c o n s t a n t ; a n d s e c o n d , b y h y p e r p o l a r i z a t i o n ,
Vn(t)~Vn(t0)zHet0{t
tH , where H is the amount of hyperpolar-
ization and tH is its time constant.
These neurons were connected together to form thalamocortical
networks using empirical data on intrathalamic, thalamocortical,
interlaminar, and intralaminar connection densities. In total, the
model consisted of 1980 neurons distributed among 14 neuronal
populations (inhibitory thalamic reticular neurons; excitatory
thalamic relay neurons; and excitatory pyramidal neurons, fast-
spiking interneurons, and low-threshold-spiking interneurons for
cortical layers 2/3, 4, 5, and 6) in accordance with empirical data
on relative numbers of neurons in each layer. The number of
neurons in the model is constrained to be integer multiples of 495
by the relative number of neurons in each population. Models
consisting of 495 to 9900 ( = 206495) neurons were tested. The
model with 1980 ( = 46495) neurons produced very similar results
to larger models, so this model was used to minimize computation
time. Excitatory neurons differed from inhibitory ones in terms of
the parameters used in the equations above, while populations in
different layers were defined by having different connectivities.
Tables of parameter values and connectivities are provided in
Neymotin et al. [54]. Connections between neurons within a
single layer were spatially dependent, with a given connection
having probability p~pmaxe{d=s, where pmax is the maximum
connection probability; s is the rate of fall-off of connection
probabillity; and d is the distance between the two neurons,
defined as d~
ffiffiffiffiffiffiffiffiffiffiffiffiffiffiffiffiffiffiffiffiffiffiffiffiffiffiffiffiffiffiffiffiffiffiffiffiffiffiffiffiffiffiffiffix2{x1ð Þ2z y2{y1ð Þ2
q, where x1,2 and y1,2 are
the spatial coordinates of the two neurons. Values used for pmax
and s were based on empirical data.
Natural touch stimuli were modeled as suprathreshold inputs to
the 25% of the thalamocortical relay cells that were closest to the
center of the model (representing a spatially contiguous field
induced via point stimulation of the periphery); the precise fraction
of stimulated cells was not found to significantly affect the results of
the simulation. Touch stimuli were delivered with a mean period
of 600 ms (range: 400–800 ms). As in the experiment, micro-
stimulation was either triggered by the firing of a randomly-chosen
cell, or applied randomly with the same frequency and variance as
in the spike-triggered case. In both cases, microstimulation was
applied to 10% of all pyramidal neurons in cortical layer 5; in
contrast to natural touch stimuli, these cells were chosen randomly
rather than contiguously, since microstimulation is thought to
activate axons, rather than cell bodies, close to the electrode [56].
Each simulation lasted for 300 s of simulated time, and was
comprised of 100 s of tactile stimulation; 100 s of random
microstimulation, spike-triggered microstimulation, or tactile
stimulation; and then 100 s of tactile stimulation.
The model was implemented in NEURON 7.2 [57,58] for
Linux, and is available on ModelDB (https://senselab.med.yale.
edu/ModelDB/ShowModel.asp?model = 147579). Each 300 s
simulation took approximately 40 min to run on a single Intel
Xeon 2.3 GHz core.
Results
We recorded simultaneous neural activity in the somatosensory
cortex area 1 (Figure 1C) from 15 sessions in the two subjects (JK,
N = 8; AC8, N = 7). Single and multi-units were used for our
analysis without differentiation. Subject JK showed more multi-
unit activity than AC8; while this affected absolute values of firing
rate and mutual information, we did not observe significant
differences with respect to microstimulation-induced changes, and
thus data from the two subjects were analyzed together. An
average of 4268 (mean6SD) units were recorded from in each
session. Electrical stimulation was delivered at 10 sites between the
two subjects (JK, N = 4; AC8, N = 6). To determine the influence
that microstimulation had on the processing of natural tactile
stimulation, we analyzed the firing characteristics of the ensemble
during tactile stimulation trials both before and after the
microstimulation period. No microstimulation was given during
periods of touch stimulation, nor were touch stimuli applied
during microstimulation. Following careful removal of the
stimulation artifact, the conditioning phases during microstimula-
tion were analyzed in 12 sessions.
Changes in Ensemble Firing RateThe ensemble responses were analyzed for peak firing rate,
sharpness of the response curve, and area under the response
curve. Tactile stimulation resulted in widespread neural responses,
with a similar but stronger neural response observed after
microstimulation. Units simultaneously recorded in S1 displayed
a distribution of different response amplitudes (Figure 1F) and
latencies (Figure 2A) to tactile stimulation at the finger. At the
population level, the ensemble showed significant tactile responses
(defined as .3 SD above baseline firing rate) in all the recording
sessions, as would be expected for this cortical region (Figure 2C).
Following microstimulation, statistically significant increases were
Microstimulation in Primate Somatosensory Cortex
PLOS ONE | www.plosone.org 6 March 2013 | Volume 8 | Issue 3 | e57453

seen in the peak firing rate (8%), area under the curve (11%), and
response sharpness (15%), with all changes being statistically
significant (Wilcoxon signed-rank test, p,0.05). Similar results
were obtained in the model, which also showed an increased
average firing rate following microstimulation (Figure 2B) of
comparable magnitude (1562%). The model also found similar
changes in the area under the curve (1663%) and response
sharpness (3466%), as shown in Figure 2C. In short, these
findings indicate that spike-triggered microstimulation increases
the population response in area 1 to tactile stimulation and that
such changes are in agreement with spike time dependent
plasticity rules. Note that many of the quantitative differences
between experimental and model results (for example, baseline
firing rates of 10 Hz and 3 Hz, respectively) can be accounted for
by the fact that the experimental results include multi-units as well
as single units.
Changes in Ensemble VariabilityThe ratio of the variance and the mean of the firing rate, called
the Fano factor, is a common characterization of neural dynamics
[59], since changes in variability are often seen with changes in
response amplitude. If spikes are generated by a perfect Poisson
process, the Fano factor will be unity; the importance of Poisson
processes as models of neural activity explain why the Fano factor
is more commonly used in neuroscience than equivalent measures,
such as the dimensionless coefficient of variation (defined as the
ratio of the standard deviation to mean).
Before microstimulation, the Fano factor decreased by an
average of 7% following tactile stimulation, as shown in Figure 2D.
After microstimulation, the decrease was 9%, as shown in
Figure 2E, although some of this enhanced decrease is attributable
to the fact that the prestimulus Fano factor was higher after
microstimulation. This indicates that the neural response to touch
was more stereotyped and less variable between trials after
microstimulation compared to before. The decrease in the Fano
factor was also observed in individual units across trials (data not
shown). Qualitatively similar results were observed in the
simulation (Figure 2D), which found pre- and post-microstimula-
tion decreases of 18% and 20%, respectively. These results suggest
that spike-triggered microstimulation could potentially be used to
decrease the variability of somatosensory information transmission
in S1, at least at a neurophysiological level. However, psycho-
physical testing would be required to determine whether or not
these changes are above the threshold of perceptibility.
Changes in Mutual InformationIn order to test how sensory information is encoded between
units and how microstimulation affects this encoding, we used
several information-theoretic measures. Information theory has
been widely used to quantify how much information a neural
response carries about a stimulus [49]. Mutual information is a
measure of statistical dependence between two variables of
interest, such as the stimulus and spike trains [60]. Here we used
mutual information as a measure of the dependence between spike
trains from pairs of units (either single or multi-units). In addition,
we calculated multi-information, which quantifies the amount of
redundancy existing among the ensemble of units, and hence
provides a measure of stochastic dependence among variables in a
network. Unlike linear cross-correlation, these measures capture
both linear and nonlinear dependences between units.
In Figure 3A, we show typical results from unit-pair mutual
information analysis over the ensemble recorded in a single
session. The unit-pair mutual information was significantly
increased following microstimulation, both in terms of individual
sessions (Wilcoxon signed-rank test, p,0.05, Figure 3B) and across
the entire population (Kolmogorov-Smirnov test, p,1025,
Figure 3D); similar results were observed in the simulation
(Figure 3D). The multi-information of the ensemble units also
showed a significant increase after microstimulation (Wilcoxon
signed-rank test, p,0.01), as shown in Figure 3C. Mutual and
multi-information increased by 15% and 25%, respectively. The
simulation found that mutual information increased by 41% and
multi-information by 18%. Despite the relatively small effect size
in the experimental result, bootstrapping with 100 samples showed
that the increase was statistically significant in 13 out of the 15
sessions. The increased unit-pair mutual information and multi-
information suggest an increased functional connectivity in the
system following microstimulation. The much greater increase in
mutual information found in the simulation is linked to a much
higher overall level of mutual information, which is most likely due
to the fact that the simulation was able to sample many more
adjacent cell pairs, which have higher connectivity and thus higher
mutual information.
To understand the mechanisms underlying this change in
mutual information, the spike-timing dependent conditioning
process was analyzed in three consecutive 10 min phases during
microstimulation. The observed increases in mutual and multi-
information were most likely due to potentiation during micro-
stimulation (Figures 4A and B); this potentiation following
microstimulation occurred even in cases where depression
occurred during conditioning phases (Figure 4A, lower panel).
It has been reported that neighboring units are more likely to be
located in the same functional column, and thus show more highly
correlated activity [61]. We tested this by calculating unit-pair
mutual information as a function of distance, and found that
mutual information was higher for nearby units than for distant
ones, as expected; this effect was confirmed by the simulation,
which found an especially prominent increase ,100 mm, which
cannot be easily sampled experimentally (Figure 4C).
We also found that pairs of units that included the spike-
triggered reference unit had greater mutual information than pairs
that did not (Kolmogorov-Smirnov test, p,0.001), as shown in
Figure 4D. Overall, 64% triggering unit pairs showed increased
mutual information, compared to 58% for non-trigger unit pairs, a
statistically significant difference (Wilcoxon rank-sum test,
p,0.001). This suggests that connections between the triggering
unit and its neighbors were more likely to be potentiated than
other connections.
To ensure that these results were not biased by a small number
of poorly sampled units, we cross-validated these mutual
information findings using a pairwise-based correlation method.
This was applied at the level of the individual unit-pair, the
network, across sessions, and across the whole population.
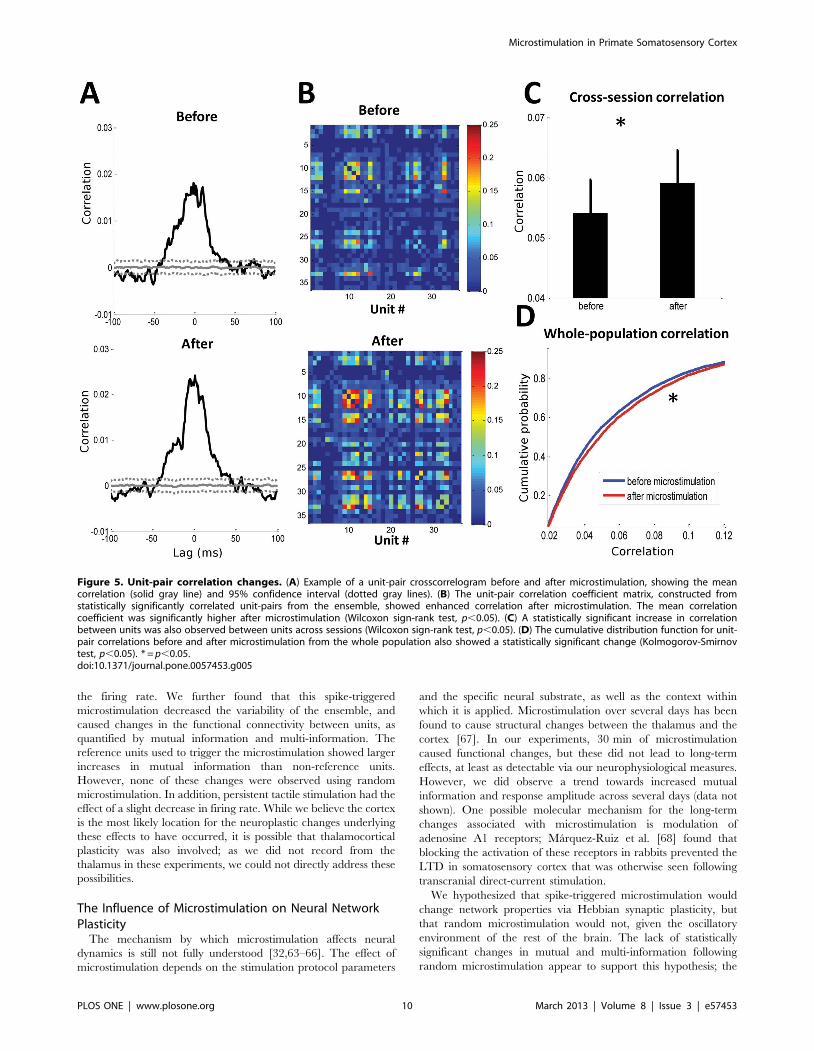
Examples of unit-pair (Figure 5A) and network (Figure 5B)
correlations showed significant increases in correlated firing after
microstimulation. There was also a significant increase in the unit-
pair correlation when analyzed across either sessions (Figure 5C)
or from whole population (Figure 5D). Over the whole population,
the correlation of unit pairs increased by an average of 10% after
microstimulation. Thus, these results were in agreement with the
findings of the information-based analysis.
Responsiveness to Tactile StimulationWe identified four types of units based on whether they
responded to tactile stimuli both before and after microstimula-
tion, responded before but not after microstimulation, responded
after but not before microstimulation, or did not respond to any
tactile stimuli. A plurality of units (48%) responded to tactile
Microstimulation in Primate Somatosensory Cortex
PLOS ONE | www.plosone.org 7 March 2013 | Volume 8 | Issue 3 | e57453

stimuli both before and after microstimulation; a small fraction of
units lost tactile responsiveness (8%) or acquired it (8%) following
microstimulation, while the remainder (36%) did not respond;
remarkably, nearly identical proportions as these were observed in
the simulation (Figure 6A). Units that responded both before and
after microstimulation showed significant increases in peak firing
rate, response sharpness, Fano factor, and mutual information
(Figure 6B) after microstimulation (Wilcoxon signed-rank test,
p,0.01 in all cases).
Units that responded both before and after were also located
considerably further from the stimulating electrode (Figure 6C).
This might result from stimulation-induced depression of neuronal
excitability for units close to the stimulating electrode [34], an
effect that was clearly observed in the stimulating channels. We
also found that the unit-pair mutual information for units
responsive only after microstimulation was significantly higher
than that of units responsive only before microstimulation
(Wilcoxon rank-sum test, p,0.01), although their distance to
stimulating electrode was not significantly different (Figure 6C).
This suggests that spike-triggered microstimulation might have
selective effects on different unit types.
Spike-Triggered vs. Random MicrostimulationIn order to test whether the effects described above were a result
of spike-triggered microstimulation, we performed additional tests
using random microstimulation and persistent tactile stimulation
in one of the subjects. During random microstimulation, the
frequency of the microstimulation pulse sequence had the same
mean and variance as in spike-triggered microstimulation; other
stimulation parameters were also kept constant. In contrast to
spike-triggered microstimulation, there were no statistically
significant differences in the firing rate, unit-pair mutual informa-
tion, or ensemble multi-information before and after microstimu-
lation (Figure 7A), although all four measures decreased in value
following microstimulation. This suggests that random micro-
stimulation protocols have different effects on S1 processing
compared with spike-triggered microstimulation. No statistically
significant effects were observed between random and spike-
triggered microstimulation in the model, however. We attribute
this to the fact that the model, unlike the real brain, does not exist
in a larger oscillatory environment. Hence, whereas experimental
random microstimulation pulses may be in-phase or antiphase
with respect to global brain activity (such as the alpha rhythm), this
Figure 3. Changes in mutual information (measured in bits). (A) Examples of unit-pair mutual information from single sessions before andafter microstimulation. The white asterisk indicates the triggering reference unit. (B) Mutual information for all sessions, showing a 15% increasefollowing microstimulation. (C) Multi-information for all sessions, showing a 25% increase following microstimulation. Circles and dots show datafrom subjects JK and AC8, respectively. (D) Cumulative distribution functions for mutual information in experimental (top) and simulated (bottom)conditions. * = p,0.05.doi:10.1371/journal.pone.0057453.g003
Microstimulation in Primate Somatosensory Cortex
PLOS ONE | www.plosone.org 8 March 2013 | Volume 8 | Issue 3 | e57453

does not apply to the model, which represents too small a region of
the brain to support pronounced, large-scale oscillatory behavior.
To test the effect of persistent tactile stimulation, we applied
tactile stimuli with a mean frequency of 0.5 Hz to the finger for
30 min. In contrast to spike-triggered microstimulation, persistent
tactile stimulation produced a small but significant reduction in
touch-induced firing rates. Similar results have been reported
using voltage-sensitive dye imaging during rat whisker adaptation
experiments [62]. However, there were no significant differences
found for the Fano factor or the information-based measures
(Figure 7B). Since the neural mechanisms underlying habituation
are still not well understood, they have not yet been incorporated
into the simulation, and hence it could not reproduce these results.
In summary, spike-triggered microstimulation had a stronger
effect on the network than random microstimulation, and tactile
versus electrical stimulation produced very different effects on the
network. Thus, different stimulation protocols can be used to
either facilitate or depress S1 activity and synchrony in response to
natural touch. While the model performed well in reproducing
both quantitative and qualitative aspects of the experimental spike-
triggered microstimulation results, it was less successful at
replicating the (null) results from random microstimulation and
persistent tactile stimulation, most likely as a result of its lack of
global activity patterns and a habituation mechanism. Further
research will be conducted in the future to determine if we can
bridge these gaps.
Discussion
We found that (1) microstimulation in area 1 of the primate
somatosensory cortex can induce neural reorganization at the level
of both individual units and the ensemble; (2) this reorganization is
dependent on the microstimulation protocol; (3) this reorganiza-
tion appears to subside within 30 min (data not shown); and (4) a
simulated network model of the thalamocortical system can
successfully reproduce both qualitative and quantitative aspects of
the in vivo findings. We found that a closed-loop, spike-triggered
microstimulation protocol induced plasticity in area 1 that elevated
Figure 4. Conditioning effects on mutual information (in bits). (A) Two example conditioning phases showing that unit-pair mutualinformation increased after microstimulation following either intra-stimulation potentiation (top panel) or intra-stimulation depression (bottompanel). (B) Conditioning effects for multi-information, showing evidence of potentiation across sessions. (C) Mutual information as a function ofdistance between the units in experimental (left) and simulated (right) conditions. The mutual information was generally higher for nearby pairs thanfor distant ones, although this effect was less pronounced following microstimulation. In the simulation, the effect was especially pronounced withinthe first 100 mm. Experimental distances are approximate, since cell body locations cannot be precisely determined from recording electrodes; hence,slight scatter has been added to the electrode separations to show the density of points at each distance. (D) The effect of the reference unit used forspike-triggered microstimulation. Unit pairs that included the reference unit showed a greater increase in mutual information followingmicrostimulation than pairs that did not. * = p,0.05.doi:10.1371/journal.pone.0057453.g004
Microstimulation in Primate Somatosensory Cortex
PLOS ONE | www.plosone.org 9 March 2013 | Volume 8 | Issue 3 | e57453
the firing rate. We further found that this spike-triggered
microstimulation decreased the variability of the ensemble, and
caused changes in the functional connectivity between units, as
quantified by mutual information and multi-information. The
reference units used to trigger the microstimulation showed larger
increases in mutual information than non-reference units.
However, none of these changes were observed using random
microstimulation. In addition, persistent tactile stimulation had the
effect of a slight decrease in firing rate. While we believe the cortex
is the most likely location for the neuroplastic changes underlying
these effects to have occurred, it is possible that thalamocortical
plasticity was also involved; as we did not record from the
thalamus in these experiments, we could not directly address these
possibilities.
The Influence of Microstimulation on Neural NetworkPlasticity
The mechanism by which microstimulation affects neural
dynamics is still not fully understood [32,63–66]. The effect of
microstimulation depends on the stimulation protocol parameters
and the specific neural substrate, as well as the context within
which it is applied. Microstimulation over several days has been
found to cause structural changes between the thalamus and the
cortex [67]. In our experiments, 30 min of microstimulation
caused functional changes, but these did not lead to long-term
effects, at least as detectable via our neurophysiological measures.
However, we did observe a trend towards increased mutual
information and response amplitude across several days (data not
shown). One possible molecular mechanism for the long-term
changes associated with microstimulation is modulation of
adenosine A1 receptors; Marquez-Ruiz et al. [68] found that
blocking the activation of these receptors in rabbits prevented the
LTD in somatosensory cortex that was otherwise seen following
transcranial direct-current stimulation.
We hypothesized that spike-triggered microstimulation would
change network properties via Hebbian synaptic plasticity, but
that random microstimulation would not, given the oscillatory
environment of the rest of the brain. The lack of statistically
significant changes in mutual and multi-information following
random microstimulation appear to support this hypothesis; the
Figure 5. Unit-pair correlation changes. (A) Example of a unit-pair crosscorrelogram before and after microstimulation, showing the meancorrelation (solid gray line) and 95% confidence interval (dotted gray lines). (B) The unit-pair correlation coefficient matrix, constructed fromstatistically significantly correlated unit-pairs from the ensemble, showed enhanced correlation after microstimulation. The mean correlationcoefficient was significantly higher after microstimulation (Wilcoxon sign-rank test, p,0.05). (C) A statistically significant increase in correlationbetween units was also observed between units across sessions (Wilcoxon sign-rank test, p,0.05). (D) The cumulative distribution function for unit-pair correlations before and after microstimulation from the whole population also showed a statistically significant change (Kolmogorov-Smirnovtest, p,0.05). * = p,0.05.doi:10.1371/journal.pone.0057453.g005
Microstimulation in Primate Somatosensory Cortex
PLOS ONE | www.plosone.org 10 March 2013 | Volume 8 | Issue 3 | e57453

fact that the model did not show this difference further supports
the hypothesis that large-scale effects are involved. We also
hypothesized that the synaptic changes are mostly due to
potentiation, as these would be expected to result in increased
unit-pair mutual information; however, in some sessions, we
observed decreases in mutual information, suggesting that synaptic
depression may also play an important role. We found that
potentiation was especially pronounced among unit pairs that
included the spike-triggered reference unit, as opposed to those
that did not.
Following microstimulation, roughly equal proportions of units
either became responsive to tactile stimulation or became
nonresponsive, despite the fact that the overall responsiveness
increased. This may indicate that there are regulatory mechanisms
built into the neural dynamics that lead to a stable number of units
representing touch to a given skin location. However, since the
simulation produced nearly identical results despite lacking any
explicit regulatory mechanism, this ‘‘regulation’’ appears to be a
simple emergent property of the network.
In summary, our results show that microstimulation has clear
short-term effects on network organization and modulation in
awake animals. Such microstimulation could potentially be used to
improve sensory performance by increasing the responsiveness of
units to tactile stimuli, by increasing the efficiency of information
transfer in individuals with compromised somatosensory through-
put.
The Effect of Microstimulation on Neural CodingIt has traditionally been believed that sensory information is
encoded by firing rates [69]. Later, population coding was widely
found in sensory and motor areas [70–72]. These coding strategies
are based on integration, and are thus robust against noise. The
role of neural synchrony is less clear, but may play an important
roles in cognition such as arousal, expectation, vigilance, attention,
and learning [73–77]. Synchronized firing has also been observed
Figure 6. Responsiveness to tactile stimulation. (A) We identified four types of units based on whether they responded to tactile stimuli bothbefore and after microstimulation (‘‘Always respond’’), responded before but not after microstimulation (‘‘Respond before’’), responded after but notbefore microstimulation (‘‘Respond after’’), or did not respond to any tactile stimuli (‘‘Never respond’’). Nearly identical proportions of each type wereobserved in the experiment and in the simulation. (B) Mutual information (in bits) as a function of unit responsiveness type. Unit-pair mutualinformation was significantly increased following microstimulation for each unit type; units that always responded to stimuli had much larger mutualinformation than other unit types. Error bars show standard error. (C) Relationship between unit responsiveness and distance to stimulatingelectrode. Units that either never responded to tactile stimulation, or only responded before microstimulation, were statistically significantly closer tothe stimulating electrode than units that responded both before and after microstimulation. * = p,0.05.doi:10.1371/journal.pone.0057453.g006
Microstimulation in Primate Somatosensory Cortex
PLOS ONE | www.plosone.org 11 March 2013 | Volume 8 | Issue 3 | e57453

in anesthetized animals [78], and therefore may be a generalized
property of the nervous system. Our data suggest that both coding
strategies might be used in S1, since we observed increases in both
firing rate and in information shared between pairs of units
following microstimulation. Further research is needed to deter-
mine if it is possible to decouple these two effects, and whether
each has a distinct influence on perception.
It has also been hypothesized that temporal coding could
enhance information flow along sensory pathways and thus
mediate sensory processing of external stimuli [71,77,79].
Synchronous responses are more likely than asynchronous ones
to undergo rapid processing. This may aid the animal during
active sensing to recognize external objects and guide motor
actions when fast integration of sensory information is needed. We
found that microstimulation increased synchrony, as measured by
mutual information. However, additional psychophysical tests
need to be performed to determine whether this produces
measurable changes in perception. Recent reports have shown
that stimulation in the sensorimotor cortex can enhance the
detection threshold in rats [21] and that motor performance can
be improved by rTMS stimulation in M1 in Parkinson’s disease
[24].
ConclusionThe effects that microstimulation of the primary somatosensory
cortex has on neural dynamics depend strongly on the stimulation
procedure used. Stimulations that are anchored to the underlying
dynamics of the region can cause neuroplasticity that increases the
network’s response amplitude to incoming sensory inputs,
decreases the ensemble variability, and increases the mutual
information shared by units that make up the neural ensemble.
These effects were reproduced using a computer model of the
thalamocortical system, providing a convenient and flexible
alternative to in vivo experimentation for exploring microstimula-
tion protocols. We do not yet know whether the network
reorganization we observed following microstimulation will affect
perception and behavior; this topic will be explored in future work.
Acknowledgments
We thank Mulugeta Semework, Pratik Chhatbar and Brandi Marsh for
assisting with the surgical implantation of the arrays; DLAR for their
excellent animal care; and the anonymous reviewers for their valuable
comments.
Figure 7. Context-dependent plasticity effects. Different parameters before and after either random microstimulation conditioning orpersistent touch conditioning (A) and their percentage changes (B). Random microstimulation had no statistically significant differences on peakfiring rate (FR; in Hz), Fano factor (FF), unit-pair mutual information (in bits), or multi-information (in bits). Persistent tactile stimulation resulted in astatistically significant decrease in firing rate, but no significant changes in other variables. Error bars show standard error. * = p,0.05.doi:10.1371/journal.pone.0057453.g007
Microstimulation in Primate Somatosensory Cortex
PLOS ONE | www.plosone.org 12 March 2013 | Volume 8 | Issue 3 | e57453

Author Contributions
Conceived and designed the experiments: WS CK JF. Performed the
experiments: WS CK. Analyzed the data: WS CK JF. Contributed
reagents/materials/analysis tools: WS CK WL JF. Wrote the paper: WS
CK.
References
1. Stoney SD Jr., Thompson WD, Asanuma H (1968) Excitation of pyramidal tractcells by intracortical microstimulation: effective extent of stimulating current.
J Neurophysiol 31: 659–669.
2. Clark KL, Armstrong KM, Moore T (2011) Probing neural circuitry and
function with electrical microstimulation. Proc Royal Soc B 278: 1121–1130.
3. Asanuma H, Hunsperger RW (1975) Functional significance of projection fromthe cerebellar nuclei to the motor cortex in the cat. Brain Res 98: 73–92.
4. Penfield W, Boldrey E (1937) Somatic Motor and Sensory Representation in the
Cerebral Cortex of Man As Studied By Electrical Stimulation. Brain 60.
5. Lenz FA, Seike M, Richardson RT, Lin YC, Baker FH, et al. (1993) Thermaland pain sensations evoked by microstimulation in the area of human
ventrocaudal nucleus. J Neurophysiol 70: 200–212.
6. Talwar SK, Xu S, Hawley ES, Weiss SA, Moxon KA, et al. (2002) Ratnavigation guided by remote control. Nature 417: 37–38.
7. O’Doherty JE, Lebedev MA, Ifft PJ, Zhuang KZ, Shokur S, et al. (2011) Active
tactile exploration using a brain-machine-brain interface. Nature 479: 228–231.
8. Salzman CD, Britten KH, Newsome WT (1990) Cortical microstimulationinfluences perceptual judgements of motion direction. Nature 346: 174–177.
9. Romo R, Hernandez A, Zainos A, Salinas E (1998) Somatosensory
discrimination based on cortical microstimulation. Nature 392: 387–390.
10. Romo R, Hernandez A, Zainos A, Brody CD, Lemus L (2000) Sensing without
touching: psychophysical performance based on cortical microstimulation.Neuron 26: 273–278.
11. Graziano MS, Taylor CS, Moore T (2002) Complex movements evoked by
microstimulation of precentral cortex. Neuron 34: 841–851.
12. Fitzsimmons NA, Drake W, Hanson TL, Lebedev MA, Nicolelis MA (2007)Primate reaching cued by multichannel spatiotemporal cortical microstimula-
tion. J Neurosci 27: 5593–5602.
13. Houweling AR, Brecht M (2008) Behavioural report of single neuron stimulationin somatosensory cortex. Nature 451: 65–68.
14. O’Doherty JE, Lebedev MA, Hanson TL, Fitzsimmons NA, Nicolelis MA (2009)
A brain-machine interface instructed by direct intracortical microstimulation.Front Integr Neurosci 3: 20.
15. Patel S, Ohara S, Dougherty PM, Gracely RH, Lenz FA (2006) Psychophysical
elements of place and modality specificity in the thalamic somatic sensory
nucleus (ventral caudal, vc) of awake humans. J Neurophysiol 95: 646–659.
16. Heming E, Sanden A, Kiss ZH (2010) Designing a somatosensory neuralprosthesis: percepts evoked by different patterns of thalamic stimulation. J Neural
Eng 7: 064001.
17. Li L, Brockmeier A, Francis JT, Sanchez JC, Principe JC (2011) An adaptiveinverse controller for online somatosensory microstimulation optimization. IEEE
Trans Biomed Eng: 13–16.
18. Brockmeier A, Choi J, DiStasio MM, Francis JT, Principe JC (2011) Optimizingmicrostimulation using a reinforcement learning framework. Conf Proc IEEE
Eng Med Biol Soc: 1069–1072.
19. Li L, Park M, Seth S, Choi J, Francis JT, et al. (2011) An adaptive decoder from
spike trains to micro-stimulation using kernel least-mean-squares (KLMS). IEEESignal Processing Machine Learning For Signal Processing: 1–6.
20. Leal-Campanario R, Delgado-Garcıa JM, Gruart A (2006) Microstimulation of
the somatosensory cortex can substitute for vibrissa stimulation during Pavlovianconditioning. Proc Natl Acad Sci USA 103: 10052–10057.
21. Rebesco JM, Miller LE (2011) Enhanced detection threshold for in vivo cortical
stimulation produced by Hebbian conditioning. J Neural Eng 8: 016011.
22. Rebesco JM, Stevenson IH, Kording KP, Solla SA, Miller LE (2010) Rewiringneural interactions by micro-stimulation. Front Sys Neurosci: 4.
23. Logothetis NK, Augath M, Murayama Y, Rauch A, Sultan F, et al. (2010) The
effects of electrical microstimulation on cortical signal propagation. Nat Neurosci
13: 1283–1291.
24. Palomar FJ, Diaz-Corrales F, Carrillo F, Fernandez-Del-Olmo M, Koch G, et
al. (2011) Sensory perception changes induced by transcranial magnetic
stimulation over the primary somatosensory cortex in Parkinson’s disease.Movement Disord 26: 2058–2064.
25. Celebrini S, Newsome WT (1995) Microstimulation of extrastriate area MST
influences performance on a direction discrimination task. J Neurophysiol 73:437–448.
26. Talwar SK, Gerstein GL (2001) Reorganization in awake rat auditory cortex by
local microstimulation and its effect on frequency-discrimination behavior.
J Neurophysiol 86: 1555–1572.
27. Griffin DM, Hudson HM, Belhaj-Saif A, Cheney PD (2011) Hijacking cortical
motor output with repetitive microstimulation. J Neurosci 31: 13088–13096.
28. Rosin B, Slovik M, Mitelman R, Rivlin-Etzion M, Haber SN, et al. (2011)
Closed-loop deep brain stimulation is superior in ameliorating parkinsonism.Neuron 72: 370–384.
29. Venkatraman S, Elkabany K, Long JD, Yao Y, Carmena JM (2009) A system for
neural recording and closed-loop intracortical microstimulation in awakerodents. IEEE Trans Biomed Eng 56: 15–22.
30. Liang SF, Liao YC, Shaw FZ, Chang DW, Young CP, et al. (2011) Closed-loopseizure control on epileptic rat models. J Neural Eng 8: 045001.
31. Bliss TV, Lomo T (1973) Long-lasting potentiation of synaptic transmission in
the dentate area of the anaesthetized rabbit following stimulation of the
perforant path. J Physiol 232: 331–356.
32. Bi G, Poo M (2001) Synaptic modification by correlated activity: Hebb’spostulate revisited. Ann Rev Neurosci 24: 139–166.
33. Whitlock JR, Heynen AJ, Shuler MG, Bear MF (2006) Learning induces long-
term potentiation in the hippocampus. Science Signalling 313: 1093.
34. Gruart A, Munoz MD, Delgado-Garcıa JM (2006) Involvement of the CA3–CA1 synapse in the acquisition of associative learning in behaving mice.
J Neurosci 26: 1077–1087.
35. Bi GQ, Poo MM (1998) Synaptic modifications in cultured hippocampalneurons: dependence on spike timing, synaptic strength, and postsynaptic cell
type. J Neurosci 18: 10464–10472.
36. Mu Y, Poo MM (2006) Spike timing-dependent LTP/LTD mediates visualexperience-dependent plasticity in a developing retinotectal system. Neuron 50:
115–125.
37. Jackson A, Mavoori J, Fetz EE (2006) Long-term motor cortex plasticity induced
by an electronic neural implant. Nature 444: 56–60.
38. Talathi SS, Hwang DU, Ditto WL (2008) Spike timing dependent plasticitypromotes synchrony of inhibitory networks in the presence of heterogeneity.
J Comput Neurosci 25: 262–281.
39. Song WG, Giszter SF (2011) Adaptation to a Cortex-Controlled Robot Attachedat the Pelvis and Engaged during Locomotion in Rats. J Neurosci 31: 3110–
3128.
40. Ganguly K, Dimitrov DF, Wallis JD, Carmena JM (2011) Reversible large-scalemodification of cortical networks during neuroprosthetic control. Nat Neurosci
14: 662–667.
41. Jarosiewicz B, Chase SM, Fraser GW, Velliste M, Kass RE, et al. (2008)
Functional network reorganization during learning in a brain-computerinterface paradigm. Proc Natl Acad Sci USA 105: 19486–19491.
42. Kerr CC, Neymotin SA, Chadderdon G, Fietkiewicz C, Francis J, et al. (2012)
Electrostimulation as a prosthesis for repair of information flow in a computermodel of neocortex. IEEE Trans Neural Sys Rehab Eng 20: 153–160.
43. Choi JS, DiStasio MM, Brockmeier AJ, Francis JT (2012) An electric field model
for prediction of somatosensory (S1) cortical field potentials induced by ventralposterior lateral (VPL) thalamic microstimulation. IEEE Trans Neural Sys
Rehab Eng 20: 161–169.
44. Chhatbar PY, von Kraus LM, Semework M, Francis JT (2010) A bio-friendly
and economical technique for chronic implantation of multiple microelectrodearrays. J Neurosci Methods 188: 187–194.
45. Dan Y, Poo MM (2004) Spike timing-dependent plasticity of neural circuits.
Neuron 44: 23–30.
46. Song WG, Semework M, Francis JT (2011). Neural network reorganization aftermicrostimulation in VPL and somatosensory cortex. Conf Proc Soc Neural
Control Movement.
47. Baker SN, Curio G, Lemon RN (2003) EEG oscillations at 600 Hz aremacroscopic markers for cortical spike bursts. J Physiol 550: 529–534.
48. Churchland MM, Yu BM, Cunningham JP, Sugrue LP, Cohen MR, et al.
(2010) Stimulus onset quenches neural variability: a widespread corticalphenomenon. Nat Neurosci 13: 369–378.
49. Borst A, Theunissen FE (1999) Information theory and neural coding. Nat
Neurosci 2: 947–957.
50. Panzeri S, Senatore R, Montemurro MA, Petersen RS (2007) Correcting for the
sampling bias problem in spike train information measures. J Neurophysiol 98:1064–1072.
51. Magri C, Whittingstall K, Singh V, Logothetis NK, Panzeri S (2009) A toolbox
for the fast information analysis of multiple-site LFP, EEG and spike trainrecordings. BMC Neurosci 10: 81.
52. Lytton WW, Stewart M (2005) A rule-based firing model for neural networks.
Int J Bioelectromagnetism 7: 47–50.
53. Lytton WW, Omurtag A, Neymotin SA, Hines M (2008) Just-in-timeconnectivity for large spiking networks. Neural Comput 20: 2745–2756.
54. Neymotin SA, Lee H, Park E, Fenton A, Lytton WW (2011) Emergence of
physiological oscillation frequencies in a computer model of neocortex. Front
Comput Neurosci 5: 1–17.
55. Neymotin SA, Kerr CC, Francis J, Lytton WW (2011) Training oscillatorydynamics with spike-timing-dependent plasticity in a computer model of
neocortex. IEEE Trans Signal Process Med Bio: 1–6.
56. Histed MH, Bonin V, Reid RC (2009) Direct activation of sparse, distributedpopulations of cortical neurons by electrical microstimulation. Neuron 63: 508–
522.
57. Carnevale N, Hines M (2006) The NEURON Book. New York: Cambridge.
58. Hines M, Carnevale N (2001) NEURON: a tool for neuroscientists.Neuroscientist 7: 123–135.
Microstimulation in Primate Somatosensory Cortex
PLOS ONE | www.plosone.org 13 March 2013 | Volume 8 | Issue 3 | e57453

59. Shadlen MN, Newsome WT (1998) The variable discharge of cortical neurons:
implications for connectivity, computation, and information coding. J Neurosci
18: 3870–3896.
60. Brunel N, Nadal JP (1998) Mutual information, Fisher information, and
population coding. Neural Comput 10: 1731–1757.
61. Li Y, Lu H, Cheng PL, Ge S, Xu H, et al. (2012) Clonally related visual cortical
neurons show similar stimulus feature selectivity. Nature 486: 118–121.
62. Ollerenshaw DRZ, Bari BA, Millard DC, Wang Q, Stanley GB (2011) Sensory
adaptation increases discriminability at the expense of detectability in the
whisker system of awake, behaving rats. Conf Proc Soc Neurosci 2011.
63. Ranck JB, Jr. (1975) Which elements are excited in electrical stimulation of
mammalian central nervous system: a review. Brain Res 98: 417–440.
64. Histed MH, Bonin V, Reid RC (2009) Direct activation of sparse, distributed
populations of cortical neurons by electrical microstimulation. Neuron 63: 508–
522.
65. Caporale N, Dan Y (2008) Spike timing-dependent plasticity: a Hebbian
learning rule. Ann Rev Neurosci 31: 25–46.
66. Dan Y, Poo MM (2006) Spike timing-dependent plasticity: from synapse to
perception. Physiol Rev 86: 1033–1048.
67. Keller A, Arissian K, Asanuma H (1992) Synaptic proliferation in the motor
cortex of adult cats after long-term thalamic stimulation. J Neurophysiol 68:
295–308.
68. Marquez-Ruiz J, Leal-Campanario R, Sanchez-Campusano R, Molaee-
Ardekani B, Wendling F, et al. (2012) Transcranial direct-current stimulation
modulates synaptic mechanisms involved in associative learning in behaving
rabbits. Proc Natl Acad Sci USA 109: 6710–6715.
69. Adrian ED (1926) The impulses produced by sensory nerve endings: Part I. J
Physiol 61: 49–72.70. Maunsell JH, Van Essen DC (1983) Functional properties of neurons in middle
temporal visual area of the macaque monkey. I. Selectivity for stimulus direction,
speed, and orientation. J Neurophysiol 49: 1127–1147.71. Petersen RS, Panzeri S, Diamond ME (2001) Population coding of stimulus
location in rat somatosensory cortex. Neuron 32: 503–514.72. Shadlen MN, Newsome WT (1994) Noise, neural codes and cortical
organization. Curr Opinion Neurobiol 4: 569–579.
73. Steinmetz PN, Roy A, Fitzgerald PJ, Hsiao SS, Johnson KO, et al. (2000)Attention modulates synchronized neuronal firing in primate somatosensory
cortex. Nature 404: 187–190.74. Salinas E, Sejnowski TJ (2001) Correlated neuronal activity and the flow of
neural information. Nat Rev Neurosci 2: 539–550.75. Alloway KD, Zhang M, Dick SH, Roy SA (2002) Pervasive synchronization of
local neural networks in the secondary somatosensory cortex of cats during focal
cutaneous stimulation. Exp Brain Res 147: 227–242.76. Roy A, Steinmetz PN, Hsiao SS, Johnson KO, Niebur E (2007) Synchrony: a
neural correlate of somatosensory attention. J Neurophysiol 98: 1645–1661.77. Niebur E, Hsiao SS, Johnson KO (2002) Synchrony: a neuronal mechanism for
attentional selection? Curr Opinion Neurobiol 12: 190–194.
78. Reed JL, Pouget P, Qi HX, Zhou Z, Bernard MR, et al. (2008) Widespreadspatial integration in primary somatosensory cortex. Proc Natl Acad Sci USA
105: 10233–10237.79. Petersen RS, Panzeri S, Diamond ME (2002) The role of individual spikes and
spike patterns in population coding of stimulus location in rat somatosensorycortex. Bio Systems 67: 187–193.
Microstimulation in Primate Somatosensory Cortex
PLOS ONE | www.plosone.org 14 March 2013 | Volume 8 | Issue 3 | e57453
Copyright © 2022 FDOKUMEN