Neural codes for perceptual discrimination in primary somatosensory cortex
10
Neural codes for perceptual discrimination in primary somatosensory cortex Rogelio Luna 1 , Adria ´n Herna ´ndez 1 , Carlos D Brody 2 & Ranulfo Romo 1 We sought to determine the neural code(s) for frequency discrimination of vibrotactile stimuli. We tested five possible candidate codes by analyzing the responses of single neurons recorded in primary somatosensory cortex of trained monkeys while they discriminated between two consecutive vibrotactile stimuli. Differences in the frequency of two stimuli could be discriminated using information from (i) time intervals between spikes, (ii) average spiking rate during each stimulus, (iii) absolute number of spikes elicited by each stimulus, (iv) average rate of bursts of spikes or (v) absolute number of spike bursts elicited by each stimulus. However, only a spike count code, in which spikes are integrated over a time window that has most of its mass in the first 250 ms of each stimulus period, covaried with behavior on a trial-by-trial basis, was consistent with psychophysical biases induced by manipulation of stimulus duration, and produced neurometric discrimination thresholds similar to behavioral psychophysical thresholds. Investigations in several sensory systems have shown how neural activity represents the physical parameters of sensory stimuli in both the periphery and central areas of the brain. This knowledge has paved the way for new questions that are more closely related to cognitive processing. For example, are the neural representations of sensory stimuli related to perception? In this respect, it has been shown that quickly adapting neurons of the primary somatosensory cortex (S1) are directly involved in frequency discrimination of vibrotactile stimuli 1,2 . But exactly which components of these neurons’ stimulus-evoked activity are associated with the discrimination process is not known. Most of the quickly adapting neurons of S1 show phase-locked responses to the periodic mechanical sinusoids, in the form of single spikes or bursts of spikes 3–6 . This suggests that discrimination could be based on observing the temporal intervals between responses to each stimulus period 3 . However, about one-third of the quickly adapting neurons in S1 also have a firing rate, averaged over the duration of a stimulus, that is a function of the periodic stimulus frequency, with higher firing rates in response to higher stimulus frequencies 5,6 . Thus, an observer of the stimulus-evoked activity in the quickly adapting neuronal population of S1 could discriminate between two periodic vibrotactile stimuli either by comparing the precise temporal intervals between spikes or by comparing the overall spike rates elicited by the two stimuli 7,8 . Previously, we have computed neurometric thresholds 6 for both spike periodicity–based codes and overall firing rate–based codes; we found that periodicity-based neurometric thresholds were far smaller than psychometric thresholds. In contrast, firing rate–based neuro- metric thresholds were similar to psychometric thresholds. This result favored firing rate over spike timing as the neural code for perception of vibrotactile stimuli 5,6 . Notably, monkeys are also able to discriminate the mean frequency of aperiodic stimuli, which lack any temporal regularity 1,5,6 . It is assumed that under aperiodic stimulation, discri- mination would be based on a comparison of overall spike rates 5,6 . Monkeys could use different coding strategies for periodic versus aperiodic stimuli, but a parsimonious account covering both the periodic and aperiodic cases once again favored firing rate as the neural code. There are, however, some further unexplored possibilities. For example, quickly adapting neurons of S1 typically respond to each stimulus pulse with a discrete burst of spikes. Encoding of vibrotactile stimuli could therefore be based on the number or rate of events, where each event is defined as a burst instead of being defined as a single spike. An observer counting bursts would obtain a good estimate of the count of stimulus pulses, and this estimate would be independent of varia- bility in the number of spikes fired in response to each pulse. Indeed, there is experimental evidence suggesting that bursting activity could efficiently encode the stimulus features 9–12 . But whether bursting actually contributes directly to psychophysical behavior is not known. Finally, the temporal window on which vibrotactile discrimi- nation is based has not been determined. In our previous experiments, stimulus periods were always 500 ms long. Under those conditions, the use of a code based on counting events and the use of a code based on the rate of events could not be distinguished. To distinguish between all these alternatives, we conducted new combined psychophysical and neurophysiological experiments in the vibrotactile discrimination task. We reasoned that if an observer uses firing rate, bursting rate or a measure of periodicity, then increases or decreases in the duration of either of the two stimuli used in each trial © 2005 Nature Publishing Group http://www.nature.com/natureneuroscience Published online 31 July 2005; doi:10.1038/nn1513 1 Instituto de Fisiologı´a Celular, Universidad Nacional Auto ´noma de Me ´xico, 04510 Me ´xico, D.F., Me ´xico. 2 Cold Spring Harbor Laboratory, Cold Spring Harbor, New York 11724, USA. Correspondence should be addressed to R.R. ([email protected]). NATURE NEUROSCIENCE ADVANCE ONLINE PUBLICATION 1 ARTICLES
-
Upload
independent -
Category
Documents
-
view
0 -
download
0
Transcript of Neural codes for perceptual discrimination in primary somatosensory cortex

Neural codes for perceptual discrimination in primarysomatosensory cortex
Rogelio Luna1, Adrian Hernandez1, Carlos D Brody2 & Ranulfo Romo1
We sought to determine the neural code(s) for frequency discrimination of vibrotactile stimuli. We tested five possible candidate
codes by analyzing the responses of single neurons recorded in primary somatosensory cortex of trained monkeys while they
discriminated between two consecutive vibrotactile stimuli. Differences in the frequency of two stimuli could be discriminated
using information from (i) time intervals between spikes, (ii) average spiking rate during each stimulus, (iii) absolute number of
spikes elicited by each stimulus, (iv) average rate of bursts of spikes or (v) absolute number of spike bursts elicited by each
stimulus. However, only a spike count code, in which spikes are integrated over a time window that has most of its mass in the
first 250 ms of each stimulus period, covaried with behavior on a trial-by-trial basis, was consistent with psychophysical biases
induced by manipulation of stimulus duration, and produced neurometric discrimination thresholds similar to behavioral
psychophysical thresholds.
Investigations in several sensory systems have shown how neuralactivity represents the physical parameters of sensory stimuli in boththe periphery and central areas of the brain. This knowledge has pavedthe way for new questions that are more closely related to cognitiveprocessing. For example, are the neural representations of sensorystimuli related to perception? In this respect, it has been shown thatquickly adapting neurons of the primary somatosensory cortex (S1) aredirectly involved in frequency discrimination of vibrotactile stimuli1,2.But exactly which components of these neurons’ stimulus-evokedactivity are associated with the discrimination process is not known.Most of the quickly adapting neurons of S1 show phase-lockedresponses to the periodic mechanical sinusoids, in the form of singlespikes or bursts of spikes3–6. This suggests that discrimination could bebased on observing the temporal intervals between responses to eachstimulus period3. However, about one-third of the quickly adaptingneurons in S1 also have a firing rate, averaged over the duration of astimulus, that is a function of the periodic stimulus frequency, withhigher firing rates in response to higher stimulus frequencies5,6. Thus,an observer of the stimulus-evoked activity in the quickly adaptingneuronal population of S1 could discriminate between two periodicvibrotactile stimuli either by comparing the precise temporal intervalsbetween spikes or by comparing the overall spike rates elicited by thetwo stimuli7,8.
Previously, we have computed neurometric thresholds6 for bothspike periodicity–based codes and overall firing rate–based codes; wefound that periodicity-based neurometric thresholds were far smallerthan psychometric thresholds. In contrast, firing rate–based neuro-metric thresholds were similar to psychometric thresholds. This resultfavored firing rate over spike timing as the neural code for perception of
vibrotactile stimuli5,6. Notably, monkeys are also able to discriminatethe mean frequency of aperiodic stimuli, which lack any temporalregularity1,5,6. It is assumed that under aperiodic stimulation, discri-mination would be based on a comparison of overall spike rates5,6.Monkeys could use different coding strategies for periodic versusaperiodic stimuli, but a parsimonious account covering boththe periodic and aperiodic cases once again favored firing rate asthe neural code.
There are, however, some further unexplored possibilities. Forexample, quickly adapting neurons of S1 typically respond to eachstimulus pulse with a discrete burst of spikes. Encoding of vibrotactilestimuli could therefore be based on the number or rate of events, whereeach event is defined as a burst instead of being defined as a single spike.An observer counting bursts would obtain a good estimate of the countof stimulus pulses, and this estimate would be independent of varia-bility in the number of spikes fired in response to each pulse. Indeed,there is experimental evidence suggesting that bursting activity couldefficiently encode the stimulus features9–12. But whether burstingactually contributes directly to psychophysical behavior is notknown. Finally, the temporal window on which vibrotactile discrimi-nation is based has not been determined. In our previous experiments,stimulus periods were always 500 ms long. Under those conditions, theuse of a code based on counting events and the use of a code based onthe rate of events could not be distinguished.
To distinguish between all these alternatives, we conducted newcombined psychophysical and neurophysiological experiments in thevibrotactile discrimination task. We reasoned that if an observer usesfiring rate, bursting rate or a measure of periodicity, then increases ordecreases in the duration of either of the two stimuli used in each trial
©20
05 N
atu
re P
ub
lish
ing
Gro
up
h
ttp
://w
ww
.nat
ure
.co
m/n
atu
reneuroscience
Published online 31 July 2005; doi:10.1038/nn1513
1Instituto de Fisiologıa Celular, Universidad Nacional Autonoma de Mexico, 04510 Mexico, D.F., Mexico. 2Cold Spring Harbor Laboratory, Cold Spring Harbor, New York11724, USA. Correspondence should be addressed to R.R. ([email protected]).
NATURE NEUROSCIENCE ADVANCE ONLINE PUBLICATION 1
ART ICLES

of the task should not lead to a systematic bias in discrimination ineither of the two possible directions. (However, under this hypothesis,stimulus duration could affect the sensory signal-to-noise ratio andtherefore the psychometric threshold.) Alternatively, if the observeruses a strategy based on the total number of spikes or bursts fired inresponse to each stimulus, then manipulation of the stimulus durationshould systematically bias performance, with longer stimuli beingperceived as having been of higher frequency than they actually were.We found that when the duration of one of the two stimuli was changedby 50% relative to the other stimulus, monkeys indeed biased theirdiscrimination performance. Monkeys treated shortened stimuli as ifthe applied stimulus frequency had been slightly but significantly lowerthan it actually was; conversely, monkeys treated lengthened stimuli asif the applied frequency had been slightly butsignificantly higher than it actually was. Theseeffects were observed with both periodic andaperiodic stimuli. We sought an explanationfor these psychophysical biases by recordingquickly adapting neurons of S1 while themonkeys performed in variable–stimuluslength conditions. We found that the effectscan be qualitatively explained if one assumesthat the neural signal used by the observer tosolve the task is a weighted sum of eitherspikes or bursts over a time window thatconcentrates most of its weight within thefirst 250 ms of the stimulus but also has asmall tail in later parts of the stimulus. Finally,examining trial-by-trial covariations ofweighted counts of spikes and weightedcounts of bursts, we found that only theweighted count of spikes covaried with per-formance on a trial-by-trial basis.
RESULTS
Stimulus duration biases performance
Two monkeys (Macaca mulatta) were trainedin the vibrotactile discrimination task (Fig. 1).Initially, the monkeys were trained to discri-minate between pairs of periodic stimulusfrequencies of equal duration (500 ms) upto their psychophysical thresholds3,13. Wethen asked whether they could discriminatebetween pairs of aperiodic stimuli1,6. In each
of these two task conditions, and in separate trial blocks, monkeyscompared a second stimulus frequency that varied from trial to trial(range, 14–30 Hz) against a fixed first stimulus frequency (22 Hz), orthey compared a fixed second stimulus frequency (22 Hz) against avarying first stimulus frequency (range, 14–30 Hz). The differencesbetween the psychometric thresholds for the four cases (data notshown) were not significant (permutation test, n ¼ 1,000, P ¼ 0.32)14.
Experiments using fixed-duration stimuli cannot distinguishbetween a code based on the total number of events produced inresponse to each stimulus and a code based on the rate at which theevents are produced. However, if discrimination is based on a totalnumber of events over the stimulus periods, changing this number bychanging the stimulus period durations should affect discriminationperformance. In contrast, if we assume that the periodicity measureand the spike and burst rate measures are time invariant during astimulus, and one of these is the code used, then changing stimulusduration should not affect discrimination performance. We used blocksof trials in which, on a pseudorandom trial-by-trial basis, monkeyswere required to discriminate either between two vibrotactile stimuli ofequal duration (500 ms, control condition) or between two stimuliwhere one of the two stimuli was modified in length. In separate blocks,the modified stimulus either shortened by 50% to 250 ms, orlengthened by 50% to 750 ms. The other stimulus was kept at500 ms. As before, in some blocks of trials we kept f1 fixed at 22 Hzand varied f2 (Fig. 2a,b); in other blocks of trials, we varied f1 andkept f2 fixed (Fig. 2c,d). We compiled psychometric curves for thedifferent stimulus conditions and fit a logistic function to eachpsychometric curve.
Quantitative changes in the psychometric curves can be assessedthrough two parameters of the logistic fits (Fig. 2): (i) the psychometric
©20
05 N
atu
re P
ub
lish
ing
Gro
up
h
ttp
://w
ww
.nat
ure
.co
m/n
atu
reneuroscience
f1 f2PD KD KU PB
500 ms
Figure 1 Discrimination task. Sequence of events during each trial. The
mechanical probe is lowered (PD), indenting the glabrous skin of one digit
of the hand, and the monkey places its free hand (KD) on an immovable key.
The probe oscillates vertically at base frequency f1, and after a delay (3 s),
a second mechanical vibration is delivered at the comparison frequency (f2).The monkey releases the key (KU) after a delay (3 s) between f2 and KU
and presses one of two push buttons (PB) to indicate whether the second
stimulus was higher or lower. In separate stimulus sets, monkeys
discriminated between periodic (black line) and aperiodic (gray line)
stimulus frequencies.
f1 f2
Periodic Aperiodic
500 ms250 ms
750 ms
500 ms250 ms
750 ms500 ms250 ms
750 ms
500 ms250 ms
750 ms
f1 f2
f1 f2 f1 f2
14 18 22 26 300
1
p (f
2 hi
gher
than
f1)
p (f
1 hi
gher
than
f2)
f2 (Hz)
n = 22n = 12
n = 10
n = 77n = 42
n = 35n = 90n = 52
n = 38
n = 24n = 15
n = 9
PT = 4.41 ± 0.32PT = 3.79 ± 0.46
PT = 5.24 ± 0.61
X0 = 20.3 ± 0.54X0 = 19.7 ± 0.72
X0 = 22.6 ± 0.78
PT = 4.73 ± 0.16PT = 5.44 ± 0.34
PT = 5.56 ± 0.42
X0 = 21.6 ± 0.2X0 = 19.8 ± 0.42
X0 = 24.9 ± 0.39
PT = 5.74 ± 0.49PT = 6.14 ± 0.34
PT = 6.56 ± 0.52
X0 = 22.0 ± 0.18X0 = 19.3 ± 0.32
X0 = 26.3 ± 0.32
PT = 4.53 ± 0.31PT = 5.01 ± 0.29
PT = 6.78 ± 0.62
X0 = 21.3 ± 0.49X0 = 19.7 ± 0.64
X0 = 24.4 ± 0.93
14 18 22 26 300
1
p (f
2 hi
gher
than
f1)
p (f
1 hi
gher
than
f2)
f2 (Hz)
14 18 22 26 300
1
f1 (Hz)14 18 22 26 30
0
1
f1 (Hz)
a b
c d
Figure 2 Psychophysical performance during the manipulation of the duration of one of the two stimuli.
(a) Psychophysical performance when the duration of the second (f2) periodic stimulus increased (red) or
decreased (cyan) with respect to the first (f1) periodic stimulus. (b) The same as in a, but with aperiodic
stimuli. (c) Psychophysical performance when the duration of the periodic f1 stimulus increased (red) or
decreased (cyan) with respect to f2. (d) The same protocol as in c, but with aperiodic stimuli. n, number
of sessions for each stimulus condition; PT, psychometric thresholds for each stimulus condition (mean
± s.d.); X0, the frequency (mean ± s.d.) that corresponds to a y-axis value of 0.5 value in the logistic fit
for each stimulus condition.
2 ADVANCE ONLINE PUBLICATION NATURE NEUROSCIENCE
ART ICLES

threshold, which measures the steepness of the logistic curve andrepresents the minimal change in stimulus frequency that produces areliable change in behavior, and (ii) the X0 value, which is a measure ofthe displacement of the curve along the horizontal axis and whichrepresents the frequency at which the stimulus being varied (f1 or f2) isindistinguishable from the stimulus kept fixed at 22 Hz. Values of X0greater than 22 Hz (rightward displacement of the psychometric curve)indicate that the subject judges the varying stimulus to have a lowerfrequency than its actual value. Values of X0 lower than 22 Hz (leftwarddisplacement of the psychometric curve) indicate that the subjectjudges the varying stimulus to have a higher frequency than its actualvalue. In extreme cases, large displacements of the logistic curvepreclude an accurate estimation of X0.
In general, we found that psychometric thresholds were only mini-mally affected by changes in stimulus duration (Fig. 2). The singleexception was the condition in which f2 was decreased in length by 50%with respect to f1 for aperiodic stimuli (Fig. 2b, cyan; permutation test,n¼ 1,000, Po 0.001)14. In contrast, X0 values were systematically andsignificantly affected by stimulus duration. Monkeys treated shortenedstimuli as if they had a frequency that was 2.3–4.3 Hz lower than theactual applied value (compare X0 values and psychometric curve shiftsin Fig. 2a–d for shortened stimuli (cyan) versus control-length stimuli(black); permutation test, n ¼ 1,000, P o 0.04)14. This bias effect wasobserved for both periodic (Fig. 2a,c) and aperiodic (Fig. 2b,d) stimuli.The opposite effect was observed when lengthened stimuli were used:monkeys treated lengthened stimuli as if they had a frequency that was0.6–2.7 Hz higher than the actual applied value (compare X0 values andpsychometric curve shifts in Fig. 2a–d for lengthened stimuli (red)versus control-length stimuli (black); permutation test, n ¼ 1,000,P o 0.04)14. Although the sign of the lengthening effect was the samein all conditions, the effect was strongest and statistically significant
only when the first stimulus, f1, was lengthened (red in Fig. 2c,d;Permutation test, n ¼ 1,000, P o 0.001)14. Again, the effect wasobserved for both periodic (Fig. 2c) and aperiodic (Fig. 2d)stimuli. The bias effects persisted over many trials despite the factthat monkeys were rewarded only for correct discrimination of theactual applied frequencies.
These results show that manipulations of the stimulus durationbiased psychophysical performance in a direction consistent with anaccumulative–event number code, such as integrating the number ofspikes or bursts over each stimulus. However, the magnitude of theeffect suggests that the accumulation of spikes or bursts does not occurequally over the entire stimulus period. For example, if firing rates wereconstant over the stimulus periods, and spikes were accumulated withequal weight over the entire period, then halving the stimulus lengthwould have halved X0 values with respect to the control (that is,shortened stimuli would have had X0 ¼ 11 Hz), and increasingstimulus lengths by 50% should have led to an increase of 50% in X0values (lengthened stimuli would have had X0¼ 33 Hz). Although thesign of the observed effect was in all cases consistent with the sign of thisprediction, the observed magnitude was much lower. In addition, theeffect was consistently stronger for shortening of stimuli than forlengthening of stimuli, which suggests that the initial part of thestimulus may have greater weight than the later part of the stimulusin determining discrimination performance. However, as there was adiscernible effect when stimuli were lengthened from 500 to 750 ms, thelater part of the stimulus must also have some influence on theperceptual process, though perhaps less influence than the earlierpart of the stimulus.
There are two distinct alternatives that could contribute towards agreater weighting for the initial part of this stimulus than for the laterpart. First, the response of S1 neurons, which are known to be causally
©20
05 N
atu
re P
ub
lish
ing
Gro
up
h
ttp
://w
ww
.nat
ure
.co
m/n
atu
reneuroscience
0 320
32
Res
pons
es(2
50 to
750
ms)
Periodicity
0 3000
300Firing rate
0 3000
300
Responses (0 to 250 ms)
No. of spikes
0 250
25No. of bursts
0 500
50Bursting rate
0 250 500 7500
1
Ave
rage
of s
lope
s
0 250 500 7500
4
0 250 500 7500
2.5
Time (ms)0 250 500 750
0
0.8
0 250 500 7500
1
a
b
Figure 3 Responses of S1 neurons as a function of time during the stimulus period. (a) Comparison of responses, using 750-ms-long stimuli, from the first
250 ms versus the last 500 ms for each of the five measures. Each point represents data for one stimulus condition from one neuron. In the first panel, only
the periodic stimulus trials are used, as no information can be calculated from the periodicity for aperiodic stimuli. Measures calculated during both periodic
and aperiodic stimuli are plotted in all other panels. Diagonal gray line is the expected value when the response is time invariant; black line is the value
obtained using the regression analysis in the data. (b) Response measure sensitivity, expressed as the linear regression slope (in units of response measure
change per 1 Hz change in stimulus frequency), averaged over all neurons, as a function of time for each of the five measures in panel a. Aperiodic stimulus
trials are not used in the first panel; both periodic and aperiodic trials are used in all other panels.
NATURE NEUROSCIENCE ADVANCE ONLINE PUBLICATION 3
ART ICLES

related to perception of vibrotactile stimuli1,2, could adapt duringthe stimulus, being more sensitive to stimulus parameters duringthe earlier versus the later parts of the stimulus15–18. Alternatively, aprocess subsequent to S1 involved in perception could preferentiallyweight the S1 responses from the earlier, versus the later, parts ofthe stimulus. We first explore S1 neuron adaptation and then turn tothe second alternative.
Response adaptation in S1 does not explain performance
To investigate whether S1 neuron responses were differentially stimulus-sensitive during different portions of the stimulus, we recorded single,quickly adapting neurons in S1 (Table 1) while the monkeys discrimi-nated between the periodic or aperiodic stimulus pairs shown inFigure 2. We examined the sensitivity over time of five candidateneural codes: spike timing periodicity, overall spike rate, overall spikecount, overall burst rate and overall burst count. We took responses to750-ms-long stimuli and compared, for each measure, the first 250 msof the stimulus to the last 500 ms of the stimulus (Fig. 3a). We foundthat spike periodicity was time invariant (Fig. 3a) but that for all othermeasures, responses were significantly attenuated from the initial250 ms to the final 500 ms of the stimulus (black slope below grayline; permutation test on distribution of responses for initial versuslater part of the stimulus period, n ¼ 1,000; P o 0.01)14. We alsocompiled trials in which both the first (f1) and the second (f2) stimuluswere 500 ms long, and compared the response attenuation in the firststimulus with the response attenuation in the second stimulus (datanot shown). No significant differences were found (permutation test,
n ¼ 1,000; P ¼ 0.41)14. The initially stronger response to the stimuluscould carry information about the stimulus value itself, or it could be aresponse common to all stimulus values and therefore uninformative.For each measure, we calculated a linear regression of the measure as afunction of stimulus frequency (as in Fig. 4 below) and used the slopeof this linear regression to quantify the sensitivity of each measure tochanges in stimulus frequency. We did this for a range of time windowsall beginning at the start of the stimulus and extending into thestimulus in steps of 50 ms. We averaged these sensitivity slopes overneurons (Fig. 3b, lower panels) and found that the sensitivity of theperiodicity and burst rate measures remained roughly constant overtime during the stimulus. However, the sensitivity of the spike ratemeasure peaked approximately 200 ms after stimulus onset, suggestingthat spikes from this time period would be particularly informativewhen used for stimulus discrimination.
These results suggest that for some codes, differential stimulussensitivity in S1 neurons to different times during the stimulus couldcontribute to psychophysical biases induced by using varying stimuluslengths. But for each of the five candidate codes (periodicity, spikenumber, spike rate, burst number and burst rate), we must address theissue in a manner that allows quantitative comparison between theneuronal response measure and psychophysical results. We thereforeused our five candidate measures to compute neurometric thresholdsfrom S1 neuron responses6. These can be directly compared with themonkeys’ psychometric threshold6,19. In our initial neurometric calcu-lations, we weighted all parts of each stimulus equally, corresponding toan observer central to S1 that weights all parts of the stimulus equally.
©20
05 N
atu
re P
ub
lish
ing
Gro
up
h
ttp
://w
ww
.nat
ure
.co
m/n
atu
reneuroscience
14 300
36
Per
iodi
city
(H
z)
b
14 300
1
NT = 0.22X0 = 22NT = 0.22X0 = 22NT = 1X0 = 22
p (f
1 >
f2)
c
14 300
135F
iring
rat
e
14 300
1
NT = 3.5X0 = 21NT = 1.9X0 = 18
14 300
85
Num
ber
of s
pike
s
Frequency pairs
14 300
1
f1 (Hz)
14 300
20
Num
ber
of b
urst
s
14 300
1
NT = 3.5X0 = 21
14 300
30
Bur
stin
g ra
te
14 300
1
NT = 3.5X0 = 21NT = 3.9X0 = 21NT = 3.5X0 = 20
30:22
28:22
26:22
24:22
20:22
18:22
16:22
14:22
f1a f2 f1 f2 f1 f2
22 22 22 22 22 22 22 22 22 22
NT = 3.4X0 = 22
NT = 3.4X0 = 22
Figure 4 Responses of an area 1 neuron during the discrimination of the periodic stimulus set in Figure 2c. (a) Raster plots. Here, the duration of the first
stimulus (f1) decreased (50%, cyan) or increased (50%, red) with respect to the comparison frequency (500 ms, gray). Middle panel: responses duringdiscrimination of frequencies of equal duration. (b) Five different response measures, plotted as a function of stimulus frequency, during the manipulation of
the stimulus duration. (c) Neurometric curves using the different measures during each stimulus condition. NT, neurometric threshold; X0, the frequency that
gives a y-axis value of 0.5 value from the logistic fit.
4 ADVANCE ONLINE PUBLICATION NATURE NEUROSCIENCE
ART ICLES

The results for one sample neuron are shown in Figure 4. As can beseen in the spike rasters of Figure 4a, this neuron was stronglyentrained by the periodic stimuli. Consistent with Figure 3a, theperiodicity measure for this neuron was similar for all stimulusdurations (leftmost panel, Fig. 4b). Similarly, the burst rate measurewas similar for all stimulus durations (rightmost panel, Fig. 4b).However, other measures were significantly affected by stimulusduration. Spike rates, calculated over each stimulus period length,were slightly but significantly higher for the short, 250-ms stimulusdurations (Fig. 4b, cyan), compared with spike rates for 500 and750 ms durations (Fig. 4b, black and red lines, respectively).Compared with control-stimulus period lengths, total spike orburst numbers were markedly higher for long, 750-ms stimulusdurations (Fig. 4b, red versus black) and markedly lower for 250-msstimulus durations, (Fig. 4b, cyan versus black). Similar trends wereobserved during discrimination of aperiodic stimuli (with the excep-tion of periodicity, which cannot be calculated when aperiodic stimuliare used). Thus, except for periodicity and burst rate, differentmeasures were considerably affected by the manipulation of thestimulus duration.
The neuronal response distributions elicited by the stimuli are thebasis for constructing neurometric functions, which can then becompared directly to the psychometric functions. Figure 4c showsneurometric curves, based on response distributions using differentmeasures, for the neuron of Figure 4a. As expected from Figure 4b, X0values based on the periodicity measure were not affected by the
stimulus duration. In contrast, neurometricX0 values calculated from a spike-rate codewere affected by stimulus duration but in adirection opposite to the effect found withpsychometric X0 values (compare Fig. 4c withFig. 2c). Neurometric X0 values for eitherspike number or burst number calculatedfrom a total-event-number code were affectedin the same direction as the psychometric X0values, but the magnitude of the neurometriceffect was far stronger than the psychometriceffect. Finally, neurometric X0 values calcu-lated from a burst-rate code were not signifi-cantly affected by stimulus duration. Thetrends shown for the example neuron ofFigure 4 were similar across the populationof recorded neurons (Fig. 5).
This result shows that when all parts ofthe stimulus response of S1 neurons areweighted equally, none of the five codes con-
sidered so far produces stimulus duration effects on neurometric curvesthat mimic those seen in the psychometric curves. Thus, none of thefive codes can explain the psychophysical biases produced by themanipulation of the stimulus duration.
Weighted integration of S1 responses explains performance
We therefore considered the alternative option: namely, that a processinvolved in perception but subsequent to S1 could differentially weightdifferent portions of the stimulus. This corresponds to carrying outneurometric calculations that assign different weights to differentportions of the stimulus response. Because the periodicity code didnot depend on the portion of time used to measure it, we did notinclude periodicity in this analysis, restricting ourselves to spike- andburst-based codes.
Having measured psychometric curves at three different stimuluslengths, we used a weighting window composed of three fixed-durationintervals corresponding to the three stimulus lengths (Fig. 6a). We nowassume that an observer central to S1 would use the same weightingwindow for all stimulus lengths. This makes event-rate and event-countcodes equivalent to each other: the relationship between event-rate andevent-count codes is defined by the weighting window in that rate canbe defined as the weighted event count divided by the area of theweighting window. In this sense, Figures 4 and 5 assume a rectangularweighting window whose width varies with the stimulus length and isalways as long as the stimulus. But here we turn to the assumption thatthe weighting window is constant over all stimulus lengths. The rate
©20
05 N
atu
re P
ub
lish
ing
Gro
up
h
ttp
://w
ww
.nat
ure
.co
m/n
atu
reneuroscience
14 22 300
1
14 22 300
1
14 22 300
1
14 22 300
1
14 22 300
1
14 22 300
1
14 22 300
1
14 22 300
1
14 22 300
1
14 22 300
1
14 22 300
1
14 22 300
1
14 22 300
1
14 22 300
1
14 22 300
1
14 22 300
1
14 22 300
1
14 22 300
1
14 22 300
1
14 22 300
1
Periodic stimuli
Aperiodic stimuli
Periodicity Firing rate No. of spikes No. of bursts Bursting rate
Periodicity Firing rate No. of spikes No. of bursts Bursting rate
p (c
ompa
rison
freq
uenc
y ju
dged
hig
her)
Comparison frequency [Hz]
p (c
ompa
rison
freq
uenc
y ju
dged
hig
her)
Comparison frequency [Hz]
Figure 5 Individual neurons’ neurometric
functions, using different measures, while
monkeys performed the discrimination task using
the stimulus sets in Figure 2. Color codes and
display format as in Figure 4c. Note the large
changes produced by manipulation of the stimulus
duration compared to the control neurometric
functions (black). These changes occurredfor both periodic and aperiodic stimulus
discriminations. Black, equal duration of the two
stimuli: 500 ms. Cyan, the duration of one of the
two stimuli decreased (50%) as compared with
the other. Red, the duration of one of the two
stimuli increased (50%) as compared with
the other.
NATURE NEUROSCIENCE ADVANCE ONLINE PUBLICATION 5
ART ICLES

codes and weighted-event-count codes therefore differ only in a fixednormalization constant (the area of weighting window) and thusbecome equivalent to each other.
What should be the shape of this weighting window? Only therelative weights for the different stimulus portions are of importance indetermining shape. We therefore kept the weight of the initial 250-msportion fixed at an arbitrary value of 1 and systematically varied theweights for each of the other two intervals in the range [0, 1.9] in stepsof 0.1 (20 different values for each interval, leading to 400 different totalwindow shapes). Each of the possible window shapes was used tointegrate spikes or bursts, and the resulting values were considered asspike- or burst-response measures. Distributions of these responsemeasures were then used to compute neurometric functions as before,and the result was averaged over neurons. We computed the sum of
squared differences between the averaged neurometric curves and themonkeys’ psychometric curves. The window shapes that gave theminimal squared difference are shown in Figure 6a. Figures 6c and eshow the corresponding neurometric curves, averaged over neurons,for spike integration and for burst integration, respectively. Resultsbased on these integration measures show that such windows canindeed lead to psychophysical biases of a sign and magnitude compar-able to those found experimentally, with shortening (cyan) having agreater effect than lengthening (red). These results are also consistentwith the idea that the earlier components of the neuronal responseshave a greater impact than later components on the perceptual signalused to perform the task.
The weighting window in Figure 6a was based on three rectangularportions, but this was determined by data from three specific stimuluslengths. In general, our data are roughly consistent with window shapesthat have a gradual fall-off as a function of time, and any actual windowused by the subjects is unlikely to have a strictly stepwise shape. Wetherefore constructed a time window with a square shape for 230 msfollowed by an exponential fall-off, with a time constant of 60 ms(Fig. 6b). We used this window, placed beginning at stimulus onset, as aweighting window to integrate spikes or bursts. The results of using thiswindow (Fig. 6d and f, for spike integration and for burst integration,respectively, with the same window used for both) are essentiallysimilar to those obtained using the stepwise window of Figure 6a,with shortening (cyan) having a greater effect than lengthening(red). The window is placed at the peak of spike sensitivity tostimulus frequency.
©20
05 N
atu
re P
ub
lish
ing
Gro
up
h
ttp
://w
ww
.nat
ure
.co
m/n
atu
reneuroscience
0 250 500 750
0
1W
eigh
t
Time (ms)
p (c
ompa
rison
freq
uenc
y ju
dged
hig
her)
14 18 22 26 30
0
1
Comparison frequency (Hz)
Spikes
Bursts
Wd = 0.1 + e–(t – 223)/60
(230 < t < 750 ms)
0 250 500 750
0
1
Time (ms)
14 18 22 26 30
0
1
14 18 22 26 30
0
1
Spikes
Bursts
Comparison frequency (Hz)
n = 42n = 28n = 39
n = 87n = 83n = 76
14 18 22 26 30
0
1
a
c
e
b
d
f
Figure 6 An integration time window, for event-number codes, that produces
neurometric biases consistent with the psychophysical biases induced by
stimulus lengthening and shortening. (a) Weighting windows, W(t), composed
of three rectangular portions, each 250 ms wide. The response measure for
events at time ti using this kernel is defined as the sum over i of W(ti). Time
t ¼ 0 corresponds to the start of the stimulus. The windows for spike events
and for burst events shown here are those that produced the neurometric
curves in c and e below most similar to the psychometric curves. (b) Asmoother weighting window with properties similar to those shown in a.
(c) Neurometric curves, averaged over neurons, that follow from using
the spike weighting window in a when each event is an individual spike.
(d) Neurometric curve as in c but using the weighting window of b. (e) The
neurometric curves that follow from using the burst weighting window in a
when each event is a burst of spikes. (f) Neurometric curve as in e but using
the weighting window of b.
–3 –2 –1 0 1 2 3
–3 –2 –1 0 1 2 3
0
1
Cum
ulat
ive
resp
onse
–3 –2 –1 0 1 2 3Normalized spikes
–3 –2 –1 0 1 2 30
1
0
1
0
1
–3 –2 –1 0 1 2 3Normalized bursts
–3 –2 –1 0 1 2 3
Cum
ulat
ive
resp
onse
0
1
0
1
250:500 ms 500:500 ms 750:500 ms
250:500 ms 500:500 ms 750:500 ms
ROC = 0.55P = 0.01n = 1,00028 neurons
ROC = 0.49P = 0.32n = 1,00083 neurons
ROC = 0.51P = 0.23n = 1,00087 neurons
ROC = 0.51P = 0.39n = 1,00076 neurons
ROC = 0.54P = 0.001n = 1,00042 neurons
ROC = 0.52P = 0.26n = 1,00039 neurons
Spikes
Bursts
Figure 7 Weighted counts of spikes covary with
behavior on a trial-by-trial basis, but weighted
counts of bursts do not. Each panel shows the
cumulative distribution of normalized responses
for correct (solid lines) versus incorrect (dotted
lines) trials for trials with the stimulus lengths
shown. Events in each stimulus are integrated
using the weighting window of Figure 6a. In the
top row, events are defined as single spikes,
whereas in the bottom row, events are defined
as bursts of spikes. Only neurons for which the
weighted measure (spikes or bursts) was
significantly stimulus-dependent were used ineach panel, leading to different numbers of
neurons in upper versus lower panels. ROC,
receiver operating characteristic measure
comparing the two distributions. The probability
of observing this ROC value or greater by chance
is 0.5, estimated using a permutation test.
n, number of permutations.
6 ADVANCE ONLINE PUBLICATION NATURE NEUROSCIENCE
ART ICLES

Weighted sum of spikes covaries with performance
Our results using the weighting windows suggest that either spikesor bursts, when integrated using the windows of the top panels ofFigure 6, could form the basis for an S1 neuronal code that is consistentwith the psychophysical results of Figure 2. To further test the relation-ship between these two neuronal response measures and behavioralperformance, we carried out an analysis that distinguished betweencorrect and error trials. We assumed that on each trial, the animal’sperformance was based on comparing the activity of S1 neurons duringthe first stimulus with the activity of S1 neurons during the secondstimulus. Trial-to-trial variations in the activity of these neurons is thenexpected to affect the animal’s performance5,19. For each neuron, foreach trial and for each of the two response measures (weighted spikesand weighted bursts, using the window of Fig. 6a), we calculated thedifference between the measure applied to the spikes fired in responseto the second stimulus in the trial, and the measure applied to theresponse to the first stimulus in the trial. We then grouped trials intoclasses defined by the f1, f2 stimulus frequency pair used in each trial.When f2 4 f1, we expected correct trials to be associated with morepositive measure differences than error trials; conversely, whenf2 o f1, we expected correct trials to be associated with more negativemeasure differences. We multiplied each trial’s measure difference bythe sign of (f2 – f1) so that all trial classes would have the same expectedtendencies. We then normalized each trial’s measure difference into aZ-score by (i) subtracting the mean measure difference over those trialsthat shared the same (f1,f2) stimulus values and were recorded from thesame neuron and then (ii) dividing by the standard deviation of thatgroup of trials. We could now collapse together all trials from all classes,allowing us to search for what could be very weak correlations betweensingle S1 neurons and behavior. We asked whether the distribution ofnormalized measure differences for correct trials had a significantlymore positive mean than the distribution of normalized measuredifferences for error trials. We found that the two distributions werevery slightly but quite significantly different only for the weightedspiking rate measure (Fig. 7; permutation test, n¼ 1,000, Po 0.01)14,but not for the weighted bursting rate measures (Fig. 7; permutationtest, n ¼ 1,000, P 4 0.2)14. The effect was of a magnitude comparableto similar correct-versus-error trial tendencies found in the middletemporal area during a perceptual discrimination task20. The effect wasfound for weighted spike measures during comparison of 250-ms-longstimuli with 500-ms-long stimuli, as well as during comparison of500-ms-long stimuli with 500-ms-long stimuli. However, no significanteffect was found when one stimulus was 750 ms long and the other was500 ms long (upper panels of Fig. 7); we have no explanation for thelack of effect in this case.
DISCUSSION
The frequency of the vibrotactile stimulus can be defined as (i) thenumber of pulses per unit of time, or as (ii) the inverse of the period of
time between two consecutive mechanical sinusoid periods. To identifythe stimulus frequency, a subject could count the number of mechan-ical sinusoid periods per unit of time or measure the interval betweentwo consecutive sinusoid periods. Here, we have addressed the follow-ing questions: first, whether we can identify in the neuronal activity ofS1 which strategy an observer might use to discriminate between twovibrotactile stimuli, and second, which of the potential strategies areactually used by the subjects. Quickly adapting neurons of S1 typicallyproduce a brief burst of spikes in response to each mechanical sinusoidperiod. We found that depending on the stimulus sets and conditions,an observer of the evoked-neuronal responses in S1 could extractinformation from either (i) the overall spiking rates during the stimuli,(ii) the rates of bursting, (iii) a count of the number of spikes or (iv) acount of the number of bursts elicited by the vibrotactile stimuli. Countand rate codes are different only when the stimulus can vary induration. We note that by ‘count codes’ we do not necessarily meanthat the observer consciously counts the exact number of pulses duringthe stimulus—an observer could simply judge whether there are morepulses in one stimulus period that there are in the other. However, as weexplain further below, when we further consider which of thesepotential codes might be actually used by subjects performing thetask, we find reasons to reject burst-based codes, suggesting that themost likely neural code for vibrotactile discrimination is one based onspike rate or count.
To distinguish whether a code based on spike rate or a code based onspike count was more to be used by subjects when discriminatingbetween two stimuli, we manipulated stimulus duration. We assumedthat if the observer used a rate-based code, or even a periodicity-basedcode, manipulation of stimulus duration should have no effect onpsychometric curves. But if the observer used a simple accumulativecounting strategy, stimulus duration manipulation should result inconsistent and predictable biases in behavior. Monkeys biased theirpsychophysical performance in a manner consistent with an accumu-lative counting strategy. In other words, when the duration of one ofthe two stimuli increased, monkeys behaved as if the frequency of thatstimulus were higher than it actually was, and when the duration of astimulus was shortened, monkeys behaved as if the frequency of thatstimulus were lower than it actually was. However, although the sign ofthe bias was consistent with an accumulative-counting code, themagnitude of the bias was much smaller than that predicted byaccumulation over the entirety of the stimulus periods. Consequently,we considered a weighting window, defining a kernel over which spikesmight be accumulated (that is, integrated), with most of the windowconcentrated over a time period significantly shorter than the standard500-ms-long stimulus. We found that a spike integration time windowwith a 230-ms width, followed by an exponential fall-off with a timeconstant of 60 ms, can qualitatively account for both sign andmagnitude of the psychophysical biases observed experimentally,can be used for both periodic and aperiodic stimuli, covaries on a
©20
05 N
atu
re P
ub
lish
ing
Gro
up
h
ttp
://w
ww
.nat
ure
.co
m/n
atu
reneuroscience
Table 1 Neurons recorded in primary somatosensory cortex (S1) during vibrotactile discrimination with variable stimulus length
f1:f2 duration (ms) Periodic (f1: 14–30 Hz, f2: 22 Hz) Aperiodic (f1: 14–30 Hz, f2: 22 Hz) Periodic (f1: 22 Hz, f2: 14–30 Hz) Aperiodic (f1: 22 Hz, f2: 14–30 Hz)
250:500 83 (p ¼ 61, fr ¼ 22, b ¼ 63) 86 (p ¼ 5, fr ¼ 27, b ¼ 64) – –
750:500 101 (p ¼ 75, fr ¼ 31, b ¼ 78) 131 (p ¼ 6, fr ¼ 38, b ¼ 95) – –
500:250 – – 23 (p ¼ 16, fr ¼ 8, b ¼ 17) 15 (p ¼ 0, fr ¼ 6, b ¼ 11)
500:750 – – 29 (p ¼ 20, fr ¼ 9, b ¼ 21) 40 (p ¼ 2, fr ¼ 7, b ¼ 28)
f1, first stimulus. f2, second stimulus. First number in each column under ‘periodic’ or ‘aperiodic’ represents number of those neurons tested with a modification in the stimulus duration of a total of146 neurons. Each stimulus set of variable stimulus length had an equal number of trials in which the two stimulus periods were always 500 ms long. Numbers in parentheses after ‘¼’ correspond tothe numbers of neurons that had significant slopes for the measures of periodicity (p), firing rate (fr) and bursts (b). The slopes were calculated using the stimulus periods of 500:500 ms.
NATURE NEUROSCIENCE ADVANCE ONLINE PUBLICATION 7
ART ICLES
trial-by-trial basis with behavior and produces neurometric discrimi-nation thresholds that are similar to psychometric thresholds. We donot propose this time window as the precisely shaped unique windowwith these properties; other windows of approximately the same shapeand size, but differing in the details of their shape (for instance, agamma function instead of flat followed by exponential fall-off) wouldshare the same properties. In sum, spike integration over a window ofthis form is the single candidate neural code for vibrotactile discrimi-nation that is consistent with all the data examined to date. The outputof such spike integration from quickly adapting neurons of S1 couldform the input to more central areas, in which a spike-rate codeencodes the stimulus frequency during the stimulus presentation,working memory, comparison and decision-making processes of thistask6,21–26. The specific mechanisms by which integration over such atime window might be carried out remain to be determined.
Our findings are closely reminiscent of psychophysical evidencefound for integration time windows during detection of vibrotactilestimuli in the vibration frequency range (250 Hz; ref. 27). Some of theseauthors found no evidence for integration in sensations transduced bynon-Pacinian receptors, which are thought to underlie perception ofstimuli in the flutter frequency range (6–40 Hz; ref. 27). But their use ofa detection task at high frequencies, as opposed to the discriminationtask in the flutter frequency range we used here, precludes a directcontrast between the two studies.
We have previously found that modifying the amplitude of themechanical stimuli has no detectable effect on discrimination bias orperformance, as long as the stimuli remain well above threshold fordetection1, as they are here. This is consistent with our present results:well above detection threshold, modest changes in stimulus amplitudedo not change the firing rate of mechanosensory afferents withreceptive fields centered at the stimulation site. Instead, amplitudechanges affect the number of afferents with receptive field centers awayfrom the stimulation site that are recruited into responding to thestimulus28. Thus, we might expect S1 neurons with receptive fieldscentered at the stimulation site to be similarly insensitive to modestchanges in stimulus amplitudes29. If discrimination is based on theweighted integration of spikes from these neurons, then discriminationwould not be affected by amplitude changes that keep the stimulusabove detection threshold.
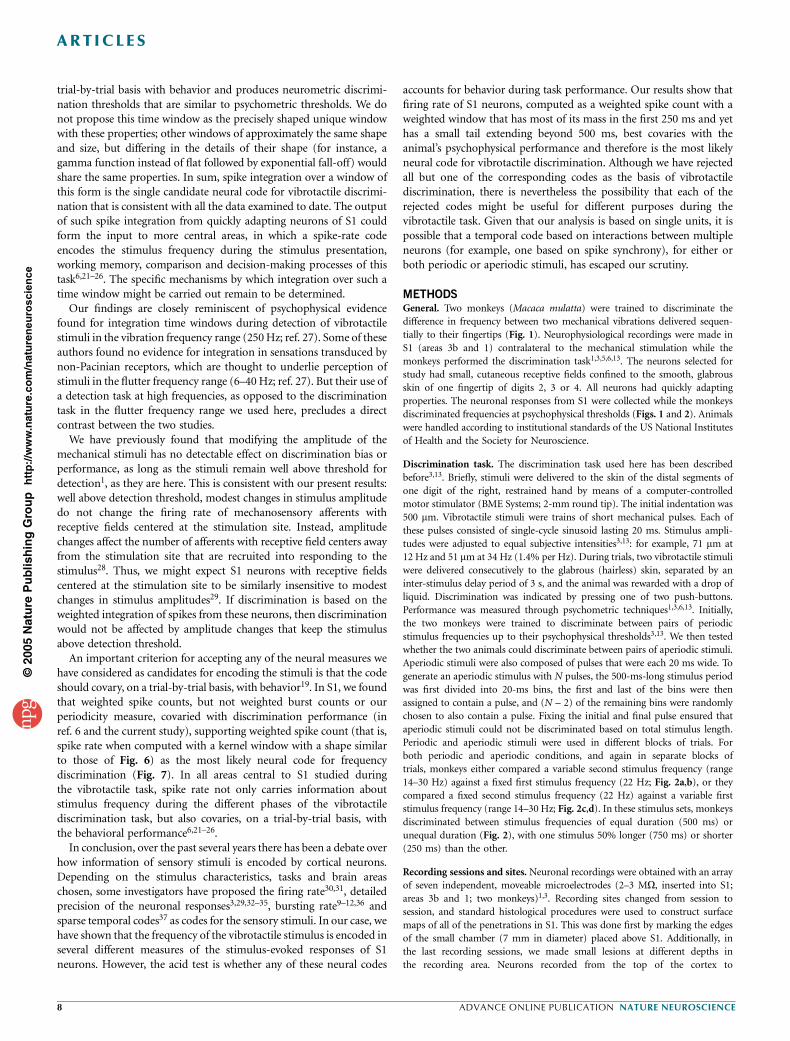
An important criterion for accepting any of the neural measures wehave considered as candidates for encoding the stimuli is that the codeshould covary, on a trial-by-trial basis, with behavior19. In S1, we foundthat weighted spike counts, but not weighted burst counts or ourperiodicity measure, covaried with discrimination performance (inref. 6 and the current study), supporting weighted spike count (that is,spike rate when computed with a kernel window with a shape similarto those of Fig. 6) as the most likely neural code for frequencydiscrimination (Fig. 7). In all areas central to S1 studied duringthe vibrotactile task, spike rate not only carries information aboutstimulus frequency during the different phases of the vibrotactilediscrimination task, but also covaries, on a trial-by-trial basis, withthe behavioral performance6,21–26.
In conclusion, over the past several years there has been a debate overhow information of sensory stimuli is encoded by cortical neurons.Depending on the stimulus characteristics, tasks and brain areaschosen, some investigators have proposed the firing rate30,31, detailedprecision of the neuronal responses3,29,32–35, bursting rate9–12,36 andsparse temporal codes37 as codes for the sensory stimuli. In our case, wehave shown that the frequency of the vibrotactile stimulus is encoded inseveral different measures of the stimulus-evoked responses of S1neurons. However, the acid test is whether any of these neural codes
accounts for behavior during task performance. Our results show thatfiring rate of S1 neurons, computed as a weighted spike count with aweighted window that has most of its mass in the first 250 ms and yethas a small tail extending beyond 500 ms, best covaries with theanimal’s psychophysical performance and therefore is the most likelyneural code for vibrotactile discrimination. Although we have rejectedall but one of the corresponding codes as the basis of vibrotactilediscrimination, there is nevertheless the possibility that each of therejected codes might be useful for different purposes during thevibrotactile task. Given that our analysis is based on single units, it ispossible that a temporal code based on interactions between multipleneurons (for example, one based on spike synchrony), for either orboth periodic or aperiodic stimuli, has escaped our scrutiny.
METHODSGeneral. Two monkeys (Macaca mulatta) were trained to discriminate the
difference in frequency between two mechanical vibrations delivered sequen-
tially to their fingertips (Fig. 1). Neurophysiological recordings were made in
S1 (areas 3b and 1) contralateral to the mechanical stimulation while the
monkeys performed the discrimination task1,3,5,6,13. The neurons selected for
study had small, cutaneous receptive fields confined to the smooth, glabrous
skin of one fingertip of digits 2, 3 or 4. All neurons had quickly adapting
properties. The neuronal responses from S1 were collected while the monkeys
discriminated frequencies at psychophysical thresholds (Figs. 1 and 2). Animals
were handled according to institutional standards of the US National Institutes
of Health and the Society for Neuroscience.
Discrimination task. The discrimination task used here has been described
before3,13. Briefly, stimuli were delivered to the skin of the distal segments of
one digit of the right, restrained hand by means of a computer-controlled
motor stimulator (BME Systems; 2-mm round tip). The initial indentation was
500 mm. Vibrotactile stimuli were trains of short mechanical pulses. Each of
these pulses consisted of single-cycle sinusoid lasting 20 ms. Stimulus ampli-
tudes were adjusted to equal subjective intensities3,13: for example, 71 mm at
12 Hz and 51 mm at 34 Hz (1.4% per Hz). During trials, two vibrotactile stimuli
were delivered consecutively to the glabrous (hairless) skin, separated by an
inter-stimulus delay period of 3 s, and the animal was rewarded with a drop of
liquid. Discrimination was indicated by pressing one of two push-buttons.
Performance was measured through psychometric techniques1,3,6,13. Initially,
the two monkeys were trained to discriminate between pairs of periodic
stimulus frequencies up to their psychophysical thresholds3,13. We then tested
whether the two animals could discriminate between pairs of aperiodic stimuli.
Aperiodic stimuli were also composed of pulses that were each 20 ms wide. To
generate an aperiodic stimulus with N pulses, the 500-ms-long stimulus period
was first divided into 20-ms bins, the first and last of the bins were then
assigned to contain a pulse, and (N – 2) of the remaining bins were randomly
chosen to also contain a pulse. Fixing the initial and final pulse ensured that
aperiodic stimuli could not be discriminated based on total stimulus length.
Periodic and aperiodic stimuli were used in different blocks of trials. For
both periodic and aperiodic conditions, and again in separate blocks of
trials, monkeys either compared a variable second stimulus frequency (range
14–30 Hz) against a fixed first stimulus frequency (22 Hz; Fig. 2a,b), or they
compared a fixed second stimulus frequency (22 Hz) against a variable first
stimulus frequency (range 14–30 Hz; Fig. 2c,d). In these stimulus sets, monkeys
discriminated between stimulus frequencies of equal duration (500 ms) or
unequal duration (Fig. 2), with one stimulus 50% longer (750 ms) or shorter
(250 ms) than the other.
Recording sessions and sites. Neuronal recordings were obtained with an array
of seven independent, moveable microelectrodes (2–3 MO, inserted into S1;
areas 3b and 1; two monkeys)1,3. Recording sites changed from session to
session, and standard histological procedures were used to construct surface
maps of all of the penetrations in S1. This was done first by marking the edges
of the small chamber (7 mm in diameter) placed above S1. Additionally, in
the last recording sessions, we made small lesions at different depths in
the recording area. Neurons recorded from the top of the cortex to
©20
05 N
atu
re P
ub
lish
ing
Gro
up
h
ttp
://w
ww
.nat
ure
.co
m/n
atu
reneuroscience
8 ADVANCE ONLINE PUBLICATION NATURE NEUROSCIENCE
ART ICLES

2,500 mm below the surface fell into area 1; neurons recorded 2,500 mm from
the insertion site and below fell into area 3b. All of these neurons had small
cutaneous receptive fields confined to the distal segments of fingertips 2, 3 or 4
and had quickly adapting properties.
Data analysis. For each neuron studied during the discrimination task, offline
analysis and statistical tests were done with custom and Matlab software
(Mathworks). The analysis was restricted to the stimulus periods according
to three criteria. First, we devised a measure that quantified the capacity of the
neurons to represent the periodicity of the stimulus. For each trial, the power
spectrum of the spike train evoked during the stimulus period was computed
(fast Fourier transform, n ¼ 216; sampling frequency, 10 kHz; resolution, 0.15;
range, 6–100 Hz)38,39. As an estimate of the periodicity, we calculated the
median frequency around the peak power spectrum frequency. The frequencies
used for this measure were limited to those within a factor of 1.8 of the peak (to
avoid contamination by harmonics) and to frequencies with a power greater
than 0.15 of the power at the peak (to avoid noise). The median frequency
calculated in this way was considered a quantitative measure of periodicity
evoked in S1 neurons by the periodic or aperiodic mechanical stimuli. Second,
neurons were classified as responding with bursts to the mechanical stimuli
according to two criteria. First, an elevated firing rate criterion: we required the
number of spikes recorded during the interval that separates two consecutive
mechanical sinusoids to be higher than the activity of 950 of 1,000 intervals of
the same duration, randomly selected within the period of 1.5 s that preceded
the stimulus presentation (permutation test, n ¼ 1,000, P o 0.05)14. Second, a
mechanical event detection criterion: we required that in 95% of the intervals
between two mechanical stimuli, the number of spikes in the first half of the
interval was higher than the number of spikes in the second half of the same
interval (Supplementary Fig. 1). Individual cycles for which the mechanical
event detection criterion was satisfied were considered as containing a burst.
This definition of bursts was intended to capture how an observer of an S1
neuron might try to detect the application of individual mechanical pulse
events. The definition was not intended to capture detection of spike bursts
caused by intrinsic biophysical properties of the neuron. Third, for each trial,
we calculated the mean firing rate over the stimulus periods. For each stimulus
frequency, we computed the mean ± s.d. of periodicity, bursting rate and firing
rate over all trials with that stimulus frequency. For further analysis, we selected
those neurons that had the best linear fit (w2, Q 4 0.05) of the periodicity,
bursting rate, number of bursts, number of spike or firing rate values as a
function of the stimulus frequency38,39. We also required the slope of this linear
fit to be significantly different from zero (permutation test, n ¼ 1,000,
P o 0.05)14. Under this combined test, not all neurons carried information
in all of the codes tested. For each of the codes tested, we selected for further
analysis only the subset of neurons that carried statistically significant stimulus
information using that code. The discrimination task requires the comparison
of the second stimulus frequency against the first. The quickly adapting
neurons of S1 provide a reliable representation of the two stimulus frequen-
cies3,5,6. We determined the probability that an observer (for example, a cortical
region central to S1) could distinguish the difference between the two stimuli.
This could be based on a comparison of the neuronal response distributions of
the second stimulus frequency (f2) made against the neuronal response
distributions of the first stimulus frequency (f1). According to this, the observer
could use a simple rule: if the number of spikes or bursts during f2 is higher
than during f1, then f2 is higher than f1. The same rule can be used when
considering the periodicity values: if the periodicity values during f2 are higher
than during f1, then f2 is higher than f1 (refs. 6,40). This rule can be tested by
determining the area under the curve receiver operating characteristic (ROC)
generated by the neuronal response distributions for each pair of stimulus
frequencies, using periodicity, bursting rate and firing rate values6,40. In pairs of
stimulus frequencies in which the neuronal response distributions of f2 are
much higher than the neuronal distributions of f1, ROC values are close to 1. If
the neuronal response distributions of f2 are much lower than the neuronal
response distributions of f1, ROC values are close to 0. For overlapping
distributions, intermediate ROC values are found (0.5). The ROC values were
then used to compute neurometric functions. Psychometric and neurometric
discrimination thresholds were calculated as half of the difference between the
stimulus frequency identified as higher than the base in 75% of the trials and
that frequency identified as higher in 25% of the trials3,6,13. These were directly
read from the logistic functions (Boltzmann’s equation) expressed in Hz.
Because the manipulation of the stimulus duration altered both psychometric
and neurometric curves, these changes can be quantified by calculating two
parameters in the logistic function: (i) the psychometric and neurometric
threshold is the minimal difference (in Hz) between f1 and f2 that the subject
and the neuron can discriminate, and (ii) the X0 value is the frequency with a
0.5 probability in the logistic function. The X0 value measures the displacement
of the logistic function along the x-axis. Rightward displacement of the
psychometric function (compared with the control psychometric function
calculated in the same run) indicates that the observer judges the comparison
stimulus frequency lower than the first, whereas leftward displacement indicates
the opposite.
Note: Supplementary information is available on the Nature Neuroscience website.
ACKNOWLEDGMENTSThe research of R.R. was supported by an International Research Scholars Awardfrom the Howard Hughes Medical Institute and grants from Consejo Nacional deCiencia y Tecnologıa and Direccion del Personal Academico of the UniversidadNacional Autonoma de Mexico. C.D.B. is supported in part by the US NationalInstitutes of Health (grant R01-MH067991).
COMPETING INTERESTS STATEMENTThe authors declare that they have no competing financial interests.
Received 29 March; accepted 8 July 2005
Published online at http://www.nature.com/natureneuroscience/
1. Romo, R., Hernandez, A., Zainos, A. & Salinas, E. Somatosensory discrimination basedon cortical microstimulation. Nature 392, 387–390 (1998).
2. Romo, R., Hernandez, A., Zainos, A., Brody, C. & Lemus, L. Sensing without touching:psychophysical performance based on cortical microstimulation. Neuron 26, 273–278(2000).
3. Mountcastle, V.B., Steinmetz, M.A. & Romo, R. Frequency discrimination in the sense offlutter: psychophysical measurements correlated with postcentral events in behavingmonkeys. J. Neurosci. 10, 3032–3044 (1990).
4. Recanzone, G.H., Merzenich, M.M. & Schreiner, C.E. Changes in the distributed temporalresponse properties of S1 cortical neurons reflect improvements in performance on atemporally based tactile discrimination task. J. Neurophysiol. 67, 1071–1091 (1992).
5. Salinas, E., Hernandez, A., Zainos, A. & Romo, R. Periodicity and firing rate as candidateneural codes for the frequency of vibrotactile stimuli. J. Neurosci. 20, 5503–5515(2000).
6. Hernandez, A., Zainos, A. & Romo, R. Neuronal correlates of sensory discrimination inthe somatosensory cortex. Proc. Natl. Acad. Sci. USA 97, 6191–6196 (2000).
7. Romo, R. & Salinas, E. Touch and go: decision-making mechanisms in somatosensation.Annu. Rev. Neurosci. 24, 107–137 (2001).
8. Romo, R. & Salinas, E. Flutter discrimination: Neural codes, perception, memory anddecision making. Nat. Rev. Neurosci. 4, 203–218 (2003).
9. Reinagel, P., Godwin, D., Sherman, M. & Koch, C. Encoding of visual information by LGNbursts. J. Neurophysiol. 81, 2558–2569 (1999).
10. Martınez-Conde, S., Macknik, S.L. & Hubel, D.H. The function of bursts of spikes duringvisual fixation in the awake primate lateral geniculate nucleus and primary visual cortex.Proc. Natl. Acad. Sci. USA 99, 13920–13925 (2000).
11. Kepecs, A., Wang, X.J. & Lisman, J. Bursting neurons signal input slope. J. Neurosci.22,9053–9062 (2002).
12. Krahe, R. & Gabbiani, F. Burst firing in sensory systems. Nat. Rev. Neurosci. 5, 13–24(2004).
13. Hernandez, A., Salinas, E., Garcıa, R. & Romo, R. Discrimination in the sense of flutter:new psychophysical measurements in monkeys. J. Neurosci. 17, 6391–6400 (1997).
14. Siegel, S. & Castellan, N.J. Nonparametric Statistics for the Behavioral Science(McGraw-Hill, New York, 1988).
15. Connors, B.W. & Gutnik, M.J. Intrinsic firing patterns of diverse neocortical neurons.Trends Neurosci. 13, 99–104 (1990).
16. Carandini, M. Visual cortex: fatigue and adaptation. Curr. Biol. 10, R605–R607 (2000).17. Nowak, L.G., Azouz, R., Sanchez-Vives, M., Gray, C.M. & McCormick, D.A. Electro-
physiological classes of cat primary visual cortical neurons in vivo as revealed byquantitative analyses. J. Neurophysiol. 89, 1541–1566 (2003).
18. Kohn, A. & Movshon, J.A. Neuronal adaptation to visual motion in area MT of themacaque. Neuron 39, 681–691 (2003).
19. Parker, A.J. & Newsome, W.T. Sense and the single neuron: probing the physiology ofperception. Annu. Rev. Neurosci. 21, 227–277 (1998).
20. Britten, K.H., Newsome, W.T., Shadlen, M.N., Celebrini, S. & Movshon, J.A. A relation-ship between behavioral choice and the visual responses of neurons in macaque MT.Vis. Neurosci. 13, 87–100 (1996).
21. Romo, R., Hernandez, A., Zainos, A., Lemus, L. & Brody, C.D. Neuronal correlates ofdecision-making in secondary somatosensory cortex. Nat. Neurosci. 5, 1217–1225(2002).
©20
05 N
atu
re P
ub
lish
ing
Gro
up
h
ttp
://w
ww
.nat
ure
.co
m/n
atu
reneuroscience
NATURE NEUROSCIENCE ADVANCE ONLINE PUBLICATION 9
ART ICLES

22. Romo, R., Hernandez, A., Zainos, A. & Salinas, E. Correlated neuronal discharges thatincrease coding efficiency during perceptual discrimination. Neuron 38, 649–657(2003).
23. Romo, R., Hernandez, A. & Zainos, A. Neuronal correlates of a perceptual decision inventral premotor cortex. Neuron 41, 165–173 (2004).
24. Hernandez, A., Zainos, A. & Romo, R. Temporal evolution of a decision-making processin medial premotor cortex. Neuron 33, 959–972 (2002).
25. Romo, R., Brody, C.D., Hernandez, A. & Lemus, L. Neuronal correlates of parametricworking memory in the prefrontal cortex. Nature 399, 470–473 (1999).
26. Brody, C.D., Hernandez, A., Zainos, A. & Romo, R. Timing and neural encoding ofsomatosensory parametric working memory in macaque prefrontal cortex. Cereb. Cortex13, 1196–1207 (2003).
27. Gescheider, G.A., Berryhill, M.E., Verrillo, R.T. & Bolanowski, S.J. Vibrotactile temporalsummation: probability summation or neural intergration? Somatosens. Mot. Res. 16,229–242 (1999).
28. Talbot, W.H., Darian-Smith, I., Kornhuber, H.H. & Mountcastle, W.T. The sense of flutter-vibration: comparison of human capacity with response patterns of mechanoreceptorsafferents from the monkey hand. J. Neurophysiol. 31, 301–334 (1968).
29. Mountcastle, V.B., Talbot, W.H., Sakata, H. & Hyvarinen, J. Cortical neuronal mechan-isms in flutter vibration studied in unanesthetized monkeys. J. Neurophysiol. 32, 452–484 (1969).
30. Shadlen, M.N. & Newsome, W.T. Noise, neural codes and cortical organization. Curr.Opin. Neurobiol. 4, 569–579 (1994).
31. Shadlen, M.N. & Newsome, W.T. The variable discharges of cortical neurons: Implica-tions for connectivity, computation, and information coding. J. Neurosci. 18, 3870–3896 (1998).
32. Ahissar, E., Sosnik, R. & Haidarliu, S. Transformation from temporal to rate coding in asomatosensory thalamocortical pathway. Nature 406, 302–306 (2000).
33. Poggio, G.F. & Viernstein, L.J. Time series analysis of impulse sequences of thalamicsomatic sensory neurons. J. Neurophysiol. 27, 517–545 (1964).
34. Abeles, M. Corticonics (Cambridge Univ. Press, Cambridge, 1990).35. Bialek, W., Rieke, F., Vansteveninck, R.R.D. & Warland, D. Reading a neural code.
Science 252, 1854–1857 (1991).36. Bair, W., Koch, C., Newsome, W.T. & Britten, K. Power spectrum analysis of
bursting cells in area MT in the behaving monkey. J. Neurosci. 14, 2870–2892 (1994).37. deCharms, R.C. & Zador, A. Neural representation and the cortical code. Annu. Rev.
Neurosci. 23, 613–647 (2000).38. Draper, N. & Smith, H. Applied Regression Analysis 2nd edn.(Wiley, New York, 1966).39. Press, W.H., Flannery, B.P., Teukolsky, S.A. & Vetterling, W.T. Numerical Recipes in C
2nd edn. (Cambridge Univ. Press, Cambridge, 1992).40. Green, D.M. & Swets, J.A. Signal Detection Theory and Psychophysics (Wiley, New York,
1966).
©20
05 N
atu
re P
ub
lish
ing
Gro
up
h
ttp
://w
ww
.nat
ure
.co
m/n
atu
reneuroscience
10 ADVANCE ONLINE PUBLICATION NATURE NEUROSCIENCE
ART ICLES