Strain-specific responses of Emiliania huxleyi to changing seawater carbonate chemistry
10
Biogeosciences, 6, 2637–2646, 2009 www.biogeosciences.net/6/2637/2009/ © Author(s) 2009. This work is distributed under the Creative Commons Attribution 3.0 License. Biogeosciences Strain-specific responses of Emiliania huxleyi to changing seawater carbonate chemistry G. Langer 1,2 , G. Nehrke 2 , I. Probert 3 , J. Ly 1,2 , and P. Ziveri 1,4 1 ICTA, Autonomous University of Barcelona (UAB), 08193 Bellaterra, Spain 2 Alfred Wegener Institute for Polar and Marine Research, 27570 Bremerhaven, Germany 3 CNRS/UPMC, Station Biologique de Roscoff, 29682 Roscoff, France 4 FALW, Vrije Universiteit Amsterdam, 1081HV Amsterdam, The Netherlands Received: 27 March 2009 – Published in Biogeosciences Discuss.: 17 April 2009 Revised: 19 October 2009 – Accepted: 4 November 2009 – Published: 24 November 2009 Abstract. Four strains of the coccolithophore E. huxleyi (RCC1212, RCC1216, RCC1238, RCC1256) were grown in dilute batch culture at four CO 2 levels ranging from ∼200 μatm to ∼1200 μatm. Growth rate, particulate or- ganic carbon content, and particulate inorganic carbon con- tent were measured, and organic and inorganic carbon pro- duction calculated. The four strains did not show a uniform response to carbonate chemistry changes in any of the anal- ysed parameters and none of the four strains displayed a re- sponse pattern previously described for this species. We con- clude that the sensitivity of different strains of E. huxleyi to acidification differs substantially and that this likely has a genetic basis. We propose that this can explain apparently contradictory results reported in the literature. 1 Introduction Anthropogenic CO 2 emissions cause a decrease of surface seawater pH, a process termed ocean acidification (Royal Society, 2005). Among the adverse effects of ocean acid- ification on marine organisms, reduction in the capacity of calcifiers to build shells has received special attention be- cause calcium carbonate precipitation in surface waters and its subsequent export to the sediments play important roles in the global carbon cycle (Van Cappellen, 2003). In terms of calcite export to sediments, the coccolithophores, unicel- lular haptophyte algae that cover the cell surface with minute intracellularly-produced calcite platelets (the coccoliths), are one of the most important groups of calcifiers in today’s oceans (Baumann et al., 2004). The question of how coccolithophores will respond to ocean acidification has attracted increasing attention over the last decade. To date, the majority of evidence stems Correspondence to: G. Langer ([email protected]) from laboratory culture experiments. Following the semi- nal study by Riebesell et al. (2000), the first widely adopted notion was that coccolithophores decrease their calcifica- tion rate with increasing CO 2 concentration (decreasing pH) in a linear fashion (see also Zondervan et al., 2001). These studies were conducted on one culture strain of each of two closely related species, E. huxleyi and Gephyro- capsa oceanica, both gephyrocapsid coccolithophores that are relatively small (≤ 8 μm), but numerically dominant in coccolithophore assemblages in modern oceans. A subse- quent study showed that one culture strain of each of the two larger, heavily calcifying coccolithophores Calcidiscus lep- toporus and Coccolithus braarudii, did not follow the re- sponse pattern previously reported for E. huxleyi (Langer et al., 2006). While C. leptoporus displayed an optimum curve, C. braarudii was insensitive over the CO 2 (pH) range tested. This clearly demonstrated that there is no uniform response of coccolithophores to acidification. For E. huxleyi, apparently conflicting results have been reported. In direct contrast to the results of Riebesell et al. (2000), a recent study reported that E. huxleyi increases its calcification rate in response to increasing CO 2 concentra- tion under light saturation (Iglesias-Rodriguez et al., 2008a). Despite an active debate on the subject (Riebesell et al., 2008; Iglesias-Rodriguez et al., 2008b), it is presently un- known why apparently contradictory results have been ob- tained in different studies on E. huxleyi. One striking fact is that in every study a different culture strain of this species has been used. Bearing in mind that different species of coc- colithophore have been shown to exhibit different responses to carbonate chemistry changes, it can be hypothesized that intra-specific responses also exist. To test this, we cultured four strains of E. huxleyi under light saturation and four dif- ferent CO 2 concentrations, and measured, inter alia, calcifi- cation rate. Published by Copernicus Publications on behalf of the European Geosciences Union.
Transcript of Strain-specific responses of Emiliania huxleyi to changing seawater carbonate chemistry
Biogeosciences, 6, 2637–2646, 2009www.biogeosciences.net/6/2637/2009/© Author(s) 2009. This work is distributed underthe Creative Commons Attribution 3.0 License.
Biogeosciences
Strain-specific responses ofEmiliania huxleyi to changing seawatercarbonate chemistry
G. Langer1,2, G. Nehrke2, I. Probert3, J. Ly1,2, and P. Ziveri1,4
1ICTA, Autonomous University of Barcelona (UAB), 08193 Bellaterra, Spain2Alfred Wegener Institute for Polar and Marine Research, 27570 Bremerhaven, Germany3CNRS/UPMC, Station Biologique de Roscoff, 29682 Roscoff, France4FALW, Vrije Universiteit Amsterdam, 1081HV Amsterdam, The Netherlands
Received: 27 March 2009 – Published in Biogeosciences Discuss.: 17 April 2009Revised: 19 October 2009 – Accepted: 4 November 2009 – Published: 24 November 2009
Abstract. Four strains of the coccolithophoreE. huxleyi(RCC1212, RCC1216, RCC1238, RCC1256) were grownin dilute batch culture at four CO2 levels ranging from∼200µatm to ∼1200µatm. Growth rate, particulate or-ganic carbon content, and particulate inorganic carbon con-tent were measured, and organic and inorganic carbon pro-duction calculated. The four strains did not show a uniformresponse to carbonate chemistry changes in any of the anal-ysed parameters and none of the four strains displayed a re-sponse pattern previously described for this species. We con-clude that the sensitivity of different strains ofE. huxleyitoacidification differs substantially and that this likely has agenetic basis. We propose that this can explain apparentlycontradictory results reported in the literature.
1 Introduction
Anthropogenic CO2 emissions cause a decrease of surfaceseawater pH, a process termed ocean acidification (RoyalSociety, 2005). Among the adverse effects of ocean acid-ification on marine organisms, reduction in the capacity ofcalcifiers to build shells has received special attention be-cause calcium carbonate precipitation in surface waters andits subsequent export to the sediments play important rolesin the global carbon cycle (Van Cappellen, 2003). In termsof calcite export to sediments, the coccolithophores, unicel-lular haptophyte algae that cover the cell surface with minuteintracellularly-produced calcite platelets (the coccoliths), areone of the most important groups of calcifiers in today’soceans (Baumann et al., 2004).
The question of how coccolithophores will respond toocean acidification has attracted increasing attention overthe last decade. To date, the majority of evidence stems
Correspondence to:G. Langer([email protected])
from laboratory culture experiments. Following the semi-nal study by Riebesell et al. (2000), the first widely adoptednotion was that coccolithophores decrease their calcifica-tion rate with increasing CO2 concentration (decreasingpH) in a linear fashion (see also Zondervan et al., 2001).These studies were conducted on one culture strain of eachof two closely related species,E. huxleyi and Gephyro-capsa oceanica, both gephyrocapsid coccolithophores thatare relatively small (≤ 8µm), but numerically dominant incoccolithophore assemblages in modern oceans. A subse-quent study showed that one culture strain of each of the twolarger, heavily calcifying coccolithophoresCalcidiscus lep-toporus and Coccolithus braarudii, did not follow the re-sponse pattern previously reported forE. huxleyi(Langer etal., 2006). WhileC. leptoporusdisplayed an optimum curve,C. braarudiiwas insensitive over the CO2(pH) range tested.This clearly demonstrated that there is no uniform responseof coccolithophores to acidification.
For E. huxleyi, apparently conflicting results have beenreported. In direct contrast to the results of Riebesell etal. (2000), a recent study reported thatE. huxleyiincreasesits calcification rate in response to increasing CO2 concentra-tion under light saturation (Iglesias-Rodriguez et al., 2008a).Despite an active debate on the subject (Riebesell et al.,2008; Iglesias-Rodriguez et al., 2008b), it is presently un-known why apparently contradictory results have been ob-tained in different studies onE. huxleyi. One striking fact isthat in every study a different culture strain of this specieshas been used. Bearing in mind that different species of coc-colithophore have been shown to exhibit different responsesto carbonate chemistry changes, it can be hypothesized thatintra-specific responses also exist. To test this, we culturedfour strains ofE. huxleyiunder light saturation and four dif-ferent CO2 concentrations, and measured, inter alia, calcifi-cation rate.
Published by Copernicus Publications on behalf of the European Geosciences Union.
2638 G. Langer et al.: Strain-specific responses ofEmiliania huxleyi
Table 1. Information on culture strains used in this and previous studies. Max. annual SST was taken from the World Ocean Atlas(www.nodc.noaa.gov).
Strain Code Isolation Date Location of samplefrom which cultureisolated
Seawatertemperature attime of sampling
Max. annualSST at samplinglocation
Experimentaltemperature
Morphotype Study
RCC1212 9/2000 34◦28′ S 17◦18′ E(South Atlantic,off South Africa)
15◦C 21◦C 20◦C B This study
RCC1216 9/1998 42◦18′ S 169◦50′ E(Tasman Sea,off New Zealand)
11◦C 18◦C 17◦C R This study
RCC1238 11/2005 34◦01′ N139◦50′ E(North Pacific,off Japan)
18◦C 25◦C 20◦C A This study
RCC1256 7/1999 63◦24′ N 20◦20′ W(North Atlantic,off Iceland)
9◦C 14◦C 17◦C A This study
PLY B92/11A 4/1992 60◦16′ N 5◦14′ E(Bergen, Norway;mesocosm bag)
10◦C 16◦C 15◦C A Riebesellet al., 2000
NZEH (COWPO6) South Pacific,off NewZealand
∼18◦C 19◦C R Iglesias-Rodriguezet al., 2008a
CCMP371 6/1987 32◦ N 62◦ W(Sargasso Sea;50 m depth)
? 25◦C 20 and 24◦C Feng et al.,2008
2 Material and methods
Clonal cultures ofE. huxleyi(strains RCC1212, RCC1216,RCC1238, and RCC1256) were grown in aged, sterile-filtered (0.2µm pore-size cellulose-acetate filters) North Seaseawater enriched with 100µmol L−1 nitrate, 6.25µmol L−1
phosphate, and trace metals and vitamins as in f/2 medium(Guillard and Ryther, 1962). Information on the strains,which were obtained from the Roscoff Culture Collection(www.sb-roscoff.fr/Phyto/RCC), is given in Table 1. Cul-tures were grown under a 16/8 hour light/dark cycle. Ex-periments were carried out at a light intensity of 400µmolphotons m−2 s−1 in an adjustable incubator (Rubarth Ap-parate GmbH, Germany). The temperature used was 17◦Cfor RCC1216 and RCC1256, and 20◦C for RCC1212 andRCC1238. We chose different temperatures as opposed toa standard temperature in order to grow each strain near itsoptimum temperature for growth. Salinity, measured witha conductivity meter (WTW Multi 340i) combined with aTetraCon 325 sensor, was 32. Cells were pre-adapted to ex-perimental conditions for approximately 12 generations andgrown in dilute batch cultures (Langer et al., 2007). Eachdata point presented in the tables and figures is the meanvalue of triplicate culture experiments. CO2 levels were ad-justed by adding calculated amounts of HCl or NaOH to themedium. Low cell densities (<50 000 cells ml−1) even at the
termination of the experiments resulted in the consumptionof less than 5% dissolved inorganic carbon (DIC), ensuringa quasi-constant carbonate system over the course of the ex-periment.
Samples for alkalinity measurements were filtered through0.6µm nominal pore-size glass fibre filters (Whatman GF/F),poisoned with 1 ml 35g L−1 HgCl2, and stored in acid-washed 300 ml borosilicate flasks at 0◦C. DIC samples weresterile-filtered through 0.2µm pore-size cellulose-acetate sy-ringe filters and stored in acid-washed 13 ml borosilicateflasks free of air bubbles at 0◦C. Total alkalinity (TA) wascalculated from linear Gran plots (Gran, 1952) after po-tentiometric titration (in duplicate) (Bradshaw et al., 1981;Brewer et al., 1986). DIC was measured photometrically(Stoll et al., 2001) in triplicate. Precision of the TA measure-ments was∼3µmol L−1 and accuracy∼4µmol L−1. ForDIC measurements, precision was∼4µmol L−1 and accu-racy ∼5µmol L−1. The carbonate system was calculatedfrom temperature, salinity, and the concentrations of DIC,TA, and phosphate using the DOS program CO2 sys (Lewisand Wallace, 1998). The equilibrium constants of Mehrbachet al. (1973) refitted by Dickson and Millero (1987) wereused. Samples for determination of total particulate carbon(TPC) and particulate organic carbon (POC) were filteredonto pre-combusted (12 h, 500◦C) 0.6µm nominal pore-sizeglass fibre filters (Whatman GF/F) and stored at−20◦C.
Biogeosciences, 6, 2637–2646, 2009 www.biogeosciences.net/6/2637/2009/
G. Langer et al.: Strain-specific responses ofEmiliania huxleyi 2639
Prior to analysis, 230µL of an HCl solution (5 mol/L) wasadded on top of the POC filters in order to remove all inor-ganic carbon. TPC and POC were subsequently measuredon a Euro EA Analyser (Euro Vector). Particulate inorganiccarbon (PIC) was calculated as the difference between TPCand POC. For determination of cell density, samples weretaken at the beginning and the end of experiment and countedimmediately after sampling using a Coulter Multisizer III.Growth rate (µ) was calculated as :
µ = (lnc1− lnc0)1t−1 (1)
wherec0 andc1 are the cell concentrations at the beginningand the end of experiment, respectively, and1t is the dura-tion of incubation in days.
Particulate inorganic carbon production, i.e. calcificationrate (PPIC, pg PIC cell−1 d−1) was calculated according to:
PPIC= µ∗(cellular inorganic carbon content) (2)
with cellular inorganic carbon content = pg PIC per cell.Particulate organic carbon production (PPOC, pg POC
cell−1 d−1) was calculated according to:
PPOC= µ∗(cellular organic carbon content) (3)
with cellular organic carbon content = pg POC per cell.
3 Results and discussion
3.1 Summary of results
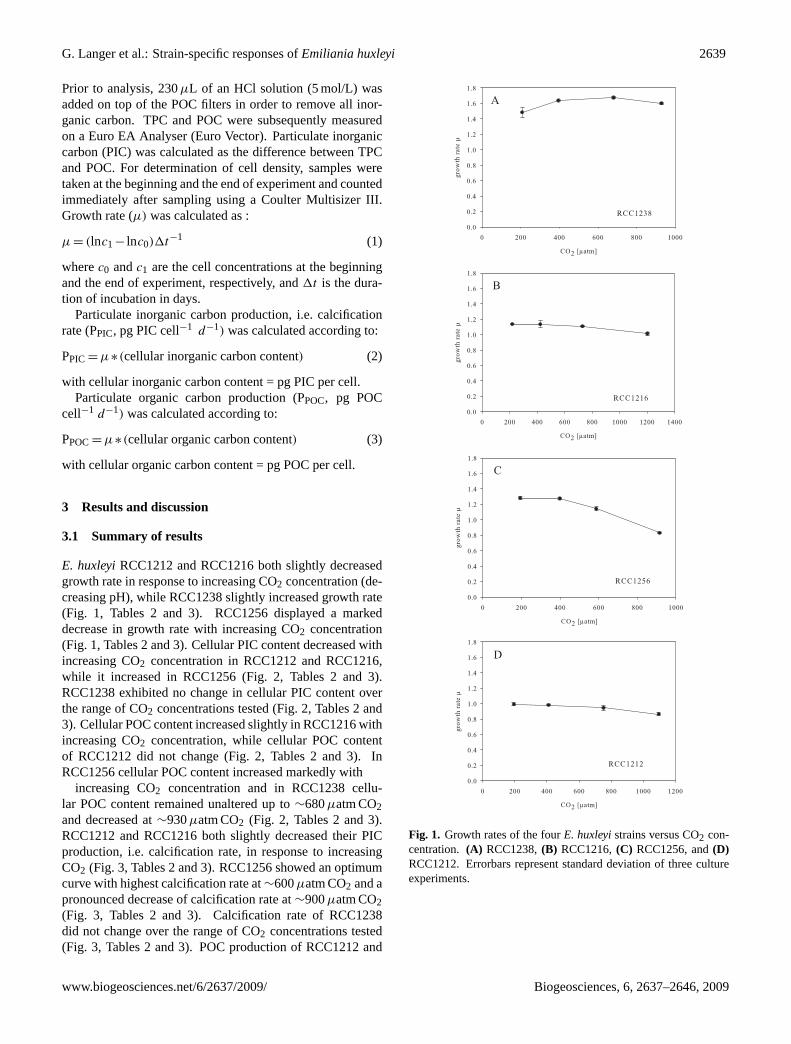
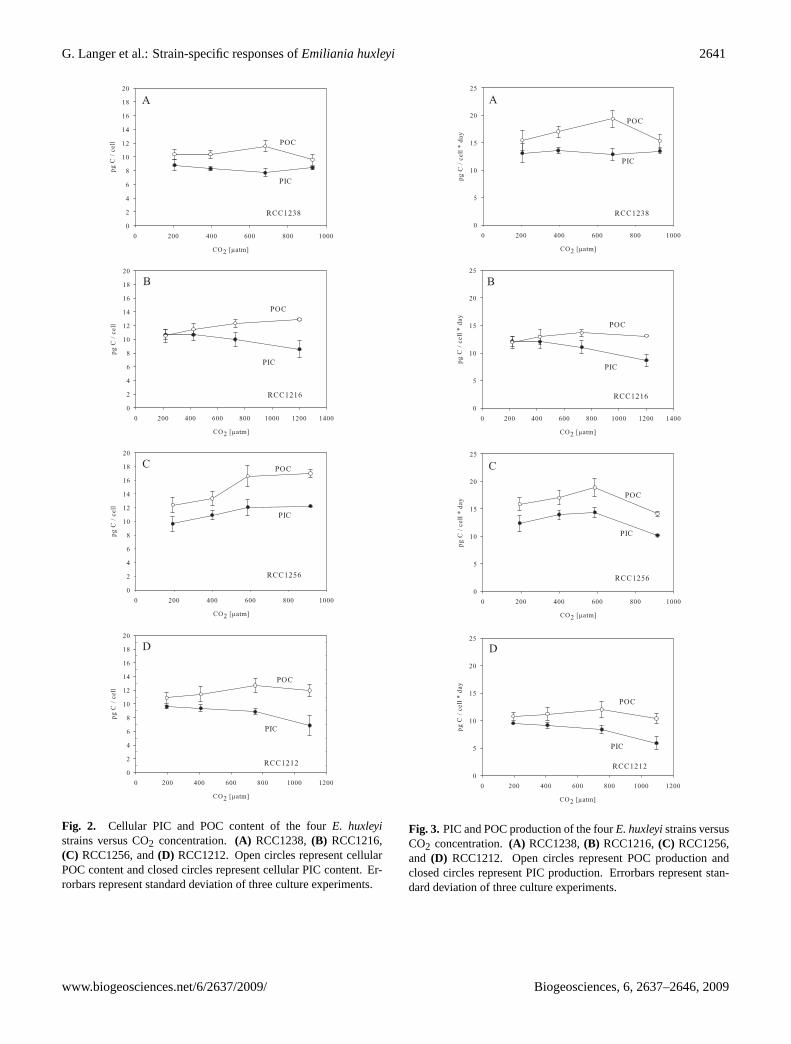
E. huxleyiRCC1212 and RCC1216 both slightly decreasedgrowth rate in response to increasing CO2 concentration (de-creasing pH), while RCC1238 slightly increased growth rate(Fig. 1, Tables 2 and 3). RCC1256 displayed a markeddecrease in growth rate with increasing CO2 concentration(Fig. 1, Tables 2 and 3). Cellular PIC content decreased withincreasing CO2 concentration in RCC1212 and RCC1216,while it increased in RCC1256 (Fig. 2, Tables 2 and 3).RCC1238 exhibited no change in cellular PIC content overthe range of CO2 concentrations tested (Fig. 2, Tables 2 and3). Cellular POC content increased slightly in RCC1216 withincreasing CO2 concentration, while cellular POC contentof RCC1212 did not change (Fig. 2, Tables 2 and 3). InRCC1256 cellular POC content increased markedly with
increasing CO2 concentration and in RCC1238 cellu-lar POC content remained unaltered up to∼680µatm CO2and decreased at∼930µatm CO2 (Fig. 2, Tables 2 and 3).RCC1212 and RCC1216 both slightly decreased their PICproduction, i.e. calcification rate, in response to increasingCO2 (Fig. 3, Tables 2 and 3). RCC1256 showed an optimumcurve with highest calcification rate at∼600µatm CO2 and apronounced decrease of calcification rate at∼900µatm CO2(Fig. 3, Tables 2 and 3). Calcification rate of RCC1238did not change over the range of CO2 concentrations tested(Fig. 3, Tables 2 and 3). POC production of RCC1212 and
Fig. 1. Growth rates of the fourE. huxleyistrains versus CO2 con-centration. (A) RCC1238,(B) RCC1216,(C) RCC1256, and(D)RCC1212. Errorbars represent standard deviation of three cultureexperiments.
www.biogeosciences.net/6/2637/2009/ Biogeosciences, 6, 2637–2646, 2009
2640 G. Langer et al.: Strain-specific responses ofEmiliania huxleyi
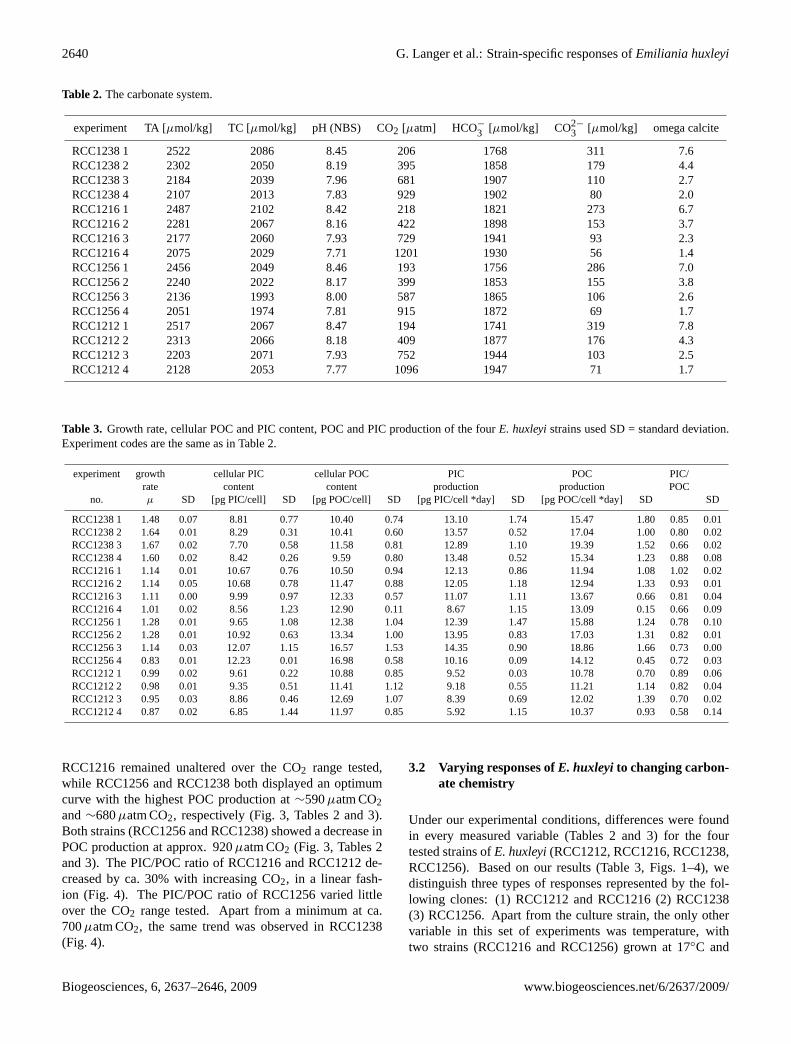
Table 2. The carbonate system.
experiment TA [µmol/kg] TC [µmol/kg] pH (NBS) CO2 [µatm] HCO−
3 [µmol/kg] CO2−
3 [µmol/kg] omega calcite
RCC1238 1 2522 2086 8.45 206 1768 311 7.6RCC1238 2 2302 2050 8.19 395 1858 179 4.4RCC1238 3 2184 2039 7.96 681 1907 110 2.7RCC1238 4 2107 2013 7.83 929 1902 80 2.0RCC1216 1 2487 2102 8.42 218 1821 273 6.7RCC1216 2 2281 2067 8.16 422 1898 153 3.7RCC1216 3 2177 2060 7.93 729 1941 93 2.3RCC1216 4 2075 2029 7.71 1201 1930 56 1.4RCC1256 1 2456 2049 8.46 193 1756 286 7.0RCC1256 2 2240 2022 8.17 399 1853 155 3.8RCC1256 3 2136 1993 8.00 587 1865 106 2.6RCC1256 4 2051 1974 7.81 915 1872 69 1.7RCC1212 1 2517 2067 8.47 194 1741 319 7.8RCC1212 2 2313 2066 8.18 409 1877 176 4.3RCC1212 3 2203 2071 7.93 752 1944 103 2.5RCC1212 4 2128 2053 7.77 1096 1947 71 1.7
Table 3. Growth rate, cellular POC and PIC content, POC and PIC production of the fourE. huxleyistrains used SD = standard deviation.Experiment codes are the same as in Table 2.
experiment growth cellular PIC cellular POC PIC POC PIC/rate content content production production POC
no. µ SD [pg PIC/cell] SD [pg POC/cell] SD [pg PIC/cell *day] SD [pg POC/cell *day] SD SD
RCC1238 1 1.48 0.07 8.81 0.77 10.40 0.74 13.10 1.74 15.47 1.80 0.85 0.01RCC1238 2 1.64 0.01 8.29 0.31 10.41 0.60 13.57 0.52 17.04 1.00 0.80 0.02RCC1238 3 1.67 0.02 7.70 0.58 11.58 0.81 12.89 1.10 19.39 1.52 0.66 0.02RCC1238 4 1.60 0.02 8.42 0.26 9.59 0.80 13.48 0.52 15.34 1.23 0.88 0.08RCC1216 1 1.14 0.01 10.67 0.76 10.50 0.94 12.13 0.86 11.94 1.08 1.02 0.02RCC1216 2 1.14 0.05 10.68 0.78 11.47 0.88 12.05 1.18 12.94 1.33 0.93 0.01RCC1216 3 1.11 0.00 9.99 0.97 12.33 0.57 11.07 1.11 13.67 0.66 0.81 0.04RCC1216 4 1.01 0.02 8.56 1.23 12.90 0.11 8.67 1.15 13.09 0.15 0.66 0.09RCC1256 1 1.28 0.01 9.65 1.08 12.38 1.04 12.39 1.47 15.88 1.24 0.78 0.10RCC1256 2 1.28 0.01 10.92 0.63 13.34 1.00 13.95 0.83 17.03 1.31 0.82 0.01RCC1256 3 1.14 0.03 12.07 1.15 16.57 1.53 14.35 0.90 18.86 1.66 0.73 0.00RCC1256 4 0.83 0.01 12.23 0.01 16.98 0.58 10.16 0.09 14.12 0.45 0.72 0.03RCC1212 1 0.99 0.02 9.61 0.22 10.88 0.85 9.52 0.03 10.78 0.70 0.89 0.06RCC1212 2 0.98 0.01 9.35 0.51 11.41 1.12 9.18 0.55 11.21 1.14 0.82 0.04RCC1212 3 0.95 0.03 8.86 0.46 12.69 1.07 8.39 0.69 12.02 1.39 0.70 0.02RCC1212 4 0.87 0.02 6.85 1.44 11.97 0.85 5.92 1.15 10.37 0.93 0.58 0.14
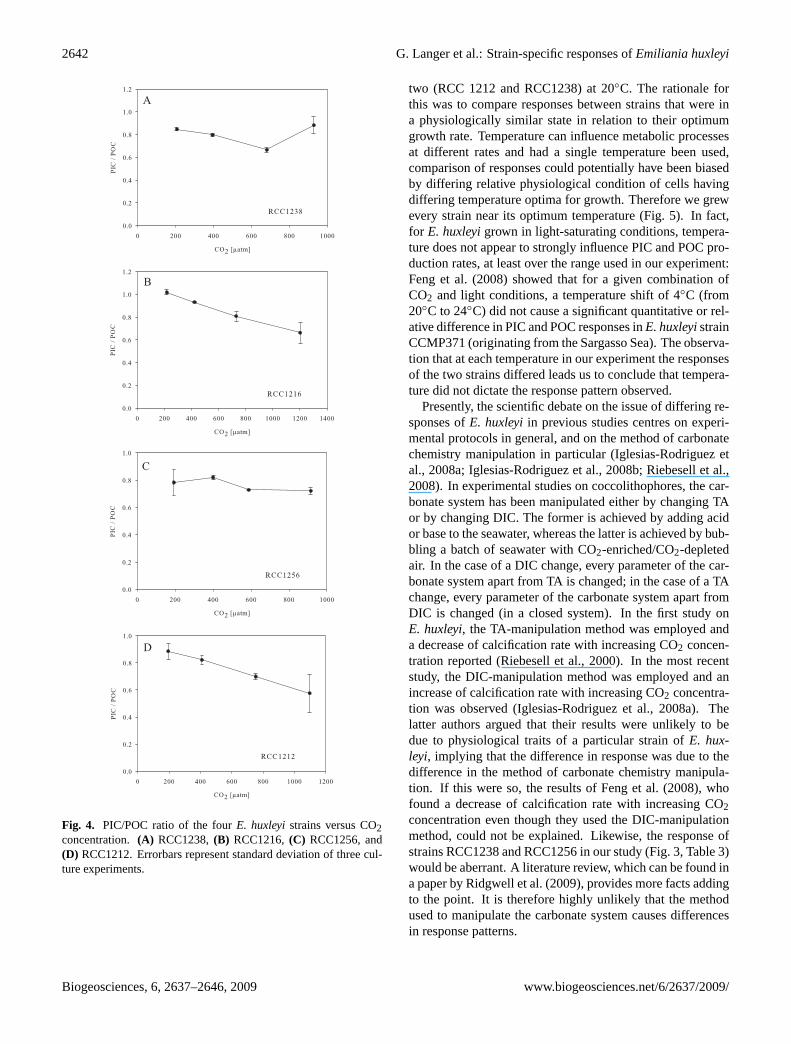
RCC1216 remained unaltered over the CO2 range tested,while RCC1256 and RCC1238 both displayed an optimumcurve with the highest POC production at∼590µatm CO2and∼680µatm CO2, respectively (Fig. 3, Tables 2 and 3).Both strains (RCC1256 and RCC1238) showed a decrease inPOC production at approx. 920µatm CO2 (Fig. 3, Tables 2and 3). The PIC/POC ratio of RCC1216 and RCC1212 de-creased by ca. 30% with increasing CO2, in a linear fash-ion (Fig. 4). The PIC/POC ratio of RCC1256 varied littleover the CO2 range tested. Apart from a minimum at ca.700µatm CO2, the same trend was observed in RCC1238(Fig. 4).
3.2 Varying responses ofE. huxleyi to changing carbon-ate chemistry
Under our experimental conditions, differences were foundin every measured variable (Tables 2 and 3) for the fourtested strains ofE. huxleyi(RCC1212, RCC1216, RCC1238,RCC1256). Based on our results (Table 3, Figs. 1–4), wedistinguish three types of responses represented by the fol-lowing clones: (1) RCC1212 and RCC1216 (2) RCC1238(3) RCC1256. Apart from the culture strain, the only othervariable in this set of experiments was temperature, withtwo strains (RCC1216 and RCC1256) grown at 17◦C and
Biogeosciences, 6, 2637–2646, 2009 www.biogeosciences.net/6/2637/2009/
G. Langer et al.: Strain-specific responses ofEmiliania huxleyi 2641
Fig. 2. Cellular PIC and POC content of the fourE. huxleyistrains versus CO2 concentration.(A) RCC1238,(B) RCC1216,(C) RCC1256, and(D) RCC1212. Open circles represent cellularPOC content and closed circles represent cellular PIC content. Er-rorbars represent standard deviation of three culture experiments.
Fig. 3. PIC and POC production of the fourE. huxleyistrains versusCO2 concentration.(A) RCC1238,(B) RCC1216,(C) RCC1256,and (D) RCC1212. Open circles represent POC production andclosed circles represent PIC production. Errorbars represent stan-dard deviation of three culture experiments.
www.biogeosciences.net/6/2637/2009/ Biogeosciences, 6, 2637–2646, 2009
2642 G. Langer et al.: Strain-specific responses ofEmiliania huxleyi
Fig. 4. PIC/POC ratio of the fourE. huxleyistrains versus CO2concentration.(A) RCC1238,(B) RCC1216,(C) RCC1256, and(D) RCC1212. Errorbars represent standard deviation of three cul-ture experiments.
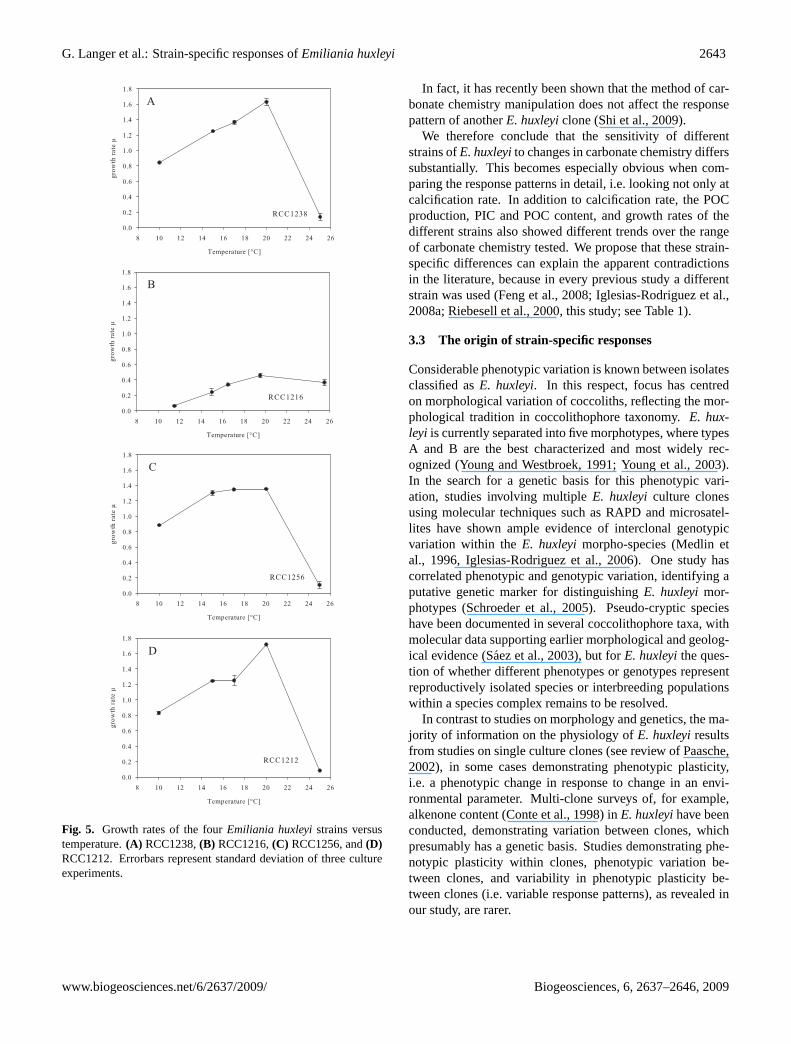
two (RCC 1212 and RCC1238) at 20◦C. The rationale forthis was to compare responses between strains that were ina physiologically similar state in relation to their optimumgrowth rate. Temperature can influence metabolic processesat different rates and had a single temperature been used,comparison of responses could potentially have been biasedby differing relative physiological condition of cells havingdiffering temperature optima for growth. Therefore we grewevery strain near its optimum temperature (Fig. 5). In fact,for E. huxleyigrown in light-saturating conditions, tempera-ture does not appear to strongly influence PIC and POC pro-duction rates, at least over the range used in our experiment:Feng et al. (2008) showed that for a given combination ofCO2 and light conditions, a temperature shift of 4◦C (from20◦C to 24◦C) did not cause a significant quantitative or rel-ative difference in PIC and POC responses inE. huxleyistrainCCMP371 (originating from the Sargasso Sea). The observa-tion that at each temperature in our experiment the responsesof the two strains differed leads us to conclude that tempera-ture did not dictate the response pattern observed.
Presently, the scientific debate on the issue of differing re-sponses ofE. huxleyiin previous studies centres on experi-mental protocols in general, and on the method of carbonatechemistry manipulation in particular (Iglesias-Rodriguez etal., 2008a; Iglesias-Rodriguez et al., 2008b; Riebesell et al.,2008). In experimental studies on coccolithophores, the car-bonate system has been manipulated either by changing TAor by changing DIC. The former is achieved by adding acidor base to the seawater, whereas the latter is achieved by bub-bling a batch of seawater with CO2-enriched/CO2-depletedair. In the case of a DIC change, every parameter of the car-bonate system apart from TA is changed; in the case of a TAchange, every parameter of the carbonate system apart fromDIC is changed (in a closed system). In the first study onE. huxleyi, the TA-manipulation method was employed anda decrease of calcification rate with increasing CO2 concen-tration reported (Riebesell et al., 2000). In the most recentstudy, the DIC-manipulation method was employed and anincrease of calcification rate with increasing CO2 concentra-tion was observed (Iglesias-Rodriguez et al., 2008a). Thelatter authors argued that their results were unlikely to bedue to physiological traits of a particular strain ofE. hux-leyi, implying that the difference in response was due to thedifference in the method of carbonate chemistry manipula-tion. If this were so, the results of Feng et al. (2008), whofound a decrease of calcification rate with increasing CO2concentration even though they used the DIC-manipulationmethod, could not be explained. Likewise, the response ofstrains RCC1238 and RCC1256 in our study (Fig. 3, Table 3)would be aberrant. A literature review, which can be found ina paper by Ridgwell et al. (2009), provides more facts addingto the point. It is therefore highly unlikely that the methodused to manipulate the carbonate system causes differencesin response patterns.
Biogeosciences, 6, 2637–2646, 2009 www.biogeosciences.net/6/2637/2009/
G. Langer et al.: Strain-specific responses ofEmiliania huxleyi 2643
Fig. 5. Growth rates of the fourEmiliania huxleyistrains versustemperature.(A) RCC1238,(B) RCC1216,(C) RCC1256, and(D)RCC1212. Errorbars represent standard deviation of three cultureexperiments.
In fact, it has recently been shown that the method of car-bonate chemistry manipulation does not affect the responsepattern of anotherE. huxleyiclone (Shi et al., 2009).
We therefore conclude that the sensitivity of differentstrains ofE. huxleyito changes in carbonate chemistry differssubstantially. This becomes especially obvious when com-paring the response patterns in detail, i.e. looking not only atcalcification rate. In addition to calcification rate, the POCproduction, PIC and POC content, and growth rates of thedifferent strains also showed different trends over the rangeof carbonate chemistry tested. We propose that these strain-specific differences can explain the apparent contradictionsin the literature, because in every previous study a differentstrain was used (Feng et al., 2008; Iglesias-Rodriguez et al.,2008a; Riebesell et al., 2000, this study; see Table 1).
3.3 The origin of strain-specific responses
Considerable phenotypic variation is known between isolatesclassified asE. huxleyi. In this respect, focus has centredon morphological variation of coccoliths, reflecting the mor-phological tradition in coccolithophore taxonomy.E. hux-leyi is currently separated into five morphotypes, where typesA and B are the best characterized and most widely rec-ognized (Young and Westbroek, 1991; Young et al., 2003).In the search for a genetic basis for this phenotypic vari-ation, studies involving multipleE. huxleyiculture clonesusing molecular techniques such as RAPD and microsatel-lites have shown ample evidence of interclonal genotypicvariation within theE. huxleyimorpho-species (Medlin etal., 1996, Iglesias-Rodriguez et al., 2006). One study hascorrelated phenotypic and genotypic variation, identifying aputative genetic marker for distinguishingE. huxleyimor-photypes (Schroeder et al., 2005). Pseudo-cryptic specieshave been documented in several coccolithophore taxa, withmolecular data supporting earlier morphological and geolog-ical evidence (Saez et al., 2003), but forE. huxleyithe ques-tion of whether different phenotypes or genotypes representreproductively isolated species or interbreeding populationswithin a species complex remains to be resolved.
In contrast to studies on morphology and genetics, the ma-jority of information on the physiology ofE. huxleyiresultsfrom studies on single culture clones (see review of Paasche,2002), in some cases demonstrating phenotypic plasticity,i.e. a phenotypic change in response to change in an envi-ronmental parameter. Multi-clone surveys of, for example,alkenone content (Conte et al., 1998) inE. huxleyihave beenconducted, demonstrating variation between clones, whichpresumably has a genetic basis. Studies demonstrating phe-notypic plasticity within clones, phenotypic variation be-tween clones, and variability in phenotypic plasticity be-tween clones (i.e. variable response patterns), as revealed inour study, are rarer.
www.biogeosciences.net/6/2637/2009/ Biogeosciences, 6, 2637–2646, 2009
2644 G. Langer et al.: Strain-specific responses ofEmiliania huxleyi
Strain-specific responses in growth rate ofE. huxleyitotemperature and salinity changes were described more thantwo decades ago, when it was found that strains isolated fromgeographically separated water masses within the westernNorth Atlantic exhibited different responses (Brand, 1982;Brand, 1984). Coastal strains generally differed physiologi-cally from oceanic strains (Brand, 1982, 1984). On the onehand, the two “coastal” (i.e. from within 10 km of the shore)strains used here (RCC1256 and RCC1238) indeed differedfrom the two ‘oceanic’ strains (RCC1212 and RCC1216).On the other hand, the two coastal strains (RCC1256 andRCC1238) did not behave similarly at all. Therefore, thedistinction coastal / oceanic is not sufficient to explain strain-specific responses.
Surface seawater CO2 concentrations at the locations ofsampling for strain isolation do not provide a hint as to areason for the differences in response pattern. The CO2concentration in the Tasman Sea (RCC1216), off Japan(RCC1238), and off South Africa (RCC1212) is approxi-mately 320µatm and does not vary greatly over the courseof the year (Takahashi et al., 2002). South of Iceland(RCC1256), CO2 concentration ranges from ca. 270µatm inAugust to ca. 360µatm in February (Takahashi et al., 2002).If ambient CO2 concentration was the parameter determin-ing the response pattern, all strains except RCC1256 wouldhave been expected to have responded similarly, which wasnot the case.
The morphotype seems to have no influence on the re-sponse pattern. The two strains that exhibited similar re-sponses belong to two different morphotypes, RCC1216 be-ing a type R and RCC1212 being a type B, and the twocoastal strains (RCC1238 and RCC1256), which differed inresponse from each other as well as from the oceanic strains,belong to the same morphotype, namely type A. Interest-ingly the two type A strains (RCC1238 and RCC1256) ex-hibit the weakest (RCC1238) and the strongest (RCC1256)responses. The intermediate responses are displayed by thetype R (RCC1216) and type B (RCC1212). The type B mor-photype is described as the more delicate form (compared totype A and type R) which is often assumed to be more vulner-able to acidification. Our data show that this is not the case.We think it more plausible to assume that the susceptibilityto acidification related effects is connected with some phys-iological process, for instance a transmembrane transport ofions.
Since the strains used in the present study were iso-lated from samples from locations separated by at leasta few thousand kilometers (Table 1), it appears reason-able to regard them at least as different populations withspecific genetic features and potentially as genetically iso-lated cryptic or pseudo-cryptic species. RCC1256 (Iceland)and RCC1238 (Japan) showed two types of responses, nei-ther of which resembled the response of RCC1212 (SouthAfrica) and RCC1216 (New Zealand). The two southern-hemisphere strains, RCC1212 (South Africa) and RCC1216
(New Zealand) displayed very similar responses (see Table 3for overview) and they might be regarded as being connectedby the Antarctic circumpolar current, which could possiblyallow for genetic exchange between the populations. Asa general caveat, we note that experiments on many morestrains would be needed to consolidate the conclusion thatvariability in the response ofE. huxleyito changing carbon-ate chemistry does not clearly correlate with biogeographicorigin or morphotype of the strain.
We propose that the observed differences in response ofE. huxleyiisolates to changing carbonate chemistry have agenetic basis. At present, it is impossible to speculate as towhether this could be due to, for example, gene differenti-ation, allelic sensitivity, or gene regulation effects (see Viaet al., 1995). Relatively little is known about the physio-logical mechanisms, let alone the genetic basis, of carbonacquisition and processes involved in calcification in coccol-ithophores. A better understanding of these aspects wouldundoubtedly shed light on the variability in the response ofcoccolithophores (and other calcifiers) to ocean acidification.
3.4 Implications for model studies and the fate ofcoccolithophores
Calcification shifts the carbonate system towards higherCO2 concentrations. Diminished calcification, and a de-creased PIC/POC ratio, in the future would, therefore, leadto a negative feedback on atmospheric CO2 concentration(Zondervan et al., 2001). Prediction of the strength of theCO2-calcification feedback is impaired by species-specificresponses to acidification in combination with the unresolvedquestion of which calcifier is the most prolific (Ridgwell etal., 2007). If our results forE. huxleyiare representativefor coccolithophores in general, or even for other calcifyinggroups such as the foraminifera, it would be unrealistic to de-fine a representative response as an input for an Earth systemmodel. Since this is an important and widely discussed issue,further studies addressing strain-specific effects are clearlywarranted.
Such studies are also desirable for shedding light on thequestions of if and how coccolithophores could cope witha future acidified ocean. Judging from culture studies only,it can be inferred that some strains will suffer from reducedcalcification, e.g.Gephyrocapsa oceanicaPC71 (Riebesellet al., 2000), someE. huxleyistrains (Table 3), andCalcidis-cus leptoporusAC365 (=RCC1135) (Langer et al., 2006),while some will be unaffected, e.g.E. huxleyi RCC1238(Table 3) andCoccolithus braarudiiAC400 (=RCC1200)(Langer et al., 2006). Given that calcification actually is ben-eficial for coccolithophores (the function of calcification isstill unknown), shifts in dominance between species and/orbetween clones within a species might therefore be expected.
However, short-term culture studies alone are not a suf-ficient basis from which conclusions regarding the fate ofcoccolithophores in the future can be drawn, because the
Biogeosciences, 6, 2637–2646, 2009 www.biogeosciences.net/6/2637/2009/
G. Langer et al.: Strain-specific responses ofEmiliania huxleyi 2645
possibility of adaptation is not taken into account. Com-bining results from culture experiments with data from thesedimentary archive, it was hypothesized thatC. leptoporusis in principle able to adapt to changing carbonate chem-istry of seawater (Langer et al., 2006). The authors spec-ulated that the population might be genetically diverse andthat strain-specific responses to carbonate chemistry changeswould lead to a high degree of adaptive potential of thespecies. The results forE. huxleyipresented here point tothe possibility that this morphospecies is heterogeneous withregard to responses to changing carbonate chemistry. Thishighlights the need to consider adaptation when trying to pre-dict the performance of coccolithophores in the future.
Acknowledgements.We thank Christiane Lorenzen and KarinWoudsma for laboratory assistance. G. L. acknowledges financialsupport by the Spanish Ministry of Education (Juan de la Ciervaprogramme) cofunded by the European Social Fund and Ministryof Science and Innovation. This work was supported by the SpanishMinistry of Science and Innovation co-funded by the EuropeanSocial Fund (CTM2007-28909-E/MAR and CTM2008-04365-E)and the ESF MERF project (ESF EuroCLIMATE ERAS-CT-2003-980490 of the European Commission, DG Research, Fp6.)Netherlands Organisatie Voor Wetenschappelijk Onderzoek (NWO855.01.086), ANR BOOM project (ANR-05-BIODIV-004), andEU FP7 ASSEMBLE project (RI-227799), and by the German re-search foundation (DFG) under grant no. BI 432/4-2 (“PaleoSal”),BI 432/6-1 “BioCalc”), and by the European Science Foundation(ESF) under the EUROCORES Programmes EuroCLIMATE andEuroMinScI through contract No. ERAS-CT-2003-980409 of theEuropean Commission, DG Research, FP6.
Edited by: S. Pantoja
References
Baumann, K.-H., Bockel, B., and Frenz, M.: Coccolith contributionto South Atlantic carbonate sedimentation, in: Coccolithophores– from molecular processes to global impact, edited by: Thier-stein, H. R. and Young, J. R., Springer-Verlag, 367–402, 2004.
Bradshaw, A. L., Brewer, P. G., Shaffer, D. K., and Williams, R. T.:Measurements of total carbon dioxide and alkalinity by poten-tiometric titration in the GEOSECS program, Earth Planet. Sc.Lett., 55, 99–115, 1981.
Brand, L. E.: Genetic variability and spatial patterns of ge-netic differentiation in the reproductive rates of the marine coc-colithophoresE. huxleyiand Gephyrocapsa oceanica, Limnol.Oceanogr., 27(2), 236–245, 1982.
Brand, L. E.: The salinity tolerance of forty-six marine phytoplank-ton isolates, Estuar. Coast. Shelf S., 18, 543–556, 1984.
Brewer, P. G., Bradshaw, A. L., and Williams, R. T.: Measurementof total carbon dioxide and alkalinity in the North Atlantic oceanin 1981, in: The Changing Carbon Cycle – A Global Analysisedited by: Trabalka, J. R. and Reichle, D. E., Springer Verlag,358–381, 1986.
Conte, M. H., Thompson, A., Lesley, D. and Harris, R.: Ge-netic and physiological influences on the alkenone/alkenoate ver-
sus growth temperature relationship inE. huxleyiandGephyro-capsa oceanica, Geochim. Cosmochim. Ac. 62, 51–68, 1998.
Dickson, A. G. and Millero F. J.: A comparison of the equilibriumconstants for the dissociation of carbonic acid in seawater media,Deep-Sea Res., 34, 1733–1743, 1987.
Feng, Y., Warner, M. E., Zhang, Y., Sun, J., Fu, F.-X., Rose, J. M.,and Hutchins, D. A.: Interactive effects of increased pCO2, tem-perature, and irradiance on the marine coccolithophoreE. huxleyi(Prymnesiophyceae), Eur. J. Phycol., 43, 87–98, 2008.
Gran, G.: Determination of the equivalence point in potentiometrictitrations of seawater with hydrochloric acid, Oceanol. Acta, 5,209–218, 1952.
Guillard, R. R. L. and Ryther, J. H.: Studies of marine planktonic di-atoms, I,Cyclotella nanna(Hustedt) andDetonula convervacea(Cleve), Can. J. Microbiol., 8, 229–239, 1962.
Iglesias-Rodriguez, M. D., Schofield, O. M., Batley, J., Medlin, L.K. and Hayes, P. K.: Intraspecific genetic diversity in the marinecoccolithohoreE. huxleyi(Prymnesiophyceae), The use of mi-crosatellite analysis in marine phytoplankton population studies,J. Phycol., 42, 526–536, 2006.
Iglesias-Rodriguez, M. D., Halloran, P. R., Rickaby, R. E. M., Hall,I. R., Colmenero-Hidalgo, E., Gittins, J. R., Green, D. R. H.,Tyrrell, T., Gibbs, S. J., von Dassow, P., Rehm, E., Armbrust,E. V., and Boessenkool, K. P.: Phytoplankton Calcification in aHigh-CO2 World, Science, 320, 5874, 336–340, 2008a.
Iglesias-Rodriguez, M. D., Buitenhuis, E. T., Raven, J. A.,Schofield, O., Poulton, A. J., Gibbs, S. J., Halloran, P. R., andde Baar, H. J. W.: Response to Comment on “Phytoplankton cal-cification in a high-CO2 world”, Science, 322, 1466c, 2008b.
Langer, G., Geisen, M., Baumann, K.-H., Klas, J., Riebesell, U.,Thoms, S., and Young, J. R.: Species-specific responses of calci-fying algae to changing seawater carbonate chemistry, Geochem.Geophys. Geosyst., 7, Q09006, doi:10.1029/2005GC001227,2006.
Langer G., Gussone N., Nehrke, G., Riebesell, U., Eisenhauer,A., and Thoms, S: Calcium isotope fractionation during coc-colith formation in E. huxleyi, Independence of growth andcalcification rate, Geochem. Geophys. Geosyst., 8, Q05007,doi:10.1029/2006GC001422, 2007.
Lewis, E. and Wallace, D. W. R.: Program Developed for CO2 Sys-tem Calculations ORNL/CDIAC-105, Carbon Dioxide Informa-tion Analysis Centre, Oak Ridge National Laboratory, US De-partment of Energy, 1998.
Medlin, L. K., Barker, G. L. A., Campbell, L., Green, J. C., Hayes,P. K., Marie, D., Wrieden, S. and Vaulot, D.: Genetic characteri-sation ofE. huxleyi(Haptophyta), J. Mar. Syst., 9, 13–31, 1996.
Mehrbach, C., Culberson, C. H., Hawley, J. E., and Pytkovicz,R. M.: Measurement of the apparent dissociation constantsof carbonic acid in seawater at atmospheric pressure, Limnol.Oceanogr., 18, 897–907, 1973.
Paasche, E.: A review of the coccolithophoridE. huxleyi(Prymne-siophyceae), with particular reference to growth, coccolith for-mation, and calcification-photosynthesis interactions, Phycolo-gia, 40, 503–529, 2002.
Ridgwell, A., Zondervan, I., Hargreaves, J. C., Bijma, J., andLenton, T. M.: Assessing the potential long-term increase ofoceanic fossil fuel CO2 uptake due to CO2-calcification feed-back, Biogeosciences, 4, 481–492, 2007,http://www.biogeosciences.net/4/481/2007/.
www.biogeosciences.net/6/2637/2009/ Biogeosciences, 6, 2637–2646, 2009
2646 G. Langer et al.: Strain-specific responses ofEmiliania huxleyi
Ridgwell, A., Schmidt, D. N., Turley, C., Brownlee, C., Maldonado,M. T., Tortell, P., and Young, J. R.: From laboratory manipula-tions to earth system models: predicting pelagic calcification andits consequences, Biogeosciences Discuss., 6, 3455–3480, 2009,http://www.biogeosciences-discuss.net/6/3455/2009/.
Riebesell, U., Bellerby, R. G. J., Engel, A., Fabry, V. J., Hutchins,D. A., Reusch, T. B. H., Schulz, K. G., and Morel, F. M. M.:Comment on “Phytoplankton calcification in a high CO2-world”,Science, 322, 1466b, 2008.
Riebesell, U., Zondervan, I., Rost, B., Tortell, P. D., Zeebe, R. E.,and Morel F. M. M.: Reduced calcification of marine plankton inresponse to increased atmospheric CO2, Nature, 407, 364–367,2000.
Royal Society: Ocean acidification due to increasing atmosphericcarbon dioxide, 60, Policy Document 12/05, The Royal Society,London, 2005.
Saez, A. G., Probert, I., Geisen, M., Quinn, P., Young, J. R. andMedlin, L. K.: Pseudo-cryptic speciation in coccolithophores,Proc. Natl. Acad. Sci., USA, 100, 7163–7168, 2003.
Schroeder, D. C., Biggi, G. F., Hall, M., Davy, J., Martınez, J.,Richardson, A. J., Malin, G. and Wilson, W. H.: A geneticmarker to separateE. huxleyi(Prymnesiophyceae) morphotypes,J. Phycol., 41, 874–879, 2005.
Shi, D., Xu, Y., and Morel, F. M. M.: Effects of the pH/pCO2control method on medium chemistry and phytoplankton growth,Biogeosciences, 6, 1199–1207, 2009,http://www.biogeosciences.net/6/1199/2009/.
Stoll, M. H. C., Bakker, K., Nobbe, G. H., and Haese, R. R.:Continuous-flow analysis of dissolved inorganic carbon contentin seawater, Anal. Chem., 73, 4111–4116, 2001.
Takahashi, T., Sutherland, S. C., Sweeney, C., Poisson, A., Metzl,N., Tilbrook, B., Bates, N., Wanninkhof, R., Feely, R. A., andSabine, C.: Global sea-air CO2 flux based on climatologicalsurface ocean pCO2, and seasonal biological and temperatureeffects, Topical Studies in Oceanography, Deep-Sea Res. Pt II,49(9–10), 1601–1622, 2002.
Van Cappellen, P.: Biomineralization and global biogeochemicalcycles, in: Biomineralization, Mineralogical Reviews, Vol. 54,edited by: Weiner, S., De Yoreo, J. J., and Dove, P., Mineralogi-cal Society of America, 357–381, 2003.
Via, S., Gomulkiewicz, R., De Jong, G., Scheiner, S. M., and VanTienderen, P. H.: Adaptive phenotypic plasticity: concensus andcontroversy, Tree, 10, 212–217, 1995.
Young, J. R. and Westbroek, P.: Genotypic variation in the coc-colithophorid speciesE. huxleyi, Mar. Micropaleontol., 18(1–2),5–23, 1991.
Young, J. R., Geisen, M., Cros, L., Kleijne, A., Probert, I. and Oster-gaard, J. B.: A guide to extant coccolithophore taxonomy, Jour-nal of Nannoplankton Research, 1, 1–132, 2003.
Zondervan, I., Zeebe, R. E., Rost, B., and Riebesell, U.: Decreasingmarine biogenic calcification: A negative feedback on rising at-mosphericpCO2, Global Biogeochem. Cy., 15, 507–516, 2001.
Biogeosciences, 6, 2637–2646, 2009 www.biogeosciences.net/6/2637/2009/