I I I I - Search ARIS Database
85
I I I I I I 1 I I I I I I I I I I I - i GEOCHEMICAL REPORT 1989 ARC AND M&M CLAIMS British Columbia NTS 104C/2 Work Period: July 2 - October 12, 1989 prepared for KESTREL RESOURCES LTD. 1124 - 470 Granville Street Vancouver, B.C. I FILMED I by JOHN BUCHHOLZ April 1990 GEOILOGHGAL ASSESSMENT REPORT
-
Upload
khangminh22 -
Category
Documents
-
view
1 -
download
0
Transcript of I I I I - Search ARIS Database

I I I I I I 1 I I I I I
I I I I I I
-
i
GEOCHEMICAL REPORT 1989
ARC AND M & M CLAIMS
British Columbia NTS 104C/2
Work Period: July 2 - October 12, 1989
prepared for
KESTREL RESOURCES LTD. 1124 - 470 Granville Street
Vancouver, B.C.
I FILMED I by
JOHN BUCHHOLZ
April 1990
G E O I L O G H G A L A S S E S S M E N T R E P O R T

I -I I $1 I I I I
I I I 'I I 1 I I I I
i
T A B L E O F C O N T E N T S
Page
In-t roduct ion
Locat ion , Access and Topography
P rope r ty a n d L i s t of C la ims
His tory
Regional Geology
P r o p e r t y Geology
Geochemica l P rogram
Discussion of Resul ts
Conclusions
Recommenda t ions
Proposed Expendi tures
Bibliography
LIST OF FIGURES
Figure 1 Index Map F igure 2 F igure 3 Figure 4
C la im Map; S c a l e 1:50,000 Regional Geology Map; Sca le 1:250,000 Sample Loca t ion Map; Sca le 1:20,000
APPENDICES
Appendix I Geochemica l R e p o r t J Appendix I1 Appendix 111 S t a t e m e n t of Qual i f ica t ions If Appendix IV
Analysis Method and Assay C e r t i f i c a t e s J I t emized Cost S t a t e m e n t d'
1 /
3 A
4 1
6 /
8 /
9 /
9 /"
10 /'
11 /
2 / in pocket [
7 i in pocket /'

- 1 -
INTRODUCTION
I I I 1 I I I I I I I I 'I I I 1 I I I
During t h e late fall of 1989, Kes t r e l Resources Ltd . c o m p l e t e d a reconnaissance
s i l t s a m p l e program on i t s A r c and M&M c la ims s i t u a t e d approx ima te ly 10
k i lome t re s due sou th of A r c t i c Lake within t h e Liard Mining Division of
Nor thwes te rn Br i t i sh Columbia. The program was unde r t aken t o assess t h e mine ra l
po ten t ia l of t h e p rope r ty and t o provide informat ion , so f a r as possible, requi red t o
out l ine addi t iona l e x plo ra t ion work .
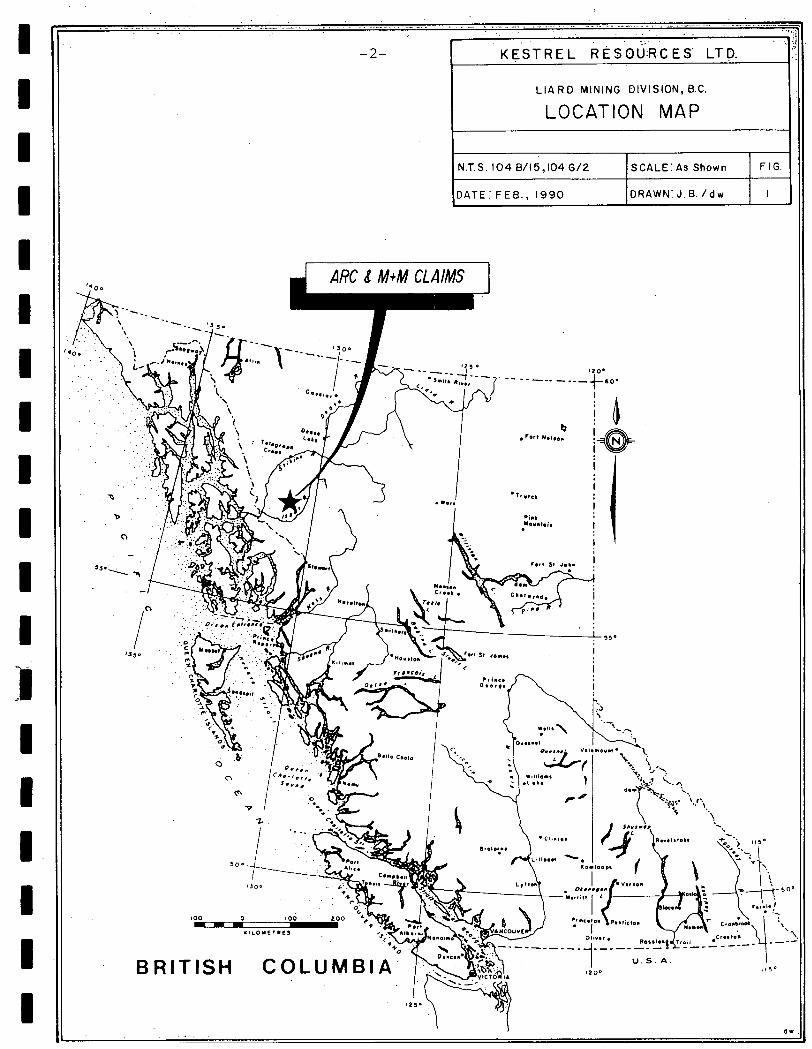
LOCATION, ACCESS AND TOPOGRAPHY
T h e p rope r ty is loca t ed within t h e Liard Mining Division approximate ly 10 k i lome t re s d u e s o u t h of Arctic Lake a n d covers t h e d ra inage s y s t e m of .the c e n t r a l
west fork of More C r e e k , w e s t of Mess Creek . L a t i t u d e 57O 08' N o r t h and
Longi tude 1300 50' West pass through M & M 2 mine ra l c l a im n e a r t h e c e n t e r of t h e
groups. A c c e s s t o t h e p rope r ty i s via f ixed wing a i r c r a f t f r o m Smi the r s o r T e r r a c e
to Bronson, which is l o c a t e d 110 k i lome t re s n o r t h w e s t of S t e w a r t , Bri t ish
Columbia, o r to F o r r e s t K e r r base c a m p l o c a t e d at t h e h e a d w a t e r s of t h e F o r r e s t
K e r r River . A c c e s s f r o m Bronson o r F o r r e s t K e r r is v ia he l i cop te r a n d via f o o t
t r a v e r s e within t h e c la ims .
Most of t h e proper ty is access ib le by foot or he l i cop te r , a l though t h e r e a r e port ions
at higher e l eva t ions which a r e n o t readi ly access ib l e d u e t o s t e e p t e r r a in o r ice .
E leva t ions r a n g e f r o m 760 m e t r e s to 1,680 m e t r e s A.S.L. Above 1,200 m e t r e s t h e
c l a ims a r e devoid of vege ta t ion e x c e p t f o r shrubs a n d grasses , a n d exhib i t abundant
ou tc rop . Below th i s e l eva t ion t h e usual c o a s t mounta in e v e r g r e e n s , devi ls c lub and
a lder predominate . P rec ip i t a t ion e x c e e d s 4,000 mi l l ime t re s annual ly; t e m p e r a t u r e s
range f r o m -4OO t o + 2 5 O cen t ig rade .
I I I I I I I I I I 1 I
I I 1 I I I
:i
A T E : F E E . , 1990
.. , . , . . . .- . . ._l_ _ _ _ _ . .., .... . .. - - .. .. .I ..
I ,'. , , ' ; .;:, ':,, . . , ' ..I . . . .. . - . . . . . . . . .
. . .. > . . . -
- 2 - K E S T R E L RESOU.RCES' LTD.
L I A R D MINING DIVISION, B.C.
LOCATION MAP
DRAWN: J.B. / d w I
1N.T.S. 104B/15,104G/2 1SCALE:As Shown I FIG. I

- 3 -
PROPERTY AND LIST OF CLAIMS
T h e A r c a n d M & M c la ims compr ise t h r e e s e p a r a t e groups to t a l l i ng 219 uni t s in 14
c la ims grouped as l i s ted below:
1) ArcGroup
Claim Name
A r c 1
M & M 4 9
M & M 1 Group
M & M 1 2 3 5 6
3) M & M 2Group
M & M 10 11
Record No.
4490 449 1 4492 4493 4494
6314 6399
631 1 6312 6313 6315 6316
6400 6401
No. of Units
3 20 20 20
5
10 15
16 20 20 18 12
20 20
Record Date
F e b 24, 1988 I 1 I I
I I 11
I 1 I I
11 11
Sep t 5 , 1989 S e p t 12, 1989
Sep t 5, 1989 1 1 I I
t l 11
11 I 1
I1 1 1
Sep t 15, 1989 Sept 15, 1989
To t h e b e s t of t h e wr i te r ' s knowledge, t h e c l a ims a p p e a r to have been co r rec t ly
recorded .

I I I I I I I I 1 I 1 I 1 I I I I I I
- 4 -
HISTORY
Sporadic explora t ion efforts have cont inued i n t e r m i t t e n t l y i n .the Iskut R ive r a r e a
s ince t h e t u r n of t h e cen tu ry , wt th e a r l y a c t i v i t y c o n c e n t r a t e d in t h e area of t h e
S t e w a r t min ing camp. As prospec t ing a n d explora t ion con t inued no r thward , var ious
placer gold ope ra t ions w e r e discontinuously a c t i v e a long bo th t h e I skut a n d Unuk
Rivers .
In 1907, a prospec t ing p a r t y f r o m Wrangell, Alaska s t a k e d n ine mine ra l c l a ims
no r th of Johnny Mountain, t h e f i rs t . r eco rded work i n t h e area. T h e c la ims w e r e
subsequent ly explored a n d mined by t h e Iskut Mining Company , who in 1917 shipped
a ton of high g r a d e o r e which r epor t ed ly assayed $1.20 gold, 44.2 o u n c e s silver a n d
12.45% copper (B.C.M.M.A.R., 1917).
L i t t l e is known a b o u t subsequent work until 1954 when Hudson Bay Mining a n d
Smel t ing L imi t ed d iscovered high g r a d e gold-silver-lead-zinc mine ra l i za t ion , known
as t h e "Pickaxe" showing, o n t h e s lopes of Johnny Mountain. T h e s e c l a ims w e r e
eventua l ly a l lowed t o l apse a f t e r a n in i t ia l evaluat ion.
Severa l ma jo r mining compan ies in i t i a t ed reconnaissance exp lo ra t ion programs i n
t h e 1960s in t h e I skut R i v e r Area. Of t h e s e , Cominco L t d . dr i l led seve ra l c o r e
holes in s e a r c h of py r i t i c minera l iza t ion on Johnny Mountain. I n t e r e s t in t h e
Johnny Mountain area potent ia l to host s ign i f icant sulphide minera l iza t ion
increased w i t h Skyl ine Explorat ion Ltd.'s discovery of mine ra l i zed f l o a t on t h e
Bronson C r e e k g l ac i e r in 1969, resu l t ing i n t h a t company s t a k i n g t h e Inel proper ty .
In 1980, t h e company s t a k e d t h e REG proper ty on Johnny Mounta in a f t e r t h e
discovery of high g r a d e gold-bear ing veins. Explorat ion on both t h e i r Inel and REG
proper t ies cont inued t o 1989.

- 5 -
Skyline Explorat ion L t d . r e p o r t e d in l a t e fa l l of 1989, geological r e s e r v e s of the i r
S tonehouse depos i t of 740,000 tons grad ing 0.52 o p t gold w i t h s ign i f icant s i lver and
copper values. Underground work commenced in 1988, a n d a f t e r s o m e ini t ia l
product ion d i f f icu l t ies , t h e m i n e is cu r ren t ly i n product ion a t 350 tons per day .
T h e joint ven tu re p a r t n e r s of P r i m e Resources Corpora t ion a n d Cominco L td . a r e
cu r ren t ly i n t h e f ina l s t a g e s of a feas ib i l i ty s tudy of the i r SNIP p rope r ty , l oca t ed
immedia t e ly n o r t h of t h e REG proper ty o n t h e n o r t h e r n s lopes of Johnny Mountain.
T h e l a t e s t combined geological reserve f o r t h e p rope r ty i s 1,000,000 tons grading
0.80 o p t gold.
O t h e r advanced p rospec t s cu r ren t ly undergoing i n t e n s e explora t ion e f f o r t s in t h e
area inc lude Inel R e s o u r c e s Ltd.'s Inel proper ty , Gulf In t e rna t iona l Minerals Ltd.'s
McLymont proper ty , P l ace r Dome L td .5 Kerr deposi t a n d Calp ine ' s 21 Zone
Discovery .
T h e d iscovery of t h e Eskay C r e e k gold p rospec t (Calpine 21 Zone) in November of
1988 has done m u c h t o s t i m u l a t e explora t ion a c t i v i t y i n t h e Iskut region. T h e
depos i t occurs essent ia l ly at t h e upper c o n t a c t of a re la t ive ly f l a t lying,
h ydro therm al l y-alter e d andes i t e b recc ia (Rhyol i te ) wit hi n Middle Ju ras s i c Haze l ton
Group volcanic a n d s e d i m e n t a r y rocks. The e f f e c t s of f a u l t i n g a n d fo ld ing a r e n o t
c lear ly understood a t th i s d a t e . T h e zone r ema ins open t o t h e n o r t h e a s t and
downdip, a l though f i l l - in dr i l l ing at 25 m e t r e spac ing i s cont inuing. Spec tacu la r
resu l t s have been ob ta ined in drill c o r e assays , par t icu lar ly t h o s e in Hole No. 109,
.which r e tu rned 201.2 m e t r e s (660 f e e t ) g rad ing 30 g r a m s per t o n n e gold (0.876 opt) .
Drill hole in t e r sec t ions vary ing f r o m 5 to 10 m e t r e s (16 to 33 f e e t ) and grading to
100 g r a m s gold pe r t o n n e (2.92 op t ) w i t h a n a v e r a g e 1,000 g r a m s o r m o r e of silver
pe r t o n n e (29.2opt), a r e not uncommon. S igni f icant va lues i n l ead and z inc a r e
present as well. This p rospec t i s wi thout doubt t h e m o s t i m p o r t a n t precious m e t a l
depos i t e v e r d i scovered in Br i t i sh Columbia.

- 6 -
REGIONAL GEOLOGY
T h e S t e w a r t - Iskut - Eskay C r e e k gold s i lver a r e a is s i t u a t e d a long the w e s t e r n
marg in of t h e In t e rmon ta ine b e l t of volcanic and s e d i m e n t a r y rocks w h e r e t h e y join
t h e Coast P lu ton ic C o m p l e x of in t rus ive and m e t a m o r p h i c rocks. T h e m o s t
s ign i f icant hos t of gold-silver minera l iza t ion i n t h e a r e a i s t h e Tr iass ic t o J u r a s s i c
vo lcanic-sedimentary S t e w a r t complex (Hazel ton group). Tr ias ic t o T e r t i a r y
p lu tonic rocks of t h e Coast Intrusion are cons idered t o b e t h e sou rce of t h e
minera l iza t ion . Ju ra s s i c s ed imen ta ry rocks of t h e Bowser Basin a r e ex tens ive ly
underlain by rocks of t h e S t e w a r t Complex .
Within t h e S t e w a r t C o m p l e x of volcanics and s e d i m e n t a r y rocks bo th nar row
f r a c t u r e s a n d wide s h e a r zones c a r r y gold, silver and o f t e n , copper and moly-
bdenum values associated w i t h quartz veining. T h e s e mine ra l i zed a r e a s a r e
f r equen t ly c lose t o f e l s i c porphyry sills and dykes. T h e nor thern por t ion of t h e
d i s t r i c t appea r s to con ta in higher f r equency of gold q u a r t z veins grad ing t o
inc reased s i lver t o w a r d t h e s o u t h and inc reased coppe r t o w a r d t h e wes t .
T h e r e c e n t l y d iscovered 21 Zone on t h e S t ik ine S i lver /Calp ine c l a ims to t h e
sou theas t of t h e A r c and M ti M claims, is hosted i n t h e Mount Di lwor th fo rma t ion
of t h e upper H a z e l t o n group. The Di lwor th f o r m a t i o n has been t r a c e d t o t h e
no r thwes t f r o m .the 21 Zone.
PROPERTY GEOLOGY
Geological Survey Map 11-1971, p repa red by J.G. Souther , shows t h e geology of t h e
A r c a n d M&M cla ims at a scale of 1:250,000. More de t a i l ed m a p s are unavai lable
f rom Governmen t sou rces a n d Kes t r e l has n o t comple t ed reconnaissance mapping
o n th i s property. Accord ing t o Souther 's work, t h e c la ims are underlain by fo l i a t ed
rocks of Pa leozo ic a g e , minor l imes tone , and a s soc ia t ed i n t e r m e d i a t e in t rus ive
rocks of Jurassic-Triassic age. Fo l i a t ed rocks consis t of phyllite, g reens tone ,
q u a r t z s e r i c i t e - ch lo r i t e s c h i s t , a rg i l laceous q u a r t z i t e , minor c h e r t and sch is tose
t u f f . T h e p rope r ty is pa r t ly f a u l t bounded n e a r i t s e a s t e r n border (More

1 I I I I I I 1 1 -1 1 I 1 I I 1 I D I
- 17 -
I30 ' 45'
0 5 IO 15Km.
I : 250,000 .
KESTREL RESOURCES L TD.
GEOLOGY MAP
ARC 8 M+M CLAIMS
DRA WN 80s I NTS. /046/2 ~~
D A E : DEC IS89 1 FIGUQE Ne. 3

- 7a -
LEGEND
1 I
QUAT ERN ARY PLEISTOCENE AND RECENT
Fluviatile gravel; eand, silt; glacial outwash, till, alpine moraine and colluvium
F] Hot.-spring depoeit,tufa , aragonite
Olivine basalt, related pyroclastic rocks and loose tephra; younger than some of 29
TERTIARY AND QUAT E RNARY UPPER TERTIARY AND PLEISTOCENE
Rhyolite and dacite flows, lava domes, pyroclastic rocks and related sub- volcanic intrusions; mlnor basalt
Basalt, olivine basalt, dacite,related pyroclastic rocke and subvolcanic intrusions; minor rhyolite; in part younger than some 26
CRETACEOUS AND TERTIARY UPPER CRETACEOUS AND LOWER TERTIARY
SLOKO GROUP Ltght green, purple and white rhyolite, trachyte and dacite flows,pyroclastic rocks and derived sediments
22. Biotite leucogranite, subvolcanic stocks, dykes and sille 23. Porphyritic biotite andesite, lava domes, flows and (7) si l ls
SUSTUT GROUP Chert-pebble conglomerate, granite-boulder conglomerate, quartzose sandstone, arkose, eiltstone, carbonaceous shale and minor c o d
Felsite, quartz-feldspar porphyry, pyritiferous felsite, orbicular rhyolite; in
I1241
(22(231
I 1E3
I
m part equivalent to 22
i Fl Medium-to coarse-grained, pink biotite-hornblende quartz monzonite
JURASSIC AND/OR CRETACEOUS
[TI Hornblende diorite
FI Granodiorite, quartz diorite; minor diorite, leucogranite and migmatite
POST- W P ER TRIASSIC P RE-TE RTIARY
I

- 7b -
JURASSIC MIDDLE (7) AND UPPER JURASSIC
BOWSER GROUP Chert-pebble conglomerate, grit, greywacke, subgreywacke, siltstone and shale; may include some 13
MIDDLE JURASSIC Basalt, pillow lava, tuff-breccia, derived volcaniclastic rocks and related eubvolcanlc intrusions
LOWER AND MIDDLE JURASSIC Shale, minor siltstone, siliceous and calcareous siltstone, greywacke and ironstone
LOWER JURASSIC Conglomerate, polymictio conglomerate; granite-boulder conglomerate, grit, groywacke, siltstone; basaltio and andesitio volaanio rocks, peperitee, pillow-breccia and derived voloaniclaetic rocks
TRIASSIC AND JURASSIC
F] Syenite, orthoclase porphyry, monzonite, pyroxenite
POST-UPPER TFUASSIC PRGLOWER JURASSIC
HICKMAN BATHOLITH 10. Hornblende granodiorite. minor hornblende-quartz diorite 11. Hornblende, quartz diorite, hornblende-pyroxene diorite, amphibolite and pyroxene-bearing amphibolite
TRIASSIC UPPER TNASSIC
L 9 1 Undifferentiated volcanio and eodimentary rocks (units 5 to 8 inclusive)
Augite- andesite flows, pyroclaetic rocks, derived volcaniclastic rock8 and related subvolcanic intrusions; minor p e . w a c k e , siltstone and polymlctic conglomerate
Siltstone, thin-bedded siliceous siltstone, ribbon chert, c a l c a r e o u ~ and (71 dolomictic siltetone, greywacke, volcanic conglomerate, and minor limestone
Isl limestone; may be in part younger than some 7 and 8 Limestone, fetid argillaceous limestone, calcareous shale and reefoid
I 5 1 Greywacke, siltstone, shale; minor conglomerate, tuff and volcanic sandstone
MIDDLE TRIASSIC I.1 Shale, concretionary black shale; minor calcareous shale and siltstone

- 7 c -
PERMIAN MIDDLE AND UPPER PERMIAN
Limestone, thick-bedded mainly bioclastic limestone; minor siltstone, chert 131 andtuff
PERMIAN AND OLDER
121 greenstone, minor chert, schistose tuff and limestone Phyllib, argillaceous quartzite, quartz-serlcite schist, chlorite schist,
MISSIsSrPPIAN Limestone, crinoidal limestone, ferruginous limestone; maroon tuff, cher t and phyllite
1.1 Amphibolite, amphibolite gneiss; age unknown probably pro-Upper Jurassic
Ultramafic rocks; peridotite, dunite, serpentinite; age unknown , probably pre-lower Jura8810
Geological boundary (defined and approximate, assumed) ................... n - 1
Bedding (horizontal, inclined, vertioal, overturned) ......................... + J % P + + .............................................................. Anticline
Syncline
Fault (defined and approximate, assumed) ............................... ~ ~
Thrust fault, teoth on hanging-wall side (defined and approximate, assumed). , A I
Fossil l o o d t y . . ............................................................. @
MLneral property ........................................................... .16 x Glacier............................ .................................... \_-__-e_:
...............................................................
_ _ - - - \ , < - -

I I I I I I I I I I I I I I I I I .I I
- 8 -
C r e e k ) as wel l as n e a r i t s no r thwes t boundary sou th of A r c t i c Lake. Nor ther ly t r e n d i n g q u a r t z veins appear t o be r e l a t e d t o th i s regional sys t em but where
e x a m i n e d a n d sampled , did not c a r r y visible sulphides o r s ignif icant va lues in
precious m e t a l s .
GEOCHEMICAL PROGRAM
T h e program comple t ed by K e s t r e l was designed t o provide broad cove rage w i t h a
minimum of t i m e and cost expendi tures a n d w a s successfu l ly comple t ed du r ing t h e
period Ju ly 2, O c t o b e r 12, 1989. A total of 29 m a n days were s p e n t i n
accumula t ing 111 s t r e a m s e d i m e n t s amples and 1 4 9 soil con tour samples . All of
t h e s a m p l e r e su l t s and loca t ions a r e shown p lo t t ed o n t h e a t t a c h e d s a m p l e l o c a t i o n m a p (Figure 4). T h e samples w e r e collected by R a n g e x personnel , t r a i n e d a n d
under c o n t r a c t t o Kes t r e l Resources L td . K e s t r e l suppl ied supervis ion. Silt
s amples w e r e collected f r o m t h e a c t i v e channel of t h e s t r e a m i n K r a f t pape r
envelopes assigned a number whose loca t ion w a s m a r k e d o n a topograph ic m a p a n d
descr ibed i n f i e l d s a m p l e books suppl ied f o r t h i s purpose. F e a t u r e s desc r ibed
inc lude d e p t h of channel , w id th of channel , t y p e of m a t e r i a l co l l ec t ed i.e. s i l t , f i n e
sand , coa r se sand , grave l , etc., colour of m a t e r i a l co l l ec t ed , a m o u n t of o r g a n i c
c o n t e n t and t y p e and pe rcen t of sulphide mine ra l i za t ion present .
Soil s amples w e r e co l l ec t ed du r ing t w o s e p a r a t e con tour t r a v e r s e s a n d s t o r e d in
K r a f t paper envelopes as descr ibed above . D e t a i l s r eco rded inc luded d e p t h of
s a m p l e (approximately 2 0 c e n t i m e t e r s a v e r a g e depth) , s lope ang le , s lope d i r ec t ion ,
colour of soil, t y p e of soil, sulphides present a n d genera l observa t ions . All s amples
w e r e dr ied at a m b i e n t t e m p e r a t u r e s t h e n sh ipped t o Vangeochem f o r analysis .
A 25 e l e m e n t I.C.A.P. analysis , as wel l as a s t a n d a r d F.A. a n d A.A. r e s u l t f o r gold,
w a s ob ta ined f o r e a c h silt s a m p l e co l lec ted . Soils w e r e ana lyzed f o r gold as a b o v e
and for Ag, As, C u , Fe, Mn, Mo, Ni, P b , Sb a n d Zinc, as descr ibed i n Appendix 11.

I I I I I I I I I I I I I I I I I I I
- 9 -
DISCUSSION OF RESULTS
T h e r e su l t s of assays ob ta ined f rom t h e soil and s i l t s a m p l e program do n o t i nd ica t e
a n y s igni f icant e c o n o m i c o r precious m e t a l t a rge t s . Values f o r silver (ppm) and
gold (ppb) a r e shown p lo t t ed o n F igu re 4 a n d a r e ful ly d iscussed by John C. H a r r o p
of Cyberques t as a r e t h e ICAP resu l t s ob ta ined (Appendix I).
A s m a y be s e e n f rom a brief review of F i g u r e 4, s a m p l e s p a c i n g a l o n g individual
c r e e k s is i n m o s t cases b e t t e r t h a n a v e r a g e , yielding a minimum of f i v e s a m p l e s
per s t r e a m . Similar ly , m o s t of t h e s t r e a m s draining t h e n o r t h e r n half of t h e c la im
block have b e e n sampled , a l though t h e r e a r e 5 t o 6 t r i b u t a r i e s t h a t did n o t r e c e i v e
a n y sampling. (These s t r e a m s drain M&M 1 a n d 10 mine ra l claims.) The sou the rn
por t ion of t h e c la im block was n o t s ampled d u e t o t i m e cons t r a in t s , ice, a n d l ack of properly developed drainage.
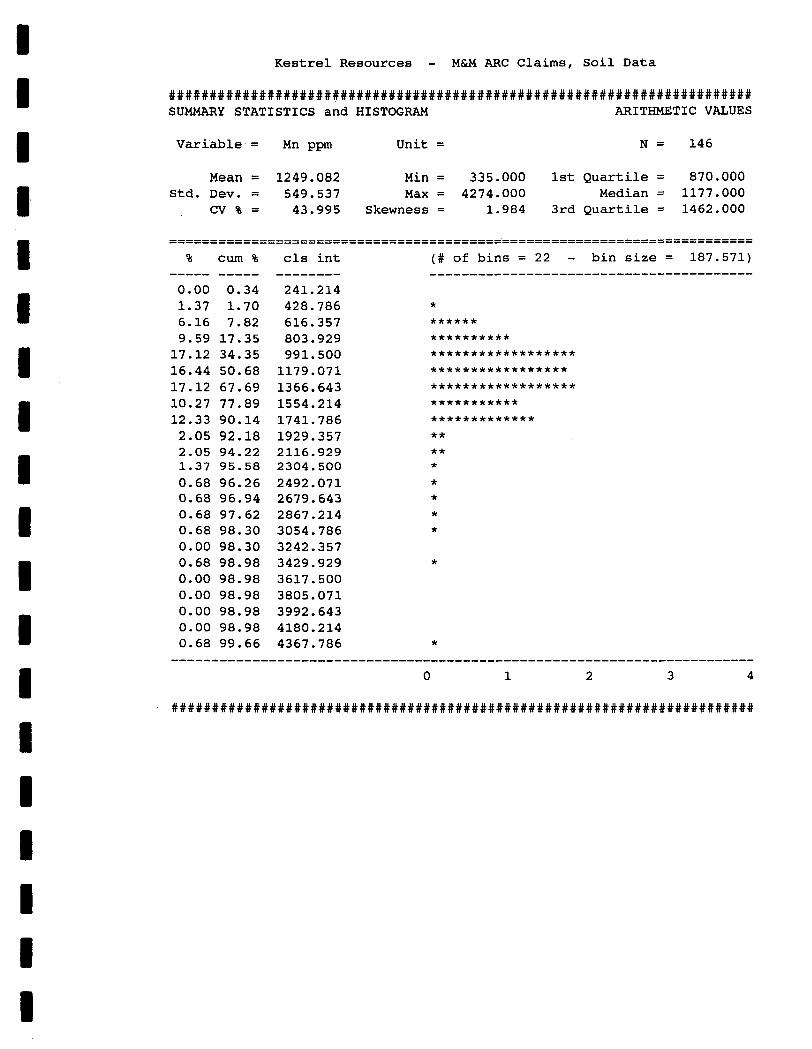
T h e h ighes t value ob ta ined is 100 ppb A u i n soi l s a m p l e 05398. Silver values are
cons is ten t ly less t h a n 1.0 ppm in both soil and s t r e a m s e d i m e n t samples . Silver
values t h e r e f o r e , a r e n o t useful in i so la t ing anomalous condi t ions t h a t m a y exist on
t h e property. I C A P re su l t s , f o r t h e m o s t p a r t , d id n o t r e t u r n useful d a t a with t h e
except ion of A s a n d possibly Pb a n d Zn i n s t r e a m sed imen t s a m p l e s , a l l of which
show s o m e co r re l a t ion wi th anomalous A u soil samples . T h e geochemica l survey
comple t ed a p p e a r s t o be a r e l i ab le tool within t h e topograph ic - geologic se t t i ng ,
bu t i nasmuch as t h e r e is no de ta i led geological i n fo rma t ion ava i lab le t o confirm
this , a d e f i n i t e conclusion r ega rd ing th i s observa t ion i s unavai lable .
CONCLUSIONS
1) T h e r e is no h is tory of work on t h e properl-y prior t o 1988.
2) The geology underlying t h e A r c a n d M&M minera l c l a ims appears t o be
f avourab le as host of sulphide and/or prec ious m e t a l depos i t s i n t h a t bo th
in t rus ive rocks and t h e i r r e l a t ed q u a r t z veins occur wi th in a volcanic-
s e d i m e n t a r y a s semblage of Pa leozo ic age .

- 10 -
3) S t r e a m sed imen t sampl ing resu l t s ob ta ined have n o t def ined any obvious
exp lo ra t ion t a r g e t s requir ing follow-up work.
4) T h e p rope r ty h a s r ece ived minimal explorat ion to d a t e .
RECOMMENDATIONS
Due to t h e l imi t ed a n d rapid cove rage of t h e p rope r ty to d a t e , it is r ecommended
t h a t t h e p rope r ty b e ful ly e v a l u a t e d by m e a n s of r econna i s sance prospect ing a n d
rock sampling, addi t ional s e l e c t e d geochemica l sampling, a n d reconnaissance
geological mapping as required. Par t icu lar a t t e n t i o n should b e given t o a n y intrusive -volcanic - s e d i m e n t a r y contacts as well as o t h e r features such as obvious
gossans, s h e a r zones a n d quartz vein s y s t e m s n o t explored previously.
T h e p rogram, as ou t l ined above , is e s t i m a t e d to requ i r e a t o t a l of $150,000 as
ind ica t ed in t h e proposed expend i tu re s a t t a c h e d .

- 11 -
PROPOSED EXPENDITURES
Prospec t ing , Sampl ing 4 m a n c r e w , 2 4 days at $300/man day
Geological Mapping
Geophysics - Geochem
Trenching: 12 man days at $300/man day
Room and Board: 150 m a n days
Hel icopter : 25 hours at $800/hour
Assay: 400 samples at $20 e a c h
Transpor ta t ion , Supplies, Mob-Demob etc.
Repor t : Compi la t ion and Maps
Managemen t Fee (10%) Cont ingency
T o t a l
$ 28,800
7,000
15,000
3 ,600
18,700
20,000
8,000
10,000
8,000
- 12,000
$ 18,000
$150,000

I I I I I I I I I I I I I 1 I I 1 I I
- 12 -
BIBLIOGRAPHY
Souther, J.G., Geological Survey of Canada, Paper 71-44, Map 11-1971.
I I 1 I I I I I I I I I 1 I I 1 1 I 1
A P P E N D I X I
GEOCHEMICAL REPORT

,I I I I m I I I 1 1 1 I I 1 I I I I I
Geochemical Data Analysis and Interpretation on the ARC 1-5, M&M 1 - 11 C l a i m s
for Kestrel Resource Ltd .
John C. Harrop (CyberQuest Exploration Systems Ltd)
1) Soil Samples
The results of 149 soil samples analyzed by 10 element ICP and AA (for Au only) were examined. These soil samples were taken along rough contours at 25 m spacing on the ridge near the common border of the ARC 2 and ARC 3 claims. Three elements, Ag, Mo and Sb were not considered in the data analysis due to their low range of values close to detection limit. The remaining elements were examined by probability plot analysis. Thresholds were then determined with the exception of Au and Zn since their probability plots were unable to distinguish component populations. Zn values greater than mean plus two standard deviations were considered outliers and treated as anomalous. Since Zn more closely approximated a log-normal distribution than a normal distribution mean and standard deviation were calculated on log transformed data. Two samples returned Au values significantly above background: 05398 - 100 ppb Au, 05405 - 50
ppb Au.
Although few conspicuously anomalous values were returned, an As anomaly of eight adjacent samples (05404 - 05411) csinciding with the 50 ppb Au has been identified. With a threshold of 60.6 ppm this may be seen as a low intensity anomaly, however the continuity, statistical significance and minor Au ( + M n and Pb) association of the anomaly make it the largest feature that may reflect mineralization found in the soil data.

N OF CASES MINIMUM MAXIMUM MEAN STANDARD DEV SKEWNESS (G1 ) KURTOSIS(G2) THRESHOLD DETECT I ON
N OF CASES MINIMUM MAXIMUM MEAN STANDARD DEV
KURTOSIS(G2) THRESHOLD DETECTION
SKEWNESS (G1 )
AG
147 0.100 1.000 0.213 0.144 1.998 5.913
0.1
MO
147 0.000 5.000 1.837 0.899
0.766
1
0.553
AS
147 0.000
247.000 21.503 32.135 3.633 17.931 60.6 3
NI
147 11.000 110.000 31.116 12.247 2.703 12.989 44.2 1
cu
147 14.000
1056.000 96.639 103.289 6.271 51.142
185.8 1
PB
147 14.000 130.000 41.769 13.404 2.571 12.247 64.8
2
FE ( % I
147 1.770 13.060 4.995 1.295 2.482 10.987 7.27 0.01
ZN
147 41.000 782.000 140.857 86.027 4.551 26.618 284.4
1
MN
147 335.000
18496.000 1366.408 1524.281
9.816 107.132 1576
1
Table 1: Summary Statistics and Thresholds for Soil Sample Data. (147 samples) All values in ppm except where marked. Zn threshold is calculated from log transformed data. All other thresholds calculated by probability plot analysis.
Samples returning Cu values greater than 185.8 ppm (05326, 05328, 05334, 05335, 05339, 05340, 05361, 05362, 05409) weresporadically located including three pairs of adjacent samples. No obvious patterns relating to mineralization or lithology were apparent in the Cu distribution.
Anomalous Mn samples were found to be sporadically located with some correlation to high Fe values. Several high Cu values may be explained by their coincidence with high Mn. samples coincide with the As anomaly mentioned above. Fe and Ni show now spatially meaningful anomalies.
Five high Mn
Three adjacent high Pb values are coincident with the above mentioned As anomaly. Otherwise not additional Pb samples are of interest. Four contiguous high Zn samples (05419 - 05422) do not

I 1 1 I I 1 I I I 1 1 I I 1 1 I I 1 I
correlate with any other elemental anomalies. Due to the hydromorphic dispersion patterns of Zn, and the frequency of the metal in contamination no further comment on this is warranted without additional knowledge of the site.
2) Stream Sediment Samples
The results of 111 stream sediment samples analyzed by 25
element ICP and AA (for Au only) were examined. Interpretation of the stream sediment results cannot be conducted in, but must be integrated with the known geology and alteration characteristics of the property. The dominant signal in the data, as would be expected, is the underlying lithology of each sample's catchment basin. Sensitivity to recognizing anomalies can be significantly increased when the geology of the basins can be determined independently from the geochemistry.
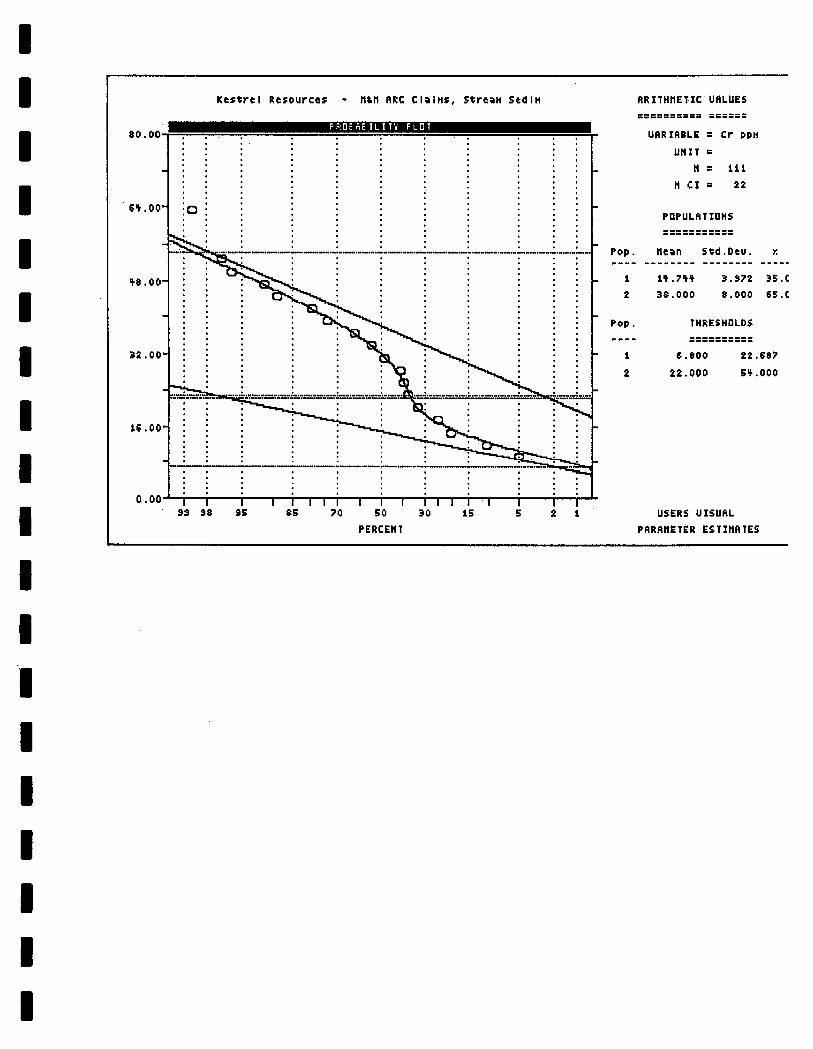
Eleven elements Ag, Bi, Cd, Co, K, Mo, Na, Sb, Sn, U and W were not considered due to their low range of values near or below the detection limit. The remaining elements were examined by probability plot analysis and when possible thresholds were determined. The elements Au, As, Ba, Ni, Pb and Sr could not be analyzed by probability plot and a threshold of mean plus two standard deviations was used to arbitrarily identify outliers. Of these Sr was found to more closely fit a log-normal than normal distribution, thus mean and standard deviation were calculated from log transformed data. Three of these elements, Ba, Ni and Sr gave scattered high values and showed no meaningful interpretation. Strong spatially consistent lithologic and/or alteration signatures were indicated by Al, Cr, Cu, Mg and P. More sporadic lithologic signatures were given by Ca, Fe, Mn, and Zn.
As was found to indicate six outliers, of which an isolated 'high' value (57 ppm) coincided with 'high' Pb (90 ppm) and Zn

(407 ppm) was of the most interest (see sample 06079). Three 'high' As values were found in the same drainage in the southwestern corner of the sampled area (samples 05456, 05457, 05462). Based on the As anomaly observed in the soil samples, As may be the better indicator of mineralization related elements. Pb indicated two pairs of 'high' values (samples 05461, 05462 and 05651, 05652). Au gave no significant high values, the highest being 30 ppb Au in sample 05653.
Most striking was the inverse correlation between Cr and P values. Mg and Fe tended to correlate with Cr but not at consistently as the Cr-P relationship. This most likely reflects a high-Cr, low-P rock unit and a low-Cr, high-P rock unit that can be traced by drainage across the claims. A high Zn population roughly correlated with high Cr but was more sporadic than P . Cu
and A1 show a consistent depletion or anomalously low population. This population is isolated to the hillside draining the soil sampled ridge in the northwestern corner of the claims. Again, this is most likely a rock unit, or an alteration pattern indicated in the stream sediments.

MINIMUM MAXIMUM MEAN STANDARD DEV SKEWNESS (G1 ) KURTOSIS(G2) THRESHOLD DETECTION
MINIMUM MAXIMUM MEAN STANDARD DEV SKEWNESS(G1) KURTOSIS(G2) THRESHOLD DETECTION
MINIMUM MAXIMUM MEAN STANDARD DEV SKEWNESS (Gl) KURTOSIS(G2) THRESHOLD DETECTION
MINIMUM MAXIMUM MEAN STANDARD DEV SKEWNESS(G1) KURTOSIS(G2) THRESHOLD DETECTION
AL
1.220 3.840 2.637 0.608
-0.208 -0.356 1.75 0.01
CR
8.000 65.000 29.919 13.327 0.131
-0.707 22.3 1
MN
588.000 5297.000 1159.090 519.108
5.050 35.496
1614 1
ZN
64.000 407.000 108.099 40.191 3.819 25.533 101.7
1
AS
3.000 57.000 16.784 7.696 1.395 5 .I83
29.8 3
cu
25.000 244.000 82.919 31.852 1.250 4.983 44.5 1
NI
9.000 36.000 22.270 5.555 0.271 -0.329 33.4 1
BA
51.000 283.000 142.532 56.077 0.404
254.686 -0.766
1
FE ( % I
2.700 6.370 4.219 0.610 0.773 0.946 4.90 0.01
p
0.040 0.410 0.116 0.080 1.555 2.206 0.101 0.01
CA
0.190 2.620 0.551 0.319 4.092
21.623 0.74 0.01
K
0.060 1.180 0.240 0.172 3.387 12.529
0.01
PB
18.000 111.000 36.486 11.264 3.599 19.811 49.4 2
co
10.000 44.000 22.523 4.578 1.042 4.155
1
MG ( % I
0.690 3.170 1.684 0.429 0.735 0.841 1.83 0.01
SR
14.000 189.000 48.351 26.604 2.107 7.184
114.4 1
Table 2: Summary Statistics and Thresholds for Stream Sediment Data. (111 Samples) All values in ppm except where noted. See text for explanation of threshold calculation.
1 1 I I I 1 I I I u I I 1 I 1 I I I
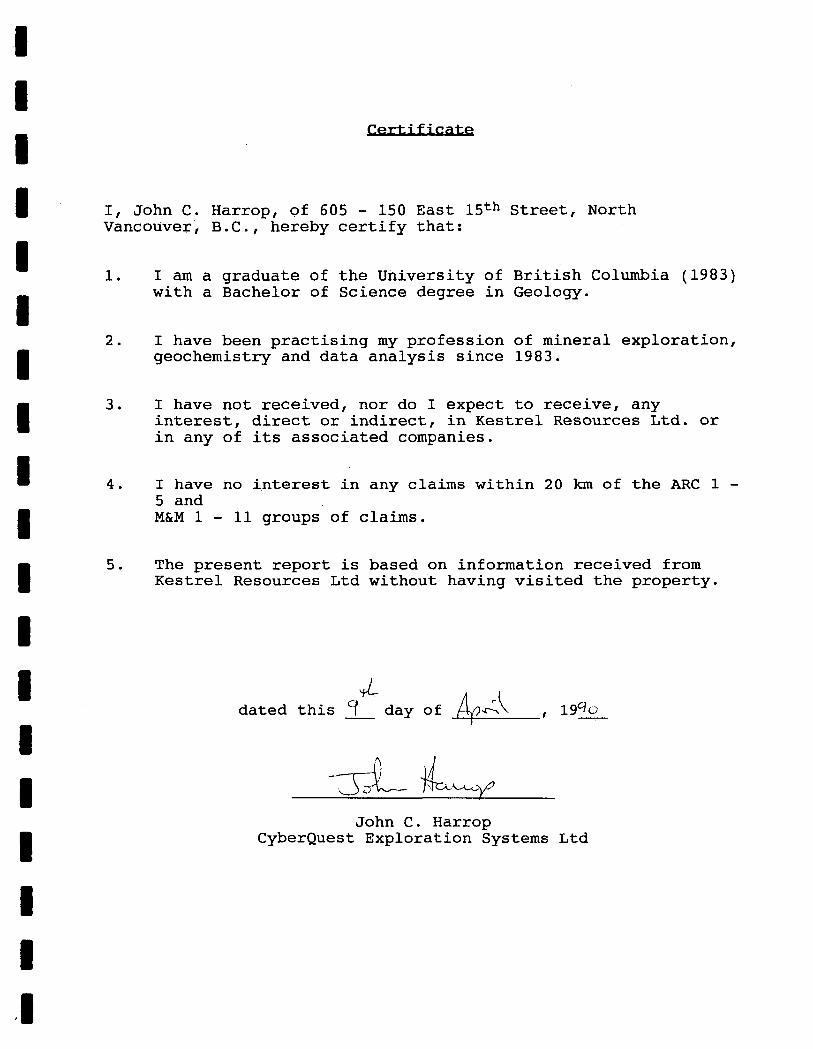
I, John C. Harrop, of 605 - 150 East 15th Street, North Vancouver, B.C., hereby certify that:
1.
2.
3.
4 .
5.
I am a graduate of the University of British Columbia (1983) with a Bachelor of Science degree in Geology.
I have been practising my profession of mineral exploration, geochemistry and data analysis since 1983.
I have not received, nor do I expect to receive, any interest, direct or indirect, in Kestrel Resources Ltd. or in any of its associated companies.
I have no interest in any claims within 20 km of the A R C 1 - 5 and M&M 1 - 11 groups of claims.
The present report is based on information received from Kestrel Resources Ltd without having visited the property.
UL dated this y day of Awe( , 194%
r\ I
John C. Harrop CyberQuest Exploration Systems Ltd

I I I I I I I I I I I I I I I I I I I
Kestrel Resources - M&M ARC Claims, Soil Data
. . . . . . . . . . . . . . . . . . . . . . . . . . . . . . . . . . . . . . . . . . . . . . . . . . . . . . . . . . . . . . . . . . . . . . . . SUMMARY STATISTICS and HISTOGRAM LOGARITHMIC VALUES
Variable = As ppm Unit = N = 121
Mean = 1.1717 Min = 0.0000 1st Quartile = 0.9542 Std. Dev. = 0.4840 Max = 2.3927 Median = 1.2041
CV % = 41.3084 Skewness = -0.2909 3rd Quartile = 1.4771
Anti-Log Mean = 14.847 Anti-Log Std. Dev. : ( - ) 4.871 (+) 45.253
........................................................................ --------------______---------------------------------------------------- % cum %
0.00 0.41 3.31 3.69 0.00 3.69 0.00 3.69 5.79 9.43 1.65 11.07 3.31 14.34 3.31 17.62 4.13 21.72 10.74 32.38 10.74 43.03 14.88 57.79 9.09 66.80 10.74 77.46
4.13 88.93 3.31 92.21 0.83 93.03 4.13 97.13 1.65 98.77 0.00 98.77 0.83 99.59
-----
7.44 84-84
antilog
0.871 1.148 1.512 1.991 2.623 3.454 4.550 5.993 7.893 10.397 13.694 18.037 23.758 31.292 41.216 54.288 71.506 94.184 124.054 163.397 215.218 283.475
-------- cls int - - - - - - - -0.0598 0.0598 0.1795 0.2991 0.4187 0.5384 0.6580 0.7776 0.8973 1.0169 1.1365 1.2562 1.3758 1.4954 1.6151 1.7347 1.8543 1.9740 2.0936 2.2132 2.3329 2.4525
***
***** * *** *** **** ********* ********* ************* ******** ********* ****** **** *** * **** *
*
. . . . . . . . . . . . . . . . . . . . . . . . . . . . . . . . . . . . . . . . . . . . . . . . . . . . . . . . . . . . . . . . . . . . . . . .

I 'I I I I I I I I I I 1 .I I I I I I I
I i i . . . . . .
1.
a.
-a. . . . . . . * . . . . . . . . . . . . . . . . . A : : . .
. . . . . . . . . . . . . . . . . . . . . . . . . . . . . . . . * . . . . . . . . . . . . I . . -1.800 I I I I 1 1 I l l I I I I I I I I I I I 99 98 95 85 70 50 30 15 5 2 i
PERCENT CLASS INTERUAL HL
PARAHETER ESTIHATES

I I I I I I I I I I I I I I I I I I I
Kestrel Resources - M&M ARC Claims, Soil Data
. . . . . . . . . . . . . . . . . . . . . . . . . . . . . . . . . . . . . . . . . . . . . . . . . . . . . . . . . . . . . . . . . . . . . . . . SUMMARY STATISTICS and HISTOGRAM LOGARITHMIC VALUES
N = 146 Variable-= Cu ppm Unit =
1.1461 1 s t Quartile = 1.7364 Mean = 1.8776 Min = Std. Dev. = 0.2497 Max = 2.7177 Median = 1.8692
CV % = 13.2974 Skewness = 0.2939 3rd Quartile = 2.0149
Anti-Log Mean = 75 * 447 Anti-Log Std . Dev. : ( - ) 42.458 ( + ) 134.066
0.00 0.34 0.68 1.02 0.00 1.02 0.00 1.02 2.05 3.06 2.74 5.78 4.79 10.54 2.74 13.27 8.22 21.43 12.33 33.67 15.75 49.32 13.70 62.93 10.96 73.81 6.16 79.93 8.90 88.78 4.79 93.54 1.37 94.90 2.05 96.94 0.68 97.62 0.68 98.30 0.00 98.30 0.68 98.98 0.68 99.66
12.844 15.260 18.129 21.539 25.589 30.401 36.118 42.910 50.979 60.566 71.955 85.487 101.563 120.662 143.353 170.310 202.337 240.387 285.592 339.299 403.104 478.909 568.968
1.1087 1.1835 1.2584 1.3332 1.4081 1.4829 1.5577 1.6326 1.7074 1.7822 1.8571 1.9319 2.0067 2.0816 2.1564 2.2312 2.3061 2.3809 2.4557 2.5306 2.6054 2.6803 2.7551
*
** *** ***** *** ******** ************* **************** ************** *********** ****** ********* ***** * ** * *
* *
. . . . . . . . . . . . . . . . . . . . . . . . . . . . . . . . . . . . . . . . . . . . . . . . . . . . . . . . . . . . . . . . . . . . . . . .

K e s t r e l Resources - H&H @RC CtP iHs , S o i l D a t a
I . . . . I
I . . . . I . . . . . . . . 1 . 0 0 0 ' I I I I I I I I I I I I I I I I 1 I I L
99 98 95 85 70 50 30 15 5 P i
PERCENT
USERS UISUAL
PARAHETER ESTIHATES
E
I I I

I I I I I I I I I I I I I I I I I I ' I
Kestrel Resources - M&M ARC Claims, Soil Data
. . . . . . . . . . . . . . . . . . . . . . . . . . . . . . . . . . . . . . . . . . . . . . . . . . . . . . . . . . . . . . . . . . . . . . . . SUMMARY STATISTICS and HISTOGRAM ARITHMETIC VALUES
Variable = Fe % Unit = N = 145
Mean = 4.962 Min = 3.320 1st Quartile = 4.245 Std. Dev. = 1.084 Max = 9.850 Median = 4.730
cv % = 21.845 Skewness = 1.691 3rd Quartile = 5.393
% , C u m %
0.00 0.34 1.38 1.71 6.90 8.56 9.66 18.15 18.62 36.64 12.41 48.97 11.03 59.93 12.41 72.26 10.34 82.53 4.14 86.64 3.45 90.07 2.07 92.12 2.07 94.18 2.07 96.23 0.69 96.92 0.00 96.92 0.00 96.92 0.00 96.92 1.38 98.29 0.69 98.97 0.00 98.97 0.00 98.97 0.69 99.66
----- ----- CIS int
3.165 3.475 3.786 4.097 4.408 4.719 5.030 5.341 5.652 5.963 6.274 6.585 6.896 7 207
7.829 8.140 8.451 8.762 9.073 9.384 9.695 10.005
--------
7.518
* ******* ********** ******************* ************* *********** ************* *********** **** **** ** ** ** *
* *
*
. . . . . . . . . . . . . . . . . . . . . . . . . . . . . . . . . . . . . . . . . . . . . . . . . . . . . . . . . . . . . . . . . . . . . . . .

K e s t r e l Resources - HclH ARC C l a i t i s , Soil Data
USERS UISUAL
PllRLHETER ESTIHATES
I I 1 I 1 i I I I I I I I 1 I I I I I
Kestrel Resources - M&M ARC Claims, Soil Data
. . . . . . . . . . . . . . . . . . . . . . . . . . . . . . . . . . . . . . . . . . . . . . . . . . . . . . . . . . . . . . . . . . . . . . . . SUMMARY STATISTICS and HISTOGRAM ARITHMETIC VALUES
Variable = Mn ppm Unit = N = 146
Mean = 1249.082 Min = 335.000 1st Quartile = 870.000 Std. Dev. = 549.537 M a x = 4274.000 Median = 1177.000
cv % = 43.995 Skewness = 1.984 3rd QUaKtile = 1462.000
. . . . . . . . . . . . . . . . . . . . . . . . . . . . . . . . . . . . . . . . . . . . . . . . . . . . . . . . . . . . . . . . . . . . . . . .
% cum % cls int ( # of bins = 22 - bin size = 187.571) ----- ----- -------- ___________________--------------------- 0.00 0.34 241.214 1.37 1.70 428.786 * 6.16 7.82 616.357 ****** 9.59 17.35 803.929 ********** 17.12 34.35 991.500 ****************** 16.44 50.68 1179.071 ***************** 17.12 67.69 1366.643 ****************** 10.27 77.89 1554.214 *********** 12.33 90.14 1741.786 ************* 2.05 92.18 1929.357 ** 2.05 94.22 2116.929 ** 1.37 95.58 2304.500 * 0.68 96.26 2492.071 * 0.68 96.94 2679.643 * 0.68 97.62 2867.214 * 0.68 98.30 3054.786 * 0.00 98.30 3242.357 0.68 98.98 3429.929 * 0.00 98.98 3617.500 0.00 98.98 3805.071 0.00 98.98 3992.643 0.00 98.98 4180.214 0.68 99.66 4367.786 *
........................................................................ 0 1 2 3 4
. . . . . . . . . . . . . . . . . . . . . . . . . . . . . . . . . . . . . . . . . . . . . . . . . . . . . . . . . . . . . . . . . . . . . . . .

I I K t c t r c l Rccourccc - HrH ARC Clains, Soil Data
5000
YO00
2000
iaaa
a 99 ¶8 95 85 70 50 3a 15 5 2 1
PERCENT USERS UISUAL
PARAHETER ESTIHATES

I I. I I I I I I I I I I 1 I I I I I I
% cum %
0.00 0.34 1.37 1.70 2.74 4.42 5.48 9.86 8.22 18.03 7.53 25.51 14.38 39.80 21.23 60.88 15.07 75.85 8.90 84.69 4.79 89.46 4.79 94.22 0.68 94.90 2.05 96.94 0.00 96.94 0.00 96.94 0.68 97.62 0.00 97.62 0.00 97.62 0.00 97.62 0.68 98.30 0.68 98.98 0.68 99.66
----- ----- cls int
9.405 12.595 15.786 18.976 22.167 25.357
31.738 34.929 38.119 41.310 44.500 47.690 50.881 54.071 57.262 60.452 63.643
70.024 73.214 76.405 79.595
- - - - - - - -
28.548
66.833
* *** ****** ******** ******** *************** . . . . . . . . . . . . . . . . . . . . . . **************** ********* ***** ***** * **
*
* * *
. . . . . . . . . . . . . . . . . . . . . . . . . . . . . . . . . . . . . . . . . . . . . . . . . . . . . . . . . . . . . . . . . . . . . . . .

80
CY
Y 8
32
16
0
Kestrel Resources - H M ARC C l a i H S , S o i l D a t a
99 98 9 5 85 7 0 5 0 30 i5 5 2 i PERCENT
USERS UISUAL PARAHETER ESTIHATES

I I I I I I I I I I I I I I I I I I I
Kestrel Resources - M&M ARC Claims, Soil Data
. . . . . . . . . . . . . . . . . . . . . . . . . . . . . . . . . . . . . . . . . . . . . . . . . . . . . . . . . . . . . . . . . . . . . . . . SUMMARY STATISTICS and HISTOGRAM ARITHMETIC VALUES
Variable = Pb ppm Unit = N = 145
Mean = 41.352 Min = 22.000 1st Quartile = 34.000 Std. Dev. = 11.071 Max = 82.000 Median = 39.000
c v % = 26.772 Skewness = 1.317 3rd Quartile = 46.250
----------______________________________-------------------------------- ----------______________________________-------------------------------- % cum % c ls int ( # of bins = 22 - bin size = 2.857)
----- ----- -------- ........................................ 0.00 0.34 20.571 0.69 1.03 23.429 * 2.07 3.08 26.286 ** 4.14 7.19 29.143 **** 8.97 16.10 32.000 ********* 12.41 28.42 34.857 ************* 16.55 44.86 37.714 ***************** 12.41 57.19 40.571 11.72 68.84 43.429 ************
*************
5.52 74.32 46.286 ****** 6.21 80.48 49.143 ****** 6.21 86.64 52.000 ****** 2.07 88.70 54.857 ** 1.38 90.07 57.714 * 2.76 92.81 60.571 *** 1.38 94.18 63.429 * 1.38 95.55 66.286 * 0.69 96.23 69.143 * 0.00 96.23 72.000 1.38 97.60 74.857 * 0.69 98.29 77.714 * 0.69 98.97 80.571 * 0.69 99.66 83.429 *
........................................................................ 0 1 2 3 4
. . . . . . . . . . . . . . . . . . . . . . . . . . . . . . . . . . . . . . . . . . . . . . . . . . . . . . . . . . . . . . . . . . . . . . . .

I I
B I I
K e s t r e l Resources - H&H ARC C I a i H S , S o i l D a t a
I I . . . . 1 0 0 . 0 0 0 * . I i i : : I . .
80
60
w
20 I . . . . I
I : : : : I I . . . . I
a . . . . . * . . . ' . . 0 . 0 0 I I I I I l l 1 I I I I I I I I I I 1
99 98 95 85 70 50 30 15 5 2 1
PERCENT
38.357 6.919 88.C
5 9 . 0 0 0 3 . 9 0 8 7 . 5 ? 5 . 0 0 0 6 . 0 8 9 ) . E
USERS UISUAL
PARAHETER ESTIHATES

I I I I I I I I I 1 I I 1 I I I I I B
Kestrel Resources - M&M ARC Claims, Soil Data
. . . . . . . . . . . . . . . . . . . . . . . . . . . . . . . . . . . . . . . . . . . . . . . . . . . . . . . . . . . . . . . . . . . . . . . . SUMMARY STATISTICS and HISTOGRAM LOGARITHMIC VALUES
Variable = Zn ppm Unit = N = 147
Mean = 2.1063 Min = 1.6128 1st Quartile = 2.0086 Std. Dev. = 0.1738 Max = 2.8932 Median = 2.0792
cv % = 8.2505 Skewness = 1.2454 3rd Quartile = 2.1896
Anti-Log Mean = 127.730 Anti-Log Std. Dev. : ( - ) 85.607 (+ ) 190.578
........................................................................ % c u m %
0.00 0.34 0.68 1.01 0.00 1.01 0.68 1.69 0.68 2.36 3.40 5.74 6.12 11.82
14.29 26.01 21.77 47.64 15.65 63.18 12.93 76.01 9.52 85.47 4.76 90.20 3.40 93.58 2.04 95.61 2.04 97.64 0.00 97.64 0.00 97.64 0.00 97.64 0.00 97.64 1.36 98.99 0.00 98.99 0.68 99.66
----- ----- antilog
38.221 43.982 50.611 58.239 67.017 77.119 88.743 102.119 117.511 135.223 155.605 179.059 206.048 237.105 272.843 313.968 361.292 415.748 478.413 550.523 633.502 728.988 838.867
-------- cls int
1.5823 1.6433 1.7042 1.7652 1.8262 1.8872 1.9481 2.0091 2.0701 2.1311 2.1920 2.2530 2.3140 2.3749 2.4359 2.4969 2.5579 2.6188 2.6798 2.7408 2.8017 2.8627 2.9237
------- *
* * **** ****** *************** . . . . . . . . . . . . . . . . . . . . . . . **************** ************* ********** ***** **** ** **
*
*
. . . . . . . . . . . . . . . . . . . . . . . . . . . . . . . . . . . . . . . . . . . . . . . . . . . . . . . . . . . . . . . . . . . . . . . .
I I I 1 I I I 1 1 I I I 1 1 I I I I I
Kestrel Resources - M&M ARC Claims, Stream Sedim
. . . . . . . . . . . . . . . . . . . . . . . . . . . . . . . . . . . . . . . . . . . . . . . . . . . . . . . . . . . . . . . . . . . . . . . . SUMMARY STATISTICS and HISTOGRAM LOGARITHMIC VALUES
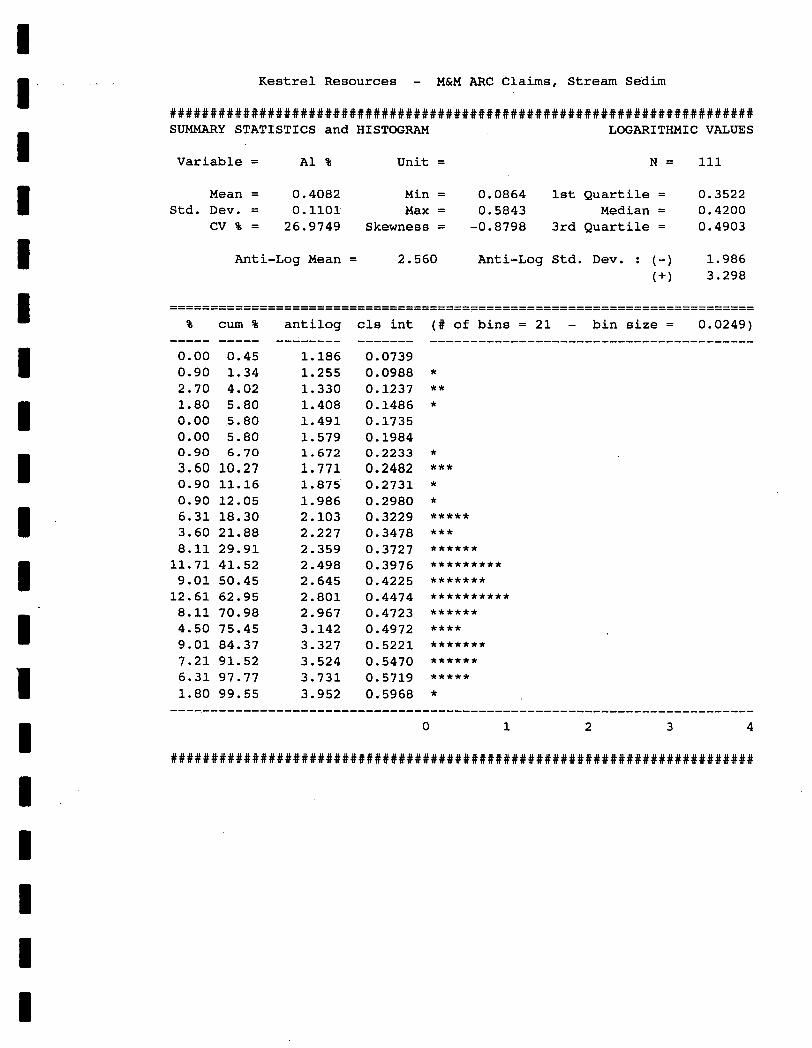
Variable = A 1 % Unit = N = 111
Mean = 0.4082 Min = 0.0864 1st Quartile = 0.3522 Std. Dev. = 0.1101 Max = 0.5843 Median = 0.4200
CV % = 26.9749 Skewness = -0.8798 3rd Quartile = 0.4903
Anti-Log Mean = 2.560 Anti-Log Std. Dev. : ( - ) 1.986 ( + I 3.298
-----------_______------------------------------------------------------ -----------_____-_------------------------------------------------------ % cum % antilog cls int ( # of bins = 21 - bin size = 0.0249) ----- ----- -------- ------- ........................................ 0.00 0.45 1.186 0.0739 0.90 1.34 1.255 0.0988 * 2.70 4.02 1.330 0.1237 ** 1.80 5.80 1.408 0.1486 * 0.00 5.80 1.491 0.1735 0.00 5.80 1.579 0.1984 0.90 6.70 1.672 0.2233 * 3.60 10.27 1.771 0.2482 *** 0.90 11.16 1.875 0.2731 * 0.90 12.05 1.986 0.2980 * 6.31 18.30 2.103 0.3229 ***** 3.60 21.88 2.227 0.3478 *** 8.11 29.91 2.359 0.3727 ******
9.01 50.45 2.645 0.4225 *******
8.11 70.98 2.967 0.4723 ****** 4.50 75.45 3.142 0.4972 **** 9.01 84.37 3.327 0.5221 ******* 7.21 91.52 3.524 0.5470 ****** 6.31 97.77 3.731 0.5719 ***** 1.80 99.55 3.952 0.5968 *
11.71 41.52 2.498 0.3976 *********
12.61 62.95 2.801 0.4474 **********
........................................................................ 0 1 2 3 4
. . . . . . . . . . . . . . . . . . . . . . . . . . . . . . . . . . . . . . . . . . . . . . . . . . . . . . . . . . . . . . . . . . . . . . . .

I I I 0 .coo
0.Y80
0 . 3 6 0
0.2)a
0 . 12c
0 .OO(
K e s e r e l Resources - H&ti ARC Clr ins , S t r e a n S e d i n
. . . . . . . . . . . . . . . . I I I I I I l l I I I I I I I I I I I
99 9% 95 $5 70 5 0 30 15 5 2 1
PERCENT
USERS UISUAL
PARRHETER ESTIHRTES

I I i I 1 I I I 1 1 1 I 1 I 1 I I I I
K e s t r e l R e s o u r c e s - M&M ARC C l a i m s , S t r e a m sedim
. . . . . . . . . . . . . . . . . . . . . . . . . . . . . . . . . . . . . . . . . . . . . . . . . . . . . . . . . . . . . . . . . . . . . . . . SUMMARY STATISTICS and HISTOGRAM ARITHMETIC VALUES
N = 110 V a r i a b l e = As ppm U n i t =
Mean = 16.418 Min = 3.000 1st Q u a r t i l e = 11.000 16.000
cv % = 40.766 S k e w n e s s = 0.304 3rd Quartile = 22.000 Std . D e v . = 6.693 M a x = 32.000 Median =
----- ----- -------- ........................................ 0.00 0.45 2.275 1.82 2.25 3.725 * 0.91 3.15 5.175 * 1.82 4.95 6.625 * 6.36 11.26 8.075 ***** 5.45 16.67 9.525 **** 6.36 22.97 10.975 ***** 7.27 30.18 12.425 ****** 6.36 36.49 13.875 ***** 10.00 46.40 15.325 ******** 10.91 57.21 16.775 ******** 8.18 65.32 ' 18.225 ****** 4.55 69.82 19.675 **** 3.64 73.42 21.125 *** 8.18 81.53 22.575 ****** 3.64 85.14 24.025 *** 3.64 88.74 25.475 *** 1.82 90.54 26.925 * 3.64 94.14 28.375 *** 0.91 95.05 29.825 * 3.64 98.65 31.275 *** 0.91 99.55 32.725 *
--------------------________^___________--------------------------------
0 1 2 3 4
. . . . . . . . . . . . . . . . . . . . . . . . . . . . . . . . . . . . . . . . . . . . . . . . . . . . . . . . . . . . . . . . . . . . . . . .

I I I I I I 1 i 1 I I I I I I I I I I
Kestrel Resources - MbiM ARC Claims, Stream sedim
. . . . . . . . . . . . . . . . . . . . . . . . . . . . . . . . . . . . . . . . . . . . . . . . . . . . . . . . . . . . . . . . . . . . . . . . SUMMARY STATISTICS and HISTOGRAM ARITHMETIC VALUES
Variable = Ba-ppm Unit = N = 111
Mean = 142.532 Min = 51.000 1st Quartile = 95.000 Std. Dev. = 56.077 M a x = 283.000 Median = 134.000
W % = 39.343 Skewness = 0.403 3rd Quartile = 184.000
% cum %
0.00 0.45 0.90 1.34 5.41 6.70 8.11 14.73 7.21 21.88 5.41 27.23 9.01 36.16 9.01 45.09 3.60 48.66 5.41 54.02 5.41 59.38 4.50 63.84 6.31 70.09 8.11 78.12 4.50 82.59 4.50 87.05 4.50 91.52 0.90 92.41 2.70 95.09 0.90 95.98 2.70 98.66 0.00 98.66 0.90 99.55
----- ----- cls int
45.476 56.524 67.571 78.619 89.667 100.714 111.762 122.810 133.857 144.905 155.952 167.000 178.048 189.095 200.143 211.190 222.238 233.286 244.333 255.381 266.429 277.476 288.524
--------
* **** ****** ****** **** ******* ******* *** **** **** **** ***** ****** **** **** **** * ** * **
*
. . . . . . . . . . . . . . . . . . . . . . . . . . . . . . . . . . . . . . . . . . . . . . . . . . . . . . . . . . . . . . . . . . . . . . . .

I I I I I I I I I I I I 1
Kestrel Resources - M&M ARC C l a i m s , Stream Sedim
. . . . . . . . . . . . . . . . . . . . . . . . . . . . . . . . . . . . . . . . . . . . . . . . . . . . . . . . . . . . . . . . . . . . . . . . SUMMARY STATISTICS and HISTOGRAM ARITHMETIC VALUES
N = 109 Variable = Ca % Unit =
Mean = 0.517 Min = 0.190 1st Quartile = 0.380 Std. Dev. = 0.188 Max = 1.220 Median = 0.495
cv % = 36.319 Skewness = 1.359 3rd Quartile = 0.592
% cum %
0.00 0.45 0.92 1.36 1.83 3.18 4.59 7.73 16.51 24.09 7.34 31.36 10.09 41.36 20.18 61.36 9.17 70.45 11-01 81.36
4.59 91.36 0.92 92.27 0.00 92.27 0.00 92.27 1.83 94.09 1.83 95.91 1.83 97.73 0.00 97.73 0.00 97.73 0.92 98.64 0.92 99.55
----- -----
5.50 86.82
cls int
0.164 0.216 0.267 0.319 0.370 0.422 0.473 0.525 0.576 0.628 0.679 0.731 0.782 0.834 0.885 0.937 0.988 1.040 1.091 1.143 1.194 1.246
-------- * * **** ************* ****** ******** **************** ******* ******** **** **** *
* * *
* *
. . . . . . . . . . . . . . . . . . . . . . . . . . . . . . . . . . . . . . . . . . . . . . . . . . . . . . . . . . . . . . . . . . . . . . . .
I I I I I I

I I I
. . . . . . . . . . . . . . . . . . . .
K t e W e l Reeourcec - H&H ARC C l o i n e , S t rean Stdin
I I i En .
I : : : : F
99 98 95 85 70 50 30 15 5 2 1 PERCENl
1 0 . + 7 5 0.143 92 .1
2 1 . 0 0 0 0 .120 7.:
USERS U I S U I L
PARAHETER ESTIHATES

I I I I I I I I I I I I I 1 I I I I I
Kestrel Resources - M&M ARC Claims, Stream Sedim
. . . . . . . . . . . . . . . . . . . . . . . . . . . . . . . . . . . . . . . . . . . . . . . . . . . . . . . . . . . . . . . . . . . . . . . . SUMMARY STATISTICS and HISTOGRAM ARITHMETIC VALUES
Variable.= Cr ppm Unit = N = 111
Mean = 29.919 Min = 8.000 1st Quartile = 17.250 Std. Dev. = 13.327 M a x = 65.000 Median = 32.000
cv % = 44.545 Skewness = 0.131 3rd Quartile = 40.000
% C u m %
0.00 0.45 4.50 4.91 5.41 10.27 9.91 20.09 4.50 24.55 8.11 32.59 4.50 37.05 1.80 38.84 1.80 40.63 7.21 47.77 6.31 54.02 8.11 62.05 11.71 73.66 5.41 79.02 9.91 88.84 2.70 91.52 4.50 95.98 0.90 96.87 0.00 96.87 0.00 96.87 0.00 96.87 1.80 98.66 0.90 99.55
----- ----- cls int
6.643 9.357 12.071 14.786 17.500 20.214 22.929 25.643 28.357 31.071 33.786 36.500 39.214 41.929 44.643 47.357 50.071 52.786 55.500 58.214 60.929 63.643 66.357
-------- **** **** ******** **** ****** **** * * ****** ***** ****** ********* **** ******** ** **** *
* *
. . . . . . . . . . . . . . . . . . . . . . . . . . . . . . . . . . . . . . . . . . . . . . . . . . . . . . . . . . . . . . . . . . . . . . . .
Kestrel Resources - H&H ARC (lains, Strean Sedin
. . . .
. . . .
. . . . . . . . . . . .
. . . . . . . . . . . . . . . . . .
8 0 .OO
6 5 . 0 0
5 8 . 0 0
3 2 . 0 0
1 6 . 0 0
0.00
. . . . . . . . . . . . . . . . I I I I I l l 1 I I I I I I I I I I I
99 98 95 85 74 50 30 15 5 2 1 PERCENT
USERS UISUAL PARAHETER ESTJHATES
I I I I I I I I I I I I I I I I I I I
Kestrel Resources - M&M ARC Claims, Stream Sedim
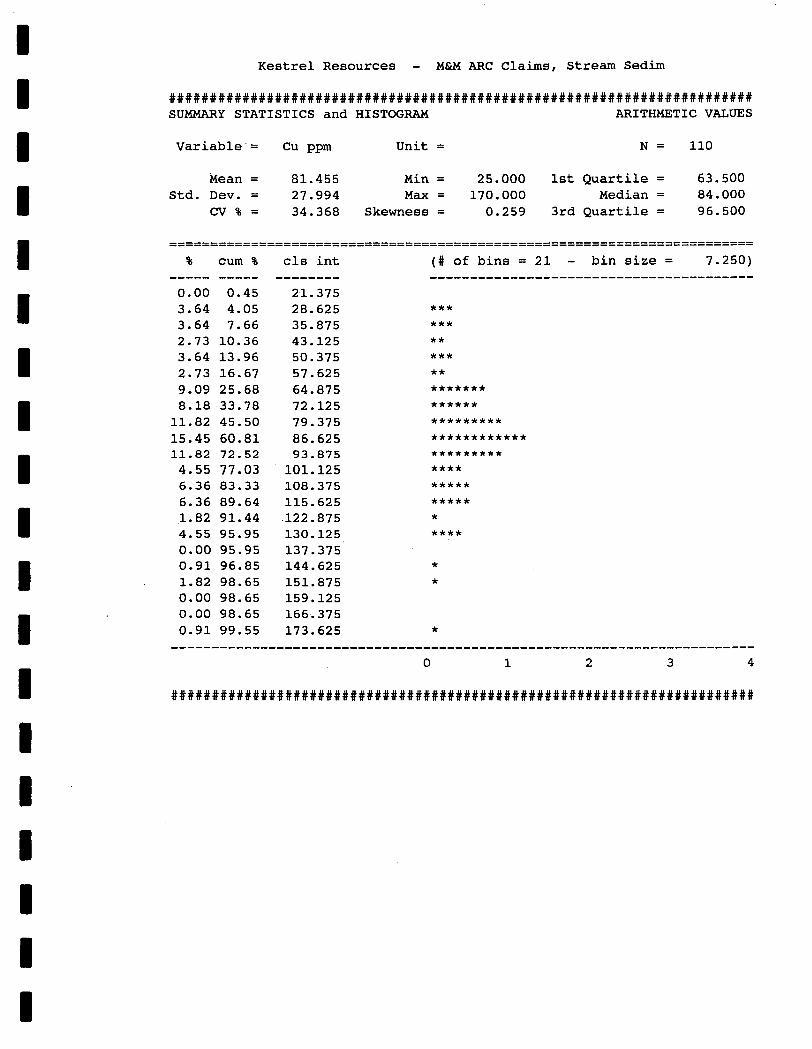
. . . . . . . . . . . . . . . . . . . . . . . . . . . . . . . . . . . . . . . . . . . . . . . . . . . . . . . . . . . . . . . . . . . . . . . . SUMMARY STATISTICS and HISTOGRAM ARITHMETIC VALUES
Variable = Cu ppm Unit = N = 110
Mean = 81.455 Min = 25.000 1st Quartile = 63.500 84.000
c v % = 34.368 Skewness = 0.259 3rd Quartile = 96.500 Std. Dev. = 27.994 M a x = 170.000 Median =
% c u m %
0.00 0.45 3.64 4.05 3.64 7.66 2.73 10.36 3.64 13.96 2.73 16.67 9.09 25.68 8.18 33.78 11.82 45.50 15.45 60.81 11.82 72.52 4.55 77.03 6.36 83.33 6.36 89.64 1.82 91.44 4.55 95.95 0.00 95.95 0.91 96.85 1.82 98.65 0.00 98.65 0.00 98.65 0.91 99.55
----- cls int
21.375 28.625 35.875 43.125 50.375 57.625 64.875 72.125 79.375 86.625 93.875 101.125 108.375 115.625 122.875 130.125 137.375 144.625 151.875 159.125 166.375 173.625
-------- *** *** ** *** ** ******* ****** ********* ************ ********* **** ***** ***** * ****
* *
*
. . . . . . . . . . . . . . . . . . . . . . . . . . . . . . . . . . . . . . . . . . . . . . . . . . . . . . . . . . . . . . . . . . . . . . . .

200 * 00
1 6 0 . 0 0
1 2 0 . 0 0
8 0 . 0 0
4 0 . 0 0
0 .00
Kestrel Resources - HhH ARC C l r i n s , S t r e o n Sedin
. . . . * . . . * . . . . . . . . . . . . . . . . . . . a . k. . . I
. . . . . . . . i . . A :-el?-% : : : k
. . . . . . I . . . . . . . . . . . . . I I I I I I I I 1 1 . 1 I I I I I I I I
99 98 9 5 85 70 5 0 30 15 5 2 4 PERCENT
‘ I 2 3
POP. - - - - I 2
3
3 1 . 4 5 8 5 . 8 3 2 9 . 1
75 .+94 1 4 . 8 5 0 45.5
9 6 . 0 8 ) 2q.702 45 .1
INCOHPLETE ITERATION
PARAHETER ESTIHATES

I I I I I I I I I I I D I 1 I I I i R
0.00 0.45 0.90 1.34 0.00 1.34 0.00 1.34 1.80 3.13 3.60 6.70 10.81 17.41 7.21 24.55 18.02 42.41 15.32 57.59 11.71 69.20 2.70 71.88 8.11 79.91 8.11 87.95 3.60 91.52 0.00 91.52 2.70 94.20 2.70 96.87 1.80 98.66 0.00 98.66 0.00 98.66 0.00 98.66, 0.90 99.55
2.613 2.787 2.962 3.137 3.312 3.486 3.661 3.836 4.011 4.185 4.360 4.535 4.710 4.885 5.059 5.234 5.409 5.584 5.758 5.933 6.108 6.283 6.457
*
* *** ******** ****** ************** ************ ********* ** ****** ****** ***
** ** *
*
. . . . . . . . . . . . . . . . . . . . . . . . . . . . . . . . . . . . . . . . . . . . . . . . . . . . . . . . . . . . . . . . . . . . . . . .

~~
K e s t r e l Resources - H&H ARC C l a i n c , S t rcan Sedin
. . . . . . . . . . . . . . . . . . . . * . . . . . . . . . . .
. . . * . . . . . . . . . . 2 .00 I I I I I I I I I I I I I I I I I I I I
99 98 95 85 70 50 30 15 5 2 4 PERCENT
USERS UISUAL
PARAHETER ESTIHATES

I I I I I I I I I I I I I I I I I I I
% cum %
0.00 0.45 0.90 1.34 0.90 2.23 0.90 3.13 2.70 5.80 3.60 9.38 8.11 17.41 11.71 29.02 18.02 46.88 12.61 59.38 9-01 68.30 7.21 75.45 5.41 80.80 3.60 84.37 4.50 88.84 4.50 93.30 2.70 95.98 0.90 96.87 0.90 97.77 0.00 97.77 0.90 98.66 0.00 98.66 0.90 99.55
----- ----- c l s i n t
0.631 0.749 0.867 0.985 1.103 1.221 1.340 1.458 1.576 1.694 1.812 1.930 2.048 2.166 2.284 2.402 2.520 2.639 2.757 2.875 2.993 3.111 3.229
-------- * * * ** *** ****** ********* ************** ********** ******* ****** **** *** **** **** ** * *
*
*
. . . . . . . . . . . . . . . . . . . . . . . . . . . . . . . . . . . . . . . . . . . . . . . . . . . . . . . . . . . . . . . . . . . . . . . .

I I I I 1 I I I I 1 I -I II I 'I I 'I -1 I
K e s t r e l Resources - HtH ARC C la ins , S t r e o n Sedin
USERS UISUAL
PARAHETER ESTIHATES

I 1 I I I I 1 I I u I I
Kestrel Resources - M&M ARC Claims, Stream Sedim
. . . . . . . . . . . . . . . . . . . . . . . . . . . . . . . . . . . . . . . . . . . . . . . . . . . . . . . . . . . . . . . . . . . . . . . . SUMMARY STATISTICS and HISTOGRAM LOGARITHMIC VA%UES
Variable. = Mn ppm Unit = N = 110
Mean = 3.0335 Min = 2.7694 1st Quartile = 2.9595 Std. Dev. = 0.1160 M a x = 3.4417 Median = 3.0154
cv % = 3.8252 Skewness = 0.5936 3rd Quartile = 3.1028
Anti-Log Mean = 1080.208 Anti-Log Std. Dev. : ( - ) 826.934 (+) 1411.054
% cum %
0.00 0.45 0.91 1.35 0.91 2.25 1.82 4.05 3.64 7.66 2.73 10.36 6.36 16.67 8.18 24.77 12.73 37.39 13.64 50.90 7.27 58.11 5.45 63.51 11.82 75.23 9.09 84.23 3.64 87.84 3.64 91.44 3.64 95.05 0.91 95.95 0.91 96.85 0.00 96.85 0.91 97.75 0.00 97.75 0.91 98.65 0.00 98.65 0.91 99.55
----- ----- antilog
568.541 608.125 650.465 695.753 744.195 796.009 851.430 910.710 974.118 1041.940 1114.484 1192.079 1275.076 1363.853 1458.810 1560.378 1669.018 1785.222 1909.517 2042.465 2184.670 2336.776 2499.412 2673.496 2859.636
-------- c ls int ------- 2.7548 2.7840 2.8132 2.8425 2.8717 2.9009 2.9301 2.9594 2.9886 3.0178 3.0471 3.0763 3.1055 3.1348 3.1640 3.1932 3.2225 3.2517 3.2809 3.3102 3.3394 3.3686 3.3978 3.4271 3.4563
* * * *** ** ***** ****** ********** *********** ****** **** ********* ******* *** *** *** * *
*
*
*
. . . . . . . . . . . . . . . . . . . . . . . . . . . . . . . . . . . . . . . . . . . . . . . . . . . . . . . . . . . . . . . . . . . . . . . .

3.600
3 . Y O O
3 . 2 0 0
3 . 0 0 0
2 .so0
2.600
Kestrel Resources - H t H RRC C l a i n r , S t r e w S t d i n
. . . . : : I
. . . . . . . . . . . . . . . . . . . . . . . . . . . . I I I I I I I I I I I I I I I 1 I I I
99 98 95 85 70 50 30 15 5 2 4 PERCENT
USERS UISUAL PARAHETER ESTIHATES

I I I I I I 1 N I I I I 1 1 I I I I 1
Kestrel Resources - M&M ARC Claims, Stream Sedim
. . . . . . . . . . . . . . . . . . . . . . . . . . . . . . . . . . . . . . . . . . . . . . . . . . . . . . . . . . . . . . . . . . . . . . . . SUMMARY STATISTICS and HISTOGRAM ARITHMETIC VALUES
Variable = Ni ppm Unit = N = 111
18.250 Mean = 22.270 Min = 9.000 1st Quartile = Std. Dev. = 5.555 Max = 36.000 Median = 22.000
c v % = 24.942 Skewness = 0.270 3rd Quartile = 26.000
........................................................................ ........................................................................ % cum % cls int ( # of bins = 18 - bin size = 1.588) ----- ----- -------- ........................................ 0.00 0.45 8.206 0.90 1.34 9.794 * 0.00 1.34 11.382 0.90 2.23 12.971 * 5.41 7.59 14.559 **** 9.01 16.52 16.147 ******* 2.70 19.20 17.735 ** 9.01 28.13 19.324 ******* 12.61 40.63 20.912 ********** 17.12 57.59 22.500 ************* 10.81 68.30 24.088 ******** 4.50 72.77 25.676 **** 9.91 82.59 27.265 ******** 2.70 85.27 28.853 ** 3.60 88.84 30.441 *** 6.31 95.09 32.029 ***** 0.90 95.98 33.618 * 2.70 98.66 35.206 ** 0.90 99.55 36.794 *
........................................................................ 0 1 2 3 4
. . . . . . . . . . . . . . . . . . . . . . . . . . . . . . . . . . . . . . . . . . . . . . . . . . . . . . . . . . . . . . . . . . . . . . . .

I 1 I I I I I 1 B I I I I 1 I I I I 1
Kestrel Resources - M&M ARC Claims, Stream Sedim
. . . . . . . . . . . . . . . . . . . . . . . . . . . . . . . . . . . . . . . . . . . . . . . . . . . . . . . . . . . . . . . . . . . . . . . . SUMMARY STATISTICS and HISTOGRAM ARITHMETIC VALUES
Variable = P % Unit = N = 111
Mean = 0.116 Min = 0.040 1st Quartile = 0.060 Std. Dev. = 0.080 Max = 0.410 Median = 0.080
.cv % = 69.185 Skewness = 1.548 3rd Quartile = 0.150
% cum %
0.00 0.45 4.50 4.91 30.63 35.27 16.22 51.34 5.41 56.70 6.31 62.95 6.31 69.20 2.70 71.88 3.60 75.45 4.50 79.91 3.60 83.48 5.41 88.84 3.60 92.41 0.90 93.30 0.90 94.20 0.90 95.09 0.00 95.09 0.00 95.09 0.90 95.98 0.90 96.87 0.90 97.77 0.90 98.66 0.00 98.66 0.90 99.55
----- ----- c l s int
0.032 0.048 0.065 0.082 0.099 0.116 0.133 0.149 0.166 0.183 0.200 0.217 0.233 0.250 0.267 0.284 0.301 0.318 0.334 0.351 0.368 0.385 0.402 0.418
- - - - - - - - **** . . . . . . . . . . . . . . . . . . . . . . . . ************* **** ***** ***** ** *** **** *** **** *** * * *
*
. . . . . . . . . . . . . . . . . . . . . . . . . . . . . . . . . . . . . . . . . . . . . . . . . . . . . . . . . . . . . . . . . . . . . . . .

I I
Kestrel Reoourceo - tl&n ARC Claino, Strean Sedin
0 60 .E. I I . . 9 . . . . .
. . . . * . . . . .
99 98 95 85 70 50 30 15 5 2 4
PERCENT USERS UISUAL
PARAHETER ESTIHATES
Kestrel Resources - M&M ARC Claims, Stream Sedim
. . . . . . . . . . . . . . . . . . . . . . . . . . . . . . . . . . . . . . . . . . . . . . . . . . . . . . . . . . . . . . . . . . . . . . . . SUMMARY STATISTICS and HISTOGRAM ARITHMETIC VALUES
Variable = Pb ppm Unit = N = 109
Mean = 35.312 Min = 18.000 1st Quartile = 31.000 Std. Dev. = 7.064 Max = 57.000 Median = 35.000
c v % = 20.005 Skewness = 0.405 3rd Quartile = 39.000
% cum %
0.00 0.45 0.92 1.36 1.83 3.18 1.83 5.00 4.59 9.55 5.50 15.00 7.34 22.27 13.76 35.91 18.35 54.09 12.84 66.82 8.26 75.00 12.84 87.73 4.59 92.27 1.83 94.09 1.83 95.91 0.92 96.82 0.00 96.82 1.83 98.64 0.92 99.55
----- ----- c ls int
16.853 19.147 21.441 23.735 26.029 28.324 30.618 32.912 35.206 37.500 39.794 42.088 44.382 46.676 48.971 51.265 53.559 55.853 58.147
- - - - - - - - * * * **** **** ****** *********** ************** ********** ****** ********** **** * * *
* *
. . . . . . . . . . . . . . . . . . . . . . . . . . . . . . . . . . . . . . . . . . . . . . . . . . . . . . . . . . . . . . . . . . . . . . . .

I I I 1 I i I I I I 1 i 1 I i R I I I
% cum %
0.00 0.45 5.41 5.80 13.51 19.20 9.91 29.02 21.62 50.45 19.82 70.09 7.21 77.23 4.50 81.70 4.50 86.16 5.41 91.52 3.60 95.09 0.90 95.98 1.80 97.77 0.00 97.77 0.00 97.77 0.00 97.77 0.00 97.77 0.90 98.66 0.00 98.66 0.00 98.66 0.00 98.66 0.00 98.66 0.90 99.55
----- ----- cls int
9.833 18.167 26.500 34.833 43.167 51.500 59.833 68.167 76.500 84.833 93.167 101.500 109.833 118.167 126.500 134.833 143.167 151.500 159.833 168.167 176.500 184.833 193.167
--------
**** *********** ******** ***************** **************** ****** **** **** **** *** * *
*
*
. . . . . . . . . . . . . . . . . . . . . . . . . . . . . . . . . . . . . . . . . . . . . . . . . . . . . . . . . . . . . . . . . . . . . . . .

. .. . Kestrel Resources - M&M ARC Claims, Stream Sedim
. . . . . . . . . . . . . . . . . . . . . . . . . . . . . . . . . . . . . . . . . . . . . . . . . . . . . . . . . . . . . . . . . . . . . . . . SUMMARY STATISTICS and HISTOGRAM LOGARITHMIC VALUES
I ~ - - -
I Variable = Sr ppm Unit = N = 111
1 I I I I I 1 I I I I I I
Mean = 1.6309 Min = 1.1461 1st Quartile = 1.4948 Std. Dev. = 0.2137 Max = 2.2765 Median = 1.6335
CV % = 13.1006 Skewness = 0.1420 3rd Quartile = 1.7520
Anti-Log Mean = 42.750 Anti-Log Std. Dev. : ( - ) 26.138 (+) 69.920
----- ----- 0.00 0.45 0.90 1.34 0.90 2.23 4.50 6.70 4.50 11.16 2.70 13.84 7.21 20.98 3.60 24.55 5.41 29.91 9.91 39.73 19.82 59.38 10.81 70.09 6.31 76.34 4.50 80.80 3.60 84.37 7.21 91.52 4.50 95.98 0.90 96.87 0.90 97.77 0.00 97.77 0.90 98.66 0.00 98.66 0.90 99.55
antilog
13.159 14.895 16.860 19.085 21.603 24.454 27.680 31.332 35.467 40.146 45.443 51.439 58.226 65.909 74.606 84.449 95.592 108.205 122.482 138.643 156.936 177.643 201.083
-------- c l s int
1.1192 1.1730 1.2269 1.2807 1.3345 1.3883 1.4422 1.4960 1.5498 1.6036 1.6575 1.7113 1.7651 1.8189 1.8728 1.9266 1.9804 2.0342 2.0881 2.1419 2.1957 2.2495 2.3034
-------
* * **** **** ** ****** *** **** ******** **************** ******** ***** **** *** ****** **** * *
*
*
. . . . . . . . . . . . . . . . . . . . . . . . . . . . . . . . . . . . . . . . . . . . . . . . . . . . . . . . . . . . . . . . . . . . . . . .
I I I I I I I I I I I I I I I I I I I
Kestrel Resources - M&M ARC Claims, Stream Sedim
. . . . . . . . . . . . . . . . . . . . . . . . . . . . . . . . . . . . . . . . . . . . . . . . . . . . . . . . . . . . . . . . . . . . . . . . SUMMARY STATISTICS and HISTOGRAM LOGARITHMIC VALUES
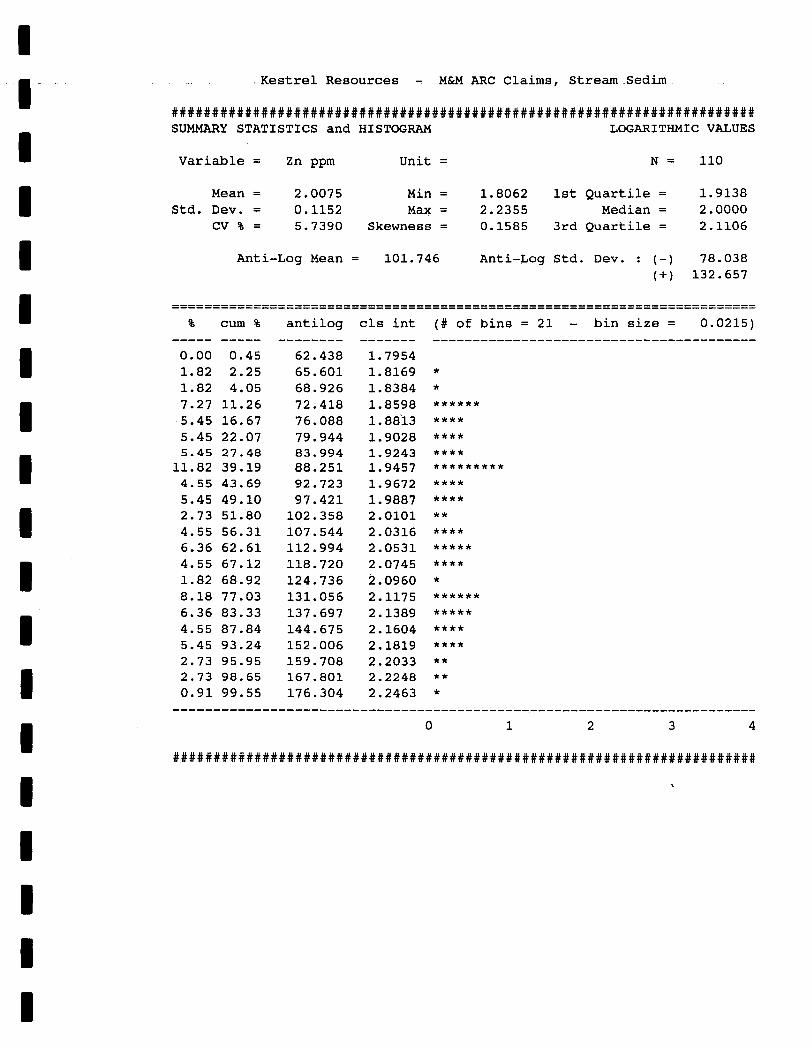
Variable = Zn ppm Unit = N = 110
Mean = 2.0075 Min = 1.8062 1st Quartile = 1.9138 Std. Dev. = 0.1152 Max = 2.2355 Median = 2.0000
cv % = 5.7390 Skewness = 0.1585 3rd Quartile = 2.1106
Anti-Log Mean = 101.746 Anti-Log Std. Dev. : ( - ) 78.038 (+) 132.657
........................................................................ ........................................................................ % cum %
0.00 0.45 1.82 2.25 1.82 4.05 7.27 11.26 5.45 16.67 5.45 22.07
11.82 39.19 4.55 43.69 5.45 49.10 2.73 51.80 4.55 56.31 6.36 62.61 4.55 67.12 1.82 68.92 8.18 77.03 6.36 83.33 4.55 87.84 5.45 93.24 2.73 95.95 2.73 98.65 0.91 99.55
----- -----
5.45 27-48
antilog
62.438 65.601 68.926 72.418 76.088 79.944 83.994 88.251 92.723 97.421 102.358 107.544 112.994 118.720 124.736 131.056 137.697 144.675 152.006 159.708 167.801 176.304
- - - - - - - - cls int
1.7954 1.8169 1.8384 1.8598 1.8813 1.9028 1.9243 1.9457 1.9672 1.9887 2.0101 2.0316 2.0531 2.0745 2.0960 2.1175 2.1389 2.1604 2.1819 2.2033 2.2248 2.2463
-------
* * ****** **** **** **** ********* **** **** ** **** ***** **** * ****** ***** **** **** * * * * *
. . . . . . . . . . . . . . . . . . . . . . . . . . . . . . . . . . . . . . . . . . . . . . . . . . . . . . . . . . . . . . . . . . . . . . . .

Kestrel Resource$ - H&H ARC C I p i H $ , S t r e o n Stdin
. . . . . . . . . . . . . . . . . . . .
. . . . * . . . . . . . . . I . . . . I
I . . . .7
. . . . . . . . . . . . . . I .
I t :
. .
. . . . 9 . I . I
: : I . . . . . . 1.600 I I I 1 I I l l I I I I I I I I I I I
99 98 95 85 70 5 0 30 15 5 2 4
PERCENT
CLASS INTERUAL HL PARAHETER ESTIHATES

I I I I I I I I I I I I I I I I I I I
A P P E N D I X I 1
ANALYSIS METHOD AND ASSAY CERTIFICATES

I I I I I I I I I I I I 1 I I I I I I
VANGEOCHEM SAMPLE ANALYSIS DESCRIPTION
T h e l i thogeochemica l s amples were properly bagged , desc r ibed and labe l led i n t h e
f ie ld . L a t e r , t h e y w e r e sh ipped by a i r and ground weight t o Vangeochem L a b L t d .
i n Vancouver , B.C. f o r analysis under t h e supervis ion of professional assayers . All
of the samples w e r e ana lyzed fo r gold, using f i r e assay a n d a t o m i c absorp t ion
procedures , and f o r a 25 -e l emen t su i t e by induct ive ly coupled argon p lasma (ICAP)
m e t hods.
A t Vangeochern L a b Ltd., e a c h rock s a m p l e w a s ground t o -100 m e s h a n d a
0.5 gram pulp was d iges ted wi th 5 mil l i l i t res of 3:2:1 hydrochlor ic a c i d t o n i t r i c
a c i d t o w a t e r a t 95OC f o r 90 minu tes , a n d then d i lu ted t o 10 mi l l i l i t res w i t h w a t e r . T h e resu l t ing p r e c i p i t a t e was then ana lyzed by ICAP m e t h o d s for: silver,
a luminum, a r sen ic , bar ium, b ismuth , c a l c i u m , c a d m i u m , c o b a l t , c h r o m i u m , coppe r ,
i ron , po tass ium, magnes ium, manganese , molybdenum, sodium, nickel , phosphorus,
l ead , an t imony , t i n , s t r o n t i u m , uran ium, tungs t en a n d zinc.
A 20.0 t o 30.0 g ram pulp w a s sp l i t f r o m e a c h of t h e ground samples , mixed wi th
f lux , fu sed a t 1,900°F t o f o r m a but ton , a n d subsequent ly d i g e s t e d i n a n a q u a r e g i a
solution. This solut ion was t h e n ana lyzed f o r gold by a Tech t ron m o d e l A A 5
A t o m i c Absorpt ion S p e c t r o p h o t o m e t e r w i t h a gold hollow c a t h o d e l amp .

MAIN OFFICE BRANCH OFFICES PASADENA, NFLD
BATHURST N B MISSISSAUGA, ONT
RENO NEVADA U S A I 1988 TRIUMPH ST I eGc VwGEOCHEM LIMITED I VANCOUVER, B C V5L 1K5
0 (604) 251-5656 e FAX (604) 254 5717 m
I REPDFT NUHSER: 830753 6A JOB NUMBER: 840753 RANGEX SERVICES LTD. PAGE 1 OF 3
I I I I I I I
SAWPLE #
0545! 05452 05453 05454 05455
05456 05457 05458 05451 05460
0546 1 05462 05463 05464 05465
O U 6 05626 05627
05629 056x1
05630. 05631 05632 05633 05634
05635 !j5626 0563 05638 05639
05645 05646 0564? 05648
Au
5 !0 15 20 10
10 20 15
0
0 0 5 0 5
0 10 5
nd nd
VJb
C
nd 15 15 15 10
!5 io 10 10 nd
10
5 !5
C
DETECTIOfd L I H I T nd = none detected
c
- - 3 n o t analysed is 3 insufficient saaple

I MAIN OFFICE BRANCH OFFICES ' UGC I
PASADENA, NFLD BATHURST, N B
MISSISSAUGA, ONT RENO, NEVADA. U S A
I 1988 TRIUMPH ST VANCOUVER, B C V ~ L 1 ~ 5 4 VANGEOCHEM LAB LIMITED
0 (604) 251-5656 0 FAX (604) 254-571 7
I I -Am- I
I REPORT NUKBER: 890753 GA JOB NUMBER: 890753 RAWGEX SERVICES LTD. PAGE 2 OF 3
I I I I i I I u
SAHPLE I
05644 05650 0565 1 05652 05653
05654 05655 05656 05657 05656
05659 05660 05661
05662 05663
05664
05952 0 6 0 6 06054
0595T
Au
nd 20 1 0 20 30
PPb
20 25 I0 nd 15
10 15 20 20 5
nd 15 10 10
C
06055 10 06056 nd 06057 5 06058 5 06059
06060 2 0 l)6!jlj 1 15 106062 nd (16(!65 :L'
e
I C
4r <li,<164 IJ
O6065 nd 06066 10
36076 f 0 06077 10
06078. 5 06<17'j 15 rJ6(IB$ 20 I;6iiti! 5
DETECTION LIt.tii 5 nd none detected - - = not analysed is = insufficient saaplE
0606L 5

I ' I I MAIN OFFICE BRANCH OFFICES
PASADENA, NFLD BATHURST, N B
MISSISSAUGA, ONT RENO NEVADA U S A
i 1988 TRIUMPH ST VwGEOCH E M LIMITED VANCOUVER, B C V5L 1 K5 0 (604) 251-5656
0 FAX (604) 254-571 7 i
I
REPORT NUMBER: 830753 6A JOB NUIIBER: 830753 RANGEX SERVICES LTD. PAGE 3 OF 3 I
I 1 I B
11 I I I
SAtiPLE t
06082 06083 06084 06085 06086
06087 06088 06089 0610i 06102
06103 06104 06 1 OS 06106 06107
06108 06103 06110 06111 061 12
i i&ll3
06115 06114
06116 06117
061!8 061 13 06120 06121 06'99
I L L
06123 06124 06125
Au
15 5
nd
15
PPb
C
10 nd 10 15
C
! 5
10 10 1s
C
10 10 5
15 nd
15 10 10 10 15
15 20 15 10 nd
15 5 5
D E T E C T I O N L I # I T 5 nd none detected - - n o t ana!ysed is = insufficient sample

Ph: (604)251-5656 f a x : (604)254-5717
ICAP GEOCHEMICAL A N A L Y S I S
A .5 g r a r sample I S d i g e s t e d w i t h 5 11 of 3:1:2 HCI t o HMO, t o H20 a t 95 OC far 90 i i n u t e s and i s d i l u t e d t o 10 11 v i t h v a t e r . T h i s l e a c h is p a r t i a l for AI, Ea, Ca, Cr, fe , K, Hg, Hn, Ha, P, Pd, P t , Sn, Sr and W.
t ANALYST: REPORT 1: 890753 PA
S a r p l e Number
05451 OS452 05453 05454 05455
RANGEX SERVICES
Ag A I As Ea
0.2 2.31 16 142 0.3 3.41 22 108 0.3 3.05 19 179 0.3 2.55 27 86 0.3 2.57 22 143
P P I 1 P P I P P I
Proj:
B i Ca P P I 1
( 3 0.49 4 1.18
(3 0.73 ( 3 0.28 (3 0.37
Date In: 89110116 Date Out:89/10/26
Cd Co Cr Cu Fe K Hg P P I P P I P P I P P I 1 1 1 0.3 21 13 80 4.30 0.21 1.89 0.1 38 IO 87 5.74 0.36 3.17 0.1 26 12 71 5.51 0.29 2.51 0.3 24 21 109 4.76 0.19 2.36 0.3 25 18 115 4.83 0.21 2.28
Att: K KAY€
Hn no Na Mi P
1210 3 0.01 26 0.20 1237 3 0.01 15 0.36 1410 3 0.01 14 0.34 963 2 0.01 19 0.11
1278 3 0.01 22 0.15
P P I P P I 1 P P I 1
Page 1 o f 3
Sr u w P P I P P I P P I
53 ( 5 (3 82 ( 5 (3 95 ( 5 (3 25 ( 5 (3 46 ( 5 (3
Pb Sb Sn P P I P P I P P I
33 ( 2 ( 2 44 (2 8 40 (2 2 42 (2 (2 44 ( 2 (2
Zn P P I 100 104 109 116 122
05456 05457 05458 05459 05460
0.2 2.78 30 172 (3 0.35 0.5 25 20 113 4.88 0.21 2.42 1348 4 0.01 21 0.14 0.2 2.78 30 173 (3 0.37 0.5 26 20 124 4.99 0.22 2.34 1470 3 0.01 22 0.15 0.1 2.61 27 128 (3 0.63 0.3 24 20 125 4.60 0.24 2.22 1286 3 0.01 23 0.14 0.2 2.67 22 134 (3 0.34 0.3 24 20 118 4.63 0.20 2.34 1314 3 0.01 24 0.12 0.1 2.22 17 116 ( 3 0.28 0.3 22 13 124 4.17 0.17 1.95 1155 2 0.01 14 0.12
0.2 2.48 27 109 ( 3 0.25 0.3 26 18 140 4.82 0.19 2.25 1203 2 0.01 20 0.11 0.1 2.55 31 119 ( 3 0.27 0.3 26 17 148 4.87 0.19 2.26 1249 2 0.01 20 0.12 0.2 2.23 16 117 (3 0.44 0.2 18 21 41 4.55 0.21 1.04 1635 5 0.01 23 0.17 0.1 2.07 16 196 (3 0.62 0.5 19 21 33 6.37 0.31 0.89 5297 11 0.01 20 0.14 0.1 1.76 8 154 (3 0.61 0.1 14 18 33 3.52 0.21 0.82 2471 3 0.07 18 0.12
46 (2 (2 44 (2 (2 40 (2 (2 45 (2 (2 40 (2 (2
48 ( 5 (3 53 ( 5 (3 44 ( 5 (3 37 ( 5 ( 3 28 ( 5 ( 3
128 133 127 132 123
05461 05462 05463 05464 05465
55 (2 (2 50 (2 (2 28 (2 (2 32 (2 (2 23 (2 (2
19 ( 5 (3 20 ( 5 (3 66 ( 5 (3
105 ( 5 (3 93 ( 5 (3
155 163 145 129 116
05466 05626 05627 05628 05629
05630 05631 05632 05633 05634
0.1 1.72 8 66 (3 0.70 0.1 10 16 25 3.15 0.21 0.69 1219 5 0.01 9 0.11 0.2 2.72 25 186 (3 0.53 0.2 23 40 84 3.76 0.20 1.41 978 1 0.01 24 0.06 0.3 2.83 17 130 (3 0.53 0.2 24 38 87 3.84 0.20 1-41 959 2 0.01 22 0.07 0.2 1.99 18 141 (3 0.51 0.1 15 29 52 2.70 0.16 0.99 588 1 0.01 15 0.06 0.2 2.37 29 191 (3 0.51 0.1 19 34 66 3.33 0.18 1,27 783 I 0.01 20 0.06
0.2 2.44 22 163 (3 0.40 0.1 18 32 63 3.27 0.16 1.21 835 1 0.01 20 0.06 0.1 3.59 16 263 (3 0.28 0.2 20 50 49 4.17 0.18 1.45 1461 2 0.01 24 0.12 0.3 3.74 25 88 (3 0.32 0.2 23 49 80 4.05 0.18 1.56 1239 2 0.01 32 0.09 0.3 3.04 23 119 (3 0.44 0.1 21 38 92 3.55 0.18 1.43 621 1 0.01 21 0.06 0.2 3.28 20 92 (3 0.42 0.3 25 42 94 3.97 0.19 1.59 901 2 0.01 26 0.07
20 (2 (2 31 (2 (2 32 (2 (2 23 (2 (2 28 (2 (2
30 (2 (2 39 (2 (2 42 (2 (2 34 (2 (2 39 (2 (2
109 ( 5 (3 39 ( 5 (3 37 (5 (3 37 ( 5 (3 38 ( 5 (3
32 (5 (3 20 ( 5 (3 31 ( 5 (3 39 ( 5 (3 36 ( 5 (3
99 84 81 77 73
76 108 94 85 88
91 72 64 67 70
05635 05636 05637 05638 05639
0.2 2.71 25 106 (3 0.53 0.2 23 34 92 3.68 0.19 1.31 863 2 0.01 22 0.07 0.1 3.27 32 261 (3 0.36 0.1 28 61 149 4.94 0.22 1,85 2765 2 0.01 31 0.05 0.1 2.89 23 159 (3 0.34 0.2 24 62 U 4.41 0.19 1.81 1809 2 0.01 30 0.05 0.2 2.47 22 149 (3 0.34 0.2 21 38 60 4.19 0.18 1.41 1405 2 0.01 25 0.07 0.1 2.78 18 238 (3 0.39 0.2 20 39 59 4 . 2 4 0.19 1,59 1758 2 0.01 24 0.06
36 (2 (2 42 (2 (2 32 (2 (2 32 (2 (2 30 (2 (2
05640 05641 05642 05643 05644
0.1 3.57 15 184 ( 3 0.63 0.3 23 31 102 3.98 0.22 1.71 1156 2 0.01 21 0.07 0.2 2.76 I9 195 (3 0.47 0.3 21 35 64 3.87 0.19 1.64 985 1 0.01 21 0.06 0.1 2.69 14 234 (3 0.39 0.3 I8 31 59 3.97 0.18 1.63 905 1 0.01 18 0.06 0.3 3.84 14 126 (3 0.67 0.2 23 52 107 3.83 0.22 1.89 1155 2 0.01 26 0.07 0.2 2.82 10 162 (3 0.55 0.3 22 40 87 3.54 0.19 1.71 826 (1 0.01 29 0.07
0.1 3.24 I 1 208 (3 0.58 0.2 20 38 85 3.51 0.20 1,51 864 1 0.01 24 0.08 0.2 3.55 19 182 (3 0.46 0.3 22 37 99 4.16 0.20 1.51 1160 2 0.01 22 0.09 0.3 2.30 16 202 ( 3 0.73 0.3 19 I4 71 4.04 0.24 1 .41 1323 3 0.01 15 0.19 0.3 2.23 10 165 (3 0.67 0.3 18 16 62 3.98 0.23 1.46 1185 3 0.01 15 0.18
40 ( 5 (3 33 (5 (3
47 ( 5 (3 45 (5 (3
n ( 5 ( 3
91 91 97 83 85
05645 05646 05647 05648
84 112 145 136
33 (2 (2 42 (2 (2 36 (2 (2 35 (2 (2
Hi nirur D e t e c t i o n 0.1 0.01 3 1 3 0.01 0.1 1 1 1 0.01 0.01 0,Ol I I 0.01 I 0.01 Haxi rum Detect i o n 50.0 10.00 2000 1000 1000 10.00 1000.0 20000 1000 20000 10.00 10.00 10.00 20000 1000 10.00 20000 10.00 ( = l e s s than M i n i r u n i s = I n s u f f i c i e n t S a i p l e ns = No s a r p l e ) = G r e a t e r than H a x i i u i ANOMLWS RESULTS = f u r t h e r Analyses by A l t e r n a t e Nethods Suggested ;
2 2 2 20000 2000 1000
1 5 3 10000 100 1000
1 20000

REPORT I: 890753 PA
Saapl e Hurber
05649 05650 05651 05652 05653
05654 05655 05656 05657 05658
05659 05660 056661 05662 05663
05664 05951 05952 06053 06054
06055 06056 06057 06058 06059
06060 06061 06062 os063 06064
06065 06066 06067 06076 06077
06078 06479 06080 O M 1
Kinirur Detection Krxirur Detection ( = LKS than Kinirui
m - m
RANGEX SERVICES
Ag AI PPI 1 0.2 2.37 0.1 2.39 0.1 2.82 0.1 3.23 0.1 2.78
0.1 2.41 0.2 3.10 0.1 2.47 0.1 2.66 0.1 2.29
0.1 1.22 0.1 1.33 0.1 1.29 0.1 1.29 0.1 1.40
0.1 1.31 0.2 1.70 0.2 2.12 0.1 2.47 0.1 2.52
0.1 2.87 0.1 2.89 0.2 3.01 0.2 3.43 0.1 3.21
0.1 2.83 0.1 3.40 0.2 3.58 0.2 3.73 0.3 3.28
0.1 3.15 0.1 3.60 0.1 3.37 0.2 2.08 0.1 2.36
0.2 2.74 0.1 2.64 0.1 2.16 0.2 2.41
0.1 0.01 50.0 10.00
As PPI
I 1 16 27 25 18
21 21 22 26 26
12 16 17 16 13
14 22 12 15 9
9 7 13 3
10
9 9
11 6 5
8 3 8 21 24
6 57 15 1 1
3 2000
Ba P P I 180 176 147 167 I58
121 222 94 82 103
67 112 73 101 85
82 127 184 99 117
98 112 67 68 78
68 72 68 73 67
66 77 86 145 244
210 I89 186 259
1 1000
Proj:
B i Ca PPI I (3 0.72 (3 0.62 (3 0.57 (3 0.66 (3 0.50
(3 0.38 (3 0.99 (3 0.38 (3 0.27 (3 0.24
(3 0.95 (3 0.55 (3 0.89 ( 3 0.72 (3 0.98
(3 0.89 (3 0.48 (3 0.45 (3 0.48 (3 0.50
(3 0.48 (3 0.42 (3 0.52 (3 0.48 (3 0.50
(3 0.51 (3 0.59 (3 0.60 (3 0.45 (3 0.53
(3 0.52 (3 0.59 ( 3 0.55 (3 0.33 13 0.33
(3 0.19 (3 0.36 (3 0.33 (3 0.42
3 0.01
Date In: 89/10/16 Date Out:89/10/26 A t t : K KAVE Page 2 of 3
Cd Co Cr Cu f e X tlg Wn no Ha N I P Pb Sb Sn S i U W 2n
4.2 20 IO 87 4.12 0.23 1.54 1323 I 0.17 I4 0.19 38 (2 (2 62 ( 5 (3 162 0.3 18 13 91 4.24 0.22 1.58 1317 2 0.01 16 0.18 41 (2 (2 59 ( 5 ( 3 160 0.4 21 9 88 4.56 0.22 1.77 1244 2 0.08 15 0.23 57 (2 (2 64 (5 (3 157 0.4 25 9 86 5.29 0.26 1.96 1580 2 0.01 13 0.28 55 (2 ( 2 74 ( 5 (3 172 0.1 25 20 103 5.39 0.24 2.49 1604 2 0.01 20 0.22 38 (2 (2 62 ( 5 (3 150
0.4 23 14 110 4.59 0.18 2.09 1423 2 0.01 I8 0.15 35 (2 (2 48 (5 (3 132 0.4 27 9 82 5.62 0.32 2.29 2081 2 0.23 I4 0.33 38 (2 2 79 ( 5 (3 144 0.3 25 20 110 5.01 0.19 2.33 I018 2 0.01 23 0.11 42 (2 (2 26 ( 5 (3 134 0.4 27 22 113 5.36 0.19 2.53 936 2 0.01 22 0.09 44 (2 ( 2 I8 (5 (3 127 0.3 24 13 124 4.59 0.16 2.08 1085 1 0.01 18 0.10 48 (2 (2 17 (5 (3 151
0.1 18 33 27 3.60 0.25 1.47 788 I 0.13 30 0.19 18 (2 (2 72 ( 5 (3 73 0.2 22 34 36 4.19 0.21 1.46 1068 2 0.19 34 0.22 25 (2 2 55 ( 5 (3 84 0.1 18 37 26 3.84 0.25 1.52 854 1 0.21 33 0.22 20 (2 (2 75 ( 5 (3 72 0.1 20 32 32 3.86 0.22 1.39 917 I 0.24 31 0.21 24 (2 2 63 ( 5 (3 77 0.1 22 41 29 4.14 0.27 1.60 980 2 0.28 34 0.26 26 (2 2 84 ( 5 (3 78
0.1 18 37 27 3.81 0.24 1.47 922 I 0.28 31 0.24 24 (2 2 75 ( 5 (3 71 0.1 23 36 42 3.98 0.18 1.22 1092 2 0.17 31 0.13 28 (2 2 49 ( 5 (3 93 0.4 25 42 49 4.79 0.21 1.26 1467 4 0.12 36 0.13 33 (2 2 43 (5 (3 131 0.1 22 32 59 3.54 0.17 1.47 738 ( I 0.0t 20 0.04 30 (2 (2 45 (5 (3 65 0.1 22 33 59 3.50 0.17 1.47 733 1 0.01 20 0.04 28 (2 ( 2 45 (5 (3 66
PPI P P I PPI P P I I 1 1 P P I PPI I PPI I PPI P P I PPI PPI PPI PPI PPI
0.3 24 36 73 4.31 0.19 1.77 925 2 0.01 32 0.05 35 (2 (2 43 ( 5 (3 IO8
0.1 27 43 88 4.12 0.19 1.58 775 1 0.01 26 0.07 35 (2 12 47 (5 ( 3 71 0.3 27 45 93 4.28 0.19 1.71 882 1 0.01 26 0.05 41 (2 (2 50 (5 (3 87 0,4 26 37 84 4.31 0,19 1.67 1036 1 0.01 25 0.05 36 (2 (2 45 (5 (3 13
0.1 24 37 74 3.93 1.18 1.58 821 1 0.01 22 0.05 33 (2 (2 45 ( 5 (3 71 0.1 27 44 85 4.36 0.22 1.87 940 I 0.01 27 0.05 32 (2 (2 51 ( 5 (3 79 0.1 29 40 91 4.60 0.23 1.99 969 2 0.01 26 0.05 37 (2 (2 52 (5 (3 75 0.1 26 43 06 4.28 0.18 1-67 986 2 0.01 25 0.08 42 (2 (2 43 (5 (3 86 0.1 26 42 84 4.15 0.19 1.84 936 I 0.01 25 0.05 34 (2 (2 46 ( 5 ( 3 77
0.1 23 32 65 4.15 0.17 1.30 958 1 0.01 24 0.05 31 (2 (2 37. ( 5 (3 103
0.2 27 42 18 4.27 0.19 1.91 992 1 0.01 26 0.05 35 ( 2 (2 44 (5 (3 '82 0.4 30 48 84 4.81 0.23 2.19 999 2 0.01 28 0.05 39 (2 (2 49 ( 5 (3 87 0.3 27 43 84 1.33 0.21 1.97 1022 1 0.01 28 0.04 36 (2 (2 46 (5 (3 81 0.1 17 46 97 3.75 0.15 1.17 701 1 0.01 20 0.06 32 (2 (2 21 (5 (3 96 0.2 22 29 I21 4.18 0.16 1.39 1245 1 0.01 21 0.06 4 1 (2 (2 21 ( 5 (3 I14
0.1 16 32 62 3.66 0.13 1.16 1321 I 0.01 20 0.04 36 (2 (2 20 (5 (3 86 0.1 4 4 31 214 5.50 0.22 1.59 1471 3 0.01 27 0.01 90 (2 (2 ZS (5 ( 3 407
0.3 21 30 86 3.98 0.17 I.?? I214 1 0.01 I7 0.07 I l l (2 (2 26 (5 (3 159
1 0 . 0 1 2 2 2 1 5 3 1 0.1 1 1 1 0.01 0.01 0801 1
0.2 20 27 52 4.61 0.18 1.19 1209 1 0.01 20 0.05 36 (2 (2 21 (5 (3 103
1 0.01 1000 10.00 1000.0 20000 1000 20000 10.00 10.00 10.00 20000 1000 10.00 20000 10.00 20000 2000 1000 loo00 loo 1000 20000
is = Insufficient Sarple ns = No sample ) E Creater than Waxirua ANOtlALOUS RESULTS = further Analyses by Alternate Methods Suggested

: '2 3 REPORT 1: 890753 PA
Sarple Nuiber
RANGEX SERVICES
AI As Ba 1 PPI PPI
3.15 30 232 2.10 8 173 2.36 I 1 174 2.13 16 173 2.28 15 283
ProJ: Date In: 89/10/16 Date Out:89/10/26 Att: K KAYE
B i Ca Cd Co Cr Cu Fe K Hg Hn No Ha Ni PPI 1 PPI PPI PPI PPI 7. 1 1 PPI PPI 1 PPI
(3 0.43 0.2 32 41 170 4.76 0.21 2.08 1578 2 0.01 27 (3 0.32 0.4 18 26 72 3.63 0.15 1.25 943 1 0.01 17 (3 0.34 0.1 18 31 78 3.84 0.16 1.31 1027 1 0.01 21 (3 0.33 0.3 21 35 129 3.95 1.02 1.35 1216 1 0.01 22 (3 0.50 0.1 17 23 88 3.40 0.16 1.28 969 1 0.01 15
(3 0.37 0.3 22 30 112 4-12 0.16 1.57 1079 1 0.01 21 (3 0.36 0.2 21 22 103 4.00 0.15 1.53 1075 1 0.01 15 (3 0.34 0.1 21 23 104 3.79 0.14 1.39 I186 I 0.01 17 (3 0.49 0.3 26 65 75 4.16 0.16 1.96 I000 I 0.01 31 ( 3 0.45 0.3 24 37 73 3.93 0.88 1.67 930 1 0.01 23
(3 0.52 0.4 21 40 76 3.81 0.15 1.66 887 I 0.01 22 (3 0.48 0.4 25 40 78 4.25 0.15 1.82 991 I 0.01 24 (3 0.45 0.3 24 35 75 3.88 0.13 1.62 888 1 0.01 21 (3 0.53 0.4 27 42 102 4.50 0.80 1.86 1028 I 0.01 25 (3 0.61 0.4 19 44 88 3.58 0.13 1.49 740 I 0.01 22
Page 3 o f
Sn Sr U PP' PPE PPI (2 32 ( 5 (2 23 ( 5 (2 26 ( 5 (2 24 ( 5 (2 27 (5
Ag PPI 0.3 0.2 0.2 0.2 0.2
P Pb Sb 1 PPI PPI
0.06 48 (2 0.06 33 (2 0.07 32 (2 0.09 39 (2 0.09 29 (2
W Zn ?
PP' PPI (3 148 (3 103 (3 108 (3 114 (3 97
(3 108 (3 103 ( 3 101 (3 82 (3 83
06082 06083 06084 06085 06086
06087 06088 06089 06101 06102
06103 06104 06105 06106 06107
0, I 0.2 0.2 0.2 0.2
2.59 19 205 2.53 16 201 2.31 15 200 2.85 13 106 2.62 9 98
2.74 15 148 2.85 13 104 2.17 14 102 3.50 10 118 3.43 , 9 134
0.08 36 (2 0.07 34 (2 0.07 36 (2 0.05 30 (2 0.05 30 ( 2
(2 29 ( 5 (2 27 ( 5 (2 24 (5 (2 41 ( 5 ( 2 42 ( 5
0.1 0.2 0.2 0.2 0.1
0.06 26 (2 0.05 31 (2 0.04 32 (2 0.05 36 (2 0.09 31 (2
(2 37 (5 (2 45 (5 (2 37 (5 (2 43 ( 5 (2 42 (5
(3 78 (3 84 (3 75 (3 92 (3 87
06 IO8 06109 06110 06111 06112
06113 06114 06115 06116 06117
0. I 0.1 0.2 0.2 0.2
0.2 0.1 0.1 0.2 0.1
3.52 7 92 3.07 10 103 3.49 10 81 3.62 12 115 2.65 13 59
2.52 13 51 1.78 10 221 2.08 16 212 2.07 I8 208 2.17 15 214
2.24 22 251 2.33 18 199 2.02 19 183
1.69 24 74 1.97 n 112
( 3 0.63 0.2 23 42 86 4.07 0.14 1.81 812 1 0.01 27 (3 0.62 0.1 18 39 75 3.41 0.12 1.48 656 1 0.01 20 (3 0.50 0.3 27 45 81 4.50 0.69 2.03 812 1 0.01 28 (3 0.60 0.4 29 49 97 4.82 0.14 2.16 1001 2 0.01 31 (3 0.50 0.2 23 36 73 3.66 0.10 1.50 800 I 0.01 23
(3 0.48 0.3 23 37 69 3.76 0.57 1.51 670 1 0.01 30 (3 0.74 0.1 15 I2 46 3.40 0.11 1.06 1267 3 0.01 16 (3 0.59 0.3 16 14 48 3.98 0.53 1.33 957 3 0.01 18 (3 0.45 0.3 17 13 56 3.87 0.50 1.32 I080 2 0.01 18 (3 0.50 0.3 19 13 72 4.17 0.48 1.39 1305 1 0.01 22
(3 0.48 0.3 17 15 C2 3.94 0.08 1.38 1105 2 0.01 20 (3 0.60 0.4 19 15 74 4.02 0.43 1.52 I010 1 0.01 19 (3 0.55 0.6 21 I4 80 4.59 0.41 1.41 1417 1 0.01 19 (3 0.45 0.4 19 12 76 4.06 0.06 1.46 1066 1 0.01 16 (3 2.27 0.5 21 13 108 3.93 0.14 1.72 841 I 0.01 20
0.08 35 (2 0.08 28 (2 0.06 36 (2 0.06 36 (2 0.05 30 (2
(2 45 (5 ( 2 41 (5 (2 42 (5 (2 49 ( 5 (2 43 ( 5
( 3 93 (3 110 (3 89 ( 3 86 (3 72
(3 72 (3 133 (3 129 (3 127 (3 150
0.05 30 (2 0.17 28 (2 0.18 32 (2 0.20 35 (2 0.20 35 (2
0.20 34 (2 0.19 38 (2 0.21 35 (2 0.15 34 (2 0.11 34 (2
(2 44 ( 5 (2 149 (5 (2 84 (5 ( 2 52 ( 5 (2 57 (5
(2 57 (5 (2 85 (5 (2 41 ( 5 (2 33 ( 5 (2 78 ( 5
(3 131 (3 142 (3 129 (3 136 (3 139
06118 06119 06120 06121 06122
0.1 0.1 0.1 0.1 0.2
06123 06124 06 125
H i n i i u i Detection llaxirur Detection
0.2 0.3 0.2
0.1 50.0
1.67 17 86 3.21 16 145 3.27 13 110
0.01 3 I 10.00 2000 1000
(3 2.62 0.3 18 12 96 3.55 0.14 1.71 875 1 0.01 19 (3 1.01 0.3 24 9 64 5.58 0.09 2.88 1267 3 0.01 I2 (3 1.22 0.2 29 8 86 5.05 0.30 2.67 1337 2 0.01 13
I 1000 10.00 1000.0 20000 1000 20000 10.00 10.00 10.00 20000 lo00 10.00 20000
I 0.01 3 0.01 0.1 I I 1 0.01 0.01 0.01 I
RESULTS = further Analyses by Alternate Methods Suggested
0.11 31 (2 0.41 42 (2 0.38 44 (2
0.01 2 2 10.00 20000 2000
( 2 85 ( 5 4 189 ( 5 5 86 ( 5
2 1 5 1000 10000 100
(3 117 (3 142 (3 140
3 1 1000 20000

~~~~~~ ~~~~~ ~ ~~
MAIN OFFICE BRANCH OFFICES PASADENA, NFLD BATHURST, N B
MISSISSAUGA, ONT RENO NEVADA, U S A
I 1988 TRIUMPH ST I \tlGc VmGEOCHEM LAB LmMlTED I VANCOUVER, B C V5L 1K5 0 (604) 251-5656
0 FAX (604) 254-5717
RE?@flT YX5ER: 890710 68 JiiB d:.IBER: 8907!0 RANGEX SERVICES LTD. '45: I CF 4
I I I I I I I I I '1 I I I I I I
SA#P!.E f r
05315 05317 053 18 05319 05320.
DETECTIOM LIEIT nd = none detected
!0 nd nd
-. ?I: L Y
5 - - no t ana!ysed is L insufficient sasple

. . . MAIN OFFICE BRANCH OFFICES PASADENA, NFLD. BATHURST. N.B.
MISSISSAUGA, ONT. RENO, NEVADA. U.S.A.
I 1988 TRIUMPH ST. VANGEOCHEM LAB LIIMIED VANCOUVER, B.C. V ~ L 1 ~ 5 0 (604) 251-5656
0 FAX (604) 254-571 7 I
REPORT HUZEER: 8907';O 6tl J O B NLIHBER: 83(l71(l RANGEX SERVICES LTD. PAGE 2 OF 4
SAPiPLE it 0. I? p p s
0 5 3 q c.
05341 nd (15342 nd 05343 5 05344 ! (1
05345 20 05345 i 0 05347 ! (1 05348 5 0534'3 5
Oyj5(1 - 15 05351 I .a
(15352 10
0535; 5 05354 10
05355 10 05356 10
05359 20
I I I 1 I 1 I I 0535'3 20
.:, .
t ?
65357 5
D 1 I I 1 I I I

1988 TRIUMPH ST PASADENA, NFLD BATHURST, N B
MISSISSAUGA. ONT 0 (604) 251-5656
I I I
I I I I 1 I
E P D R T W%EW: 8407!0 EA JOB W l B E f i : 8'30710 RANGEX SERVICES LTD.
SAY?!€ t
05387
05389 05390 05331
05388
05392 05353 05394 05395 05336
C
nd 25 5 5
nd nd !5
5 !5

~~
MAIN OFFICE BRANCH OFFICES PASADENA, NFLD BATHURST. N B
MISSISSAUGA, ONT RENO NEVADA, U S A
I 1988 TRIUMPH ST I \t/Gc VmGEOcHEM LAB LIMITED VANCOUVER, B C V5L 1K5 0 (604) 251-5656
e FAX (604) 254 571 7 I
4EPriRT kUffBER: 8907!0 GA JDEi NUYEER: 890710 RANGEX SERVICES LTD. 24gE 4 [IC 4
SAYPLE 4
05431 05432 05433 05434 05435
05436 05437 (15438 95439 05440
k 11 ppb
I ,
L Y \ : I
I (1
nd nd
.,
C
nd 10 5 . . .. I E'
nd nd nd
lit
5 nd nd nd nd
nd nd 10 10 Od
nd nd 10
- +
-. p .!<

1 m MAIN OFFICE BRANCH OFFICES
PASADENA NFLD BATHURST N B
MISSISSAUGA ONT RENO NEVADA U S A
I 1988 TRIUMPH ST VMGEOCHEM LAB LIMITED I VANCOUVER, B C V5L 1K5 e (604) 251-5656
0 FAX (604) 254 571 7
REPORT f : 890710 PA RANGEX Page 1 o f 4
S a w p l e Number
0530 1 05302 05303 05304 05305
05306 05307 05308 05309 05310
05311 053 12 05313 05314 053 15
053 16 05317 053 I8 053 19 05320
OS32 1 05322 05323 05324 05325
05326 05327 05328 05329 05330
0533 1 05332 05333 05334 05335
05336 05337 05338 05339
Ii n i BUO Detec t ion
Ag PP@ 0.2 0.2 0.2 0.2 0.1
0.1 0.1 0.1 0.1 0.1
0.1 0.1 0.2 0.1 0.2
0.1 0.1 0.1 0.1 0.1
0.1 0.1 0.2 0.3 0.3
1.U 0.3 0.4 0.1 0.4
0.3 0.4 0.4 0.3 0.6
0.4 0,3 0.3 0.2
0.1
AS
P P I (3 9 (3 (3 (3
(3 9 (3 (3 (3
(3 (3 (3 (3 (3
( 3 (3 (3 (3 21
6 (3 (3 (3 5
34 (3 14 10 20
6 38 (3 5 (3
5 (3 (3 (3
3
CU Fe
25 5.18 31 4.84 33 4.60 59 4.30 30 5.44
58 5.14 153 7.17 33 5.35 46 5.55 44 4.29
60 5.06 14 3.45 22 4.06 51 5.03 29 3-74
44 4.13 113 5.48 63 4.41 83 4.97 70 6.49
46 8.94 129 5.29 141 6.08 135 4.76 161 4.32
1056 4.52 97 3.88 212 4.26 141 4.85 109 4.70
78 4.25 177 )10.00 137 4.46 408 4.51 237 4.07
87 3.74 35 3.96 84 3.53 522 3.75
1 0.01
PPB x #n
PPB 1559 1300 986 1094 1542
1692 920 1426 1285 860
1126 335 384 1325 758
936 1612 1017 1365 1763
3422 1328 2406 1297 1425
4274 1208 890 896 1222
1096 18496 1247 1162 600
614 810 572 605
1
14 I> N i Pb Sb P P I PPB PPO P P I
1 20 25 (2 2 29 29 (2 2 28 30 (2 1 44 29 (2 3 30 33 (2
1 41 29 (2 2 29 39 (2 3 32 34 (2 2 39 40 (2 1 30 34 (2
2 41 45 (2 2 1 1 31 (2 1 17 47 ( 2 2 17 47 (2 1 16 39 (2
1 21 39 (2 2 29 50 (2 1 39 37 (2 1 42 41 (2 2 34 36 (2
3 42 47 (2 2 36 49 (2 2 28 46 (2 2 29 47 (2 2 31 44 (2
2 21 59 (2 1 35 38 (2 2 36 48 ( 2 2 28 50 (2 2 32 43 (2
1 38 41 (2 5 42 72 (2 1 48 42 (2 2 36 45 (2 2 22 51 (2
2 18 43 (2 2 14 54 (2 1 26 42 (2 1 30 40 (2
1 1 2 2
Zn P P I 99 92 99 99 98
113 78 109 112 90
160 67 69 117 71
88 154 1 1 1 1 1 1 139
132 132 120 114 102
118 106 126 131 103
93 252 105 104 95
106 85 69 70
1 l i a x i rum Detect i o n 50.0 2000 20000 10,OO 20000 1000 20000 20000 2000 20000 ( = Less than flinirsum i s = I n s u f f i c i e n t Sample ns = No s a r p l e ) = Greater than Haxileula

BATHURST N B I MISSISSAUGA ONT (604) 251 5656
RAMGEX Page 2 o f 4 REPORT #: 890710 PA
Saaple Nureber
05340 0534 1 05342 05343 05344
05345 05346 05347 05348 05349
05350 0535 1 05352 05353 05354
05355 05356 05357 05358 OS359
05360 05361 05362 05363 05364
05365 05366 05367 05368 05363
05369 8 05370 05370 8 0537 1 05372
05373 05374 05375 05376
Minimure Detection Haxirur Detection
Ag PPI 0.1 0. 1 0.2 0.2 0.1
0.2 0.2 0. 1 0.1 0.2
0.1 0, 1 0 . 2 0.1 0.1
0 , l 0.1 0.2 0.3 0 . 5
0.3 0.7 0.2 0.1 0.1
0,2 0.1 0.3 0.1 0, 1
0.2 0.3 0.1 0.1 0.1
0.1 0.2 0.2 0.2
0.1 50.0
AS
PPB 3 9 8
18 13
(3 ( 3
4 (3 20
5 (3 ( 3 (3 (3
6 (3 3 9
45
50 48 23 25 36
31 35 53 21 35
36 18 10 €0 11
20 11 14 15
3 2000
cu PPW 252
95 98
124 139
6 0 74
110 67 34
69 51 36 58 56
70 60 53 78 89
90 308 238
83 121
116 95
160 79
128
102 76 €7 91 €1
61 63 68 67
1 20000
Fe tln
4.06 800 5.24 1474 4.36 815 4.22 729 4.63 1205
3.77 855 4.32 1040 5 .03 1592 4.18 981 4.65 1385
5.5'3 1588 4.23 714 4.34 749 3.92 871 3.97 833
4.26 808 4.36 613 4.25 525 4.34 1154 5.41 1428
4.80 750 8.61 2940 6.34 1865 5.09 1295 4.98 1505
4.96 1686 4.63 1112 5.87 1691 4.94 1432 6,13 2207
6.73 1069 5.37 1310 4.07 924 5.32 928 3.68 6€6
4.35 852 4.29 797 4.42 1058 4.18 562
0.01 1 10.00 20000
1 PPI tlo
PPa 1 1 1 1 1
( 1 1 1 1 1
1 1 2 1 1
1 1 1 2 1
2 2 2 1 2
1 1 2 1 1
2 1 1 2 1
1 1 1 1
1 1000
Mi PPB
29 27 26 35 38
37 43 40 43 41
30 30 13 36 34
41 30 28 34 31
30 25 25 33 31
3€ 49 31 33 30
32 29 32 2 3 38
26 37 35 31
1 20000
Pb P P B
37 34 38 34 33
22 27 32 26 37
32 35 59 30 28
31 35 34 33
130
63 41 44 34 68
45 48 55 30 33
42 35 31 45 27
65 34 35 42
2 20000
< = less than Hinirum is = Insufficient Sample ns = No sample = Greater than Maximum
Zn PPI
81 92 105 100 104
90 91
121 89
197
126 96
116 90
104
102 115 111 121 263
240 206 146 113 208
125 1€7 185 116 181
177 137 92
170 8 0
147 128 112 142
1 20000

1 ' I BATHURST, N B
RANGEX Page 3 o f 4 REPORT #: 890710 PA
Sample Number
05377 05378 05379 053BO 0538 1
05382 05383 05384 05385 05386
05387 05388 05389 05390 05391
05392 05393 05394 05395 05396
05397 05398 05399 05400 0540 1
05402 05403 05404 os4os 05406
05407 05408 05409 054 10 0541 1
054 12 05413 054 14 054 15
flinimum Detect ion flaxiaum Detection
Ag PP@ 0.1 0.1 ir, 1 0.1 0, 1
0.2 0,1 0.2 0 . 1 0 , l
0.1 0.2 0.2 0 , l 0 . 2
0.1 0. I 0.1 0.2 0.1
0.3 0.2 0 , 2 0.3 0.1
0.3 0,3 0,3 0,s 0.4
0, 2 0.5 0.5 0,5 0.4
0.3 0,2 0.3 0.5
0.1 50.0
A5
PPB 1 0 8
16 12
4
(3 (3 11 9 4
7 12 10
4 27
8 11 7
22 19
11 39 16 17 17
28 19
111 247 125
100 98
151 104 103
55 13 24 31
3 2000
cu f e fln PPW PPR
79 4.04 619 68 4.55 1141 66 4.27 946 54 4.66 1114 70 4.72 1066
57 4.51 826 70 4.23 879 50 6.17 1619 76 4.68 892 55 4.88 869
56 4.11 847 76 4.68 935 37 4.36 1304 76 4.17 1109
132 8.69 1908
76 4.01 982 78 4.74 1084 99 4.79 666
161 6,07 1992 82 5.10 1676
76 5.40 1508 53 6.90 2053 74 5.52 999 82 5.46 1622 71 5 .65 1738
101 5,58 1642 78 5.0'3 1379 55 5.12 1450
105 5,9s 2018 141 5.53 1328
123 5.88 1159 133 5,51 1653 199 6.72 2658 169 6.54 2243 151 6.97 1640
164 5.69 1396 60 4.17 1279 94 4.90 1132 97 5.39 847
1 0.01 1 20000 10.00 20000
no PPm
1 2
( 1 2
( 1
( 1 1
(1 1 2
1 1 2 1 3
1 1 2 2 2
2 2 2 2 2
2 2 3 3 3
3 3 3 3 3
2 2 2 3
1 1000
M i PO8
33 26 33 23 33
27 33 31 34 31
30 32 17 30 53
33 26 26 34 23
32 19 24 20 20
25 21 25 19 26
30 28 32 25 26
21 13 26 50
1
Pb PPR
43 37 35 36 38
42 33 40 38 37
31 35 34
31 54
26 31 43 36 36
33 39 31 36 31
41 30 47 51 59
52 58 82 75 78
56 39 43 51
2 20000 20000
( = Less than Hinimum is = I n s u f f i c i e n t Sample ns = No sample > = Greater than Haxirum
l n PPIs 152 108 90
106 120
116 108 139 123 128
106 150 142
102 215
84 115 155 157 123
130 177 142 141 134
157 120 159 160 198
155 215 279 189 215
158 104 128 194
1 20000

BRANCH OFFICES PASADENA, NFLD BATHURST, N B
MISSISSAUGA ONT RENO NEVADA U S A
MAIN OFFICE 1988 TRIUMPH ST
VANCOUVER, B C V5L 1K5
0 FAX (604) 254-5717 I \f/Gc VwGEOCHEM LAB LIMITED
0 (604) 251-5656 I REPORT 1: 890710 PA RANGEX Page 4 of 4
1 I I 1 I I I 1 i I I 1 i I I I
Sample Number
05416 054 17 05418 054 19 05420
0542 1 05422 05423 05424 05425
05426 05427 05428 05429 05430
05431 05432 05433 05434 05435
05436 05437 05438 05439 05440
0544 1 05442 05443 05444 05445
nini mum Detect ion
Ag ??m 0.3 0. 1 0.1 0.1 0.2
0.2 0.1 0.1 0.1 0.1
0.5 0.6 0.4 0.4 0.2
0.3 0.3 0.2 0.2 0.2
0.2 0.3 0.1 0 .1 0.1
0.2 0.2 0.2 0.1 0.2
0.1
AS
P?fl 24 17 23 24 26
37 27 18 23 73
31 63 30 62 44
34 12 17 16 16
13 15 14 10 30
( 3 17 17 12 11
3
cu f e tln
81 5.05 1277 120 5.09 1043 69 5.89 1365 43 9.85 1589
105 6.59 1399
PPS x ?PO
Y3 5.43 1145 59 4.75 1161 48 5.23 1305 63 5.14 1348 78 7.51 2704
62 5.23 1316 115 6.09 1504 69 5.32 1345 63 5.00 1579 55 4.06 1208
61 5.77 1571 35 4,56 1187 46 3,75 759 47 4,45 1177 40 4'13 780
38 4,06 607 32 3,62 550 30 4.44 1220 22 3.32 712 47 3.84 1044
29 1.77 617 61 4.34 1393 43 3.71 1156 39 3,63 1671 46 3.89 1249
1 0.01 1 Haximum Det:-;;ion 50.0 2000 20000 10,00 20000
I@ P?a
3 2 3 3 -,
3 3 4 3 3
3 3 3 3 2
5 3 2 2 2
2 2 3 2 2
3 2 2 3 2
f 1000
Ni PPr 45 33 24 17 30
29 29 29 27 33
44 110
75 71 24
78 26 20 27 24
29 32 29 12 17
14 27 20 18 2 0
1 20000
Pb PP&
4 0 41 40 42 51
73 61 47 36 32
37 65 50 51 46
50 37 35 39 39
36 38 37 31 37
14 36 41 38 33
2 2ljOl)l!
l n PPI 153 151 173 285 557
782 570 274 170 117
119 222 175 144 160
152 124 115 129 145
113 71 88 58 84
41 134 84
104 89
1 20000
< = Less than l inimur i s In su f f i c i en t Sample n5 No sample > = Greater than Haximum

I I I I I I I I I I I I I I I I I I I
A P P E N D I X I 1 1
STATEMENT OF QUALIFICATIONS

I 1 1 d
I I I I I I I I 1 I I I I I
i C E R T I F I C A T E
I, JOHN BUCHHOLZ, of 10370 Monte Bella Road, Winfield, British Columbia do hereby cer t i fy that:
I was employed by Kestrel Resources Ltd. during t h e months of July - December, 1989 as Exploration Geologist to conduct geological mapping and property examinations on their Iskut River mineral claims.
I a m a graduate of t h e University of British Columbia having obtained a degree in Geology (B.A.) in 1962.
I have pract ised my profession during t h e periods 1962-1974 and 1987 to present on various exploration projects ranging f rom grass roots to underground programs.
I a m familiar with and have personally examined t h e property described in t h e body of th i s repor t in September of 1988 and supervised t h e work during October 1989, at which t i m e I a c t e d on behalf of Kestrel Resources Ltd. in conducting their on-going exploration program on this property.
I have no in te res t in t h e property described herein, nor in securi t ies of Kestrel Resources Ltd., nor do I expec t to rece ive any such interest .
I hereby au thor ize Kestrel Resources Ltd. or any associated company to present th i s r e p o r t or p a r t s thereof , in any s t a t e m e n t of mater ia l f a c t s i n a n y prospectus or o ther documentation submi t ted t o fulfill regulatory requirements.
DATED at Vancouver, British Columbia, this 2 0 day of @?HY 1990.

I I I I 1 I I D I I I I I I
I
1 I
i
i
A P P E N D I X I V
ITEMIZED COST STATEMENT

I I I I I I I I I I I I 1 I I I 1 I I
ARC GROUP
A R C 1 - 5 , M & M 4 A N D 9
Personnel Expenses
D. Blanchflower C eo1 ogi s t 1 d a y a t $300/day $ 300.00 0. C h a s e Prospector 1 day at $225/day 225.00
875.00 R. Durocher Sampler 5 days at $175/day Sampler 7 days at $l5O/day 1,050.00 J. Elmore
Total Personnel Expenses
Field Expenses
Man Support
Aviation
14 days at $120/day
H eli co pter Fixed Wing
(Northern Mountain H e l i c o p t e r ) (Central Mountain Air Ltd.)
Assaying (Van Geochem Labs Ltd.)
Drafting and Maps
Travel and Accommodation
Field Expendables
Freight
€qui pm ent Rent a1 s
C us torn s Broker age
E xpe di ti ng
Total Field Expenses
Management Fee (10% on Field Expenses only)
Report Expenses
TOTAL COST 1989 PROGRAM
$ 2,450.00
$ 1,750.00
3,141.45 1,017.00
1,845.50
135.59
268.66
293.69
142.02
131.21
224.24
100.00
$ 9,049.36
904.94
1,750.00
$14,154.30

I I I I I B I I I I I I I I I I I I I
Personnel Expenses
J. Buchholz R. Riedel R. Durocher J. Lee C. Bilquist
Total Personnel Expenses
Field Expenses
Room andBoard
A vi ati on Helicopter Fixed Wing
Assaying
Draf t ing a n d Maps
Field Expendables
Freight
Equi pm ent Rent a1 s
C us tom s B ro kera ge
Expediting
Total Field Expenses
M & M 1 GROUP
M & M 1, 2, 3, 5, 6
G eologi s t Prospector 3 days at $200/day Sampler 2 days a t $175/day Sampler 3 days at $175/day Sampler 2 days a t $175/day
1 day at $300/day
(Northern Mount ai n Helicopter ) (Central Mountain Air Ltd.)
(Van Geochem Labs Ltd.)
Management F e e (10% on Field Expenses only)
Repor t Expenses
TOTAL COST 1989 PROGRAM
$ 300.00 600.00 350.00 525.00 350.00
$ 2,125.00
$ 1,375.00
3,313.49 918.97
975.00
132.26
266.24
138.08
118.94
165.45
89.58
$ 7,736.54
773.65
1,750.00
$12,385.19

I I I I I I D I I I D I I D I I I I I
Personnel Expenses
R. Riedel R. Durocher
Total Personnel Expenses
M & M 2 GROUP
M & M 10, 11
Prospector 2 days at $200/day Sampler 2 days at $175/day
Field Expenses
Room and Board 4 man days at $125/man day
Avi at i on H eli co p t e r F ixed Wing
A ssa yi n g
Travel and Accommodat ion
Draf .ti ng and Maps
Fie1 d Expendables
Freight
Equi pm ent R ent a1 s
Custom s B ro kerage
E xpe di ti n g
Total Field Expenses
(Northern Mountain Hel icopter) (Central Mountain A i r Ltd.)
(Van Geochem Labs Ltd.)
Management F e e (10% o n Field Expenses only)
Repor t Expenses
TOTAL COST 1989 PROGRAM
$ 400.00 350.00
$ 750.00
$ 500.00
546.18 196.05
208.00
51.95
106.88
56.80
108.12
25.37
35.60
19.11
$ 1,854.06
185.41
1,300.00
$ 4,089.47