
Statistics II Single ANOVA
52
Statistics II Single ANOVA Çağrı Çöltekin University of Groningen Information Science April 22, 2014
-
Upload
khangminh22 -
Category
Documents
-
view
0 -
download
0
Transcript of Statistics II Single ANOVA

Statistics IISingle ANOVA
Çağrı Çöltekin
University of GroningenInformation Science
April 22, 2014

Previous topics Hypothesis testing ANOVA General Linear models Summary
The random numbers from the survey
Histogram of the random numbers from you (between 1–20)
Freq
uenc
y
5 10 15 20
01
23
45
6
n = 40
Ç. Çöltekin / Informatiekunde Statistics II: Single ANOVA April 22, 2014 1 / 40

Previous topics Hypothesis testing ANOVA General Linear models Summary
Class activity
▶ Your random numbers are in the bag (or ‘urn’).▶ Pick four numbers randomly▶ Write them down.▶ Pass it to your neighbor.▶ Calculate the mean of the numbers that you sampled.▶ During the break, draw a box on the board based on your
calculation.
Ç. Çöltekin / Informatiekunde Statistics II: Single ANOVA April 22, 2014 2 / 40

Previous topics Hypothesis testing ANOVA General Linear models Summary
Back to the birth-rate estimate
1960 1970 1980 1990 2000 2010
12
34
5
years
Birt
hra
tein
NL
World Bank dataOur estimate99% conf. int.
Ç. Çöltekin / Informatiekunde Statistics II: Single ANOVA April 22, 2014 3 / 40

Previous topics Hypothesis testing ANOVA General Linear models Summary
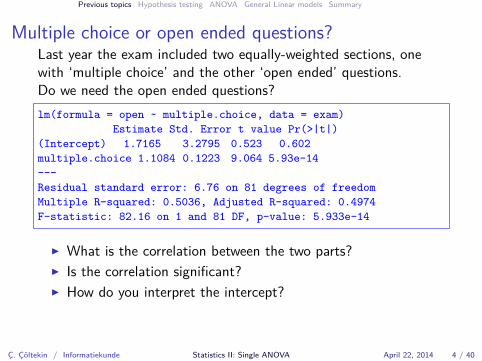
Multiple choice or open ended questions?Last year the exam included two equally-weighted sections, onewith ‘multiple choice’ and the other ‘open ended’ questions.Do we need the open ended questions?
lm(formula = open ~ multiple.choice, data = exam)Estimate Std. Error t value Pr(>|t|)
(Intercept) 1.7165 3.2795 0.523 0.602multiple.choice 1.1084 0.1223 9.064 5.93e-14---Residual standard error: 6.76 on 81 degrees of freedomMultiple R-squared: 0.5036, Adjusted R-squared: 0.4974F-statistic: 82.16 on 1 and 81 DF, p-value: 5.933e-14
▶ What is the correlation between the two parts?▶ Is the correlation significant?▶ How do you interpret the intercept?▶ How do you interpret the slope?▶ How should we check the model fit?
Ç. Çöltekin / Informatiekunde Statistics II: Single ANOVA April 22, 2014 4 / 40

Previous topics Hypothesis testing ANOVA General Linear models Summary
Multiple choice or open ended questions?Last year the exam included two equally-weighted sections, onewith ‘multiple choice’ and the other ‘open ended’ questions.Do we need the open ended questions?lm(formula = open ~ multiple.choice, data = exam)
Estimate Std. Error t value Pr(>|t|)(Intercept) 1.7165 3.2795 0.523 0.602multiple.choice 1.1084 0.1223 9.064 5.93e-14---Residual standard error: 6.76 on 81 degrees of freedomMultiple R-squared: 0.5036, Adjusted R-squared: 0.4974F-statistic: 82.16 on 1 and 81 DF, p-value: 5.933e-14
▶ What is the correlation between the two parts?
▶ Is the correlation significant?▶ How do you interpret the intercept?▶ How do you interpret the slope?▶ How should we check the model fit?
Ç. Çöltekin / Informatiekunde Statistics II: Single ANOVA April 22, 2014 4 / 40

Previous topics Hypothesis testing ANOVA General Linear models Summary
Multiple choice or open ended questions?Last year the exam included two equally-weighted sections, onewith ‘multiple choice’ and the other ‘open ended’ questions.Do we need the open ended questions?lm(formula = open ~ multiple.choice, data = exam)
Estimate Std. Error t value Pr(>|t|)(Intercept) 1.7165 3.2795 0.523 0.602multiple.choice 1.1084 0.1223 9.064 5.93e-14---Residual standard error: 6.76 on 81 degrees of freedomMultiple R-squared: 0.5036, Adjusted R-squared: 0.4974F-statistic: 82.16 on 1 and 81 DF, p-value: 5.933e-14
▶ What is the correlation between the two parts?▶ Is the correlation significant?
▶ How do you interpret the intercept?▶ How do you interpret the slope?▶ How should we check the model fit?
Ç. Çöltekin / Informatiekunde Statistics II: Single ANOVA April 22, 2014 4 / 40
Previous topics Hypothesis testing ANOVA General Linear models Summary
Multiple choice or open ended questions?Last year the exam included two equally-weighted sections, onewith ‘multiple choice’ and the other ‘open ended’ questions.Do we need the open ended questions?lm(formula = open ~ multiple.choice, data = exam)
Estimate Std. Error t value Pr(>|t|)(Intercept) 1.7165 3.2795 0.523 0.602multiple.choice 1.1084 0.1223 9.064 5.93e-14---Residual standard error: 6.76 on 81 degrees of freedomMultiple R-squared: 0.5036, Adjusted R-squared: 0.4974F-statistic: 82.16 on 1 and 81 DF, p-value: 5.933e-14
▶ What is the correlation between the two parts?▶ Is the correlation significant?▶ How do you interpret the intercept?
▶ How do you interpret the slope?▶ How should we check the model fit?
Ç. Çöltekin / Informatiekunde Statistics II: Single ANOVA April 22, 2014 4 / 40

Previous topics Hypothesis testing ANOVA General Linear models Summary
Multiple choice or open ended questions?Last year the exam included two equally-weighted sections, onewith ‘multiple choice’ and the other ‘open ended’ questions.Do we need the open ended questions?lm(formula = open ~ multiple.choice, data = exam)
Estimate Std. Error t value Pr(>|t|)(Intercept) 1.7165 3.2795 0.523 0.602multiple.choice 1.1084 0.1223 9.064 5.93e-14---Residual standard error: 6.76 on 81 degrees of freedomMultiple R-squared: 0.5036, Adjusted R-squared: 0.4974F-statistic: 82.16 on 1 and 81 DF, p-value: 5.933e-14
▶ What is the correlation between the two parts?▶ Is the correlation significant?▶ How do you interpret the intercept?▶ How do you interpret the slope?
▶ How should we check the model fit?
Ç. Çöltekin / Informatiekunde Statistics II: Single ANOVA April 22, 2014 4 / 40

Previous topics Hypothesis testing ANOVA General Linear models Summary
Multiple choice or open ended questions?Last year the exam included two equally-weighted sections, onewith ‘multiple choice’ and the other ‘open ended’ questions.Do we need the open ended questions?lm(formula = open ~ multiple.choice, data = exam)
Estimate Std. Error t value Pr(>|t|)(Intercept) 1.7165 3.2795 0.523 0.602multiple.choice 1.1084 0.1223 9.064 5.93e-14---Residual standard error: 6.76 on 81 degrees of freedomMultiple R-squared: 0.5036, Adjusted R-squared: 0.4974F-statistic: 82.16 on 1 and 81 DF, p-value: 5.933e-14
▶ What is the correlation between the two parts?▶ Is the correlation significant?▶ How do you interpret the intercept?▶ How do you interpret the slope?▶ How should we check the model fit?
Ç. Çöltekin / Informatiekunde Statistics II: Single ANOVA April 22, 2014 4 / 40

Previous topics Hypothesis testing ANOVA General Linear models Summary
Another regression example: predicting shoe size fromheight
lm(formula = shoesize ~ height, data = survey)Estimate Std. Error t value Pr(>|t|)
(Intercept) 34.44853 2.64985 13.000 1.46e-15 ***height 0.03092 0.01532 2.019 0.0506 .---Residual standard error: 2.758 on 38 degrees of freedomMultiple R-squared: 0.09686, Adjusted R-squared: 0.07309F-statistic: 4.075 on 1 and 38 DF, p-value: 0.05061
Ç. Çöltekin / Informatiekunde Statistics II: Single ANOVA April 22, 2014 5 / 40

Previous topics Hypothesis testing ANOVA General Linear models Summary
Let’s try weight
lm(formula = shoesize ~ weight, data = survey)Estimate Std. Error t value Pr(>|t|)
(Intercept) 27.79832 1.50902 18.421 < 2e-16 ***weight 0.17914 0.02255 7.943 1.98e-09 ***---Residual standard error: 1.714 on 36 degrees of freedomMultiple R-squared: 0.6367, Adjusted R-squared: 0.6266F-statistic: 63.09 on 1 and 36 DF, p-value: 1.984e-09
Are you convinced?
Ç. Çöltekin / Informatiekunde Statistics II: Single ANOVA April 22, 2014 6 / 40

Previous topics Hypothesis testing ANOVA General Linear models Summary
Always plot your data
0 50 100 150 200
3638
4042
4446
48
Height (cm)
Sho
esi
ze
Ç. Çöltekin / Informatiekunde Statistics II: Single ANOVA April 22, 2014 7 / 40
Previous topics Hypothesis testing ANOVA General Linear models Summary
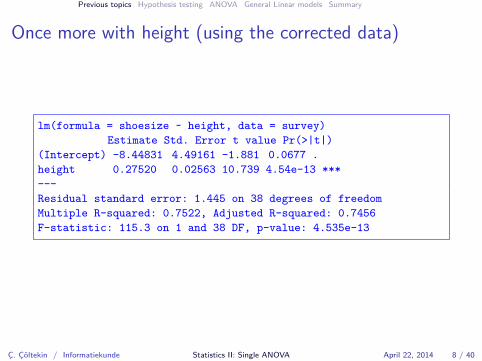
Once more with height (using the corrected data)
lm(formula = shoesize ~ height, data = survey)Estimate Std. Error t value Pr(>|t|)
(Intercept) -8.44831 4.49161 -1.881 0.0677 .height 0.27520 0.02563 10.739 4.54e-13 ***---Residual standard error: 1.445 on 38 degrees of freedomMultiple R-squared: 0.7522, Adjusted R-squared: 0.7456F-statistic: 115.3 on 1 and 38 DF, p-value: 4.535e-13
Ç. Çöltekin / Informatiekunde Statistics II: Single ANOVA April 22, 2014 8 / 40

Previous topics Hypothesis testing ANOVA General Linear models Summary
Using both height and weight
In comparison to the single predictor models, do you expectchanges in
▶ coefficient estimates?▶ statistical significance?▶ r2?
lm(formula = shoesize ~ height.fixed + weight, data = survey)Estimate Std. Error t value Pr(>|t|)
(Intercept) 1.27327 4.13571 0.308 0.76height.fixed 0.18388 0.02778 6.618 1.20e-07 ***weight 0.09419 0.01993 4.726 3.66e-05 ***---Residual standard error: 1.159 on 35 degrees of freedomMultiple R-squared: 0.8386, Adjusted R-squared: 0.8294F-statistic: 90.95 on 2 and 35 DF, p-value: 1.371e-14
Ç. Çöltekin / Informatiekunde Statistics II: Single ANOVA April 22, 2014 9 / 40

Previous topics Hypothesis testing ANOVA General Linear models Summary
Model diagnostics: normality of residuals
-2 -1 0 1 2
-2-1
01
2
Theoretical Quantiles
Sta
ndar
dize
dre
sidu
als
Normal Q-Q
17
16
33
Ç. Çöltekin / Informatiekunde Statistics II: Single ANOVA April 22, 2014 10 / 40

Previous topics Hypothesis testing ANOVA General Linear models Summary
Model diagnostics: residual distribution
36 38 40 42 44 46 48
-3-2
-10
12
3
Fitted values
Res
idua
ls
Residuals vs Fitted
17
16
33
Ç. Çöltekin / Informatiekunde Statistics II: Single ANOVA April 22, 2014 11 / 40

Previous topics Hypothesis testing ANOVA General Linear models Summary
Model diagnostics: influential observations
0.0 0.1 0.2 0.3 0.4 0.5
-3-2
-10
12
Leverage
Sta
ndar
dize
dre
sidu
als
Cook’s distance
10.5
0.51
Residuals vs Leverage
16
2133
Ç. Çöltekin / Informatiekunde Statistics II: Single ANOVA April 22, 2014 12 / 40

Previous topics Hypothesis testing ANOVA General Linear models Summary
Hypothesis testing: a reminder
Aim: make inferences about the population based on a sampleregarding a research question.Procedure:
▶ Formulate your question as two explicit hypotheses:null hypothesis (H0) is the formulation of the case where your
expectations were wrong.alternative hypothesis (Ha) supports what you expect to find
in the population.▶ Set a probability level (α-level) at which to reject the H0.
Typical values are 0.05, 0.01, 0.001.▶ Calculate the probability, p, of obtaining the sample you have,
if H0 was true.▶ If p < α, we reject the H0, otherwise, we fail to reject the H0.
Ç. Çöltekin / Informatiekunde Statistics II: Single ANOVA April 22, 2014 13 / 40

Previous topics Hypothesis testing ANOVA General Linear models Summary
Hypothesis testing: exampleWe want to know whether a new web-page design is easier to usebased on evaluation from two groups of users, one using only theold design, the other only the new design.Procedure:
▶ Formulate your question as two explicit hypotheses:H0 the mean response score is the same for both
groups (µ1 = µ2).Ha the mean response score differs for the groups
(µ1 ̸= µ2).▶ We set α = 0.05.▶ The p-value for obtaining these samples given H0 is true, can
be calculated from a t-distribution (given the response scoresfor both groups are normally distributed, and the variances aresimilar).
▶ If p < 0.05, we reject the H0, otherwise, we fail to reject theH0.
Ç. Çöltekin / Informatiekunde Statistics II: Single ANOVA April 22, 2014 14 / 40
Previous topics Hypothesis testing ANOVA General Linear models Summary
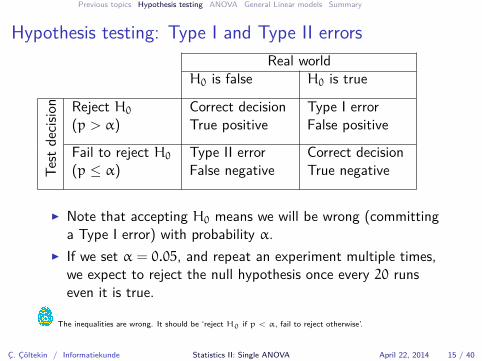
Hypothesis testing: Type I and Type II errorsReal world
H0 is false H0 is true
Test
decis
ion Reject H0
(p > α)Correct decisionTrue positive
Type I errorFalse positive
Fail to reject H0
(p ≤ α)Type II errorFalse negative
Correct decisionTrue negative
▶ Note that accepting H0 means we will be wrong (committinga Type I error) with probability α.
▶ If we set α = 0.05, and repeat an experiment multiple times,we expect to reject the null hypothesis once every 20 runseven it is true.
The inequalities are wrong. It should be ‘reject H0 if p < α, fail to reject otherwise’.
Ç. Çöltekin / Informatiekunde Statistics II: Single ANOVA April 22, 2014 15 / 40

Previous topics Hypothesis testing ANOVA General Linear models Summary
Example problems for ANOVA
▶ Compare time needed for lexical recognition in1. healthy adults2. patients with Wernicke’s aphasia3. patients with Broca’s aphasia
▶ Effect of background color choice in a web site.▶ Compare Dutch proficiency scores of second language learners
based on their native language.
Ç. Çöltekin / Informatiekunde Statistics II: Single ANOVA April 22, 2014 16 / 40

Previous topics Hypothesis testing ANOVA General Linear models Summary
Why not multiple t-tests?
▶ Multiple comparisons over the same sample increases thechances of rejecting the null hypothesis (finding an effectwhere there is none).
▶ With α = 0.05, if you do 20 different t-tests on the samesample, we expect to one of them being significant if the nullhypothesis was true.
▶ We need3 comparisons 3 groups,6 comparisons for 4 groups,10 comparisons for 5 groups,45 comparisons for 10 groups,4950 comparisons for 100 groups.
▶ In general, for k groups, we need(k2
)comparisons.
Ç. Çöltekin / Informatiekunde Statistics II: Single ANOVA April 22, 2014 17 / 40

Previous topics Hypothesis testing ANOVA General Linear models Summary
An extreme demonstrationfinding emotional response in a dead salmon’s brain activity
Subject One mature Atlantic Salmon (Salmo salar) participated in the fMRI study. The salmon was approximately18 inches long, weighed 3.8 lbs, and was not alive at he time of scanning.
Task The task administered to the salmon involved completing an open-end mentalizing task. The salmon wasshown a series of photographs depicting human individuals in social situations with a specified emotional valence.The salmon was asked to determine what emotion the individual in the photo must have been experiencing.
Results Several active voxels were discovered in a cluster located within the salmon’s brain cavity …with acluster-level significance of p = 0.001. Out of a search volume of 8064 voxels a total of 16 voxels weresignificant.
* From the poster by Bennett et al. (2009).
Ç. Çöltekin / Informatiekunde Statistics II: Single ANOVA April 22, 2014 18 / 40

Previous topics Hypothesis testing ANOVA General Linear models Summary
ANOVA
▶ ANOVA (analysis of variance) is a method to compare meansof more than two groups.
▶ For two groups the result is equivalent to t-test.▶ ANOVA indicate whether there is any difference at all. For k
groups:H0: µ1 = µ2 = . . . = µk
▶ A limited number and type of comparisons can be carried outby specifying contrasts.
▶ Otherwise, post-hoc pairwise comparisons can be carried outusing corrected α-levels.
▶ ANOVA is strongly related to regression (later today).
Ç. Çöltekin / Informatiekunde Statistics II: Single ANOVA April 22, 2014 19 / 40

Previous topics Hypothesis testing ANOVA General Linear models Summary
Logic of ANOVA
We want to know whether there are any differences between themeans of k groups.
▶ If the variance between the groups is higher than the variancewithin the groups, there must be a significant group effect.
▶ Between group variance (MSbetween, or MSM or MSG) ischaracterized by variance between the group means.
▶ Within group variance (MSwithin, or MSR or MSE) ischaracterized by variance of data round the group means.
Then, the statistic of interest is
F =MSbetween
MSwithin
.
Ç. Çöltekin / Informatiekunde Statistics II: Single ANOVA April 22, 2014 20 / 40

Previous topics Hypothesis testing ANOVA General Linear models Summary
ANOVA: visualization0
24
68
10
group 1 group 2 group 3
F = MSbetween
MSwithin
F =SSbetweenDFbetweenSSwithinDFwithin
DFbetween = k− 1
DFwithin = n− k
where k is the number ofgroups, and n is thenumber of observations.
Ç. Çöltekin / Informatiekunde Statistics II: Single ANOVA April 22, 2014 21 / 40

Previous topics Hypothesis testing ANOVA General Linear models Summary
F-distribution
▶ Ratio of variancesfollows F distribution.
▶ F distribution has twoparameters,DFnumerator andDFdenominator.
▶ If variances are equal,we get F = 1.
▶ In ANOVA, we get aneffect if MSbetween islarger than MSwithin. 0 1 2 3 4 5
0.0
0.1
0.2
0.3
0.4
0.5
0.6
0.7
F
Den
sity
F3,10 distribution
p < 0.05
Ç. Çöltekin / Informatiekunde Statistics II: Single ANOVA April 22, 2014 22 / 40

Previous topics Hypothesis testing ANOVA General Linear models Summary
ANOVA: assumptions
▶ All observations are independent.▶ The response within each group follow an approximately
normal distribution.▶ The variances within each group are approximately the same.
Ç. Çöltekin / Informatiekunde Statistics II: Single ANOVA April 22, 2014 23 / 40

Previous topics Hypothesis testing ANOVA General Linear models Summary
ANOVA: example
We have two new designs for company web site, want to knowwhich one is easier to use. We test the new web site prototypesand the old one on three different group, and get their opinion viaa questionnaire with 7-point scale. The data looks like:
Old New 1 New 24.4 6.6 5.95.8 6.2 4.9
... ... ...Mean 4.76 5.03 6.11
Variance 1.11 1.12 0.97
Note: rows in the table are not related!
Ç. Çöltekin / Informatiekunde Statistics II: Single ANOVA April 22, 2014 24 / 40

Previous topics Hypothesis testing ANOVA General Linear models Summary
Visualizing the dataBox-and-whisker plots (or box plots) are one of the best ways tovisualize this type of data.
old new1 new2
01
23
45
67
Note: the vertical bars are medians.Ç. Çöltekin / Informatiekunde Statistics II: Single ANOVA April 22, 2014 25 / 40

Previous topics Hypothesis testing ANOVA General Linear models Summary
ANOVA results from software
Analysis of Variance TableResponse: ease
Df Sum Sq Mean Sq F value Pr(>F)design 2 10.796 5.3978 13.955 5.541e-06 ***Residuals 87 33.652 0.3868
▶ There is a significant effect (for any conventional α level, thep-values is 0.0000055)
▶ but we do not know where the effect is.
Ç. Çöltekin / Informatiekunde Statistics II: Single ANOVA April 22, 2014 26 / 40

Previous topics Hypothesis testing ANOVA General Linear models Summary
Regression with categorical predictors: some terminology
▶ We take ‘grouping’ variables like design as categorical (orfactor) variables.
▶ The values a categorical variable take are called levels.▶ A categorical variable with k levels is converted to k− 1
numeric variables, called ‘indicator’ or ‘dummy’ variables.
Ç. Çöltekin / Informatiekunde Statistics II: Single ANOVA April 22, 2014 27 / 40

Previous topics Hypothesis testing ANOVA General Linear models Summary
Regression with categorical predictors
▶ Consider the ‘design’ variable with three levels (‘old’, ‘new 1’,‘new 2’), we can code it as two variables, ‘Contrast 1’,‘Contrast 2’ :
design Contrast 1 Contrast 2old 0 0new 1 1 0new 2 0 1
▶ Other coding options (contrasts) are possible. With someconstraints, the inferences will not change.
Ç. Çöltekin / Informatiekunde Statistics II: Single ANOVA April 22, 2014 28 / 40

Previous topics Hypothesis testing ANOVA General Linear models Summary
An example with only two levels
Do men or women are better statisticians?
Normally we would do a t-test:Two Sample t-test
data: stat1grade by gendert = 0.2086, df = 37, p-value = 0.8359alt. hypothesis: true difference in means is not equal to 095 percent confidence interval:-0.7779205 0.9564919sample estimates:mean in group F mean in group M
7.375000 7.285714
Ç. Çöltekin / Informatiekunde Statistics II: Single ANOVA April 22, 2014 29 / 40

Previous topics Hypothesis testing ANOVA General Linear models Summary
An example with only two levels
Do men or women are better statisticians?Normally we would do a t-test:
Two Sample t-testdata: stat1grade by gendert = 0.2086, df = 37, p-value = 0.8359alt. hypothesis: true difference in means is not equal to 095 percent confidence interval:-0.7779205 0.9564919sample estimates:mean in group F mean in group M
7.375000 7.285714
Ç. Çöltekin / Informatiekunde Statistics II: Single ANOVA April 22, 2014 29 / 40

Previous topics Hypothesis testing ANOVA General Linear models Summary
Doing t-test with regression
▶ We have two levels of the predictor (F and M).▶ We code F as 0 and M as 1.
yi = a+ b× genderMi + ei
a (intercept) is the mean of level F.b (slope) is the mean difference between M and F.
Ç. Çöltekin / Informatiekunde Statistics II: Single ANOVA April 22, 2014 30 / 40

Previous topics Hypothesis testing ANOVA General Linear models Summary
Doing t-test with regression: practice
lm(formula = stat1grade ~ gender, data = survey)Estimate Std. Error t value Pr(>|t|)
(Intercept) 7.37500 0.18133 40.673 <2e-16genderM -0.08929 0.42800 -0.209 0.836---Residual standard error: 1.026 on 37 degrees of freedomMultiple R-squared: 0.001175, Adjusted R-squared: -0.02582F-statistic: 0.04352 on 1 and 37 DF, p-value: 0.8359
Ç. Çöltekin / Informatiekunde Statistics II: Single ANOVA April 22, 2014 31 / 40

Previous topics Hypothesis testing ANOVA General Linear models Summary
T-test as regression: the picture
0.0 0.2 0.4 0.6 0.8 1.0
56
78
9
gender (0=‘F’, 1=‘M’)
Sta
tistic
s1
grad
e
R2 = 0intercept = 7.37
slope = -0.09 (p = 0.84 )
Ç. Çöltekin / Informatiekunde Statistics II: Single ANOVA April 22, 2014 32 / 40

Previous topics Hypothesis testing ANOVA General Linear models Summary
T-test as regression: the picture
0 1 2 3 4 5
56
78
9
gender (0=‘F’, 5=‘M’)
Sta
tistic
s1
grad
e
R2 = 0intercept = 7.37
slope = -0.09 (p = 0.84 )
Ç. Çöltekin / Informatiekunde Statistics II: Single ANOVA April 22, 2014 32 / 40

Previous topics Hypothesis testing ANOVA General Linear models Summary
ANOVA as regression
Back to our web-site design example.
yi = a+ b1 × x1,i + b2 × x2,i + ei
a (intercept) is the mean of old design.b1 (slope of x1) is the mean difference between new 1 and old.b2 (slope of x2) is the mean difference between new 2 and old.
Ç. Çöltekin / Informatiekunde Statistics II: Single ANOVA April 22, 2014 33 / 40

Previous topics Hypothesis testing ANOVA General Linear models Summary
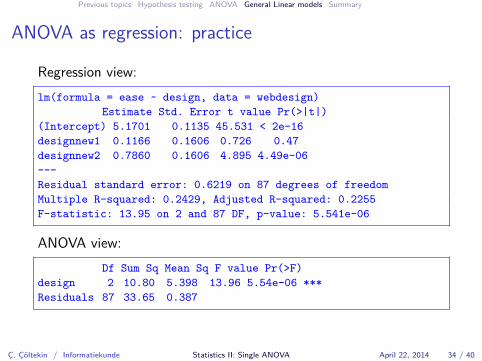
ANOVA as regression: practice
Regression view:lm(formula = ease ~ design, data = webdesign)
Estimate Std. Error t value Pr(>|t|)(Intercept) 5.1701 0.1135 45.531 < 2e-16designnew1 0.1166 0.1606 0.726 0.47designnew2 0.7860 0.1606 4.895 4.49e-06---Residual standard error: 0.6219 on 87 degrees of freedomMultiple R-squared: 0.2429, Adjusted R-squared: 0.2255F-statistic: 13.95 on 2 and 87 DF, p-value: 5.541e-06
ANOVA view:Df Sum Sq Mean Sq F value Pr(>F)
design 2 10.80 5.398 13.96 5.54e-06 ***Residuals 87 33.65 0.387
Ç. Çöltekin / Informatiekunde Statistics II: Single ANOVA April 22, 2014 34 / 40
Previous topics Hypothesis testing ANOVA General Linear models Summary
ANOVA as regression: practice
Regression view:lm(formula = ease ~ design, data = webdesign)
Estimate Std. Error t value Pr(>|t|)(Intercept) 5.1701 0.1135 45.531 < 2e-16designnew1 0.1166 0.1606 0.726 0.47designnew2 0.7860 0.1606 4.895 4.49e-06---Residual standard error: 0.6219 on 87 degrees of freedomMultiple R-squared: 0.2429, Adjusted R-squared: 0.2255F-statistic: 13.95 on 2 and 87 DF, p-value: 5.541e-06
ANOVA view:Df Sum Sq Mean Sq F value Pr(>F)
design 2 10.80 5.398 13.96 5.54e-06 ***Residuals 87 33.65 0.387
Ç. Çöltekin / Informatiekunde Statistics II: Single ANOVA April 22, 2014 34 / 40

Previous topics Hypothesis testing ANOVA General Linear models Summary
ANOVA as regression: the picture
0.0 0.2 0.4 0.6 0.8 1.0 3.5
4.0
4.5
5.0
5.5
6.0
6.5
7.0
0.00.2
0.40.6
0.81.0
ease
ofus
e
old new1
new2
Ç. Çöltekin / Informatiekunde Statistics II: Single ANOVA April 22, 2014 35 / 40

Previous topics Hypothesis testing ANOVA General Linear models Summary
Contrast coding
▶ For k levels (or groups) we have k− 1 coefficients.▶ We can code some comparisons (contrasts) into these
coefficients to test for differences between certain groups, orcertain trends due to groups.
▶ If the contrasts does not inflate the t-value (does not causeadditional Type I error) it is called an orthogonal contrast.
Ç. Çöltekin / Informatiekunde Statistics II: Single ANOVA April 22, 2014 36 / 40

Previous topics Hypothesis testing ANOVA General Linear models Summary
Example: different contrastsWe have 3 groups, so we can specify 2 contrasts. Two interestingquestions to ask:
1. Are new designs (on average) better than the old one?2. Are the new designs different?
design x1 x2
old −2 0new 1 1 -1new 2 1 1
▶ A contrast is orthogonal if columns sum to 0 and product ofrows sum to 0.
▶ Orthogonal contrasts do not increase Type I errors.
Ç. Çöltekin / Informatiekunde Statistics II: Single ANOVA April 22, 2014 37 / 40
Previous topics Hypothesis testing ANOVA General Linear models Summary
Post-hoc comparisons
▶ In most cases, you will have a specific hypothesis and a(small) set of comparisons to make.
▶ You can do pairwise comparisons once you found a significantANOVA result.
▶ Every comparison you make increases finding a significantdifference where there isn’t any (Type I error).
▶ If you do multiple comparisons you need to correct for it.▶ Correction is applied such that your α-level is adjusted (called
family-wise error rate).
Ç. Çöltekin / Informatiekunde Statistics II: Single ANOVA April 22, 2014 38 / 40

Previous topics Hypothesis testing ANOVA General Linear models Summary
Post-hoc comparisons (2)
Remember: finding a significant difference means that there is achance (for example, p = 0.05) of finding a difference when thereis no difference (null hypothesis is true).
▶ The simplest (and most conservative) correction is called‘Bonferroni’ correction, which is obtained by dividing α tonumber of comparisons. If you have α = 0.05 and n
comparisons your family-wise α should be 0.05n
.▶ Bonferroni correction is safe in all cases, but increases the
Type II error rate.▶ There are other multiple-comparison methods that are more
powerful, but they typically apply only in specific cases.
Ç. Çöltekin / Informatiekunde Statistics II: Single ANOVA April 22, 2014 39 / 40

Previous topics Hypothesis testing ANOVA General Linear models Summary
Summary
▶ Single ANOVA is used when we have a single factor with morethan two levels/groups.
▶ ANOVA tests whether there is a difference between means ofthe groups by comparing the variance within the groups, andvariance of the means of the groups.
▶ ANOVA tests for ‘any difference’, you can inspect specificdifferences through planned contrasts, or post-hoccomparisons.
▶ ANOVA is a specific case of regression.Next week: more ANOVA. Reading: Ch. 12 (13 in 4th edition),‘factorial ANOVA’.
Ç. Çöltekin / Informatiekunde Statistics II: Single ANOVA April 22, 2014 40 / 40