item-wise anova analysis of human resource ... - IJRAR
12
© 2020 IJRAR February 2020, Volume 7, Issue 1 www.ijrar.org (E-ISSN 2348-1269, P- ISSN 2349-5138) IJRAR2001336 International Journal of Research and Analytical Reviews (IJRAR) www.ijrar.org 458 ITEM-WISE ANOVA ANALYSIS OF HUMAN RESOURCE DEVELOPMENT CLIMATE IN INDIAN INFORMATION TECHNOLOGY ORGANISATIONS Dr. Deepakshi Gupta, HOD and Assistant Professor, P.G. Department of Economics, Sikh National College, Banga, Punjab, India. ABSTRACT Human resource development climate is an integral part of organisational climate. The present paper, examines ANOVA analysis of human resource development climate of different information technology organizations in India. The study is based on survey of in 13 selected information technology organisations such as Tata Consultancy Services, Wipro Technologies, Infosys Technologies Ltd., Hindustan Computer Ltd. (HCL), Dell International, Birlasoft, Pyramid Consulting Inc., Quark Inc., Semi-Conductor Laboratory (SCL Ltd.), Alcatel-Lucent Technologies, Attra, Kanbay International and Omnia Technologies from Delhi, Bangalore, Pune, Chandigarh and Mohali respectively. The results from ANOVA analysis proves that human resource development climate in information technology sector varies from organisation to organisation. KEYWORDS ANOVA analysis, Human Resource Development Climate, Information Technology Organisations INTRODUCTION Human resources are the most valuable and unique asset of an organisation. Now a days, the world has become a global village, so managing and developing different employees belonging to different cultures under one organisation is a very dynamic and challenging task. The nature of human resource is not similar in mental abilities, traditions, sentiments and behaviour. They are widely different from each other as an individual person and as a group of persons. It is very difficult to attract, develop, retain and satisfy all employees simultaneously for an organisation to get a desirable outcome. It is therefore necessary for all human resources managers to understand and give due importance to the different human resource policies and activities in the organisation (Mamoria, C.B. and S.V. Gankar, 2002, pp.8-10; ICFAI (a), 2004, pp.17-20). Peter Drucker, who is credited with first coining of the term ‘Knowledge Workers’ or ‘Knowledge HR’, observed in his book, Post Capital Society (1993) that we are entering in a knowledge society. Where the basic economic resource is no longer capital, natural resource or labour but is and will be knowledge workers who play a central role. He suggested that various classes of knowledge workers, of which high knowledge workers include professionals, such as doctors, teachers and consultants, who deal mainly in the realm of the mind. While on the other hand, another class of knowledge workers is – the knowledge technicians who work with their hands and brains in the industries of IT, medical and other areas. In highly skilled intensive and knowledge intensive industries like information technology industry, human resource plays a vital role. This industry needs highly skilled, talented and well-learned human resource.
-
Upload
khangminh22 -
Category
Documents
-
view
0 -
download
0
Transcript of item-wise anova analysis of human resource ... - IJRAR
© 2020 IJRAR February 2020, Volume 7, Issue 1 www.ijrar.org (E-ISSN 2348-1269, P- ISSN 2349-5138)
IJRAR2001336 International Journal of Research and Analytical Reviews (IJRAR) www.ijrar.org 458
ITEM-WISE ANOVA ANALYSIS OF HUMAN
RESOURCE DEVELOPMENT CLIMATE IN
INDIAN INFORMATION TECHNOLOGY
ORGANISATIONS
Dr. Deepakshi Gupta,
HOD and Assistant Professor,
P.G. Department of Economics,
Sikh National College, Banga, Punjab, India.
ABSTRACT
Human resource development climate is an integral part of organisational climate. The present paper, examines ANOVA analysis
of human resource development climate of different information technology organizations in India. The study is based on survey of in 13
selected information technology organisations such as Tata Consultancy Services, Wipro Technologies, Infosys Technologies Ltd.,
Hindustan Computer Ltd. (HCL), Dell International, Birlasoft, Pyramid Consulting Inc., Quark Inc., Semi-Conductor Laboratory (SCL Ltd.),
Alcatel-Lucent Technologies, Attra, Kanbay International and Omnia Technologies from Delhi, Bangalore, Pune, Chandigarh and Mohali
respectively. The results from ANOVA analysis proves that human resource development climate in information technology sector varies
from organisation to organisation.
KEYWORDS
ANOVA analysis, Human Resource Development Climate, Information Technology Organisations
INTRODUCTION
Human resources are the most valuable and unique asset of an organisation. Now a days, the world has
become a global village, so managing and developing different employees belonging to different cultures under one
organisation is a very dynamic and challenging task. The nature of human resource is not similar in mental abilities,
traditions, sentiments and behaviour. They are widely different from each other as an individual person and as a
group of persons. It is very difficult to attract, develop, retain and satisfy all employees simultaneously for an
organisation to get a desirable outcome. It is therefore necessary for all human resources managers to understand and
give due importance to the different human resource policies and activities in the organisation (Mamoria, C.B. and
S.V. Gankar, 2002, pp.8-10; ICFAI (a), 2004, pp.17-20). Peter Drucker, who is credited with first coining of the term
‘Knowledge Workers’ or ‘Knowledge HR’, observed in his book, Post Capital Society (1993) that we are entering in
a knowledge society. Where the basic economic resource is no longer capital, natural resource or labour but is and
will be knowledge workers who play a central role. He suggested that various classes of knowledge workers, of
which high knowledge workers include professionals, such as doctors, teachers and consultants, who deal mainly in
the realm of the mind. While on the other hand, another class of knowledge workers is – the knowledge technicians
who work with their hands and brains in the industries of IT, medical and other areas. In highly skilled intensive and
knowledge intensive industries like information technology industry, human resource plays a vital role. This industry
needs highly skilled, talented and well-learned human resource.

© 2020 IJRAR February 2020, Volume 7, Issue 1 www.ijrar.org (E-ISSN 2348-1269, P- ISSN 2349-5138)
IJRAR2001336 International Journal of Research and Analytical Reviews (IJRAR) www.ijrar.org 459
OBJECTIVES OF PRESENT STUDY- The objectives of present study,” Item-Wise Anova Analysis of Human
Resource Development Climate in Indian Information Technology Organisations” is as following:-
1. To observe and analyse the human resource development climate prevailing in the information technology
industry.
2. To analyse and compare the human resource development climate prevailing in the selected information
technology organisations.
3. To examine the human resource development climate in different Indian information organizations is similar or
dissimilar.
REVIEW OF LITRATURE
A survey of human resource development practices was conducted by Rao, T.V. in (1984) covering 53
different organisations in India. This survey indicates, by and large, a positive trend of using open appraisal system,
improving the training function, making up organisational development activities and using employees counselling
by an increasingly large number of companies. All in all, human resource development seems to be becoming a
significant aspect of work and life in many organisations. Rao, T.V. and E. Abraham S.J. (1991) studied the human
resource development climate in the surveyed organisations and found it to be at average level in India. Aileni,
Vidyadhar Reddy (1995) examined the relationship between organisational climate and job satisfaction of the lower
level managers in a public sector undertaking. The study reveals that the satisfied group gave top ranks to
interpersonal relationship, risk taking and management of rewards. On the other side, the dissatisfied group gave top
priority to supervision, communication and decision-making. Jain, V.K. and K.C. Singhal (1997) study took into
account three human resource development mechanisms including management policy, potential appraisal and
organisational development to study variances of human resource development climate on account of these
mechanisms. The effect of personal factors on human resource development climate was found to be low but positive.
Pillai, Prakash R. (2000) makes an attempt to study the influence of the human resource development climate
existing in banks on the learning orientation of the employees. The findings of the study show that about 57 percent
of respondents perceive the learning, and development climate existing in banks as moderate. Pattanayak, Biswajeet
(2000) conducted a study on, the effect of shift-work and hierarchical position on satisfaction, commitment, stress
and human resource development climate in a steel plant. The study calls for greater emphasis to be laid on human
resource development interventions for improving organisational synergy. Tripathi, Sangeeta and Nachiketa
Tripathi (2002) studied the relationship between organisational climate and organisational success; which includes
effectiveness, job satisfaction, organisational commitment and intention to quit. The results show that the climate is
highly correlated with all components of effectiveness. Ganesan, P., V. Samuel, Rajkumar and V. Saravanan
(2002), studied the ‘Determinants of Employee Relations Climate in Public Sector Undertakings.’ The study revealed
that by improving factors like working conditions, level of supervision, communication and worker’s participation
etc. favourable climate can be achieved. Purang, Pooja (2006) in a comparative study of Public, Private and
Multinational organizations shows that the human resource development climate scores of the two private
organisations and the MNC are significantly higher than the two PSUs. Majee, Kunal K. (2006) study of
Chittaranjan Locomotive Workshop finds moderate level of HRD Climate with a lot of scope for improvement
© 2020 IJRAR February 2020, Volume 7, Issue 1 www.ijrar.org (E-ISSN 2348-1269, P- ISSN 2349-5138)
IJRAR2001336 International Journal of Research and Analytical Reviews (IJRAR) www.ijrar.org 460
because HRD climate is the lifeblood for organization. Mufeed, S.A. (2006) highlights the need for a focus on key
elements of human resource development in hospitals. Lim, Doo Hun and Michael Lane Morris (2006) study
reveals that trainees’ characteristics, instructional factors and organisational climate are closely correlated with both
the trainees perceived learning and learning transfer collectively. Srimannarayana, M. (2007) attempted to assess
the extent of human resource development climate in Dubai organisations, such as shipping, banking, tourism, trading
and food businesses. The results reveal moderate level of general HRD climate in the organisations. Saraswathi, S.
(2010) study revealed that the three variables: General Climate, HRD Mechanisms and OCTAPACE culture
(Openness, Confrontation, Trust, Autonomy, Pro-activity, Authenticity, Collaboration and Experimentation) are
better in software organisations compared to manufacturing organisations. Kashi Singh and Abhijit Bhattacharya
(2008), conducted a study on, ‘High Performance Organisations: Relationship with Human Resource Policies and
Practices,’ to examine the relationship between organisational performance and human resource policies and
practices. It is hypothesized that human resource policies and practices will have a positive relationship with
organisational performance. A list of 300 companies is prepared. The data used in this study is collected from 49
organisations consisting of 18 public sectors and 31 private sectors. Pearson correlation and step-wise regression
analysis is used to analyze the data. For measuring organisational performance and human resource policy, five point
Likert-scale scores ranging from 1 to 5 is used. Saraswathi, S. (2010) study revealed that the three variables: General
Climate, HRD Mechanisms and OCTAPACE culture (Openness, Confrontation, Trust, Autonomy, Pro-activity,
Authenticity, Collaboration and Experimentation) are better in software organisations compared to manufacturing
organisations.
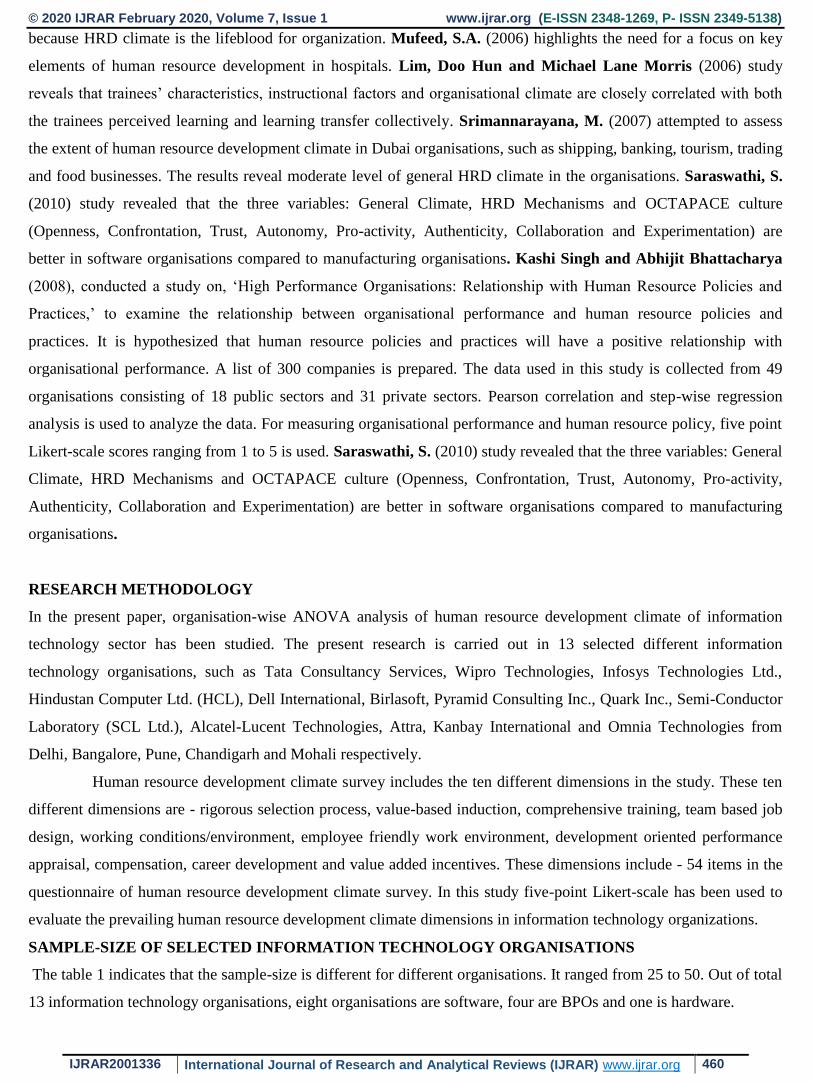
RESEARCH METHODOLOGY
In the present paper, organisation-wise ANOVA analysis of human resource development climate of information
technology sector has been studied. The present research is carried out in 13 selected different information
technology organisations, such as Tata Consultancy Services, Wipro Technologies, Infosys Technologies Ltd.,
Hindustan Computer Ltd. (HCL), Dell International, Birlasoft, Pyramid Consulting Inc., Quark Inc., Semi-Conductor
Laboratory (SCL Ltd.), Alcatel-Lucent Technologies, Attra, Kanbay International and Omnia Technologies from
Delhi, Bangalore, Pune, Chandigarh and Mohali respectively.
Human resource development climate survey includes the ten different dimensions in the study. These ten
different dimensions are - rigorous selection process, value-based induction, comprehensive training, team based job
design, working conditions/environment, employee friendly work environment, development oriented performance
appraisal, compensation, career development and value added incentives. These dimensions include - 54 items in the
questionnaire of human resource development climate survey. In this study five-point Likert-scale has been used to
evaluate the prevailing human resource development climate dimensions in information technology organizations.
SAMPLE-SIZE OF SELECTED INFORMATION TECHNOLOGY ORGANISATIONS
The table 1 indicates that the sample-size is different for different organisations. It ranged from 25 to 50. Out of total
13 information technology organisations, eight organisations are software, four are BPOs and one is hardware.
© 2020 IJRAR February 2020, Volume 7, Issue 1 www.ijrar.org (E-ISSN 2348-1269, P- ISSN 2349-5138)
IJRAR2001336 International Journal of Research and Analytical Reviews (IJRAR) www.ijrar.org 461
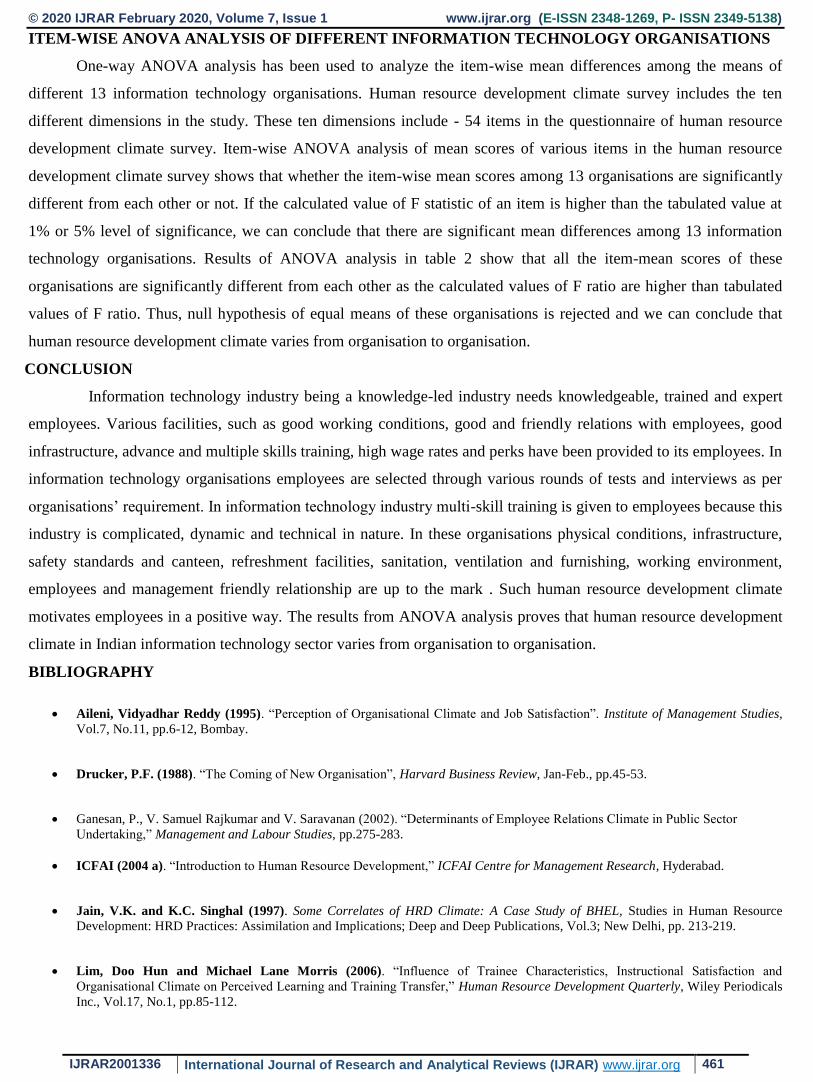
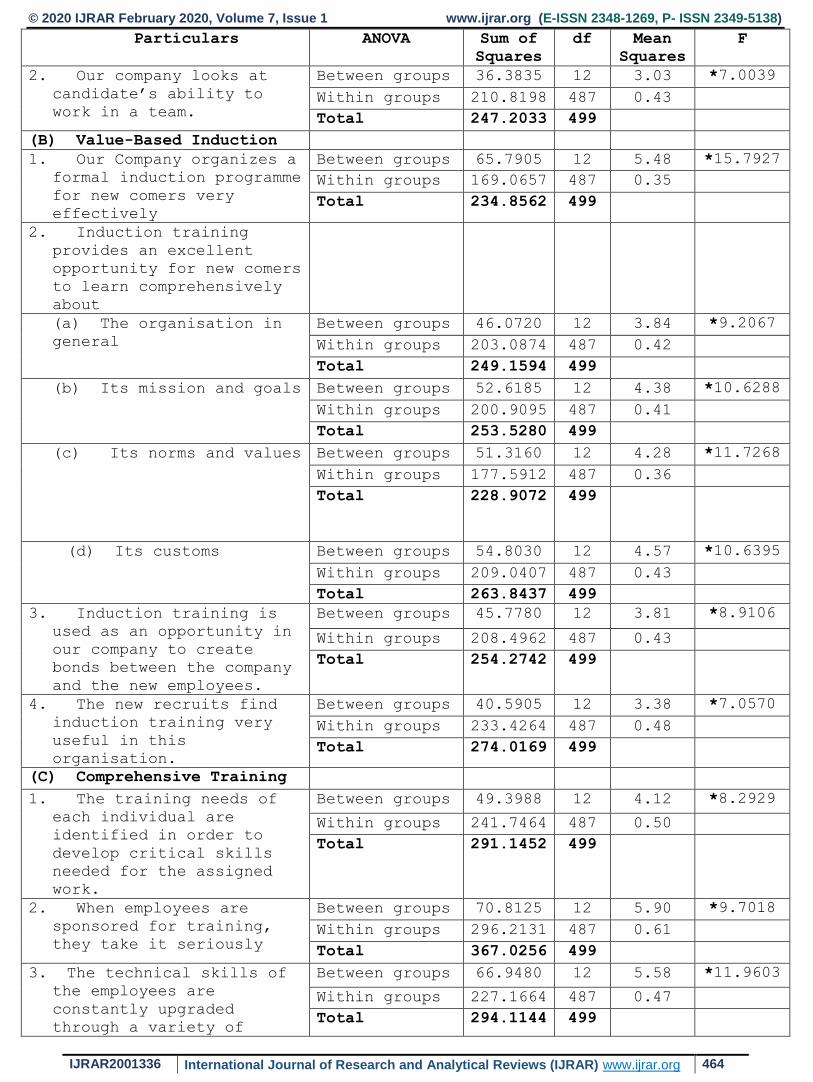
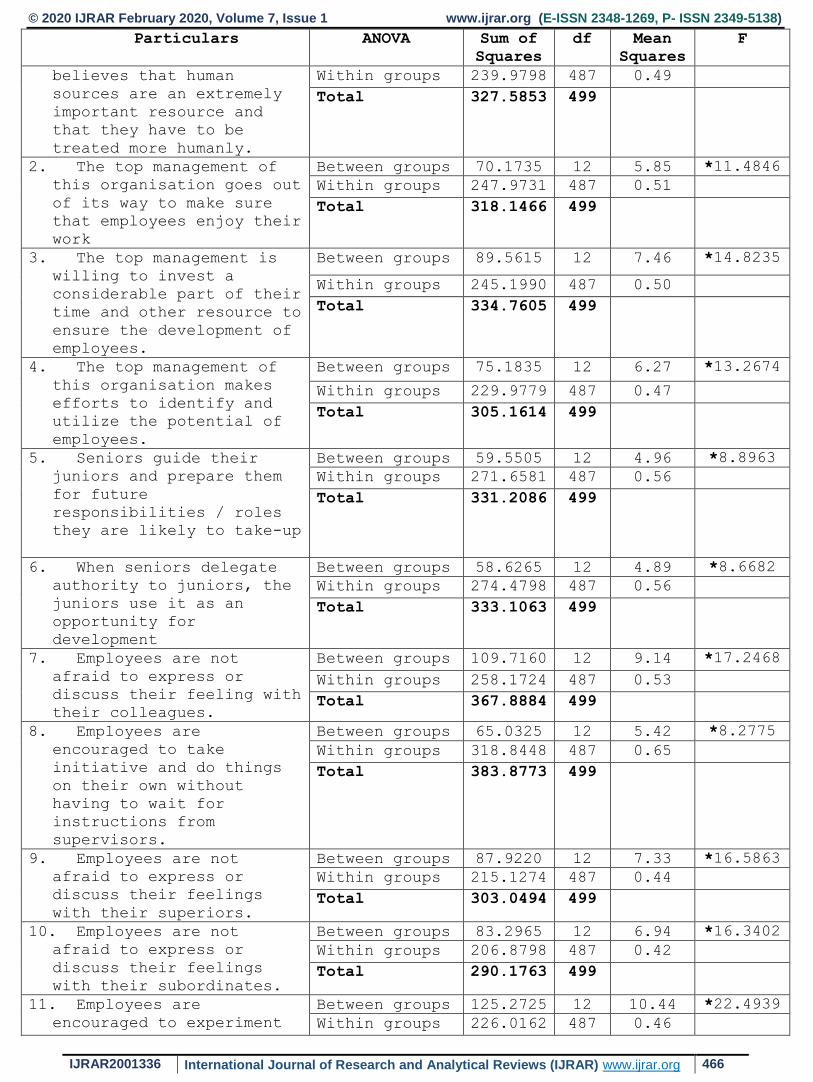
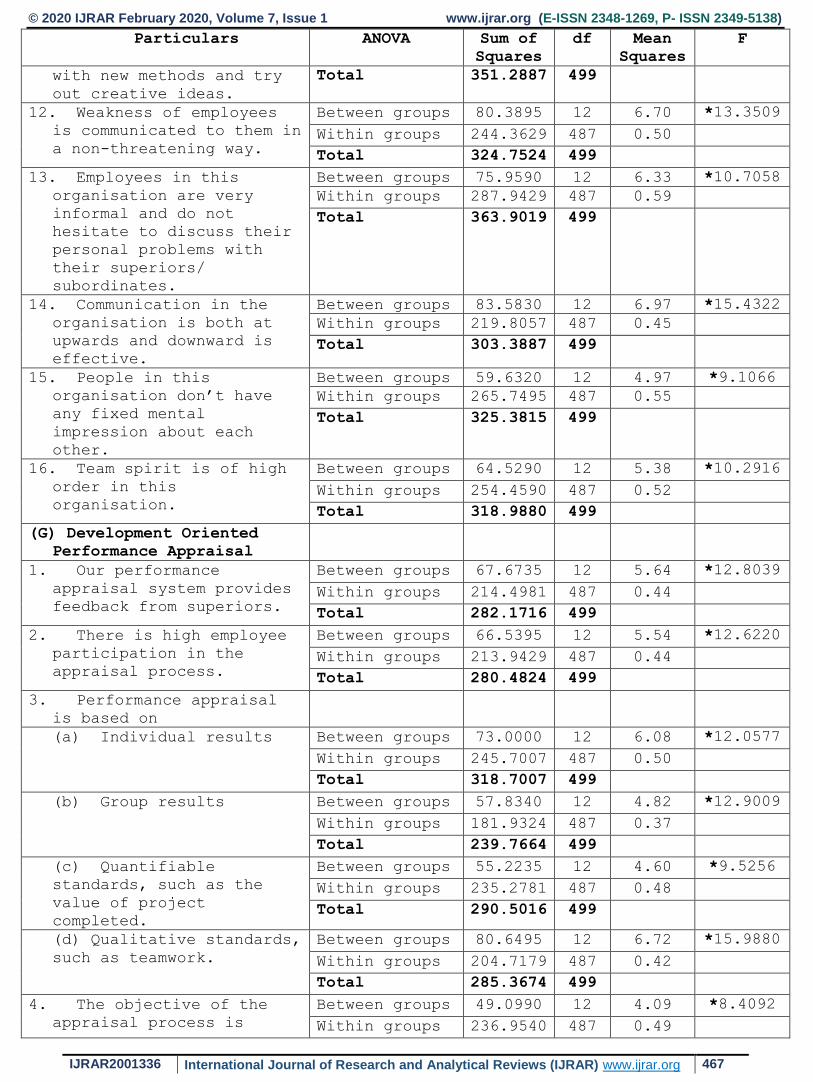
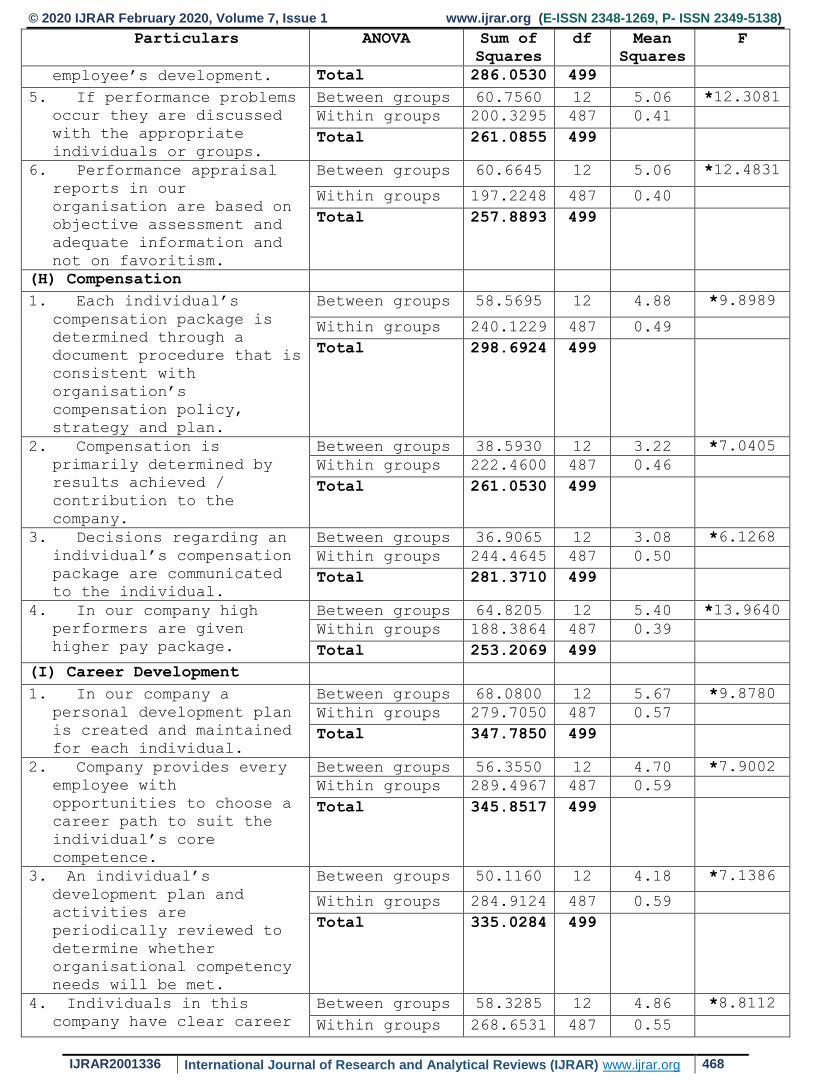
ITEM-WISE ANOVA ANALYSIS OF DIFFERENT INFORMATION TECHNOLOGY ORGANISATIONS
One-way ANOVA analysis has been used to analyze the item-wise mean differences among the means of
different 13 information technology organisations. Human resource development climate survey includes the ten
different dimensions in the study. These ten dimensions include - 54 items in the questionnaire of human resource
development climate survey. Item-wise ANOVA analysis of mean scores of various items in the human resource
development climate survey shows that whether the item-wise mean scores among 13 organisations are significantly
different from each other or not. If the calculated value of F statistic of an item is higher than the tabulated value at
1% or 5% level of significance, we can conclude that there are significant mean differences among 13 information
technology organisations. Results of ANOVA analysis in table 2 show that all the item-mean scores of these
organisations are significantly different from each other as the calculated values of F ratio are higher than tabulated
values of F ratio. Thus, null hypothesis of equal means of these organisations is rejected and we can conclude that
human resource development climate varies from organisation to organisation.
CONCLUSION
Information technology industry being a knowledge-led industry needs knowledgeable, trained and expert
employees. Various facilities, such as good working conditions, good and friendly relations with employees, good
infrastructure, advance and multiple skills training, high wage rates and perks have been provided to its employees. In
information technology organisations employees are selected through various rounds of tests and interviews as per
organisations’ requirement. In information technology industry multi-skill training is given to employees because this
industry is complicated, dynamic and technical in nature. In these organisations physical conditions, infrastructure,
safety standards and canteen, refreshment facilities, sanitation, ventilation and furnishing, working environment,
employees and management friendly relationship are up to the mark . Such human resource development climate
motivates employees in a positive way. The results from ANOVA analysis proves that human resource development
climate in Indian information technology sector varies from organisation to organisation.
BIBLIOGRAPHY
Aileni, Vidyadhar Reddy (1995). “Perception of Organisational Climate and Job Satisfaction”. Institute of Management Studies,
Vol.7, No.11, pp.6-12, Bombay.
Drucker, P.F. (1988). “The Coming of New Organisation”, Harvard Business Review, Jan-Feb., pp.45-53.
Ganesan, P., V. Samuel Rajkumar and V. Saravanan (2002). “Determinants of Employee Relations Climate in Public Sector
Undertaking,” Management and Labour Studies, pp.275-283.
ICFAI (2004 a). “Introduction to Human Resource Development,” ICFAI Centre for Management Research, Hyderabad.
Jain, V.K. and K.C. Singhal (1997). Some Correlates of HRD Climate: A Case Study of BHEL, Studies in Human Resource
Development: HRD Practices: Assimilation and Implications; Deep and Deep Publications, Vol.3; New Delhi, pp. 213-219.
Lim, Doo Hun and Michael Lane Morris (2006). “Influence of Trainee Characteristics, Instructional Satisfaction and
Organisational Climate on Perceived Learning and Training Transfer,” Human Resource Development Quarterly, Wiley Periodicals
Inc., Vol.17, No.1, pp.85-112.
© 2020 IJRAR February 2020, Volume 7, Issue 1 www.ijrar.org (E-ISSN 2348-1269, P- ISSN 2349-5138)
IJRAR2001336 International Journal of Research and Analytical Reviews (IJRAR) www.ijrar.org 462
Majee, Kunal K. (2006). “Human Resource Climate Survey of Chittaranjan Locomotive Workshop,” Management and Labour
Studies, Vol.31, No.1, pp.70-78.
Mamoria, C.B. and S.V. Gankar (2002). Personnel Management: Text and Cases, Himalaya Publishing House, p. 541.
Mufeed, S.A. (2006). “The Need for a Focus on Key Elements of HRD Climate in Hospitals - An Empirical Study,” Management
and Labour Studies, Vol.31, No.1, pp 57-68.
Pattanayak, Biswajeet (2000). “Effects of Shift Work and Hierarchical Position on Satisfaction Commitment, Stress and HRD
Climate: A Study on an Integrated Steel Plant.” Management and Labour Studies, Vol.25, No.2, April, pp.126-134.
Paul, A.K. and R.N. Anantharaman (2002). “Impact of HRM Practices on Competence of Software Professional in India: An
Analytical Study,” Management and Change, Vol. 6, No.1, pp. 95-111.
Pillai, Prakash R. (2000). “Influence of HRD Climate on the Learning Orientation of Bank Employers,” Indian Journal of
Industrial Relation, Vol.43, No.3, pp. 406-418.
Purang, Pooja (2006). “HRD Climate: A Comparative Analysis of Public, Private and Multinational Organisations,” Indian
Journal of Industrial Relation, Vol. 41, No.3. pp. 407-419.
Rao, T.V. (1984). “HRD Practices in Indian Industry,” LOK Udyog, March, pp.5-15.
Rao, T.V. and E. Abraham S.J. (1991). “HRD Climate in Organisation”, Reading in HRD, Indian Institute of Management,
Ahmedabad, pp.36-71.
Rao, T.V. and E. Abraham S.J. (1986). “Human Resources Development Climate in Indian Organisation,” Recent Experiences in
Human Resources Development, Oxford and IBH, New Delhi, pp.70-98.
Saraswathi, S. (2010). “Human Resources Development Climate: An Empirical Study,” International Journal of Innovation,
Management and Technology, Vol. 1, No. 2.
Shailendra Singh, Naresh Kashi Singh and Abhijit Bhattacharya (2008). “High Performance Organisations: Relationship with
Human Resource Policies and Practices,” Indian Journal of Industrial Relation, Vol.43, No.4, April, pp.507-526.
Srimannarayana, M. (2007). “Human Resource Development Climate in Dubai Organisations”, Indian Journal of Industrial
Relation, Vol. 43, No. 1, July, pp.1-12.
Sukalyani, Swati and Biswajeet Pattanayak (2004). “Organisational Climate: An Exploratory Study on NALCO,” Management
and Labour Studies, Vol.24 No.2, May, pp.109-117.
Tripathi, Sangeeta and Nachiketa Tripathi (2002). “The Effect of Organisational Climate on Organisational Success,” Indian
Journal of Industrial Relation, Vol.38, No.2, pp.160-174.

© 2020 IJRAR February 2020, Volume 7, Issue 1 www.ijrar.org (E-ISSN 2348-1269, P- ISSN 2349-5138)
IJRAR2001336 International Journal of Research and Analytical Reviews (IJRAR) www.ijrar.org 463
Table 1
Sample Size of Selected Information Technology
Organisations
S.
No.
Name of Organisations Nature of
Organisations
Sample-
Size
1 Tata Consultancy
Services
Software 30
2 Wipro Technologies Software 30
3 Infosys Technologies
Ltd.
Software 30
4 Hindustan Computer
Ltd.(HCL)
BPO 30
5 Dell International BPO 50
6 Birlasoft Software 25
7 Pyramid Consulting Inc. BPO 50
8 Semi-Conductor
Laboratory (SCL)
Hardware 30
9 Alcatel-Lucent
Technologies
Software 50
10 Attra Software 35
11 Kanbay International
Inc.
Software 40
12 Omnia Technologies BPO 50
13 Quark Software 50
Source: Primary Survey
Table 2
Item-Wise ANOVA Analysis of Different Information
Technology Organisations
Particulars ANOVA Sum of
Squares
df Mean
Squares
F
(A ) Rigorous Selection
Process
1. Select the candidates,
our company conducts
(a) Written Test Between groups 27.2775 12 2.27 *5.0113
Within groups 220.9048 487 0.45
Total 248.1823 499
(b) Test On Programming
Skills
Between groups 43.9785 12 3.66 *8.0504
Within groups 221.7013 487 0.46
Total 265.6798 499
(c) Technical Interview Between groups 32.4220 12 2.70 *8.5253
Within groups 154.3390 487 0.32
Total 186.7610 499
(d) General Interview Between groups 47.3615 12 3.95 *12.3562
Within groups 155.5562 487 0.32
Total 202.9177 499
© 2020 IJRAR February 2020, Volume 7, Issue 1 www.ijrar.org (E-ISSN 2348-1269, P- ISSN 2349-5138)
IJRAR2001336 International Journal of Research and Analytical Reviews (IJRAR) www.ijrar.org 464
Particulars ANOVA Sum of
Squares
df Mean
Squares
F
2. Our company looks at
candidate’s ability to
work in a team.
Between groups 36.3835 12 3.03 *7.0039
Within groups 210.8198 487 0.43
Total 247.2033 499
(B) Value-Based Induction
1. Our Company organizes a
formal induction programme
for new comers very
effectively
Between groups 65.7905 12 5.48 *15.7927
Within groups 169.0657 487 0.35
Total 234.8562 499
2. Induction training
provides an excellent
opportunity for new comers
to learn comprehensively
about
(a) The organisation in
general
Between groups 46.0720 12 3.84 *9.2067
Within groups 203.0874 487 0.42
Total 249.1594 499
(b) Its mission and goals Between groups 52.6185 12 4.38 *10.6288
Within groups 200.9095 487 0.41
Total 253.5280 499
(c) Its norms and values Between groups 51.3160 12 4.28 *11.7268
Within groups 177.5912 487 0.36
Total 228.9072 499
(d) Its customs Between groups 54.8030 12 4.57 *10.6395
Within groups 209.0407 487 0.43
Total 263.8437 499
3. Induction training is
used as an opportunity in
our company to create
bonds between the company
and the new employees.
Between groups 45.7780 12 3.81 *8.9106
Within groups 208.4962 487 0.43
Total 254.2742 499
4. The new recruits find
induction training very
useful in this
organisation.
Between groups 40.5905 12 3.38 *7.0570
Within groups 233.4264 487 0.48
Total 274.0169 499
(C) Comprehensive Training
1. The training needs of
each individual are
identified in order to
develop critical skills
needed for the assigned
work.
Between groups 49.3988 12 4.12 *8.2929
Within groups 241.7464 487 0.50
Total 291.1452 499
2. When employees are
sponsored for training,
they take it seriously
Between groups 70.8125 12 5.90 *9.7018
Within groups 296.2131 487 0.61
Total 367.0256 499
3. The technical skills of
the employees are
constantly upgraded
through a variety of
Between groups 66.9480 12 5.58 *11.9603
Within groups 227.1664 487 0.47
Total 294.1144 499

© 2020 IJRAR February 2020, Volume 7, Issue 1 www.ijrar.org (E-ISSN 2348-1269, P- ISSN 2349-5138)
IJRAR2001336 International Journal of Research and Analytical Reviews (IJRAR) www.ijrar.org 465
Particulars ANOVA Sum of
Squares
df Mean
Squares
F
training programmes,
workshops and seminar
(D) Team-Based Job Design
1. Self-managed work teams
and semi-autonomous work
groups are the building
blocks of the work system
Between groups 51.1850 12 4.27 *7.9903
Within groups 259.9724 487 0.53
Total 311.1574 499
2. The actual job duties
are shaped more by the
employees than by a
specific job description
Between groups 32.1330 12 2.68 *5.1195
Within groups 254.7257 487 0.52
Total 286.8587 499
3. Employees are given the
details of the consumers
and their requirements
Between groups 47.2480 12 3.94 *9.5884
Within groups 199.9800 487 0.41
Total 247.2280 499
4. Individuals and groups
are involved in making
decisions that affect
their work
Between groups 47.6630 12 3.97 *9.3726
Within groups 206.3817 487 0.42
Total 254.0447 499
(E) Working Conditions/
Environment
1. The quality of physical
conditions provided in the
work-place is good.
Between groups 16.0200 12 1.34 *2.9909
Within groups 217.3712 487 0.45
Total 233.3912 499
2. Our company provider
excellent infrastructure
and support services for
high performance.
Between groups 54.9965 12 4.58 *8.2172
Within groups 271.6181 487 0.56
Total 326.6146 499
3. Sources of frequent
interruption or
distraction that degrade
the effectiveness of work
environment are identified
and minimized
Between groups 46.9715 12 3.91 *9.0086
Within groups 211.6048 487 0.43
Total 258.5763 499
4. Periodic improvements
are made to the work
environment that increases
effectiveness in
performing work
Between groups 49.9730 12 4.16 *8.7869
Within groups 230.8057 487 0.47
Total 280.7787 499
5. Sanitation, ventilation
and furnishing facilities
in the company are good
Between groups 75.6465 12 6.30 *14.9399
Within groups 205.4895 487 0.42
Total 281.1360 499
6. Canteen and refreshment
facilities arrangement are
good
Between groups 76.0390 12 6.34 *12.3835
Within groups 249.1962 487 0.51
Total 325.2352 499
7. Safety standards
maintained by the
department are good
Between groups 68.5980 12 5.72 *14.4901
Within groups 192.1274 487 0.39
Total 260.7254 499
(F) Employee Friendly Work
Environment
1. The top management Between groups 87.6055 12 7.30 *14.8151
© 2020 IJRAR February 2020, Volume 7, Issue 1 www.ijrar.org (E-ISSN 2348-1269, P- ISSN 2349-5138)
IJRAR2001336 International Journal of Research and Analytical Reviews (IJRAR) www.ijrar.org 466
Particulars ANOVA Sum of
Squares
df Mean
Squares
F
believes that human
sources are an extremely
important resource and
that they have to be
treated more humanly.
Within groups 239.9798 487 0.49
Total 327.5853 499
2. The top management of
this organisation goes out
of its way to make sure
that employees enjoy their
work
Between groups 70.1735 12 5.85 *11.4846
Within groups 247.9731 487 0.51
Total 318.1466 499
3. The top management is
willing to invest a
considerable part of their
time and other resource to
ensure the development of
employees.
Between groups 89.5615 12 7.46 *14.8235
Within groups 245.1990 487 0.50
Total 334.7605 499
4. The top management of
this organisation makes
efforts to identify and
utilize the potential of
employees.
Between groups 75.1835 12 6.27 *13.2674
Within groups 229.9779 487 0.47
Total 305.1614 499
5. Seniors guide their
juniors and prepare them
for future
responsibilities / roles
they are likely to take-up
Between groups 59.5505 12 4.96 *8.8963
Within groups 271.6581 487 0.56
Total 331.2086 499
6. When seniors delegate
authority to juniors, the
juniors use it as an
opportunity for
development
Between groups 58.6265 12 4.89 *8.6682
Within groups 274.4798 487 0.56
Total 333.1063 499
7. Employees are not
afraid to express or
discuss their feeling with
their colleagues.
Between groups 109.7160 12 9.14 *17.2468
Within groups 258.1724 487 0.53
Total 367.8884 499
8. Employees are
encouraged to take
initiative and do things
on their own without
having to wait for
instructions from
supervisors.
Between groups 65.0325 12 5.42 *8.2775
Within groups 318.8448 487 0.65
Total 383.8773 499
9. Employees are not
afraid to express or
discuss their feelings
with their superiors.
Between groups 87.9220 12 7.33 *16.5863
Within groups 215.1274 487 0.44
Total 303.0494 499
10. Employees are not
afraid to express or
discuss their feelings
with their subordinates.
Between groups 83.2965 12 6.94 *16.3402
Within groups 206.8798 487 0.42
Total 290.1763 499
11. Employees are
encouraged to experiment
Between groups 125.2725 12 10.44 *22.4939
Within groups 226.0162 487 0.46
© 2020 IJRAR February 2020, Volume 7, Issue 1 www.ijrar.org (E-ISSN 2348-1269, P- ISSN 2349-5138)
IJRAR2001336 International Journal of Research and Analytical Reviews (IJRAR) www.ijrar.org 467
Particulars ANOVA Sum of
Squares
df Mean
Squares
F
with new methods and try
out creative ideas.
Total 351.2887 499
12. Weakness of employees
is communicated to them in
a non-threatening way.
Between groups 80.3895 12 6.70 *13.3509
Within groups 244.3629 487 0.50
Total 324.7524 499
13. Employees in this
organisation are very
informal and do not
hesitate to discuss their
personal problems with
their superiors/
subordinates.
Between groups 75.9590 12 6.33 *10.7058
Within groups 287.9429 487 0.59
Total 363.9019 499
14. Communication in the
organisation is both at
upwards and downward is
effective.
Between groups 83.5830 12 6.97 *15.4322
Within groups 219.8057 487 0.45
Total 303.3887 499
15. People in this
organisation don’t have
any fixed mental
impression about each
other.
Between groups 59.6320 12 4.97 *9.1066
Within groups 265.7495 487 0.55
Total 325.3815 499
16. Team spirit is of high
order in this
organisation.
Between groups 64.5290 12 5.38 *10.2916
Within groups 254.4590 487 0.52
Total 318.9880 499
(G) Development Oriented
Performance Appraisal
1. Our performance
appraisal system provides
feedback from superiors.
Between groups 67.6735 12 5.64 *12.8039
Within groups 214.4981 487 0.44
Total 282.1716 499
2. There is high employee
participation in the
appraisal process.
Between groups 66.5395 12 5.54 *12.6220
Within groups 213.9429 487 0.44
Total 280.4824 499
3. Performance appraisal
is based on
(a) Individual results Between groups 73.0000 12 6.08 *12.0577
Within groups 245.7007 487 0.50
Total 318.7007 499
(b) Group results Between groups 57.8340 12 4.82 *12.9009
Within groups 181.9324 487 0.37
Total 239.7664 499
(c) Quantifiable
standards, such as the
value of project
completed.
Between groups 55.2235 12 4.60 *9.5256
Within groups 235.2781 487 0.48
Total 290.5016 499
(d) Qualitative standards,
such as teamwork.
Between groups 80.6495 12 6.72 *15.9880
Within groups 204.7179 487 0.42
Total 285.3674 499
4. The objective of the
appraisal process is
Between groups 49.0990 12 4.09 *8.4092
Within groups 236.9540 487 0.49
© 2020 IJRAR February 2020, Volume 7, Issue 1 www.ijrar.org (E-ISSN 2348-1269, P- ISSN 2349-5138)
IJRAR2001336 International Journal of Research and Analytical Reviews (IJRAR) www.ijrar.org 468
Particulars ANOVA Sum of
Squares
df Mean
Squares
F
employee’s development. Total 286.0530 499
5. If performance problems
occur they are discussed
with the appropriate
individuals or groups.
Between groups 60.7560 12 5.06 *12.3081
Within groups 200.3295 487 0.41
Total 261.0855 499
6. Performance appraisal
reports in our
organisation are based on
objective assessment and
adequate information and
not on favoritism.
Between groups 60.6645 12 5.06 *12.4831
Within groups 197.2248 487 0.40
Total 257.8893 499
(H) Compensation
1. Each individual’s
compensation package is
determined through a
document procedure that is
consistent with
organisation’s
compensation policy,
strategy and plan.
Between groups 58.5695 12 4.88 *9.8989
Within groups 240.1229 487 0.49
Total 298.6924 499
2. Compensation is
primarily determined by
results achieved /
contribution to the
company.
Between groups 38.5930 12 3.22 *7.0405
Within groups 222.4600 487 0.46
Total 261.0530 499
3. Decisions regarding an
individual’s compensation
package are communicated
to the individual.
Between groups 36.9065 12 3.08 *6.1268
Within groups 244.4645 487 0.50
Total 281.3710 499
4. In our company high
performers are given
higher pay package.
Between groups 64.8205 12 5.40 *13.9640
Within groups 188.3864 487 0.39
Total 253.2069 499
(I) Career Development
1. In our company a
personal development plan
is created and maintained
for each individual.
Between groups 68.0800 12 5.67 *9.8780
Within groups 279.7050 487 0.57
Total 347.7850 499
2. Company provides every
employee with
opportunities to choose a
career path to suit the
individual’s core
competence.
Between groups 56.3550 12 4.70 *7.9002
Within groups 289.4967 487 0.59
Total 345.8517 499
3. An individual’s
development plan and
activities are
periodically reviewed to
determine whether
organisational competency
needs will be met.
Between groups 50.1160 12 4.18 *7.1386
Within groups 284.9124 487 0.59
Total 335.0284 499
4. Individuals in this
company have clear career
Between groups 58.3285 12 4.86 *8.8112
Within groups 268.6531 487 0.55

© 2020 IJRAR February 2020, Volume 7, Issue 1 www.ijrar.org (E-ISSN 2348-1269, P- ISSN 2349-5138)
IJRAR2001336 International Journal of Research and Analytical Reviews (IJRAR) www.ijrar.org 469
Particulars ANOVA Sum of
Squares
df Mean
Squares
F
paths within the
organisation.
Total 326.9816 499
5. Our company has created
a learning environment in
the organisation for both
professional and personal
growth.
Between groups 62.4260 12 5.20 *9.2921
Within groups 272.6450 487 0.56
Total 335.0710 499
6. Job rotation in this
organisation facilities
employee development.
Between groups 68.2830 12 5.69 *9.6003
Within groups 288.6524 487 0.59
Total 356.9354 499
(J) Value-Added Incentives
1. Employees are offered
an extremely flexible
compensation and benefits
package like housing
assistance, stock options,
soft loans and asset
acquisition assistance.
Between groups 83.2505 12 6.94 *7.4058
Within groups 456.2074 487 0.94
Total 539.4579 499
2. Extensive performance-
based incentives and
bonuses are available to
all employees.
Between groups 70.0488 12 5.84 *9.1501
Within groups 310.6867 487 0.64
Total 380.7355 499
Source: Primary Survey
* Significant at 1% level of significance
** Significant at 5% level of significance