Statistical Properties of the GALEX ‐SDSS Matched Source Catalogs, and Classification of the UV...
33
arXiv:astro-ph/0611926v1 30 Nov 2006 Submitted for publication in the Special GALEX ApJS Issue Statistical Properties of the GALEX/SDSS matched source catalogs, and classification of the UV sources. Luciana Bianchi 1 , Lino Rodriguez-Merino 1 , Maurice Viton 2 , Michel Laget 2 , Boryana Efremova 1 , James Herald 1 , Alberto Conti 3 ,Bernie Shiao 3 , Armando Gil de Paz 4 , Samir Salim 5 , A. Thakar 1 , Peter G. Friedman 6 , S.C. Rey 6 , David Thilker 1 , Tom A. Barlow 6 , Tamas Budavari 1 , Jose Donas 2 , Karl Forster 6 , Timothy M. Heckman 1 , Young-Wook Lee 8 , Barry F. Madore 9 , D. Christopher Martin 6 , Bruno Milliard 2 , Patrick Morrissey 6 , Susan G. Neff 7 , R. Michael Rich 5 , David Schiminovich 6 , Mark Seibert 6 , Todd Small 6 , Alex S. Szalay 1 , Ted K. Wyder 6 , Barry Y. Welsh 10 , Sukyoung K. Yi 8 ABSTRACT We use the Galaxy Evolution Explorer (GALEX) Medium and All-Sky- Imaging Survey (MIS & AIS) data from the first public data release (GR1), matched to the Sloan Digital Sky Survey (SDSS) DR3 catalog, to perform source classification. The GALEX surveys provide photometry in far- and near-UV bands and the SDSS in five optical bands (u,g,r,i,z). The GR1/DR3 overlap- ping areas are 363[83]deg 2 for the GALEX AIS[MIS], for sources within the 0.5 ◦ 1 Dept. of Physics and Astronomy, The Johns Hopkins University, 3400 N. Charles St., Baltimore, MD 21218, USA. Email: [email protected] 2 Laboratoire d’Astrophysique de Marseille, BP 8, Traverse du Siphon, 13376 Marseille Cedex 12, France 3 Space Telescope Science Institute, Baltimore, MD 21218 4 Univ. Complutense, Madrid, Spain 5 Department of Physics and Astronomy, University of California, Los Angeles, CA 90095 6 California Institute of Technology, MC 405-47, 1200 East California Boulevard, Pasadena, CA 91125h 7 Laboratory for Astronomy and Solar Physics, NASA Goddard Space Flight Center, Greenbelt, MD 20771 8 Center for Space Astrophysics, Yonsei University, Seoul 120-749, Korea 9 Observatories of the Carnegie Institution of Washington, 813 Santa Barbara St., Pasadena, CA 91101 10 Space Sciences Laboratory, University of California at Berkeley, 601 Campbell Hall, Berkeley, CA 94720
-
Upload
independent -
Category
Documents
-
view
2 -
download
0
Transcript of Statistical Properties of the GALEX ‐SDSS Matched Source Catalogs, and Classification of the UV...

arX
iv:a
stro
-ph/
0611
926v
1 3
0 N
ov 2
006
Submitted for publication in the Special GALEX ApJS Issue
Statistical Properties of the GALEX/SDSS matched source
catalogs, and classification of the UV sources.
Luciana Bianchi1, Lino Rodriguez-Merino1, Maurice Viton2, Michel Laget2, Boryana
Efremova1, James Herald1, Alberto Conti3,Bernie Shiao3, Armando Gil de Paz4, Samir
Salim5, A. Thakar1, Peter G. Friedman6, S.C. Rey6, David Thilker1, Tom A. Barlow6,
Tamas Budavari1, Jose Donas2, Karl Forster6, Timothy M. Heckman1, Young-Wook Lee8,
Barry F. Madore9, D. Christopher Martin6, Bruno Milliard2, Patrick Morrissey6, Susan G.
Neff7, R. Michael Rich5, David Schiminovich6, Mark Seibert6, Todd Small6, Alex S.
Szalay1, Ted K. Wyder6, Barry Y. Welsh10, Sukyoung K. Yi 8
ABSTRACT
We use the Galaxy Evolution Explorer (GALEX) Medium and All-Sky-
Imaging Survey (MIS & AIS) data from the first public data release (GR1),
matched to the Sloan Digital Sky Survey (SDSS) DR3 catalog, to perform source
classification. The GALEX surveys provide photometry in far- and near-UV
bands and the SDSS in five optical bands (u,g,r,i,z). The GR1/DR3 overlap-
ping areas are 363[83]deg2 for the GALEX AIS[MIS], for sources within the 0.5 ◦
1Dept. of Physics and Astronomy, The Johns Hopkins University, 3400 N. Charles St., Baltimore, MD
21218, USA. Email: [email protected]
2Laboratoire d’Astrophysique de Marseille, BP 8, Traverse du Siphon, 13376 Marseille Cedex 12, France
3Space Telescope Science Institute, Baltimore, MD 21218
4Univ. Complutense, Madrid, Spain
5Department of Physics and Astronomy, University of California, Los Angeles, CA 90095
6California Institute of Technology, MC 405-47, 1200 East California Boulevard, Pasadena, CA 91125h
7Laboratory for Astronomy and Solar Physics, NASA Goddard Space Flight Center, Greenbelt, MD
20771
8Center for Space Astrophysics, Yonsei University, Seoul 120-749, Korea
9Observatories of the Carnegie Institution of Washington, 813 Santa Barbara St., Pasadena, CA 91101
10Space Sciences Laboratory, University of California at Berkeley, 601 Campbell Hall, Berkeley, CA 94720

– 2 –
central area of the GALEX fields. Our sample covers mostly |b|>30 ◦ galac-
tic latitudes. We present statistical properties of the GALEX/SDSS matched
sources catalog, containing >2 106 objects detected in at least one UV band. We
classify the matched sources by comparing the seven-band photometry to model
colors constructed for different classes of astrophysical objects. For sources with
photometric errors <0.3 mag, the corresponding typical AB-magnitude limits are
mFUV ∼21.5, mNUV ∼22.5 for AIS, and mFUV ∼24, mNUV ∼24.5 for MIS. At AIS
depth, the number of Galactic and extragalactic objects are comparable, but the
latter predominate in the MIS. Based on our stellar models, we estimate the
GALEX surveys detect hot White Dwarfs throughout the Milky Way halo (down
to a radius of 0.04R⊙ at MIS depth), providing an unprecedented improvement
in the Galactic WD census. Their observed surface density is consistent with
Milky Way model predictions. We also select low-redshift QSO candidates, ex-
tending the known QSO samples to lower magnitudes, and providing candidates
for detailed z≈1 follow-up investigations. SDSS optical spectra available for a
large subsample confirm the classification for the photometrically selected can-
didates with 97% purity for single hot stars, ≈45%(AIS)/31%(MIS) for binaries
containing a hot star and a cooler companion, and about 85% for QSOs.
Subject headings: Astronomical Data Bases: surveys — Galaxy: stellar content
— (galaxies:) quasars: general — stars: statistics — stars: white dwarfs —
ultraviolet: stars
1. Introduction
Several recent and ongoing survey projects are providing a wealth of new data that
allow us to refine theoretical models, and our global understanding of stars, galaxies, and
the evolution of the Universe. The Galaxy Evolution Explorer (GALEX, Martin et al. 2005)
is performing the first survey of the sky in two broad bands: the far ultraviolet (FUV) and the
near ultraviolet (NUV). The Sloan Digital Sky Survey (SDSS) is scanning one fourth of the
sky in five optical bands, u, g, r, i and z. Bianchi et al. (2005) explored the potential of the
multi-band photometric catalogs to classify astrophysical objects, using GALEX early release
data and showed that the UV bands are very sensitive to the detection of hot stellar objects
and to the interstellar extinction by dust, as well as to the identification of low-redshift QSOs,
as expected. Star counts are important because they delineate galactic structure, and thus
give clues to galaxy formation and evolution. The GALEX UV surveys provide unbiased
detection of evolved, hot post-AGB objects, and of binary stellar systems containing white

– 3 –
dwarfs (WD), which will allow us to populate the observational Hertzprung-Russel diagram
of hot evolved objects. Late evolutionary phases are extremely important for the yield
of processed elements (e.g. Marigo 2004) and the consequent chemical evolution of the
interstellar medium (ISM). However, the post-AGB phases are much less understood than
the early evolutionary phases, due to the scarcity of known objects. Such evolved objects
are elusive in surveys at longer wavelengths both because of their low luminosity (at optical
wavelengths) and high effective temperatures, to which optical colors are insensitive, and
because they are extremely short-lived. We use the GALEX deep sensitivity to significantly
extend the census of hot evolved objects in the Milky Way.
In this paper we analyze the characteristics of a database we obtained by matching the
GALEX GR1 (MIS and AIS) and SDSS DR3 (Abazajian et al. 2005) imaging catalogs.
Both the GALEX GR1, and the SDSS DR3 data for the matched sources are available
from the MAST archive. In section 2 we describe the characteristics of the GALEX and
SDSS photometric data used in this work. In section 3 we describe our final catalog of
GALEX/SDSS matched sources. In section 4 we use color-color diagrams for classification
of the sources. The results are discussed in section 5.
2. Observations
This work makes use of photometric data collected by two of the largest astronomical
surveys currently in progress, the GALEX mission and the SDSS project. Here we recall
the basic characteristics of the imaging data from the two instruments, then we describe the
matched source catalog constructed for this analysis.
2.1. GALEX data
The GALEX mission (Martin et al. 2005) is performing a series of imaging and spectro-
scopic sky surveys in two ultraviolet bands, FUV and NUV. The instrument consists of a 50
cm diameter modified Ritchey-Chretien telescope providing a very wide field of view (1.25◦
diameter) with good astrometric quality across most of the field, and a resolution of ≈ 4.5-6′′
[FUV-NUV] (Morrissey et al. 2005). In this work we limit the analysis to the sources in the
inner 0.5◦ radius of the GALEX field of view, for best astrometric and photometric quality.
The GALEX photometric data cover the wavelength range from 1344 A to 2831 A with
two broad bands, the FUV passband (1344 - 1786 A) with λeff = 1528 A and the NUV
band (1771 - 2831 A) with λeff = 2271 A (Morrissey et al. 2005). Imaging surveys are

– 4 –
carried out with different depth and coverage. In this work we use data from the All-sky
Imaging Survey (AIS), that has typically ∼100 second exposures with a 5 σ NUV limiting
magnitude of mNUV ∼20.8, and from the Medium Imaging Survey (MIS), with typical ∼1500
second exposures and limiting magnitude of mNUV ∼22.7 in the AB system (Morrissey et al.
2005). The photometric system used in this paper is based on the AB magnitude scale (Oke
& Gunn 1983), although in the color-color diagrams we also provide the Vega-mag scale, to
facilitate comparison with other work.
We note that the GALEX flux calibration has been revised since the early release data
(used e.g. by Bianchi et al.(2005) in similar work), and the current processing and calibration
brings a total shift in the FUV-NUV color of ∼0.12mag, such that the GR1 photometry
is giving redder colors than the early release data by about this amount. Zero points of
18.82 mag and 20.08 mag for the FUV and NUV magnitudes respectively (AB system) are
used in the GALEX GR1 catalog.
2.2. Sloan Digital Sky Survey
The SDSS project (York et al. 2000) is mapping one fourth of the sky in five broad
optical bands: u g r i z (Fukugita et al. 1996), using a dedicated 2.5m telescope with a
wide-field of view and a 0.5-meter telescope for photometric calibration. An automated
image-processing system measures photometric and astrometric properties of each source
(Pier et al. 2003). The SDSS photometric system covers from 3000 A to 11000 A with five
non-overlapping pass-bands. The u filter peaks at 3500 A with a width of 600 A, the g is
a blue-green band centered at 4800 A with a width of 1400 A, r is a red band centered at
6250 A with a width of 1400 A, i is a far red filter centered at 7700 A with a width of 1500
A, and the near-infrared passband z is centered at 9100 A with a width of 1200 A.
3. The GALEX-SDSS Matched Source Catalog
In the GALEX GR1 release there are 622 AIS fields and 112 MIS fields which overlap
areas of the sky observed by the SDSS. Figure 1 displays the GALEX/SDSS overlapping fields
in galactic coordinates. As a starting point we used a GALEX GR1/ SDSS DR3 matched
catalog available from the MAST database. The match between GALEX and SDSS sources
was done based on position using a 4′′ match radius (Budavari et al. 2004).

– 5 –
3.1. Calculation of areas of overlap
In order to calculate the density of sources from our classification work, we determined
the total areas of overlap between the GALEX GR1 and SDSS DR3 releases with the follow-
ing method. We use in our analysis only sources within the central 1◦ of the GALEX field,
therefore for each GALEX field we considered an effective radius of 0.5◦. Partial overlap
among some GALEX fields is not removed in the on-line GALEX database, hence sources
observed in more than one field have multiple entries in the catalog. We wrote a code that
scans the entire sky and calculates the unique area covered by the GALEX fields included
in our matched catalog, and then calculates the part of this area covered also by the SDSS.
Three subsequent steps are performed: a) the celestial sphere is divided in small (0.05 de-
grees on a side), approximately square, elements, b) the distance between the center of each
area element in the grid to the GALEX field centers is used to determine whether the ele-
ment was included in our survey, and thus contributed to the total area, and c) a check is
performed on each area element included in our GALEX coverage to assess whether it was
also included in the area observed by the SDSS. The resulting unique-coverage areas of the
matched catalogs are 363 deg2 for AIS and 86 deg2 for MIS. These figures will be used to
determine the density of sources (number/deg2) in the next sections. Note that the total
areas refer to a 0.5 degree radius GALEX field, corresponding to our sample restriction. See
also Figure 1 of Bianchi et al. (2006b). The error in our area determination was estimated
by running several tests on a small area of the sky, including thousands of field position
simulations. The maximum estimated uncertainty in the areas from our procedure is 3 deg2
and 1 deg2 for AIS and MIS respectively.
We note that the SDSS database sky partition (hierarchical triangular mesh, HTM)
could not be used to estimate the area coverage due to the HTM’s intrinsic inability to
return accurate areas, and to an error in the areas and vertices of the triangular tassels,
which prevented calculation of exact areas of the HTM tassels.
3.2. The final catalog
We used as a starting point the matched catalogs available from the MAST archive,
which include all sources from the GALEX GR1 MIS and AIS, and from the SDSS DR3
releases, matched according to their position using a match radius of 4′′. The matched
database contains a total of over 2 Million objects (1.4M from AIS and 0.9M from MIS)
detected in at least one UV band. In order to proceed to the analysis of the sources, we first
eliminated multiple entries for the same source.

– 6 –
GALEX sources observed in more than one pointing result in multiple entries for the
same source in the on-line catalog. Eliminating GALEX duplicate entries for the same
source reduced the number of sources by 23% for AIS and by 15% for MIS. In addition,
some GALEX sources have more than one SDSS counterpart due to the different spatial
resolution: GALEX has a point spread function of ∼4.5-6” while the SDSS’ psf is ∼1.4”.
For these sources the analysis of photometric colors would be meaningless, since the GALEX
photometry would be a composite measurement of different objects. Therefore, GALEX
sources with multiple matches must be excluded from the classification analysis, but their
fraction must be counted for source statistics. Removal of GALEX sources with multiple
optical counterparts within the match radius reduced the number of sources by 13% for AIS
and by 11% for MIS. Our object density counts (section 5) take into account the fraction
of sources eliminated because having more than one optical counterpart. After eliminating
duplicate GALEX detections, and UV sources with multiple SDSS matches, our final catalog
contains 1,074,460 AIS sources and 752,190 MIS sources.
Finally, we must evaluate the possible contamination by spurious matches, and whether
the purity of the sample would be improved by decreasing the match radius. In this work
we considered all sources with a match radius up to 4′′ (but excluded multiple matches, as
explained above). When we apply error cuts of 0.15/0.1/0.1mag (FUV/NUV/optical) to
the sample, the distance between GALEX coordinates and SDSS coordinates is less than
2.5′′ for 99/96% of the sources [AIS/MIS]. If no error cuts are applied, a higher number of
matched sources with GALEX and SDSS coordinates differing by more than 2.5′′ is found
over the entire catalog. As a result of the photometric error cuts applied in our analysis,
possible spurious matches are not expected to significantly affect the results.
In fact, the UV sky is rather “empty”, i.e. much more scarcely populated than the sky
at optical wavelengths, due to the paucity of hot stars relative to the vast majority of cooler
objects. Therefore, a possible spurious match (positional coincidence) would probably occur
if multiple optical sources are detected around the position of the UV source. Such cases are
eliminated as explained above. Because we use both FUV and NUV bands, and our optical
photometry includes the u and g bands, we expect that a hot object appearing as both an
FUV and NUV source would be detected in u and g. Random positional associations would
be much more likely to occur if we considered matches of UV sources with red or IR bands.
We did not impose in our final analysis samples that good photometric measurements exist
for the UV sources also in i and z bands. Such requirement would considerably limit the final
sample of hot stellar objects, in addition to possibly favouring spurious matches. A purity
of over 95% for matches of UV sources with optical sources was predicted by simulations
conducted during the design phases.

– 7 –
We also checked for possible artifacts in the matched catalog. Instrumental artifacts
would likley be eliminated by the matching process itself, however a caveat remains about
possible contamination of our samples by SDSS sources that the pipeline generates by “shred-
ding” galaxies, i.e. deblending extended objects into a number of individual photometric
sources. We have investigated the problem and we believe such sources cannot be reliably
eliminated with the use of the current SDSS or GALEX photometric flags. Therefore we
specifically searched whether any of our selected sources (section 5) falls within the radius of
any known galaxy, using a list of galaxies with R25>1arcmin extracted from the catalog of de
Vaucouleurs et al. (1991). We found only one case in our AIS catalogs of WD, and 3 cases
in the MIS catalog, of point-like sources which are in fact portions of large galaxies. A few
sources out of several thousand QSO candidates were also identified as “shredded galaxies”.
3.3. Properties of the matched GALEX/SDSS source catalog. Analysis
sample definition.
Figures 2–4 display the number of objects in our matched catalog as a function of
magnitude for each band. The histograms show the total number of objects included in the
final catalog (all detections), as well the numbers obtained by applying different error cuts.
These histograms are useful for estimating the magnitude limits reached in restricted samples
(by applying error cuts in the analysis), which are helpful for interpreting the results. In
the histograms, we also marked the typical limiting magnitude for each band as given by
the projects via the MAST and SDSS web sites. Note that the SDSS pipeline generates
sources several magnitudes below the nominal limits for each band, and it is surprising that
the error cuts are not sufficient to eliminate these spurious detections. Figures 3 and 4 show
that while the histograms of sources brighter than the magnitude limit behave as expected,
with fainter sources progressively eliminated by more stringent error cuts, there is an almost
specular distribution of spurious sources at the faint magnitudes, well below the expected
SDSS limit. Such spurious sources are different in each band, therefore while they are not
eliminated by error cuts in an individual band, they are eliminated by applying both error
and magnitude cuts to the sample.
In the following section, we discuss the effects of error cuts applied as appropriate to
separate the sources into classes of astrophysical objects based on their colors, in order
to minimize contamination by other types of objects. Error cuts translate (statistically)
into magnitude limits, in each photometric band, as can be inferred from the histograms
in Figures 2–4. The number of objects remaining in our catalog when different error limits
are applied in each band are given in Table 1. It is extremely important to consider the

– 8 –
effects of the magnitude limits when using colors to classify objects and to derive luminosity
functions. Therefore, we provide some illustration of such effects and discuss them in section
4.
In our analysis we also use SDSS spatial information to separate the sources into point-
like (at the SDSS ∼1.4′′ psf) and extended sources. Point-like sources are mostly stellar
objects or QSOs (see section 4), while extended sources are typically galaxies. The numbers
of point-like and extended sources are approximately equal at the depth of the AIS survey,
but the number of extended sources (galaxies) increases significantly at fainter magnitudes
(MIS survey) as shown in Figures 5 - 7. Likewise, among the point-like sources, the low-
redshift QSO candidates increase more than the number of hot star candidates at fainter
magnitudes (section 4.2).
4. Analysis. Classification of the GALEX sources.
In this section we analyse the colors of the matched sources to extract information about
their nature. Bianchi et al. (2005) showed two sample color-color diagrams demonstrating
that the combination of the GALEX UV bands with optical photometry is a powerful tool
for identifying low-redshift QSOs, hot stellar objects and binary stellar objects containing a
hot WD.
4.1. The model colors
In Figures 5 – 7 we compare observed colors of our sources to model colors, calculated
by applying the transmission curves of the GALEX and SDSS filters to theoretical spectra
or templates of different astrophysical objects. Theoretical stellar colors for main sequence
and supergiant stars are derived from the stellar libraries of Lejeune (1997), Bianchi et al.
(in preparation), and Rodriguez et al. (2005), for a total of six metallicity values (two
cases shown in the color-color diagrams: solar, and one tenth solar). All these grids are
based on Kurucz (LTE, line-blanketed, plane-parallel) models. We compared, for sample
cases, the broad-band stellar colors derived from the Kurucz model grids, to colors com-
puted from TLUSTY (Hubeny & Lanz 1995) model atmospheres for hot stars (non-LTE,
line-blanketed, plane-parallel), as well as with stellar atmospheres plus wind models (non-
LTE, line-blanketed, spherical, hydrodynamic), computed by us (Bianchi & Garcia 2002,
Garcia & Bianchi 2004, Bianchi et al., in preparation) with the WM-basic code of Pauldrach
et al. (2001). As expected, there is no appreciable difference in the broad-band colors.

– 9 –
The whole grid of models will be published elsewhere (Bianchi et al., in preparation). We
calculated white dwarf (WD) models using the TLUSTY code of Hubeny & Lanz (2005),
for various gravities and solar, pure-H and pure-He abundances. In the color-color diagrams
(figures 5 – 7), we show stellar model colors as a function of Teff for three different gravities
(representing main-sequence (MS), supergiants (SG) and high-gravity stars with log g=9),
and two metallicity values, to illustrate the effects of relevant parameters without crowding
the figure.
To define the locus of galaxies, we computed broad-band colors from “Simple Stellar
Population” (SSP) models from the library by Bressan et al. 2006 (in preparation), as well
as from a library of galaxy templates. The templates were calculated for ellipticals, spirals
and irregulars (marked as “E, S, I” in the figures) using the GRAZIL code (Bressan et al.
1998, Silva et al. 1998). We show in figures 5 – 7 these model colors as a function of age,
for redishift z=0. For QSO colors, we used a composite model of Francis et al. (1991)
revised as described in Bianchi et al. (2005), as well as the SDSS average template, with
extrapolations at long and short wavelengths by Zheng (private communication), that include
Lyα absorption. Model colors from both these QSO templates are shown as a function of
red-shift in the color-color diagrams, the first plotted with a solid line, the latter with a
dashed line.
Bianchi et al. (2005) showed two sample color combinations, for the GALEX early data
release sample, and also plotted a comparison of [known] spectroscopically classified objects
with the model colors, showing that the loci defined by our models match very well the
observed properties of each astrophysical class represented. We omit the comparison of the
models to known objects in this work as it would show the same result. Instead, in this
paper we describe the effects of physical parameters, such as Teff , metallicity and gravity for
stars. Below we discuss general properties and then we comment on individual color-color
diagrams.
Effects of interstellar extinction by dust are applied to the model spectra, for varying
amounts and types of extinction, in the calculation of the grids of model colors. Because we
are using broad-band photometry, applying extinction corrections Aλ/E(B−V ) for the λeff
of the filter band-pass to the intrinsic model magnitudes would only be an approximation
of the reddening effects on the colors. Instead, we reddened each model spectrum with
progressive amounts of E(B − V ), for different extinction laws, and then calculated broad-
band colors for the reddened model spectra. For the analysis of hot Galactic objects, and
for the sample in this paper in particular, which includes fields at high galactic latitudes,
the extinction is small as we shall see in the next section. Therefore, we only show the case
of Milky Way-type extinction with RV =3.1 in the color-color diagrams.
– 10 –
4.2. Color-Color diagrams
Figures 5–7 show a number of color-color diagrams of the sources and model colors, cho-
sen to illustrate the most relevant effects of the physical parameters and useful classification
criteria, as well as the statistical properties of the sources. In these figures, point-like sources
are shown with blue dots and extended sources with black dots. To avoid excessive crowding
in the diagrams, in general only sources with errors better than 0.15mag (0.10mag) in FUV
(NUV) and better than 0.05mag in the optical bands are shown. More details are given in
the captions. Model colors are shown with different symbols and colors, explained in the
figures. The effects of reddening by interstellar dust are shown with lines connecting the
intrinsic model color (large symbol) to the reddened model color (smaller symbol), for a
sample case of Galactic typical extinction with RV = 3.1, and for E(B-V)=0.5mag. It can
be seen from all diagrams that for most hot stars the probable reddening does not exceed
E(B−V )≈ 0.1mag, as can be expected given the high galactic latitudes of the fields included
in our catalog (Figure 1).
4.2.1. General Properties
In all the color-color diagrams, but especially in the [FUV-NUV] vs [g-r] diagram (Figure
7) and [FUV-g] vs [g-i] (or [NUV-g] vs [g-i] ) diagram (Figures 5 and 6), the extended sources
(black dots, mostly galaxies) are well separated from the stellar sources (the blue dots, or
point-like sources, near the stellar model colors). The locus of the QSOs lies somewhat in
between, and is occupied in these diagrams by a compact cloud of mostly point-like sources,
populating the locus of the low-z QSO template colors. A number of extended sources is
also found in the same color space, which is also shared by the young-age SSP and elliptical
galaxy models. Note that if we consider points with good photometry also in the FUV
band, only the locus of low-z QSOs is populated with sources. Instead, sources with good
photometry in the NUV—optical range (FUV drop-outs) do extend over the color-space of
higher redshifts QSOs, as expected, and of stars with lower temperatures.
Another general feature which is evident in all diagrams, from the density of points in
regions defined by the model colors for different objects, is that the number of extragalactic
sources (galaxies and QSOs) increases much more than the number of Milky Way stellar
sources at fainter magnitudes. This effect is quantified by the surface density plots shown in
the section 5.
The galaxies (extended sources, black dots) are well represented by the three “average”
templates for irregulars, spirals and ellipticals. Two properties of the sample can be inferred
– 11 –
from the color-color diagrams. First, the templates cover well the space for irregular and
spiral galaxies in the AIS sample, which is limited to brighter magnitudes. For the deeper
MIS sample the templates’ intrinsic colors rather provide an envelope to distribution of the
sources, and the extinction effects shown (foreground MW-type) do not account for the
entire extent of the data-points on the color-color diagrams. This may be an indication of
intrinsic mixed, possibly non-MW-type extinction. The analysis of galaxies colors from the
GALEX surveys is not the scope of this work and is pursued in other works, therefore for
our purpose it is sufficient that the unreddened galaxy colors produce an envelope to the
observed distribution of the extended sources. The second point of relevance is that data-
points are seen with colors corresponding to Ellipticals of either young or old ages, due to the
contribution of hot He burning low mass stellar population such as horizontal-branch stars
and their progeny (Yi, 2003) in the diagrams including the FUV band, in which these objects
are probably too faint at intermediate ages. This is especially evident in the shallower AIS
sample. When the more sensitive NUV band is considered (regardless of FUV detection of
the source), the locus of Ellipticals, especially at old ages, becomes more populated, even in
the AIS survey (Figure 6).
As for the stellar sources, our models for different luminosity classes (main sequence
versus supergiants) and metallicities show the separation of the photometric colors for stars
cooler than approximately 10,000 K, most evident in the [NUV-g] vs [g-i] diagram. For
hotter stars, supergiants and main-sequence colors are indistinguishable, however the well
defined cluster of stellar sources separate from the main-sequence colors is well represented
by high gravity stellar models. Only WD models with log g =9 are shown for clarity. We
see that the majority of the hottest stellar sources lies on the high-gravity sequence (evolved
stars) rather than on the main-sequence or supergiant color sequence. An interesting point is
that, for the case of MW-type extinction (as shown), reddening would displace the intrinsic
color of a very hot star roughly along color sequence of high-gravity stars in the [NUV-
g] vs [g-i] diagram, making Teff and reddening effects indistinguishable. However, the
effects of Teff and reddening on the stellar colors are different in the [FUV-NUV] vs [g-r] and
[FUV-g] vs [g-i] diagrams and they can be disentangled. In any case, it is evident from all
diagrams that the number of objects along the high-gravity stellar sequence increases at
lower Teff ’s, consistent with numerical expectations. It would be unlikely that the majority
of objects were extremely hot, highly reddened main-sequence or supergiant stars.
Another interesting stellar population component that can be easily detected, especially
in the [FUV-NUV] vs [NUV-r] diagram (Figure 7), is that of stellar binaries composed of
a white dwarf and a much cooler object. A significant number of point-like sources can be
seen with very blue FUV-NUV colors, but red optical colors. These objects appear as an
arc-like distribution of blue points on the top-right part of the color-color diagrams, and

– 12 –
are presumably WD plus M-dwarf pairs. The WD+MD binary sequence has been first
recognized at optical colors (e.g. Raymond et al. 2003, Smolcic et al. 2004, Pourbaix et al.
2004) but the UV bands are much more sensitive to the detection of systems with hot WD.
Smolcic et al. (2004) found ≈ 0.4 of such binaries per square degree from the SDSS DR1.
This population will be discussed again in section 5.1.
The last general point worth discussing, and often overlooked, is the effect of the pho-
tometry’s magnitude limits (and hence also effects of error cuts) on the sample. Figures 5
and 6 show the same [NUV-g] vs [g-i] diagram, in one case selecting sources with good
photometry in the four filters shown, regardless of detection in the FUV (Figure 6). In
Figure 5 the same sample is restricted to sources that also have good photometry (error
better than 0.15 mag) in the FUV band. As expected, the hot star, and low-redshift QSO
samples do not change significantly, however QSOs at higher redshift and a huge number of
cooler stellar sources appear only when no FUV cut is applied. Interestingly, also a number
of extended sources occupy the crowded locus of the lower Teff stellar sequence and higher-z
QSOs. These data-points are not visible in the diagram because the point-like sources (the
primary subject of investigation in this work) are plotted over the extended sources. In
general, imposing good photometry also in the FUV band reduces the sample by a factor of
about 10, with respect to a sample based on NUV-band good photometry (see also Table
1). Obviously, magnitude limits affect objects differently depending on their colors.
4.2.2. Discussion of the individual color-color diagrams
We finally comment here on each diagram separately.
The [NUV-g] vs [g-i] and [FUV-g] vs [g-i] color-color diagrams (Figures 5 and 6) are
somewhat similar to the classical optical [U-B] vs [B-V] diagram (e.g. Bianchi et al. 2006a)
but present several advantages thanks to the broader wavelength range. Stars are well
separated from galaxies and low-redshift QSOs in the g-i color. Binary stars containing
a hot WD and a much cooler companion are easy to detect (top right blue points in the
diagram). The price to pay for the wide color separation of the objects is that the very hot
WDs are faint in the i band, thus a sample selected from these colors is clean but limited to
objects brighter than the detection depth that can be reached by the GALEX surveys (see
next section). We plot the FUV-g and NUV-g colors (left, and right panels respectively) on
the same scale, to illustrate the advantage of including a FUV band as diagnostic for the
hottest objects: note the much larger spread in color among hot temperature models, when
the FUV band is included. Broad-band photometric colors separate for stars of different
gravity and metallicity only at Teff lower than ≈ 10,000K, as shown also by Bianchi &

– 13 –
Efremova (2006) in a recent HST study of stellar populations. For high-gravity stars, we
plot only one sequence of model colors with log g=9 for clarity. While supergiants and
main sequence stars are indistinguishable at high Teffs, gravities much higher than log g=5
(our model sequence plotted in red) are clearly separated photometrically. Most of the
GALEX hot stellar sources cluster around the log g=9 sequence and are therefore likely to
be subdwarfs or WDs. A dramatic difference in the sources’ census is made by including or
neglecting the FUV photometry (Figure 5 versus 6); this effect has already been mentioned
above. Finally, note the direction of the reddening effect on the colors in the [NUV-g] vs [g-
i] diagram: it is very similar to the effect of the major physical parameters (Teff for stars, age
for galaxies, redshift for QSOs - in some ranges), making these particular colors unsuitable
to disentangling reddening and e.g. Teff for WDs. The degeneracy is less severe for the
[FUV-g] vs [g-i] diagram, and it is completely removed in the diagrams including a [FUV-
NUV] color (Figure 7). Such extinction effects apply only to the case of MW-type dust, and
would be slightly different for other types of dust.
Similar considerations apply to the [FUV-NUV] vs [g-r] diagrams (Figure 7 , top),
however stars with different gravities are less separated, while galaxies, QSO and stars are
better separated, with respect to the diagrams discussed previously.
The NUV-r vs. FUV-NUV diagram (Figure 7, lower panels) separates very well stellar
objects from galaxies, thanks to the broad wavelength base-line. The stellar sequence is
continuously populated, with the number of stellar objects fading out at Teff about 8500 K
in the AIS catalog, but extending to cooler (Teff∼ 6000 K ) stars in the deeper MIS catalog.
Note that these limits are driven by imposing an error cut of FUVerr < 0.15mag (as used
in the color-color diagrams). In particular, hot stellar objects can be easily selected from
their FUV-NUV color, while a UV-r color allows us to separate single hot stars from binaries
with a hot and a cool component. Using the NUV-r and FUV-NUV colors we extract hot
star candidates in different Teff ranges, and low redshift (z < 1.6) QSO candidates (next
section). The distribution of hot stars and QSO candidates are shown in Figures 8 to 11.
In the next section we present the statistical properties of the hot stellar objects (single
and binary) candidates. An analysis of the physical parameters of these objects will be the
subject of future papers with spectroscopic follow-up.
5. Discussion and Conclusions
As discussed in the previous section, the color-color diagrams can be used to separate
objects by astrophysical class, and in particular to select hot stars and low-redshift QSO

– 14 –
candidates. In this section we derive surface densities for such objects, and compare them
to previous known catalogs, as well as to predictions by a Milky Way model.
5.1. Hot stars Candidates
According to the fluxes of our TLUSTY models, a WD with Teff= 50,000K[100,000K],
log g =7., and R=0.2 R⊙ has an AB magnitude (in absence of reddening) of r= 8.5, 13.5,
18.5 and 20.0 [7.9, 12.6, 17.9, 19.4]mag at 100pc, 1kpc, 10kpc and 20kpc respectively. Again
from our models, its colors are FUV-r = -2.35[-2.62] and NUV-r =-1.75[-1.93] (ABmag) for
Teff= 50,000K and 100,000K respectively. A radius of R=0.2 R⊙ would be a typical value
for a very hot post-AGB star (Teff≈ 100000 K) at the end of the constant-luminosity phase.
A lower mass/ cooler remnant may have a larger radius. A hot WD then would dim by
several magnitudes descending (at approximately the same Teff , initially) along the cooling
sequence, down to a radius of ≈ 0.05 - 0.02R⊙, becoming fainter by -2.0 in log Flux, or 5
magnitudes. Therefore, with error limits of <0.15/0.3mag (FUV) and <0.10/0.3mag (NUV)
which translate into GALEX magnitude limits of ≈19.5/21.5 mag for AIS and 22.5/25 mag
for MIS, we expect that our GALEX dataset can detect WDs all the way in the Galactic
halo, even in the AIS sample, in their (advanced) post-AGB constant luminosity phase. In
the MIS sample, we expect to also detect hot WD with radii as small as 0.04R⊙ out to
20kpc. When descending on the WD cooling sequence, the stars will have higher gravity.
For log g=9., FUV-r = -2.33[-2.61] and NUV-r =-1.73[-1.92] (ABmag) for Teff= 50,000K
and 100,000K respectively, not significantly different from the log g=7 case. Imposing an
error limit of better than 0.1mag in the r and g bands would however limit the survey to a
smaller volume (see Figure 3). These model magnitude values are in absence of reddening.
However, as we saw from the color-color diagrams, reddening is quite small for the high
galactic latitudes of the present sample.
For subdwarfs and main-sequence stars, e.g. with log g =5 and Teff= 50kK, 30kK, and
18kK, FUV-r = [ -2.30, -1.87 and -0.55], NUV-r= [-1.74 ,-1.38, and -0.40]. The radius will be
larger than that of a WD, therefore all hot stars are expected to be detected in our GALEX
surveys. For a reference radius of 1R⊙, at 20kpc a star with log g=5. and Teff= 50kK, 30kK,
18kK would have r = 16.53, 17.34, and 18.26mag. These numbers are based on our TLUSTY
model calculations. Using Kurucz models for log g=5 stars, we find consistent magnitudes
within 0.1mag.
Here we use two different color selections to extract hot stars candidates from the
GALEX sources. First, the color-color diagrams [NUV-g] vs [g-i] or [FUV-g] vs [g-i] (Figure
5), and the similar [NUV-g] vs [g-r] and [FUV-g] vs [g-r] , can be used to select hot stars.

– 15 –
At the hottest temperatures, main sequence and supergiant stars cannot be separated, but
high-gravity (WD) stars are well separated and are the majority of the hottest sources. At
lower Teff , MS stars and TO stars dominate the statistics (Figure 5). Figure 8 shows the
number per square degree of high gravity stars, and lower gravity stars, selected from the
[NUV-g] vs [g-r] colors, with error cuts of 0.1mag (NUV, r and g). If we included sources
with larger errors, they would also be consistent with the locus of QSOs in the [NUV-g] vs [g-
r] and [FUV-g] vs [g-r] diagrams. In this selection, hot stellar sources with a cool companion
(occupying the top-right part of the color-color diagrams) cannot be included, because for
g-r>-0.1 they would be confused with QSO candidates. Therefore, our selection included
the locus around the stellar sequence for high gravity (purple symbols in figures 5) down to
Teff≈15000 K for WD. For the lower gravity stars, we included all the lower Teff sequence
and no g-r cut below Teff=10,000K, so binaries are also counted in this case.
The error bars on the number densities in Figure 8 are calculated by considering com-
bined photometric 1σ errors of each object, and counting the number of sources that fall
inside and outside the color boundary that define an object class, when their individual
errors are applied in both directions.
In Figure 8 we also plot predictions for the surface density of such objects calculated with
the Besancon Milky Way model (Robin et al. 2003, 2004). We assumed a standard diffuse
absorption of AV =0.7/kpc, and calculated the predictions over an area of approximately
210 square degrees between 40 deg and 50 deg in galactic latitude. No population age
selection has been applied. The calculations were extended to g= 24. The Milky Way model
predictions are shown as black histograms, with symbols of the same color of the objects they
represent (green for WD, blue for MS and TO, and orange for total) in the data histograms.
The lower than predicted number of bright objects is due to saturation in the SDSS bands
(saturated objects are excluded in our sample) which occur around 14th mag (between 13
and 15 mag). At the fainter magnitude end, incompleteness is due to the error cuts.
We also performed a selection of hot WD candidates based on the [FUV-NUV] color
only, down to Teff≈ 18,000K. Below this limit their FUV-NUV color overlaps with the z≈0
QSOs; our QSO templates with z=0 have FUV-NUV=0.175 mag. We used [FUV-NUV] <
-0.037 mag (corresponding to Teff> 18,000K for log g =5) and [FUV-NUV] <-0.343 mag,
which corresponds to Teff> 30,000K for log g =5 but includes objects down to Teff≈ 25,000K
for higher gravities. The surface density of the hot stars selected in this way, from GALEX
measurements only (errors < 0.3 mag), is shown in Figures 9 and 10. If we restrict the
sample to sources with errFUV <0.15 mag and errFUV <0.10 mag, the shape of the histogram
does not change significantly, but the density of objects becomes about half in both AIS and
MIS, and the counts begin to drop at about one magnitude brighter than they do in Figure

– 16 –
9.
The WD surface density in Figure 9 is matching the predictions by the Milky Way model
in the MIS sample, and is a factor of two lower in the AIS sample. However, we suspect that
the MIS counts are contaminated by point-like sources possibly of extragalactic nature, as
explained and quantified below. Such spurious sources affect only the “binary” candidates,
and not the “single WD” candidates, as we will see.
The number of objects per square degree (surface density) are plotted in Figures 8
and 9 as a function of the visual r magnitude, for direct comparison with the Galactic
model predictions and with other works. When we combine the GALEX selection of hot
stellar objects (from [FUV-NUV] color) with optical bands, we can also assess the fraction
of hot stars that have a cooler companion, i.e. objects with FUV-NUV color corresponding
to a hot Teff , but much redder optical colors. However, objects with WD-like FUV-NUV
colors and brighter than expected optical magnitudes may also be of extra-galactic origin,
such as unresolved galaxies or QSOs whose SEDs may differ from our templates. The
fraction of objects with optical colors inconsistent with their hot-WD FUV-NUV color, is
about 20-30% for magnitudes brigher than ≈20, however the number substantially increases
at fainter magnitudes. This increase suggests some contamination by non-stellar (extra-
galactic) objects. The r magnitude of a fraction of our sample objects therefore does
not correspond to that of the WD component, but rather to the optical magnitude of a
cool companion, or to that of a different object in case of extragalactic contaminants. In
either case, the observed r magnitude is brighter than the WD optical magnitude. This
fact causes an artificial increase of the number of MIS sources in the bright r magnitudes
range, where we would expect that the density of sources (either single WD, binaries or
possible spurious objects) would anyway be the same in AIS and MIS, down to the limit
where the AIS begins to be incomplete. Therefore, we consider the match of the Milky
Way model to the MIS counts in Figure 9 (left) to be, at least in part, a bias from this
effect. In order to avoid this bias, we plotted in Figure 10 the surface density for the same
sample of hot-star candidates as a function of NUV magnitude, which better represents
the magnitude of the WD component in the binary objects. The solid-color histograms
show the “single” objects (whose optical colors are consistent with the FUV-NUV hot-star
classification). These histograms show similar object counts for MIS and AIS, down to where
the AIS becomes incomplete, as one would expect. The dashed histograms show all FUV-
NUV selected sources, both single- and binary-WD candidates, the latter including possible
spurious objects. These total counts increase at fainter magnitudes much more than the
single-WD counts, reinforcing the suspicion of contamination by extragalactic objects in
the “binaries” sample. Because the Besancon Milky Way model is not available specifically
for GALEX bands, we have taken the model prediction in the r-band and translated it into
– 17 –
NUV-band using an average NUV-r color in the range of Teff where our WD candidates were
selected, <NUV-r>=-1.5mag. Such approximation only provides a qualitative comparison,
however we believe is quite close to reality since the Galaxy model includes WD in binaries in
the predicted counts but does not account for the color effects of the companion stars. The
good qualitative match between the observed surface density of objects and the Milky Way
model, confirms our prediction (see above) that GALEX can detect hot WDs throughout the
Galactic halo. The GALEX selection of high-gravity hot stars in the Galaxy offers therefore
a major improvement with respect to previous surveys.
For comparison to previous catalogs based on extensive surveys, we recall that Acker et
al. (1982) catalog of Galactic Planetary Nebulae includes 36 [12] objects at latitudes higher
than 30 deg [45 deg], out of a total of ≈1140 objects. McCook & Sion (1999) catalog of WDs
has 2364 [ 1553] WDs at latitudes higher than 30 deg [45 deg], out of ≈3060 total objects.
Kleinmann et al. (2004) catalogue 2551 certain white dwarf stars, 240 hot subdwarf stars,
and another 144 possible, but uncertain, white dwarf and hot subdwarf stars from the 1360
deg2 of SDSS DR1, or about 2.2 objects per square degree. The Palomar-Green catalog
of UV-excess stellar objects (Green et al. 1986), covering 10,714 square degrees, lists 1874
objects with limiting magnitudes between B=15.49 and B=16.67. Eisenstein et al. (2006)
catalogue about 9316 WDs and 928 subdwarfs from the SDSS Data Release 4, covering 4783
square degrees. The GALEX selection of hot stellar objects is more sensitive to the hottest
objects, and especially to binaries containing a hot WD, since the optical photometry in
such cases is dominated by the cooler companion (see also Bianchi et al. 2006b, Figure 6,
for an example).
The question of contamination of the hot-star candidate sample by non-stellar point-
like sources, can be better investigated with follow-up spectroscopy, which is under way. In
order to assess the robustness of our photometric selection, we have matched our samples of
photometrically selected hot stars with the SDSS Data Release 5 (DR5) spectroscopic data.
The spectroscopic survey is less deep than the photometric survey, so the fraction of our hot-
star selected samples that have available spectra in DR5 is higher for the AIS samples than for
the MIS samples. Of the hot stars (Teff> 18000 K) selected from the FUV-NUV color (Figure
10), 28% (AIS) and 5%(MIS) have optical spectra. In particular, of the “single” hot-star
candidates (whose optical colors are consistent with the UV colors, and are plotted as solid-
color histograms in Figure 10), 29%(AIS) and 16%(MIS) have SDSS spectra. Of our sample
“binaries” (which may include both true stellar binaries with a WD plus cool companion and
spurious objects), 24%(AIS) and 1%(MIS) have spectra. Therefore, the statistics are more
significant for AIS and for “single” WD selections than for other samples. Of the sources
with spectroscopic classification, 97%(AIS)/95%(MIS) of our “single” hot-star candidates
are confirmed as stars. Out of the “binary” candidate sample, 45%(AIS) and 31%(MIS) are

– 18 –
spectroscopically classified as stars, 47%(AIS) and 65%(MIS) are spectroscopically classified
as QSOs. The fractions are very similar for the sample of hot stars with Teff>30,000K.
These numbers confirm our previous conclusions, based on the photometrically histograms
of density counts, that FUV-NUV selected hot stars with inconsistent optical colors include
both true stellar binaries and extra-galactic objects with SED differing from the average
QSO templates shown in our color-color diagrams. More importantly, they indicate that our
FUV-NUV selection of “single” hot stars is quite robust.
As for the hot stars (WD) selected from the [NUV-g] vs [g-r] diagram, and shown in the
histograms of figure 8, 57%(AIS)/40%(MIS) have SDSS spectra. Of these, 66%(AIS)/61%(MIS)
are spectroscopically confirmed as stars; 30%(AIS)/34%(MIS) are spectroscopically classi-
fied as QSOs. We believe that the purity of the stellar sample is lower in this case because
the locus used to extract the high gravity stars includes lower Teff ’s than our FUV-NUV
selection, and is close to the QSO locus.
5.2. QSO Candidates
As pointed out previously by Bianchi et al. (2005), the [FUV-NUV] vs [NUV-r] diagram
(Figure 7) can also be used to select low redshift QSOs candidates. Figure 11 shows the
observed surface density of low-redshift QSO candidates, selected from this color combination
from both the MIS and AIS surveys. For comparison, the recent QSO catalog of Schneider
et al. (2005) from the SDSS DR3-release is also shown (orange histogram). To normalize the
SDSS QSO catalog to density of objects per unit area, we used an area of 3732 square degrees,
the coverage of the spectroscopic DR3 release, because the catalog includes spectroscopically
confirmed QSOs. We also limited the SDSS catalog to QSOs with z<1.3, corresponding to
our GALEX photometric selection. To actually scale the SDSS spectroscopically confirmed
catalog to the SDSS photometric selection of QSO candidates, we must consider that about
60% of the photometrically selected candidates have been observed spectroscopically so far
(Richards, private comm.) although the exact fraction is not available from the Schneider
et al. (2005) catalog. For more discussion, see Richards et al. (2005) and Hutchings et al.
(in preparation). The density of objects in our GALEX photometrically selected sample is
larger than the SDSS QSO candidate sample, and extends to fainter magnitudes.
In Figure 11, we show separately the point-like QSO-candidate GALEX sources, and
all sources with QSO-like colors regardless of spatial extent, i.e. including extended sources
which have observed colors consistent with our photometric selection. The present classifi-
cation of “point-like” and “extended” is based on the SDSS ≈1.4′′ psf, and obtained from
the pipeline. However, the contrast between the AGN central source and the underlying

– 19 –
galaxy is still poorly characterized at low redshifts (z≈1). The GALEX-selected catalog
of low redshift QSO candidates presents an opportunity to clarify this issue, which will be
investigated with follow-up deeper imaging.
We finally point out that other objects share the locus of the QSOs in the color-color
diagram: cataclysmic variables (CV) with a significant accretion disk have similar colors
and thus potentially contaminate the QSO sample. These objects however are extremely
rare, about 0.02 per square degrees (e.g. Szkody et al. (2004) and references therein). Our
QSO candidate density is at least over one order of magnitude higher than the expected
density of CV in the AIS, and about two dex higher in the MIS, therefore we expect our
GALEX-selected QSO candidates to not be significantly contaminated. However, such stellar
sources (expected to be nearby and therefore bright) might explain the excess of sources at
bright magnitudes, with respect to the confirmed SDSS QSOs. To estimate the purity of
the photometrically-selected sample, as we did for the hot stars samples, we have matched
our QSO candidates with the SDSS DR5 to search for archival optical spectra. We found
that 60%(AIS)/17%(MIS) of our QSO candidates (point-like) have spectra, and of these,
83%(AIS)/85%(MIS) confirm the QSO classification. The statistics is fairly significant: 1631
objects have spectra out of 2689 total objects for AIS, 930 out of 5312 for MIS. Of the non-
QSO objects, 14%(AIS)/12%(MIS) are spectroscopically classified as stars, consistent with
what one can qualitatively expect from the color-color diagrams. Therefore, based on the
results from the SDSS automated spectral classification, the purity of our GALEX-selected
point-like QSO-candidate sample can be considered ≈ 85%, comparable or higher to the
success rate of optical selection. As for the extended sources that fall in our QSO-selection
color locus, only 19%(AIS)/<0.1%(MIS) have spectra: of these, 27%(AIS)/48%(MIS) are
spectroscopically classified as QSOs. The statistic is less significant than for the point-like
sources.
GALEX (Galaxy Evolution Explorer) is a NASA Small Explorer, launched in April
2003. We gratefully acknowledge NASA’s support for construction, operation, and science
analysis of the GALEX mission, developed in cooperation with the Centre National d’Etudes
Spatiales of France and the Korean Ministry of Science and Technology. We are grateful to
John Hutchings, Wei Zheng and Gordon Richards for discussions about QSO issues and clar-
ifications about the QSO SDSS catalogs and templates, to Alessandro Bressan for providing
the yet unpublished SSP models and for extremely useful discussions, and (with Olga Vega)
for assistance in calculations of the galaxy template, to Paula Szkody and Knox Long for
illuminating discussions about CVs and for the CV templates. Facilities: GALEX, Sloan

– 20 –
REFERENCES
Abazajian, K., et al. 2005, AJ, 129, 1755
Acker, A. et al., 1982, the CDS Catalog of Galactic Planetary Nebulae
Bianchi, L., et al. 2006a, AAS207, 133.13
, Bianchi, L., et al. 2006b, in “The UV Universe: Stars from Birth to Death”, eds. A.I.
Gomez de Castro and M. Barstow, UCM publ., in press
Bianchi, L., & Efremova, B., 2006, AJ, 132, 378
Bianchi, L., et al. 2005, ApJ, 619, L27
Bressan, A., Granato, G.L., and Silva, L. 1998, A&A, 332, 135
Bruzual, G., & Charlot, S. 2003, MNRAS, 344, 1000
Budavari, T., Conti, A., Seibert, M., Szalay, A. S., & GALEX Science 2004, American
Astronomical Society Meeting Abstracts, 205,4204B
Buzzoni, A. 2005, MNRAS, 361, 725
de Voucouleurs, G et al., 1991 “Third Reference Catalogue of Bright Galaxies”, Springer-
Verlag
Eisenstein, D. J., et al. 2006, ApJS, in press
Eisenstein, D. J., et al. 2001, AJ, 122, 2267
Francis, P. J., Hewett, P. C., Foltz, C. B., Chaffee, F. H., Weymann, R. J., & Morris, S. L.
1991, ApJ, 373, 465
Fukugita, M., Ichikawa, T., Gunn, J. E., Doi, M., Shimasaku, K., & Schneider, D. P. 1996,
AJ, 111, 1748
Green, R.F., Schmidt, M. & Liebert, J. 1986, ApJS, 61, 305
Hubeny, I., & Lanz, T. 1995, ApJ, 439, 875
Lejeune, T., Cuisinier, F., & Buser, R. 1997, A&AS, 125, 229
Kleinman, S.J., et al. 2004, ApJ, 607, 426

– 21 –
Marigo, P., Girardi, L., Weiss, A., Groenewegen, M. A. T., & Chiosi, C. 2004, A&A, 423,
995
Martin, D. C., et al. 2005, ApJ, 619, L1
McCook, G. & Sion, E. 1999, ApJSS, 121, 1
Morrissey, P., et al. 2005, ApJ, 619, L7
Oke, J. B., & Gunn, J. E. 1983, ApJ, 266, 713
Pier, J. R., Munn, J. A., Hindsley, R. B., Hennessy, G. S., Kent, S. M., Lupton, R. H., &
Ivezic, Z. 2003, AJ, 125, 1559
Pourbaix, et al. 2004, A&A, 423, 755
Raymond et al. 2003, AJ, 125, 2621
Richards, G. T., et al. 2004, ApJS, 155, 257
Richards, G. T., et al. 2006, MNRAS, 360, 839
Robin, A.C., Reyl, C., Derrire, S., and Picaud, S. 2003, A&A409, 523
Robin, A.C., Reyl, C., Derrire, S., and Picaud, S. 2004, A&A416, 157 (erratum)
Schneider, D.P., et al. 2005, AJ, 130, 367
Silva, L., Granato, G.L., Bressan, A., & Danese, L. 1998, ApJ, 509, 103
Smolcic, V., et al. 2004, ApJ, 615, L144
Szkody, P., et al. 2004, AJ, 128, 1882
Yi, S.K. 2003, ApJ, 582, 202
York, D.G., Adelman, J., Andersen, J.E. et al. 2000, AJ, 120, 1579
This preprint was prepared with the AAS LATEX macros v5.2.

– 22 –
Fig. 1.— The location of the common areas between the GALEX GR1 release and the SDSS
DR3 release are shown in galactic coordinates. Upper plot: the All-sky Imaging Survey
carried out by GALEX has 622 fields matching the SDSS, the total unique area is 363±3
deg2, when we restrict the GALEX fields to the central 1 degree diameter. Lower plot:
The GALEX Medium Imaging Survey has 112 fields in common with SDSS DR3 covering a
unique overlap area of 86±1 deg2 .
– 23 –
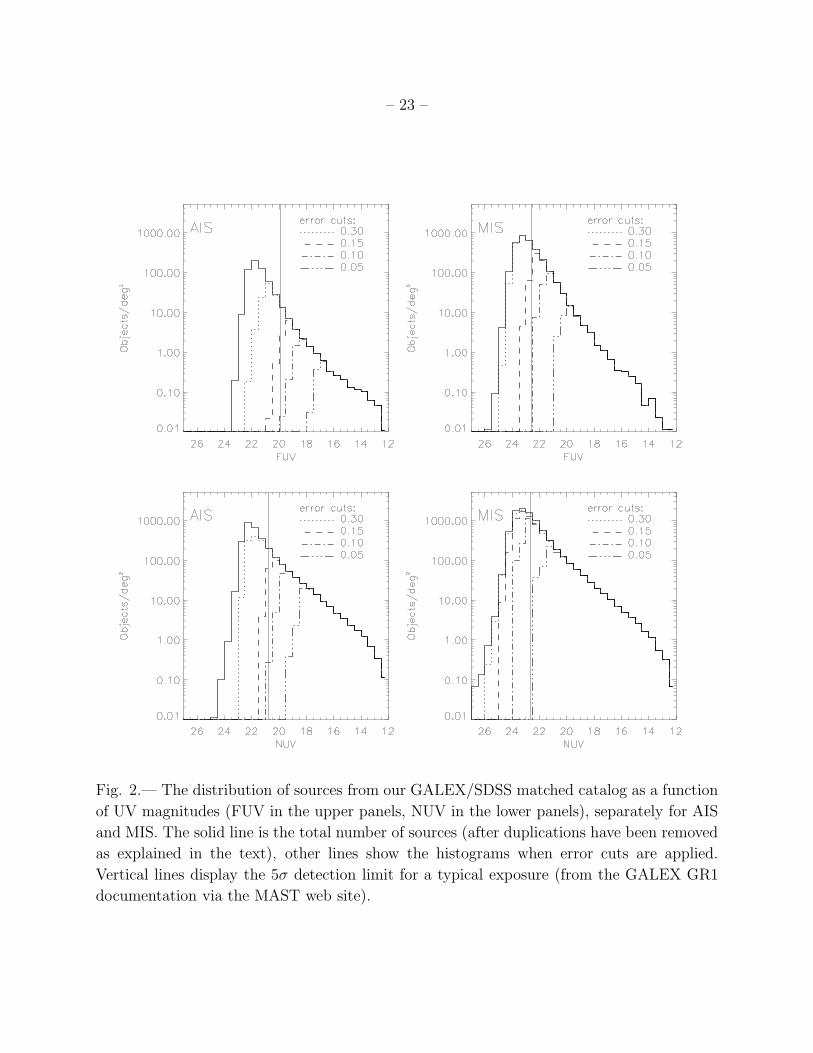
Fig. 2.— The distribution of sources from our GALEX/SDSS matched catalog as a function
of UV magnitudes (FUV in the upper panels, NUV in the lower panels), separately for AIS
and MIS. The solid line is the total number of sources (after duplications have been removed
as explained in the text), other lines show the histograms when error cuts are applied.
Vertical lines display the 5σ detection limit for a typical exposure (from the GALEX GR1
documentation via the MAST web site).

– 24 –
35 30 25 20 15 10u mag
1
10
100
1000
Obj
ects
/deg
2
MISError limit:
0.300.100.050.01
35 30 25 20 15 10g mag
1
10
100
1000
Obj
ects
/deg
2
MISError limit:
0.300.100.050.01
35 30 25 20 15 10r mag
1
10
100
1000
Obj
ects
/deg
2
MISError limit:
0.300.100.050.01
35 30 25 20 15 10 5i mag
1
10
100
1000
Obj
ects
/deg
2
MISError limit:
0.300.100.050.01
Fig. 3.— Similar to Figure 2 for the SDSS filters. Only the sources matched to the GALEX
MIS sources are shown, since the depth of the SDSS DR3 is obviously the same for the AIS
matched catalog, but the catalogs are limited by the GALEX detection limits in the AIS.
Vertical lines indicate the limiting magnitudes in each band from the SDSS web site. The
solid line is the total number of objects (including objects with saturation). The other lines
show the histograms when error cuts are applied.

– 25 –
30 25 20 15 10 5z mag
1
10
100
1000
Obj
ects
/deg
2
MISError limit:
0.300.100.050.01
Fig. 4.— Similar to Figure 3 for SDSS z magnitudes.

– 26 –
Fig. 5.— The [FUV-g] vs [g-i] and [NUV-g] vs [g-i] color-color diagrams for the AIS and MIS sources. Blue
dots are point-like sources and black-dots are extended sources, based on the optical data (psf ≈ 1.4”). Model
symbols are explained in the legend and described in the text. [FUV-g] and [NUV-g] are shown on the same
scale, to illustrate (y-axis) the advantage of FUV for separating hot stellar objects. Extinction effects are
shown for E(B − V )=0.5mag, MW-type dust, with lines connecting large symbols (intrinsic model colors)
to smaller symbols (reddened model color). Triangles mark stellar (main sequence and supergiants) Teff ’s of
50, 20, 10, 8, 7 and 6 kK. QSO model symbols mark redshifts of z= 0.0, 0.6, 1.0, 1.6 and 3. Galaxy templates
symbols (green) mark ages of 1, 5, 12 and 13 Gyrs for Ellipticals (E), Spirals (S), Irregulars (I). SSP marked
ages are 1, 200, 500Myrs, 1.5 and 15Gyr. Point-like sources cluster along the stellar sequence (predominantly
on the high-gravity sequence at high Teff ’s) and the QSO locus. QSOs and galaxies occupy contiguous loci,
well separated from the stellar sources. Sources with photometric errors better than 0.15/0.10/0.05/0.05mag
in FUV/NUV/g/i are shown.

– 27 –
Fig. 6.— The [NUV-g] vs [g-i] color-color diagrams for the AIS and MIS sources, with
symbols as in the previous figure. In this figure sources with errors < 0.1mag in NUV
and <0.05mag in the optical bands are shown, regardless of FUV-band photometric error.
The comparison with the previous figure, where an error cut in the FUV band was also
applied, illustrates the selection effects driven by FUV magnitude limits and error cuts in
the analysis. While the hot objects hardly change, the lower Teff stellar sequence becomes
extremely populated in these panels.

– 28 –
Fig. 7.— The [FUV-NUV] vs [g-r] and [FUV-NUV] vs [NUV-r] diagrams. Symbols and colors as in previous
figure. Stars and galaxies are well separated. The low-z QSOs are in between stars and galaxies in the top
diagrams but are more separated from both these classes of objects in the [FUV-NUV] vs [NUV-r] diagram,
especially for redshifts around 1 (the lowest point in the ’dip’ of the QSO model colors). Here, QSOs at z=0
overlap with cool WDs, and QSOs with z≈ 1.6 have similar colors to A-type main-sequence stars, but the
selection of QSOs around z=1 is best performed by using this color combination. Cataclysmic Variables at
some stages (binaries containing a WD and an accretion disk) may contaminate the z=1 QSO locus. These
objects are rare, and can be recognized only spectroscopically. The [FUV-NUV] vs [NUV-r] diagram can
also be used to separate single and binary hot WDs whose FUV-NUV colors are bluer than the QSOs.

– 29 –
Fig. 8.— The surface density of WDs (green) and lower gravity stars (blue). In orange, the
sum of the two samples. The stars were selected from the [NUV-g] vs [g-r] colors, for direct
comparison with the Milky Way model (see text). We restricted the sample to sources with
photometric errors better that 0.1mag in NUV, g and r, to avoid contamination by QSOs
(see figure 5). The diagram on the left shows the sources extracted from the deeper MIS
survey, the one to the right shows the sources from the AIS. The black histograms show
the predictions from the Milky Way model (see text for details), with colored asterisks to
indicate WD, non-WD, and total respectively. Sources around 14th mag in optical bands
may be affected by saturation in the SDSS survey and therefore excluded, so our histograms
are incomplete for objects brighter than r≈ 15mag.

– 30 –
Fig. 9.— The surface density (in the r-band) of hot stars selected from the FUV-NUV
(GALEX) color. The FUV-NUV color cuts correspond to Teff> 18,000 K (blue histogram)
and Teff> 30,000 K (green histogram) for stars with log g=5.0, but include lower Teff ’ s for
stars of higher gravities (see text). Sources with photometric errors of < 0.3 mag in FUV
and NUV are included. This selection does not use SDSS measurements, thus avoids the loss
of bright stars due to saturation seen in the previous figure. A fraction of these objects have
optical colors discrepant from the hot-WD UV colors, and they are either binaries with a
cool companion or extragalactic objects intruded in the sample. The apparent difference in
the AIS and MIS counts at bright magnitudes is due to these objects having an r magnitude
that does not correspond to that of a single WD (which is not taken into account by the
Milky Way model), as proven by the next figure. For the same reason, the apparent match
of the MIS number of objects with the model is probably biased in the r-band.

– 31 –
Fig. 10.— The NUV-band surface density of the hot stars selected from FUV-NUV GALEX
color, same sample as in the previous Figure. Solid-color histograms show “single” hot WD-
candidates, dashed histograms include both single-WD and objects with optical colors redder
than what correponds to a hot-WD with the observed UV color. These include binaries with
a hot-WD and possibly also extragalactic objects as suggested by their number increasing
at fainter magnitudes. The Galaxy r-band WD model (black line) has been shifted using
an average color of <NUV-r>=-1.5 mag. Because the UV band is more representative of
the WD component in the case of binaries, the AIS and MIS counts at bright magnitudes
are consistent as we expect, until the AIS becomes incomplete. The AIS is better sampled
because it covers a larger area.

– 32 –
Fig. 11.— The surface density of low-redshift QSO candidates from the GALEX catalogs.
In green, sources extracted from the deeper MIS, in blue the QSO candidates from AIS.
Histograms only outlined include both point-like and extended sources in the color locus
of the QSOs. Shadow-filled histograms include only point-like sources with the same color
selection. Error bars are shown. The solid orange histogram shows the SDSS QSO catalog
of Schneider et al. (2005); included are QSOs with (z<1.3), to match the GALEX color
selection. Including QSOs at all redshifts from the SDSS catalog does not change significantly
the SDSS histogram on our scale. Note that the SDSS QSOs are spectroscopically confirmed;
they are about 60% to 85% of the SDSS QSOs candidates selected photometrically. We
estimate that our photometric selection may contain 15% spurious sources.

– 33 –
Table 1. Statistics of sources in the different bands
Number of Sources
Band (error<0.2 mag) (error<0.1 mag) (error<0.05 mag)
AIS MIS AIS MIS AIS MIS
FUV 15007 137940 2902 23840 821 3866
NUV 250063 627353 83540 314498 31275 75680
u 269070 99563 206481 74777 169439 58671
g 631119 287428 448334 172208 312059 116371
r 699744 355341 513223 211791 350779 132569
i 637288 310262 448761 182945 309971 117935
z 365375 144429 255060 96299 194863 73006