Designing customer-oriented catalogs in e-CRM using an effective self-adaptive genetic algorithm
12
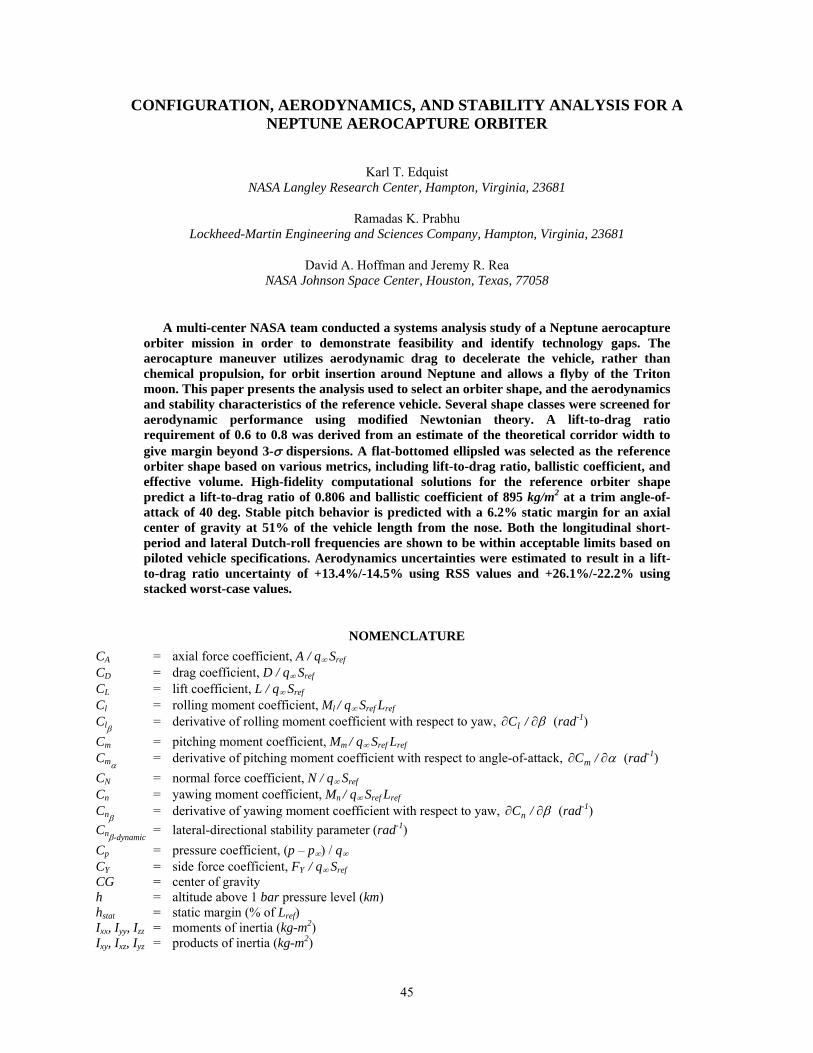
45 CONFIGURATION, AERODYNAMICS, AND STABILITY ANALYSIS FOR A NEPTUNE AEROCAPTURE ORBITER Karl T. Edquist NASA Langley Research Center, Hampton, Virginia, 23681 Ramadas K. Prabhu Lockheed-Martin Engineering and Sciences Company, Hampton, Virginia, 23681 David A. Hoffman and Jeremy R. Rea NASA Johnson Space Center, Houston, Texas, 77058 A multi-center NASA team conducted a systems analysis study of a Neptune aerocapture orbiter mission in order to demonstrate feasibility and identify technology gaps. The aerocapture maneuver utilizes aerodynamic drag to decelerate the vehicle, rather than chemical propulsion, for orbit insertion around Neptune and allows a flyby of the Triton moon. This paper presents the analysis used to select an orbiter shape, and the aerodynamics and stability characteristics of the reference vehicle. Several shape classes were screened for aerodynamic performance using modified Newtonian theory. A lift-to-drag ratio requirement of 0.6 to 0.8 was derived from an estimate of the theoretical corridor width to give margin beyond 3-σ dispersions. A flat-bottomed ellipsled was selected as the reference orbiter shape based on various metrics, including lift-to-drag ratio, ballistic coefficient, and effective volume. High-fidelity computational solutions for the reference orbiter shape predict a lift-to-drag ratio of 0.806 and ballistic coefficient of 895 kg/m 2 at a trim angle-of- attack of 40 deg. Stable pitch behavior is predicted with a 6.2% static margin for an axial center of gravity at 51% of the vehicle length from the nose. Both the longitudinal short- period and lateral Dutch-roll frequencies are shown to be within acceptable limits based on piloted vehicle specifications. Aerodynamics uncertainties were estimated to result in a lift- to-drag ratio uncertainty of +13.4%/-14.5% using RSS values and +26.1%/-22.2% using stacked worst-case values. NOMENCLATURE C A = axial force coefficient, A / q ∞ S ref C D = drag coefficient, D / q ∞ S ref C L = lift coefficient, L / q ∞ S ref C l = rolling moment coefficient, M l / q ∞ S ref L ref C l β = derivative of rolling moment coefficient with respect to yaw, β ∂ ∂ / C l (rad -1 ) C m = pitching moment coefficient, M m / q ∞ S ref L ref C m α = derivative of pitching moment coefficient with respect to angle-of-attack, α ∂ ∂ / C m (rad -1 ) C N = normal force coefficient, N / q ∞ S ref C n = yawing moment coefficient, M n / q ∞ S ref L ref C n β = derivative of yawing moment coefficient with respect to yaw, β ∂ ∂ / C n (rad -1 ) C n β-dynamic = lateral-directional stability parameter (rad -1 ) C p = pressure coefficient, (p – p ∞ ) / q ∞ C Y = side force coefficient, F Y / q ∞ S ref CG = center of gravity h = altitude above 1 bar pressure level (km) h stat = static margin (% of L ref ) I xx , I yy , I zz = moments of inertia (kg-m 2 ) I xy , I xz , I yz = products of inertia (kg-m 2 )
Transcript of Designing customer-oriented catalogs in e-CRM using an effective self-adaptive genetic algorithm
45
CONFIGURATION, AERODYNAMICS, AND STABILITY ANALYSIS FOR A NEPTUNE AEROCAPTURE ORBITER
Karl T. Edquist NASA Langley Research Center, Hampton, Virginia, 23681
Ramadas K. Prabhu Lockheed-Martin Engineering and Sciences Company, Hampton, Virginia, 23681
David A. Hoffman and Jeremy R. Rea NASA Johnson Space Center, Houston, Texas, 77058
A multi-center NASA team conducted a systems analysis study of a Neptune aerocapture orbiter mission in order to demonstrate feasibility and identify technology gaps. The aerocapture maneuver utilizes aerodynamic drag to decelerate the vehicle, rather than chemical propulsion, for orbit insertion around Neptune and allows a flyby of the Triton moon. This paper presents the analysis used to select an orbiter shape, and the aerodynamics and stability characteristics of the reference vehicle. Several shape classes were screened for aerodynamic performance using modified Newtonian theory. A lift-to-drag ratio requirement of 0.6 to 0.8 was derived from an estimate of the theoretical corridor width to give margin beyond 3-σ dispersions. A flat-bottomed ellipsled was selected as the reference orbiter shape based on various metrics, including lift-to-drag ratio, ballistic coefficient, and effective volume. High-fidelity computational solutions for the reference orbiter shape predict a lift-to-drag ratio of 0.806 and ballistic coefficient of 895 kg/m2 at a trim angle-of-attack of 40 deg. Stable pitch behavior is predicted with a 6.2% static margin for an axial center of gravity at 51% of the vehicle length from the nose. Both the longitudinal short-period and lateral Dutch-roll frequencies are shown to be within acceptable limits based on piloted vehicle specifications. Aerodynamics uncertainties were estimated to result in a lift-to-drag ratio uncertainty of +13.4%/-14.5% using RSS values and +26.1%/-22.2% using stacked worst-case values.
NOMENCLATURE CA = axial force coefficient, A / q∞ Sref CD = drag coefficient, D / q∞ Sref CL = lift coefficient, L / q∞ Sref Cl = rolling moment coefficient, Ml / q∞ Sref Lref Clβ
= derivative of rolling moment coefficient with respect to yaw, β∂∂ /Cl (rad-1) Cm = pitching moment coefficient, Mm / q∞ Sref Lref Cmα
= derivative of pitching moment coefficient with respect to angle-of-attack, α∂∂ /Cm (rad-1) CN = normal force coefficient, N / q∞ Sref Cn = yawing moment coefficient, Mn / q∞ Sref Lref Cnβ
= derivative of yawing moment coefficient with respect to yaw, β∂∂ /Cn (rad-1) Cnβ-dynamic
= lateral-directional stability parameter (rad-1) Cp = pressure coefficient, (p – p∞) / q∞ CY = side force coefficient, FY / q∞ Sref CG = center of gravity h = altitude above 1 bar pressure level (km) hstat = static margin (% of Lref) Ixx, Iyy, Izz = moments of inertia (kg-m2) Ixy, Ixz, Iyz = products of inertia (kg-m2)
46
L = aeroshell length (m) L/D = lift-to-drag ratio m = aerocapture mass (kg) q = dynamic pressure, ½ρV2 (Pa) S = surface area (m2) T = temperature (K) U = aeroshell volume (m3) V = velocity relative to atmosphere (km/s) Veff = effective volume X = axial coordinate (m) Y, Z = lateral coordinate (m) α = trim angle of attack (deg) β = yaw angle (deg) βm = ballistic coefficient, m / CD Sref (kg/m2) γ = flight path angle (deg) Ω = Dutch-roll frequency (rad/s) ω = short-period frequency (rad/s) θ = angle between surface normal vector and freestream velocity vector (deg) ρ = density (kg/m3) σ = standard deviation
SUBSCRIPTS cg = center of gravity base = aeroshell base neut = neutral point ref = reference value wet = wetted surface ∞ = freestream condition
INTRODUCTION multi-center NASA team conducted a systems analysis study of a Neptune aerocapture orbiter mission1-8 under funding from the In-Space Propulsion program. The study was conducted to demonstrate the benefits and
feasibility of aerocapture, and identify technology gaps and requirements that must be addressed. Detailed analyses were performed in the areas of mission design, configuration, aerodynamics, propulsion, mass properties, structural dynamics, aerothermodynamics, thermal protection, atmospheric modeling, trajectory simulations, guidance, and navigation. This paper covers the trade study that resulted in the reference orbiter shape, as well as the static aerodynamics and a preliminary stability analysis of the vehicle.
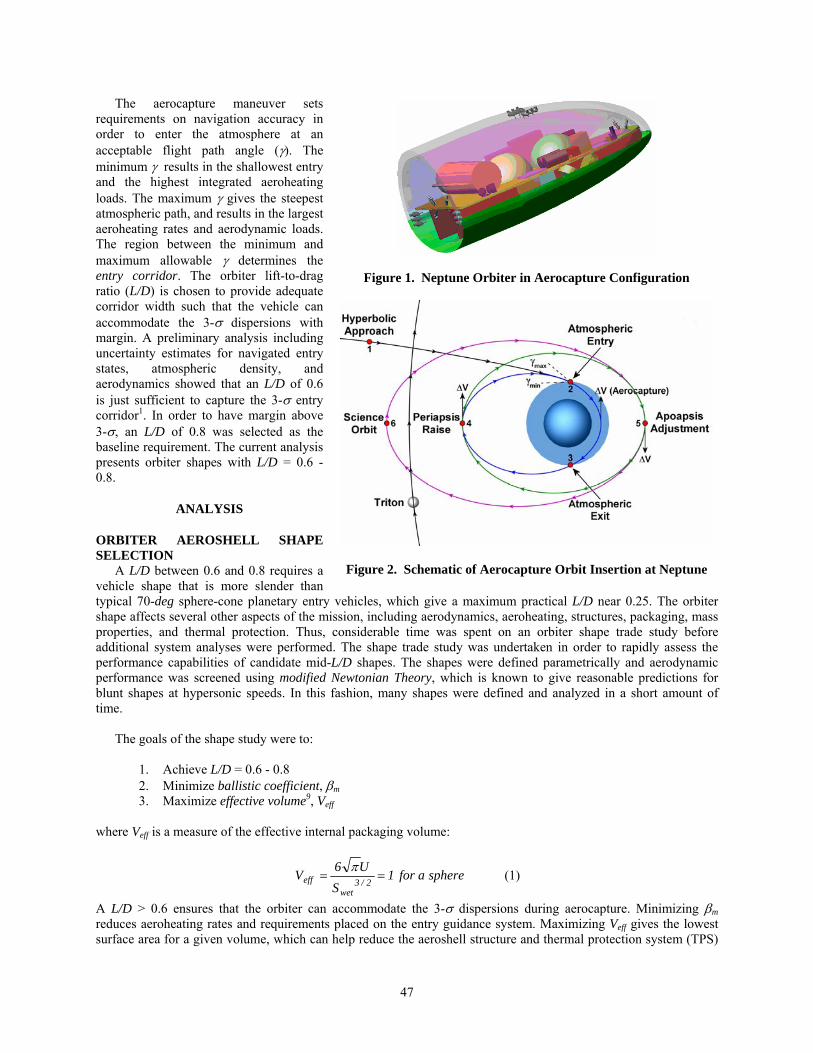
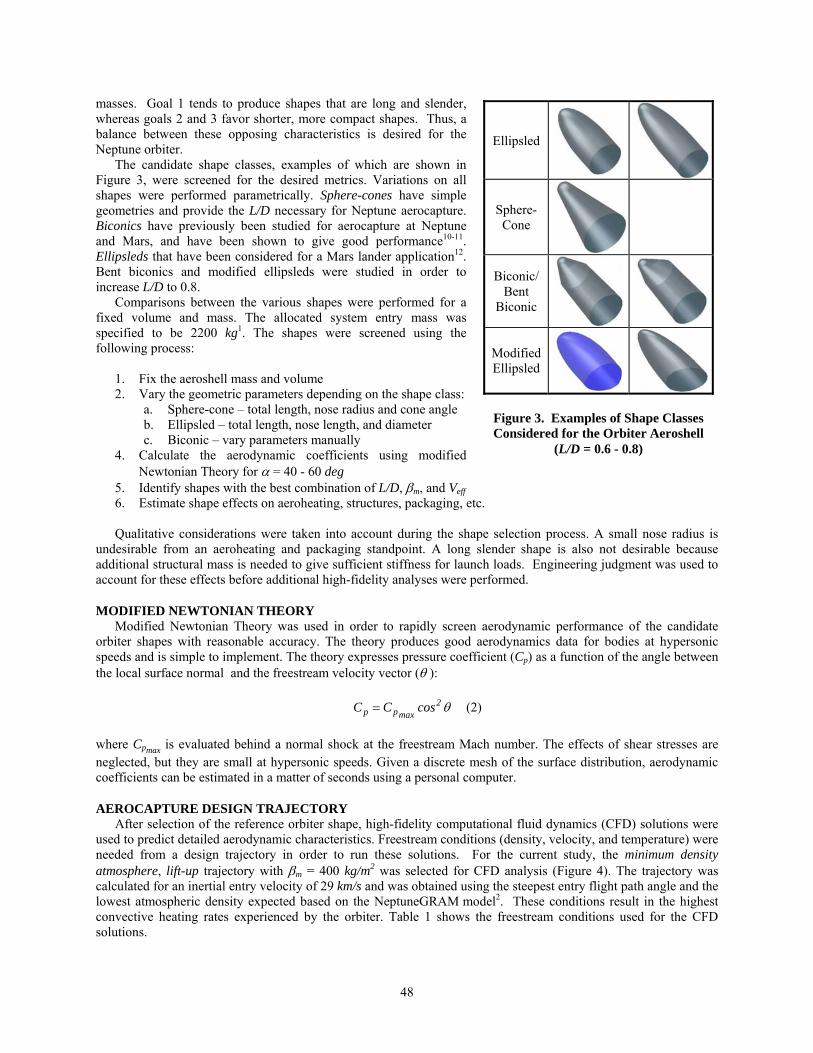
Figure 1 shows the reference orbiter in its aerocapture configuration. The orbiter is designed to release two probes before atmospheric entry. The science orbit is designed to observe both Neptune and a nearby moon, Triton. An elliptical orbit with an apoapsis of 430,000 km was selected to achieve the science goals. Aerocapture is proposed as an alternative to chemical propulsion to insert the aeroshell into an elliptical orbit around Neptune. Aerocapture is a maneuver performed at the target planet in which the vehicle enters the atmosphere in order to remove kinetic energy via aerodynamic drag. The maneuver must be performed so that the vehicle reaches deep enough into the atmosphere to remove sufficient energy to allow capture and shallow enough to avoid hitting the planet. A small amount of chemical propulsion is needed to raise the periapsis and place the spacecraft into the final science orbit. Figure 2 shows a schematic of aerocapture at Neptune with a science orbit that intercepts Triton’s orbit.
A
47
The aerocapture maneuver sets requirements on navigation accuracy in order to enter the atmosphere at an acceptable flight path angle (γ). The minimum γ results in the shallowest entry and the highest integrated aeroheating loads. The maximum γ gives the steepest atmospheric path, and results in the largest aeroheating rates and aerodynamic loads. The region between the minimum and maximum allowable γ determines the entry corridor. The orbiter lift-to-drag ratio (L/D) is chosen to provide adequate corridor width such that the vehicle can accommodate the 3-σ dispersions with margin. A preliminary analysis including uncertainty estimates for navigated entry states, atmospheric density, and aerodynamics showed that an L/D of 0.6 is just sufficient to capture the 3-σ entry corridor1. In order to have margin above 3-σ, an L/D of 0.8 was selected as the baseline requirement. The current analysis presents orbiter shapes with L/D = 0.6 - 0.8.
ANALYSIS
ORBITER AEROSHELL SHAPE SELECTION
A L/D between 0.6 and 0.8 requires a vehicle shape that is more slender than typical 70-deg sphere-cone planetary entry vehicles, which give a maximum practical L/D near 0.25. The orbiter shape affects several other aspects of the mission, including aerodynamics, aeroheating, structures, packaging, mass properties, and thermal protection. Thus, considerable time was spent on an orbiter shape trade study before additional system analyses were performed. The shape trade study was undertaken in order to rapidly assess the performance capabilities of candidate mid-L/D shapes. The shapes were defined parametrically and aerodynamic performance was screened using modified Newtonian Theory, which is known to give reasonable predictions for blunt shapes at hypersonic speeds. In this fashion, many shapes were defined and analyzed in a short amount of time.
The goals of the shape study were to:
1. Achieve L/D = 0.6 - 0.8 2. Minimize ballistic coefficient, βm 3. Maximize effective volume9, Veff
where Veff is a measure of the effective internal packaging volume:
sphereafor1S
U6V2/3
weteff ==
π (1)
A L/D > 0.6 ensures that the orbiter can accommodate the 3-σ dispersions during aerocapture. Minimizing βm reduces aeroheating rates and requirements placed on the entry guidance system. Maximizing Veff gives the lowest surface area for a given volume, which can help reduce the aeroshell structure and thermal protection system (TPS)
Figure 1. Neptune Orbiter in Aerocapture Configuration
Figure 2. Schematic of Aerocapture Orbit Insertion at Neptune
48
masses. Goal 1 tends to produce shapes that are long and slender, whereas goals 2 and 3 favor shorter, more compact shapes. Thus, a balance between these opposing characteristics is desired for the Neptune orbiter.
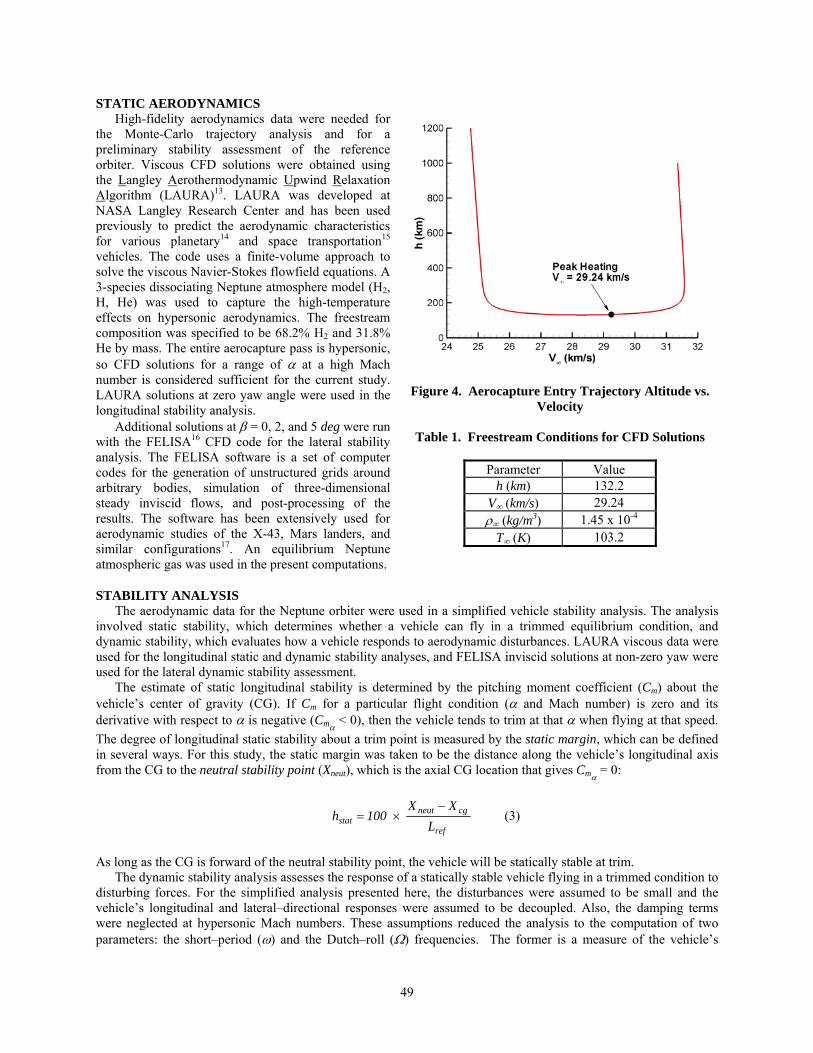
The candidate shape classes, examples of which are shown in Figure 3, were screened for the desired metrics. Variations on all shapes were performed parametrically. Sphere-cones have simple geometries and provide the L/D necessary for Neptune aerocapture. Biconics have previously been studied for aerocapture at Neptune and Mars, and have been shown to give good performance10-11. Ellipsleds that have been considered for a Mars lander application12. Bent biconics and modified ellipsleds were studied in order to increase L/D to 0.8.
Comparisons between the various shapes were performed for a fixed volume and mass. The allocated system entry mass was specified to be 2200 kg1. The shapes were screened using the following process:
1. Fix the aeroshell mass and volume 2. Vary the geometric parameters depending on the shape class:
a. Sphere-cone – total length, nose radius and cone angle b. Ellipsled – total length, nose length, and diameter c. Biconic – vary parameters manually
4. Calculate the aerodynamic coefficients using modified Newtonian Theory for α = 40 - 60 deg
5. Identify shapes with the best combination of L/D, βm, and Veff 6. Estimate shape effects on aeroheating, structures, packaging, etc. Qualitative considerations were taken into account during the shape selection process. A small nose radius is
undesirable from an aeroheating and packaging standpoint. A long slender shape is also not desirable because additional structural mass is needed to give sufficient stiffness for launch loads. Engineering judgment was used to account for these effects before additional high-fidelity analyses were performed.
MODIFIED NEWTONIAN THEORY Modified Newtonian Theory was used in order to rapidly screen aerodynamic performance of the candidate
orbiter shapes with reasonable accuracy. The theory produces good aerodynamics data for bodies at hypersonic speeds and is simple to implement. The theory expresses pressure coefficient (Cp) as a function of the angle between the local surface normal and the freestream velocity vector (θ ):
θ2
maxpp cosCC = (2)
where Cpmax is evaluated behind a normal shock at the freestream Mach number. The effects of shear stresses are neglected, but they are small at hypersonic speeds. Given a discrete mesh of the surface distribution, aerodynamic coefficients can be estimated in a matter of seconds using a personal computer.
AEROCAPTURE DESIGN TRAJECTORY After selection of the reference orbiter shape, high-fidelity computational fluid dynamics (CFD) solutions were
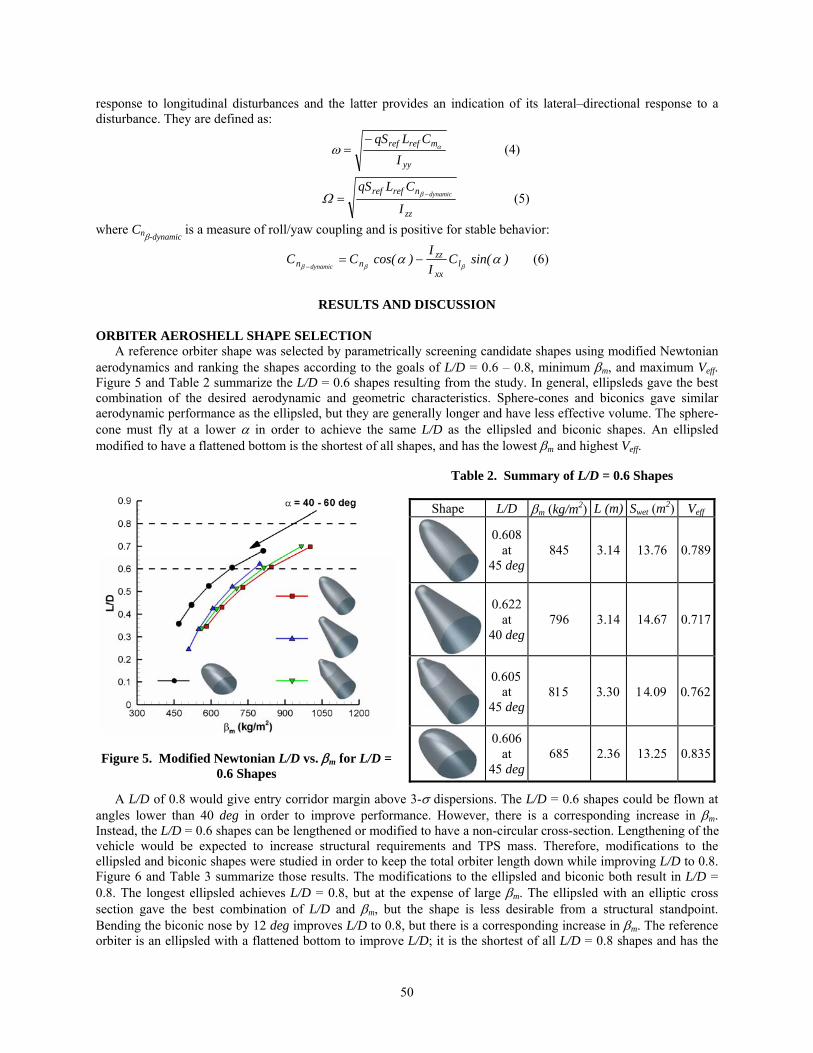
used to predict detailed aerodynamic characteristics. Freestream conditions (density, velocity, and temperature) were needed from a design trajectory in order to run these solutions. For the current study, the minimum density atmosphere, lift-up trajectory with βm = 400 kg/m2 was selected for CFD analysis (Figure 4). The trajectory was calculated for an inertial entry velocity of 29 km/s and was obtained using the steepest entry flight path angle and the lowest atmospheric density expected based on the NeptuneGRAM model2. These conditions result in the highest convective heating rates experienced by the orbiter. Table 1 shows the freestream conditions used for the CFD solutions.
Ellipsled
Sphere-Cone
Biconic/ Bent
Biconic
Modified Ellipsled
Figure 3. Examples of Shape Classes Considered for the Orbiter Aeroshell
(L/D = 0.6 - 0.8)
49
STATIC AERODYNAMICS High-fidelity aerodynamics data were needed for
the Monte-Carlo trajectory analysis and for a preliminary stability assessment of the reference orbiter. Viscous CFD solutions were obtained using the Langley Aerothermodynamic Upwind Relaxation Algorithm (LAURA)13. LAURA was developed at NASA Langley Research Center and has been used previously to predict the aerodynamic characteristics for various planetary14 and space transportation15 vehicles. The code uses a finite-volume approach to solve the viscous Navier-Stokes flowfield equations. A 3-species dissociating Neptune atmosphere model (H2, H, He) was used to capture the high-temperature effects on hypersonic aerodynamics. The freestream composition was specified to be 68.2% H2 and 31.8% He by mass. The entire aerocapture pass is hypersonic, so CFD solutions for a range of α at a high Mach number is considered sufficient for the current study. LAURA solutions at zero yaw angle were used in the longitudinal stability analysis.
Additional solutions at β = 0, 2, and 5 deg were run with the FELISA16 CFD code for the lateral stability analysis. The FELISA software is a set of computer codes for the generation of unstructured grids around arbitrary bodies, simulation of three-dimensional steady inviscid flows, and post-processing of the results. The software has been extensively used for aerodynamic studies of the X-43, Mars landers, and similar configurations17. An equilibrium Neptune atmospheric gas was used in the present computations.
STABILITY ANALYSIS The aerodynamic data for the Neptune orbiter were used in a simplified vehicle stability analysis. The analysis
involved static stability, which determines whether a vehicle can fly in a trimmed equilibrium condition, and dynamic stability, which evaluates how a vehicle responds to aerodynamic disturbances. LAURA viscous data were used for the longitudinal static and dynamic stability analyses, and FELISA inviscid solutions at non-zero yaw were used for the lateral dynamic stability assessment.
The estimate of static longitudinal stability is determined by the pitching moment coefficient (Cm) about the vehicle’s center of gravity (CG). If Cm for a particular flight condition (α and Mach number) is zero and its derivative with respect to α is negative (Cmα
< 0), then the vehicle tends to trim at that α when flying at that speed. The degree of longitudinal static stability about a trim point is measured by the static margin, which can be defined in several ways. For this study, the static margin was taken to be the distance along the vehicle’s longitudinal axis from the CG to the neutral stability point (Xneut), which is the axial CG location that gives Cmα
= 0:
ref
cgneutstat L
XX100h
−×= (3)
As long as the CG is forward of the neutral stability point, the vehicle will be statically stable at trim.
The dynamic stability analysis assesses the response of a statically stable vehicle flying in a trimmed condition to disturbing forces. For the simplified analysis presented here, the disturbances were assumed to be small and the vehicle’s longitudinal and lateral–directional responses were assumed to be decoupled. Also, the damping terms were neglected at hypersonic Mach numbers. These assumptions reduced the analysis to the computation of two parameters: the short–period (ω) and the Dutch–roll (Ω) frequencies. The former is a measure of the vehicle’s
Figure 4. Aerocapture Entry Trajectory Altitude vs. Velocity
Table 1. Freestream Conditions for CFD Solutions
Parameter Value
h (km) 132.2 V∞ (km/s) 29.24 ρ∞ (kg/m3) 1.45 x 10⁻⁴
T∞ (K) 103.2
50
response to longitudinal disturbances and the latter provides an indication of its lateral–directional response to a disturbance. They are defined as:
yy
mrefref
ICLqS
αω−
= (4)
zz
nrefref
I
CLqSdynamic−= βΩ (5)
where Cnβ-dynamic is a measure of roll/yaw coupling and is positive for stable behavior:
)sin(CII
)cos(CC lxx
zznn dynamic
ααβββ
−=−
(6)
RESULTS AND DISCUSSION
ORBITER AEROSHELL SHAPE SELECTION A reference orbiter shape was selected by parametrically screening candidate shapes using modified Newtonian
aerodynamics and ranking the shapes according to the goals of L/D = 0.6 – 0.8, minimum βm, and maximum Veff. Figure 5 and Table 2 summarize the L/D = 0.6 shapes resulting from the study. In general, ellipsleds gave the best combination of the desired aerodynamic and geometric characteristics. Sphere-cones and biconics gave similar aerodynamic performance as the ellipsled, but they are generally longer and have less effective volume. The sphere-cone must fly at a lower α in order to achieve the same L/D as the ellipsled and biconic shapes. An ellipsled modified to have a flattened bottom is the shortest of all shapes, and has the lowest βm and highest Veff.
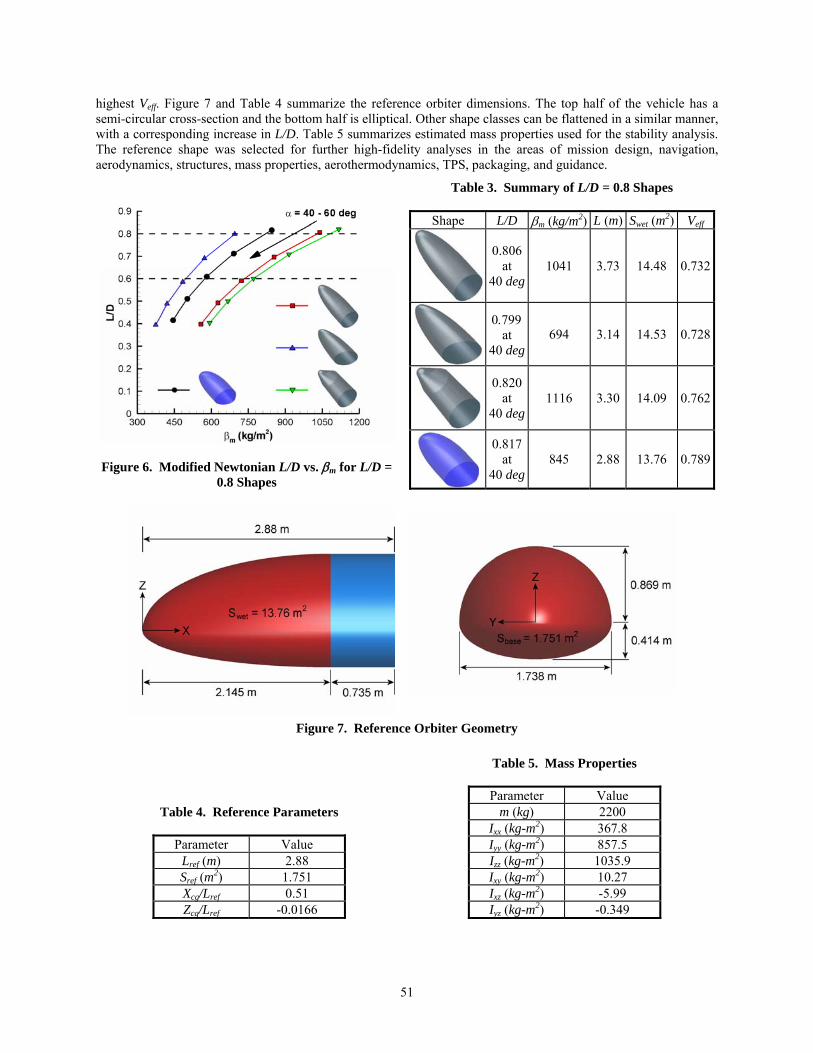
A L/D of 0.8 would give entry corridor margin above 3-σ dispersions. The L/D = 0.6 shapes could be flown at angles lower than 40 deg in order to improve performance. However, there is a corresponding increase in βm. Instead, the L/D = 0.6 shapes can be lengthened or modified to have a non-circular cross-section. Lengthening of the vehicle would be expected to increase structural requirements and TPS mass. Therefore, modifications to the ellipsled and biconic shapes were studied in order to keep the total orbiter length down while improving L/D to 0.8. Figure 6 and Table 3 summarize those results. The modifications to the ellipsled and biconic both result in L/D = 0.8. The longest ellipsled achieves L/D = 0.8, but at the expense of large βm. The ellipsled with an elliptic cross section gave the best combination of L/D and βm, but the shape is less desirable from a structural standpoint. Bending the biconic nose by 12 deg improves L/D to 0.8, but there is a corresponding increase in βm. The reference orbiter is an ellipsled with a flattened bottom to improve L/D; it is the shortest of all L/D = 0.8 shapes and has the
Figure 5. Modified Newtonian L/D vs. βm for L/D = 0.6 Shapes
Table 2. Summary of L/D = 0.6 Shapes
Shape L/D βm (kg/m2) L (m) Swet (m2) Veff
0.608at
45 deg845 3.14 13.76 0.789
0.622at
40 deg796 3.14 14.67 0.717
0.605 at
45 deg 815 3.30 14.09 0.762
0.606at
45 deg685 2.36 13.25 0.835
51
highest Veff. Figure 7 and Table 4 summarize the reference orbiter dimensions. The top half of the vehicle has a semi-circular cross-section and the bottom half is elliptical. Other shape classes can be flattened in a similar manner, with a corresponding increase in L/D. Table 5 summarizes estimated mass properties used for the stability analysis. The reference shape was selected for further high-fidelity analyses in the areas of mission design, navigation, aerodynamics, structures, mass properties, aerothermodynamics, TPS, packaging, and guidance.
Figure 6. Modified Newtonian L/D vs. βm for L/D = 0.8 Shapes
Table 3. Summary of L/D = 0.8 Shapes
Shape L/D βm (kg/m2) L (m) Swet (m2) Veff
0.806at
40 deg1041 3.73 14.48 0.732
0.799 at
40 deg 694 3.14 14.53 0.728
0.820at
40 deg1116 3.30 14.09 0.762
0.817at
40 deg845 2.88 13.76 0.789
Figure 7. Reference Orbiter Geometry
Table 4. Reference Parameters
Parameter Value Lref (m) 2.88 Sref (m2) 1.751 Xcg/Lref 0.51 Zcg/Lref -0.0166
Table 5. Mass Properties
Parameter Value
m (kg) 2200 Ixx (kg-m2) 367.8 Iyy (kg-m2) 857.5 Izz (kg-m2) 1035.9 Ixy (kg-m2) 10.27 Ixz (kg-m2) -5.99 Iyz (kg-m2) -0.349
52
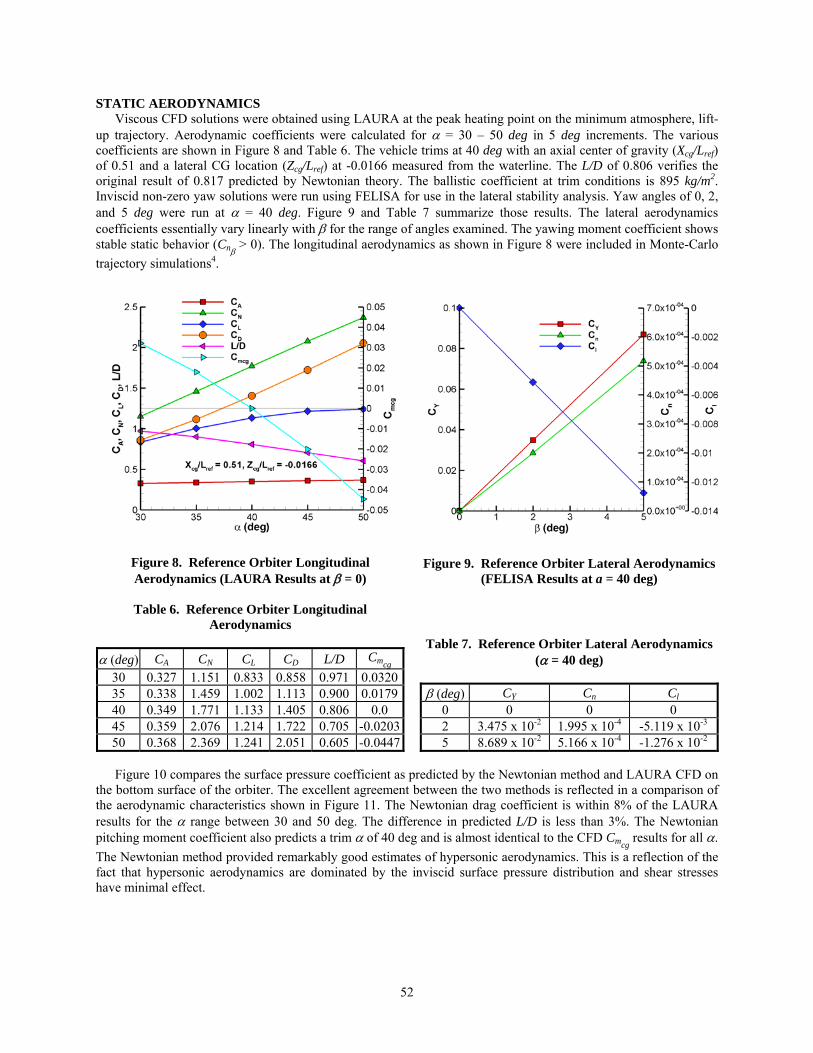
STATIC AERODYNAMICS Viscous CFD solutions were obtained using LAURA at the peak heating point on the minimum atmosphere, lift-
up trajectory. Aerodynamic coefficients were calculated for α = 30 – 50 deg in 5 deg increments. The various coefficients are shown in Figure 8 and Table 6. The vehicle trims at 40 deg with an axial center of gravity (Xcg/Lref) of 0.51 and a lateral CG location (Zcg/Lref) at -0.0166 measured from the waterline. The L/D of 0.806 verifies the original result of 0.817 predicted by Newtonian theory. The ballistic coefficient at trim conditions is 895 kg/m2. Inviscid non-zero yaw solutions were run using FELISA for use in the lateral stability analysis. Yaw angles of 0, 2, and 5 deg were run at α = 40 deg. Figure 9 and Table 7 summarize those results. The lateral aerodynamics coefficients essentially vary linearly with β for the range of angles examined. The yawing moment coefficient shows stable static behavior (Cnβ
> 0). The longitudinal aerodynamics as shown in Figure 8 were included in Monte-Carlo trajectory simulations4.
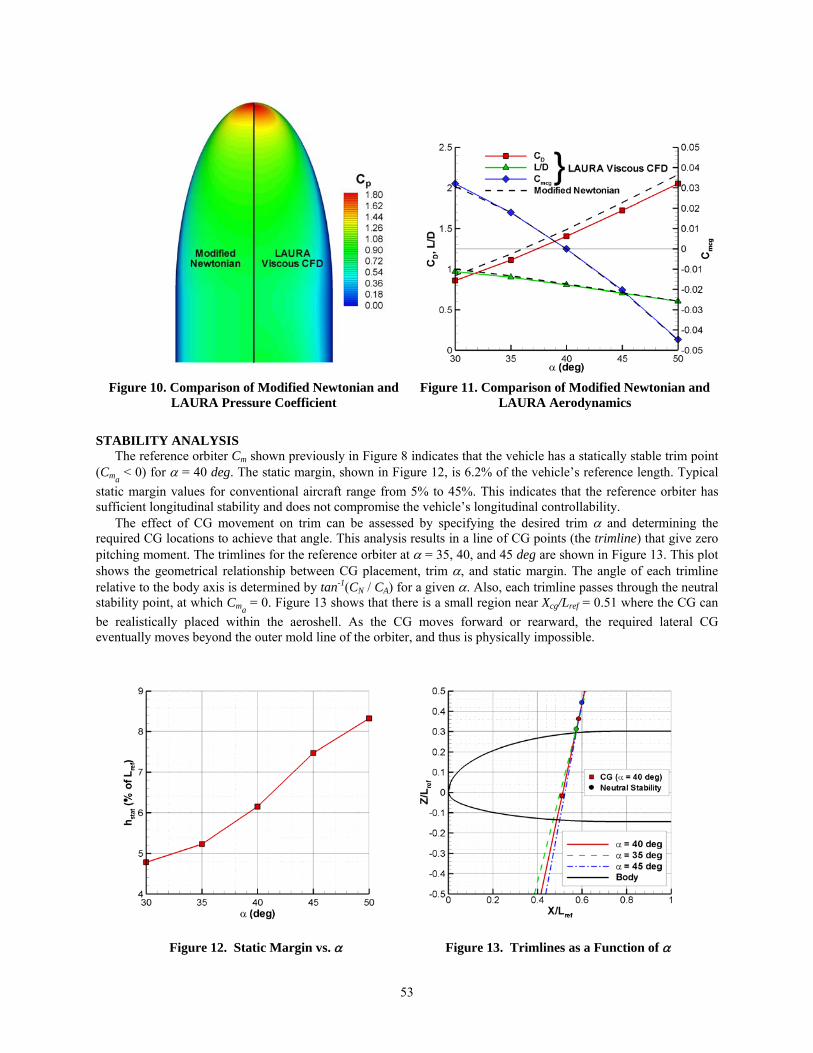
Figure 10 compares the surface pressure coefficient as predicted by the Newtonian method and LAURA CFD on the bottom surface of the orbiter. The excellent agreement between the two methods is reflected in a comparison of the aerodynamic characteristics shown in Figure 11. The Newtonian drag coefficient is within 8% of the LAURA results for the α range between 30 and 50 deg. The difference in predicted L/D is less than 3%. The Newtonian pitching moment coefficient also predicts a trim α of 40 deg and is almost identical to the CFD Cmcg
results for all α. The Newtonian method provided remarkably good estimates of hypersonic aerodynamics. This is a reflection of the fact that hypersonic aerodynamics are dominated by the inviscid surface pressure distribution and shear stresses have minimal effect.
Figure 8. Reference Orbiter Longitudinal Aerodynamics (LAURA Results at β = 0)
Figure 9. Reference Orbiter Lateral Aerodynamics (FELISA Results at a = 40 deg)
Table 6. Reference Orbiter Longitudinal
Aerodynamics
α (deg) CA CN CL CD L/D Cmcg
30 0.327 1.151 0.833 0.858 0.971 0.032035 0.338 1.459 1.002 1.113 0.900 0.017940 0.349 1.771 1.133 1.405 0.806 0.0 45 0.359 2.076 1.214 1.722 0.705 -0.020350 0.368 2.369 1.241 2.051 0.605 -0.0447
Table 7. Reference Orbiter Lateral Aerodynamics
(α = 40 deg)
β (deg) CY Cn Cl 0 0 0 0 2 3.475 x 10⁻² 1.995 x 10⁻⁴ -5.119 x 10⁻³ 5 8.689 x 10⁻² 5.166 x 10⁻⁴ -1.276 x 10⁻²
53
STABILITY ANALYSIS The reference orbiter Cm shown previously in Figure 8 indicates that the vehicle has a statically stable trim point
(Cma < 0) for α = 40 deg. The static margin, shown in Figure 12, is 6.2% of the vehicle’s reference length. Typical
static margin values for conventional aircraft range from 5% to 45%. This indicates that the reference orbiter has sufficient longitudinal stability and does not compromise the vehicle’s longitudinal controllability.
The effect of CG movement on trim can be assessed by specifying the desired trim α and determining the required CG locations to achieve that angle. This analysis results in a line of CG points (the trimline) that give zero pitching moment. The trimlines for the reference orbiter at α = 35, 40, and 45 deg are shown in Figure 13. This plot shows the geometrical relationship between CG placement, trim α, and static margin. The angle of each trimline relative to the body axis is determined by tan-1(CN / CA) for a given α. Also, each trimline passes through the neutral stability point, at which Cma
= 0. Figure 13 shows that there is a small region near Xcg/Lref = 0.51 where the CG can be realistically placed within the aeroshell. As the CG moves forward or rearward, the required lateral CG eventually moves beyond the outer mold line of the orbiter, and thus is physically impossible.
Figure 10. Comparison of Modified Newtonian and LAURA Pressure Coefficient
Figure 11. Comparison of Modified Newtonian and
LAURA Aerodynamics
Figure 12. Static Margin vs. α
Figure 13. Trimlines as a Function of α
54
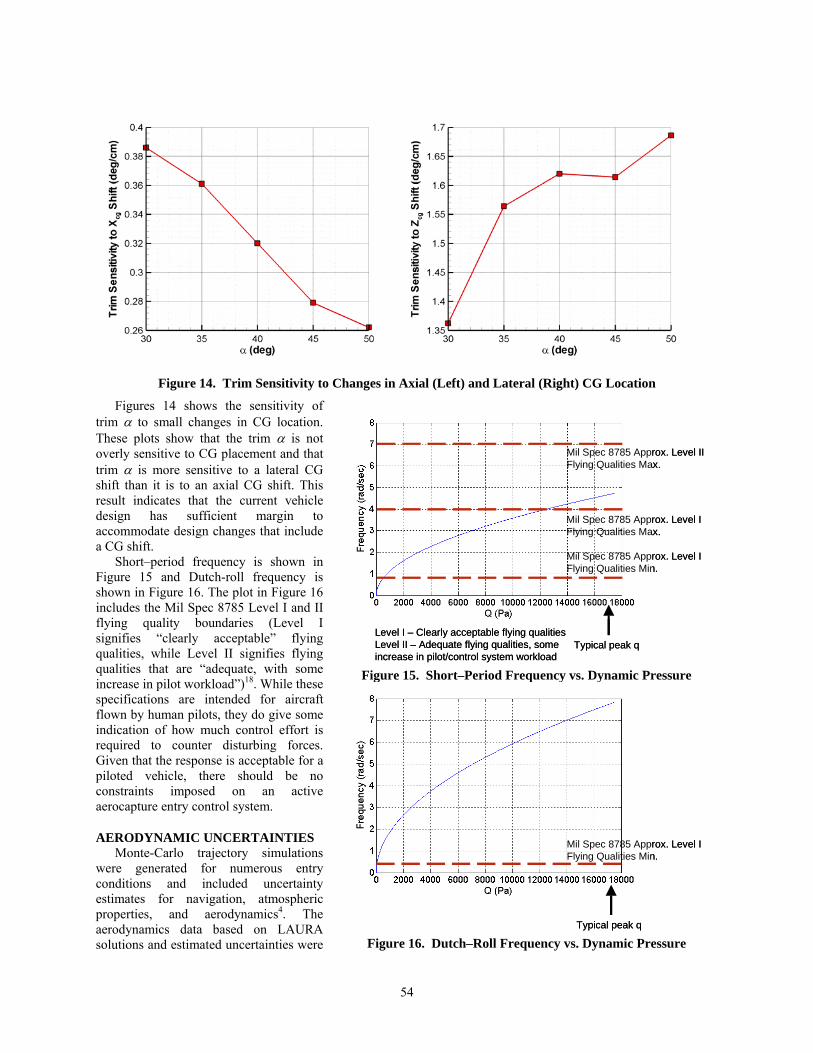
Figures 14 shows the sensitivity of trim α to small changes in CG location. These plots show that the trim α is not overly sensitive to CG placement and that trim α is more sensitive to a lateral CG shift than it is to an axial CG shift. This result indicates that the current vehicle design has sufficient margin to accommodate design changes that include a CG shift.
Short–period frequency is shown in Figure 15 and Dutch-roll frequency is shown in Figure 16. The plot in Figure 16 includes the Mil Spec 8785 Level I and II flying quality boundaries (Level I signifies “clearly acceptable” flying qualities, while Level II signifies flying qualities that are “adequate, with some increase in pilot workload”)18. While these specifications are intended for aircraft flown by human pilots, they do give some indication of how much control effort is required to counter disturbing forces. Given that the response is acceptable for a piloted vehicle, there should be no constraints imposed on an active aerocapture entry control system.
AERODYNAMIC UNCERTAINTIES Monte-Carlo trajectory simulations
were generated for numerous entry conditions and included uncertainty estimates for navigation, atmospheric properties, and aerodynamics4. The aerodynamics data based on LAURA solutions and estimated uncertainties were
Figure 14. Trim Sensitivity to Changes in Axial (Left) and Lateral (Right) CG Location
Typical peak q
Mil Spec 8785 Approx. Level I Flying Qualities Max.
Mil Spec 8785 Approx. Level I Flying Qualities Min.
Mil Spec 8785 Approx. Level II Flying Qualities Max.
Level I – Clearly acceptable flying qualitiesLevel II – Adequate flying qualities, some increase in pilot/control system workload
Figure 15. Short–Period Frequency vs. Dynamic Pressure
Mil Spec 8785 Approx. Level I Flying Qualities Min.
Typical peak q
Mil Spec 8785 Approx. Level I Flying Qualities Min.
Typical peak q Figure 16. Dutch–Roll Frequency vs. Dynamic Pressure
55
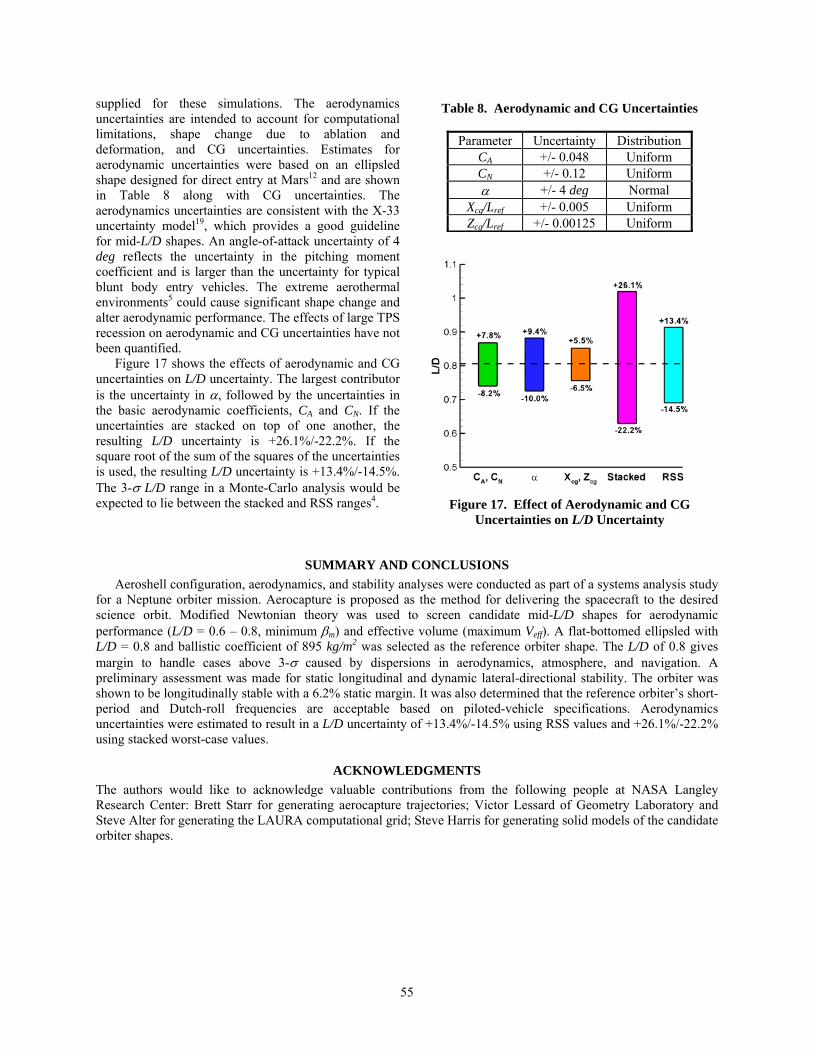
supplied for these simulations. The aerodynamics uncertainties are intended to account for computational limitations, shape change due to ablation and deformation, and CG uncertainties. Estimates for aerodynamic uncertainties were based on an ellipsled shape designed for direct entry at Mars12 and are shown in Table 8 along with CG uncertainties. The aerodynamics uncertainties are consistent with the X-33 uncertainty model19, which provides a good guideline for mid-L/D shapes. An angle-of-attack uncertainty of 4 deg reflects the uncertainty in the pitching moment coefficient and is larger than the uncertainty for typical blunt body entry vehicles. The extreme aerothermal environments5 could cause significant shape change and alter aerodynamic performance. The effects of large TPS recession on aerodynamic and CG uncertainties have not been quantified.
Figure 17 shows the effects of aerodynamic and CG uncertainties on L/D uncertainty. The largest contributor is the uncertainty in α, followed by the uncertainties in the basic aerodynamic coefficients, CA and CN. If the uncertainties are stacked on top of one another, the resulting L/D uncertainty is +26.1%/-22.2%. If the square root of the sum of the squares of the uncertainties is used, the resulting L/D uncertainty is +13.4%/-14.5%. The 3-σ L/D range in a Monte-Carlo analysis would be expected to lie between the stacked and RSS ranges4.
SUMMARY AND CONCLUSIONS Aeroshell configuration, aerodynamics, and stability analyses were conducted as part of a systems analysis study
for a Neptune orbiter mission. Aerocapture is proposed as the method for delivering the spacecraft to the desired science orbit. Modified Newtonian theory was used to screen candidate mid-L/D shapes for aerodynamic performance (L/D = 0.6 – 0.8, minimum βm) and effective volume (maximum Veff). A flat-bottomed ellipsled with L/D = 0.8 and ballistic coefficient of 895 kg/m2 was selected as the reference orbiter shape. The L/D of 0.8 gives margin to handle cases above 3-σ caused by dispersions in aerodynamics, atmosphere, and navigation. A preliminary assessment was made for static longitudinal and dynamic lateral-directional stability. The orbiter was shown to be longitudinally stable with a 6.2% static margin. It was also determined that the reference orbiter’s short-period and Dutch-roll frequencies are acceptable based on piloted-vehicle specifications. Aerodynamics uncertainties were estimated to result in a L/D uncertainty of +13.4%/-14.5% using RSS values and +26.1%/-22.2% using stacked worst-case values.
ACKNOWLEDGMENTS The authors would like to acknowledge valuable contributions from the following people at NASA Langley Research Center: Brett Starr for generating aerocapture trajectories; Victor Lessard of Geometry Laboratory and Steve Alter for generating the LAURA computational grid; Steve Harris for generating solid models of the candidate orbiter shapes.
Table 8. Aerodynamic and CG Uncertainties
Parameter Uncertainty Distribution CA +/- 0.048 Uniform CN +/- 0.12 Uniform α +/- 4 deg Normal
Xcg/Lref +/- 0.005 Uniform Zcg/Lref +/- 0.00125 Uniform
Figure 17. Effect of Aerodynamic and CG
Uncertainties on L/D Uncertainty
56
REFERENCES 1 Lockwood, M. K., “Neptune Aerocapture Mission Systems Analysis,” AIAA Paper 2004-4951, AIAA Atmospheric Flight
Mechanics Conference, Providence, RI, 16-19 Aug. 2004. 2 Justus, C. G., Duvall, A, and Keller, V. W. “Atmospheric Models for Aerocapture Systems Studies,” AIAA Paper 2004-
4952, AIAA Atmospheric Flight Mechanics Conference, Providence, RI, 16-19 Aug. 2004. 3 Masciarelli, J. P., Westhelle, C. H., and Graves, C. A., “An Aerocapture Guidance Algorithm for the Neptune Orbiter,”
AIAA Paper 2004-4954, AIAA Atmospheric Flight Mechanics Conference, Providence, RI, 16-19 Aug. 2004. 4 Starr, B. R., Powell, R. W., Westhelle, C. H., and Edquist, K. T., “Performance of a 0.8 L/D Aerocapture Simulation for a
Neptune-Triton Exploration Mission,” AIAA Paper 2004-4955, AIAA Atmospheric Flight Mechanics Conference, Providence, RI, 16-19 Aug. 2004.
5 Hollis, B. R., Takashima, N., Sutton, K., Wright, M., Olejniczak, J., and Prabhu, D., “Preliminary Convective-Radiative Heating Environments for a Neptune Aerocapture Mission,” AIAA Paper 2004-5177, AIAA Atmospheric Flight Mechanics Conference, Providence, RI, 16-19 Aug. 2004.
6 Laub, B., and Chen, Y.-K., “TPS Challenges for Neptune Aerocapture,” AIAA Paper 2004-5178, AIAA Atmospheric Flight Mechanics Conference, Providence, RI, 16-19 Aug. 2004.
7 Dyke, R. E., and Hrinda, G. A., “Structural Design for a Neptune Aerocapture Mission,” AIAA Paper 2004-5179, AIAA Atmospheric Flight Mechanics Conference, Providence, RI, 16-19 Aug. 2004.
8 Hanak, C. and Bishop, R. H., “Aerocapture Navigation Analysis at Titan and Neptune,” AIAA Paper 2004-5180, AIAA Atmospheric Flight Mechanics Conference, Providence, RI, 16-19 Aug. 2004.
9 Tang, W., Orlowski, M., Longo, J., and Giese, P., “Aerodynamic Optimization of Re-Entry Vehicles,” Aerospace Science and Technology, Vol. 5, Issue 1, pp. 15-25, Jan. 2001.
10 Wercinski, P. F., Chen, Y.-K., Loomis, M., Tauber, M., McDaniel, M., Wright, M., Papadopolous, P., Allen, G., and Yang, L., “Neptune Aerocapture Entry Vehicle Preliminary Design,” AIAA Paper 2002-4812, AIAA Atmospheric Flight Mechanics Conference, Monterey, CA, Aug. 2002.
11 Jits, R. Y., and Walberg, G.D., “High L/D Mars Aerocapture for 2001, 2003, and 2005 Mission Opportunities,” AIAA Paper 98-0299, AIAA Aerospace Sciences Meeting and Exhibit, Reno, NV, 12-15 Jan. 1998.
12 Lockwood, M. K., Sutton K., Prabhu, R. K., Powell, R. W., Graves, C. A., Epp, C., Carman, G. L., “Entry Configurations and Performance Comparisons for the Mars Smart Lander,” AIAA Paper 2002-4407, AIAA Atmospheric Flight Mechanics Conference and Exhibit, Monterey, CA, 5-8 August 2002.
13 Cheatwood, F. M., and Gnoffo, P. A., “User’s Manual for the Langley Aerothermodynamic Upwind Algorithm (LAURA),” NASA TM-4674, April 1996.
14 Papadopoulos, P., Prahbu, D., Olynick, D., Chen, Y. K., and Cheatwood, F. M., “CFD Code Validation and Comparisons for Mars Entry Simulations,” AIAA Paper 98-0272, Jan. 1998.
15 Hollis, B. R., Thompson, R. A., Murphy, K. J., Nowak, R. J., Riley, C. J., Wood, W. A., and Alter, S. J., “X-33 Aerodynamic Computations and Comparisons with Wind-Tunnel Data,” Journal of Spacecraft and Rockets, Vol. 38, No. 5, Sept.-Oct., 2001, pp. 684-691.
16 Peiro J., Peraire J., and Morgan K., “FELISA System Reference Manual and User’s Guide,” NASA CP-3291, May 1995. 17 Prabhu, R. K., "Inviscid Flow Computations of Several Aeroshell Configurations for '07 Mars Lander," NASA/CR-2001-
210851, April 2001. 18 Anonymous, “Military Specification: Flying Qualities of Piloted Airplanes”, MilSpec 8785C, Aug. 1969. 19 Cobleigh, B. R., “Development of the X-33 Aerodynamic Uncertainty Model,” NASA TP-1998-206544, April 1998.