CRM Design Note: Derating factors - Elia
34
CRM Design Note: Derating factors
-
Upload
khangminh22 -
Category
Documents
-
view
0 -
download
0
Transcript of CRM Design Note: Derating factors - Elia

CRM Design Note:
Derating factors

15/08/2019 Derating factors 2
Table of contents
0 Legal framework 6
1 Input scenario 8
2 Model simulation 11
3 Identification of near-scarcity hours 15
Choice of a criterion 15
Justification 15
4 Calculation of the derating factors 17
Thermal TSO-connected technologies 18
4.1.1 Concept 18
4.1.2 Categories 19
Weather dependent technologies 20
4.2.1 Concept 20
4.2.2 Categories 20
Energy-limited technologies 21
4.3.1 Concept 21
4.3.2 Categories 21
DSO-connected technologies 23
4.4.1 Concept 23
4.4.2 Categories 23
Synthesis 25
5 Interconnections 28
References 32
Annex 1: Correlation of climatic conditions 33
15/08/2019 Derating factors 3
ABOUT THE PUBLIC CONSULTATION
This design note is put for formal public consultation and any remark, comment or
suggestion is welcome. It builds further on the discussions and proposals already made
in the different TF CRM meetings gathering all relevant stakeholders and in the follow-
up committee, the latter consisting of representatives of the CREG and Elia, under the
presidency of the FPS Economy.
This public consultation runs in parallel with a public consultation on other design notes.
Reactions to this public consultation can be provided to Elia via the specific submission
form on Elia’s website no later than Wednesday 30 October 2019 at 6pm.
On 13 September 2019 a first set of design notes has already been launched by Elia for
public consultation1.
Note that, in line with their roles and responsibilities and the foreseen governance in the
Electricity Law, also the FPS Economy and the CREG will consult on aspects within their
competence according to their procedures.
1 https://www.elia.be/en/public-consultation/20190913_formal-public-consultation-on-the-crm-design-notes-part-i

15/08/2019 Derating factors 4
Introduction
This design note will serve as basis for Elia’s proposal regarding the methodology, as
referenced in Article 7undecies, §2 of the CRM Law2. In particular, the principles included
at the end of each chapter of this note, will serve as guidance for Elia when preparing its
proposal of methodology.
In accordance with Article 7undecies, §2 of the CRM Law, a yearly calibration for the
parameters will take place. At the end, a yearly Ministerial Decision is taken in order to
instruct the TSO to organize the auction and according to which parameters.
The purpose of this document is to present the methodology and the process that will be
followed to determine the derating factors associated with every capacity, hence
reflecting its expected contribution to adequacy. In addition, it will also provide the
maximum cross-border contribution per border. The multiplication of the associated
derating factor and the reference power upon prequalification results in the derated
capacity, i.e. the maximum capacity that could take part in the auction.
An overview of the whole process is illustrated on Figure 1.
Figure 1: Methodology overview
The first step of the methodology is to select an input scenario on which the derating
factors will be calculated. Such scenario must contain at least information about the
expected hourly consumption profiles, thermal generation facilities, RES capacities,
storage capacities, market response and cross-border market capacities between
considered countries. In addition associated weather profiles, energy limitations and
technology characteristics are also required.
The second step consists in performing a ‘Monte-Carlo’ probabilistic simulation to
dispatch the different facilities to meet the electricity demand following a cost
optimization approach. The output of the model will first provide all the data needed to
calibrate the input scenario installed capacities to comply with the legal adequacy
criteria, as referenced in Article 7undecies, §3 of the CRM Law. The model will also
provide dispatch indicators necessary to calculate the contribution of each technology,
like countries net position or the hourly generated energy per technology.
The third step consists of determining the near-scarcity hours. These hours represent
the time periods which are critical for the Belgian electricity adequacy.
2 http://www.ejustice.just.fgov.be/doc/rech_n.htm
Input scenarioModel
simulation
Near-scarcity hours
identification
Calculation of derating factors
Cross-border contribution

15/08/2019 Derating factors 5
Once this set of hours is known, the fourth step is to calculate model-based derating
factors for all technologies. A derating factor is calculated as the ratio between the
average contribution during near-scarcity hours (the contribution to security of supply)
and the reference power of every technology.
Following the same methodology, the maximum entry capacity for cross-border
participation for each border is calculated in the last step.
All these steps, and if applicable any other relevant input, will be provided for the
determination of the capacity to be procured.

15/08/2019 Derating factors 6
0 Legal framework
This design note is based on the CRM Law from 22nd of April 2019 that modifies the
Electricity Law of 29th April 1999 on the organization of the electricity market.
The main articles concerning the derating factors are the following:
22 April 2019
Wet tot wijziging van de wet
van 29 april 1999 betreffende de organisatie
van de elektriciteitsmarkt, teneinde
een capaciteitsvergoedingsmechanisme
in te stellen
22 avril 2019
Loi modifiant la loi
du 29 avril 1999 relative à l’organisation
du marché de l’électricité portant
la mise en place d’un mécanisme
de rémunération de capacité
Ch.2, Art 2, §78
“vraagcurve”: de curve die de variatie weergeeft van het
te contracteren capaciteitsvolume in functie van het
prijsniveau van de capaciteit
“courbe de demande”: la courbe représentant la variation
du volume de capacité à contracter en fonction du niveau
de prix de la capacité
Ch.2, Art 2, §83
“reductiefactor”: de wegingsfactor van een bepaalde
capaciteit, die diens bijdrage aan de
bevoorradingszekerheid bepaalt, teneinde het volume
vast te leggen dat in aanmerking komt om deel te nemen
aan de veiling
“facteur de réduction”: le facteur de pondération d’une
capacité considérée, déterminant sa contribution à la
sécurité d’approvisionnement afin de fixer le volume
éligible à participer à la mise aux enchères
Ch.2, Art 6, §2
Op basis van een methode die wordt vastgesteld door
de Koning, op voorstel van de netbeheerder, opgesteld
na raadpleging van de marktspelers en na advies van de
commissie, stelt de netbeheerder, na raadpleging van
de marktspelers over met name de basishypotheses, de
twee volgende verslagen op:
1° een eerste verslag […] dat de berekeningen bevat van
het noodzakelijke capaciteitsvolume en het aantal uren
tijdens dewelke deze capaciteit gebruikt zal worden ten
behoeve van de toereikendheid, met het oog op het
verzekeren van het vereiste niveau aan
bevoorradingszekerheid zoals bepaald in paragraaf 3,
voor de veilingen van één jaar en van vier jaar vóór de
periode van capaciteitslevering. Dit verslag omvat
eveneens een voorstel voor een minimaal te reserveren
volume voor de veiling die één jaar voor de periode van
capaciteitslevering plaatsvindt. Dit minimaal te
reserveren volume is minstens gelijk aan de capaciteit
die gemiddeld minder dan 200 draaiuren heeft per jaar
teneinde de totale piekcapaciteit af te dekken; en
2° een tweede verslag dat een voorstel bevat van
parameters, berekend op basis van het volume bedoeld
in het 1°, die noodzakelijk zijn voor de organisatie van
de veiling van vier jaar vóór de periode van
capaciteitslevering, met name de vraagcurve, de
prijslimiet(en), de referentieprijs, de uitoefenprijs en de
reductiefactoren. Dit verslag bevat eveneens de
noodzakelijke aanpassingen voor de veiling van één
jaar vóór de periode van capaciteitslevering.
Voorafgaand aan de opmaak van het verslag bedoeld in het
Sur la base d’une méthode fixée par le Roi, sur
proposition du gestionnaire du réseau, formulée après
consultation des acteurs du marché et après avis de la
commission, le gestionnaire du réseau établit, après
consultation des acteurs du marché notamment sur les
hypothèses de base, les deux rapports suivants:
1° un premier rapport contenant un calcul du volume de
capacité nécessaire et du nombre d’heures pendant
lesquelles cette capacité sera utilisée à des fins
d’adéquation, en vue d’assurer le niveau de sécurité
d’approvisionnement requis conformément au
paragraphe 3, pour les mises aux enchères quatre ans et
un an avant la période de fourniture de capacité. Ce
rapport contient également une proposition de volume
minimal à réserver pour la mise aux enchères se
déroulant un an avant la période de fourniture de
capacité. Ce volume minimal à réserver est au moins égal
à la capacité nécessaire, en moyenne, pour couvrir la
capacité de pointe totale pendant moins de 200 heures
de fonctionnement par an; et
2° un second rapport contenant une proposition des
paramètres, calculés sur la base du volume visé au 1°,
nécessaires à l’organisation de la mise aux enchères
quatre ans avant la période de fourniture de capacité,
notamment, la courbe de demande, le ou les plafond(s)
de prix, le prix de référence, le prix d’exercice et les
facteurs de réduction. Ce rapport contient également les
ajustements nécessaires pour la mise aux enchères un
an avant la période de fourniture de capacité.
Préalablement à l’établissement du rapport visé à

15/08/2019 Derating factors 7
eerste lid, 1°, stelt de Algemene Directie Energie alle
informatie die nuttig is voor die analyse en waarover het
beschikt, ter beschikking van de netbeheerder.
Uiterlijk op 15 december van elk jaar worden de in het eerste
lid bedoelde verslagen voor advies bezorgd aan de
commissie en aan de Algemene Directie Energie.
De Algemene Directie Energie en de commissie maken
uiterlijk op 15 februari hun respectieve adviezen met
betrekking tot deze verslagen over aan de minister.
Uiterlijk op 31 maart van elk jaar, op basis van de verslagen
en de adviezen bedoeld in het eerste en het vierde lid, met
het oog op het verzekeren van het vereiste niveau aan
bevoorradingszekerheid zoals bepaald in paragraaf 3, na
overleg in de Ministerraad, geeft de minister instructie aan
de netbeheerder om de veilingen te organiseren voor de
onderzochte perioden van capaciteitslevering, stelt de
parameters vast die nodig zijn voor hun organisatie en
bepaalt het minimaal te reserveren volume voor de veiling
die één jaar voor de periode van capaciteitslevering
georganiseerd wordt. Dit minimaal te reserveren volume is
minstens gelijk aan de capaciteit die gemiddeld minder dan
200 draaiuren heeft per jaar teneinde de totale
piekcapaciteit af te dekken, vermeerderd met de
onzekerheidsmarge vervat in de initiële volumeberekening
uitgevoerd door de netbeheerder in het verslag bedoeld in
het eerste lid, 1°.
l’alinéa 1er, 1°, la Direction générale de l’Énergie met à
disposition du gestionnaire du réseau toute information
utile pour cette analyse et dont elle dispose.
Au plus tard le 15 décembre de chaque année, les
rapports visés à l’alinéa 1er sont transmis pour avis à la
commission et à la Direction générale de l’Energie.
La Direction générale de l’Énergie et la commission
transmettent leurs avis respectifs relatifs à ces rapports
au ministre au plus tard le 15 février.
Au plus tard le 31 mars de chaque année, sur la base des
rapports et des avis visés aux alinéas 1er et 4, afin
d’assurer le niveau de sécurité d’approvisionnement
requis conformément au paragraphe 3, après
concertation en Conseil des ministres, le ministre donne
instruction au gestionnaire du réseau d’organiser les
mises aux enchères pour les périodes de fourniture de
capacité considérées, fixe les paramètres nécessaires à
leur organisation et détermine le volume minimal à
réserver pour la mise aux enchères organisée un an avant
la période de fourniture de capacité. Ce volume minimal
à réserver est au moins égal à la capacité nécessaire, en
moyenne, pour couvrir la capacité de pointe totale
pendant moins de 200 heures de fonctionnement par an,
augmentée de la marge d’incertitude prévue dans le
calcul du volume initial effectué par le gestionnaire du
réseau dans le rapport visé au 1° de l’alinéa 1er.
Ch.2, Art 6, §3
Het te bereiken niveau van bevoorradingszekerheid dat
wordt vooropgesteld voor het
capaciteitsvergoedingsmechanisme, komt overeen met
de vraagcurve, die gekalibreerd wordt met als
referentie:
1° desgevallend, de geharmoniseerde normen
vastgesteld door de in deze aangelegenheid bevoegde
Europese instellingen;
2° bij het ontbreken van geharmoniseerde normen op
Europees niveau, desgevallend de geharmoniseerde
normen vastgesteld op regionaal niveau, inzonderheid
op het niveau van de Centraal-West-Europese
elektriciteitsmarkt;
3° bij het ontbreken van zulke normen, een berekening
van een LOLE van minder dan 3 uur en van een LOLE95
van minder dan 20 uur.
Le niveau de sécurité d’approvisionnement à atteindre
visé par le mécanisme de rémunération de capacité
correspond à la courbe de demande calibrée avec
comme référence:
1° le cas échéant, des normes harmonisées établies par
les institutions européennes compétentes en la matière;
2° en l’absence de normes harmonisées au niveau
européen, les normes harmonisées fixées le cas échéant
au niveau régional, en particulier au niveau du marché de
l’électricité du Centre Ouest de l’Europe;
3° en l’absence de telles normes, un calcul de LOLE
inférieur à 3 heures et de LOLE95 inférieur à 20 heures.
Disclaimer:
The above-mentioned legal framework is subject to evolution, in particular to align it with
the European ‘Clean Energy Package-legislation’. This could impact the process of the
determination of the reliability standard for Belgium and the competences in the volume
determination process. This design note already anticipates the possible future changes,
to the best of knowledge of Elia, following discussion in a working group consisting of
representatives of CREG, FPS Economy and Elia.
15/08/2019 Derating factors 8
1 Input scenario
The derating factors shall always be calculated based on a given input scenario. To
develop a coherent scenario, some information must be provided regarding on the one
hand the national consumption and on the other hand the different capacity sources and
their characteristics (volume, energy limitations…). These data should be available for
Belgium but also for at least the electrically directly connected market zones included in
the simulation perimeter. Moreover, the interconnection capacity between the different
considered market zones must also be determined.
An example of input scenario to calculate the derating factors for Belgium could be the
latest available ‘central scenario’ from the European Resource Adequacy Assessment
(ERAA) defined at ENTSO-E level.
The input parameters that are required to determine derating factors are [I]:
- The consumption (growth) and hourly normalized consumption profiles;
- The installed capacity of thermal generation facilities with their associated
availability parameters for per-unit modeled generators and hourly generation
profiles for distributed thermal capacities;
- The installed solar, wind and hydroelectric capacity;
- The installed storage facilities with their associated efficiency and reservoir
constraints;
- The installed demand flexibility/market response capacity with their associated
energy or activation limits;
- The interconnection capacity between market zones (e.g. ‘flow-based’ domains,
‘NTC’ capacities).
To correctly calibrate the derating factors and given that the CRM is designed to procure
the needed capacity to be adequate, the input scenario has to be made adequate
following the adequacy criteria defined for Belgium (cf. section on model simulation). It
means that the defined reliability standard has to be respected, as referenced in Article
7undecies, §3 of the CRM Law.
Input scenarioModel
simulation
Near-scarcity hours
identification
Calculation of derating factors
Cross-border contribution

15/08/2019 Derating factors 9
Example: Case study from the Adequacy & Flexibility study [I]
Throughout this note, an example is used to illustrate the different concepts and the
process to be followed when calculating derating factors.
For this example a scenario is used from the latest 10 year Adequacy & Flexibility study
[I]. The input scenario used is the ‘CENTRAL/EU-BASE’ scenario for 2025, which also
takes into account the ‘flow-based’ model implemented for CWE countries (including the
CEP min 70% rule) and the adequacy patch.
The main assumptions for Belgium of this example scenario are summarized on Figure
2.
Figure 2: Assumptions for Belgium for the illustrational example [I]

15/08/2019 Derating factors 10
1. The Minister shall determine on an annual basis and no later than 31 March of
every year, the derating factors and cross-border entry capacity for every auction
on the basis of a scenario.
2. The scenario shall include input parameters on consumption, supply and
interconnection capacity for Belgium and at least electrically connected market
zone.
Main principles which serve as input for the Royal Decree proposal

15/08/2019 Derating factors 11
2 Model simulation
Once the input scenario has been defined, a ‘Monte-Carlo’ simulation is performed with
a unit commitment tool for the given year. The purpose of this tool is to optimally dispatch
the different technologies on the market to meet the hourly consumption for each
considered market zone. The simulation methodology that will be applied shall be in line
with the relevant sections of the ‘European Resource Adequacy Assessment’
methodology, provided that such an approved methodology exists at the time of
performing the calculations. The simulation shall apply the requirements described in
this methodology, insofar they are implemented in the most recently published ENTSO-
E ERAA report at the time of performing the calculations on derating factors. For the
latter, the most recently published ‘ENTSO-E Mid-Term Adequacy Forecast’ report at
the time of performing the calculations on derating factors is used as a benchmark.
A ‘Monte-Carlo’ method is used to perform simulation of the electricity market. This
requires the construction of a large number of future states (called ‘Monte-Carlo’ years).
The different variables which are needed to perform the simulations can be subdivided
into two categories: weather variables and the availability of generation or
interconnection facilities (more information can be found in Annex 1: Correlation of
climatic conditions).
First, periodic values for wind energy generation, solar generation, hydro inflows and
temperature-dependent electricity consumption are mutually correlated. These climatic
variables are modelled on the basis of a representative number of historical years. The
forecasts of installed capacity for each simulated market zone are combined with this
historical data to obtain production time series for onshore wind, offshore wind,
photovoltaic production and hydroelectric ‘run-of-river’ production. The temperatures of
the historical years have an impact on the electricity consumption.
Second, parameters related to the availability of thermal generation or HDVC links (in a
non-meshed grid) are assumed to be independent from climatic data and therefore not
correlated to the others. Thermal generation can be subdivided in two categories. On the
one hand, large thermal generation units, independent of their generation types, are
modelled individually, with their specific technical characteristics. Their individual
availability is determined by a probabilistic draw for each 'Monte Carlo' year based on
historical availability rates. This way, a sequence of availabilities can be drawn for each
unit to be used in the simulations. On the other hand, small thermal generation units are
modelled in an aggregated way by using a fixed generation profile based on historical
metering data. The availability of these smaller units is directly taken into account in the
generation profile, and is therefore the same for all ‘Monte Carlo’ years.
The generation output of climate independent technologies is optimized by the simulator.
Input scenarioModel
simulation
Near-scarcity hours
identification
Calculation of derating factors
Cross-border contribution

15/08/2019 Derating factors 12
This category also contains flexible technologies such as storage or market response.
Storage capacity is economically optimized, storing electricity in some form when prices
are low and releasing electricity when those are higher. Market response is also
introduced in the model with a certain number of constraints. The model optimizes their
dispatch, taking their specific characteristics and limitations into account.
The above variables are combined into a number of ‘Monte-Carlo’ years so that the
correlation between the various renewable energy sources (wind, solar, hydroelectric)
and the temperature remains intact. Both geographical and time correlations are present.
Consequently, the climatic data relating to a given variable for a specific year shall
always be combined with data from the same climatic year for all other variables, with
this applying to all market zones involved. In contrast, for power plant and HVDC link
availability, random samples are taken by the model, by considering the parameters of
probability and length of unavailability (in accordance with the 'Monte Carlo' method).
Availability thus differs for each future state. Since each 'Monte Carlo' year carries the
same weight in the assessment, the different availability samples have equal probability
of occurrence.
Based on the defined inputs and parameters, the optimization problems are solved with
an hourly time step and a weekly timeframe, making the assumption of perfect
information at this weekly time horizon but assuming that the evolution of load and RES
is not known beyond this weekly horizon. Fifty-two weekly optimization problems are
therefore solved in a row for each ‘Monte-Carlo’ year. The simulation ends when it
reaches a convergence criterion by combining the results of all these future states.
The optimal dispatch, minimizing overall ENS, is based on market bids reflecting the
marginal costs of each unit (be it generation, storage or demand/market response)
[€/MWh]. When this optimum is found, the following output can be analysed in order to
derive the derating factors and cross border contribution:
- Hourly dispatch by technology (generation, storage or demand/market
response);
- Hourly net position for all market zones within the ‘flow-based’ zone (only Belgium
and electrically directly connected market zones data will be used);
- Hourly cross border exchanges on links modelled with ‘net transfer capacities’
(links between market zones inside the ‘flow-based’ zone and outside of this
zone).
Following the simulations, the output data provided by the model enables a large range
of indicators to be determined. In the framework of this design note, the main parameters
of interest will be dispatch indicators:
- market exchanges between market zones;
- generated energy per fuel/technology.
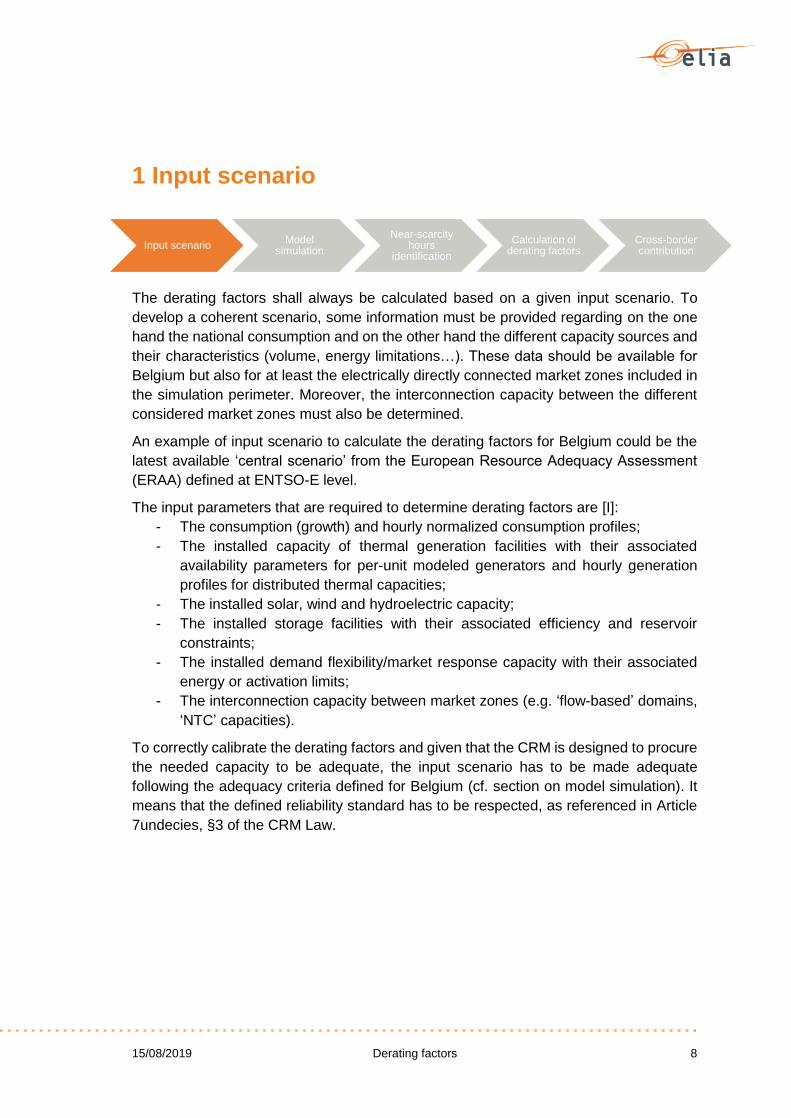
Figure 3 summarizes the global process.
15/08/2019 Derating factors 13
Figure 3: Hourly electricity market model [I]
The hourly generated energy per technology and the hourly imports/exports are
furthermore required to calculate the derating factors and the maximum entry capacity
for cross-border participation for each border.
As mentioned before, the applicable adequacy criteria of Article 7undecies, §3 of the
CRM Law needs to respected. If the input scenario already complies with the criterion,
then it is assumed to be adequate and the analysis can continue. In contrast, if the
criterion is not reached, a virtual capacity (100% available capacity) will be added, or
vice-versa, if the scenario is ‘over-adequate’, a volume of assumed new capacity will be
removed to the point where any additional removal would lead to a non-compliance with
the criteria.

15/08/2019 Derating factors 14
3. Elia shall perform a simulation of the electricity market. The simulation shall be
based on the relevant sections as determined by the TSO of the European
Resource Adequacy Assessment methodology referenced in Article 23 of
Regulation (EU) 2019/943, provided such methodology has been adopted at the
time of the simulation. The simulation shall apply the requirements described in
this methodology, insofar they are implemented in the most recently published
ENTSO-E ERAA report at the time of performing the calculations on derating
factors.
4. The simulation shall provide the hourly dispatch per technology and net positions
of Belgium and at least electrically connected market zone.
5. In case the simulation demonstrates that the scenario does not comply with the
applicable adequacy criteria for Belgium, the Belgian installed capacity in the
scenario shall be recalibrated as follows:
i. if one or more of the applicable adequacy criteria of Article 7undecies, §3 of
the CRM Law are not reached, an additional virtual capacity shall be added
until the criteria is reached;
ii. if one or more of the applicable adequacy criteria of Article 7undecies, §3 of
the CRM Law are exceeded, a volume of assumed new capacity shall be
removed to the point where any additional removal would lead to a non-
compliance with the criteria.
Main principles which serve as input for the Royal Decree proposal

15/08/2019 Derating factors 15
3 Identification of near-scarcity hours
The purpose of this step is to select from the simulation output the critical hours for the
Belgian adequacy. These hours correspond to situations where the sum of the available
capacity on the market and the imports from electrically directly connected market zones
is insufficient to meet the domestic consumption or close to the limit.
In the remainder of this note, the term ‘near-scarcity hours’ refers to both those hours
with ENS (scarcity) and those hours that are close to a situation of scarcity (near-
scarcity). Near-scarcity refers to situations where any additional increase of the load will
lead to energy not served.
Choice of a criterion
The criterion used for the determination of the near-scarcity hours is a situation where
any additional load in Belgium would not be served and would therefore lead to ENS.
This criterion leads to an identification of hours where a scarcity situation with ENS
exists, as well as hours with a near-scarcity situation where no margin is left.
Justification
The consideration of near-scarcity hours while calculating the derating factors is deemed
necessary as relying only on the hours with ENS would not take into account situations
where the system is close to its limits. As these situations are also critical for the
adequacy of Belgium, the contribution of each technology to system adequacy should
also account for such near-scarcity hours.
Basing the criterion on a given threshold (in [€]) for the marginal price introduces the
difficulty of fixing this threshold value. It is very difficult to objectively select such a
threshold, also given that simulated prices will depend on assumptions taken in the
scenario regarding generation mix in Belgium and abroad, economic parameters, etc.
Therefore, an approach is proposed where the identification of near-scarcity situations
is based on the appearance of ENS when for the given hour any additional consumption
would be introduced in Belgium. This approach does not require setting a specific
threshold value on simulated prices while allowing to capture the critical time periods
from different ‘Monte-Carlo’ years.
Input scenarioModel
simulation
Near-scarcity hours
identification
Calculation of derating factors
Cross-border contribution

15/08/2019 Derating factors 16
6. Near-scarcity hours shall mean hours in which there is simulated Energy Not
Served and in which no more margin is left in Belgium, meaning that any additional
load would not be served.
Main principles which serve as input for the Royal Decree proposal

15/08/2019 Derating factors 17
4 Calculation of derating factors
The purpose of derating factors is to evaluate the contribution of different technologies
(generation/demand flexibility/storage facilities) to the Belgian adequacy for a particular
input scenario. In the framework of the CRM, this contribution is evaluated in situations
where Belgium is facing near-scarcity, as defined in §3. In such situations, the total
generation combined with imports are insufficient to cover either the actual load (scarcity)
or any additional load (near-scarcity).
The derating factors are technology specific and expressed as the percentage of the
reference power that contributes to adequacy. It represents the fact that technologies
are not assumed to be available to generate 100% of the time at 100% of their reference
power during near-scarcity hours, due to breakdowns, maintenance cycles, economical
constraints, technical constraints or weather conditions. In order to determine the
contribution to adequacy of each unit, the capacity within each technology category is
derated.
In the framework of the CRM, 4 main categories of contribution to adequacy are
considered (Figure 4). The different technologies taken into account for the derating
factors are divided into these 4 categories. They are based on the currently available
technologies and could evolve in the future. The maximum entry capacity for cross-
border participation for each border forms a particular case since their contribution is
expressed in [MW] rather than in [%]. Cross-border contribution is therefore not
represented in this figure and is presented in chapter 5.
Figure 4: Derating factors categories
Input scenarioModel
simulation
Near-scarcity hours
identification
Calculation of derating factors
Cross-border contribution

15/08/2019 Derating factors 18
Thermal TSO-connected technologies
4.1.1 Concept
The first category takes into consideration technologies that contribute to adequacy
independently from the weather conditions and without energy limitations. In the
framework of the CRM, this category mostly refers to thermal units.
Thermal units consist in fossil fuel generation including TSO-connected combined heat
and power (CHP), biomass and waste units, CCGT and OCGT. Turbojets, gas engines
or diesel generators are also considered in this category. The main parameters
impacting these units are their planned and unplanned unavailabilities (Figure 5). On the
one hand, for planned outages, it is assumed that no maintenance is applied during
winter months (or more specifically when near-scarcity situations occur). Therefore,
planned outages will have no impact on the derating factors since no planned outage
are assumed during near-scarcity periods. On the other hand, forced outage events are,
within the probabilistic approach, assumed independent from the specific climate
conditions occurring within the set of near-scarcity hours identified.
Figure 5: Thermal units’ parameters
For the thermal generation, the assumed yearly average forced-outage rates (FORs) are
provided as input to the model (combined with an average duration of such FORs). Given
their independence from climatic variables and that these technologies are not
constrained by activation limitations, the model-based approach will lead to the result
that the average contribution of each thermal technology during the near-scarcity hours
is equal to its reference power reduced by the given FOR percentage. The associated
derating factors of these technologies can therefore simple be inferred from the input
parameters provided to the model (i.e. historical FO data).
The thermal derating factors are thus computed from forced outage rates through the
following formula:
DRF [%] = Average contribution during near − scarcity hours [MW]
Reference power [MW]
which is equivalent to:
[1] DRF [%] = 100 [%] - Forced Outage Rate [%]
Forced outage rate
Assumption:
Independent from climatic conditions
Derating factors linked to FOR
Planned outage rate
Assumption:
Not scheduled during winter months
No impact on Belgian adequacy
15/08/2019 Derating factors 19
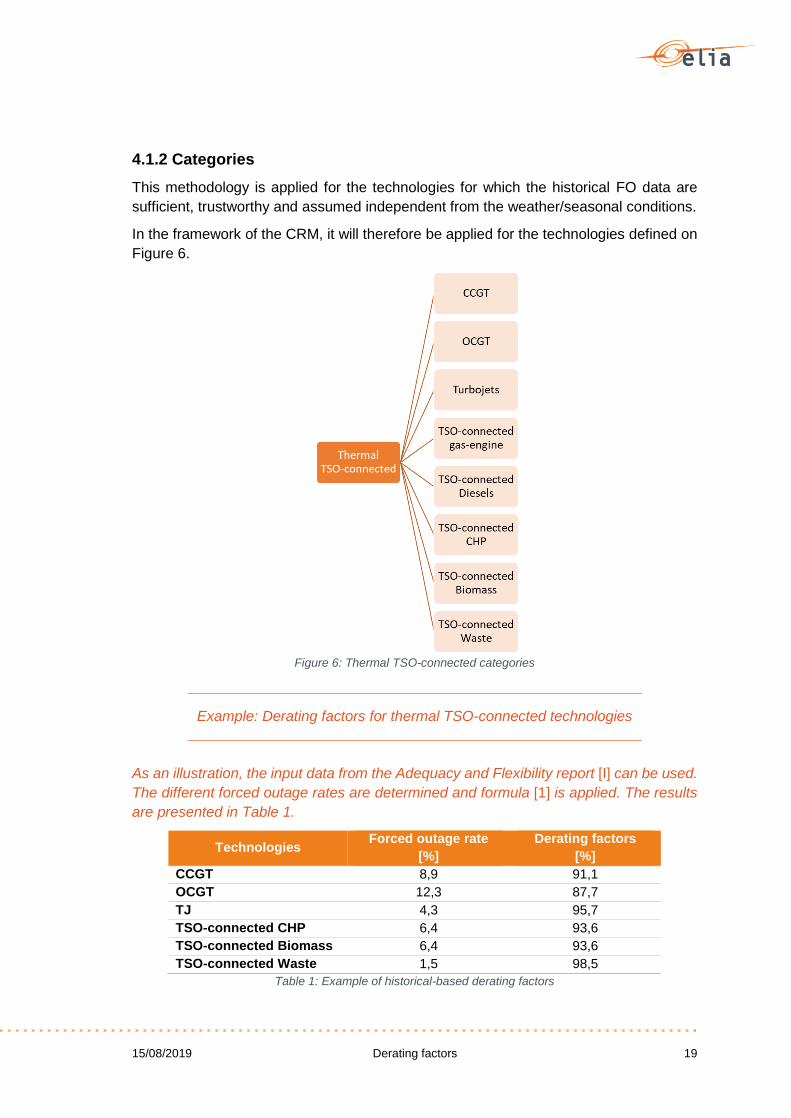
4.1.2 Categories
This methodology is applied for the technologies for which the historical FO data are
sufficient, trustworthy and assumed independent from the weather/seasonal conditions.
In the framework of the CRM, it will therefore be applied for the technologies defined on
Figure 6.
Figure 6: Thermal TSO-connected categories
Example: Derating factors for thermal TSO-connected technologies
As an illustration, the input data from the Adequacy and Flexibility report [I] can be used.
The different forced outage rates are determined and formula [1] is applied. The results
are presented in Table 1.
Technologies Forced outage rate
[%]
Derating factors
[%]
CCGT 8,9 91,1
OCGT 12,3 87,7
TJ 4,3 95,7
TSO-connected CHP 6,4 93,6
TSO-connected Biomass 6,4 93,6
TSO-connected Waste 1,5 98,5
Table 1: Example of historical-based derating factors

15/08/2019 Derating factors 20
Weather dependent technologies
4.2.1 Concept
For weather dependent technologies, the derating factors are calculated after analysis
of the results of the model-based approach (Figure 7). Their contribution cannot be easily
inferred from the input provided to the model. In this case, the contribution comes from
the output of an associated ‘Monte-Carlo’ simulation including all technologies as input
data. In the context of the CRM, the derating factors for these technologies are calculated
on their contribution (from the simulation output) on near-scarcity hours, as defined in
§3.
Figure 7: Derating factors calculation – required data
The derating factors are determined by dividing the average contribution of a particular
technology during near-scarcity hours by its reference power.
The derating factors for weather independent technologies are computed through the
following formula:
[2] DRF [%] = Average contribution during near−scarcity hours [MW]
Reference power [MW]
4.2.2 Categories
In the framework of the CRM, this approach shall be applied for the technologies
presented on Figure 8.
Figure 8: Weather dependent technologies categories
Derating factors
calculation
Simulation output on an
input scenario
Near-scarcity hours criteria

15/08/2019 Derating factors 21
Energy-limited technologies
4.3.1 Concept
For energy-limited technologies, the derating factors are calculated by applying the same
approach as for weather dependent technologies. Their derating factors are determined
by dividing the average contribution of a particular technology during near-scarcity hours
by its total reference power [2].
4.3.2 Categories
In the framework of the CRM, this approach shall be applied for categories defined on
Figure 9.
Figure 9: Energy-limited technologies categories
For flexible technologies (pumped-storage plants (PSP), market response, batteries or
any other storage technology), the model optimizes their use so that they can maximally
contribute to adequacy in near-scarcity hours when the price is the highest (and as such
lead to the lowest overall ENS). Flexible sources are cost-optimized so that the
pumping/loading cost is lower than the turbining/unloading revenue. Therefore, the
optimization considers that pumping/loading can be interesting because there is a
possibility to turbine/unload later at a higher price.
The contribution of market response and storage with high round trip efficiency (above
90%) subject to activation or reservoir constraints can be considered as equal as long
as their availability duration is similar.
From the latest ‘10 year adequacy and flexibility study’ performed by Elia [I], it can be
shown that both a Market Response (MR) and a battery category with the same duration
constraint have the same energy-constrained derating factor. Any aggregation of x% of
MR and y% of battery (x% MR + y% battery) will qualify in principle under the same
aggregation category.
A list of ‘SLA categories’ is therefore defined. Categories can be composed of any mix
of MR (= DSR + generation +…), batteries or any other storage technology subject to
similar activation constraints. For each ’aggregation category’ a given activation limit is

15/08/2019 Derating factors 22
defined (Table 2). The derating factors for ‘aggregation categories’ can be therefore
presented as so-called different ‘service level agreements’ (SLAs) based on hourly
activation constraints (as most constraining limits). Moreover, every aggregation
category is assumed to be available once a day.
In order for the aggregator or individual demand/market response provider to select the
SLA category that best fits its portfolio/profile, the choice of SLA is left open and left to
the aggregator/individual demand/market response provider.
‘SLA category’ Duration Limits
SLA #1 1h
1 activation / day
SLA #2 2h
SLA #3 3h SLA #4 4h SLA #5 8h SLA #6 No Limit NA
Table 2: MR categories
The derating factors associated with each aggregation category is to be considered as
a maximum threshold. Its value is associated with the contribution of the SLA category
to the Belgian adequacy. Furthermore, it is up to the aggregator to define the level of the
reference power of each aggregated CMU, according to the principles set up in the
prequalification and availability monitoring parts of the design.
Pumped-storage cannot be associated to a SLA category, even if both energy-limited
technologies can be in principle activated with the same duration3 because the derating
factors are different. This is explained by two main parameters:
- a pumping/turbining efficiency ratio of around 75% (value for Coo power plant in
Belgium);
- a forced outage rate in the same logic as for thermal units.
These parameters lead to the definition of a specific derating factor for pumped-storage
units.
3 For PSP, the duration of activation is linked to the size of the reservoir and to the turbining capacity.

15/08/2019 Derating factors 23
DSO-connected technologies
4.4.1 Concept
For DSO-connected units, available historical metering datasets are used as input in the
simulation. Due to a lack of information4, it is not feasible to model the exact behaviour
of such units. One of the main characteristics of these technologies is that their
generation is not always linked to the electricity price only because it has frequently other
purposes as well (e.g. the production of heat or steam). Nevertheless, it is assumed that
these units will maximize their electricity generation in case of high electricity prices. The
derating factors are consequently obtained by dividing the maximum contribution of a
particular technology during near-scarcity hours by its total installed capacity.
Since it is assumed that those units are able to maximally produce electricity in case of
high electricity prices, their derating factors shall be computed by taking the maximum
contribution of the technology during near-scarcity hours from the simulation output
through the following formula:
[3] DRF [%] = Maximum contribution during near−scarcity hours [MW]
Total installed capacity [MW]
Nevertheless, if relevant and sufficient metering data are available in the future, the
calculation of derating factors for DSO-connected units could evolve to be closer to
reality. These derating factors will then be determined by the ratio of their average
contribution during near-scarcity hours to the reference power [2].
4.4.2 Categories
For the DSO-connected units, a detailed analysis has been performed to compare the
contribution to adequacy of different categories. On the one hand, the units can be
divided by fuel type:
waste,
biomass, and
gas-fired.
From applying the first categorization it could be concluded that the data for waste were
not representative due to a too small number of units in this category.
4 E.g. all DSO-connected are not metered, the TSO does not have access to the metering data … Only relevant available metering are used but it only represent a part of the capacity.

15/08/2019 Derating factors 24
On the other hand, they can be divided by the contract type that has been awarded:
Gtrad5
Gflex6
Gint7
When applying the second categorization, most units have a Gtrad contract. The number
of units with Gflex and Gint contracts is not large enough and the available data are not
sufficient to be representative8.
Therefore, two main categories of derating factors have been taken into account for
DSO-connected technologies (that are not weather dependent): RES and non-RES
(Figure 10). These categories could be subject to evolution in case of additional available
information or data in the future.
Figure 10: DSO-connected technologies categories
5 Possibility to produce without any grid constraint. 6 Possibility to produce subject to grid constraints. In case of planned or unplanned constraints on the grid, there can be a necessity to reduce the production. 7 Interruptible production. The unit is connected through only one grid element to the transmission system (non-redundant connection). An interruptible unit can have either a Flex or a Trad contract. 8 TSO-connected also have that kind of contract but the categorization does not apply since derating factors are determined based on forced outage rates.

15/08/2019 Derating factors 25
Synthesis
Table 3 presents a synthesis of each category of derating factors and the formula used
to determine those. Every technology taking part to the CRM has to be classified into
one of these categories and the appropriate derating factor shall be applied to its
reference power. These categories are based on the current available technologies and
could evolve in the future.
Categories Formulation Sub-category Technology SLA
Duration
Weather-
dependent
technologies
Average contribution
during near-scarcity
/
Maximum capacity
[%]
RES
Onshore wind /
Offshore wind /
Solar /
Run-of-River /
Energy-
limited
technologies
Market
Response
Aggregation
(MR + small-scale
storage)
1h
2h
3h
4h
8h
No Limit
Large-scale
storage PSP /
DSO-
connected
technologies
Maximum
contribution during
near-scarcity
/
Maximum capacity
[%]
RES DSO-connected
RES /
Thermal DSO-connected
non-RES /
Thermal
TSO-
connected
technologies
100 - Forced
Outage Rate
[%]
/
CCGT /
OCGT /
TJ /
TSO-connected
gas-engines /
TSO-connected
Diesels /
TSO-connected
CHP /
TSO-connected
Biomass /
TSO-connected
Waste /
Table 3: Synthesis of derating factors categories

15/08/2019 Derating factors 26
Example: Derating factors calculation
The Adequacy and Flexibility study [I] presents (Figure 11) some global results of
derating factors that would be obtained by applying the explained methodology to each
technology (note that the derating factors depend on the scenario applied, and will
therefore vary depending on the chosen scenario).
Figure 11: Results from the Adequacy and Flexibility report [I]

15/08/2019 Derating factors 27
7. For the purpose of calculating the derating factor applicable to each technology,
the different technologies shall be divided into 4 different categories as follows:
i. The category of thermal TSO-connected technologies shall comprise
”CCGT”, ”OCGT”, ”Turbojets”, “TSO-connected gas-engine”, ”TSO-
connected Diesels”, ”TSO-connected CHP”, “TSO-connected Biomass”
and “TSO-connected Waste”.
ii. The category of weather-dependent technologies shall comprise “Onshore
wind”, “Offshore wind”, “Solar” and “Run-of-river hydro”.
iii. The category of energy-limited technologies shall comprise “Market
Response”, including at least aggregation of demand side response, all
type of small-scale storage technologies and emergency generators, and
“Pumped-Storage plants”.
iv. The category of DSO-connected technologies shall comprise “renewable
energy sources”, including at least biomass CHP, biomass and waste, and
“non-renewable energy sources”, including at least gas-fired CHP.
8. Derating factors for thermal TSO-connected units shall be calculated by
subtracting the forced outage rate, based on historical data, and expressed in [%],
from 100 [%].
9. Derating factors for weather dependent technologies shall be calculated by
dividing their average contribution during near-scarcity hours from the simulation
output by the relevant technology’s reference power.
10. Derating factors for energy-limited technologies shall be calculated by dividing
their average contribution during near-scarcity hours from the simulation output by
the relevant technology’s reference power, it being understood that, for “Market
Response” the input data for the simulation shall first be divided into aggregation
categories, represented by different “service levels” (SLAs), on the basis of hourly
activation constraints or any other relevant technical constraint, as shall be
proposed by the TSO in the yearly parameter report prior to the auction.
11. Derating factors for DSO-connected technologies shall be calculated based on
available metering data. Derating factors for DSO-connected units shall be
determined by the ratio of their average contribution during near-scarcity hours
from the simulation output to the reference power. If insufficient relevant metering
data are available as determined by the TSO, these derating factors shall be
determined by the ratio of the technologies’ maximal contribution during near-
scarcity hours from the simulation output to the reference power.
Main principles which serve as input for the Royal Decree proposal

15/08/2019 Derating factors 28
5 Cross-border contribution
Belgium is very dependent on imports to ensure its adequacy. Additionally, when scarcity
situations occur in Belgium, they are mostly linked to scarcity in at least one electrically
directly connected market zone. In the future, this interaction of scarcity situations
between countries will further increase (see [I], Figure 4-12).
The contribution of interconnections is based on the simulation output. A post-processing
methodology is implemented to determine the maximum entry capacity for cross-border
participation in the context of adequacy, as the most relevant parameter for estimating
the contribution to adequacy via interconnections with electrically directly connected
market zones is the amount of energy that can be imported rather than the available
interconnection capacity. Therefore, the contribution of other market zones to the Belgian
adequacy shall be expressed in [MW].
The net position of Belgium during near-scarcity hours will be determined and the
capability of electrically directly connected market zones (France, Germany 9 ,
Netherlands and United Kingdom)10 to export energy during those moments will be used
to determine the average contribution of each electrically directly connected market zone
to Belgian adequacy.
For interconnections, the different categories shall therefore be related to the contribution
of these market zones, as presented on Figure 12.
Figure 12: Interconnections categories
9 Through the Allegro connection that will be available for the first delivery year. 10 Luxemburg is not considered because it is part of the same market zone as Germany.
Input scenarioModel
simulation
Near-scarcity hours
identification
Calculation of derating factors
Cross-border contribution

15/08/2019 Derating factors 29
The approach to determine cross-border contributions for the input scenario is presented
on Figure 13.
Figure 13: Interconnection contribution calculation
This methodology could further evolve when the methodology for the determination of
the maximum entry capacity following the Regulation Internal Market for Electricity
(RIME) Art. 26.11 (a) becomes available. Note that according to Art. 26.7 of RIME in the
future also the RSC (Regional Security Coordinator center) (Coreso) will have to provide
a recommendation.

15/08/2019 Derating factors 30
Example of interconnection contribution calculation
Let’s assume a situation where Belgium is in scarcity and is
importing 1 GW of available energy in electrically directly
connected market zones.
On this particular hour, other market zones can also be in
scarcity situations and have no capacity to export electricity
abroad. The electrically directly connected market zones net
position (for ‘flow-based’ domain, in red) and market exchange
to Belgium (for ‘NTC-connected’ market zone, in blue) are
presented on the figure to the side. In this case, only Germany
and Netherlands are exporting whereas France and United
Kingdom are importing. Therefore, the contribution of these
countries can be calculated:
- 𝐹𝑅 → 𝐵𝐸 = 0
- 𝑈𝐾 → 𝐵𝐸 = 0
- 𝑁𝐿 → 𝐵𝐸 = 𝐵𝐸𝑖𝑚𝑝𝑜𝑟𝑡 .𝑁𝐿𝑒𝑥𝑝𝑜𝑟𝑡
𝑁𝐿𝑒𝑥𝑝𝑜𝑟𝑡+𝐷𝐸𝑒𝑥𝑝𝑜𝑟𝑡= 1 .
3
3+2= 0.6 𝐺𝑊
- 𝐷𝐸 → 𝐵𝐸 = 𝐵𝐸𝑖𝑚𝑝𝑜𝑟𝑡 .𝐷𝐸𝑒𝑥𝑝𝑜𝑟𝑡
𝑁𝐿𝑒𝑥𝑝𝑜𝑟𝑡+𝐷𝐸𝑒𝑥𝑝𝑜𝑟𝑡= 1 .
2
3+2= 0.4 𝐺𝑊
On average, the latest Adequacy and Flexibility report of Elia [I] gives some insights of
the capability of other countries to export energy during Belgian scarcity moments
(Figure 14)
Figure 14: Example of electrically directly connected market zones contribution to Belgian adequacy from
the Adequacy and Flexibility report [I]

15/08/2019 Derating factors 31
12. The contribution of interconnections to adequacy is expressed in power [MW].
13. The contribution of each electrically directly connected market zone is determined by averaging the contribution of each market zone over all near-scarcity hours.
14. The contribution of a market zone in the same “flow-based” zone as Belgium at a specific hour is determined as the weighted Belgian net position for exporting market zones, and zero for importing market zones.
15. The contribution of a market zone connected with a “net transfer capacity” with Belgium at a specific hour is determined by the market exchange for that hour if positive (from the market zone to Belgium) and zero if Belgium exports.
Main principles which serve as input for the Royal Decree proposal

15/08/2019 Derating factors 32
References
[I] Elia (2019). Adequacy and flexibility study for Belgium 2020-2030.
http://www.elia.be/~/media/files/Elia/publications-
2/studies/20190628_ELIA_Adequacy_and_flexibility_study_EN.pdf

15/08/2019 Derating factors 33
Annex 1: Correlation of climatic conditions
The various meteorological conditions having an impact on renewable generation and
electricity consumption are not independent of each other. Wind, solar radiation,
temperature and precipitation are correlated for a given region. In general, high-pressure
areas are characterized by clear skies and little wind, while low-pressure areas have
cloud cover and more wind or rain. Given the very wide range of meteorological
conditions that countries in Europe can experience, it is very hard to find clear trends
between meteorological variables for a given country. Figure 15 attempts to show the
non-explicit correlation between wind production, solar generation and temperature for
Belgium. The graph presents the seven-day average for these three variables for
Belgium based on 34 climatic years. The hourly or daily trends cannot be seen as the
variables were averaged by week but various seasonal and high-level trends can be
observed:
The higher the temperature, the lower the level of wind energy production. During
the winter there is more wind than in the summer;
The higher the temperature, the higher the level of PV generation. This is a logical
result from the fact that more solar generation goes on during the summer and
inter-season months;
When the level of wind energy production is very high, the level of PV generation
tends to fall;
In extremely cold periods, wind energy production falls while there is a slight
increase in PV generation. This is a key finding that will affect adequacy during
very cold weather.
The various meteorological data are also geographically correlated as countries are
close enough to each other to be affected by the same meteorological effects. A typical
example of this is the occurrence of a tight situation due to a cold spell which first spreads
over western France, then over Belgium and after that over Germany. It is essential to
maintain this geographical correlation between countries in terms of climate variables.
Given the high amount of renewable energy from variable sources that is installed each
year in Europe and the high sensitivity to temperature of some countries' electricity
demand, it is essential to maintain the various geographically and time-correlated
weather conditions in the assessment.

15/08/2019 Derating factors 34
Figure 15: Correlation between wind production, solar production and temperature