Statistical error in particle simulations of hydrodynamic phenomena
Upload
khangminh22Category
view
4download
0
Statistical Methods for Assessments inSimulations and Serious Games
December 2014
Research ReportETS RR–14-12
Jianbin Fu
Diego Zapata
Elia Mavronikolas
ETS Research Report Series
EIGNOR EXECUTIVE EDITOR
James CarlsonPrincipal Psychometrician
ASSOCIATE EDITORS
Beata Beigman KlebanovResearch Scientist
Heather BuzickResearch Scientist
Brent BridgemanDistinguished Presidential Appointee
Keelan EvaniniManaging Research Scientist
Marna Golub-SmithPrincipal Psychometrician
Shelby HabermanDistinguished Presidential Appointee
Donald PowersManaging Principal Research Scientist
Gautam PuhanSenior Psychometrician
John SabatiniManaging Principal Research Scientist
Matthias von DavierSenior Research Director
Rebecca ZwickDistinguished Presidential Appointee
PRODUCTION EDITORS
Kim FryerManager, Editing Services
Ayleen StellhornEditor
Since its 1947 founding, ETS has conducted and disseminated scientific research to support its products and services, andto advance the measurement and education fields. In keeping with these goals, ETS is committed to making its researchfreely available to the professional community and to the general public. Published accounts of ETS research, includingpapers in the ETS Research Report series, undergo a formal peer-review process by ETS staff to ensure that they meetestablished scientific and professional standards. All such ETS-conducted peer reviews are in addition to any reviews thatoutside organizations may provide as part of their own publication processes. Peer review notwithstanding, the positionsexpressed in the ETS Research Report series and other published accounts of ETS research are those of the authors andnot necessarily those of the Officers and Trustees of Educational Testing Service.
The Daniel Eignor Editorship is named in honor of Dr. Daniel R. Eignor, who from 2001 until 2011 served the Research andDevelopment division as Editor for the ETS Research Report series. The Eignor Editorship has been created to recognizethe pivotal leadership role that Dr. Eignor played in the research publication process at ETS.
ETS Research Report Series ISSN 2330-8516
R E S E A R C H R E P O R T
Statistical Methods for Assessments in Simulationsand Serious Games
Jianbin Fu, Diego Zapata, & Elia Mavronikolas
Educational Testing Service, Princeton, NJ
Simulation or game-based assessments produce outcome data and process data. In this article, some statistical models that can poten-tially be used to analyze data from simulation or game-based assessments are introduced. Specifically, cognitive diagnostic modelsthat can be used to estimate latent skills from outcome data so as to scale these assessments are presented under the framework ofBayesian networks; 5 prospective data mining methods that can be employed to discover problem-solving strategies from process dataare described. Some studies in the literature that apply some of these methods to analyze simulation or game-based assessments arepresented as application examples. Recommendations are provided for selecting appropriate scaling and data mining methods for theseassessments; future directions of research are proposed.
Keywords Simulation-based assessment; game-based assessment; cognitive diagnostic model; data mining; review
doi:10.1002/ets2.12011
In recent years, the importance of incorporating computer technology in assessments for the digital age, to create newtypes of technology-enhanced assessments, has been increasingly recognized. This is reflected in the U.S. Department ofEducation’s National Education Technology Plan (2010, p. xvii), which outlines the importance of conducting “researchand development that explores how embedded assessment technologies, such as simulations, collaboration environments,virtual worlds, games, and cognitive tutors, can be used to engage and motivate learners while assessing complex skills.”DiCerbo and Behrens (2012) defined four levels of integration between technology and assessment, ordered from low tohigh assimilation: (a) computerized linear or adaptive versions of paper-pencil tests, (b) simulation-based performanceassessments, (c) game-based stealth assessments, and (d) accumulation of information from multiple assessments acrossthe first three levels. Simulation and game-based assessments are considered as the new generation of assessments. Mis-levy et al. (2013) provided general discussion of psychometric issues in game-based assessments in the framework of theevidence-centered assessment design. In the current article, we discuss the specific statistical and psychometric modelsthat can be potentially used to analyze test data from simulation or game-based assessments, and we provide samples ofapplications in literature
A simulation is a computational model imitating a real or hypothesized situation where users can manipulate or modifyparameters to learn educational objectives (National Research Council, 2011). A serious game is defined as a mental con-test combining entertainment and educational objectives (e.g., learning and/or skill acquisition) in which players engagein computer-simulated context in accordance with specific rules, which results in a quantifiable outcome (Shute, 2011;Zyda, 2005). Some key elements of a serious game are (a) artificial phenomena containing challenges and problems tobe solved, (b) explicit play rules and goals, (c) explicit or implicit feedback on players’ performance, (d) change of gamestates by players’ actions, and (e) dual purposes of entertainment and education. Serious games and computer simulationsare similar, given that most games incorporate simulations as part of their basic architecture; however, there are some dif-ferences between them, as simulations do not necessarily have the elements of (b) through (e) above (National ResearchCouncil, 2011).
Compared to traditional assessments (i.e., paper-and-pencil tests and their computerized versions), simulation orgame-based assessments are considered to be more suitable for creating performance-based tasks to measure high-orderskills, as well as multiple skills at different levels of granularity simultaneously. This is because simulation and gamingtechnology provides the affordances to create a situated environment for assessment (Eseryel, Ge, Ifenthaler, & Law, 2011;
Corresponding author: J. Fu, E-mail: [email protected]
ETS Research Report No. RR-14-12. © 2014 Educational Testing Service 1
J. Fu et al. Statistical Methods in Simulations and Serious Games
National Research Council, 2011). Some high-order skills such as complex problem solving, collaboration, communi-cation, and information literacy have been identified as critical for people to be successful in the 21st century (Eseryel,Ifenthaler, & Ge, 2011; Shute, Ventura, & Zapata-Rivera, 2012; Silva, 2008). Because multiple skills at different levels ofgranularity can be measured simultaneously and an examinee’s every action in solving an item or task can be recordedrelatively easily, simulation or game-based assessments can be designed to provide individualized, dynamic, real-time,and detailed feedback to examinees (Shute et al., 2012).
Traditional assessments versus simulation and game-based assessments also differ in terms of the type and amount ofdata they produce. This has implications in terms of how data from them is modeled and how that data can be used tosupport score reporting and interpretation. Traditional assessments usually only produce outcome data, that is, a student’sfinal result on an item or task. However, simulation or game-based assessments not only produce outcome data but alsocan be specifically designed to generate large amount of process data, that is, the complete process that a student followswhen working on a particular item or task.
Outcome data can be aggregated across items and tasks to infer students’ statuses on target skills; this is referred toas the scaling issue. Scaling can be done using a direct linear or nonlinear combination of item and task scores. Forexample, classical test theory (CTT) focuses on the psychometric properties of the sum of item and task raw scores.Another example is epistemic network analysis (Rupp, Gushta, Mislevy, & Shaffer, 2010; Shaffer et al., 2009), which is anapplication of social network analysis (Wasserman & Faust, 1994) to scale students’ performance in so-called epistemicgames, such as Digital Zoo and Urban Science. Alternatively, a probabilistic model, for example, an item response the-ory (IRT) model, can be used to infer students’ latent skills targeted by an assessment. Currently, IRT models are widelyused in practice (e.g., in state K-12 testing and the National Assessment of Educational Progress). Unlike traditionaltests, which are often assumed to measure one general ability, the outcome data from simulation or game-based assess-ments are usually multidimensional, targeting multiple finer grained skills, and thus requiring more complicated scalingmodels.
Process data along with outcome data can be used to reveal students’ problem-solving strategies and identify good andpoor strategies. Various data mining methods can serve this purpose. The results can be used to provide timely informativefeedback to examinees.
The National Research Council (2011) argued that the greatest technical challenge to simulation or game-basedassessments might be how to draw inferences from the large amount of data generated from these assessments. Inthe subsequent sections, we describe some probabilistic scaling models for estimating latent skills from outcome data,as well as data mining methods for analyzing process data and making inferences about students’ problem-solvingstrategies. We also discuss future research for analyzing test data from simulation and game-based assessments. Notethat the statistical models discussed here can be applied to any other types of assessment that produce outcome and/orprocess data with features similar to that generated from simulation or game-based measures. In addition, althoughour focus is on test data resulting from cognitive skills, these methods may also be applied to test data of noncognitiveskills.
Scaling Methods for Students’ Latent Skills With Outcome Data
In this section, a general probabilistic scaling model is first presented under Bayesian networks (Heckerman, 1998;Murphy, 1998; Pearl, 1988). Then, specific models are described under the three types of relationships betweenitems/tasks and skills upon which the models are based. For each model, we focus on the main features (e.g., modelcomponents and purposes) of the model, rather than the estimation procedures. Applications of Bayesian networksin simulation or game-based assessments are discussed and suggestions for selecting appropriate scaling methods areprovided.
Probabilistic Scaling Models
The general scaling problem for educational assessments can be set up using Bayesian networks. Therefore, before pre-senting the general probabilistic scaling model, we first introduce Bayesian networks. A Bayesian network consists of agraphical network and a probability distribution and is built on a finite directed acyclic graph (DAG). A DAG is a directedgraph because, if two nodes in the graph have a path, the path is directed with an arrow. For example, node Z1 has an
2 ETS Research Report No. RR-14-12. © 2014 Educational Testing Service
J. Fu et al. Statistical Methods in Simulations and Serious Games
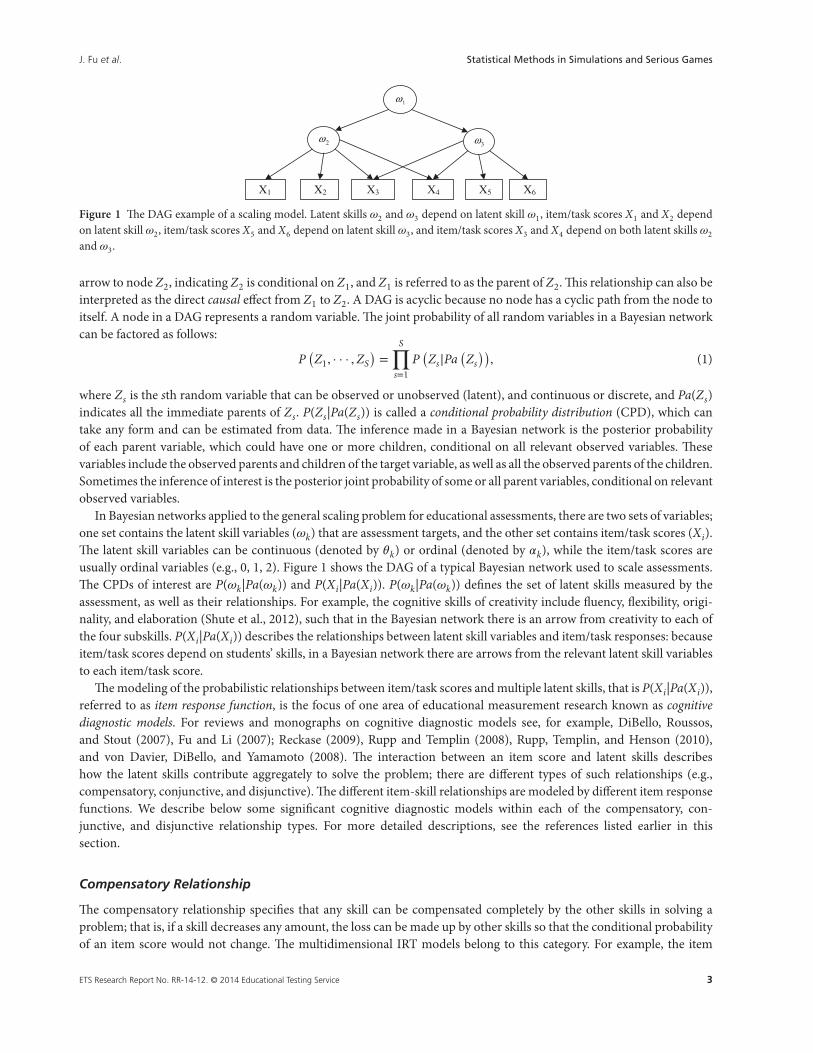
X1 X2 X3 X6X5X4
2ω
1ω
3ω
Figure 1 The DAG example of a scaling model. Latent skills 𝜔2 and 𝜔3 depend on latent skill 𝜔1, item/task scores X1 and X2 dependon latent skill 𝜔2, item/task scores X5 and X6 depend on latent skill 𝜔3, and item/task scores X3 and X4 depend on both latent skills 𝜔2
and 𝜔3.
arrow to node Z2, indicating Z2 is conditional on Z1, and Z1 is referred to as the parent of Z2. This relationship can also beinterpreted as the direct causal effect from Z1 to Z2. A DAG is acyclic because no node has a cyclic path from the node toitself. A node in a DAG represents a random variable. The joint probability of all random variables in a Bayesian networkcan be factored as follows:
P(
Z1, · · · ,ZS)=
S∏s=1
P(
Zs|Pa(
Zs)), (1)
where Zs is the sth random variable that can be observed or unobserved (latent), and continuous or discrete, and Pa(Zs)indicates all the immediate parents of Zs. P(Zs|Pa(Zs)) is called a conditional probability distribution (CPD), which cantake any form and can be estimated from data. The inference made in a Bayesian network is the posterior probabilityof each parent variable, which could have one or more children, conditional on all relevant observed variables. Thesevariables include the observed parents and children of the target variable, as well as all the observed parents of the children.Sometimes the inference of interest is the posterior joint probability of some or all parent variables, conditional on relevantobserved variables.
In Bayesian networks applied to the general scaling problem for educational assessments, there are two sets of variables;one set contains the latent skill variables (𝜔k) that are assessment targets, and the other set contains item/task scores (Xi).The latent skill variables can be continuous (denoted by 𝜃k) or ordinal (denoted by 𝛼k), while the item/task scores areusually ordinal variables (e.g., 0, 1, 2). Figure 1 shows the DAG of a typical Bayesian network used to scale assessments.The CPDs of interest are P(𝜔k|Pa(𝜔k)) and P(Xi|Pa(Xi)). P(𝜔k|Pa(𝜔k)) defines the set of latent skills measured by theassessment, as well as their relationships. For example, the cognitive skills of creativity include fluency, flexibility, origi-nality, and elaboration (Shute et al., 2012), such that in the Bayesian network there is an arrow from creativity to each ofthe four subskills. P(Xi|Pa(Xi)) describes the relationships between latent skill variables and item/task responses: becauseitem/task scores depend on students’ skills, in a Bayesian network there are arrows from the relevant latent skill variablesto each item/task score.
The modeling of the probabilistic relationships between item/task scores and multiple latent skills, that is P(Xi|Pa(Xi)),referred to as item response function, is the focus of one area of educational measurement research known as cognitivediagnostic models. For reviews and monographs on cognitive diagnostic models see, for example, DiBello, Roussos,and Stout (2007), Fu and Li (2007); Reckase (2009), Rupp and Templin (2008), Rupp, Templin, and Henson (2010),and von Davier, DiBello, and Yamamoto (2008). The interaction between an item score and latent skills describeshow the latent skills contribute aggregately to solve the problem; there are different types of such relationships (e.g.,compensatory, conjunctive, and disjunctive). The different item-skill relationships are modeled by different item responsefunctions. We describe below some significant cognitive diagnostic models within each of the compensatory, con-junctive, and disjunctive relationship types. For more detailed descriptions, see the references listed earlier in thissection.
Compensatory Relationship
The compensatory relationship specifies that any skill can be compensated completely by the other skills in solving aproblem; that is, if a skill decreases any amount, the loss can be made up by other skills so that the conditional probabilityof an item score would not change. The multidimensional IRT models belong to this category. For example, the item
ETS Research Report No. RR-14-12. © 2014 Educational Testing Service 3
J. Fu et al. Statistical Methods in Simulations and Serious Games
response function of the well-known multidimensional generalized partial credit model (MGPCM; Fu, 2009; Haberman,2013; von Davier, 2008) is given as follows:
Pim = P(
Xi = m|𝜽, ai, bi)=
exp
( ∑k∈Kim
aik𝜃km−bim
)Mi−1∑h=0
exp
( ∑k∈Kih
aik𝜃kh−bih
) , (2)
where 𝜽 is the skill vector with elements 𝜃k representing skill k= 1 to K; Xi is a random score on item i and can takeinteger value m= 0 to Mi − 1; ai is the discrimination parameter vector with elements aik indicating the discriminationpower of item i on skill k; bi is the parameter vector related to item category difficulties with elements bim representing theparameter related to item category difficulty for score m of item i, and bi0 ≡ 0; and Kim is the set of skill indexes relevant toscore m of item i. MGPCM’s item response function is an adjacent category logit function with ai and bi as item parameters.The skill compensation is reflected in the summation term,
∑k∈Kim
aik𝜃km, in Equation 2. MGPCM is a very general IRT
model and can be reduced to many simple models by fixing one or more parameters. For example, using K = 1, MGPCMbecomes the unidimensional generalized partial credit model (GPCM; Muraki, 1992), and the further constraint of aik =1 leads to the partial credit model (Masters & Wright, 1997). The simplified 2-parameter and 1-parameter logistic models(Hambleton, Swaminathan, & Rogers, 1991) are the special cases of these two models, respectively, for dichotomous items(i.e., m= 0, 1).
Another notable multidimensional IRT model is the multidimensional random coefficients multinomial logit model(MRCMLM; Adams, Wilson, & Wang, 1997), whose response function is given by:
P(
Xi = m|𝜽, 𝝃) = exp
( K∑k=1
𝛾imk𝜃k −P∑
p=1𝛽imp𝜉p
)Mi−1∑h=0
exp
( K∑k=1
𝛾ihk𝜃k −P∑
p=1𝛽ihp𝜉p
) , (3)
whereK∑
k=1𝛾i0k𝜃jk −
P∑p=1
𝛽i0p𝜉p ≡ 0; 𝛾 imk is the predefined score weight representing the relative importance of skill k to
attain score m of item i; 𝜉p is the pth basic item difficulty parameter, p= 1 to P, and 𝝃 is the difficulty parameter vector;and 𝛽 imp is a predefined design parameter representing the level of the pth basic item difficulty parameter involved in scorem of item i. The specifications of score parameters 𝛾 imk and design parameters 𝛽 imp are based on cognitive theory, andthus a variety of IRT models can be formed (e.g., Adams et al., 1997; Wang, Wilson, & Adams, 1996; Wilson & Adams,1995). The family of linear logistic test models (LLTM; Fischer, 1973, 1997; Fischer & Ponocny, 1994, 1995) is a specialcase of MRCMLM.
Conjunctive Relationship
Within the conjunctive relationship, to achieve a score m(> 0) requires successful executions of all the relevant skills onthe score category. In terms of probability, this means that an item response probability can be written as the function ofa joint probability of successfully executing all the required skills:
P(
Xi = m|𝝎) = P({
yimk = 1, k ∈ Kim} |𝝎) , (4)
where 𝝎 is the skill vector, and a skill variable can be continuous or ordinal; yimk denotes the status of applying skill k toitem i’s score category m, with 1 indicating success and 0 indicating failure; and {yimk = 1, k∈Kim} represents the eventthat all the yimks related to the score category m of item i equals 1. Conjunctive models are different regarding how tospecify the joint probability of the successful executions of all relevant skills.
4 ETS Research Report No. RR-14-12. © 2014 Educational Testing Service
J. Fu et al. Statistical Methods in Simulations and Serious Games
The dichotomous fusion model (Hartz, 2002; Roussos, Templin, & Henson, 2007; also referred to as reparameter-ized unified model, see Kim, 2011) specifies the joint probability for dichotomous items and skills with binary values(0=mastery vs. 1= nonmastery), except for a residual ability:
P(
Xi = 1|a, 𝜃) = 𝜋∗i
∏k∈Ki
r∗(1−𝛼k)ik Pci
(𝜃), (5)
where a is the binary skill vector with K elements of 𝛼k which are of primary interest; Ki is the set of skill indices rel-evant to dichotomous item i; 𝜋∗
i is the probability of successfully applying all relevant binary skills on item i, givenmastery of all these skills, which is interpreted as item i difficulty; r∗ik
(0 ≤ r∗ik ≤ 1
)is the ratio of: (a) the probability
of correctly executing skill k to item i, given mastery of skill k, and (b) the probability of correctly executing skill k toitem i, given nonmastery of skill k, which is interpreted as the item i’s discrimination parameter with respect to skillk, where r∗ik = 1 implies mastery of skill k is not required by item i, and r∗ik = 0 implies the skill is strictly necessary;𝜃 is the continuous residual ability used to account for the aggregate effect of skills other than those binary skills; andPci
(𝜃) = Pci
(Xi = 1|𝜃) = 1
1+exp(−𝜃−ci) , is the 1-parameter logistic model (also referred to as the Rasch model) with theitem easiness parameter ci (0≤ ci ≤ 3) to account for the effect of the residual ability in answering item i correctly. Fuand Bolt (2004) extended the fusion model to accommodate polytomous items using the cumulative score probabilityfunction.
The fusion model is quite complicated and, in applications, the residual part, Pci(𝜃), is often removed from the item
response function, leading to the reduced fusion model. The noisy inputs, deterministic “and” gate (NIDA) model (Junker& Sijtsma, 2001) that simplifies the reduced fusion model by assuming the probability of executing a skill, for a master orfor a nonmaster, is the same across items:
P(
Xi = 1|𝜶) = ∏k∈Ki
𝜋𝛼kk r(1−𝛼k)
k , (6)
where 𝜋k is the probability of successfully applying skill k for a master of this skill, and rk is the probability of successfullyapplying skill k for a nonmaster of this skill, and rk <𝜋k. Note that rk and 𝜋k are the same across items so that they do nothave a subscript for items. The above models simplify the conditional joint probability in Equation 4 by factoring it intothe product of independent execution of each related skill conditioned on the skill, that is,
P({
yimk = 1, k ∈ Kim} |𝝎) = ∏
k∈Kim
P(
yimk = 1|𝜔k). (7)
The deterministic inputs, noisy “and” gate (DINA) model (Haertel, 1989; Junker & Sijtsma, 2001; Mislevy, Almond,Yan, & Steinberg, 1999; Tatsuoka, 2002) takes another approach to simplify Equation 4 by assuming that the conditionaljoint probability takes only two values: one for a master of all skills required by item i, and another for a nonmaster of atleast one required skill:
P(
Xi = 1|𝜶)⎧⎪⎨⎪⎩1 − pi
∏k∈Ki
𝛼k = 1
𝜂i
∏k∈Ki
𝛼k = 0, (8)
where pi denotes the probability of an error on item i for a master of all skills required by item i, and 𝜂i is the probabilityof solving item i by guessing for a nonmaster of at least one required skill.
In Equation 7, skills can be represented by continuous variables instead of binary or ordinal variables. The conjunc-tive Rasch model (CRM; Maris, 1995) treats skills as continuous variables, and the probability of executing each skill ismodeled by the 1-parameter logistic model:
P(
Xi = 1|𝜽) = ∏k∈Ki
exp(𝜃k − bik
)1 + exp
(𝜃k − bik
) , (9)
where bik is the difficulty parameter of skill k on dichotomous item i.
ETS Research Report No. RR-14-12. © 2014 Educational Testing Service 5
J. Fu et al. Statistical Methods in Simulations and Serious Games
Disjunctive Relationship
In the case of the disjunctive relationship, to attain an item score it is sufficient to successfully execute any one of theskills related to the item score. In terms of the joint probability of attribute executions, the disjunctive relationship can bewritten as:
P(
Xi = m|𝝎) = P(∀yimk = 1, k ∈ Kim|𝝎) = 1 − P
({yimk = 0, k ∈ Kim
} |𝝎) , (10)
where ∀ yimk = 1 denotes that any one of yimks equals 1. By assuming conditional independence of skill execution,Equation 10 can be further factored into:
P(
Xi = m|𝝎) = 1 −∏
k∈Kim
P(yimk = 0|𝝎). (11)
Due to the fact that in the disjunctive relationship any one skill is sufficient to solve a problem, the disjunctive relation-ship is a special case of the compensatory relationship in the sense that one skill can totally replace another skill to solvea problem.
The disjunctive multiple classification latent class model (MCLCM-DJ; Maris, 1999) is a disjunctive model with binaryskills for dichotomous items:
P(
Xi = 1|𝜶) = 1 −∏k∈Ki
[1 − 𝜋
𝛼kik r(1−𝛼k)
ik
], (12)
where 𝜋ik is the probability of successfully applying skill k to item i for a master of this skill, and rik is the probability ofsuccessfully applying skill k to item i for a nonmaster of this skill. The disjunctive hierarchical class model (HICLAS-DJ;De Boeck & Rosenberg, 1988) simplifies the MCLCM-DJ by fixing all 𝜋ik to 1 and all rik to 0. That is, a master of anyrelated skill to an item will certainly answer this item correctly, and only a nonmaster of all related skills will definitelyanswer this item incorrectly.
Bayesian Networks Versus Cognitive Diagnostic Models
Though often distinguished from one another, we propose that Bayesian networks can be treated as a general probabilisticscaling method for latent skills. However, one caveat is that, in Bayesian networks, all skill estimates are based on theirposterior probabilities, while, for the probabilistic scaling methods, skill estimates can be based on their posterior prob-abilities or likelihood functions. The development of probabilistic scaling methods in educational measurement, in mostcases, is independent of the work of Bayesian networks. The explicit applications of Bayesian networks to scaling educa-tional assessments have been limited to Bayesian networks with ordinal skill variables and simple item response functions;more discussion of this topic follows in a subsequent section of this article. In the field of educational measurement, quitea few computer programs have been developed to implement the scaling models for latent skills, for example, the MIRTpackage (Haberman, 2013) and mdltm (von Davier & Xu, 2009). It will be interesting to determine whether existing pro-grams of Bayesian networks can be used to estimate more complicated scaling models for educational assessments, suchas the cognitive diagnostic models presented earlier in this article.
Most cognitive diagnostic models in educational measurement, such as those models mentioned previously, do notinclude a hierarchical structure in P(𝜔k|Pa(𝜔k)) so as to enable simplification of the models and reduced complication ofthe parameter estimation. The hierarchical structure could represent a cognitive structure or long-term learning effects,that is, the effects of prior skills (e.g., skills estimated from previous test administrations) on the skills being estimatedduring the current administration. In addition, most models do not take into account short-term learning effects regardingthe impact of previous items or feedback on responses to the current item (i.e., the parent set of an item score does notcontain any other item score).1 However, these components can easily be added to a Bayesian network by drawing arrowsbetween latent skills and between item scores.
Applications of Bayesian Networks
For scaling models with many latent skills, that include many parameters, even when based on strong empirical cognitivetheory, the estimation is challenging in terms of efficiency, accuracy, and stability. Partly for this reason, the use of multi-dimensional cognitive diagnostic models is rarely seen in operational settings. For simulation or game-based assessments,
6 ETS Research Report No. RR-14-12. © 2014 Educational Testing Service
J. Fu et al. Statistical Methods in Simulations and Serious Games
Bayesian networks where skills are treated as ordinal variables have been used to scale latent skills in, for example, QuestAtlantis: Taiga Park (Shute, Masduki, & Donmez, 2010), The Elder Scrolls IV: Oblivion (Shute, 2011), Crayon Physics Deluxe(Shute et al., 2012), World of Goo (Shute & Kim, 2011), and a damage-control simulation for firefighting on a naval ship(Koenig, Lee, Iseli, & Wainess, 2010). In these applications, procedures have been taken to parameterize the conditionalprobabilities (i.e., P(𝜔k|Pa(𝜔k)) and P(Xi|Pa(Xi))) in a parsimonious way so as to keep the conditional probability tablessmall (Almond, DiBello, Moulder, & Zapata-Rivera, 2007). The common procedures define a limited number of skill lev-els (e.g., two or three levels) and/or combine multiple skills to one variable consistent with substantive knowledge andtheory using, for example, Equation 8. Almond et al. (2001) proposed several linear functions to transform multiple skillsunder compensatory, conjunctive, disjunctive, and inhibitor relationships to one ability value and then used the gradedresponse model (Samejima, 1997) as the item response function to fit data.
In order to use a probabilistic scaling model for simulation or game-based assessments to provide instant feedbackor latent skill estimates, the model item parameters or conditional probability tables should be determined beforehand.The parameter values may come from the estimates based on a prior test dataset with an adequate sample size. How-ever, sufficient sample test data may be difficult to obtain for serious games and simulations that do not have a lot ofplayers. Moreover, if the assessments are high stakes, considerations should be taken to ensure test security, as is donewith traditional high-stakes tests. Another way to establish item parameters is by using expert judgments. All the studiesusing Bayesian networks mentioned previously set up the conditional probability tables by means of expert judgments.However, the accuracy of item parameters based on expert judgments should be further verified by other means. Iseli,Koenig, Lee, and Wainess (2010) and Koenig et al. (2010) compared the test scores from a dynamic Bayesian network anda Bayesian network, respectively, with both conditional probability tables based on expert judgments, and scores fromhuman raters in a damage control simulation for fire and flooding situations on a naval ship; some discrepancies werefound between the two sets of scores. The results of both studies suggested the need to further improve the (dynamic)Bayesian networks. Alternatively, conditional probability tables can be created based on both test data and expert judg-ments. Further, item parameters or conditional probability tables can be produced dynamically; existing item parametersor conditional probability tables can be refined based on new test data and/or expert judgments.
Once the model item parameters or conditional probability tables are available, a student’s skill level is estimated basedon the posterior distribution of the skill conditional on the student’s available observed item and task scores. The skillestimate could be the expectation of the posterior distribution (i.e., expected a posteriori) or the skill with the maximumdensity in the posterior distribution (i.e., maximum a posteriori). If the skill is ordinal, the posterior probability for eachskill level can be reported. A student’s skills can be estimated and reported after a test is completed, or the student’s latentskills estimates can be updated dynamically as each or some new item scores are available.
Selecting Appropriate Scaling Methods
Scaling methods vary in complexity, ranging from the simple sum of item scores to multidimensional probabilistic modelswith many model parameters. When selecting a scaling method for an assessment, the following questions need to beasked:
1. Is the scaling method supported by the cognitive theory underlying the assessment?2. Is the scaling method so complicated that it causes estimation difficulties and barriers for practical uses?3. Is a simple method adequate in terms of estimation accuracy and the intended use of the test scores?
First, in order for any scaling method to work well, an assessment must be properly developed based on a high-qualitytest blueprint so that the test can provide valid evidence to make appropriate inferences about the latent skills that areintended to be measured. Second, it is important to consider the implications of a complicated scaling method; a compli-cated cognitive model may require a scaling model with equivalent complexity. However, compared to a simple model, itis more difficult to obtain stable and accurate parameter estimates when using a complicated scaling model, and usuallylarger samples and longer computation time are needed. In addition, a complicated model may have model identificationissues that are difficult to discover and identify (see Almond et al., 2007, for an example). Therefore, when we choose thecomplexity of a scaling model, we should consider the following factors: (a) alignment with the cognitive model under-lying the test, (b) data-model fit, (c) the intended use(s) of test scores, and (d) computational burden. If a simple modelprovides a better statistical fit to the data than a complicated model, we should examine the cognitive model, make any
ETS Research Report No. RR-14-12. © 2014 Educational Testing Service 7
J. Fu et al. Statistical Methods in Simulations and Serious Games
necessary modifications, and use the simple model. Sometimes a simple model is chosen mainly based on practical con-siderations (e.g., small sample requirement, light computation, and easy interpretation), provided that the simple model isstill aligned with the cognitive model and the intended uses of test scores, and the score estimates are comparable to thoseobtained from a complicated model. As mentioned previously, in all the current experiments using Bayesian networks toscale simulation or game-based assessments, the simplified conditional probability tables for ordinal skills were used tomake the scaling processes manageable.
Alternatively, if the direct scaling method is psychometrically sound and appropriate for the intended use(s) of testscores, we may use a direct linear or nonlinear combination of observed outcome scores (e.g., total raw scores) to scalestudents’ test performance without using iterative estimation procedures. Since a direct scaling method does not havemodel parameters to estimate, the method can be used immediately to scale students’ performance. However, adequate testsamples are still needed to examine the psychometric properties of the scores generated from the method (e.g., reliabilityand validity).
Data Mining Methods for Process Data
Beyond outcome data, games and simulations provide a rich source of process data—data that tell us how a student goesabout solving a problem as he or she interacts with the game or simulation. Process data may contain rich informationregarding students’ problem-solving strategies. In games and simulations, one type of process data is the log-files or otherrecords that contain all actions that students make during simulations or game playing. By proper coding of the processdata, meaningful variables can be generated as inputs to various data mining methods and multivariate analysis models touncover the relationships between students’ actions and performance outcomes. These analyses are useful for providingstudents with timely and individualized feedback, as well as hypothesis verification, evidence of test validity, and ratio-nales for simulation or game redesign. In the following sections, we describe some examples of the applications of fivedata mining methods to the process data from simulations and serious games. These methods are all well-established withextensive research and applications in various fields; in this article, we provide only general introductions. The methodsdescribed below are by no means exhaustive of all the methods that can be used to analyze process data obtained from sim-ulations and serious games. At the end of this section, we compare the five data mining methods and provide suggestionsfor selecting appropriate methods for a given dataset.
Data Mining Methods
The probabilistic scaling models are confirmatory data analysis methods because the models are set up based on therelationships between skills and items/tasks that are defined beforehand, while data mining methods are identified asexploratory data analysis, as they are used to discover problem-solving strategies from process data. Uncovering problem-solving strategies is actually classifying students’ action sequences. Therefore, the five data mining methods describedbelow are all related to classification.
Decision Tree
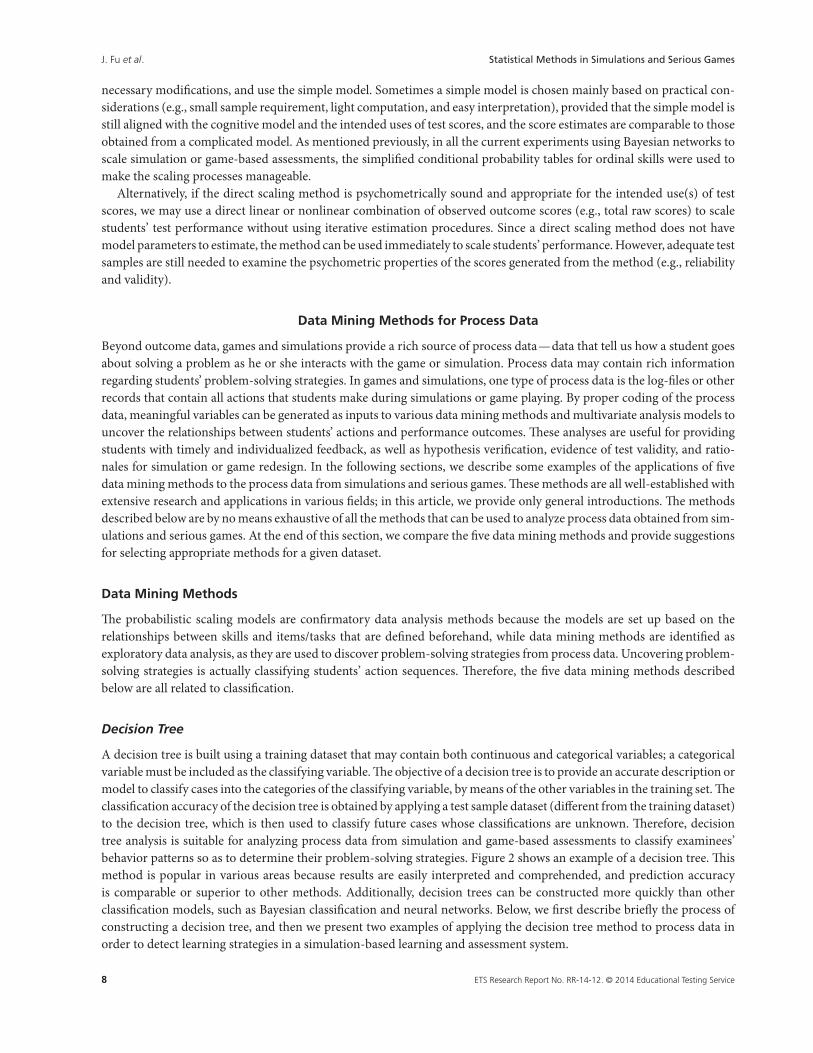
A decision tree is built using a training dataset that may contain both continuous and categorical variables; a categoricalvariable must be included as the classifying variable. The objective of a decision tree is to provide an accurate description ormodel to classify cases into the categories of the classifying variable, by means of the other variables in the training set. Theclassification accuracy of the decision tree is obtained by applying a test sample dataset (different from the training dataset)to the decision tree, which is then used to classify future cases whose classifications are unknown. Therefore, decisiontree analysis is suitable for analyzing process data from simulation and game-based assessments to classify examinees’behavior patterns so as to determine their problem-solving strategies. Figure 2 shows an example of a decision tree. Thismethod is popular in various areas because results are easily interpreted and comprehended, and prediction accuracyis comparable or superior to other methods. Additionally, decision trees can be constructed more quickly than otherclassification models, such as Bayesian classification and neural networks. Below, we first describe briefly the process ofconstructing a decision tree, and then we present two examples of applying the decision tree method to process data inorder to detect learning strategies in a simulation-based learning and assessment system.
8 ETS Research Report No. RR-14-12. © 2014 Educational Testing Service
J. Fu et al. Statistical Methods in Simulations and Serious Games
≤5 >5
Y N
Y N
A1
A2 A3
Y N Y N
Figure 2 An example of a decision tree. Cases are classified from the root to the leaf node. For example, if a case has variables A1= “Yes”and A2≤ 5, the class of this case (e.g., if a task is completed successfully) is “Yes.”
Deriving a typical decision tree from the training dataset consists of two phases, a construction phase and a pruningphase. In the construction phase, the training dataset is recursively partitioned until all or most of the cases in a partitionhave the same classification. Beginning with the root, which contains the entire dataset, the cases in each node may bepartitioned into two or more subpartitions (child nodes) according to established splitting rules. Various criteria havebeen proposed for split selection when developing decision trees, such as Pearson’s chi-squared statistic, Gini and towingcriterion, likelihood test, mean posterior improvement criterion, and other statistical tests (Loh & Shih, 1997). If a nodecannot be further divided based on a splitting rule, then it is identified as a leaf node and labeled as the dominant class. Ifeach nonleaf node can only have two children, the decision tree is called a binary tree. When nonleaf nodes can have morethan two children, the decision tree is called a multiway-split tree. A decision tree resulting from the construction phasemay be perfect in terms of accurately classifying the known cases. However, the statistical irregularities and idiosyncrasiesof the training dataset will result in this decision tree being less than ideal in terms of prediction accuracy for other datasets.Thus, a pruning phase is need, in which nodes are iteratively reduced to prevent overfitting and to obtain a decision treewith greater accuracy for future cases. A number of pruning strategies are proposed in the literature, including minimumdescription length principle, cost-complexity pruning, and pessimistic pruning. Lim, Loh, and Shih (1997) provide anin-depth comparison of 32 classification and regression tree algorithms, in terms of accuracy, complexity, and trainingtime.
Montalvo, Baker, Sao Pedro, Nakama, and Gobert (2010) used the decision tree method to classify students’ planningbehavior within the context of scientific inquiry. The learning environment was the Science Assistments Phase ChangeMicroworld, a computer simulation-based learning and assessment system. This system contains scientific tasks, eachof which requires students to conduct experiments to find out the relationship between an independent variable (e.g.,container size) and an outcome variable (e.g., the melting point or boiling point of a substance). Students’ inquiry processesfor each task include four different inquiry stages: observe, hypothesize, experiment, and analyze data. The system’s log-files record every widget action taken by students when engaging in the system tasks (e.g., button clicks, checkbox choices,etc.). In the study conducted by Montalvo et al., the sequence of actions was separated into clips; a clip included all theactions in both the hypothesis and the experiment stages in a single run of the four-stage inquiry process. Each clip wasa text display of a sequence of actions and was coded by one or two raters as Used Table to Plan, if the clip indicated thatthe student used the trial run data table to plan subsequent trials, or Used Hypothesis Viewer to Plan, if the clip indicatedthat the student viewed the hypotheses list to plan subsequent trials. The clip codes served as the classifying variables.The variables used to split cases were also extracted from each clip and included 12 categories (e.g., all actions, totaltrial runs, incomplete trial runs, etc.). Two categories included only one variable (the number of the actions), while theother 10 categories included, besides the number of the actions, the five summary statistics of the time taken for oneaction within a category (minimum, maximum, standard deviation, mean, and mode of time taken for one action). Thecumulative values of these variables across the current and previous clips were also used to build the decision tree andmade up the cumulative dataset. All the values of the split variables were recorded and automatically generated by thesystem. A total of 570 clips were used to generate data. There were two classifying variables (Used Table to Plan and UsedHypothesis Viewer to Plan) and two sets of split variables (cumulative and noncumulative); thus, four decision trees wereconstructed, two for each classifying variable. The results showed that the decision trees for planning using the data tableperformed better than those for planning using the hypothesis list. Additionally, the decision tree for planning using thedata table, based on the cumulative data, reached a sufficiently high level of accuracy so that it could be used robustly toprovide feedback to a student who did not use the data table effectively for planning. The decision tree for planning using
ETS Research Report No. RR-14-12. © 2014 Educational Testing Service 9
J. Fu et al. Statistical Methods in Simulations and Serious Games
the hypothesis list, based on the noncumulative data, had a lower level of accuracy and might be considered adequate forfail-soft interventions that are not harmful if misapplied.
Sao Pedro, Baker, and Gobert (2012) used the same learning system as the one in the study described above to builddecision trees for two scientific behaviors in the experiment phase: designing controlled experiments and testing statedhypotheses. A clip was defined the same as in Montalvo et al.’s (2010) study and included all the actions in both thehypothesis and the experiment stages. Each clip was tagged by one or two coders as designing controlled experiments,testing stated hypotheses, both, or neither. There were 78 split variables including cumulative counts and summary timingvalues generated by the learning system, similar to the cumulative data in Montalvo et al.’s study. The main purpose ofthis study was to compare two methods of selecting split variables before building decision trees. The first method was toremove redundant split variables having correlations at or above .6 with other split variables, and the other method was toselect those split variables that were considered theoretically important to the constructs being classified. The motivationfor the second method was that using the first method could result in split variables, considered theoretically importantto the constructs, being removed while other variables without theoretical justification would be retained. The secondmethod led to a smaller set of split variables with increasing construct validity and interpretability. The performance ofthe decision trees, constructed from the two sets of split variables for each classifying variable, based on data from allclips combined, as well as partial data up to and including each clip in each run (e.g., all clips before and including Clip1 Run 2), was compared. The purpose of building the decision trees based on partial data was to determine how muchstudent interaction data was necessary to make accurate predictions. The study showed that the decision trees based onthe variable set with higher construct validity achieved not only better overall accuracy, but also achieved better predictionwith less data for both designing controlled experiments and testing stated hypotheses.
Cluster Analysis
Cluster analysis (Tan, Steinbach, & Kumar, 2006) is an exploratory data analysis method for grouping similar objects intocategories. Each object can be viewed in an n-dimensional space such that the distances between objects can be calculated,where n is the number of features (variables) on which the grouping is based. For example, cities can be grouped basedon census information such as population density, income, age, and so forth to identify cities with similar demographicfeatures. At the same time, census variables can be clustered to find variables with similar distributions across cities. Thereare different types of distance measures (e.g., Euclidean distance, squared Euclidean distance, and Manhattan distance)to compute the distances between objects. There are also different linkage rules (e.g., single linkage, complete linkage,and unweighted pair-group average) which, along with distance measures, are used to calculate the distances betweenclusters. Different types of cluster analyses can be distinguished according to their purposes and algorithms (e.g., treeclustering, two-way joining, k-means clustering, and expectation and maximization clustering). However, all types ofcluster analysis have a common goal, namely, to minimize the ratio of within-cluster distances over across-cluster distances(http://www.statsoft.com/textbook/cluster-analysis/).
Kerr, Chung, and Iseli (2011) applied cluster analysis to identify students’ strategies when solving fraction additionproblems in Save Patch, a serious game designed to teach the addition of fractions. In Save Patch, the game character,named Patch, needs to bounce over obstacles to reach his home; students are required to apply concepts underlying ratio-nal addition to complete tasks. The game has six stages, and each stage has up to five levels, resulting in a total of 16 levels.Cluster analyses were conducted at each level. The sample comprised 155 students in grades 6 through 8. The log-filesrecorded each action that students took to solve the tasks. The input data for each level of the cluster analysis includedvariables representing all sequence actions that at least five students had taken at that level. Across all of the 16 levels,the cluster analyses successfully identified solution strategies and error patterns involving game strategy or mathematicalmisconceptions. These clusters were highly interpretable and accounted for 73.6% of attempts made by students to solvethe tasks. The identified solution strategies included standard solutions that the game designers had in mind, as well asalternate solutions used by students. Given the wide coverage and clear interpretability of the action patterns identified bythe cluster analyses in their study, Kerr et al. concluded that cluster analysis can be a valid tool for analyzing process datagenerated from solving complex problems in serious games or simulations to detect meaningful learning and problem-solving strategies. In turn, the results may be used to diagnose students’ errors and to provide prompt remediation andtailored instruction through games or simulations.
10 ETS Research Report No. RR-14-12. © 2014 Educational Testing Service
J. Fu et al. Statistical Methods in Simulations and Serious Games
Neural Network
Neural network analysis (Mitchell, 1997) is used to classify cases based on input feature vectors containing observedvariables. This method has been inspired in part by the neurocognitive model of the human brain, which includes verycomplex webs of interconnected neurons. In neural networks, the input variables represent a set of interconnected nodesthat produce a single real-valued output. The function to produce the single output is commonly called the activationfunction. The activation function can take many forms, the most common being the logistic function, which has the sameform as the 2-parameter logistic IRT model:
𝛿 = 1
1 − exp
[−a
( I∑i=1
wixi − b
)] , (13)
where 𝛿 is the output value ranging from 0 to 1; xi is the input variable i; wi is the weight for xi; I is the total numberof input variables; b is the threshold; and a is the growth rate. In this function, a, wi, and b are the parameters to beestimated. The output value can serve as the final value for an output node or the input value for a hidden node (i.e., thenode between input nodes and output nodes) in a multilayer network. Each output node represents a binary classification(0 or 1). Therefore, if the cases are to be classified into M classifications, there are M − 1 output nodes, and each outputnode has its own set of parameters in the logistic function. The training dataset includes the observed class membershipfor each case; the neural network analysis uses an iterative algorithm to find the parameters in the logistic functions, whichminimizes the total mean-squared error. This kind of neural network belongs to supervised learning.
For unsupervised neural networks, the class memberships for input data are unknown, and cases are grouped intoclassifications based on the similarity of their input variables. For example, self-organizing map (SOM; Kohonen, 2001)is a type of unsupervised neural network that maps the input variables into a one- or two-dimensional space in a topo-logically ordered fashion. The mapping process includes four iterative steps: initialization, competition, cooperation, andadaptation. SOMs can be viewed as a nonlinear generalization of principal component analysis. In applications of bothsupervised and unsupervised neural networks on educational assessments, the input nodes could represent examinees’actions in tackling items/tasks, and the output nodes could represent examinees’ problem-solving strategies, so that exam-inees’ problem-solving strategies can be classified based on their problem-solving behaviors.
Soller and Stevens (2007) applied SOM to discover students’ problem-solving strategies in the interactive multime-dia exercises (IMMEX) collaborative, a web-based multimedia scientific learning environment. The tasks in their studyinvolved identifying a chemical that was spilled out of a container. To complete each task, students needed to use scientificinquiry skills to construct the problem, find relevant information, plan a search strategy, select the appropriate physicaland chemical tests, and reach a conclusion. The input variables were 22 possible actions (binary variables) in a task, whichwere recorded in the log-files and related to background information, physical, and chemical tests, precipitation reac-tions (e.g., Run_Blue_Litmus_Test, Study_Periodic_Table, Reaction_with_Silver_Nitrate). The training data contained5,284 samples; each sample included a student’s actions on a task. A student might have multiple samples because theyresponded to multiple tasks. The resulting SOM derived from the training samples had 36 output nodes. These outputnodes had different frequencies for the 22 actions and represented 36 different problem-solving strategies, with differentrates of successfully solving the problem. For example, the strategies with a balance of looking for background informa-tion and conducting tests were most effective with the highest success rates, while the strategies with conducting too manytests were associated with low success rates. The established SOM could then be used to identify the learning strategy ofa new input sample.
Hidden Markov Model
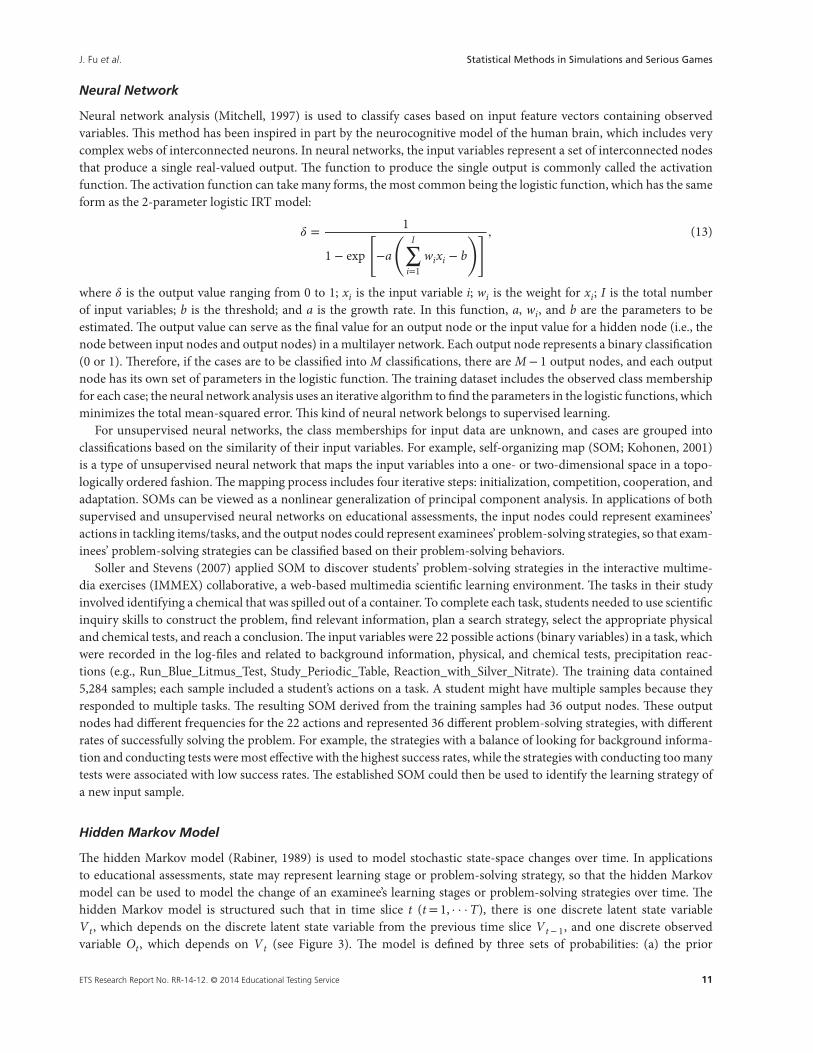
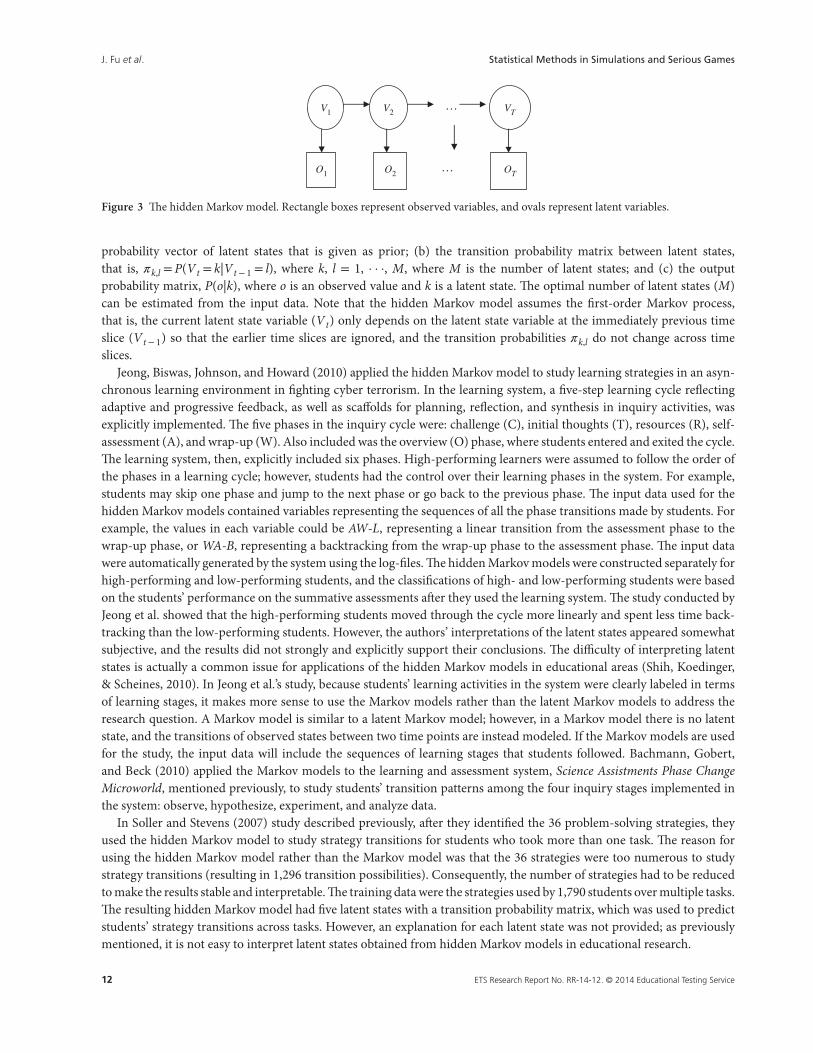
The hidden Markov model (Rabiner, 1989) is used to model stochastic state-space changes over time. In applicationsto educational assessments, state may represent learning stage or problem-solving strategy, so that the hidden Markovmodel can be used to model the change of an examinee’s learning stages or problem-solving strategies over time. Thehidden Markov model is structured such that in time slice t (t = 1, · · ·T), there is one discrete latent state variableVt , which depends on the discrete latent state variable from the previous time slice Vt − 1, and one discrete observedvariable Ot , which depends on Vt (see Figure 3). The model is defined by three sets of probabilities: (a) the prior
ETS Research Report No. RR-14-12. © 2014 Educational Testing Service 11
J. Fu et al. Statistical Methods in Simulations and Serious Games
V2V1…
…
VT
O2O1 OT
Figure 3 The hidden Markov model. Rectangle boxes represent observed variables, and ovals represent latent variables.
probability vector of latent states that is given as prior; (b) the transition probability matrix between latent states,that is, 𝜋k,l = P(Vt = k|Vt − 1 = l), where k, l = 1, · · ·, M, where M is the number of latent states; and (c) the outputprobability matrix, P(o|k), where o is an observed value and k is a latent state. The optimal number of latent states (M)can be estimated from the input data. Note that the hidden Markov model assumes the first-order Markov process,that is, the current latent state variable (Vt) only depends on the latent state variable at the immediately previous timeslice (Vt − 1) so that the earlier time slices are ignored, and the transition probabilities 𝜋k,l do not change across timeslices.
Jeong, Biswas, Johnson, and Howard (2010) applied the hidden Markov model to study learning strategies in an asyn-chronous learning environment in fighting cyber terrorism. In the learning system, a five-step learning cycle reflectingadaptive and progressive feedback, as well as scaffolds for planning, reflection, and synthesis in inquiry activities, wasexplicitly implemented. The five phases in the inquiry cycle were: challenge (C), initial thoughts (T), resources (R), self-assessment (A), and wrap-up (W). Also included was the overview (O) phase, where students entered and exited the cycle.The learning system, then, explicitly included six phases. High-performing learners were assumed to follow the order ofthe phases in a learning cycle; however, students had the control over their learning phases in the system. For example,students may skip one phase and jump to the next phase or go back to the previous phase. The input data used for thehidden Markov models contained variables representing the sequences of all the phase transitions made by students. Forexample, the values in each variable could be AW-L, representing a linear transition from the assessment phase to thewrap-up phase, or WA-B, representing a backtracking from the wrap-up phase to the assessment phase. The input datawere automatically generated by the system using the log-files. The hidden Markov models were constructed separately forhigh-performing and low-performing students, and the classifications of high- and low-performing students were basedon the students’ performance on the summative assessments after they used the learning system. The study conducted byJeong et al. showed that the high-performing students moved through the cycle more linearly and spent less time back-tracking than the low-performing students. However, the authors’ interpretations of the latent states appeared somewhatsubjective, and the results did not strongly and explicitly support their conclusions. The difficulty of interpreting latentstates is actually a common issue for applications of the hidden Markov models in educational areas (Shih, Koedinger,& Scheines, 2010). In Jeong et al.’s study, because students’ learning activities in the system were clearly labeled in termsof learning stages, it makes more sense to use the Markov models rather than the latent Markov models to address theresearch question. A Markov model is similar to a latent Markov model; however, in a Markov model there is no latentstate, and the transitions of observed states between two time points are instead modeled. If the Markov models are usedfor the study, the input data will include the sequences of learning stages that students followed. Bachmann, Gobert,and Beck (2010) applied the Markov models to the learning and assessment system, Science Assistments Phase ChangeMicroworld, mentioned previously, to study students’ transition patterns among the four inquiry stages implemented inthe system: observe, hypothesize, experiment, and analyze data.
In Soller and Stevens (2007) study described previously, after they identified the 36 problem-solving strategies, theyused the hidden Markov model to study strategy transitions for students who took more than one task. The reason forusing the hidden Markov model rather than the Markov model was that the 36 strategies were too numerous to studystrategy transitions (resulting in 1,296 transition possibilities). Consequently, the number of strategies had to be reducedto make the results stable and interpretable. The training data were the strategies used by 1,790 students over multiple tasks.The resulting hidden Markov model had five latent states with a transition probability matrix, which was used to predictstudents’ strategy transitions across tasks. However, an explanation for each latent state was not provided; as previouslymentioned, it is not easy to interpret latent states obtained from hidden Markov models in educational research.
12 ETS Research Report No. RR-14-12. © 2014 Educational Testing Service
J. Fu et al. Statistical Methods in Simulations and Serious Games
Process Mining
Process mining (van der Aalst, 2011) has emerged from the field of business process management and is used to extractprocess-related knowledge from event logs recorded by an information system. Process mining is suitable for chaoticlog-files where the process structures are not easily uncovered by other techniques. Process mining techniques can beclassified by their purposes as confirming a prior process model, extending a prior process model, or exploring a processmodel without a prior model.
Howard, Johnson, and Neitzel (2010) used the process mining method to study students’ patterns of learning phasetransition in the same learning system that was used by Jeong et al. (2010), as well as students’ behaviors in answeringitems in the assessment phase. All students’ patterns of behaviors were summarized in a Petri net plot to aid analyses.A Petri net plot is a directed bipartite graph for process analysis, in which the bars represent transitions (i.e., events),circles denote places (i.e., conditions), and directed arrows describe which places are pre- and/or post-conditions forwhich transitions. This method enumerates all students’ behavior patterns; therefore, any descriptive statistics related tothe research questions can be calculated. For example, Howard et al. found that 70% of the 5,617 students included intheir study went through the learning cycle sequentially, and the most significant linear process deviation was skippingthe initial thoughts phase. DiCerbo, Liu, Rutstein, Choi, and Behrens (2011) described the digraph to present data visually,which is similar to the Petri net plot, using the process data from the Packet Tracer Skills Based Assessments.
Selecting Appropriate Data Mining Methods
The five data mining methods described above are related to classifying samples. With the exception of the hidden Markovmodel, these data mining methods do not make any assumptions about data distributions.
The decision tree and supervised neural network find the best way to classify students into designated classes (i.e.,students’ class memberships are known in input data) based on input variables (i.e., feature vectors); however, they use dif-ferent classification methods. The decision tree searches for the best split variable at each step, which classifies students intothe most homogenous groups in terms of their known class memberships, while the supervised neural network classifiesstudents based on the weighted sum of input variables. Alternatively, for cluster analysis and unsupervised neural network,the students’ memberships are unknown in the input data, and the two methods identify class membership of studentsbased on the similarity of input variables. Although these two methods are similar, some differences are observed. Forexample, SOM, an unsupervised neural network discussed previously, is similar to nonlinear k-means clustering variantswith constrained topologies. The hidden Markov model is used for time series data to model the transition probabilitiesamong latent classes from one time point to the next time point. The input variables are all discrete variables with eachrepresenting students’ observed classes at one time point in a sequence. The hidden Markov model reduces the number ofobserved classes by extracting a few latent classes. Process mining is helpful for extracting meaningful information fromsequence data by enumerating data sequence patterns and presenting them graphically.
The selection of a data mining method depends on the training data and the research questions. To detect problem-solving strategies in simulation or game-based assessments, if we know students’ strategies (e.g., determined by ratersthrough checking students’ action sequences), we could use the decision tree or supervised neural network. If we donot know students’ strategies and have to identify these from their action patterns, we could use cluster analysis or anunsupervised neural network. If we want to see exactly all action patterns in the input data and how many students takeeach of them, process mining techniques can be used. The hidden Markov model is useful if the strategies include specificstages, each stage contains a number of actions, and we are interested in the transition patterns among stages.
In summary, if used properly, these and other potential data mining methods are effective for getting the type of richassessment evidence we want from complex assessment tasks. Therefore, these methods are critical for analyzing processdata produced by simulation and game-based assessments to allow us to uncover more meaningful things about studentcognition and problem solving.
Directions for Future Research
Simulation or game-based assessments have many attractive features that make them a potential direction of future assess-ments. These features include being suitable for measuring high-order skills as well as multiple skills simultaneously,
ETS Research Report No. RR-14-12. © 2014 Educational Testing Service 13
J. Fu et al. Statistical Methods in Simulations and Serious Games
providing examinees with timely and meaningful individualized feedback at desired levels of granularity, and enhancingthe enjoyment of a test-taking experience. However, the current development of simulation-based, especially game-based,assessments is still in the preliminary stages (National Research Council, 2011). More research is needed to study psy-chometric properties of simulation or game-based assessments, as well as methods to extract useful information fromprocess data resulting from these assessments. For that purpose, more simulation or game-based assessments need to bedeveloped first to provide grounds for such research.
We conclude this article by pointing out some future directions in this area.
1. Compare different scaling methods and find the most appropriate ones that meet psychometric and theoreticalrequirements and are also feasible to use in simulations or serious games. All scaling methods are easily implementedin a simulation or serious game by either writing new program code or embedding existing programs.
2. Compare different statistical and data mining methods and find the most appropriate means to reveal useful infor-mation from process data to inform students’ problem-solving strategies and/or simulation or game redesign. Thisissue is also related to the scaling issue. Researchers in this area are starting to consider these two concerns simultane-ously to determine the most appropriate scaling methods and data mining methods for uncovering problem-solvingstrategies in conjunction for analyzing data from simulation or game-based assessments.
3. Study the reliability, validity, and fairness issues of simulation or game-based assessments, as these are the basicpsychometric requirements for all types of assessments. Rupp, Gushta, et al. (2010) and Rupp, Templin, et al. (2010)outlined various reliability and validity requirements for game-based assessments. Also, Zapata-Rivera and Bauer(2011) described several threats to the validity of assessment data derived from game-like scenarios.
We believe that these research areas are critical to address the fundamental psychometric issues of simulation and game-based assessments and to allow us to derive valid and reliable claims from the rich information that the new generationassessments generate.
Acknowledgments
Thanks are due to Joanna Gorin, Rebecca Zwick, Carolyn Wentzel, and Andreas Oranje for their helpful suggestions andedits on early versions of this article. Malcolm Bauer and Frank Rijmen also provided constructive comments. We aregrateful to Kim Fryer for her editorial assistance.
Notes1 Some cognitive diagnostic models can take into account a hierarchical skill structure, the long-term or short-term learning
effects. Examples include the following:
• the loglinear Rasch model (Kelderman, 1984) for which the probability of an item response depends on a latent ability andother item scores;
• the generalized linear latent and mixed model framework (Rabe-Hesketh, Skrondal, & Pickles, 2004), which combinesfeatures of generalized linear mixed models and structural equation models, and causal models with discrete latent variables(Hagenaars, 1998), which combine loglinear modeling and graphical modeling, can incorporate flexible latent skillstructures that include hierarchical structures, interactions among item scores and/or multilevel data structures(e.g., students are nested in classes which in turn are nested in schools);
• the high level IRT model (Fu & Feng, 2013), similar to a high level factor analysis, can estimate a hierarchical skill structure(e.g., a general skill and several subskills).
References
Adams, R. J., Wilson, M., & Wang, W. C. (1997). The multidimensional random coefficients multinomial logit model. Applied Psycho-logical Measurement, 21(1), 1–23.
Almond, R., DiBello, L., Jenkins, F., Mislevy, R., Senturk, D., Steinberg, L., & Yan, D. (2001). Models for conditional probability tablesin educational assessment. In T. Jaakkola & T. Richardson (Eds.), Artificial intelligence and statistics 2001 (pp. 137–143). Waltham,MA: Morgan Kaufmann/Elsevier.
14 ETS Research Report No. RR-14-12. © 2014 Educational Testing Service
J. Fu et al. Statistical Methods in Simulations and Serious Games
Almond, R. G., DiBello, L. V., Moulder, B., & Zapata-Rivera, J. D. (2007). Modeling diagnostic assessments with Bayesian networks.Journal of Educational Measurement, 44, 341–359.
Bachmann, M., Gobert, J., & Beck, J. (2010). Tracking students’ inquiry paths through student transition analysis. Proceedings ofthe 3rd international conference on educational data mining, 269–270. Retrieved from http://files.eric.ed.gov/fulltext/ED538834.pdf#page=281
De Boeck, P., & Rosenberg, S. (1988). Hierarchical classes: Model and data analysis. Psychometrika, 53(3), 361–381.DiBello, L. V., Roussos, L., & Stout, W. F. (2007). Review of cognitively diagnostic assessment and a summary of psychometric models.
In C. R. Rao & S. Sinharay (Eds.), Handbook of statistics 26 (pp. 979–1030). Amsterdam, The Netherlands: Elsevier.DiCerbo, K. E., & Behrens, J. T. (2012, April). From technology-enhanced assessment to assessment-enhanced technology. Paper presented
at the annual meeting of the National Council on Measurement in Education, Vancouver, Canada.DiCerbo, K. E., Liu, J., Rutstein, D. W., Choi, Y., & Behrens, J. T. (2011, April). Visual analysis of sequential log data from complex
performance assessments. Paper presented at the annual meeting of the American Educational Research Association, New Orleans,LA.
Eseryel, D., Ge, X., Ifenthaler, D., & Law, V. (2011). Dynamic modeling as a cognitive regulation scaffold for developing complexproblem-solving skills in an educational massively multiplayer online game environment. Journal of Educational Computing Research,45, 265–286.
Eseryel, D., Ifenthaler, D., & Ge, X. (2011). Alternative assessment strategies for game-based learning environments. In D. Ifenthaler, P.Kinshuk, D. G. Isaias, D. G. Sampson, & J. M. Spector (Eds.), Multiple perspectives on problem solving and learning in the digital age(pp. 159–178). New York, NY: Springer.
Fischer, G. H. (1973). The linear logistic test model as an instrument in educational research. Acta Psychologica, 37(6), 359–374.Fischer, G. H. (1997). Unidimensional linear logistic Rasch models. In W. J. van der Linden & R. K. Hambleton (Eds.), Handbook of
modern item response theory (pp. 225–244). New York, NY: Springer-Verlag.Fischer, G. H., & Ponocny, I. (1994). An extension of the partial credit model with an application to the measurement of change.
Psychometrika, 59(2), 177–192.Fischer, G. H., & Ponocny, I. (1995). Extended rating scale and partial credit models for assessing change. In G. H. Fischer & I. W.
Molenaar (Eds.), Rasch models: Foundations, recent developments, and applications (pp. 181–202). New York, NY: Springer-Verlag.Fu, J. (2009, April). Marginal likelihood estimation with EM algorithm for general IRT models and its implementation in R. Paper presented
at the annual meeting of the National Council on Measurement in Education, San Diego, CA.Fu, J., & Bolt, D. M. (2004, April). A polytomous extension of the fusion model and its Bayesian parameter estimation. Paper presented at
the annual meeting of the National Council on Measurement in Education, San Diego, CA.Fu, J., & Feng, Y. (2013, April). A comparison of score aggregation methods for unidimensional tests on different dimensions. Paper pre-
sented at the annual meeting of the American Educational Research Association, San Francisco, CA.Fu, J., & Li, Y. (2007, April). Cognitively diagnostic psychometric models: An integrative review. Paper presented at the annual meeting of
the National Council on Measurement in Education, Chicago, IL.Haberman, S. J. (2013). A general program for item-response analysis that employs the stabilized Newton-Raphson algorithm (Research
Report No. RR-13-32). Princeton, NJ: Educational Testing Service.Haertel, E. H. (1989). Using restricted latent class models to map the skill structure of achievement items. Journal of Educational Mea-
surement, 26(4), 301–321.Hagenaars, J. A. (1998). Categorical causal modeling. Sociological Methods & Research, 26(4), 436–487.Hambleton, R. K., Swaminathan, H., & Rogers, H. J. (1991). Fundamentals of item response theory. Thousand Oaks, CA: Sage.Hartz, S. M. (2002). A Bayesian framework for the unified model for assessing cognitive abilities: Blending theory with practicality (Unpub-
lished doctoral dissertation). University of Illinois at Urbana-Champaign.Heckerman, D. (1998). A tutorial on learning with Bayesian networks. In M. I. Jordan (Ed.), Learning in graphical models (pp. 301–354).
New York, NY: Kluwer Academic.Howard, L., Johnson, J., & Neitzel, C. (2010). Examining learner control in a structured inquiry cycle using process mining. Proceedings
of the 3rd International Conference on Educational Data Mining, 71–80. Retrieved from http://educationaldatamining.org/EDM2010/uploads/proc/edm2010_submission_28.pdf
Iseli, M. R., Koenig, A. D., Lee, J. J., & Wainess, R. (2010). Automatic assessment of complex task performance in games and simula-tions (CRESST Report No. 775). Los Angeles, CA: The National Center for Research on Evaluation, Standards, and Student Testing(CRESST), Center for Studies in Education, UCLA.
Jeong, H., Biswas, G., Johnson, J., & Howard, L. (2010). Analysis of productive learning behaviors in a structured inquiry cycleusing hidden Markov models. Proceedings of the 3rd international conference on educational data mining, 81–90. Retrieved fromhttp://educationaldatamining.org/EDM2010/uploads/proc/edm2010_submission_59.pdf
Junker, B. W., & Sijtsma, K. (2001). Cognitive assessment models with few assumptions, and connections with nonparametric itemresponse theory. Applied Psychological Measurement, 25(3), 258–273.
ETS Research Report No. RR-14-12. © 2014 Educational Testing Service 15

J. Fu et al. Statistical Methods in Simulations and Serious Games
Kelderman, H. (1984). Loglinear Rasch model tests. Psychometrika, 49(2), 223–245.Kerr, D., Chung, G. K., & Iseli, M. R. (2011). The feasibility of using cluster analysis to examine log data from educational video games
(CRESST Report No. 790). Los Angeles, CA: The National Center for Research on Evaluation, Standards, and Student Testing(CRESST), Center for Studies in Education, UCLA.
Kim, Y.-H. (2011). Diagnosing EAP writing ability using the reduced reparameterized unified model. Language Testing, 28, 509–541.Koenig, A. D., Lee, J. J., Iseli, M., & Wainess, R. (2010). A conceptual framework for assessing performance in games and simulations
(CRESST Report No. 771). Los Angeles, CA: The National Center for Research on Evaluation, Standards, and Student Testing(CRESST), Center for Studies in Education, UCLA.
Kohonen, T. (2001). Self-organizing maps (3rd ed.). New York, NY: Springer.Lim, T.-S., Loh, W.-Y., & Shih, Y.-S. (1997). An empirical comparison of decision trees and other classification methods (Technical
Report No. 979). Madison, WI: Department of Statistics, University of Wisconsin, Madison.Loh, W. Y., & Shih, Y. S. (1997). Split selection methods for classification trees. Statistica Sinica, 7, 815–840.Maris, E. (1995). Psychometric latent response models. Psychometrika, 60(4), 523–547.Maris, E. (1999). Estimating multiple classification latent class models. Psychometrika, 64(2), 187–212.Masters, G. N., & Wright, B. D. (1997). The partial credit model. In W. J. van der Linden & R. K. Hambleton (Eds.), Handbook of modern
item response theory (pp. 101–122). New York, NY: Springer-Verlag.Mislevy, R. J., Almond, R. G., Yan, D., & Steinberg, L. S. (1999). Bayes nets in educational assessment: Where do the numbers come
from?. In K. B. Laskey & H. Prade (Eds.), Proceedings of the fifteenth conference on uncertainty in artificial intelligence (pp. 437–446).San Francisco, CA: Morgan Kaufmann.
Mislevy, R. J., Oranje, A., Bauer, M., von Davier, A., Corrigan, S., DiCerbo, K., & John, M. (2013, April). Psychometrics and game-basedassessment. Paper presented at the annual meeting of the National Council on Measurement in Education, San Francisco, CA.
Mitchell, T. M. (1997). Machine learning. Boston, MA: WCB/McGraw-Hill.Montalvo, O., Baker, R. S. J. d., Sao Pedro, M. A., Nakama, A., & Gobert, J. D. (2010). Identifying students’ inquiry planning
using machine learning. Proceedings of the 3rd international conference on educational data mining, 141–150. Retrieved fromhttp://educationaldatamining.org/EDM2010/uploads/proc/edm2010_submission_53.pdf
Muraki, E. (1992). A generalized partial credit model: Application of an EM algorithm. Applied Psychological Measurement, 16,159–176.
Murphy, K. (1998). A brief introduction to graphical models and Bayesian networks. Retrieved from http://www.cs.ubc.ca/∼murphyk/Bayes/bnintro.html
National Research Council. (2011). Learning science through computer games and simulations. Washington, DC: The NationalAcademies Press.
Pearl, J. (1988). Probabilistic reasoning in intelligent systems: Networks of plausible inference. San Mateo, CA: Morgan Kaufmann.Rabe-Hesketh, S., Skrondal, A., & Pickles, A. (2004). Generalized multilevel structural equation modeling. Psychometrika, 69(2),
167–190.Rabiner, L. (1989). A tutorial on hidden Markov models and selected applications in speech recognition. Proceedings of IEEE, 77(2),
257–285.Reckase, M. D. (2009). Multidimensional item response theory. New York, NY: Springer.Roussos, L. A., Templin, J. L., & Henson, R. A. (2007). Skills diagnosis using IRT-based latent class models. Journal of Educational
Measurement, 44, 293–311.Rupp, A. A., Gushta, M., Mislevy, R. J., & Shaffer, D. W. (2010). Evidence-centered design of epistemic games: Measure-
ment principles for complex learning environments. Journal of Technology, Learning, and Assessment, 8(4). Retrieved fromhttp://ejournals.bc.edu/ojs/index.php/jtla/article/view/1623/1467
Rupp, A. A., & Templin, J. L. (2008). Unique characteristics of diagnostic classification models: A comprehensive review of the currentstate-of-the-art. Measurement, 6(4), 219–262.
Rupp, A. A., Templin, J., & Henson, R. A. (2010). Diagnostic measurement: Theory, methods, and applications. New York, NY: GuilfordPress.
Samejima, F. (1997). Graded response model. In W. J. van der Linden & R. K. Hambleton (Eds.), Handbook of modern item responsetheory (pp. 85–100). New York, NY: Springer-Verlag.
Sao Pedro, M. A., Baker, R. S. J. d., & Gobert, J. D. (2012). Improving construct validity yields better models of systematic inquiry,even with less information. In J. Masthoff, B. Mobasher, M. C. Desmarais, & R. Nkambou (Eds.), User modeling, adaptation, andpersonalization: Proceedings of the 20th UMAP conference (pp. 249–260). Berlin/Heidelberg, Germany: Springer-Verlag.
Shaffer, D. W., Hatfield, D., Svarovsky, G. N., Nash, P., Nulty, A., Bagley, E., ... Mislevy, R. J. (2009). Epistemic network analysis: Aprototype for 21st century assessment of learning. International Journal of Learning Media, 1(2), 33–53.
16 ETS Research Report No. RR-14-12. © 2014 Educational Testing Service
J. Fu et al. Statistical Methods in Simulations and Serious Games
Shih, B., Koedinger, K. R., & Scheines, R. (2010). Unsupervised discovery of student learning tactics. Proceedings of the 3rd interna-tional conference on educational data mining, 201–210. Retrieved from http://educationaldatamining.org/EDM2010/uploads/proc/edm2010_submission_55.pdf
Shute, V. J. (2011). Stealth assessment in computer-based games to support learning. In S. Tobias & J. D. Fletcher (Eds.), Computergames and instruction (pp. 503–524). Charlotte, NC: IAP Information Age.
Shute, V. J., & Kim, Y. J. (2011). Does playing the World of Goo facilitate learning?. In D. Y. Dai (Ed.), Design research on learning andthinking in educational settings: Enhancing intellectual growth and functioning (pp. 359–387). New York, NY: Routledge Books.
Shute, V. J., Masduki, I., & Donmez, O. (2010). Conceptual framework for modeling, assessing and supporting competencies withingame environments. Technology, Instruction, Cognition & Learning, 8, 137–161.
Shute, V., Ventura, M., & Zapata-Rivera, D. (2012, April). Stealth assessment in digital games. Paper presented at the annual meeting ofthe National Council on Measurement in Education, Vancouver, Canada.
Silva, E. (2008). Measuring skills for the 21st century. Washington, DC: Education Sector. Retrieved from http://www.educationsector.org/publications/measuring-skills-21st-century
Soller, A., & Stevens, R. (2007). Applications of stochastic analyses for collaborative learning and cognitive assessment (IDA DocumentD-3421). Arlington, VA: Institute for Defense Analysis.
Tan, P.-N., Steinbach, M., & Kumar, V. (2006). Introduction to data mining. Boston, MA: Addison-Wesley. Retrieved from http://www-users.cs.umn.edu/∼kumar/dmbook/index.php
Tatsuoka, C. (2002). Data analytic methods for latent partially ordered classification models. Applied Statistics, 51(3), 337–350.U.S. Department of Education. (2010). Transforming American education: Learning powered by technology. National Education Technol-
ogy Plan 2010. Washington, DC: Author. Retrieved from http://www.ed.gov/sites/default/files/netp2010.pdfvan der Aalst, W. M. P. (2011). Process mining: Discovery, conformance and enhancement of business processes. Berlin, Germany: Springer-
Verlag.von Davier, M. (2008). A general diagnostic model applied to language testing data. British Journal of Mathematical and Statistical
Psychology, 61, 287–307.von Davier, M., DiBello, L. V., & Yamamoto, K. (2008). Reporting test outcomes using models for cognitive diagnosis. In J. Hartig, E.
Klieme & D. Leutner (Eds.), Assessment of competencies in educational contexts (pp. 151–176). Cambridge, MA: Hogrefe & Huber.von Davier, M. & Xu, X. (2009). Estimating latent structure models (including diagnostic classification models) with mdltm – a software
for multidimensional discrete latent traits models [Computer software]. Princeton, NJ: Educational Testing Service.Wang, W.-C., Wilson, M., & Adams, R. J. (1996). Implications and applications of the multidimensional random coefficients multinomial
logit model. Unpublished manuscript.Wasserman, S., & Faust, K. (1994). Social network analysis: Methods and applications. Cambridge, England: Cambridge University Press.Wilson, M., & Adams, R. J. (1995). Rasch models for item bundles. Psychometrika, 60(2), 181–198.Zapata-Rivera, D., & Bauer, M. (2011). Exploring the role of games in educational assessment. In M. C. Mayrath, J. Clarke-Midura, &
D. Robinson (Eds.), Technology-based assessments for 21st century skills (pp. 149–171). Charlotte, NC: Information Age.Zyda, M. (2005). From visual simulation to virtual reality to games. Computer, 38(9), 25–32.
Action Editor: Rebecca Zwick
Reviewers: Andreas Oranje and Joanna Gorin
ETS, the ETS logo, and LISTENING. LEARNING. LEADING. are registered trademarks of Educational Testing Service (ETS). All othertrademarks are property of their respective owners.
Find other ETS-published reports by searching the ETS ReSEARCHER database at http://search.ets.org/researcher/
ETS Research Report No. RR-14-12. © 2014 Educational Testing Service 17
Copyright © 2022 FDOKUMEN