Spectroscopic and docking studies on the interaction between pyrrolidinium based ionic liquid and...
8
Spectroscopic and docking studies on the interaction between pyrrolidinium based ionic liquid and bovine serum albumin Meena Kumari a , Jitendra Kumar Maurya a , Upendra Kumar Singh a , Abbul Bashar Khan a , Maroof Ali b , Prashant Singh c , Rajan Patel a,⇑ a Centre for Interdisciplinary Research in Basic Sciences, Jamia Millia Islamia (A Central University), New Delhi, India b Department of Chemistry, Jamia Millia Islamia (A Central University), New Delhi, India c Department of Chemistry, A. R. S. D. College, University of Delhi, Delhi, India highlights BMOP quenches the fluorescence intensity of BSA and changes its conformation. Quenching follows the dynamic mechanism. BMOP are first used to investigate their effects on BSA. graphical abstract article info Article history: Received 1 November 2013 Received in revised form 26 December 2013 Accepted 5 January 2014 Available online 18 January 2014 Keywords: Ionic liquid Bovine serum albumin Fluorescence quenching Hydrophobic interaction Molecular docking abstract The interaction of synthesized ionic liquid, 1-butyl-1-methyl-2-oxopyrrolidinium bromide (BMOP) and bovine serum albumin (BSA) was investigated using UV–Vis, FT-IR, steady state and time resolved fluo- rescence measurements and docking studies. Steady state spectra revealed that BMOP strongly quenched the intrinsic fluorescence of BSA through dynamic quenching mechanism. The corresponding thermody- namic parameters; Gibbs free energy change (DG), entropy change (DS) and enthalpy change (DH) showed that the binding process was spontaneous and entropy driven. It is also indicated that hydropho- bic forces play a key role in the binding of BMOP to BSA. The synchronous fluorescence spectroscopy reveals that the conformation of BSA changed in the presence of BMOP. The shift in amide I band of FT-IR spectrum of BSA suggested unfolding of the protein secondary structure upon the addition of BMOP. In addition, the molecular modeling study of BSA–BMOP system shows that BMOP binds with BSA at the interface between two sub domains IIA and IIIA, which is located just above the entrance of the binding pocket of IIA through hydrophobic and hydrogen bond interactions in which hydrophobic interaction are dominated. Ó 2014 Elsevier B.V. All rights reserved. Introduction Ionic liquids (ILs) are solvents that are often liquid at room tem- perature and composed of organic cation and appropriate anion. Their fascinating properties like negligible vapour pressure, non- flammability, high thermal stability, wide liquid range and large electrochemical window draws key interest of chemists [1,2]. ILs behaves as green surface active agents and can be superior over conventional surfactants in various chemical and biological appli- cations. Till now no reliable rules exist so far that predicts the properties of any novel IL, even though some guidelines are 1386-1425/$ - see front matter Ó 2014 Elsevier B.V. All rights reserved. http://dx.doi.org/10.1016/j.saa.2014.01.012 ⇑ Corresponding author. Tel.: +91 8860634100; fax: +91 11 26983409. E-mail addresses: [email protected], [email protected] (R. Patel). Spectrochimica Acta Part A: Molecular and Biomolecular Spectroscopy 124 (2014) 349–356 Contents lists available at ScienceDirect Spectrochimica Acta Part A: Molecular and Biomolecular Spectroscopy journal homepage: www.elsevier.com/locate/saa
-
Upload
independent -
Category
Documents
-
view
1 -
download
0
Transcript of Spectroscopic and docking studies on the interaction between pyrrolidinium based ionic liquid and...
Spectrochimica Acta Part A: Molecular and Biomolecular Spectroscopy 124 (2014) 349–356
Contents lists available at ScienceDirect
Spectrochimica Acta Part A: Molecular andBiomolecular Spectroscopy
journal homepage: www.elsevier .com/locate /saa
Spectroscopic and docking studies on the interaction betweenpyrrolidinium based ionic liquid and bovine serum albumin
1386-1425/$ - see front matter � 2014 Elsevier B.V. All rights reserved.http://dx.doi.org/10.1016/j.saa.2014.01.012
⇑ Corresponding author. Tel.: +91 8860634100; fax: +91 11 26983409.E-mail addresses: [email protected], [email protected] (R. Patel).
Meena Kumari a, Jitendra Kumar Maurya a, Upendra Kumar Singh a, Abbul Bashar Khan a, Maroof Ali b,Prashant Singh c, Rajan Patel a,⇑a Centre for Interdisciplinary Research in Basic Sciences, Jamia Millia Islamia (A Central University), New Delhi, Indiab Department of Chemistry, Jamia Millia Islamia (A Central University), New Delhi, Indiac Department of Chemistry, A. R. S. D. College, University of Delhi, Delhi, India
h i g h l i g h t s
� BMOP quenches the fluorescenceintensity of BSA and changes itsconformation.� Quenching follows the dynamic
mechanism.� BMOP are first used to investigate
their effects on BSA.
g r a p h i c a l a b s t r a c t
a r t i c l e i n f o
Article history:Received 1 November 2013Received in revised form 26 December 2013Accepted 5 January 2014Available online 18 January 2014
Keywords:Ionic liquidBovine serum albuminFluorescence quenchingHydrophobic interactionMolecular docking
a b s t r a c t
The interaction of synthesized ionic liquid, 1-butyl-1-methyl-2-oxopyrrolidinium bromide (BMOP) andbovine serum albumin (BSA) was investigated using UV–Vis, FT-IR, steady state and time resolved fluo-rescence measurements and docking studies. Steady state spectra revealed that BMOP strongly quenchedthe intrinsic fluorescence of BSA through dynamic quenching mechanism. The corresponding thermody-namic parameters; Gibbs free energy change (DG), entropy change (DS) and enthalpy change (DH)showed that the binding process was spontaneous and entropy driven. It is also indicated that hydropho-bic forces play a key role in the binding of BMOP to BSA. The synchronous fluorescence spectroscopyreveals that the conformation of BSA changed in the presence of BMOP. The shift in amide I band ofFT-IR spectrum of BSA suggested unfolding of the protein secondary structure upon the addition of BMOP.In addition, the molecular modeling study of BSA–BMOP system shows that BMOP binds with BSA at theinterface between two sub domains IIA and IIIA, which is located just above the entrance of the bindingpocket of IIA through hydrophobic and hydrogen bond interactions in which hydrophobic interaction aredominated.
� 2014 Elsevier B.V. All rights reserved.
Introduction
Ionic liquids (ILs) are solvents that are often liquid at room tem-perature and composed of organic cation and appropriate anion.
Their fascinating properties like negligible vapour pressure, non-flammability, high thermal stability, wide liquid range and largeelectrochemical window draws key interest of chemists [1,2]. ILsbehaves as green surface active agents and can be superior overconventional surfactants in various chemical and biological appli-cations. Till now no reliable rules exist so far that predicts theproperties of any novel IL, even though some guidelines are
350 M. Kumari et al. / Spectrochimica Acta Part A: Molecular and Biomolecular Spectroscopy 124 (2014) 349–356
zbrooming up, and quantitative structure–property relationshipsare being explored [3].
Currently, the research interest towards the biological applica-tion of ILs, grown up so rapidly because they provided exception-ally interesting solvent media for various biological processes viz.biocatalytic reaction [4], biosensor [5], protein separation, extrac-tion and biopreservation [6,7]. The unusual solvating propertyand high thermal stability make them a novel protein stabilizingsolvent. The spectroscopic analysis showed that [bmpy][NTf2] pro-vide high thermal stability to the monellin [8]. Similarly, higherthermal stability of a-chymotrypsin, was observed in ammoniumbased ILs [9]. Beside these unique properties they also have prom-inent role in miscellaneous industrial applications, where high sur-face areas, modification of the inter-facial activity or stability ofcolloidal systems are required. Recently, the temperature depen-dent self-assembly of amphiphilic drug in [C8mim][Cl] have beenreported [10]. Due to these interesting and useful applications ofILs herein, we examine the effect of synthesized pyrrolidiniumbased IL on BSA. The molecular interactions between them werestudied systematically by fluorescence, time resolved fluorescence,UV–Vis, and FTIR spectroscopic techniques. In addition moleculardocking was used to get better understanding of the interactionof BMOP with BSA.
The most abundant proteins in plasma are serum albumins [11].Serum albumin functions as the major transporter of non-esteri-fied fatty acids and different drugs and metabolites to different tis-sues [12]. Serum albumin is synthesized in liver and exported asnon-glycosylated protein. Bovine serum albumin (BSA) is one ofmost studied protein and used as a model in protein–ligand bind-ing studies because of its abundance, low cost, easy purification[13,14], as well as of its structural homology with human serumalbumin [15]. BSA is a globular protein of 582 amino acid residues[16]. The secondary structure of BSA consists mostly of a-helix,loops and disulphide bridges which unite to form a 3D heartshaped structure [17]. BSA consist of homologous domains I, IIand III. Each domains are further subdivided into two subdomainsA and B [18]. Among them, IIA and IIIA subdomains being hydro-phobic in nature and serve as principle binding sites. BSA hastwo tryptophan residues, Trp-212 located in subdomain IIA, andTrp-134 in the subdomain IA. Tyrosine residues (Tyr-263) are alsopresent in the subdomains IIA [19].
The spectroscopic techniques, such as UV–Vis spectroscopy[20], fluorescence spectroscopy [21], and Fourier transform infra-red spectroscopy [22], are useful techniques to investigate theinteraction between ligands and protein due to their non-destruc-tive measurement of substances under physiological conditionswith high sensitivity and rapidity [23]. To the best of our knowl-edge, the binding profile of BMOP with BSA has never been inves-tigated. The aim of this study was to analyse the fluorescencequenching mechanism, binding properties and conformationalchanges induced by BMOP in BSA.
NO
Br
Fig. 1. Schematic structure of the IL (BMOP) used in this work.
Experimental
Materials
BSA (96% purity) was purchased from Sigma Aldrich (Batch No.A2153) and was used without further purification. The BMOP wassynthesized in the laboratory. All BSA solutions were prepared inphosphate buffer at pH 7.4. Doubly distilled water was usedthroughout the experiments. The stock solution of BSA was pre-pared in phosphate buffer (pH 7.4) and its concentration wasdetermined from absorption spectroscopy. The stock concentration(20 � 10�6 M) was calculated by dividing absorbance at 280 nm bythe molar extinction coefficients of the BSA e280 = 43,890 M�1 cm�1
[24]. The working concentration of BSA (5 � 106 M) was preparedby diluting the stock solution with phosphate buffer.
Synthesis of BMOP
The BMOP as shown in Fig. 1 was synthesized [25,26], by usingthe following method: in a round bottom flask (250 ml), N-Methylpyrrolidone (10 mmol) in acetronitrile (50 ml) was taken and bro-mobutane (10 mmol) in acetronitrile (50 ml) was added to theabove solution drop wise. After that the reaction mixture was re-fluxed for 3 h. Further, it was cooled at room temperature and sol-vent was evaporated under reduced pressure. It was furtherdistilled under reduced pressure to afford the pure IL and thendried well and degassed at 60 �C for three day. It was well charac-terized by 1H NMR, 13C NMR, FTIR techniques and the purity of ILwas checked by HPLC technique. FTIR (m = cm�1 2935.05,1705.87, 1400.25, 1365.89 and 865.49; NMR (d, CdCl3
1H NMR ali-phatic proton at C3(2.49, 2H); aliphatic proton at C4(2.17, 2H); ali-phatic proton at C5(3.19, 2H); aliphatic proton at C10(3.05, 2H);aliphatic proton at C20(1.98, 2H); aliphatic proton at C30(1.56, 2H);aliphatic proton at C40(1.11, 3H); aliphatic proton at C10(2.95,3H);13C NMR aliphatic carbon at 3, 4, 5, 10, 20, 30, 40 and 100 are35.6, 19.8, 50.2, 54.3, 30.7, 20.9, 15.6, 40.2 respectively and car-bonyl carbon at 2 position is 184.9; HPLC purity of the synthesizedIL is 98.1%.
Procedures
UV–Vis spectroscopyThe UV–Vis spectra were measured using the Analytik Jena Spe-
cord-250 spectrophotometer (USA) using a 1.0 cm cell. The absorp-tion spectra of BSA were recorded at different BMOP concentrationat k280.
Fluorescence spectroscopyThe fluorescence spectra were recorded on a Cary Eclipse spec-
trofluorimeter (Varian, USA) equipped with a 150W xenon lamp ina 1 cm quartz cell and a thermostat water bath. The emission wasmeasured from 290 nm to 450 nm with an excitation wavelengthof 280 nm. Synchronous fluorescence spectra were acquired bythe same spectroflourimeter. The difference between excitationand emission wavelength was kept constant (Dk = kem � kex). TheDk at 15 nm or 60 nm showed by synchronous fluorescence spec-tra gave characteristic information of Tyrosine (Tyr) residues orTryptophan (Trp) residues, respectively, with the excitation andemission slit widths at 5 nm. Temperature was controlled duringexperiments using constant-temperature cell holder connected toconstant-temperature water circulator (Varian, USA).
Time-resolved fluorescence spectroscopyThe time-resolved fluorescence measurements were performed
at room temperature, using a single-photon counting spectrometerequipped with pulsed nanosecond LED excitation heads at 280 nm(Horiba, Jobin Yvon, IBH Ltd, Glasgow, UK). The fluorescence life-time data were measured to 10,000 counts in the peak, unlessotherwise indicated. The instrumental response function was

0.00
0.05
0.10
0.15
0.20
0.25
0.30
0.35
0.40
i
Abs
orba
nce
Wavelength (nm)
a
240 260 280 300 320 340 360 380 400
Fig. 2. UV–Vis spectra of BSA in the absence (a) and presence (b-i) of BMOP(pH = 7.4). BSA = 5 � 10�6 M and BMOP = (b-i) 4.15–29.20 mM. The scanning wasdone at 280 nm with a time interval of 160 s per scan. 20 ll of 5% BMOP was addedin 2 ml of BSA solution per spectrum.
4003500
100
200
300
400
500
600
i
Inte
nsity
(a.u
.)
Wavelength (nm)
a
Fig. 3. Fluorescence quenching spectra of BSA in the absence (a) and presence (b-i)of BMOP (pH = 7.4). BSA = 5 � 10�6 M and BMOP = (b-i) 4.15–29.20 mM at 298 Kand pH 7.4. The spectra was taken at kex = 280 nm and kem = 290–450 nm with atime interval of 240 ± 5 s per scan. 20 ll of 5% BMOP was added in 2 ml of BSAsolution per spectrum.
M. Kumari et al. / Spectrochimica Acta Part A: Molecular and Biomolecular Spectroscopy 124 (2014) 349–356 351
recorded sequentially using a scattering solution and a time cali-bration of 114 ps/channel. Data were analysed using a sum ofexponentials, employing a nonlinear least square reconvolutionanalysis from Horiba Jobin Yvon, IBH Ltd., of the form [27]:
f ðtÞ ¼Xn
i¼1
ai exp�tsi
� �ð1Þ
The pre-exponential factors (ai) are shown normalized to 1 andthe errors are taken as three standard deviations. The goodness offit was judged in terms of both a chi-squared (v2) value andweighted residuals. Time-resolved fluorescence decays were ana-lysed making use of the impulse response function (IBH DAS6 soft-ware). The average fluorescence lifetimes hsi for tri-exponentialiterative fittings were calculated by using the following relation
hsi ¼P
ais2iP
aisið2Þ
where ai and si are the relative contribution and life time of differ-ent components to the total decay.
FTIR spectroscopySingle pass attenuated total reflection Fourier transform infra-
red (ATR–FTIR) spectra were measured with a Specac Golden Gatediamond ATR sampler fitted to a Bruker Tensor 27 with an MCTdetector. Approximately 4 ll of BSA solution was pipette onto adiamond window and a 100 scan interferogram was collected insingle beam mode, with 2 cm�1 resolution, from 1200 to2000 cm�1. Reference spectra were recorded under identical condi-tions with only the solvent media.
Molecular dockingThe AutoDock 4.0 was employed to compute the possible bind-
ing mode of the BMOP with BSA. The 3-D structure of BMOP andBSA (PDB ID: 4F5S) were modeled on molecular modeling softwarepyMOL. The docking calculations were then performed using theLamarckian genetic algorithm (LGA) for ligand conformationalsearching. Lamarckian genetic algorithm (LGA) implemented inthe Autodock was used to estimate the possible binding conforma-tions of BMOP. During the docking process, a maximum of 10 dif-ferent conformations were considered for the BMOP. Theconformer with the lowest binding free energy was used for fur-ther analysis.
Results and discussion
UV–Vis spectra
The UV–Vis measurements were used to explore the structuralchanges as well as to diagnose the complex formation between li-gand and protein [28]. Fig. 2 shows the absorption spectra of BSAwith increasing concentrations of BMOP in phosphate buffer atpH 7.4. An increase in absorbance of BSA (5 � 10�6 M) at 280 nmalong with a blue shift in the spectra from 280 nm to 276 nm withincreasing concentration of BMOP (from 4.15 to 29.20 mM) wasobserved. This indicates that BMOP binds with BSA and results inalteration in the conformation of BSA [29].
Fluorescence spectra
In case of macromolecules like protein, fluorescence measure-ments provide useful information regarding binding of the ligandto protein, such as the binding mechanism, binding site, and inter-molecular distance [30,31]. There are three intrinsic fluorophoremolecules tryptophan (Trp), tyrosine (Tyr) and phenylalanine(Phe) present in protein which provides the information about
protein conformation [32]. Shifts in kmax and fluorescence intensitywhich are mainly attributed to changes in the position of the Trpresidues were used for studying the BSA–BMOP interaction. Thelack of emission peak of Tyr at 300–310 nm was mainly attributedto the quenching of fluorescence by Trp due to efficient energytransfer from Tyr to Trp a result of internal quenching effect [33].
The BSA solution of fixed concentration of 5 � 10�6 M was ex-cited at 280 nm, the maximum emission peak at 343 nm was ob-served. BMOP of different concentrations ranging from 4.15 to29.20 mM was added to the BSA solution, which shows a decreasein fluorescence intensity regularly with its increasing concentra-tion. Interestingly, a blue shift was observed from 343 to 335 nmin the fluorescence emission of BSA, with increasing concentrationsof BMOP (Fig. 3), which indicates the change in conformation ofBSA and shifts the Trp residues towards a more hydrophobic envi-ronment [34].
Fluorescence quenching decreases the fluorescence intensity ofa fluorophore due to variety of molecular interactions namely ex-cited state reactions, energy transfer, molecular rearrangements,ground state complex formation or collisional quenching [35–36]. Usually fluorescence quenching is classified as dynamicquenching and static quenching. Dynamic quenching results from
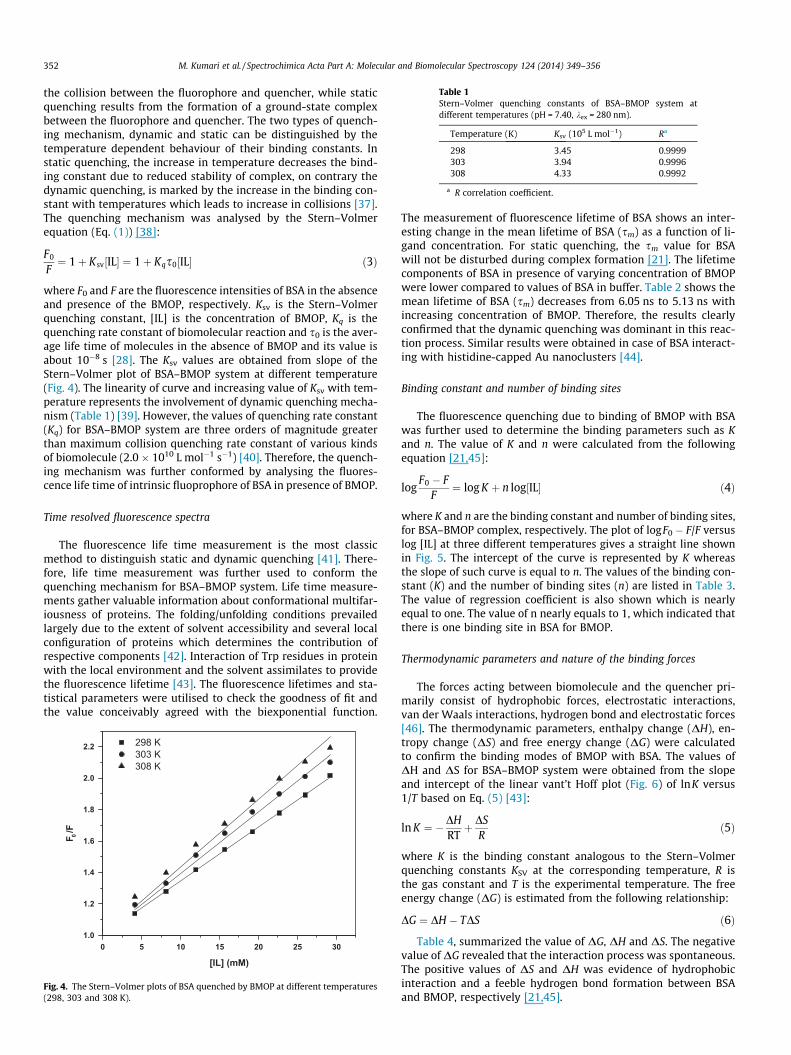
Table 1Stern–Volmer quenching constants of BSA–BMOP system atdifferent temperatures (pH = 7.40, kex = 280 nm).
Temperature (K) Ksv (105 L mol�1) Ra
298 3.45 0.9999303 3.94 0.9996308 4.33 0.9992
a R correlation coefficient.
352 M. Kumari et al. / Spectrochimica Acta Part A: Molecular and Biomolecular Spectroscopy 124 (2014) 349–356
the collision between the fluorophore and quencher, while staticquenching results from the formation of a ground-state complexbetween the fluorophore and quencher. The two types of quench-ing mechanism, dynamic and static can be distinguished by thetemperature dependent behaviour of their binding constants. Instatic quenching, the increase in temperature decreases the bind-ing constant due to reduced stability of complex, on contrary thedynamic quenching, is marked by the increase in the binding con-stant with temperatures which leads to increase in collisions [37].The quenching mechanism was analysed by the Stern–Volmerequation (Eq. (1)) [38]:
F0
F¼ 1þ Ksv½IL� ¼ 1þ Kqs0½IL� ð3Þ
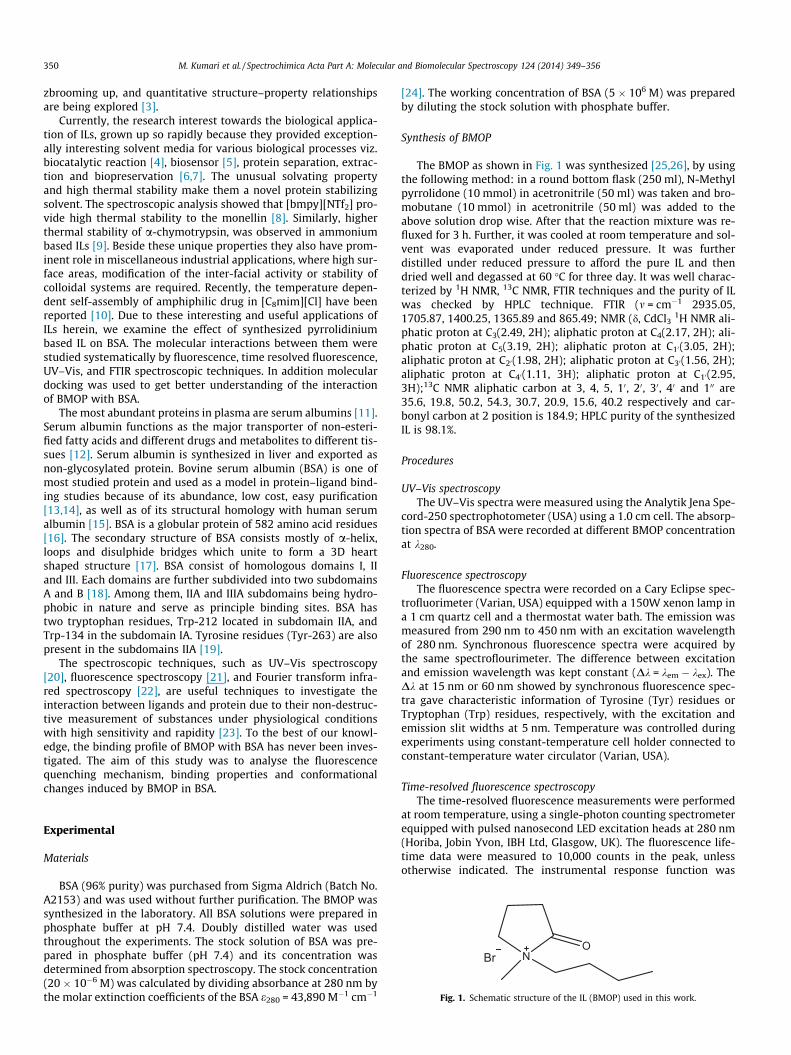
where F0 and F are the fluorescence intensities of BSA in the absenceand presence of the BMOP, respectively. Ksv is the Stern–Volmerquenching constant, [IL] is the concentration of BMOP, Kq is thequenching rate constant of biomolecular reaction and s0 is the aver-age life time of molecules in the absence of BMOP and its value isabout 10�8 s [28]. The Ksv values are obtained from slope of theStern–Volmer plot of BSA–BMOP system at different temperature(Fig. 4). The linearity of curve and increasing value of Ksv with tem-perature represents the involvement of dynamic quenching mecha-nism (Table 1) [39]. However, the values of quenching rate constant(Kq) for BSA–BMOP system are three orders of magnitude greaterthan maximum collision quenching rate constant of various kindsof biomolecule (2.0 � 1010 L mol�1 s�1) [40]. Therefore, the quench-ing mechanism was further conformed by analysing the fluores-cence life time of intrinsic fluoprophore of BSA in presence of BMOP.
Time resolved fluorescence spectra
The fluorescence life time measurement is the most classicmethod to distinguish static and dynamic quenching [41]. There-fore, life time measurement was further used to conform thequenching mechanism for BSA–BMOP system. Life time measure-ments gather valuable information about conformational multifar-iousness of proteins. The folding/unfolding conditions prevailedlargely due to the extent of solvent accessibility and several localconfiguration of proteins which determines the contribution ofrespective components [42]. Interaction of Trp residues in proteinwith the local environment and the solvent assimilates to providethe fluorescence lifetime [43]. The fluorescence lifetimes and sta-tistical parameters were utilised to check the goodness of fit andthe value conceivably agreed with the biexponential function.
1.0
1.2
1.4
1.6
1.8
2.0
2.2 298 K 303 K 308 K
F 0/F
[IL] (mM)0 5 10 15 20 25 30
Fig. 4. The Stern–Volmer plots of BSA quenched by BMOP at different temperatures(298, 303 and 308 K).
The measurement of fluorescence lifetime of BSA shows an inter-esting change in the mean lifetime of BSA (sm) as a function of li-gand concentration. For static quenching, the sm value for BSAwill not be disturbed during complex formation [21]. The lifetimecomponents of BSA in presence of varying concentration of BMOPwere lower compared to values of BSA in buffer. Table 2 shows themean lifetime of BSA (sm) decreases from 6.05 ns to 5.13 ns withincreasing concentration of BMOP. Therefore, the results clearlyconfirmed that the dynamic quenching was dominant in this reac-tion process. Similar results were obtained in case of BSA interact-ing with histidine-capped Au nanoclusters [44].
Binding constant and number of binding sites
The fluorescence quenching due to binding of BMOP with BSAwas further used to determine the binding parameters such as Kand n. The value of K and n were calculated from the followingequation [21,45]:
logF0 � F
F¼ log K þ n log½IL� ð4Þ
where K and n are the binding constant and number of binding sites,for BSA–BMOP complex, respectively. The plot of logF0 � F/F versuslog [IL] at three different temperatures gives a straight line shownin Fig. 5. The intercept of the curve is represented by K whereasthe slope of such curve is equal to n. The values of the binding con-stant (K) and the number of binding sites (n) are listed in Table 3.The value of regression coefficient is also shown which is nearlyequal to one. The value of n nearly equals to 1, which indicated thatthere is one binding site in BSA for BMOP.
Thermodynamic parameters and nature of the binding forces
The forces acting between biomolecule and the quencher pri-marily consist of hydrophobic forces, electrostatic interactions,van der Waals interactions, hydrogen bond and electrostatic forces[46]. The thermodynamic parameters, enthalpy change (DH), en-tropy change (DS) and free energy change (DG) were calculatedto confirm the binding modes of BMOP with BSA. The values ofDH and DS for BSA–BMOP system were obtained from the slopeand intercept of the linear vant’t Hoff plot (Fig. 6) of lnK versus1/T based on Eq. (5) [43]:
ln K ¼ �DHRTþ DS
Rð5Þ
where K is the binding constant analogous to the Stern–Volmerquenching constants KSV at the corresponding temperature, R isthe gas constant and T is the experimental temperature. The freeenergy change (DG) is estimated from the following relationship:
DG ¼ DH � TDS ð6Þ
Table 4, summarized the value of DG, DH and DS. The negativevalue of DG revealed that the interaction process was spontaneous.The positive values of DS and DH was evidence of hydrophobicinteraction and a feeble hydrogen bond formation between BSAand BMOP, respectively [21,45].
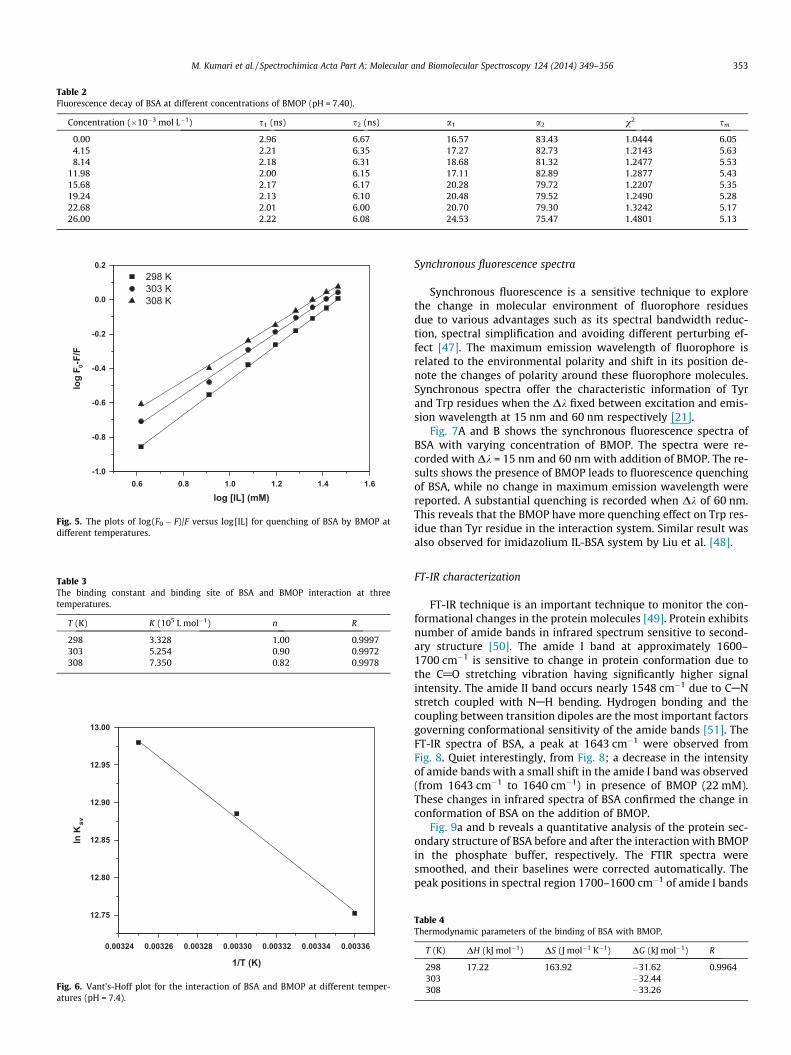
Table 2Fluorescence decay of BSA at different concentrations of BMOP (pH = 7.40).
Concentration (�10�3 mol L�1) s1 (ns) s2 (ns) a1 a2 v2 sm
0.00 2.96 6.67 16.57 83.43 1.0444 6.054.15 2.21 6.35 17.27 82.73 1.2143 5.638.14 2.18 6.31 18.68 81.32 1.2477 5.53
11.98 2.00 6.15 17.11 82.89 1.2877 5.4315.68 2.17 6.17 20.28 79.72 1.2207 5.3519.24 2.13 6.10 20.48 79.52 1.2490 5.2822.68 2.01 6.00 20.70 79.30 1.3242 5.1726.00 2.22 6.08 24.53 75.47 1.4801 5.13
0.6 0.8 1.0 1.2 1.4 1.6-1.0
-0.8
-0.6
-0.4
-0.2
0.0
0.2 298 K 303 K 308 K
log
F 0-F/
F
log [IL] (mM)
Fig. 5. The plots of log(F0 � F)/F versus log[IL] for quenching of BSA by BMOP atdifferent temperatures.
Table 3The binding constant and binding site of BSA and BMOP interaction at threetemperatures.
T (K) K (105 L mol�1) n R
298 3.328 1.00 0.9997303 5.254 0.90 0.9972308 7.350 0.82 0.9978
0.00324 0.00326 0.00328 0.00330 0.00332 0.00334 0.00336
12.75
12.80
12.85
12.90
12.95
13.00
ln K
sv
1/T (K)
Fig. 6. Vant’s-Hoff plot for the interaction of BSA and BMOP at different temper-atures (pH = 7.4).
M. Kumari et al. / Spectrochimica Acta Part A: Molecular and Biomolecular Spectroscopy 124 (2014) 349–356 353
Synchronous fluorescence spectra
Synchronous fluorescence is a sensitive technique to explorethe change in molecular environment of fluorophore residuesdue to various advantages such as its spectral bandwidth reduc-tion, spectral simplification and avoiding different perturbing ef-fect [47]. The maximum emission wavelength of fluorophore isrelated to the environmental polarity and shift in its position de-note the changes of polarity around these fluorophore molecules.Synchronous spectra offer the characteristic information of Tyrand Trp residues when the Dk fixed between excitation and emis-sion wavelength at 15 nm and 60 nm respectively [21].
Fig. 7A and B shows the synchronous fluorescence spectra ofBSA with varying concentration of BMOP. The spectra were re-corded with Dk = 15 nm and 60 nm with addition of BMOP. The re-sults shows the presence of BMOP leads to fluorescence quenchingof BSA, while no change in maximum emission wavelength werereported. A substantial quenching is recorded when Dk of 60 nm.This reveals that the BMOP have more quenching effect on Trp res-idue than Tyr residue in the interaction system. Similar result wasalso observed for imidazolium IL-BSA system by Liu et al. [48].
FT-IR characterization
FT-IR technique is an important technique to monitor the con-formational changes in the protein molecules [49]. Protein exhibitsnumber of amide bands in infrared spectrum sensitive to second-ary structure [50]. The amide I band at approximately 1600–1700 cm�1 is sensitive to change in protein conformation due tothe C@O stretching vibration having significantly higher signalintensity. The amide II band occurs nearly 1548 cm�1 due to CANstretch coupled with NAH bending. Hydrogen bonding and thecoupling between transition dipoles are the most important factorsgoverning conformational sensitivity of the amide bands [51]. TheFT-IR spectra of BSA, a peak at 1643 cm�1 were observed fromFig. 8. Quiet interestingly, from Fig. 8; a decrease in the intensityof amide bands with a small shift in the amide I band was observed(from 1643 cm�1 to 1640 cm�1) in presence of BMOP (22 mM).These changes in infrared spectra of BSA confirmed the change inconformation of BSA on the addition of BMOP.
Fig. 9a and b reveals a quantitative analysis of the protein sec-ondary structure of BSA before and after the interaction with BMOPin the phosphate buffer, respectively. The FTIR spectra weresmoothed, and their baselines were corrected automatically. Thepeak positions in spectral region 1700–1600 cm�1 of amide I bands
Table 4Thermodynamic parameters of the binding of BSA with BMOP.
T (K) DH (kJ mol�1) DS (J mol�1 K�1) DG (kJ mol�1) R
298 17.22 163.92 �31.62 0.9964303 �32.44308 �33.26

260 280 300 3200
10
20
30
40
iIn
tens
ity (a
.u.)
Wavelength (nm)
a
260 280 300 3200
20
40
60
80
100
120
140
160
180
200
a
Inte
nsity
(a.u
.)
Wavelength (nm)
i
(A) (B)
Fig. 7. Synchronous fluorescence spectra of BSA (5 � 10�6 M) in absence (a) and presence of various concentration (b-i = 4.15–29.20 mM) of BMOP (A) Dk = 15 nm; (B)Dk = 60 nm, (T = 298 K, pH = 7.4).
1800 1700 1600 1500 1400 1300
0
10
20
30
40
50
Tran
smita
nce
Wavenumber (cm-1)
BSA-BMOP BSA
1643
1640
Fig. 8. FT-IR spectra of BSA in absence and presence of BMOP. BSA = 5 � 10�6 M andBMOP = 22 mM at 298 K and pH = 7.4.
354 M. Kumari et al. / Spectrochimica Acta Part A: Molecular and Biomolecular Spectroscopy 124 (2014) 349–356
are a-helix (1660–1650 cm�1), b-sheet (1638–1610 cm�1), turn(1680–1660 cm�1), random coil (1648–1638 cm�1), and b-antipar-allel (1692–1680 cm�1) respectively. The major peaks for proteinand the complexes in the region mentioned above were resolved.The above spectral region was deconvoluted were adjusted andthe area measured with the Gaussian function fitting curves. Thearea of all component bands assigned to a given conformation werethen summed up and divided by the total area. For all the fittings,the square of the correlation coefficient (R2) is 0.9999 for BSA and0.9998 BSA–BMOP systems. The spectra of free BSA obtained werefound to be in consent with the reported data after curve fitting
Fig. 9. Infrared absorption, curve fitted and deconvoluted spectra of (a) free BSA (b) differ298 K and pH = 7.4.
[52]. Upon BMOP interaction, there was a major decrease in a-he-lix from 55% to 49%, also in random coil from 27% to 18% and aminor decrease in b-sheet from 9% to 6% but an increase in b-anti-parallel from 3% to 9% as well as major increase in b-Turn from 8%to 24%. These results again show the decrease in intensity of amide1 band on the addition of BMOP as discussed above. In addition, thedecrease in a-helix structure and increase in b-Turn and b-antipar-allel structure suggested conformational changes in BSA induce byBOMP.
Molecular modeling
Molecular docking technique has been employed to understandthe different binding modes of BSA–BMOP interaction. The 3Dstructure of BSA was obtained from Proteins Data Bank. The possi-ble conformations of the BSA–BMOP complex were calculatedusing Autodock program. Out of 10 conformers obtained, the con-former with the lowest binding free energy was used for furtheranalysis. The crystal structure of BSA contain three homologousdomains (I, II, and III): I (residues 1–183), II (184–376), III (377–583), each containing two subdomains (A and B). The hydrophobiccavities in subdomain IIA and IIIA suggested as principle ligandbinding site [53]. The best energy ranked model (Fig. 10A) revealedthat the BMOP bound at the interface between two sub domainsIIA and IIIA, which is located just above the entrance of the bindingpocket of IIA. The amino acid residues lining this binding site arecomprised of Arg196, Phe148, Arg458, Ser192, Gln195, His145,Tyr147 and Asp108 (Fig. 10B). HNBD and C120 also bind at this siteof BSA [53]. The docking result indicates that the BMOP interactwith BSA through hydrophobic interaction and single hydrogenbond between His 145 residue of BSA and O-atom of BMOP
ence spectra of BSA–BMOP complex in the amide I band region (1600–1700 cm�1) at

Fig. 10. (A) Molecular docked model of BMOP (sphere representation) located within the hydrophobic pocket of BSA. (B) The surrounding amino acid residues of BSA within 5A� from BMOP (red coloured). (C) Hydrogen bond represented using dashed lines (magenta) between O atom of BMOP (depicted in red stick) and His 145 residue of BSA (D)Distances (A�) between docked BMOP and Trp residues of BSA. (For interpretation of the references to colour in this figure legend, the reader is referred to the web version ofthis article.)
M. Kumari et al. / Spectrochimica Acta Part A: Molecular and Biomolecular Spectroscopy 124 (2014) 349–356 355
(Fig. 10C) in agreement with our conclusion of thermodynamicanalysis.
Conclusion
The interaction between BSA and BMOP were studied usingUV–Vis, FT-IR, fluorescence and time resolved spectroscopy andpossible binding mechanism were confirmed through moleculardocking method. The results obtained from time resolved and stea-dy state spectroscopy shows that BMOP effectively quenched theintrinsic fluorescence of BSA through dynamic quenching mecha-nism. The binding constant and the number of binding site werecalculated along with the thermodynamic parameters from van’tHoff equation indicated that the hydrophobic interaction playsan important role in stabilizing the BSA–BMOP complex and thebinding process is spontaneous, endothermic and entropy driven.UV–Vis spectra confirm the complex formation between the BMOPand BSA. The results obtained from Synchronous and FT-IR spectraindicated that the binding of BMOP to BSA induce the conforma-tional change of BSA. In addition, molecular docking study con-firms the interaction between the BMOP and BSA and consistentwith available investigational data. This study on the interactionbetween BSA and BMOP help the understanding of the role thatpyrrolidinium based ILs contributes to their application in thepharmaceutical industries in the future.
Acknowledgment
The authors thanks to Science and Engineering Research Board(SERB), New Delhi for providing research grant with Sanction OrderNo. (SR/S1/PC-19/2011).
References
[1] M.J. Earle, K.R. Seddon, Pure Appl. Chem. 72 (2000) 1391–1398.[2] C.M. Gordon, Catal. Appl. A Gen. 222 (2001) 101–117.
[3] I. Lopez-Martin, E. Burello, P.N. Davey, K.R. Seddon, G. Rothenberg, Chem. Phys.Chem. 8 (2007) 690–695.
[4] M. Sureshkumar, C.K. Lee, J. Mol. Catal. B: Enzym. 60 (2009) 1–12.[5] H. Ohno, C. Suzuki, K. Fukumoto, M. Yoshizawa, K. Fujita, Chem. Lett. 32 (2003)
450–451.[6] Y. Pei, J. Wang, K. Wu, X. Xuan, X. Lu, Sep. Purif. Technol. 64 (2009) 288–295.[7] S. Dreyer, P. Salim, U. Kragl, Biochem. Eng. J. 46 (2009) 176–185.[8] S.N. Baker, T.M. McCleskey, S. Pandey, G.A. Baker, Chem. Commun. (2004) 940–
941.[9] P. Attri, P. Venkatesu, Process Biochem. 48 (2013) 462–470.
[10] A.B. Khana, M. Ali, N.A. Malik, A. Ali, R. Patel, Colloids Surf. B 112 (2013) 460–465.
[11] G. Colmenarejo, A. Alvarez-Pedraglio, J.L. Lavandera, J. Med. Chem. 44 (2001)4370–4378.
[12] J. Liu, J. Tian, X. Tian, Z. Hu, X. Chen, Bioorg. Med. Chem. 12 (2004) 469–474.[13] D.C. Carter, J.X. Ho, Adv. Protein Chem. 45 (1994) 153–203.[14] D.C. Carter, B. Chang, J.X. Ho, K. Keeling, Z. Krishnasami, Eur. J. Biochem. 226
(1994) 1049–1052.[15] R.E. Olson, D.D. Christ, Annu. Rep. Med. Chem. 31 (1996) 327–336.[16] T. Maruyama, S. Katoh, M. Nakajima, H. Nabetani, T.P. Abbott, A. Shono, K.
Satoh, J. Membr. Sci. 192 (2001) 201–207.[17] X.M. He, D.C. Carter, Nature 358 (1992) 209–215.[18] J. Tian, J. Liu, Z. Hu, X. Chen, Bioorg. Med. Chem. 13 (2005) 4124–4129.[19] U. Kragh-Hansen, V.T. Chuang, M. Otagiri, Biol. Pharm. Bull. 25 (2002) 695–
704.[20] C.D. Kanakis, P.A. Tarantilis, M.G. Polissiou, S. Diamantoglou, H.A. Tajmir-Riahi,
J. Mol. Struct. 798 (2006) 69–74.[21] J.R. Lakowicz, Principles of Fluorescence Spectroscopy, third ed., Springer, New
York, 2006.[22] D. Tang, H.J. Li, P. Li, X.D. Wen, Z.M. Qian, Chem. Pharm. Bull. 56 (2008) 360–
365.[23] L. Trnkova, I. Bousova, V. Kubicek, J. Drsata, Nat. Sci. 2 (2010) 563–570.[24] C.N. Pace, F. Vajdos, L. Fee, G. Grimsley, T. Gray, Protein Sci. 4 (1995) 2411–
2423.[25] P. Singh, K. Kumari, V. Tomar, M. Samim, R. Patel, G.K. Mehrotra, M. Dubey,
N.D. Pandey, A. Katyal, Can. J. Chem. 89 (2011) 1332–1342.[26] P. Singh, K. Kumari, A. Katyal, R. Kalra, R. Chandra, Spectrochim. Acta A 73
(2009) 218–220.[27] J. Tian, Y. Zhao, X. Liu, S. Zhao, Luminescence 24 (2009) 386–393.[28] S. Bi, D. Song, Y. Tian, X. Zhou, Z. Liu, H. Zhang, Spectrochim. Acta A 61 (2005)
629–636.[29] S.K. Mehta, Bhawna, K.K. Bhasin, A. Kumar, Colloids Surf. A: Physicochem. Eng.
Aspects 317 (2008) 32–38.[30] Y.P. Wang, Y.L. Wei, C. Dong, J. Photochem. Photobiol. A: Chem. 177 (2006) 6–
11.[31] Y.Z. Zhang, B. Zhou, Y.X. Liu, C.X. Zhou, X.L. Ding, Y. Liu, J. Fluoresc. 18 (2008)
109–118.

356 M. Kumari et al. / Spectrochimica Acta Part A: Molecular and Biomolecular Spectroscopy 124 (2014) 349–356
[32] A. Papadopoulou, R.J. Green, R.A. Frazier, J. Agric. Food. Chem. 53 (2004) 158–163.
[33] D. Freifelder, Physical Biochemistry Applications to Biochemistry andMolecular Biology, W. H. Freeman, 1982.
[34] C.C. Ruiz, J. Hierrezuelo, J. Peula-Garcia, J. Aguiar, Open Macromol. J. 2 (2008)6–18.
[35] B. Valeur, M.N. Berberan-Santos, Molecular Fluorescence: Principles andApplications, Wiley, 2013.
[36] M. Matos, J. Hofkens, M. Gehlen, J. Fluoresc. 18 (2008) 821–826.[37] X. Shi, X. Li, M. Gui, H. Zhou, R. Yang, H. Zhang, Y. Jin, J. Lumin. 130 (2010) 637–
644.[38] P.D. Ross, S. Subramanian, Biochemistry 20 (1981) 3096–3102.[39] Y. Shi, H. Liu, M. Xu, Z. Li, G. Xie, L. Huang, Z. Zeng, Spectrochim. Acta A 87
(2012) 251–257.[40] M. Bihari, T.P. Russell, D.A. Hoagland, Biomacromolecules 11 (2010) 2944–
2948.[41] B. Chakraborty, S. Basu, J. Lumin. 129 (2009) 34–39.
[42] A. Mallick, B. Haldar, N. Chattopadhyay, J. Phys. Chem. B 109 (2005) 14683–14690.
[43] B. Ojha, G. Das, J. Phys. Chem. B 114 (2010) 3979–3986.[44] C. Zheng, H. Wang, W. Xu, C. Xu, J. Liang, H. Han, Spectrochim. Acta A 118
(2014) 897–902.[45] A. Airinei, R. Tigoianu, E. Rusu, D. Dorohoi, Dig. J. Nanomater. Bios. 6 (2011)
1265–1272.[46] D. Leckband, Annu. Rev. Biophys. Biomol. Struct. 29 (2000) 1–26.[47] U. Mote, S. Bhattar, S. Patil, G. Kolekar, Luminescence 25 (2010) 1–8.[48] R. Huang, S. Zhang, L. Pan, J. Li, F. Liu, H. Liu, Spectrochim. Acta A 104 (2013)
377–382.[49] M. Jackson, H.H. Mantsch, Crit. Rev. Biochem. Mol. Biol. 30 (1995) 95–120.[50] B.H.M. Hussein, J. Lumin. 131 (2011) 900–908.[51] J. Tian, Y. Xie, Y. Zhao, C. Li, S. Zhao, Luminescence 26 (2011) 296–304.[52] F. Ye, Y. An, D. Qin, L. Yang, L. She, R. Xing, Guang pu xue yu guang pu fen
xi = Guang pu. 27 (2007) 321–324.[53] B. Bhattacharya, S. Nakka, L. Guruprasad, A. Samanta, J. Phys. Chem. B 113
(2009) 2143–2150.