Spectral Estimation of Cavitation Related Narrow-Band Ship Radiated Noise Based on Fractional Lower...
6
Spectral Estimation of Cavitation Related Narrow-Band Ship Radiated Noise Based on Fractional Lower Order Statistics and Multiple Signal Classification Umut Fırat 1,2 , Tayfun Akgül 1 1 Department of Electronics and Communications Engineering, Istanbul Technical University, Istanbul, Turkey 2 TÜB ˙ ITAK B ˙ ILGEM, Gebze, Kocaeli, Turkey {firatu, tayfunakgul}@itu.edu.tr Abstract—Narrow-band spectral components of ship radiated noise are of crucial importance for sonar operators in order to detect and classify possible targets. Classical spectral estimation techniques have been widely used to fulfill the requirements for narrow-band signal detection. However, classical methods may not be sufficient when signal-to-noise ratio is relatively low. In this paper we propose to utilize the subspace based multiple signal classification for the cavitation related narrow-band ship radiated noise detection. In addition we propose the use of fractional lower order statistics instead of second order statistics when the ship radiated noise exhibits an impulsive behavior leading to drifting apart from Gaussianity. We present the results of a real ship noise data gathered from the Strait of Istanbul. We also investigate and present the 1/f -type noise characteristics of a sample ship noise segment and discuss how we can use this information for robust estimation of cavitation related narrow-band ship noise spectrum. Keywords—Ship radiated noise, Multiple Signal Classification, α-stable processes, fractional lower order statistics, 1/f noise I. I NTRODUCTION Underwater environment introduces acoustical variety due to several sound sources which can be anthropogenic, natural or biological. Typical anthropogenic sound sources are ship noises mainly originating from the propeller and the machin- ery. Narrow-band ship radiated noise has been very important for sonar operators in order to detect and classify possible targets. Among narrow-band ship radiated noise the cavitation related noise gives remarkable information about the propeller of the ship which can be utilized to classify the ship. This information includes the revolution rate of the propeller shaft and the propeller blades which may be extracted from the cavitation related narrow-band noise spectrum. Spectral estimation of narrow-band ship radiated noise is traditionally performed by classical nonparametric spectral estimation techniques, namely the Fourier transform based periodogram and its derivatives [1]–[3]. A recent paper on the spectral estimation of ship noise suggests cyclostationarity in the cavitation related narrow-band noise which results in higher detection signal-to-noise ratio (SNR) over conventional methods [2]. Nevertheless nonparametric techniques may not be sufficient to estimate narrow-band characteristics of the ship radiated noise in low SNR conditions. In this paper we propose to use an alternative spectral estimation approach based on sub- space processing, i.e., multiple signal classification (MUSIC) where noisy signals are divided into signal and noise subspaces [4]. These subspace methods assume Gaussianity in the nature of the signal justifying the use of second order statistics (SOS). However ship radiated noise may exhibit impulsive behavior whose statistical characteristics can be modeled using a heavy tailed distribution. Thus we further propose to describe the ship radiated noise with an α-stable distribution which is often used to model heavy-tailed distributions. Since the second order moment of an α-stable distribution does not exist, fractional lower order moments (FLOMs) are used to represent its statistics [5]. This gives the opportunity to replace the inadequate SOS with the fractional lower order statistics (FLOS) in non-Gaussian signal processing. Thus we are able to show the superiority of FLOS-MUSIC proposed in [6] where the only difference with MUSIC is the use of the covariation coefficient matrix instead of the well-known covariance matrix. A good overview on stable signal processing is given in [5]. We also investigate a possible 1/f behavior of the ship radiated noise using the eigenvalues of the noise covariance matrix. This approach helps us distinguish the signal and noise spaces which then can be used in MUSIC algorithm to maximize the detection SNR. We show for a sample ship noise segment that the logarithmic eigenvalue distribution of the noise covariance matrix decreases almost linearly after an eigenvalue index which may be interpreted as the signal subspace dimension. This paper is organized as follows. In Section II we briefly summarize FLOS. In Section III we give the definition of 1/f noise. Problem formulation is given in Section IV. In Section V we give the experimental results and conclude in Section VI. II. FRACTIONAL LOWER ORDER STATISTICS A. Stable Processes The stable distribution is described by its characteristic function as [5] φ(t) = exp(jδt − γ |t| α [1 + jβsignum(t)w(t, α)]) (1) 978-0-933957-40-4 ©2013 MTS This is a DRAFT. As such it may not be cited in other works. The citable Proceedings of the Conference will be published in IEEE Xplore shortly after the conclusion of the conference.
-
Upload
istanbultek -
Category
Documents
-
view
0 -
download
0
Transcript of Spectral Estimation of Cavitation Related Narrow-Band Ship Radiated Noise Based on Fractional Lower...
Spectral Estimation of Cavitation RelatedNarrow-Band Ship Radiated Noise Based on
Fractional Lower Order Statistics and MultipleSignal Classification
Umut Fırat1,2, Tayfun Akgül11Department of Electronics and Communications Engineering,
Istanbul Technical University, Istanbul, Turkey2TÜBITAK BILGEM, Gebze, Kocaeli, Turkey
{firatu, tayfunakgul}@itu.edu.tr
Abstract—Narrow-band spectral components of ship radiatednoise are of crucial importance for sonar operators in order todetect and classify possible targets. Classical spectral estimationtechniques have been widely used to fulfill the requirements fornarrow-band signal detection. However, classical methods maynot be sufficient when signal-to-noise ratio is relatively low. Inthis paper we propose to utilize the subspace based multiple signalclassification for the cavitation related narrow-band ship radiatednoise detection. In addition we propose the use of fractional lowerorder statistics instead of second order statistics when the shipradiated noise exhibits an impulsive behavior leading to driftingapart from Gaussianity. We present the results of a real ship noisedata gathered from the Strait of Istanbul. We also investigate andpresent the 1/f -type noise characteristics of a sample ship noisesegment and discuss how we can use this information for robustestimation of cavitation related narrow-band ship noise spectrum.
Keywords—Ship radiated noise, Multiple Signal Classification,α-stable processes, fractional lower order statistics, 1/f noise
I. INTRODUCTION
Underwater environment introduces acoustical variety dueto several sound sources which can be anthropogenic, naturalor biological. Typical anthropogenic sound sources are shipnoises mainly originating from the propeller and the machin-ery. Narrow-band ship radiated noise has been very importantfor sonar operators in order to detect and classify possibletargets. Among narrow-band ship radiated noise the cavitationrelated noise gives remarkable information about the propellerof the ship which can be utilized to classify the ship. Thisinformation includes the revolution rate of the propeller shaftand the propeller blades which may be extracted from thecavitation related narrow-band noise spectrum.
Spectral estimation of narrow-band ship radiated noiseis traditionally performed by classical nonparametric spectralestimation techniques, namely the Fourier transform basedperiodogram and its derivatives [1]–[3]. A recent paper onthe spectral estimation of ship noise suggests cyclostationarityin the cavitation related narrow-band noise which results inhigher detection signal-to-noise ratio (SNR) over conventionalmethods [2]. Nevertheless nonparametric techniques may notbe sufficient to estimate narrow-band characteristics of the ship
radiated noise in low SNR conditions. In this paper we proposeto use an alternative spectral estimation approach based on sub-space processing, i.e., multiple signal classification (MUSIC)where noisy signals are divided into signal and noise subspaces[4]. These subspace methods assume Gaussianity in the natureof the signal justifying the use of second order statistics(SOS). However ship radiated noise may exhibit impulsivebehavior whose statistical characteristics can be modeled usinga heavy tailed distribution. Thus we further propose to describethe ship radiated noise with an α-stable distribution whichis often used to model heavy-tailed distributions. Since thesecond order moment of an α-stable distribution does notexist, fractional lower order moments (FLOMs) are used torepresent its statistics [5]. This gives the opportunity to replacethe inadequate SOS with the fractional lower order statistics(FLOS) in non-Gaussian signal processing. Thus we are able toshow the superiority of FLOS-MUSIC proposed in [6] wherethe only difference with MUSIC is the use of the covariationcoefficient matrix instead of the well-known covariance matrix.A good overview on stable signal processing is given in [5].
We also investigate a possible 1/f behavior of the shipradiated noise using the eigenvalues of the noise covariancematrix. This approach helps us distinguish the signal andnoise spaces which then can be used in MUSIC algorithmto maximize the detection SNR. We show for a sample shipnoise segment that the logarithmic eigenvalue distribution ofthe noise covariance matrix decreases almost linearly afteran eigenvalue index which may be interpreted as the signalsubspace dimension.
This paper is organized as follows. In Section II we brieflysummarize FLOS. In Section III we give the definition of 1/fnoise. Problem formulation is given in Section IV. In SectionV we give the experimental results and conclude in SectionVI.
II. FRACTIONAL LOWER ORDER STATISTICS
A. Stable Processes
The stable distribution is described by its characteristicfunction as [5]
φ(t) = exp(jδt− γ|t|α[1 + jβsignum(t)w(t, α)]) (1)
978-0-933957-40-4 ©2013 MTS This is a DRAFT. As such it may not be cited in other works. The citable Proceedings of the Conference will be published in IEEE Xplore shortly after the conclusion of the conference.
where
w(t, α) =
{
tan απ2
for α 6= 12
πlog|t| for α = 1,
(2)
signum(t) =
1 for t > 0
0 for t = 0
−1 for t < 0
(3)
and
−∞ < δ < ∞, γ > 0, 0 < α <= 2, −1 <= β <= 1. (4)
Thus, a stable distribution is completely determined by fourparameters, the location parameter δ, the scale parameter γ,also called the dispersion, the index of skewness β and thecharacteristic exponent α. The characteristic exponent α is ashape parameter. It measures the "thickness" of the tails ofthe density function. A stable distribution with characteristicexponent α is called α-stable. When α = 2, the relevant stabledistribution is Gaussian [5]. Decreasing α suggests that thecorresponding distribution has heavier tails.
These distributions have the convenient and appealingproperty that the sum of two independent stable randomvariables having the same characteristic exponent α is againα-stable. In addition, stable distributions are very flexiblemodeling tools and are able to describe a wide variety of non-Gaussian phenomena, from those which only slightly deviatefrom the Gaussian to those which are severely impulsive [5].These properties make the stable distributions useful especiallyin applications which may exhibit outliers such as underwateracoustic signals.
B. Fractional Lower Order Moments
Although the second-order moment of a symmetric α-stable (SαS) random variable with 0 < α < 2 does notexist, all moments of order less than α do exist and are calledthe fractional lower order moments. In α-stable framework,a quantity called covariation plays an analogous role to thecovariance for Gaussian random variables [5]. The covariationcoefficient of jointly SαS random variables X and Y withα > 1 is given by
ηXY =E(XY <p−1>)
E(|Y |p), (5)
Y <p−1> = |Y |p−1signum(Y ) (6)
for any 1 <= p < α, where p is the fractional momentorder. Likewise the sample covariance function the covariationcoefficient can be estimated from the data samples as
ηFLOM =
N∑
i=1
Xi|Yi|p−1signum(Yi)
N∑
i=1
|Yi|p(7)
for some 1 <= p < α.
III. 1/f NOISE
The 1/f noise is a random process defined in terms of theshape of its power spectral density (PSD), S(f). The powerassociated with the random process, measured in a narrowbandwidth, is roughly proportional to the reciprocal frequency[7],
S(f) =constant
|f |a, (8)
where a is known as the spectral exponent.
Another representation of 1/f noise can be the log-log eigenvalue distribution of the noise covariance matrix.Eigenvalues of this matrix are obtained by the well-knowneigendecomposition as
Cφi = λiφi, i = 1, ..., N (9)
where C is the N -by-N noise covariance matrix, φi are theeigenvectors and λi are the corresponding eigenvalues [8].
Like the slope of the PSD the slope of the eigenvaluedistribution gives the 1/f behavior of the process. As shownin Section V ship radiated noise may follow a 1/f behaviorafter a certain eigenvalue index. This information can be usedfor robust estimation of cavitation related narrow-band shipnoise spectrum.
IV. PROBLEM FORMULATION
A. Cavitation Related Narrow-Band Ship Radiated Noise
Dominant components of the narrow-band ship radiatednoise originate from the propeller cavitation and the machin-ery [9]. Cavitation occurs when a ship’s propeller revolutionexceeds a certain threshold (at a given depth) which dependson the ship type and the propeller geometry. Cavitation leadsto generation of bubbles around the propeller which collapseand form a broadband noise [10]. Low frequency signal causedby propeller revolution modulates this broadband signal whichis usually modeled with the amplitude modulation. Amplitudemodulated signal received at the hydrophone is traditionallydemodulated with an envelope detector. This procedure iscalled Detection of Envelope Modulation on Noise (DEMON).Amplitude modulated signal can be modeled as
x[n]=(A+ µm[n])c[n], (10)
m[n] =
K∑
k=1
Ak sin(wkn) (11)
where m[n] represents the cavitation related narrow-bandsignal, c[n] is the cavitation related broadband signal and µis the modulation index. In this work we utilize the DEMONalgorithm given in [3] to extract the cavitation related narrow-band signal, m[n] which is subject to the spectral estimation.
B. MUSIC
Classical spectral estimation methods do not assume anyparametric model on the data. One of them is the well-knownperiodogram,
PPER(f) =1
N
∣
∣
∣
∣
∣
N−1∑
n=0
x[n] exp(−j2πfn)
∣
∣
∣
∣
∣
2
(12)
where x[n] is the signal sample and N is the signal length.Fourier based estimators like periodogram are only able toestimate broadband or low dynamic range PSDs. This rea-son gives us motivation to approach to narrow-band spectralestimation problem with more elaborate methods. Amongmany high resolution spectral estimation methods, subspacebased methods are considered to be more suitable to narrow-band spectral estimation problem. These methods rely on theproperty that the noise subspace eigenvectors of a Toeplitzcovariance matrix are orthogonal to the signal eigenvectors[4]. Thus, they are not only suitable for finding peaks in thespectrum but also separate the signal and noise spaces whichyields easier extraction of the desired signal part. An exampleof such methods is MUSIC,
PMUSIC(f) =1
M∑
i=l+1
|eH vi|2
(13)
where e = [1 exp(j2πf) exp(j4πf) ... exp(j2Mπf)]T isthe frequency vector, vi, are the eigenvectors of the covariancematrix and l is the signal subspace dimension [4]. Theoreti-cally, when f = fi, the ith sinusoidal frequency, so that e = ei,PMUSIC(f) goes to infinity. Due to estimation errors, a peakis exhibited at or near the sinusoidal frequency. The frequencyestimates are found as the frequencies corresponding to the llargest peaks of (13) [4].
C. FLOS-MUSIC
Frequency estimates of the FLOS-based MUSIC can beobtained utilizing the sample covariation coefficient matrixcontrary to the SOS-based MUSIC which uses the samplecovariance matrix [6]. The components of the sample covari-ation coefficient matrix can be obtained using (7). However,the sample covariation coefficient matrix, as estimated by (7),is not symmetric and hence it has complex eigenvalues. Apossible solution to this problem, as proposed by [11], canbe performing the eigenvalue decomposition to the sum ofthe sample covariation coefficient matrix and its Hermitiantranspose, thus obtaining real eigenvalues.
V. EXPERIMENTS
A. Dataset
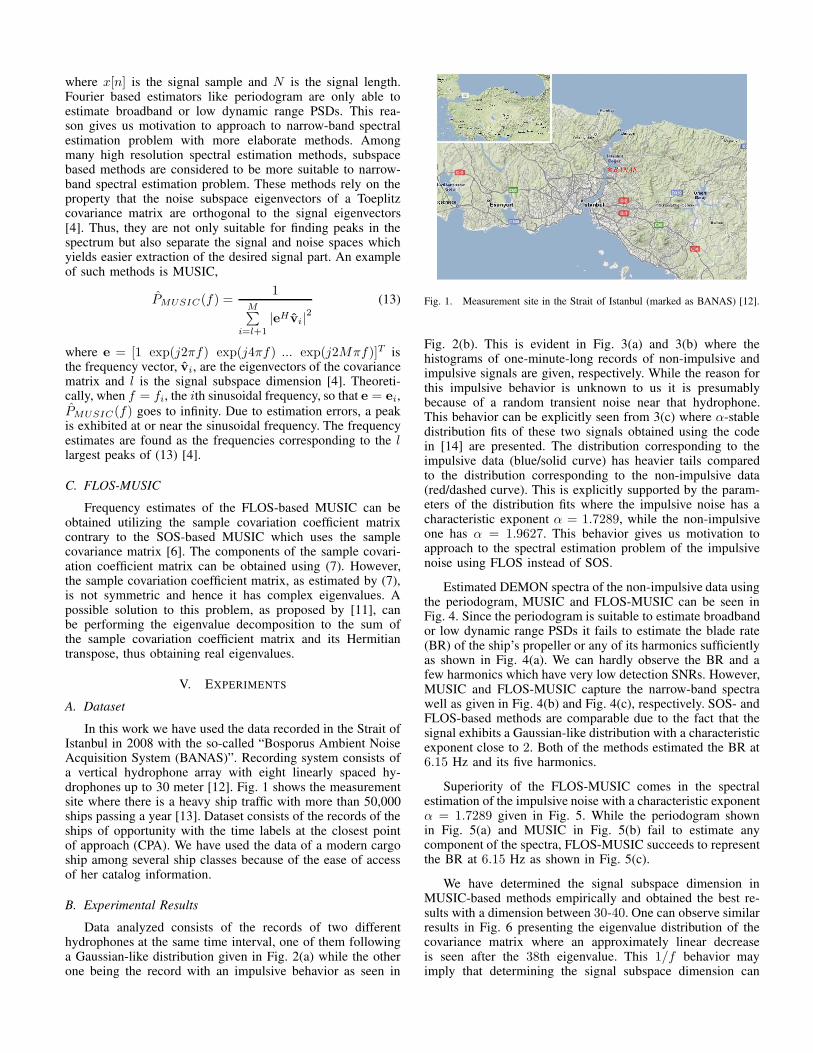
In this work we have used the data recorded in the Strait ofIstanbul in 2008 with the so-called “Bosporus Ambient NoiseAcquisition System (BANAS)”. Recording system consists ofa vertical hydrophone array with eight linearly spaced hy-drophones up to 30 meter [12]. Fig. 1 shows the measurementsite where there is a heavy ship traffic with more than 50,000ships passing a year [13]. Dataset consists of the records of theships of opportunity with the time labels at the closest pointof approach (CPA). We have used the data of a modern cargoship among several ship classes because of the ease of accessof her catalog information.
B. Experimental Results
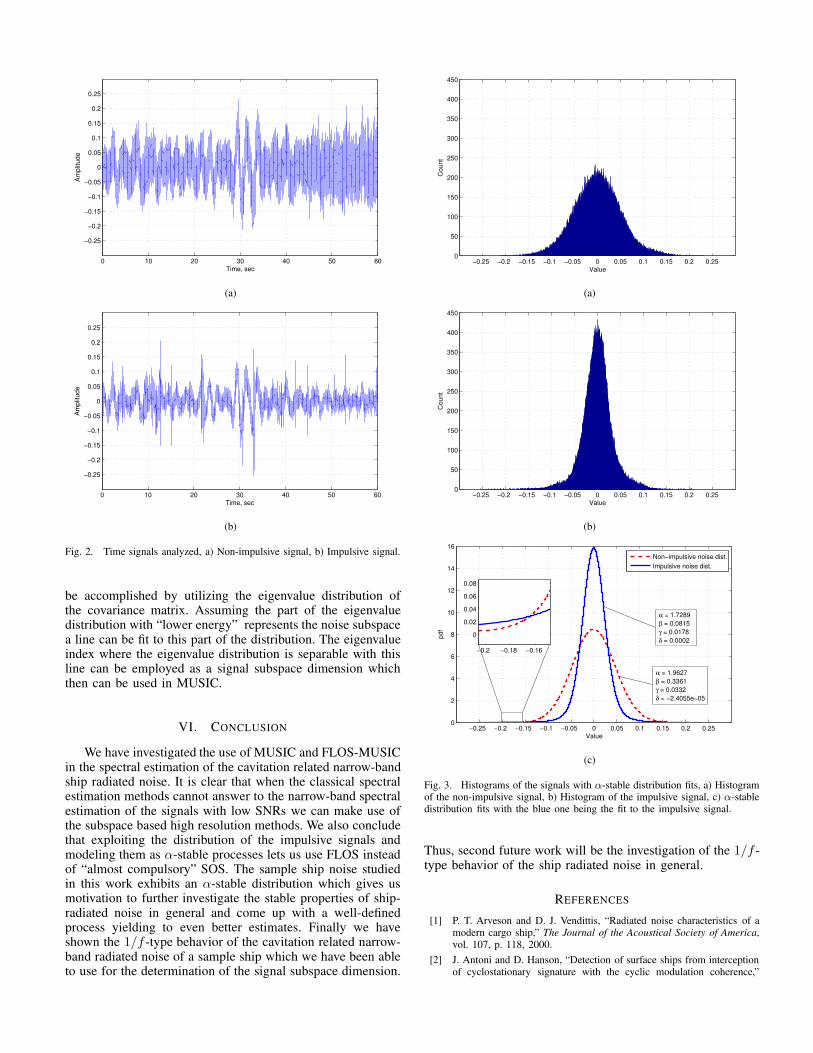
Data analyzed consists of the records of two differenthydrophones at the same time interval, one of them followinga Gaussian-like distribution given in Fig. 2(a) while the otherone being the record with an impulsive behavior as seen in
Fig. 1. Measurement site in the Strait of Istanbul (marked as BANAS) [12].
Fig. 2(b). This is evident in Fig. 3(a) and 3(b) where thehistograms of one-minute-long records of non-impulsive andimpulsive signals are given, respectively. While the reason forthis impulsive behavior is unknown to us it is presumablybecause of a random transient noise near that hydrophone.This behavior can be explicitly seen from 3(c) where α-stabledistribution fits of these two signals obtained using the codein [14] are presented. The distribution corresponding to theimpulsive data (blue/solid curve) has heavier tails comparedto the distribution corresponding to the non-impulsive data(red/dashed curve). This is explicitly supported by the param-eters of the distribution fits where the impulsive noise has acharacteristic exponent α = 1.7289, while the non-impulsiveone has α = 1.9627. This behavior gives us motivation toapproach to the spectral estimation problem of the impulsivenoise using FLOS instead of SOS.
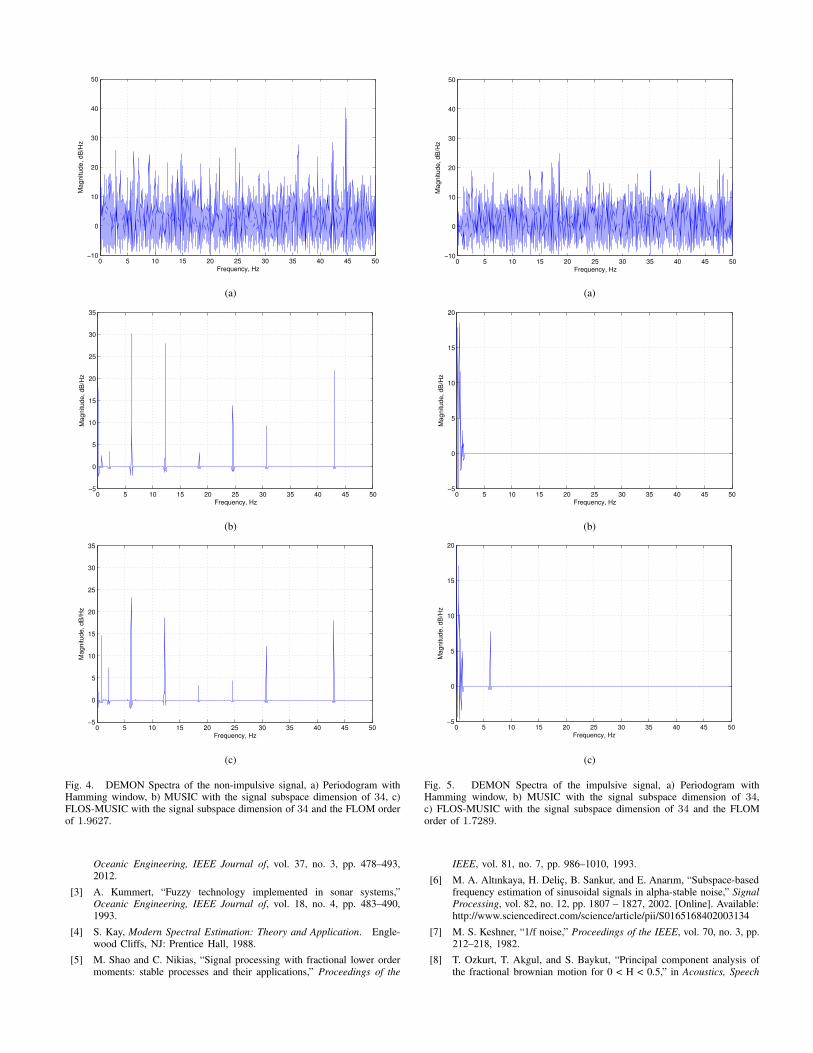
Estimated DEMON spectra of the non-impulsive data usingthe periodogram, MUSIC and FLOS-MUSIC can be seen inFig. 4. Since the periodogram is suitable to estimate broadbandor low dynamic range PSDs it fails to estimate the blade rate(BR) of the ship’s propeller or any of its harmonics sufficientlyas shown in Fig. 4(a). We can hardly observe the BR and afew harmonics which have very low detection SNRs. However,MUSIC and FLOS-MUSIC capture the narrow-band spectrawell as given in Fig. 4(b) and Fig. 4(c), respectively. SOS- andFLOS-based methods are comparable due to the fact that thesignal exhibits a Gaussian-like distribution with a characteristicexponent close to 2. Both of the methods estimated the BR at6.15 Hz and its five harmonics.
Superiority of the FLOS-MUSIC comes in the spectralestimation of the impulsive noise with a characteristic exponentα = 1.7289 given in Fig. 5. While the periodogram shownin Fig. 5(a) and MUSIC in Fig. 5(b) fail to estimate anycomponent of the spectra, FLOS-MUSIC succeeds to representthe BR at 6.15 Hz as shown in Fig. 5(c).
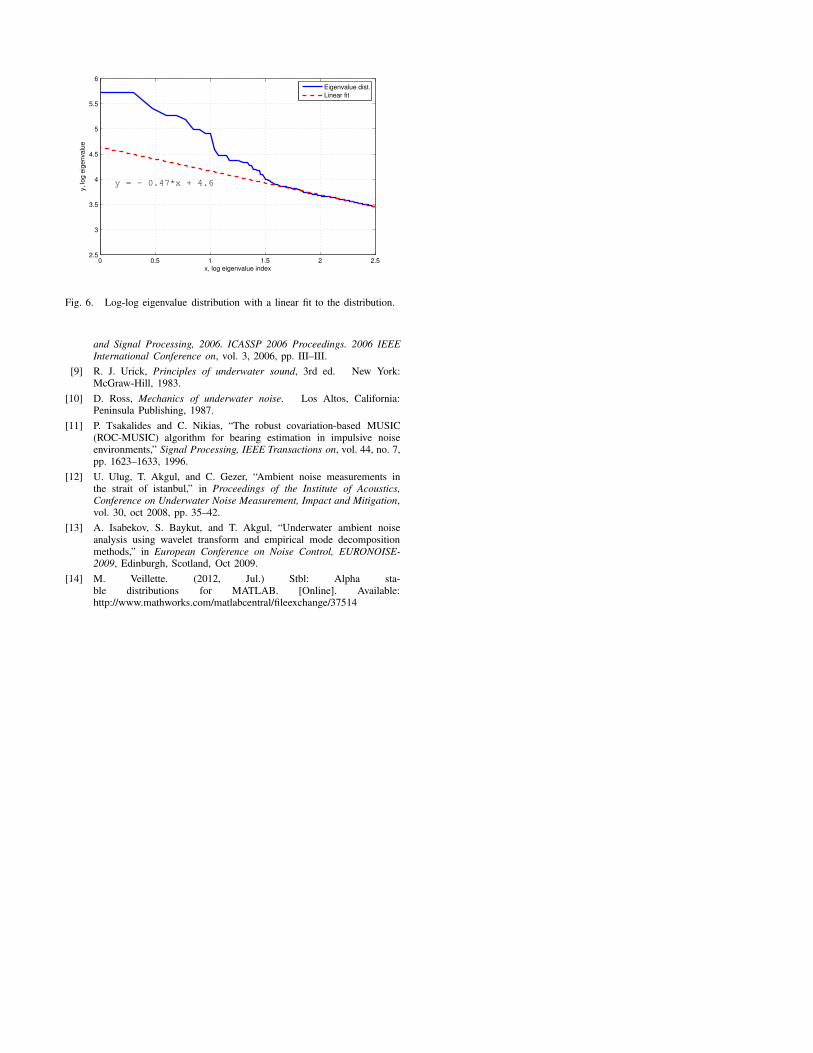
We have determined the signal subspace dimension inMUSIC-based methods empirically and obtained the best re-sults with a dimension between 30-40. One can observe similarresults in Fig. 6 presenting the eigenvalue distribution of thecovariance matrix where an approximately linear decreaseis seen after the 38th eigenvalue. This 1/f behavior mayimply that determining the signal subspace dimension can
0 10 20 30 40 50 60
−0.25
−0.2
−0.15
−0.1
−0.05
0
0.05
0.1
0.15
0.2
0.25
Time, sec
Am
plit
ud
e
(a)
0 10 20 30 40 50 60
−0.25
−0.2
−0.15
−0.1
−0.05
0
0.05
0.1
0.15
0.2
0.25
Time, sec
Am
plit
ud
e
(b)
Fig. 2. Time signals analyzed, a) Non-impulsive signal, b) Impulsive signal.
be accomplished by utilizing the eigenvalue distribution ofthe covariance matrix. Assuming the part of the eigenvaluedistribution with “lower energy” represents the noise subspacea line can be fit to this part of the distribution. The eigenvalueindex where the eigenvalue distribution is separable with thisline can be employed as a signal subspace dimension whichthen can be used in MUSIC.
VI. CONCLUSION
We have investigated the use of MUSIC and FLOS-MUSICin the spectral estimation of the cavitation related narrow-bandship radiated noise. It is clear that when the classical spectralestimation methods cannot answer to the narrow-band spectralestimation of the signals with low SNRs we can make use ofthe subspace based high resolution methods. We also concludethat exploiting the distribution of the impulsive signals andmodeling them as α-stable processes lets us use FLOS insteadof “almost compulsory” SOS. The sample ship noise studiedin this work exhibits an α-stable distribution which gives usmotivation to further investigate the stable properties of ship-radiated noise in general and come up with a well-definedprocess yielding to even better estimates. Finally we haveshown the 1/f -type behavior of the cavitation related narrow-band radiated noise of a sample ship which we have been ableto use for the determination of the signal subspace dimension.
−0.25 −0.2 −0.15 −0.1 −0.05 0 0.05 0.1 0.15 0.2 0.250
50
100
150
200
250
300
350
400
450
Value
Co
un
t
(a)
−0.25 −0.2 −0.15 −0.1 −0.05 0 0.05 0.1 0.15 0.2 0.250
50
100
150
200
250
300
350
400
450
Value
Co
un
t
(b)
−0.25 −0.2 −0.15 −0.1 −0.05 0 0.05 0.1 0.15 0.2 0.250
2
4
6
8
10
12
14
16
Value
pd
f
−0.2 −0.18 −0.16
0
0.02
0.04
0.06
0.08
Non−impulsive noise dist.
Impulsive noise dist.
α = 1.7289
β = 0.0815
γ = 0.0178
δ = 0.0002
α = 1.9627
β = 0.3361
γ = 0.0332
δ = −2.4055e−05
(c)
Fig. 3. Histograms of the signals with α-stable distribution fits, a) Histogramof the non-impulsive signal, b) Histogram of the impulsive signal, c) α-stabledistribution fits with the blue one being the fit to the impulsive signal.
Thus, second future work will be the investigation of the 1/f -type behavior of the ship radiated noise in general.
REFERENCES
[1] P. T. Arveson and D. J. Vendittis, “Radiated noise characteristics of amodern cargo ship,” The Journal of the Acoustical Society of America,vol. 107, p. 118, 2000.
[2] J. Antoni and D. Hanson, “Detection of surface ships from interceptionof cyclostationary signature with the cyclic modulation coherence,”
0 5 10 15 20 25 30 35 40 45 50−10
0
10
20
30
40
50
Frequency, Hz
Ma
gn
itu
de
, d
B/H
z
(a)
0 5 10 15 20 25 30 35 40 45 50−5
0
5
10
15
20
25
30
35
Frequency, Hz
Ma
gn
itu
de
, d
B/H
z
(b)
0 5 10 15 20 25 30 35 40 45 50−5
0
5
10
15
20
25
30
35
Frequency, Hz
Ma
gn
itu
de
, d
B/H
z
(c)
Fig. 4. DEMON Spectra of the non-impulsive signal, a) Periodogram withHamming window, b) MUSIC with the signal subspace dimension of 34, c)FLOS-MUSIC with the signal subspace dimension of 34 and the FLOM orderof 1.9627.
Oceanic Engineering, IEEE Journal of, vol. 37, no. 3, pp. 478–493,2012.
[3] A. Kummert, “Fuzzy technology implemented in sonar systems,”Oceanic Engineering, IEEE Journal of, vol. 18, no. 4, pp. 483–490,1993.
[4] S. Kay, Modern Spectral Estimation: Theory and Application. Engle-wood Cliffs, NJ: Prentice Hall, 1988.
[5] M. Shao and C. Nikias, “Signal processing with fractional lower ordermoments: stable processes and their applications,” Proceedings of the
0 5 10 15 20 25 30 35 40 45 50−10
0
10
20
30
40
50
Frequency, Hz
Ma
gn
itu
de
, d
B/H
z
(a)
0 5 10 15 20 25 30 35 40 45 50−5
0
5
10
15
20
Frequency, Hz
Ma
gn
itu
de
, d
B/H
z
(b)
0 5 10 15 20 25 30 35 40 45 50−5
0
5
10
15
20
Frequency, Hz
Ma
gn
itu
de
, d
B/H
z
(c)
Fig. 5. DEMON Spectra of the impulsive signal, a) Periodogram withHamming window, b) MUSIC with the signal subspace dimension of 34,c) FLOS-MUSIC with the signal subspace dimension of 34 and the FLOMorder of 1.7289.
IEEE, vol. 81, no. 7, pp. 986–1010, 1993.
[6] M. A. Altınkaya, H. Deliç, B. Sankur, and E. Anarım, “Subspace-basedfrequency estimation of sinusoidal signals in alpha-stable noise,” Signal
Processing, vol. 82, no. 12, pp. 1807 – 1827, 2002. [Online]. Available:http://www.sciencedirect.com/science/article/pii/S0165168402003134
[7] M. S. Keshner, “1/f noise,” Proceedings of the IEEE, vol. 70, no. 3, pp.212–218, 1982.
[8] T. Ozkurt, T. Akgul, and S. Baykut, “Principal component analysis ofthe fractional brownian motion for 0 < H < 0.5,” in Acoustics, Speech
0 0.5 1 1.5 2 2.52.5
3
3.5
4
4.5
5
5.5
6
x, log eigenvalue index
y,
log
eig
en
va
lue
y = − 0.47*x + 4.6
Eigenvalue dist.
Linear fit
Fig. 6. Log-log eigenvalue distribution with a linear fit to the distribution.
and Signal Processing, 2006. ICASSP 2006 Proceedings. 2006 IEEE
International Conference on, vol. 3, 2006, pp. III–III.
[9] R. J. Urick, Principles of underwater sound, 3rd ed. New York:McGraw-Hill, 1983.
[10] D. Ross, Mechanics of underwater noise. Los Altos, California:Peninsula Publishing, 1987.
[11] P. Tsakalides and C. Nikias, “The robust covariation-based MUSIC(ROC-MUSIC) algorithm for bearing estimation in impulsive noiseenvironments,” Signal Processing, IEEE Transactions on, vol. 44, no. 7,pp. 1623–1633, 1996.
[12] U. Ulug, T. Akgul, and C. Gezer, “Ambient noise measurements inthe strait of istanbul,” in Proceedings of the Institute of Acoustics,
Conference on Underwater Noise Measurement, Impact and Mitigation,vol. 30, oct 2008, pp. 35–42.
[13] A. Isabekov, S. Baykut, and T. Akgul, “Underwater ambient noiseanalysis using wavelet transform and empirical mode decompositionmethods,” in European Conference on Noise Control, EURONOISE-
2009, Edinburgh, Scotland, Oct 2009.
[14] M. Veillette. (2012, Jul.) Stbl: Alpha sta-ble distributions for MATLAB. [Online]. Available:http://www.mathworks.com/matlabcentral/fileexchange/37514