LASER NARROW GAP WELDING OF THICK SECTION ...
429
LASER NARROW GAP WELDING OF THICK SECTION DISSIMILAR METALS A thesis submitted to The University of Manchester for the degree of Doctor of Philosophy in the Faculty of Science and Engineering 2019 Timo Tapio Väistö School of Mechanical, Aerospace and Civil Engineering
-
Upload
khangminh22 -
Category
Documents
-
view
3 -
download
0
Transcript of LASER NARROW GAP WELDING OF THICK SECTION ...

LASER NARROW GAP WELDING OF
THICK SECTION DISSIMILAR
METALS
A thesis submitted to The University of Manchester for the degree of
Doctor of Philosophy in the Faculty of Science and Engineering
2019
Timo Tapio Väistö
School of Mechanical, Aerospace and Civil Engineering

2
Blank page

3
Table of Contents
List of Figures ........................................................................................ 11
List of Tables ......................................................................................... 25
List of Symbols ...................................................................................... 29
List of Abbreviations............................................................................. 30
Abstract .................................................................................................. 33
Declaration ............................................................................................. 34
Copyright Statement ............................................................................. 35
Acknowledgements ................................................................................ 36
1 Introduction ............................................................................... 37
1.1 Background .................................................................................................. 37
1.2 Primary Cooling Circuit Pressure Vessel Nozzles....................................... 38
1.3 Narrow Gap Laser Welding ......................................................................... 39
1.4 Research Motivation and Research Questions ............................................. 40
1.5 Aim and Objectives...................................................................................... 41
1.6 Structure of This Thesis ............................................................................... 43
2 Literature Review ..................................................................... 45
2.1 Pressurised Water Reactor (PWR) ............................................................... 45
2.1.1 Primary Cooling Circuit Environment (PCC).............................................. 46
2.1.1.1 Heat and Pressure ......................................................................................... 46
2.1.1.2 Corrosion...................................................................................................... 47
2.1.1.3 Other Considerations ................................................................................... 48
2.2 Narrow Gap Welding ................................................................................... 49
2.2.1 Filling strategies ........................................................................................... 52
2.3 Narrow Gap Laser Welding ......................................................................... 53

4
2.3.1 Challenges in NGLW ................................................................................... 58
2.3.2 Welding efficiency ........................................................................................ 58
2.3.3 Welding Parameters for Narrow Gap Laser Welding ................................... 58
2.3.4 Hot Wire Laser Welding (HWLW) .............................................................. 63
2.4 Present-day Solutions in Ferritic-Austenitic Dissimilar PWR PCC
Welding ......................................................................................................... 65
2.4.1 Dissimilar Welding Processes and Geometries Used in PWR Primary
Cooling Circuit Manufacturing ..................................................................... 67
2.4.2 Metals Used in PWR Primary Cooling Circuit Construction ....................... 72
2.4.2.1 Base Materials .............................................................................................. 73
2.4.2.2 Filler Metals .................................................................................................. 76
2.5 Considerations in Austenitic-Ferritic Dissimilar Metal Welding in PWR
Cooling Circuit ............................................................................................. 80
2.5.1 Corrosion ...................................................................................................... 81
2.5.2 Sensitisation of Austenitic Stainless Steel .................................................... 82
2.5.3 Residual Stresses .......................................................................................... 84
2.5.3.1 Types of Residual Stresses ........................................................................... 85
2.5.4 Environmentally Assisted Cracking and Stress Corrosion Cracking ........... 87
2.5.5 DMW Creep Failure in the HAZ of Low Alloy Steel .................................. 89
2.5.6 Radiation Damage ........................................................................................ 90
2.6 Dissimilar Metal Welding (DMW) ............................................................... 91
2.6.1 Phase Prediction of Austenitic Weld Metal .................................................. 92
2.6.2 Solidification Mechanisms in Dissimilar Metal Welding ............................ 93
2.6.3 The Heat Affected Zone ............................................................................... 95
2.6.3.1 Carbon Equivalent ........................................................................................ 98
2.7 Weldability of Alloy 52 Filler Metal ............................................................ 99
2.7.1 Solidification Cracking ............................................................................... 101
2.7.2 Ductility Dip Cracking ............................................................................... 105

5
2.7.3 Liquation Cracking .................................................................................... 107
2.8 Laser Welding of Dissimilar Materials ...................................................... 109
2.8.1 HAZ in Laser Welding............................................................................... 112
2.8.2 Laser Welding Parameters ......................................................................... 115
2.8.3 Laser Welding With Filler Material ........................................................... 116
2.9 Testing of Weldments ................................................................................ 119
2.9.1 Destructive Testing .................................................................................... 119
2.9.2 Non-Destructive Testing ............................................................................ 122
2.9.2.1 Visual Testing ............................................................................................ 122
2.9.2.2 Radiographic Testing ................................................................................. 123
2.9.3 Measurement of Residual Stresses and the Contour Method .................... 124
2.10 Standards for evaluation of welds in nuclear applications......................... 129
2.11 Summary of the Literature Review and Rationale for the Current Work .. 136
2.11.1 Knowledge gaps ......................................................................................... 139
3 Materials, Methods and Equipment ..................................... 141
3.1 Welding Programme Stages ....................................................................... 141
3.2 Materials .................................................................................................... 142
3.2.1 Stage I – Similar Metal Welding in Stainless Steel ................................... 142
3.2.2 Stage II – Dissimilar Metal Welding with Mild Steel ............................... 143
3.2.3 Stage III - Dissimilar Metal Welding with Pedigree Steel ........................ 144
3.3 Sample Geometry....................................................................................... 145
3.4 Welding Groove Design ............................................................................ 146
3.5 Welding Parameters ................................................................................... 149
3.6 Welding Setup ............................................................................................ 151
3.6.1 Laser and Robot Used ................................................................................ 151
3.7 Development of the Equipment and Procedures ........................................ 152
3.7.1 Welding Restraint ...................................................................................... 153

6
3.7.2 Wire Feed Arrangement ............................................................................. 157
3.7.3 Shielding Gas Setup .................................................................................... 164
3.7.4 Welding Procedure Development ............................................................... 169
3.7.5 Alignment of the Weld and Equipment ...................................................... 170
3.8 Monitoring of the Welding Process ............................................................ 171
3.8.1 Interpass Temperature Measurement .......................................................... 172
3.8.2 Measurement of Welding Distortions ......................................................... 172
3.8.3 Laser Illumination Imaging ........................................................................ 175
3.9 Measurement Uncertainties ........................................................................ 180
3.9.1 Laser Power ................................................................................................ 180
3.9.2 Spot Size Control ........................................................................................ 182
3.9.3 Accuracy of Welding Consumable Feed .................................................... 182
3.9.4 Welding Robot Accuracy ........................................................................... 183
3.9.5 Accuracy of the Alignment of the Welds ................................................... 183
3.9.6 Welding Groove Dimensional Accuracy .................................................... 183
3.9.7 Accuracy of the Distortion Measurements ................................................. 183
3.9.8 Summary ..................................................................................................... 184
3.10 Analysis Methods for the Weldments ......................................................... 184
3.10.1 X-ray Radiography and Acceptance ........................................................... 185
3.10.2 Microstructural Analysis and Triple Etching ............................................. 185
3.10.3 Hardness Mapping and Hardness Line Scanning ....................................... 187
3.10.4 Contour Method Residual Stress Measurement Procedure ........................ 189
3.10.5 Tensile Testing ............................................................................................ 197
3.10.6 Digital Image Correlation ........................................................................... 198
3.10.7 Charpy-V Impact Toughness Analysis ....................................................... 199

7
4 Thick Section Narrow Gap Laser Welding of 316L
Stainless Steel .......................................................................... 201
4.1 Introduction ................................................................................................ 201
4.1.1 Expectations ............................................................................................... 203
4.2 Materials .................................................................................................... 204
4.3 Experimental Work and Results ................................................................ 204
4.3.1 Experiments 1-3 ......................................................................................... 205
4.3.2 Experiment 4 .............................................................................................. 207
4.3.3 Experiment 5 .............................................................................................. 209
4.3.4 Experiment 6 .............................................................................................. 211
4.4 Discussion .................................................................................................. 216
4.4.1 Welding Restraint, Welding Distortions and Groove Design .................... 216
4.4.2 Gas Shielding ............................................................................................. 218
4.4.3 Wire Feeding .............................................................................................. 219
4.4.4 Laser Illumination Imaging........................................................................ 221
4.4.5 Pre-Heating and Interpass Temperature Control ....................................... 222
4.5 Conclusions ................................................................................................ 223
5 Thick Section Narrow Gap Laser Welding of Dissimilar
Metals S275 and AISI 316L ................................................... 225
5.1 Introduction ................................................................................................ 225
5.1.1 Expectations ............................................................................................... 227
5.2 Materials and Experimental Methods ........................................................ 228
5.2.1 Materials .................................................................................................... 229
5.2.2 Weld Setup and Parameters ....................................................................... 229
5.3 Experimental Work .................................................................................... 231
5.3.1 Experiments 1-3 ......................................................................................... 231
5.3.2 Experiments 4 and 5................................................................................... 234
5.4 Analysis of Process Characteristics ........................................................... 240

8
5.4.1 Weld Pool Behaviour Analysis ................................................................... 240
5.4.2 Symmetry of the Weld Bead ....................................................................... 244
5.4.3 Welding Distortion Analysis ...................................................................... 245
5.5 Analysis of Weldments ............................................................................... 249
5.5.1 Radiographical Analysis of Welding Flaws and ASME IX Acceptance ... 249
5.5.2 Hardness Mapping ...................................................................................... 250
5.5.3 Hardness Line Scan Measurements ............................................................ 253
5.5.4 Microstructural Analysis ............................................................................ 257
5.5.5 EDX Dilution Analysis ............................................................................... 260
5.6 Discussion ................................................................................................... 263
5.7 Conclusions................................................................................................. 267
6 Thick Section Narrow Gap Laser Welding of Dissimilar
Metals SA508 Gr3 Cl2 and 316L ........................................... 271
6.1 Introduction ................................................................................................. 271
6.1.1 Expectations ................................................................................................ 272
6.2 Materials and Experimental Methods ......................................................... 274
6.2.1 Materials ..................................................................................................... 274
6.2.2 Experimental Setup and Welding Parameters ............................................ 274
6.3 Experimental Work and Results ................................................................. 277
6.3.1 Experiment 1 ............................................................................................... 278
6.3.2 Experiment 2 ............................................................................................... 279
6.3.3 Experiment 3 ............................................................................................... 282
6.3.4 Experiment 4 ............................................................................................... 285
6.3.5 Experiment 5 ............................................................................................... 287
6.3.6 Experiment 6 ............................................................................................... 290
6.3.7 Experiment 7 ............................................................................................... 291
6.3.8 Experiment 8 ............................................................................................... 293

9
6.4 Analysis of Process Characteristics ........................................................... 295
6.4.1 Welding Process Monitoring ..................................................................... 295
6.4.2 Mechanical Distortion Measurements ....................................................... 297
6.4.3 Effect of Remelting .................................................................................... 299
6.4.4 Temperature Distribution ........................................................................... 300
6.5 Analysis of Weldments .............................................................................. 301
6.5.1 Radiographical Analysis and ASME IX Acceptance ................................ 302
6.5.2 Macrographical Analysis ........................................................................... 303
6.5.2.1 SA2 ............................................................................................................ 304
6.5.2.2 SA5 ............................................................................................................ 310
6.5.3 Hardness Evaluation .................................................................................. 312
6.5.4 Microstructural Analysis ............................................................................ 317
6.5.5 Residual Stress Analysis ............................................................................ 335
6.5.6 Longitudinal Tensile Strength Analysis..................................................... 339
6.5.7 Composite Tensile Analysis ...................................................................... 346
6.5.8 Digital Image Correlation Analysis ........................................................... 350
6.5.9 Impact Toughness Analysis of SA508 Base Material ............................... 352
6.5.10 Impact Toughness Analysis of SA508 Heat Affected Zone ...................... 359
6.6 Discussion .................................................................................................. 367
6.7 Conclusions ................................................................................................ 372
7 General Discussion on Dissimilar Metal NGLW ................. 375
7.1 Introduction ................................................................................................ 375
7.2 Process Characteristics............................................................................... 375
7.3 Geometrical Tolerances ............................................................................. 376
7.4 Oxidation of the Weld Metal ..................................................................... 377
7.4.1 Remedies for Oxidation Issues .................................................................. 378
7.5 Undercutting of Stainless Steel .................................................................. 378
10
7.6 Mechanisms Leading to Formation of Lack of Fusion ............................... 381
7.6.1 LoF Due to Oxidation ................................................................................. 381
7.6.2 LoF Due to Undercut .................................................................................. 384
7.6.3 Interpass LoF .............................................................................................. 386
7.6.4 Location of Lack of Fusion ......................................................................... 387
7.7 Laser Beam Reflections from the Weld Pool Surface ................................ 388
7.8 Alignment of the Filler Wire ...................................................................... 391
8 Conclusions .............................................................................. 395
8.1 Introduction ................................................................................................. 395
8.2 Conclusions................................................................................................. 395
8.3 Process Characteristics ............................................................................... 397
9 Future Work ............................................................................ 401
10 Publications ............................................................................. 403
11 References ................................................................................ 405
12 Appendices ............................................................................... 416
64820 words
11
List of Figures
Fig. 1.1 Geometry of a full-size mock-up of an RPV safe-end nozzle weld
[12] .......................................................................................................... 38
Fig. 1.2 Main process steps for Laser Multi-Pass Narrow Gap welding [21] ...... 40
Fig. 2.1 Pressurised water reactor. Primary cooling circuit in red, secondary
cooling circuit in blue. U.S. NRC [28] .................................................... 46
Fig. 2.2 Boron and Lithium chemistry control regimes in PWR [32]. ................. 48
Fig. 2.3 Comparison of conventional V-groove to a typical NG J-groove
weld preparation ...................................................................................... 49
Fig. 2.4 Cross sections of ultra-NGLW and conventional GTA welds of
20 mm thick stainless steel [35] .............................................................. 50
Fig. 2.5 Comparison of traditional groove cross-sectional areas to narrow
gap welding in arc welding. Modified from [37] .................................... 50
Fig. 2.6 Three backing support strategies, one permanent and two
removable designs [36] ........................................................................... 52
Fig. 2.7 Principle of NGLW according to Katayama 2013 [41] .......................... 53
Fig. 2.8 Comparison of narrow gap welding geometries and typical groove
dimensions, root support not shown ........................................................ 54
Fig. 2.9 Defocused laser beam in an NGLW groove............................................ 56
Fig. 2.10 The basic groove geometry used by Jokinen and a photograph of an
acceptable root pass. Different groove angles and material
thicknesses were experimented. [17]. ..................................................... 56
Fig. 2.11 Groove geometry for narrow gap welding of 50 mm 316L [20] ............ 61
Fig. 2.12 Experimental setup used by Zhang et al. 2011 [20] ................................ 62
Fig. 2.13 Schematic diagram of NGLW of 17 mm LAS [18] (V1:α=6.74º,
b=4, c=6;V2:α=3.25º, b=2.8, c=5; V3:α=2.3º, b=2.4, c=5) .................... 63
Fig. 2.14 Photo of CRDM (a) and schematic diagram of CRDM assembly (b)
[57]. ......................................................................................................... 66
Fig. 2.15 Typical locations of dissimilar welds in a PWR [13].............................. 67
Fig. 2.16 Geometry and dimensions of Westinghouse AP1000 PWR RPV
safe-end dissimilar metal weld. A – SA508 ferritic steel, B – Alloy
12
82 buttering, C – Alloy 182 weld, D- 316L austenitic SS. Note the
cladding of RPV with SS [14].................................................................. 69
Fig. 2.17 Steam generator dissimilar metal weld design [60] ................................. 71
Fig. 2.18 Different pressuriser nozzle dissimilar welds before and after a
repair [60] ................................................................................................. 71
Fig. 2.19 Pressuriser surge line nozzle design and dimensions [61] ....................... 72
Fig. 2.20 Outline of PWR components and materials [66]. .................................... 73
Fig. 2.21 Intergranular corrosion in HAZ of 304 SS containing 0.05 % C
[98]. .......................................................................................................... 82
Fig. 2.22 The effect of carbon content on carbide precipitation [91] ...................... 83
Fig. 2.23 Examples of different types of residual macro- and micro-residual
stress [99] ................................................................................................. 85
Fig. 2.24 Schematic representation of changes of temperature and
longitudinal thermal residual stresses during bead-on-plate welding
[99] ........................................................................................................... 86
Fig. 2.25 Comparison of the average life of dissimilar welds, Type 309
austenitic steel = 1. FM82 both high (H) and low (L) heat input
welds are included [75]. ........................................................................... 90
Fig. 2.26 Schaeffler diagram showing the reduction in the extent of the
ferrite/austenite region for high cooling rate processes [116] .................. 92
Fig. 2.27 WRC-1992 diagram for predicting ferrite content and solidification
mode [98] ................................................................................................. 93
Fig. 2.28 “Normal” grain growth with Type I grain boundaries and the grain
growth exhibiting Type II boundaries in a dissimilar metal weld
[98] ........................................................................................................... 94
Fig. 2.29 Dissimilar metal fusion line and the formation mechanism of Type
II boundaries [75] ..................................................................................... 95
Fig. 2.30 A diagram of the zones in the HAZ of a 0.15 wt.% C steel [119] ........... 96
Fig. 2.31 Another classification of the low alloy steel HAZ subzones [120]. ........ 96
Fig. 2.32 Boundaries developing in austenitic weld metals [75] .......................... 101
Fig. 2.33 Migrated grain boundary (MGB), Solidification grain boundary
(SGB) and Solidification subgrain boundaries (SSGB) in austenitic
Filler Metal 52 weld metal [75]. ............................................................ 102
13
Fig. 2.34 Examples of weld solidification cracking in Filler Metal 52M
(ERNiCrFe -7A) dissimilar weld overlays on a) carbon steel A36,
and b) stainless steel Type 304L [75].................................................... 103
Fig. 2.35 Hot cracking propagated to the surface of narrow groove laser
hybrid welding of AISI 316L-IG (ITER-grade) using Thermanit
19/15 filler [130] ................................................................................... 104
Fig. 2.36 Ductility as a function of temperature and ductility dip [75] ................ 106
Fig. 2.37 DDC in multi-pass weld using Filler Metal 52. Arrows showing
severe DDC and recrystallization along migrated grain boundaries
[75] ........................................................................................................ 107
Fig. 2.38 The principle of liquation cracking [98] ............................................... 108
Fig. 2.39 Weld metal contraction tearing PMZ of 7075 aluminium welded
with filler 1100 [134] ............................................................................ 108
Fig. 2.40 Sketch of critical locations in the ferritic/austenitic laser welds
[148] ...................................................................................................... 110
Fig. 2.41 HAZ of GTA weld of AISI 1018 steel [98] ......................................... 113
Fig. 2.42 HAZ microstructure of 1018 steel by a high-power CO2 laser.
Magnification of (A)–(D) 415x and of (E) 65x. B, High carbon
martensite [98]....................................................................................... 114
Fig. 2.43 The parameters of laser welding with filler wire [154]. ........................ 117
Fig. 2.44 Engineering stress-strain diagram [157] ............................................... 120
Fig. 2.45 Ductile to brittle transition region. Energy shelves and fracture
descriptions [158]. ................................................................................. 121
Fig. 2.46 Schematic indicative of the approximate current capabilities of
various techniques. Destructive techniques shaded grey [163]............. 127
Fig. 2.47 The intact sample with original stresses [166] ...................................... 128
Fig. 2.48 The cut sample with deformation induced by the residual stresses
[166] ...................................................................................................... 128
Fig. 2.49 The analytically flattened surface with residual stress map [166] ........ 128
Fig. 2.50 Appendix I of ASME IX defining the acceptable appearance of
rounded radiographic indications [176] ................................................ 131
Fig. 2.51 Example of BS EN ISO 13919-1. The maximum height of undercut... 132
Fig. 2.52 Charpy V-notch impact toughness sample according to BS EN ISO
148 ......................................................................................................... 132

14
Fig. 2.53 Example of an impact test curve ............................................................ 133
Fig. 2.54 Principle of the Vickers hardness test .................................................... 134
Fig. 2.55 ASTM E8 rectangular tensile test sample [182] ........................................ 135
Fig. 2.56 Stress-strain diagram [182] .................................................................... 136
Fig. 3.1 Dimensions and design of NGLW samples. .......................................... 146
Fig. 3.2 5 mm parallel groove contraction, TV4 ................................................. 147
Fig. 3.3 The 4° V-groove design for countering groove contraction .................. 148
Fig. 3.4 The laser welding setup during wire feeder nozzle prototype trials ...... 152
Fig. 3.5 Sample TV1 restrained by one pair of Carver buttress clamps.............. 154
Fig. 3.6 Strongback welding arrangement for TV4. Note copper shielding
gas nozzles on the table and separate brackets to contain the gas
atmosphere for the last passes. ............................................................... 155
Fig. 3.7 Strongback welding restraint arrangement for TV4 viewed from
below. Note the machined slot to accommodate the backing plate
and the extensive manual GTAW-welding required.............................. 156
Fig. 3.8 42 kN Lenskes welding clamps restraining a dissimilar metal weld
sample DS4 on an 80 mm thick Lenskes T-groove steel welding
table. Note the location of the clamping points near the edges of the
sample, the pre-heating blankets and run-in and run-out blocks to
guide the shielding gas. .......................................................................... 157
Fig. 3.9 TecArc F4 wire feeder and the wire conduit (red). ................................ 158
Fig. 3.10 Jetline Engineering 9600 wire feeder unit mounted on top of the
robot ....................................................................................................... 159
Fig. 3.11 Jetline engineering 9600 wire feeder control unit .................................. 159
Fig. 3.12 Two examples of different experimental wire feeder versions. A) A
simple feeder pipe attached to the welding head (arrow) and B) the
MTRL NGLW nozzle which was used in welding the TV-series
stainless steel tests .................................................................................. 161
Fig. 3.13 Final wire feeder nozzle bracket (silver) and 300 mm stage (black)
used ........................................................................................................ 162
Fig. 3.14 The improved 5 mm diameter wire feed nozzle .................................... 164
Fig. 3.15 Different gas shoe designs. A) A version constructed for first trials.
B) A proposed design to alleviate dust accumulation issues. ................ 165
Fig. 3.16 Blade shielding gas and wire feed design .............................................. 166

15
Fig. 3.17 Shielding gas setup used during welding of TV4 set up with
stationary nozzles aided by steel blocks to guide the gas flow. The
nozzles were raised according to the progression of the weld. ............. 167
Fig. 3.18 Final gas shielding and wire feed setup ................................................ 169
Fig. 3.19 Cross-hairs aligned to the centre of the laser spot seen during a trial
weld 1) Top of base materials, 2) Welding groove sidewalls, 3)
Backing plate. ........................................................................................ 171
Fig. 3.20 Measurement of the pre-heat and interpass temperature ....................... 172
Fig. 3.21 Punch mark locations for indirect distortion measurements ................. 173
Fig. 3.22 Conducting the indirect gap measurement between punch marks. ....... 174
Fig. 3.23 200 measurement line pairs for butterfly analysis on a 3D scanned
model of sample TV4. Note the omitted central area to avoid the
effect of local deformation near the weld.............................................. 175
Fig. 3.24 Laser illumination imaging setup on the welding head.
Experimental LED light source pictured, Cavilux laser aperture
unit similar in size ................................................................................. 177
Fig. 3.25 A frame from Laser illumination imaging video. 3rd
pass of test
DS1. 1) Top of the stainless steel plate, 2) Top of the ferritic steel
plate, 3) Weld bead, 34 mm below the previous, 4) Wire feed
nozzle and 5) welding groove side wall (dark area). ............................. 178
Fig. 3.26 A frame from the coaxial camera system video. 1st pass of test
SA5. 1) Welding groove sidewalls, 2) Filler wire and 3) wetting of
the sidewall ............................................................................................ 179
Fig. 3.27Laser power calibration chart .................................................................... 181
Fig. 3.28 Typical sample for microstructural and hardness analysis, thickness
varying from 2 mm to 10 mm ............................................................... 186
Fig. 3.29 High level overview of contour method analysis .................................. 190
Fig. 3.30 Contour cutting jig lower half. Top beams removed to reveal the
individually adjustable pads which ensure restrainment avoiding
inducing external stresses. The cut was performed between the
beams along the line drawn in red. ........................................................ 192
Fig. 3.31 Contour cut sample, cross-sectional view. Contour cut made first,
with ligaments in place to support the sample. ..................................... 193
Fig. 3.32 Sample of SA5 mounted to a jig undergoing the contour scanning ...... 193
Fig. 3.33 Profilometry raw data example, (µm) ................................................... 194

16
Fig. 3.34 Averaged data with some residual noise, not in scale ............................ 194
Fig. 3.35 Profile outline silhouette spline with seeds (circles) for mesh
generation ............................................................................................... 195
Fig. 3.36 Finite element mesh (left) and the 3D extrusion (single material
sample shown)........................................................................................ 196
Fig. 3.37 Contour method residual stress map plotted using dense knot
spacing ................................................................................................... 196
Fig. 3.38 Contour method residual stress map plotted using less dense knot
spacing ................................................................................................... 196
Fig. 3.39 Tensile test sample ASTM E8/E8M. Longitudinal and composite
similar..................................................................................................... 197
Fig. 3.40 DIC setup for tensile testing. 1) cameras, 2) flashlights and 3)
tensile test sample. ................................................................................. 198
Fig. 3.41 Tensile test samples used for DIC by spraying a speckle pattern .......... 199
Fig. 3.42 Charpy-V impact toughness test coupon as per ASTM E23 and ISO
148-1 ...................................................................................................... 199
Fig. 4.1 Cross-section of TV1 showing a successful weld with no fusion
issues and good penetration to the backing plate ................................... 207
Fig. 4.2 Cross-section of TV2 showing asymmetry and poor capping due to
misalignment of the sample. .................................................................. 207
Fig. 4.3 Average groove width per pass, measured directly between the top
corners of the welding groove, TV4. ..................................................... 209
Fig. 4.4 Macrographical cross-section showing no issues with fusion, cracks
or porosity TV5. ..................................................................................... 210
Fig. 4.5 A LII video frame, showing wire, nozzle and the welding pool.
Note the stable welding process. Stainless steel similar metal weld
TV5 ........................................................................................................ 210
Fig. 4.6 The generation of butterfly distortion, 3D scan data analysis, test
TV6 ........................................................................................................ 211
Fig. 4.7 Groove top contraction development of a 5° V-groove 40 mm thick
316L similar metal weld. See the minimum staying over 5 mm.
Direct measurement was not applicable for last 2 passes due to
melting of the groove top edges, test TV6. ............................................ 213
17
Fig. 4.8 Laser Illumination Image of pass 1 in a similar metal NGLW. 1)
Uneven wetting of side walls due to too small spot size, oxidation
of weld bead, 2) Wire nozzle melting due to reflected laser beam,
3) Wire contamination by particles of nozzle and vibration (in
video material), 4) Smoke generation due to excess laser power ......... 221
Fig. 4.9 12th
pass of a similar metal NGLW. 1) Good smooth fusion, 2) Gap
contracting excessively, laser beam heats the corners of the groove
prematurely, 3) Wire alignment off-centre and 4) Accumulated
oxides floating on top of the melt pool ................................................. 221
Fig. 5.1 Initial 4° welding groove design for S275 dissimilar metal welds ....... 230
Fig. 5.2 Experimental setup for a DMW aligned for the first pass. 1) Laser
head, 2) coaxial wire feeding and shielding gas nozzle, 3)
stationary shielding gas nozzle, 4) welding clamps and 5) high-
speed camera lens. Laser illumination laser is just outside the
picture on right. ..................................................................................... 231
Fig. 5.3 DS1 dual etched with Nital and oxalic acid. The hardness mapping
indentations also visible ........................................................................ 232
Fig. 5.4 The nozzle with added trailing nozzles as used for DS4....................... 235
Fig. 5.5 19th
pass of DS4, note undercutting at 130-170 mm. ............................ 237
Fig. 5.6 Close-up of undercut at 19th
pass of DS4, note lack of fusion to the
stainless steel (arrows) .......................................................................... 237
Fig. 5.7 Finished weld DS4. Note the mainly good fusion due to two
parallel capping passes. ......................................................................... 237
Fig. 5.8 First pass of DS5. Note smooth, symmetrical wetting, oxidation and no
irregularities .......................................................................................... 239
Fig. 5.9 Close-up of the 8th
pass of DS5. Note unacceptable irregular oxidation
and wetting. ........................................................................................... 239
Fig. 5.10 The finished weld DS5 prior to wire brushing. ..................................... 240
Fig. 5.11 Laser illumination imaging image, note the absence of glare. DS2,
second pass. ........................................................................................... 241
Fig. 5.12 Formation of lack of fusion / inadequate wetting (arrow) and
oxidation of the weld bead viewed by laser illumination imaging ....... 242
Fig. 5.13 Coaxial camera ambient light image. DS4, first pass. .......................... 243
Fig. 5.14 DS4 second pass pictured from the end of the welding groove. Note
the level surface of the bead with no inclination to either metal and
the sharp corners instead of smooth wetting. ........................................ 245

18
Fig. 5.15 Welding groove contraction measured directly and calculated from
indirect measurements. Test DS2. Error bars represent min and
max values measured. ............................................................................ 246
Fig. 5.16 Welding groove top width of DS series of welds using 4° V-
groove. Note the groove contracting to below 5 mm. Average of
three tests, DS1-DS3. Error bars represent min and max values
measured. ............................................................................................... 247
Fig. 5.17 Welding groove top width of DS series of welds using 5° V-
groove. Note the groove width staying above 5 mm until the end.
Average of tests DS4 and DS5. Error bars represent min and max
values measured. .................................................................................... 248
Fig. 5.18 Hardness map of DS1. 69 (HV1) S275 left, FM52 middle, 316L
right. Fusion lines in red. A main observation is the strain
hardening of the austenitic materials. .................................................... 251
Fig. 5.19 Hardness map of DS1 69 (HV0.3. Approximate fusion lines in red.
Note the narrow area of high hardness at the S275 FL. ......................... 252
Fig. 5.20 Hardness line plot across the weld, second to top pass. Note the
narrow area of high hardness in S275. Fusion lines marked on the
graph. Sample DS1 69. .......................................................................... 254
Fig. 5.21 Hardness test grid and locations. Note top bead being considerably
wider than previous passes to ensure smooth capping. Sample DS2
116. ......................................................................................................... 255
Fig. 5.22 Hardness of S275 HAZ at different states of multipass tempering........ 256
Fig. 5.23 Hardness of the S275 HAZ. Close up near the fusion line. ................... 257
Fig. 5.24 S275 HAZ of a tempered filling pass, BM-tempered-ICHAZ-
FGHAZ-CGHAZ-WM........................................................................... 257
Fig. 5.25 Unaffected S275 base material .............................................................. 258
Fig. 5.26 Grain structure at a tempered filling pass .............................................. 258
Fig. 5.27 Untempered CGHAZ at the top pass ..................................................... 259
Fig. 5.28 DS1 weld metal microstructures ............................................................ 259
Fig. 5.29 S275 HAZ banding due to multi-pass tempering................................... 260
Fig. 5.30 EDX line plot of the weld metal and fusion lines. Note the rapid
transition from ferritic BM to WM composition ................................... 261
Fig. 5.31 EDX line plot for top bead at the S275 fusion line. The transition in
the composition is prompt. ..................................................................... 262

19
Fig. 5.32 EDX line plot for top bead at the 316L fusion line. .............................. 263
Fig. 6.1 Experimental setup for SA1 pedigree metal weld. Thermocoupling,
stationary gas shielding arrangement, pre-heating blankets and
Lenskes clamps. .................................................................................... 275
Fig. 6.2 First application of the commercial wire nozzle holder, as used for
SA1. ....................................................................................................... 276
Fig. 6.3 Wire feed setup with a linear stage for height adjustment and tri-
blade gas nozzle arrangement. As used from SA2 onwards. ................ 277
Fig. 6.4 The welding setup for SA1. SA508 LAS nearer the camera. ............... 278
Fig. 6.5 The gas and wire nozzle used for SA2 .................................................. 280
Fig. 6.6 SA2 first pass. The smooth wetting, symmetrical concave bead
shape and good gas shielding were characteristic for the first passes
of all Stage III welds. A and B are separate blocks to guide the
shielding gas. ......................................................................................... 282
Fig. 6.7 The welding setup for SA3 with welded run in and –out brackets.
Welding direction down. Stainless steel on the left. ............................. 283
Fig. 6.8 3rd
pass of SA3. Note the oxide-free weld extending to the run on
bracket at start. ...................................................................................... 283
Fig. 6.9 Smooth capping of SA4 with just some minor lack of fusion type
defects.................................................................................................... 287
Fig. 6.10 Symmetrical capping of SA4. ............................................................... 287
Fig. 6.11 First pass of SA5. Smooth wetting and bead surface with low
oxidation. ............................................................................................... 289
Fig. 6.12 12th
pass of SA5. Weld quality very similar to pass 1. Slight
colouration of the SA508 surface due to heating starting to appear. .... 289
Fig. 6.13 Finished weld SA5 uncleaned, as welded. Note lack of oxidation. .......... 289
Fig. 6.14 SA6, 11th
pass, low oxidation, smooth bead and good wetting of the
sidewalls ................................................................................................ 291
Fig. 6.15 Finished weld SA6. Minor underfilling (arrow) ................................... 291
Fig. 6.16 Collapse of the sidewall (arrow) SA7, 19th
pass. .................................. 293
Fig. 6.17 SA7 finished, with fusion flaws. ........................................................... 293
Fig. 6.18 A depression in the 14th
pass, SA8. ....................................................... 295
Fig. 6.19 SA1, first pass. LII snapshot. Good wetting and alignment.
Excessive oxidation. .............................................................................. 296
20
Fig. 6.20 SA1 13th
pass. LII snapshot. Groove contracting excessively, laser
beam melting the stainless steel prematurely, very severe oxidation. ... 296
Fig. 6.21 Welding groove top width of SA1 using 4° V-groove. Note gap
contracting below 5 mm. Error bars represent min and max values
measured. ............................................................................................... 298
Fig. 6.22 Welding groove top width of SA series using 5° V-groove. Note
gap remaining over 5 mm until the end of the weld. Average of 6
tests. Error bars represent min and max values measured. .................... 299
Fig. 6.23 2nd
pass SA7, poor wetting and fusion of the first 75 mm, see
arrow. ..................................................................................................... 300
Fig. 6.24 3rd
pass SA7, a re-melt applied to the previous pass has reduced the
length of the poorly fused area by 50 %, see arrow. .............................. 300
Fig. 6.25 Thermocoupling of SA1, top side. Bottom similar. ............................... 301
Fig. 6.26 Photomontage of Nital (for SA508) and ammonium persulfate
(FM52) etched weld cross-section. Sample SA5 161. ........................... 304
Fig. 6.27 Cross-section of an ASME IX rejected dissimilar metal weld
showing various fusion defects. Nital etch. 316L fusion line
superimposed as dotted line. Sample SA2 98 ........................................ 307
Fig. 6.28 Cross-section of an ASME IX accepted dissimilar metal weld
showing near-perfect fusion. Nital etch. Fusion line superimposed
in red. Sample SA5 161 ......................................................................... 311
Fig. 6.29 Hardness map of SA5 157. SA508 on the left, FM52 middle and
316L right. Approximate fusion line in red. (HV 0.3) ........................... 313
Fig. 6.30 Detail of the high hardness HAZ in SA508. Test point grid 200 x
200 µm. Sample SA5 157 ...................................................................... 315
Fig. 6.31 Hardness map with an alternate scale to emphasize strain
hardening. Sample SA5 157................................................................... 316
Fig. 6.32 Outline of top of the weld SA5. ............................................................. 317
Fig. 6.33 SA508 Base material, tempered martensite (light). Carbon
precipitated as cementite particles (grey) austenite grain boundaries
(dark), SA5 159 Nital etch. .................................................................... 318
Fig. 6.34 Martensitic (dark) HAZ with bainite (light) adjacent to FL of the
top pass, SA5 159 Nital etch. ................................................................. 319
Fig. 6.35 Martensitic/bainitic structure at the area of highest hardness,
200 µm perpendicular) from FL, top pass, SA5 159 Nital etch. ............ 319
21
Fig. 6.36 Transition from CGHAZ (right) to FGHAZ (left), approx. 1 mm
from FL, top pass, SA5 159 Nital etch. ................................................. 320
Fig. 6.37 FGHAZ, approx. 1.5 mm from FL top pass, SA5 159 Nital etch. ........ 321
Fig. 6.38 ICHAZ, approx. 2 mm from FL, top pass, SA5 159 Nital etch. ........... 321
Fig. 6.39 Vertical stitched image of SA508 HAZ. SA5 159 Nital etch. .............. 322
Fig. 6.40 Multi-pass tempered CGHAZ, 7th
to last pass, 15 mm from top,
SA5 161 Nital etch. ............................................................................... 323
Fig. 6.41 Austenitic weld metal at 316L FL. 1) SSGB and 2) SGB. SA5 161
Ammonium persulfate etch. .................................................................. 324
Fig. 6.42 Austenitic weld metal at 316L. 1) SSGB, 2) SGB and 3) MGB.
SA5 161 Ammonium persulfate etch. ................................................... 325
Fig. 6.43 FM52 weld metal at SA508 FL. 1) SSGB, 2) MGB and 3)
martensitic region. SA5 161 Ammonium persulfate etch. .................... 325
Fig. 6.44 Suspected DDC (arrow) at MGB near 316L fusion line. SA5 161
Ammonium persulfate etch. .................................................................. 327
Fig. 6.45 Suspected DDC in weld metal near SA508 fusion line with possible
recrystallization (arrow) SA5 161 Ammonium persulfate etch. ........... 328
Fig. 6.46 SA508 sidewall LoF at 2nd
to last pass. SA5 159 Nital etch. ................ 329
Fig. 6.47 Interpass LoF in weld metal at pass no 18, SA5 161 Ammonium
persulfate etch. ...................................................................................... 329
Fig. 6.48 Pore near fusion boundary of SA508. Note over-etched SA508.
SA5 161 Ammonium persulfate etch. ................................................... 330
Fig. 6.49 316L base material. Austenitic grain structure with δ-ferrite
stringers in rolling direction. SA5 159. ................................................. 331
Fig. 6.50 Local cluster of large grain in 316L base material. SA5 159 Oxalic
acid etch................................................................................................. 332
Fig. 6.51 Hot crack in 316L HAZ near the top SA5. Note heavily over-
etched weld metal SA5 159 Oxalic acid etch. ....................................... 333
Fig. 6.52 Intergranular ferrite formation at fusion line. SA5 159 Oxalic acid
etch. ....................................................................................................... 334
Fig. 6.53 Skeletal δ-ferrite formation at fusion boundary. SA5 159 Oxalic
acid etch................................................................................................. 334
Fig. 6.54 Sample SA5 showing the contour cut ................................................... 335
Fig. 6.55 SA2 residual stress map ........................................................................ 337
22
Fig. 6.56 SA5 residual stress map ......................................................................... 337
Fig. 6.57 Locations of longitudinal tensile test coupons numbered CPL1 to
CPL15 .................................................................................................... 340
Fig. 6.58 Longitudinal tensile test coupons; CPL1-3 316L BM, CPL4-6 316L
HAZ, CPL7-9 FM52 WM, CPL10-12 SA508 HAZ, CPL13-15
SA508BM .............................................................................................. 341
Fig. 6.59 Longitudinal tensile test coupons after testing ....................................... 342
Fig. 6.60 316L BM stress-strain curves, test coupons CPL1 to 3 ......................... 343
Fig. 6.61 316L HAZ stress-strain curves, test coupons CPL4 to 6 ....................... 343
Fig. 6.62 Filler Metal 52 weld metal stress-strain curves, test coupons CPL7
to 9.......................................................................................................... 344
Fig. 6.63 SA 508 Gr3 Cl2 HAZ stress-strain curves, test coupons CPL10 to
12 ............................................................................................................ 345
Fig. 6.64 SA 508 Gr3 Cl2 BM stress-strain curves, test coupons CPL13 to 15 ... 345
Fig. 6.65 Charpy-V coupon and composite tensile test coupons CPT1-18
locations in sample SA5 ......................................................................... 346
Fig. 6.66 Composite (CPT1-9) and transverse 508 base material (CPT10-18)
test coupons, 316L steel top ................................................................... 347
Fig. 6.67 Composite test stress-strain curves, test coupons CPT1 to 3. ................ 348
Fig. 6.68 Composite test stress-strain curves, test coupons CPT4 to 6. ................ 349
Fig. 6.69 Composite test stress-strain curves, test coupons CPT7 to 9. ................ 349
Fig. 6.70 Transverse 508 BM test stress-strain curves, test coupons CPT10 to
18. ........................................................................................................... 350
Fig. 6.71 Strain localisation images for composite tensile test SA5, coupon 5.
Stainless steel at bottom. ........................................................................ 351
Fig. 6.72 Strain localisation images for composite tensile test SA5, coupon 8.
Stainless steel at bottom. ........................................................................ 352
Fig. 6.73 Deformation of the fusion zone in SA5, coupon 8, arrow ..................... 352
Fig. 6.74 SA508 base material Charpy-V impact energy, J .................................. 354
Fig. 6.75 SA508 Base material fracture surfaces. A – D, G and H brittle
fracture, E transition and I ductile facture .............................................. 355
Fig. 6.76 Ductile fracture area in SA508 base material, 400x, 1000x and
5000x magnification, sample F .............................................................. 357

23
Fig. 6.77 Brittle fracture area in SA508 base material, 400x, 1000x and
5000x magnification, sample F ............................................................. 358
Fig. 6.78 SA508 HAZ Charpy-V impact energy, J .............................................. 359
Fig. 6.79 SA508 HAZ fracture surfaces. A and B brittle, C to I ductile. ............. 360
Fig. 6.80 SEM images of ductile fracture. 400x, 1000x and 5000x
magnification, Sample G ....................................................................... 362
Fig. 6.81 SEM image of Sample C, low magnification ........................................ 363
Fig. 6.82 SEM images of Sample C. 400x, 1000x and 5000x magnification,
ductile area ............................................................................................ 364
Fig. 6.83 SEM images of Sample C. 400x, 1000x and 5000x magnification,
brittle area .............................................................................................. 365
Fig. 6.84 SEM images of HAZ Sample A, three different locations A, B and
C. 400x, 1000x and 5000x magnification. ............................................ 366
Fig. 7.1 Near symmetrical undercut (arrow) due to re-melting of a pass in
an incomplete stainless steel weld. Note also overheated top
corners of the welding groove. Oxalic acid etch. .................................. 379
Fig. 7.2 Local widening of the welding groove caused by irregular collapse
of asymmetric undercut in the stainless steel, sample DS4................... 380
Fig. 7.3 LII image of DS2, pass 11. The weld bead generated is flat. Note
heavy oxidation. .................................................................................... 382
Fig. 7.4 Desirable and undesirable bead shapes ................................................. 382
Fig. 7.5 Optimal penetration between passes and reliable fusion ...................... 383
Fig. 7.6 Consequences of inadequate wetting increasing the risk of lack of
fusion ..................................................................................................... 384
Fig. 7.7 Undercut induced lack of fusion principle and two possible bead
shapes .................................................................................................... 385
Fig. 7.8 The effect of undercut induced lack of fusion to the following
welding pass .......................................................................................... 386
Fig. 7.9 Reflection of the laser beam towards the direction of welding ............. 388
Fig. 7.10 Overheating of wire nozzle (arrow) due to reflections. DS2 pass 2,
38 s from the start. ................................................................................. 389
Fig. 7.11 Copper debris (two right arrows) from the damaged nozzle (left
arrow) being carried to the melt pool by the filler wire. DS2 pass 2,
250 ms after Fig. 7.10............................................................................ 390
24
Fig. 7.12 The detrimental effects of asymmetric reflections ................................. 391
Fig. 7.13 Droplet formation due to filler wire inadvertently hitting the laser
beam above the melt pool. Oxidation of the droplet visible in video
material. Maximum droplet size shown, just before gravity pulls
the droplet down to the meltpool. DS2, pass 1. ..................................... 392
Fig. 7.14 Droplet at the moment of being absorbed by the meltpool, 40 ms
after Fig. 7.13. DS2, pass 1. ................................................................... 393
25
List of Tables
Table 1.1 Power reactors operating in the United Kingdom in 2017 [2] ................ 37
Table 2.1 Parameters to achieve 20 mm NGLW of stainless steel [17] .................. 59
Table 2.2 Per pass parameters for 20 mm NGLW of AISI 304LN [17] ................. 59
Table 2.3 Parameters for 35 mm NGLW of AISI 304LN [17] ............................... 60
Table 2.4 Per pass parameters for 35 mm NGLW of AISI 304LN [17] ................. 60
Table 2.5 Per pass parameters for Q235 LAS used by Yu et al. 2013 [18] ............ 63
Table 2.6 Chemical composition of A508 Grade 3 Class 2 steels used in a
study [67] wt.-% ...................................................................................... 74
Table 2.7 Mechanical properties of SA508 Gr3 Cl2 steel[67]. ............................... 74
Table 2.8 Standard chemical composition of AISI 316 and AISI 316L wt.-%
[71, 72] .................................................................................................... 75
Table 2.9 Mechanical properties of AISI 316L annealed [71]. ............................... 75
Table 2.10 Chemical composition 316L wt.-% [74] ................................................. 75
Table 2.11 Chemical compositions of Ni filler alloys wt.-% [58] ............................ 77
Table 2.12 Mechanical properties of Alloy 52 and Alloy 82 fillers [58] .................. 77
Table 2.13 Chemical composition of Filler Metal 82 [78] ........................................ 78
Table 2.14 Chemical composition of Filler Metal 52 wt.-% [80] ............................. 78
Table 2.15 Chemical composition of Filler Metal 52M wt.-% [87].......................... 79
Table 2.16 Chemical composition of Filler Metal 52MSS wt.-% [89] ..................... 79
Table 2.17 Basic types of EAC [33].......................................................................... 88
Table 2.18 Cracking types in Alloy 52 and 52M weldments [128] ........................ 100
Table 2.19 Approximate limit of diluting elements in Fe – Ni – Cr welds.
Adapted from [131] ............................................................................... 105
Table 2.20 Laser weldability of binary metal combinations. E = excellent, G =
Good, F = Fair, P = Poor, * = no data available [149] ......................... 111
Table 2.21 Critical parameters in laser welding [150] ............................................ 115
Table 2.22 Visual examinations after welding [161] .............................................. 123

26
Table 2.23 Comparison of three strain mapping methods [163] .............................. 126
Table 2.24 Standards used for evaluation of the weldments .................................... 130
Table 3.1 Welding programme stages and corresponding materials used ............. 142
Table 3.2 EDS analysis of the 316L stainless steel used throughout the study,
wt.% [35] ................................................................................................ 143
Table 3.3 Nominal chemical composition of ER 316L, wt.% [184]...................... 143
Table 3.4 Mechanical properties of materials used [185] [80] [186] .................... 143
Table 3.5 Chemical properties of the base materials used [185-187] .................... 143
Table 3.6 Chemical properties of the filler material used [80] .............................. 144
Table 3.7 Mechanical properties of materials used in the SA series of
experiments [185], [80], [188] ............................................................... 144
Table 3.8 EDS analysis of the 316L stainless steel used, wt.% [35] ..................... 144
Table 3.9 Analysis of SA508 Gr3 Cl2 material used, wt.%, Appendix IV ........... 145
Table 3.10 Analysis of Inconel Alloy FM52 material used, wt.%, Appendix V .... 145
Table 3.11 Base parameters for NGLW ................................................................... 150
Table 3.12 Typical values of different parameters and measurements with
errors ...................................................................................................... 184
Table 3.13 Etchants, compositions and applications ............................................... 187
Table 3.14 Minimum distances to prevent work hardening artefacts in hardness
testing. d = indent diagonal [180, 181] .................................................. 188
Table 3.15 Contour method workflow ..................................................................... 191
Table 4.1 Stage I of thick section similar metal narrow gap laser welds in
316L ....................................................................................................... 202
Table 4.2 Welding parameters TV1 to TV3 ........................................................... 205
Table 4.3 Groove contraction measurements TV1 to TV3 .................................... 206
Table 4.4 Welding parameters TV4, all passes. ..................................................... 208
Table 4.5 Groove contraction measurements, test TV6 ......................................... 213
Table 4.6 The preheating and welding parameters for similar metal welding,
test TV6. ................................................................................................. 215
27
Table 4.7 Temperature and thickness development of TV6 similar metal
316L weld .............................................................................................. 216
Table 5.1 The Stage II of dissimilar thick section narrow gap laser welds
using S275, Alloy 52 and 316L ............................................................. 227
Table 5.2 Welding parameters DS1. ..................................................................... 232
Table 5.3 Welding parameters DS2. ..................................................................... 233
Table 5.4 Visual examination of welds DS1 to DS3 ............................................. 234
Table 5.5 Welding parameters and notes DS4 ...................................................... 236
Table 5.6 Welding parameters and notes DS5 ...................................................... 238
Table 5.7 Visual examination of welds DS4 and DS5 .......................................... 240
Table 5.8 Summary of radiographical acceptance reports of DS series of
welds...................................................................................................... 250
Table 5.9 Dilution of weld DS1 ............................................................................ 261
Table 6.1 Stage III of dissimilar metal narrow gap laser welds, SA508 to
316L using Alloy 52 .............................................................................. 272
Table 6.2 Welding parameters and notes SA1. ..................................................... 279
Table 6.3 Welding parameters and notes SA2. ..................................................... 281
Table 6.4 Welding parameters and notes SA3. ..................................................... 284
Table 6.5 Welding parameters and notes SA4. ..................................................... 286
Table 6.6 Welding parameters and notes SA5. ..................................................... 288
Table 6.7 Welding parameters and notes SA6. ..................................................... 290
Table 6.8 Welding parameters and notes SA7. ..................................................... 292
Table 6.9 Welding parameters and notes SA8. ..................................................... 294
Table 6.10 Thermocouple numbering SA1 ............................................................. 301
Table 6.11 Stage III weld quality visual inspection ................................................ 302
Table 6.12 Results and interpretation of radiographical analysis of Stage III
welds...................................................................................................... 302
Table 6.13 Record of basic welding parameters, fusion quality and undercut in
weld SA2 ............................................................................................... 306
Table 6.14 Record of basic parameters and fusion quality in test SA5................... 310

28
Table 6.15 Poisson’s ratios and coefficients of elasticity for PCC materials .......... 336
Table 6.16 Longitudinal tensile test coupon locations in sample SA6 by
location ................................................................................................... 340
Table 6.17 Longitudinal tensile properties. Sample SA6 ........................................ 342
Table 6.18 Transverse tensile test locations ............................................................. 346
Table 6.19 UTS and elongation of transverse tensile tests, SA5, average of 9
coupons .................................................................................................. 347
Table 6.20 Variation of transverse tensile properties according to location of
the sample, SA5 ..................................................................................... 348
Table 6.21 Impact energies and proportion of ductile fracture in SA508
Charpy-V tests........................................................................................ 356
Table 6.22 Impact energies and proportion of ductile fracture in SA508 HAZ
Charpy-V tests........................................................................................ 361

29
List of Symbols
A, γ Austenite
Creq Chromium equivalent
CN Maximum allowed force on welding clamp
D Diagonal of the hardness measurement indent
d0 Original gap measurement pre-welding
dn Measurement at pass n
E Modulus of elasticity
e Strain
ef Strain to fracture
F, α Ferrite
FZ Filler wire height relative to sample surface
G0 Original gap pre welding
Gn Gap at pass n
HV, Hv Vickers Number hardness
M Martensite
NC Number of pairs of clamps
Nieq Nickel equivalent
Pcm Carbon equivalent JWES
PH Plate height
PL Plate length
PW Plate width
S Stress
UTS, σTS (Ultimate) tensile strength
Wy, Wx, WZ Filler wire position coordinates relative to laser beam
αW Filler wire feed angle from horizontal
ν Poisson’s ratio
σy Yield strength

30
List of Abbreviations
AISI American Iron and Steel Institute
ASCII American Standard Code for Information Interchange
ASME The American Society of Mechanical Engineers
ASTM American Society for Testing and Materials
BCC Body Centric Cubic (crystal lattice)
BM Base Material
BWR Boiling Water Reactor
CE Carbon Equivalent
CF Corrosion Fatigue
CMM Coordinate Measuring Machine
CO2 Carbon Dioxide
Cr Chromium
CRDM Control Rod Drive Mechanism
CTE Coefficient of Thermal Expansion
DBA Design Basis Accident
DBTT Ductile Brittle Transformation Temperature
DDC Ductility Dip Cracking
DM Dissimilar Metal
DMW Dissimilar Metal Welding
EAC Environmentally Assisted Cracking
EDM Electrical Discharge Machining
EDX, EDS Energy-dispersive X-ray Spectroscopy
EPRI Electric Power Research Institute
FAC Flow Assisted Corrosion
FCC Face Centric Cubic (crystal lattice)

31
Fe Iron
GTAW Gas Tungsten Arc Welding
HAZ Heat Affected Zone
HSLA High Strength Low Alloyed (steel)
ISO International Organization for Standardization
JWES Japanese Welding Engineering Society
LBZ Local Brittle Zone
LAS Low Alloyed Steel
LC Liquation Cracking
LCF Low Cycle Corrosion Fatigue
LII Laser Illumination Imaging
LoB Lack of Bonding
LOCA Loss of Coolant Accident
LoF Lack of Fusion
MGB Migrated Grain Boundary
MTRL Manufacturing Technology Research Laboratory
Nd:YAG Neodymium Yttrium Aluminium Garnet
NDT Non-Destructive Testing
NGLW Narrow Gap Laser Welding
Ni Nickel
NNUMAN New Nuclear Manufacturing Programme
NPP Nuclear Power Plant
PCC Primary Coolant Circuit
PMZ Partially Melted Zone
PVH Pressure Vessel Head
PWHT Post Weld Heat Treatment
PWR Pressurised Water Reactor
32
PWSCC Primary Water Stress Corrosion Cracking
RPV Reactor Pressure Vessel
SCC Stress Corrosion Cracking
SEM Surface Electron Microscopy
SICC Strain-Induced Corrosion Cracking
SGB Solidification Grain Boundary
SS Stainless Steel
SSGB Solidification Subgrain Boundary
USE Upper Shelf Energy
UTS Ultimate Tensile Strength
WM Weld Metal
WPS Welding Procedure Specification

33
Abstract
Dissimilar metal welding (DMW) between thick section low alloyed and stainless
steels is essential in pressurised water reactor (PWR) construction. This study
explored the potential of narrow gap laser welding (NGLW) to improve the quality
and manufacturability of these welds. It concentrates on DMW joints located in the
primary cooling circuit, where austenitic stainless steel pipes are connected to forged
low alloy pressure vessel nozzles.
Current welding processes for this application are manual metal arc (MMA) and
narrow gap gas tungsten arc (NG-GTA) welding, which are slow and inefficient.
They require large amounts of filler material to be deposited and generate
considerable residual stresses. The residual stresses contribute to stress corrosion
cracking (SCC), which has been found a major issue to the longevity and reliability
of PWR’s. NGLW has the potential to reduce the amount of filler material required
and has been shown to reduce the detrimental residual stresses.
In this study NGLW was applied for welding SA508 Gr3 Cl2 low alloyed steel with
AISI 316L austenitic stainless steel using Inconel Alloy 52 filler metal up to 40 mm
thickness. This thesis is the first time that dissimilar metal NGLW has been reported.
The process characteristics are discussed. The resulting welds were subjected to
industry-standard radiographical approval according to ASME IX. Hardness
mapping and microstructural analysis were carried out. Tensile and impact toughness
tests were executed. Residual stresses were mapped using the contour method.
Welding equipment was developed. The unusually narrow welding groove required
special shielding gas and wire feed nozzles. Real-time weld monitoring systems
using two different approaches were developed. An appropriate restraint system for
the high distortion forces caused by the thick section welding was designed.
The microstructural and hardness properties were found to be sound and impact
toughness requirements were fulfilled in the as welded condition. This was caused
by an effective multi-pass tempering. Lack of fusion (LoF) defects were found to
limit the repeatability of the welds. Two main mechanisms were recognised:
oxidation induced LoF and undercut related LoF. The filler material used was found
to be prone to oxidation. Solutions to overcome the issues found are suggested.

34
Declaration
I hereby declare that no portion of the work referred to in the thesis has been
submitted in support of an application for another degree or qualification of this or
any other university or other institute of learning.
Tapio Väistö
1.2.2019, Manchester, United Kingdom
35
Copyright Statement
i. The author of this thesis (including any appendices and/or schedules to this thesis) owns
certain copyright or related rights in it (the “Copyright”) and s/he has given The
University of Manchester certain rights to use such Copyright, including for
administrative purposes.
ii. Copies of this thesis, either in full or in extracts and whether in hard or electronic copy,
may be made only in accordance with the Copyright, Designs and Patents Act 1988 (as
amended) and regulations issued under it or, where appropriate, in accordance with
licensing agreements which the University has from time to time. This page must form
part of any such copies made.
iii. The ownership of certain Copyright, patents, designs, trademarks and other intellectual
property (the “Intellectual Property”) and any reproductions of copyright works in the
thesis, for example graphs and tables (“Reproductions”), which may be described in this
thesis, may not be owned by the author and may be owned by third parties. Such
Intellectual Property and Reproductions cannot and must not be made available for use
without the prior written permission of the owner(s) of the relevant Intellectual Property
and/or Reproductions.
iv. Further information on the conditions under which disclosure, publication and
commercialisation of this thesis, the Copyright and any Intellectual Property and/or
Reproductions described in it may take place is available in the University IP Policy (see
http://documents.manchester.ac.uk/DocuInfo.aspx?DocID=24420), in any relevant Thesis
restriction declarations deposited in the University Library, The University Library’s
regulations (see http://www.library.manchester.ac.uk/about/regulations/) and in The
University’s policy on Presentation of Theses

36
Acknowledgements
During the course of this work I have been helped, supported and encouraged by many
people and I want to thank you all, no matter how big or small your contributions seemingly
are. It all adds up!
Firstly I would like to express my gratitude to my supervisors, Professor Lin Li and Dr. John
Francis. Thank you for all your guidance and advice over the hard working years. I also
would like to thank Dr. Neil Irvine and Ms Jacqui Grant of the NNUMAN programme for
their invaluable support during this challenging time.
I’m especially thankful to Dr. Jean Dhers from Areva for his advice and for providing the
filler material used in the welding. I’m also grateful to the EPSRC equipment pool and Mr
Adrian Walker in particular for his effort on donating the laser illumination system used for
monitoring the welds. I also want to thank the School of MACE for the scholarship I
received for three years and NNUMAN for funding my submission pending time.
A big thankyou goes to everybody involved in the substantial amount of experimental work
conducted, especially Dr. Wei Guo for guidance and Mr Damian Crosby for the robot
operation and assistance in data gathering and processing. For collaboration during the
analytical phase of the work I want to thank Dr. Anastasia Vasileiou for all her help and
expertise in contour method and hardness mapping, Dr. Dinesh Rathod for metallurgical
discussions and to Dr. Jiecai Feng for transferring NGLW knowledge and also to all the
colleagues at MTRL and LPRC.
Thanks also go to Heng and Isidro for being my best friends during my studies in
Manchester. Your support was valuable in so many different ways and is much appreciated.
I would like to use this opportunity to thank my mother Pirkko and father Pentti back home
for support and encouragement over the course of my academic studies since I was a little
boy. Thanks also go to my sister Piritta and brother Jouni for their support and reassurance
during all the twists and turns in my life, PhD and everything.
Finally, the biggest thanks of all go to my dear partner Heli. Thank you for the nudges and
shoves on the uphills of my struggle and for cheering me up on the downhills. Without your
unwavering faith this would have not been possible!

37
1 Introduction
1.1 Background
It can be argued that energy is the biggest problem faced by modern civilisation.
Global energy consumption is at unprecedented levels and rising [1]. As Britain’s 15
ageing nuclear power reactors currently (2017) supply 21 % [2] of the electricity and
as their shutdown grows nearer, there is a tremendous demand for new power plants
in the near future, Table 1.1. To add to the pressure there has been a decline in the
availability of current power plants due to ageing-related problems [2]. The renewal
of the reactor fleet is inevitable.
Table 1.1 Power reactors operating in the United Kingdom in 2017 [2]
The House of Lords Select Committee on Science and Technology [3] has identified
insufficient research and development capability as a potential threat for the UK’s
ability to produce nuclear power. New Nuclear Manufacturing Programme
(NNUMAN) [4] addressed this issue by developing R&D capabilities to support the
nuclear power needs into the future [5].

38
One of the four key research areas in NNUMAN was ‘innovative joining methods’,
including welding. Laser welding was identified as one ‘candidate advanced welding
process’ in the programme [6]. As a fully independent branch of NNUMAN, this
exploratory study investigated dissimilar metal (DMW) narrow gap laser welding
(NGLW) in pressurised water reactor (PWR) primary cooling circuits (PCC).
1.2 Primary Cooling Circuit Pressure Vessel Nozzles
The target applications considered in this study are the different pressure vessel safe-
end DMW’s in a PWR reactor PCC. The largest application, the RPV safe end weld
is illustrated as Fig. 1.1. These welds are among the most critical in the construction
and often a source of concern, as primary water stress corrosion cracking (PWSCC)
is often observed in them after prolonged use [7-10]. NGLW has shown potential to
produce lower residual stresses than conventional welding, hence reducing the
susceptibility to PWSCC [11].
Fig. 1.1 Geometry of a full-size mock-up of an RPV safe-end nozzle weld [12]
39
Currently, these welds are welded with conventional or narrow gap arc welding [13-
15]. The procedure includes laying a buttering layer of filler material, see section A-
A in Fig. 1.1. This buttering layer, with the resulting fusion line and the ferritic steel
HAZ, is then subjected to a post weld heat treatment (PWHT) to restore toughness
and relieve residual stresses before the stainless steel prone to sensitisation is present
[16]. The buttering layer is then welded onto the stainless steel pipe.
There are certain factors in the current practice to take into account. The actual weld
does not get PWHT and the residual stresses do not get relieved. This leaves a high
level of residual stress in the weld which makes it prone to PWSCC. Also, the
buttering has to be relatively thick to avoid excessive heating of the heat treated
ferritic steel, which adds to cost.
1.3 Narrow Gap Laser Welding
NGLW is a novel welding process which has seen rising interest after the invention
of high beam quality laser sources such as fibre lasers. The principle of NGLW is
illustrated in Fig. 1.2. It has been attributed to have benefits over conventional arc
welding such as higher process speeds, lower filler material consumption and lower
residual stresses. Studies of NGLW have thus far concentrated entirely on similar
metal welding [11, 17-20]. No research on dissimilar metal NGLW has been
published.
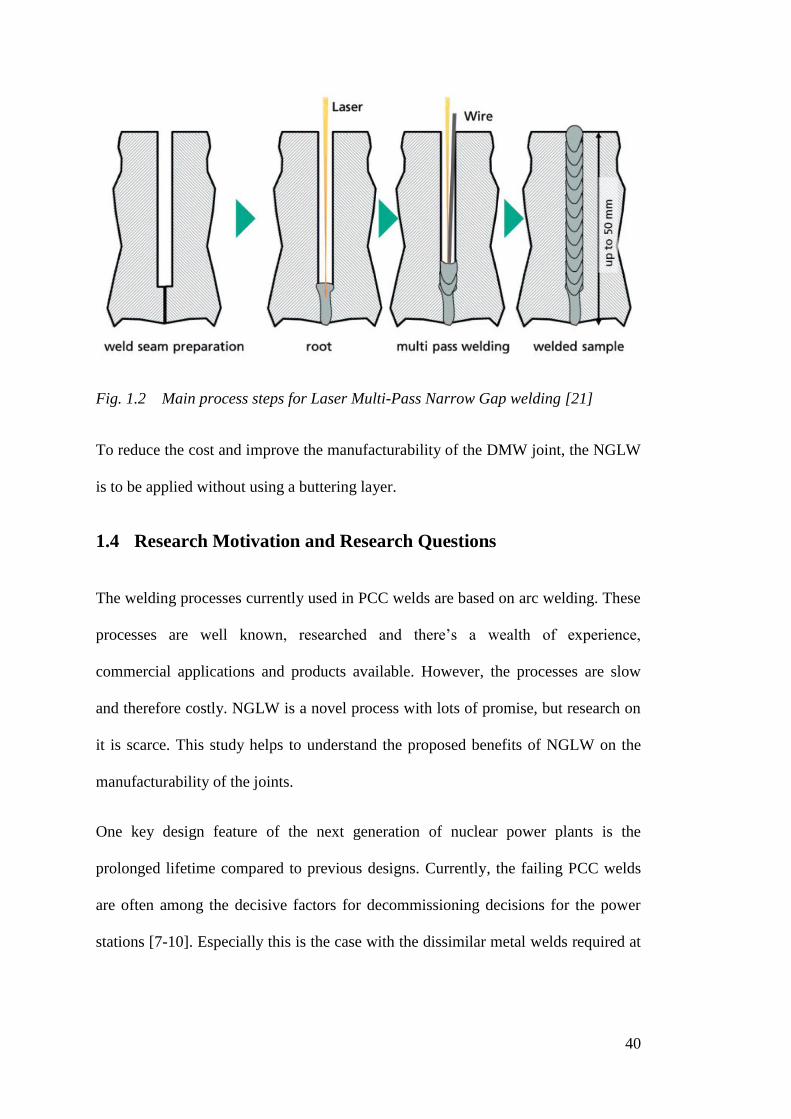
40
Fig. 1.2 Main process steps for Laser Multi-Pass Narrow Gap welding [21]
To reduce the cost and improve the manufacturability of the DMW joint, the NGLW
is to be applied without using a buttering layer.
1.4 Research Motivation and Research Questions
The welding processes currently used in PCC welds are based on arc welding. These
processes are well known, researched and there’s a wealth of experience,
commercial applications and products available. However, the processes are slow
and therefore costly. NGLW is a novel process with lots of promise, but research on
it is scarce. This study helps to understand the proposed benefits of NGLW on the
manufacturability of the joints.
One key design feature of the next generation of nuclear power plants is the
prolonged lifetime compared to previous designs. Currently, the failing PCC welds
are often among the decisive factors for decommissioning decisions for the power
stations [7-10]. Especially this is the case with the dissimilar metal welds required at

41
the pressure vessel unions [8, 22, 23]. This study probes the potential to improve the
lifetime of these welds by using NGLW.
Considering the above the following research questions arise:
Is NGLW capable of producing weld quality in accordance with the industry-
standard weld quality and mechanical property requirements?
Does the lower heat input of NGLW lead to reductions in residual stresses to
allow better resistance to PWSCC?
Can the buttering layer be omitted when using NGLW? Is the ferritic steel
HAZ toughness high enough in as welded condition?
1.5 Aim and Objectives
The motivation for this research is to investigate the proposed benefits of laser
narrow gap welding for new nuclear manufacturing. A central dissimilar weld in a
PWR primary cooling circuit was chosen for study. The welding setup, procedure
and the parameters were developed. Plateform samples were welded and the
resulting welds were subjected to industry-standard radiographic analysis
supplemented by various mechanical analysis. By doing the investigation on residual
stresses the susceptibility to PWSCC is evaluated. The ultimate target is the
reduction of the cost of manufacturing, shortening of the processing time and
improvement of the longevity of the future PWR reactors.
The aim of this study was:
To investigate the feasibility and the proposed benefits in material savings,
residual stresses and lower heat input of NGLW for SA508 Gr3 Cl2 to 316L
dissimilar metal welds in PWR reactor primary cooling circuits using nickel
Alloy 52 filler material using industry-standard acceptance criteria.
42
The objectives were:
To construct a welding setup and to develop process parameters capable of
welding thick section NGLW up to a relevant thickness to the applications
intended.
To understand the development of distortions and welding flaws during the
welding process using mechanical measurements, 3D scanning, laser
illumination imaging (LII) and X-ray analysis.
To assess the quality of the welds subjecting them to nuclear industry-
standard ASME IX radiographical acceptance and to understand the flaw
development mechanisms
To understand the formation of different microstructures and the multi-pass
tempering effect involved in the NGLW process.
To analyse the mechanical properties and understand the mechanisms leading
to them in the welds and heat affected zones by several different analysis
techniques including hardness, tensile strength and impact energy supported
by digital image correlation.
To measure the residual stresses and investigate their distribution using the
contour method and to understand their effect on susceptibility to PWSCC
To justify the omitting of the buttering and partial PWHT conventionally
involved in these types of welds by comparing the ferritic steel HAZ impact
toughness to U.S. NRC impact energy requirements.
43
1.6 Structure of This Thesis
Chapter 2 is a literature review. It describes the PWR primary cooling circuit and
the primary cooling water environment. Narrow gap welding is covered, as well as
weldability issues of high chromium filler materials. Current research of narrow gap
laser welding is reviewed. It discusses the current materials, methods and practices in
welding of the dissimilar metal weld investigated in this study. It considers the
demands posed to the materials and design by the application such as corrosion and
thermal issues. Industry-standard criteria for acceptance are described.
Chapter 3 describes the materials and methods. The welding programme structure is
described. The welding setup and parameters are presented. The chapter discusses
the extensive equipment development work conducted throughout the study. The
real-time monitoring of the welding is described. The analysis methods for the
weldments are presented in detail.
Chapter 4 presents the welding and development work conducted during the first
stage of the welding programme. The welding groove design process is described.
The observations during NGLW of 316L similar metal welds are discussed.
Chapter 5 describes the second stage of the welding programme, the first reported
dissimilar metal welds made with NGLW. The materials at this stage were S275
mild steel, AISI 316L austenitic stainless steel and nickel alloy filler metal Inconel
FM52. The welding process is described, welds are analysed and the results are
discussed.
Chapter 6 presents the third stage of the welding programme and the main objective
of this study, the dissimilar NGLW of SA508 Gr3 Cl2 low alloyed steel and 316L
stainless steel. The welding setup and the process are described. Detailed analysis of
the weldments is conducted and the results are discussed.
Chapter 7 summarises the welding programme and discusses the common findings
in the three previous chapters.
Chapter 8 concludes the key findings of this study and presents them with short
synopses.
Chapter 9 presents suggestions for future work.

44
Blank page

45
2 Literature Review
2.1 Pressurised Water Reactor (PWR)
Several different nuclear reactor systems have been developed to commercial scale
over the years [24-26]. Of these, the pressurised water reactor (PWR) type has
become the most common, with 289 reactors in operation as of 31.12.2016 [27].
The characteristics which have led to the success of the PWR design identified by
The Institute of Electrical Engineering [24] are the low construction cost resulting
from the design being amenable to fabrication in factory-built sub-assemblies and
the wealth of operating experience gained globally.
A PWR reactor, Fig. 2.1, is a light water moderated thermal nuclear fission reactor.
In a thermal nuclear reaction, the neutrons have to be slowed down (or moderated) to
maintain the chain reaction. In a PWR design, this is achieved using the cooling
water as moderant. The water also conveys the heat out from the reactor core. This
primary cooling water is kept under pressure to prevent steam formation. The low
pressure secondary circuit provides the steam driving the turbines. The steam is
generated in separate steam generators, which prevent the coolants from mixing. A
pressuriser is required to control the primary coolant pressure during thermal
fluctuations such as power changes [26].

46
Fig. 2.1 Pressurised water reactor. Primary cooling circuit in red, secondary
cooling circuit in blue. U.S. NRC [28]
2.1.1 Primary Cooling Circuit Environment (PCC)
To be able to understand the requirements for materials and design in the PCC of a
PWR reactor, the PCC environment must be understood. The following chapters
give an overview of the main considerations for design and material selection for the
components.
2.1.1.1 Heat and Pressure
Carnot’s theorem states that in order to achieve maximum efficiency any heat engine
has to operate at the largest temperature differential possible. In order to be able to
use water as an efficient means of transferring thermal energy it needs to be
pressurised to increase its boiling point. In a PWR design, the average core outlet
temperature is 320 - 325 °C [26]. This places significant thermal loading on the
structure of the pressure circuit in the thermal power plant.
47
The primary coolant pressure in a PWR is typically 150 – 155 bar and the design of a
PWR requires a large reactor pressure vessel (RPV) [26, 29]. This creates a design
challenge as exceptionally thick pressure vessel walls are required. In conventionally
fired thermal power plants higher pressures and temperatures can be used because of
the different design requiring only relatively small diameter tubing under high
pressure [26].
The primary cooling circuit piping of a PWR plant is also large-scale in comparison
to conventional power plants: 1000 mm diameters and 80 mm wall thicknesses are
typical [14, 30]. For the smallest piping in the PCC, the pressuriser surge line,
372 mm diameter and 33.45 mm wall thickness have been reported [31].
2.1.1.2 Corrosion
Hot water itself is a corrosive substance affecting the whole reactor primary cooling
circuit. In addition, the primary water is mixed with a small amount of boric acid, as
the neutron absorbing effect of boron is used to control the neutron flux and chain
reaction in the reactor core. Additionally, a minute amount of lithium is added to
stabilize the pH through the fuel cycle [32], see Fig. 2.2. The presence of boric acid
adds to the demands on the pressure vessel material as the water solution becomes
more corrosive [26]. Corrosion within PWR primary cooling circuits is a long-
established issue and has been reported by the United States Nuclear Regulatory
Commission [23]. A report by U.S. NRC specifically discusses such issues with
primary cooling circuit dissimilar welds found in 2000 and 2006 [8].
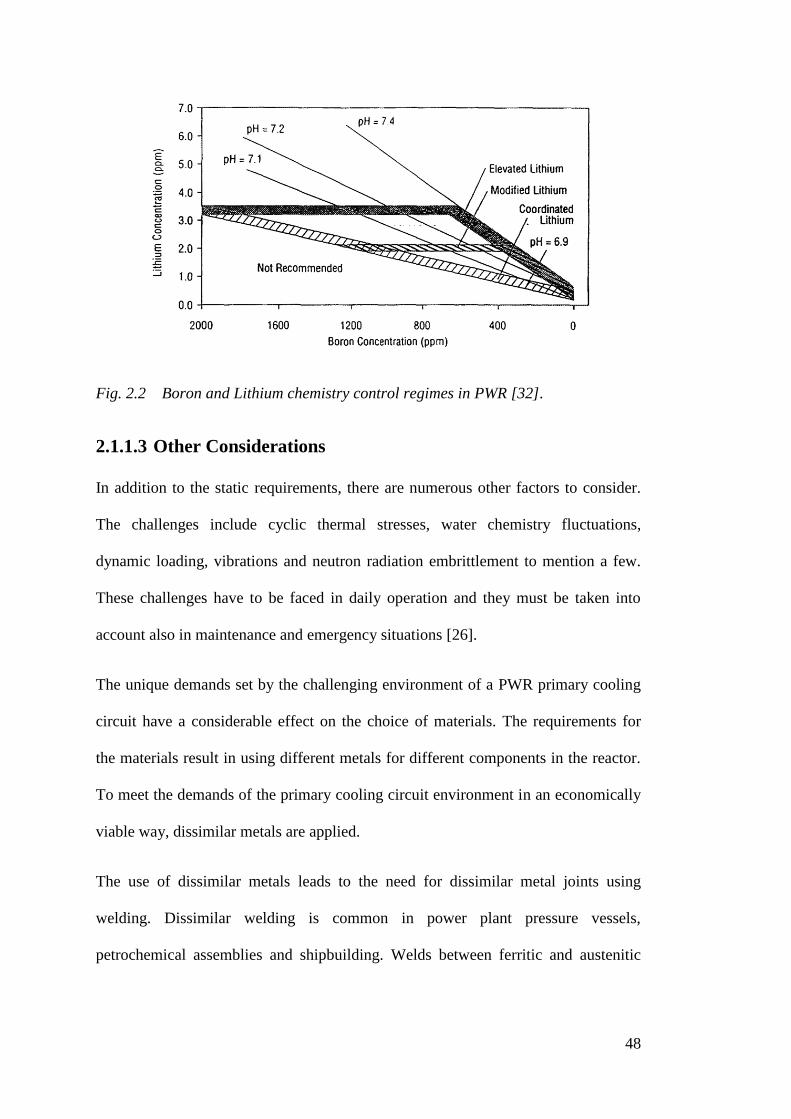
48
Fig. 2.2 Boron and Lithium chemistry control regimes in PWR [32].
2.1.1.3 Other Considerations
In addition to the static requirements, there are numerous other factors to consider.
The challenges include cyclic thermal stresses, water chemistry fluctuations,
dynamic loading, vibrations and neutron radiation embrittlement to mention a few.
These challenges have to be faced in daily operation and they must be taken into
account also in maintenance and emergency situations [26].
The unique demands set by the challenging environment of a PWR primary cooling
circuit have a considerable effect on the choice of materials. The requirements for
the materials result in using different metals for different components in the reactor.
To meet the demands of the primary cooling circuit environment in an economically
viable way, dissimilar metals are applied.
The use of dissimilar metals leads to the need for dissimilar metal joints using
welding. Dissimilar welding is common in power plant pressure vessels,
petrochemical assemblies and shipbuilding. Welds between ferritic and austenitic

49
steels are required for several reasons, mostly because the mechanical and corrosion
resistance requirements vary along the structure [33].
2.2 Narrow Gap Welding
In narrow gap (NG) welding a conventional wide V-groove is substituted with a
narrower, near-parallel welding groove. Narrow gap welding typically uses groove
angles between 2 and 20°, instead of the common V-angles in the region of 45-60°.
The aim is to reduce the consumable, time and welding passes required to weld thick
sections. NG welding is commonly applied for SAW, GMAW and GTAW processes
[34].
Fig. 2.3 Comparison of conventional V-groove to a typical NG J-groove weld
preparation
The narrow gap welding process uses a very narrow welding groove compared to
conventional processes [34-36]. This has direct implications to the weld geometry,
filler material volume and subsequent welding distortions. An extreme example is
given as Fig. 2.4, where 1.5 mm parallel groove ultra narrow gap laser welding is
compared to a conventional 60° V-groove GTA welding at 20 mm section thickness.

50
Fig. 2.4 Cross sections of ultra-NGLW and conventional GTA welds of 20 mm
thick stainless steel [35]
Comparison of commonly used weld preparation geometries for arc welding to
narrow gap arc welding is displayed as Fig. 2.5. The volumetric benefits of NG
welding compared to commonly used geometries are significant. In the case of a
single sided access, the narrow groove process can reduce the weld volume by 78%
[37]. An NGLW process is capable of reducing the gap to 4-6 mm [17], yielding a
reduction up to 93%.
Fig. 2.5 Comparison of traditional groove cross-sectional areas to narrow gap
welding in arc welding. Modified from [37]

51
NG welding generally requires specialised nozzles to access the bottom of the
narrow groove. However, in GTA welding a conventional welding torch can be
applicable up to 45 mm thickness by adjusting the electrode stick-out [36]. The wire
nozzle has to be narrow enough to fit the welding groove. In most cases, the gas
shielding nozzles have to be inserted deep in the groove to achieve efficient
shielding performance. The narrower the groove the more difficult it is to achieve
acceptable rigidity of the equipment [34-36].
Following general advantages have been listed for narrow gap welding: [34]
Lower costs due to less filler material required
Lower costs due to shorter welding time
Lower angular distortion as the weld is near-parallel
Disadvantages include: [34]
Weld is more prone to lack of fusion to the sidewalls and other defects
Reparability of defects is poor due to difficult access
More costly J-preparations required unless a root support is used
Different backing supports can be used instead of autogenous root pass [36].
Especially in the case of dissimilar metal welding, an autogenous root pass is
inapplicable as the whole thickness of the weld is required to a have similar
composition. To accomplish this, a backing support is used, see Fig. 2.6. Generally,
the backing support is removed after welding, but in certain applications, this is not
necessary.

52
Fig. 2.6 Three backing support strategies, one permanent and two removable
designs [36]
2.2.1 Filling strategies
Four main filling strategies for NG-GTAW can be listed.
Single bead per layer
Two (or more) beads per layer
Single oscillated electrode layer
Two (or more) oscillated electrode beads per layer[36]
The single bead per layer offers the best performance but can be difficult to
implement. This approach allows the use of the narrowest possible groove. The main
challenges are in machining precision and fit-up [36].
With two or three passes per layer welding energy may be reduced while
maintaining wetting and penetration, as both groove edges don’t have to be melted
simultaneously. It has benefits in residual stress which also can reduce hot cracking.
The groove width varies from 10 mm to 13 mm. Also, in dissimilar metal welding,
the properties of the base materials can be taken into account by selecting
appropriate parameters individually for each side [36].
Using a single oscillating pass with a sophisticated power source some of the
benefits of the dual pass approach can be reached. The sidewall penetration can be
optimised. Groove width, however, range up to 18 mm reducing the productivity
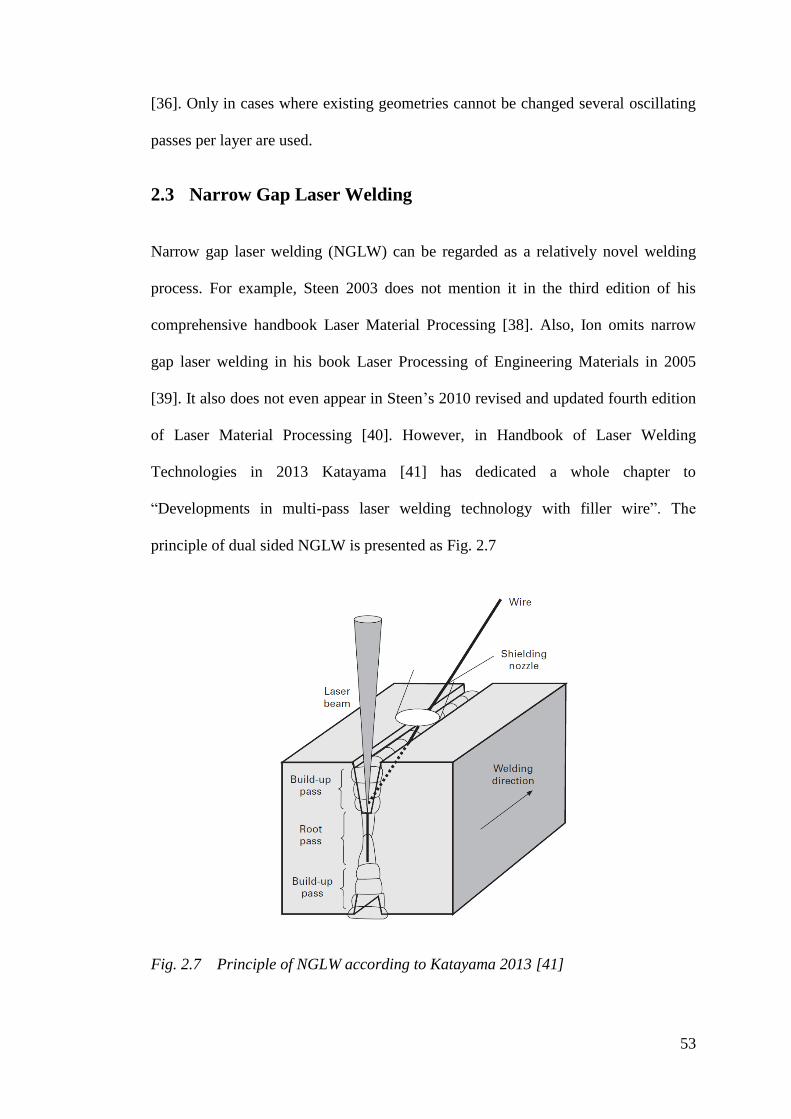
53
[36]. Only in cases where existing geometries cannot be changed several oscillating
passes per layer are used.
2.3 Narrow Gap Laser Welding
Narrow gap laser welding (NGLW) can be regarded as a relatively novel welding
process. For example, Steen 2003 does not mention it in the third edition of his
comprehensive handbook Laser Material Processing [38]. Also, Ion omits narrow
gap laser welding in his book Laser Processing of Engineering Materials in 2005
[39]. It also does not even appear in Steen’s 2010 revised and updated fourth edition
of Laser Material Processing [40]. However, in Handbook of Laser Welding
Technologies in 2013 Katayama [41] has dedicated a whole chapter to
“Developments in multi-pass laser welding technology with filler wire”. The
principle of dual sided NGLW is presented as Fig. 2.7
Fig. 2.7 Principle of NGLW according to Katayama 2013 [41]

54
NGLW is developed from autogenous keyhole laser welding. One major incentive
has been the possibility of welding thick section welds using much lower power than
conventionally required [42]. Other benefits have also been shown, such as lower
sensitivity to the stringent alignment tolerances [17] and smaller evaporation of
alloying elements [42] compared to keyhole laser welding.
Compared to conventional NG welding groove design NGLW uses narrower groove
design. This leads to further savings in filler material and smaller distortions [35]
with lower residual stress [41]. Katayama 2013 [41] states: ”The narrower welding
groove, lower heat input and fewer weld passes for laser welding lead to lower
residual stress.” The reduction of the weld cross-section is approximately 60% [17,
34, 37, 43]. Different NG geometries with typical dimensions are presented in Fig.
2.8.
Fig. 2.8 Comparison of narrow gap welding geometries and typical groove
dimensions, root support not shown
The ultra-narrow gap laser welding utilises a groove which is just wide enough to
accommodate the filler wire using no nozzle. The maximum applicable thickness for
ultra-narrow gap welding is limited by the rigidity of the filler wire and the laser
beam geometry. Reported thicknesses are below 20 mm [35].
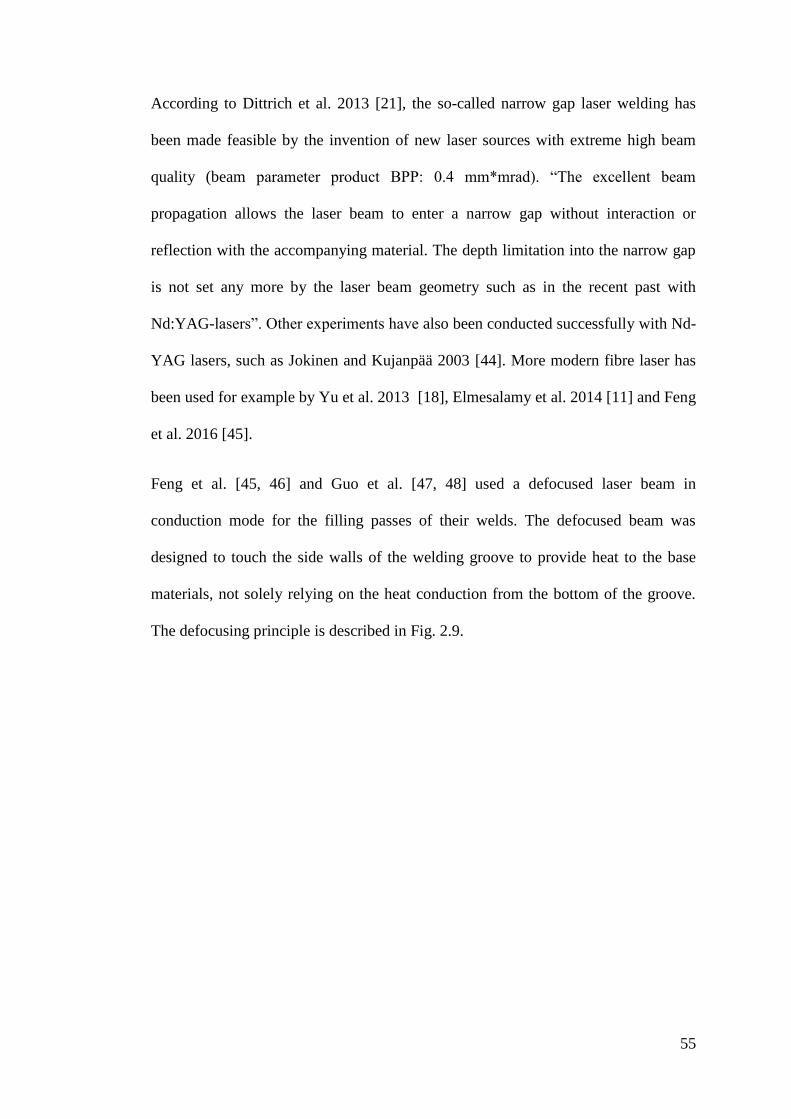
55
According to Dittrich et al. 2013 [21], the so-called narrow gap laser welding has
been made feasible by the invention of new laser sources with extreme high beam
quality (beam parameter product BPP: 0.4 mm*mrad). “The excellent beam
propagation allows the laser beam to enter a narrow gap without interaction or
reflection with the accompanying material. The depth limitation into the narrow gap
is not set any more by the laser beam geometry such as in the recent past with
Nd:YAG-lasers”. Other experiments have also been conducted successfully with Nd-
YAG lasers, such as Jokinen and Kujanpää 2003 [44]. More modern fibre laser has
been used for example by Yu et al. 2013 [18], Elmesalamy et al. 2014 [11] and Feng
et al. 2016 [45].
Feng et al. [45, 46] and Guo et al. [47, 48] used a defocused laser beam in
conduction mode for the filling passes of their welds. The defocused beam was
designed to touch the side walls of the welding groove to provide heat to the base
materials, not solely relying on the heat conduction from the bottom of the groove.
The defocusing principle is described in Fig. 2.9.
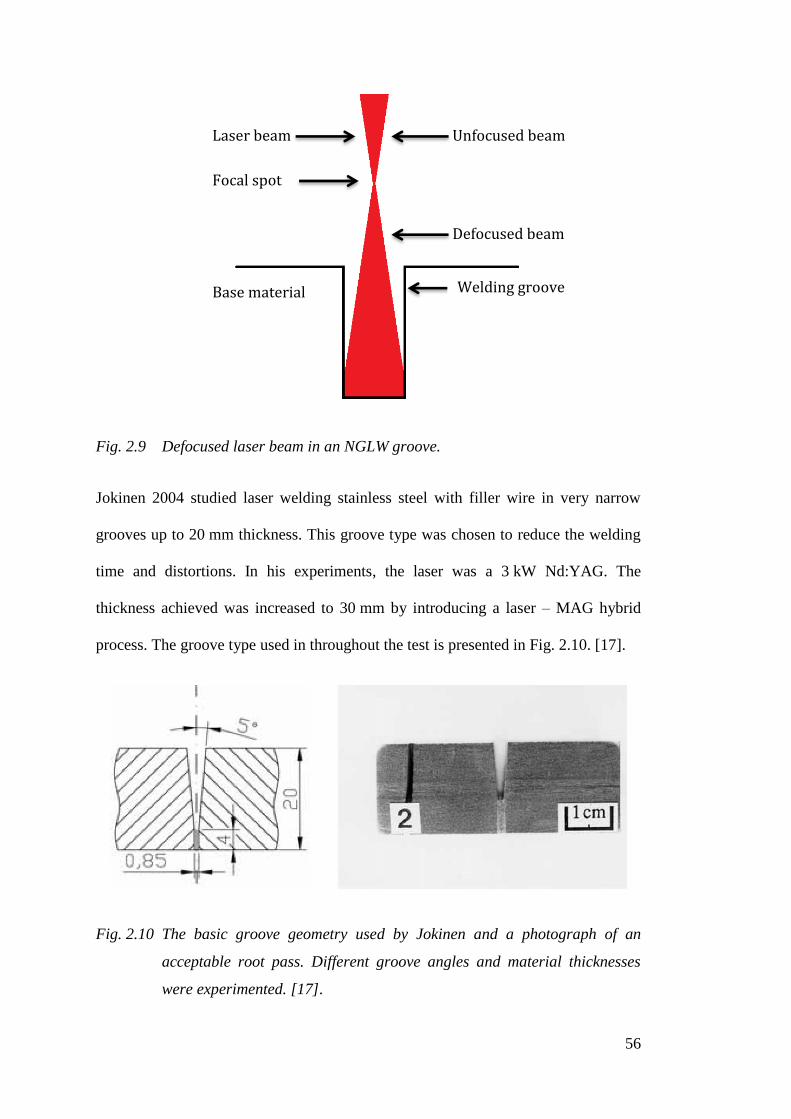
56
Fig. 2.9 Defocused laser beam in an NGLW groove.
Jokinen 2004 studied laser welding stainless steel with filler wire in very narrow
grooves up to 20 mm thickness. This groove type was chosen to reduce the welding
time and distortions. In his experiments, the laser was a 3 kW Nd:YAG. The
thickness achieved was increased to 30 mm by introducing a laser – MAG hybrid
process. The groove type used in throughout the test is presented in Fig. 2.10. [17].
Fig. 2.10 The basic groove geometry used by Jokinen and a photograph of an
acceptable root pass. Different groove angles and material thicknesses
were experimented. [17].
Laser beam
Defocused beam
Base material
Focal spot
Unfocused beam
Welding groove
sidewall

57
In laser welding typical penetration depths are of the order of 1 – 2 mm / kW laser
power. With the multi-pass laser welding technique, which is based on the narrow
gap welding principle, thicker materials can be handled with relatively low laser
power.
Different methods for laser narrow gap welding have been investigated. Phaoniam et
al. 2013 have developed a hot-wire laser hybrid process for narrow gap welding. The
material was ASTM A304 austenitic SS. The filler wire was Inconel 600 nickel
alloy. [49] This resembles a technique called laser hybrid welding in which gas metal
arc welding is combined with laser welding. Hybrid welding has been studied by
several groups e.g. [50] who studied a T-joint with good results.
Yu et. al. 2013 demonstrated that after optimisation the groove size and the side
shielding gas, a sound weld without defects was achieved in welding 17 mm thick
plate by a combination of autogenous laser welding and laser welding with filler
wire technology. During the laser welding of thick plate with filler wire using a
narrow gap joint configuration and multi-pass technique, lack of fusion, inclusions
and porosity were the main weld defects [18].
In the study, they found that by using a carefully controlled shielding gas flow above
the weld pool, the concavity of the root side is reduced or can be avoided altogether
while welding the autogenous zero gap root pass. Recently Feng et al. 2017 [46]
evaluated NGLW as a candidate process for welding the ferritic nuclear reactor
pressure vessels. They found that NGLW can produce welds of a quality suitable for
critical nuclear components. The similar metal welds of SA508 Gr3 Cl1 steel were
analysed with several methods.
58
2.3.1 Challenges in NGLW
NGLW is known to add new challenges compared with traditional laser welding.
The process introduces several new parameters since it is necessary to introduce
filler wire in order to fill the gap [51]. The welding groove design is more complex.
Lack of fusion occurs easily in the welds [41, 46]. Yu et a.l. 2013 list lack of fusion,
inclusions and porosity as the main welding defects likely to be encountered in low
carbon steel welding. The narrow groove was found to be beneficial in avoiding lack
of fusion as more energy is conducted to help melt the sidewalls. The problem was
also countered by widening the weld pool, which was also found to reduce the
effects of wire feed inaccuracies [18]. Cracking in stainless steel has been studied by
Zhang et a.l. 2011 [20]. Feng et a.l. [45] reported cracking and porosity in ferritic
steel welding.
2.3.2 Welding efficiency
Conventionally the deposition rate has been used for comparing different welding
processes. In the case of NGLW, it is misleading. Using the deposition rate of
different welding processes is based on the assumption that the welding preparation
design does not change and it, therefore, is a powerful quick ratio to assess the
efficiency of welding. However, when the volume of the welding groove is reduced
dramatically, a seemingly low deposition rate may give a high rate of joining
capacity. Therefore in this study deposition rate is not used.
2.3.3 Welding Parameters for Narrow Gap Laser Welding
There are only few published articles about NGLW which directly discuss the
parameters. Jokinen 2004 experimented with several different parameters for

59
welding 20 mm stainless steel. According to his conclusions, the most reliable
parameters are presented in Table 2.1 and Table 2.2.
Table 2.1 Parameters to achieve 20 mm NGLW of stainless steel [17]
Parameter
focal length f = 200 mm
spot diameter d = 0.6 mm
laser power 3 kW
base materials AISI 316L and AISI 319LN
filler material AWS 5.9 ER 316 LSi and AWS 5.9 ER 308 Lsi
filler wire diameter 0.8 mm
wire feed angle 45 deg
groove partial V
groove angle 10 deg
air gap 0.85 mm
Table 2.2 Per pass parameters for 20 mm NGLW of AISI 304LN [17]
Pass
no:
Wire feed speed
[m/min]
Interaction point
[mm]
Focal point
[mm]
1 4 -2 -15
2 4 -2 -9
3 5.5 -2 -6
4 5.5 -2 -3
5 5.5 -2 -1
The filler wire feeding speed was selected carefully. Excess speed was found to
cause insufficient melting of the sidewalls and lack of fusion. For achieving a stable
process the interaction point of the laser beam and filler wire was found to be
important. Pointing the wire below the focal point gave the best results. As long as
the interaction point was not above the focal point, which was found to be
detrimental for the stability of the process, the accuracy was not found to be critical,
as interaction points from -2 mm to -4 mm were found to give similar good results
[17].

60
Jokinen 2004 [17] reported that the limiting factor for the weld thickness was found
to be the increasing air gap. The widening gap led to lack of fusion when the width
was 2.8 mm or more. In his experimental setup, the groove walls were inclined all
the way to the surface starting from the top of the parallel root surface. Even at the
best case, this led to an unsuitably wide groove at 21 to 24 mm thickness. Regardless
of these problems a sound weld at a thickness of 35 mm was achieved by 8 passes
with parameters which are presented in Table 2.3 and Table 2.4.
Table 2.3 Parameters for 35 mm NGLW of AISI 304LN [17]
Parameter
focal length f = 200 mm
spot diameter d = 0.6 mm
laser power 3 kW
base materials AISI 304LN
filler material ESAB OK 16.12 (AWS 5.9 ER
308LSi)
filler wire diameter 0.8 mm
feed angle 45 deg
groove partial V with 4 mm parallel root face
groove angle 8 deg
air gap 0.85 mm
Table 2.4 Per pass parameters for 35 mm NGLW of AISI 304LN [17]
Pass
no:
Wire feed speed
[m/min]
Interaction point
[mm]
Focal point
[mm]
1 3.5 -2 -30
2 4.5 -2 -25
3 5.5 -2 -20
4 6.0 -2 -16
5 6.0 -2 -12
6 4.5 -2 -8
7 4.5 -2 -3
8 4.5 -2 0

61
It is important to notice that the root pass was not made autogenously as in many
other cases. This does not apply to dissimilar metal NGLW as it does not allow
controlling of the composition and properties of the fusion zone at the first pass.
Jokinen 2004 [17] also observed porosity and fine oxidised dust. Porosity was
concluded to be related to rapid cooling and solidification of the melt pool not
allowing the bubbles to escape. Oxidation was found to be caused by an inadequate
shielding gas environment in the narrow groove. It was also found to have some non-
critical effect on porosity.
Narrow gap welding for thick section SS plates was also studied by Zhang et al.
2011. The study shows that a flawless weld of a 50 mm thick Type 316L SS can be
achieved using narrow gap laser welding. The groove geometries are described in
Fig. 2.11. [20].
Fig. 2.11 Groove geometry for narrow gap welding of 50 mm 316L [20]
The welding started with a root pass of an autogenous laser weld. It was succeeded
with four passes of build-up layers. The procedure of five passes was repeated on the

62
other side with similar parameters. The wire and shielding gas were fed from the
front of the laser beam, as illustrated in Fig. 2.12. The best results and flawless weld
were obtained at a laser power of 6 kW, welding speed 0.4 m/min, wire feed 5.5
m/min and focus spot size 0.69 mm [20].
Fig. 2.12 Experimental setup used by Zhang et al. 2011 [20]
Yu et al. 2013 tested NGLW of 17 mm thick Q235 LAS with filler wire H08Mn2Si.
The laser used was fibre laser YLR-4000 at 4 kW power. The wire feed angle was
70° and they used a special narrow nozzle to guide shielding gas to the narrow
welding groove to reduce the concavity of the root side. The experiments were made
with groove shapes described in Fig. 2.13 and parameters described in Table 2.5.

63
Fig. 2.13 Schematic diagram of NGLW of 17 mm LAS [18]
(V1:α=6.74º, b=4, c=6;V2:α=3.25º, b=2.8, c=5; V3:α=2.3º, b=2.4, c=5)
Table 2.5 Per pass parameters for Q235 LAS used by Yu et al. 2013 [18]
Pass
no:
Welding speed
[m/min]
Wire feed speed
[m/min]
Side blown
shielding gas
nozzle diam.
[mm]
Side blown
shielding gas
flow
[m3/h]
1 0.7 0 1.4 0.2
2 0.5 4.0 1.4 0.2
3 0.5 4.5 1.4 0.2
4 0.5 4.5 6.0 1.0
Certain uniformities can be found in the parameters for narrow gap laser welding
found in the literature. The laser beam is usually tilted a few degrees forward in
order to reduce back reflections to the laser source. As is the layout such that the
shielding gas and filler wire are introduced in front of the welding pool. [19, 20]
2.3.4 Hot Wire Laser Welding (HWLW)
A recent application of NGLW is the hot wire laser welding (HWLW). The gap
geometries used in hot wire laser welding are similar with very narrow grooves

64
offering the geometrical benefits [52, 53]. In HWLW the filler wire is attached to an
electric arc welding power source, but the voltage is kept low enough to prevent arc
formation. The concept is to heat the wire electrically prior to introducing it to the
melt pool. Westinghouse 2015 [52] lists the following benefits for HWLW:
Narrow grooves with up to 70 % volume reductions
High deposition rates, 5 times that of GTAW
Up to 90 % reduction of welding time in thick section welding
Lower distortion and residual stress
Reduced machining and non-destructive testing
Automated process
Improved welding performance on highly irradiated materials
Näsström et al. 2015 [53] reported that HWLW is sensitive to wire and laser
alignment, and a novel welding setup was designed to improve repeatability. They
report reaching 5 mm thick weld beads and using a wide laser spot improving the
quality of wetting, as it was found melting the sidewalls. They were using AR400
wear-resistant carbon steel.
Todo et al. 2015 [54] investigated HWLW of 9 % chromium steels P91 and KA-
SCMV28. They used a rectangular spot diode laser for welding up to 54 mm wall
thickness pipe. They reported low dilution and narrow HAZ. Fusion was improved if
a soft focus was used and the bead thickness was kept low.
In 2017 Näsström et al. [55] report that solidification cracking was observed on
HWLW of carbon steels. This phenomenon was more common in the filling passes
where the restraint was higher than during capping passes.

65
In 2016 Kaplan et al. [56] performed up to 14 mm thick welds in AR400 steel using
3 mm wide grooves. The process was found very flexible in terms of laser power and
welding speed used. They concluded that the electrical pre-heating of the filler wire
increased the performance and possibly improved the wetting.
It can be seen the characteristics of HWLW are similar to those of NGLW. The
major difference is in the deposition rate, which is higher in HWLW. Also, weld
pool behaviour such as wetting has been reported to improve when using a pre-
heated wire.
2.4 Present-day Solutions in Ferritic-Austenitic Dissimilar PWR
PCC Welding
The established practice in PWR PCC construction is to build the pressure vessels of
ferritic high strength low alloyed steel (HSLA or LAS) for its mechanical properties
and then clad the inner surface of the vessel with an austenitic stainless steel (SS)
layer to address the corrosion challenges [26]. The PCC piping is made of solid
stainless steel for simplicity.
The use of dissimilar metals in the construction of nuclear reactor components leads
to the need for dissimilar metal welding. Fang et al. [13] list typical locations for
dissimilar metal welds in PWR power plants. They can be found in several places in
the power plant, for example in the primary coolant circuit they are required in the
RPV nozzles, steam generator nozzles, the pressurizer and at the main circulating
pumps. An important detail in the pressure vessel is the pressure vessel head (PVH),
through which the control rod drive mechanism (CRDM) operates. The CRDM
assembly Fig. 2.14 is made of LAS and Alloy 690 [57].
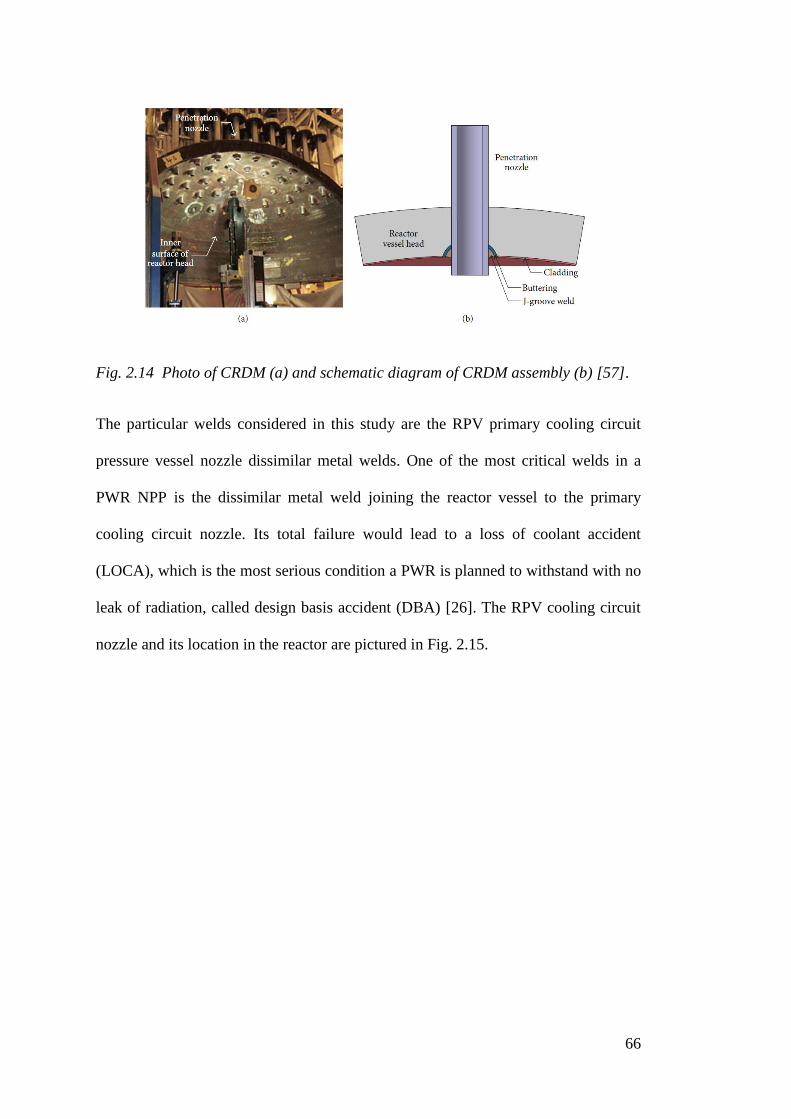
66
Fig. 2.14 Photo of CRDM (a) and schematic diagram of CRDM assembly (b) [57].
The particular welds considered in this study are the RPV primary cooling circuit
pressure vessel nozzle dissimilar metal welds. One of the most critical welds in a
PWR NPP is the dissimilar metal weld joining the reactor vessel to the primary
cooling circuit nozzle. Its total failure would lead to a loss of coolant accident
(LOCA), which is the most serious condition a PWR is planned to withstand with no
leak of radiation, called design basis accident (DBA) [26]. The RPV cooling circuit
nozzle and its location in the reactor are pictured in Fig. 2.15.

67
Fig. 2.15 Typical locations of dissimilar welds in a PWR [13].
2.4.1 Dissimilar Welding Processes and Geometries Used in PWR
Primary Cooling Circuit Manufacturing
The applications considered in this study are the ferritic-austenitic dissimilar welds
in the primary cooling circuit of a PWR power plant. An example of a current
arrangement of welding the RPV nozzle to the primary coolant circuit pipe is shown

68
in Fig. 2.15. The actual dissimilar GTAW is preceded with thick arc-buttering of the
ferritic RPV nozzle using a Ni alloy. Then an austenitic SS safe-end is added with
GTAW to provide a nozzle. The dissimilar metal weld is performed at manufacturer
facilities, which allows a similar metal weld to be used for the assembly at the power
plant construction site [13]. Other welding processes such as manual metal arc
welding (MMAW) [14] and submerged arc welding (SAW) [15] are also currently
used.
Fig. 2.16 illustrates a dimensioned drawing of an RPV PCC nozzle of a current
design NPP by Westinghouse. Concluding from the filler materials used, the welding
methods are arc welding, most likely GTAW for the buttering and MMAW for the
actual weld [14]. This illustrates both the geometry and the current very conservative
practices applied by the industry.

69
Fig. 2.16 Geometry and dimensions of Westinghouse AP1000 PWR RPV safe-end
dissimilar metal weld. A – SA508 ferritic steel, B – Alloy 82 buttering, C –
Alloy 182 weld, D- 316L austenitic SS. Note the cladding of RPV with SS
[14].
The Shanghai Company of Nuclear Power Equipment produced a full-scale RPV
nozzle joint. The nozzle outer diameter was 1001.6 mm and wall thickness was 83.5
mm. The SA 508 was pre-heated to 125 °C. The buttering was applied with a total of
478 weld passes at a welding speed of 1.85 mm/s. The buttering was deposited with

70
GTAW creating a 20 mm thick layer. Then the buttered layer was heat treated
annealing it at 610 °C for 15 hours with furnace cooling to 300 °C to relieve residual
stresses. After that, a 100 % NDT ultrasound test was performed. The actual welding
took 439 GTAW passes at 1.75 mm / s to form a 19 mm wide weld [30]. Calculating
from the figures above, the buttering and welding took over 400 hours in total, not
including inspection and setup work.
The rationale behind PWHT is to reduce residual stresses and temper the
microstructure to restore toughness [16]. It has been found that the post weld heat
treatment affects the corrosion fatigue and SCC crack growth in simulated PWR
conditions. Huang et al. (2013) conclude that a long heat treatment at 621°C can
increase the crack growth rate, but a lower temperature heat treatment can improve
the corrosion resistance properties compared to in the as welded condition [58].
Primary cooling circuit dissimilar welds are needed also at steam generator nozzles.
An example of a design is presented as Fig. 2.17. One other application is the
pressuriser surge nozzle pictured in Fig. 2.18 and Fig. 2.19. In 2010 Rudland et al.
[59] report using a 35 mm wall thickness for their simulation of residual stresses at a
pressuriser surge line nozzle DMW.
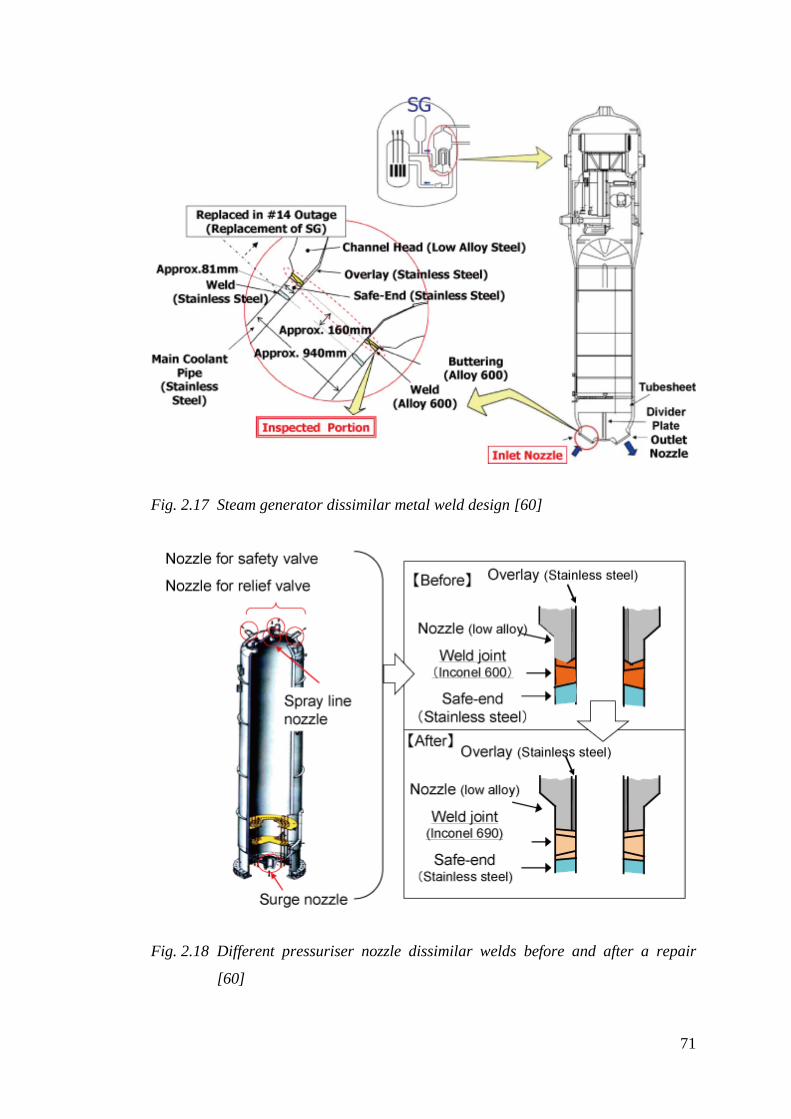
71
Fig. 2.17 Steam generator dissimilar metal weld design [60]
Fig. 2.18 Different pressuriser nozzle dissimilar welds before and after a repair
[60]

72
Fig. 2.19 Pressuriser surge line nozzle design and dimensions [61]
2.4.2 Metals Used in PWR Primary Cooling Circuit Construction
Both low alloy steels and austenitic stainless steels are widely used in PWR nuclear
power plants. Typical examples are the various pressure vessels in the primary
cooling circuit made of LAS and clad with SS. The major branch lines of the primary
cooling circuit are made of SS to provide the required strength and corrosion
resistance [13]. Low alloyed ferritic ASME SA508 is widely used in RPVs The
cooling circuit piping is often made of austenitic stainless steel AISI 316L [13, 62].
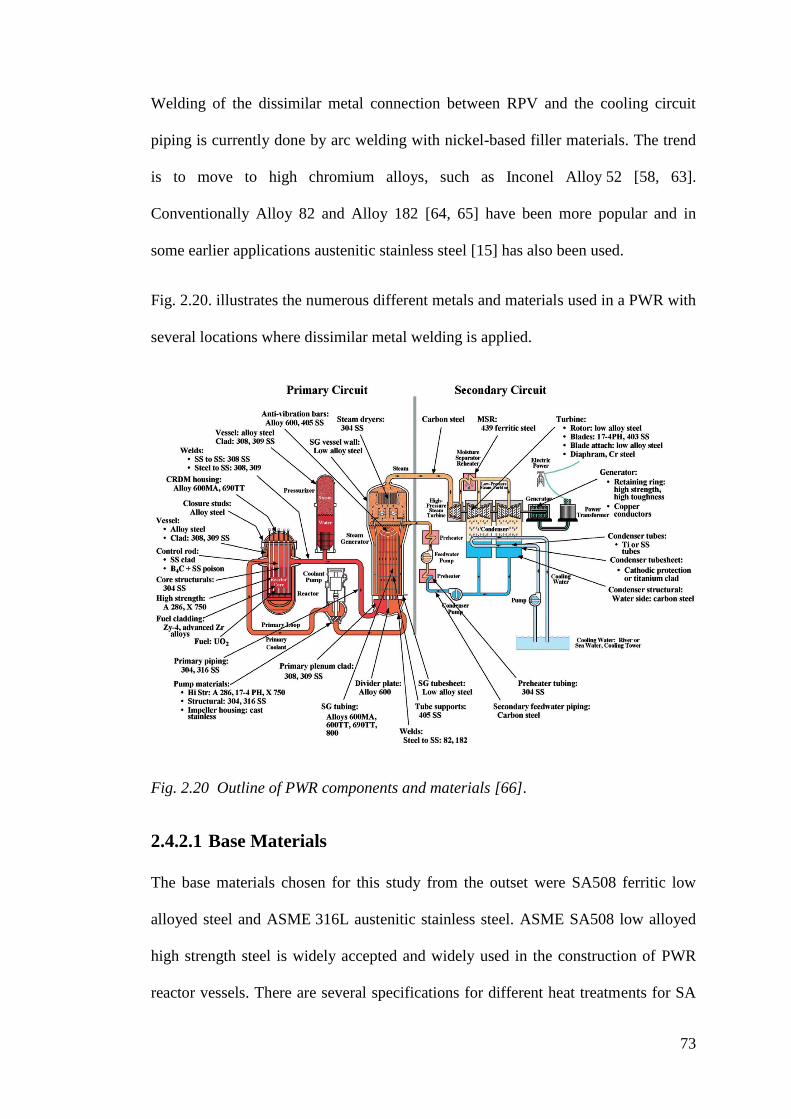
73
Welding of the dissimilar metal connection between RPV and the cooling circuit
piping is currently done by arc welding with nickel-based filler materials. The trend
is to move to high chromium alloys, such as Inconel Alloy 52 [58, 63].
Conventionally Alloy 82 and Alloy 182 [64, 65] have been more popular and in
some earlier applications austenitic stainless steel [15] has also been used.
Fig. 2.20. illustrates the numerous different metals and materials used in a PWR with
several locations where dissimilar metal welding is applied.
Fig. 2.20 Outline of PWR components and materials [66].
2.4.2.1 Base Materials
The base materials chosen for this study from the outset were SA508 ferritic low
alloyed steel and ASME 316L austenitic stainless steel. ASME SA508 low alloyed
high strength steel is widely accepted and widely used in the construction of PWR
reactor vessels. There are several specifications for different heat treatments for SA
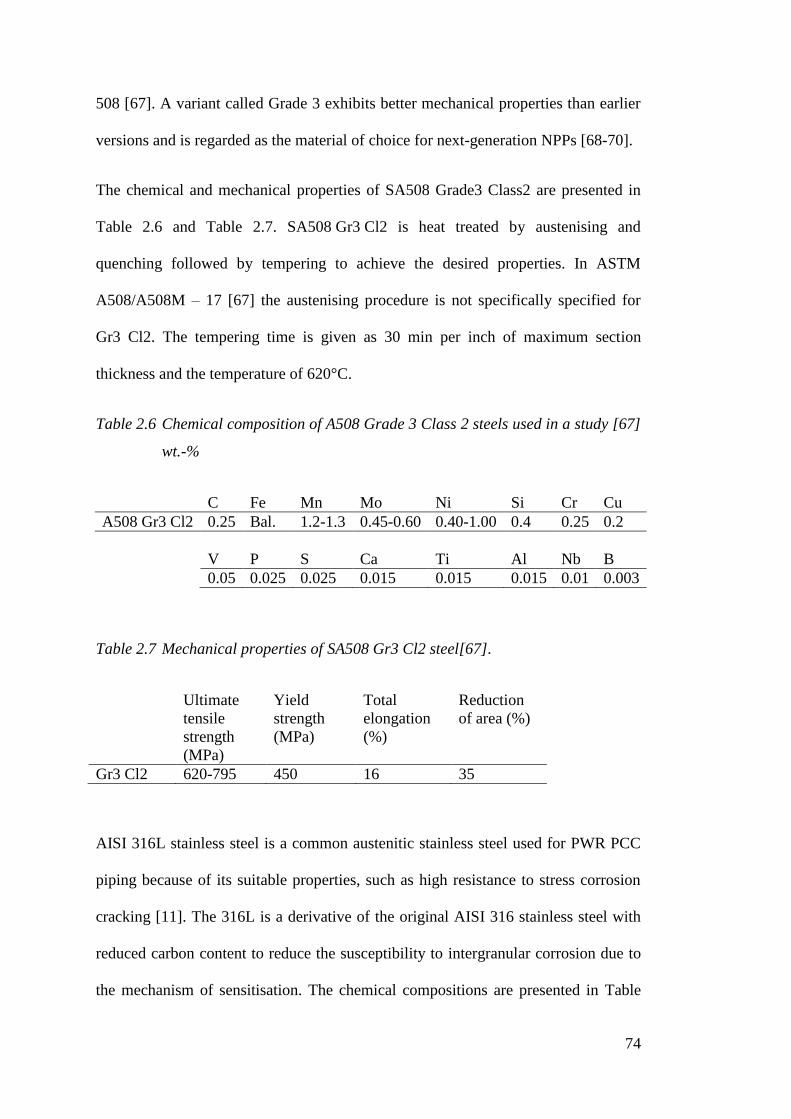
74
508 [67]. A variant called Grade 3 exhibits better mechanical properties than earlier
versions and is regarded as the material of choice for next-generation NPPs [68-70].
The chemical and mechanical properties of SA508 Grade3 Class2 are presented in
Table 2.6 and Table 2.7. SA508 Gr3 Cl2 is heat treated by austenising and
quenching followed by tempering to achieve the desired properties. In ASTM
A508/A508M – 17 [67] the austenising procedure is not specifically specified for
Gr3 Cl2. The tempering time is given as 30 min per inch of maximum section
thickness and the temperature of 620°C.
Table 2.6 Chemical composition of A508 Grade 3 Class 2 steels used in a study [67]
wt.-%
C Fe Mn Mo Ni Si Cr Cu
A508 Gr3 Cl2 0.25 Bal. 1.2-1.3 0.45-0.60 0.40-1.00 0.4 0.25 0.2
V P S Ca Ti Al Nb B
0.05 0.025 0.025 0.015 0.015 0.015 0.01 0.003
Table 2.7 Mechanical properties of SA508 Gr3 Cl2 steel[67].
Ultimate
tensile
strength
(MPa)
Yield
strength
(MPa)
Total
elongation
(%)
Reduction
of area (%)
Gr3 Cl2 620-795 450 16 35
AISI 316L stainless steel is a common austenitic stainless steel used for PWR PCC
piping because of its suitable properties, such as high resistance to stress corrosion
cracking [11]. The 316L is a derivative of the original AISI 316 stainless steel with
reduced carbon content to reduce the susceptibility to intergranular corrosion due to
the mechanism of sensitisation. The chemical compositions are presented in Table

75
2.8. Nominal mechanical properties of AISI 316L in an annealed condition are
presented in Table 2.9.
Table 2.8 Standard chemical composition of AISI 316 and AISI 316L wt.-% [71, 72]
C
max
Mn
max
P
max
S
max
Si
max
Cr Ni Mo N
AISI
316
0.08 2 0.045 0.03 1 16.00 –
18.00
10.00 –
14.00
2.00-
3.00
0.1
AISI
316L
0.03 2 0.045 0.03 1 16.00 –
18.00
10.00 –
14.00
2.00-
3.00 0.1
Table 2.9 Mechanical properties of AISI 316L annealed [71].
Tensile
Strength
[MPa]
Yield
Strength
[MPa]
Elongation
%
Reduction in
area
%
Hardness
[HB]
Hardness
[HV]*
550 200 45 55 140 142
* Converted from HB by [73]
In a real-life study [74] the chemical composition of a batch of AISI 316L was
investigated in detail. This is presented in Table 2.10. The actual carbon content was
found to be much lower than the standard maximum value. This will have
significance in lowering carbon migration and, hence, reducing susceptibility to
sensitisation.
Table 2.10 Chemical composition 316L wt.-% [74]
C Cr Ni Si Mn Mo Al Co
316L 0.016 17.68 12.6 0.663 1.53 2.38 0.018 0.121
Cu Nb Ti V W Fe P S
0.211 0 0.021 0.663 0.029 64.42 0.02 0.003
76
2.4.2.2 Filler Metals
Filler metals for welding of dissimilar ferritic-austenitic steels have changed through
the decades. The first successful industrial applications were in the 1940s. The early
welds were made with austenitic stainless steel filler metal. These were later found to
be prone to failure due to creep in prolonged use. This problem was largely solved
by introducing nickel-based filler materials to reduce the difference of thermal
expansion coefficients between LAS and SS. However nickel based materials have
also been found to fail due to stress corrosion cracking after decades of use [64, 75-
77].
INCONEL Filler Metal 82 (FM82) and INCONEL Welding Electrode 182 (WE182)
[78, 79], commonly abbreviated as Alloy 82 and Alloy 182 respectively, have been
widely used in dissimilar welds between LAS and SS in the nuclear industry. They
have a composition similar to the Alloy 600 base material. Inconel Filler Metal 52
and Inconel Welding Electrode 152 are typical high chromium welding consumables
[80, 81] for dissimilar welding and are more resistant to SCC. These have
compositions nearly matching the composition of Alloy 690.
Due to widely observed stress corrosion cracking (SCC) in welds made with alloy
182 welding rods in many PWRs currently in use [82, 83], the trend in recent
decades has been to use higher chromium content FM52 and WE152, which have
better resistance to SCC. The mechanism improving SCC resistance is segregation of
Cr to the solidification boundaries [84]. The ability to retard carbon migration to the
weld is also in favour of using alloy 52 in dissimilar welds [85]. Repairing SCC in
Alloy 82 based welds using Alloy 52 has been reported [8, 23]. They have also been
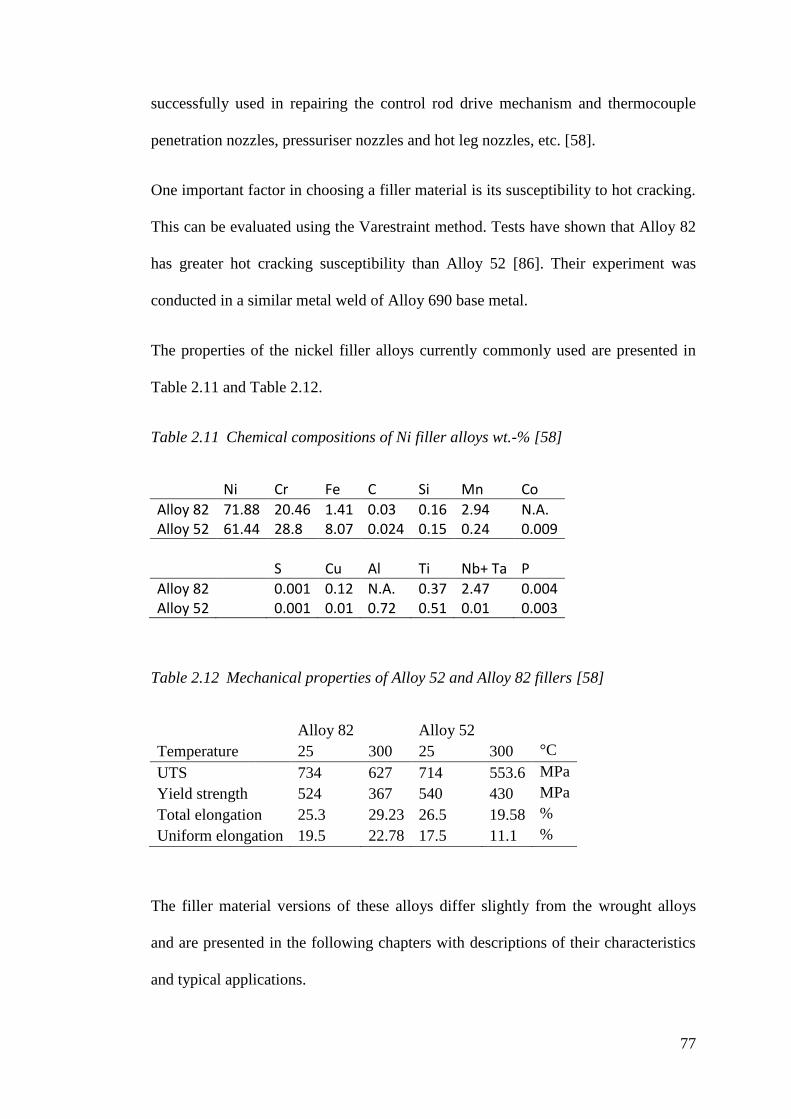
77
successfully used in repairing the control rod drive mechanism and thermocouple
penetration nozzles, pressuriser nozzles and hot leg nozzles, etc. [58].
One important factor in choosing a filler material is its susceptibility to hot cracking.
This can be evaluated using the Varestraint method. Tests have shown that Alloy 82
has greater hot cracking susceptibility than Alloy 52 [86]. Their experiment was
conducted in a similar metal weld of Alloy 690 base metal.
The properties of the nickel filler alloys currently commonly used are presented in
Table 2.11 and Table 2.12.
Table 2.11 Chemical compositions of Ni filler alloys wt.-% [58]
Ni Cr Fe C Si Mn Co
Alloy 82 71.88 20.46 1.41 0.03 0.16 2.94 N.A. Alloy 52 61.44 28.8 8.07 0.024 0.15 0.24 0.009
S Cu Al Ti Nb+ Ta P
Alloy 82 0.001 0.12 N.A. 0.37 2.47 0.004 Alloy 52 0.001 0.01 0.72 0.51 0.01 0.003
Table 2.12 Mechanical properties of Alloy 52 and Alloy 82 fillers [58]
Alloy 82
Alloy 52
Temperature 25 300 25 300 °C
UTS
734 627 714 553.6 MPa
Yield strength 524 367 540 430 MPa
Total elongation 25.3 29.23 26.5 19.58 %
Uniform elongation 19.5 22.78 17.5 11.1 %
The filler material versions of these alloys differ slightly from the wrought alloys
and are presented in the following chapters with descriptions of their characteristics
and typical applications.

78
Inconel Filler Metal 82 is used for gas tungsten arc (GTA), gas metal arc welding
(GMAW) and submerged arc (SMA) welding. It is described to have high strength
and good corrosion resistance at elevated temperatures. It is also used to join ferritic
steels to austenitic stainless steels, see Table 2.13 [78].
Table 2.13 Chemical composition of Filler Metal 82 [78]
Ni+
Co
Cr C Ti Mn Fe P S Nb+
Ta
Si Ti Cu Others
FM
82
67 18.0
–
22.0
0.10
max
0.75
max
2.5
–
3.5
3.0
max
0.030
max
0.015
max
2.0 –
3.0
0.50
max
0.75
max
0.30
max
0.50
max
Filler Metal 52 is designed for GTA and GMAW of Inconel Alloy 690. It is also
useful for dissimilar joints involving carbon, low alloy and stainless steels. The
chemical specification of Filler Metal 52 is presented in Table 2.14. [80]
Table 2.14 Chemical composition of Filler Metal 52 wt.-% [80]
Ni + Co Cr C Ti Mn Al Fe P
FM 52 rem 28.0 – 31.5 0.04 max 1.0 max 1.0 max 1.10 max 7.0 – 11.0 0.02 max
S Nb+ Ta Si Al + Ti Mo Cu Others
0.015 max 0.10 max 0.50 max 1.5 max 0.50 max 0.30 max 0.50 max
Filler Metal 52M, Table 2.15, is designed for GTA and GMW of Inconel Alloy 690
and overlaying of carbon and stainless steels. The high chromium level provides
excellent resistance to SCC in nuclear water environments. This alloy contains boron
and zirconium to minimise the tendency of ductility-dip cracking (DDC). It is
especially resistant to oxide “floaters” and inclusions [87].
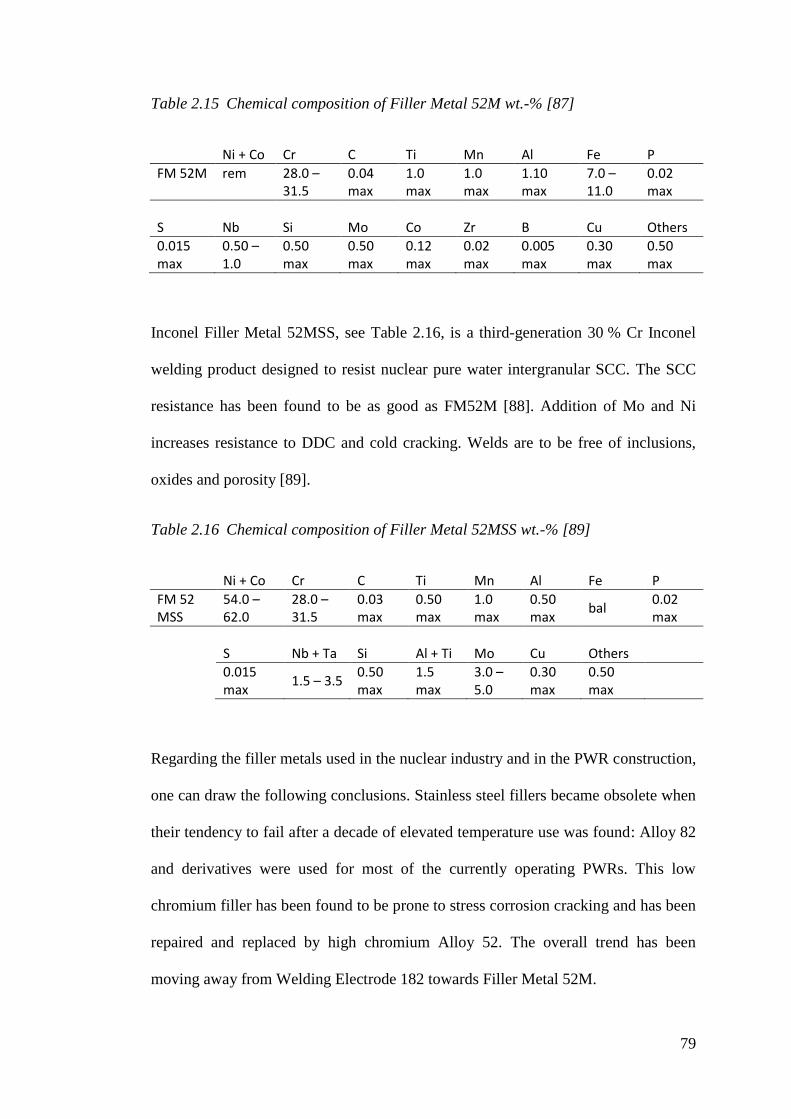
79
Table 2.15 Chemical composition of Filler Metal 52M wt.-% [87]
Ni + Co Cr C Ti Mn Al Fe P
FM 52M rem 28.0 – 31.5
0.04 max
1.0 max
1.0 max
1.10 max
7.0 – 11.0
0.02 max
S Nb Si Mo Co Zr B Cu Others
0.015 max
0.50 – 1.0
0.50 max
0.50 max
0.12 max
0.02 max
0.005 max
0.30 max
0.50 max
Inconel Filler Metal 52MSS, see Table 2.16, is a third-generation 30 % Cr Inconel
welding product designed to resist nuclear pure water intergranular SCC. The SCC
resistance has been found to be as good as FM52M [88]. Addition of Mo and Ni
increases resistance to DDC and cold cracking. Welds are to be free of inclusions,
oxides and porosity [89].
Table 2.16 Chemical composition of Filler Metal 52MSS wt.-% [89]
Ni + Co Cr C Ti Mn Al Fe P
FM 52 MSS
54.0 – 62.0
28.0 – 31.5
0.03 max
0.50 max
1.0 max
0.50 max
bal 0.02 max
S Nb + Ta Si Al + Ti Mo Cu Others
0.015 max
1.5 – 3.5 0.50 max
1.5 max
3.0 – 5.0
0.30 max
0.50 max
Regarding the filler metals used in the nuclear industry and in the PWR construction,
one can draw the following conclusions. Stainless steel fillers became obsolete when
their tendency to fail after a decade of elevated temperature use was found: Alloy 82
and derivatives were used for most of the currently operating PWRs. This low
chromium filler has been found to be prone to stress corrosion cracking and has been
repaired and replaced by high chromium Alloy 52. The overall trend has been
moving away from Welding Electrode 182 towards Filler Metal 52M.
80
2.5 Considerations in Austenitic-Ferritic Dissimilar Metal Welding
in PWR Cooling Circuit
There are many phenomena taking place in the weld metal and the heat affected zone
adjacent to it. In the case of dissimilar welding, the phenomena are various and often
complex.
When welding carbon steels to austenitic steels in nuclear applications a filler
material with increased nickel and chromium is often used. The increased alloy
content helps form a similar composition in the weld when diluted with the carbon
steel base material. Nickel-based fillers are used particularly in high-temperature
applications because the thermal expansion coefficient is closer to carbon steel
compared to austenitic filler [90]. In nuclear dissimilar welding applications, nickel
alloys are used extensively [83].
The method currently used in nuclear dissimilar welding involves buttering of the
ferritic RPV steel with nickel alloy [12, 14]. This is done by weld depositing a layer
of nickel alloy on the ferritic steel. During the buttering process, the HAZ of the low
alloy steel develops a brittle martensitic structure, which has to be tempered with
post weld heat treatment [75]. The buttered ferritic steel can receive the heat
treatment required before the final welding. This eliminates the need to perform
PWHT to the final joint [90]. PWHT of the whole joint would cause sensitisation of
the stainless steel base material which increases the susceptibility to intergranular
corrosion [91, 92].

81
2.5.1 Corrosion
Corrosion is defined by ISO as “a physicochemical interaction leading to a
significant deterioration of the functional properties of either a material, or the
environment with which it has interacted, or both of these”. Over the chemical
aspects, an important aspect considering welding of metals, this definition includes
combinations of environmental deterioration where these are influenced with stresses
within the material [93]. The residual stresses caused by welding, for example, have
been found to be a significant source of SCC [94]. PWSCC (primary water stress
corrosion cracking) in PWR reactors has been reported extensively [7, 8, 23, 83] and
has been studied by several researchers [15, 85, 95].
Couvant (2013) describes the problem as “a large variety of the structural metals
present in primary and secondary circuits of pressurized water reactors suffer
corrosion. Uniform corrosion, flow-accelerated corrosion (FAC), pitting, stress
corrosion cracking, environmentally assisted fatigue and hydrogen embrittlement can
all affect the major components of PWRs, despite stringent selection of materials for
component manufacture” [7].
As the PWR primary coolant partially serves the purpose of a neutron moderator, its
pH is acidic. To control corrosion, the coolant chemistry has to be managed within
strict limits. The objectives of the coolant chemistry management are to minimise all
types of corrosion of materials, to assure fuel-cladding integrity, to assure pressure
boundary integrity and to optimise the radio-protection of workers by minimising the
corrosion and cation release and their activation in the reactor core [96].
Stainless steels are resistant to corrosion and therefore used in numerous applications
in PWR cooling circuits. The interior of the LAS pressure vessel in a PWR is clad
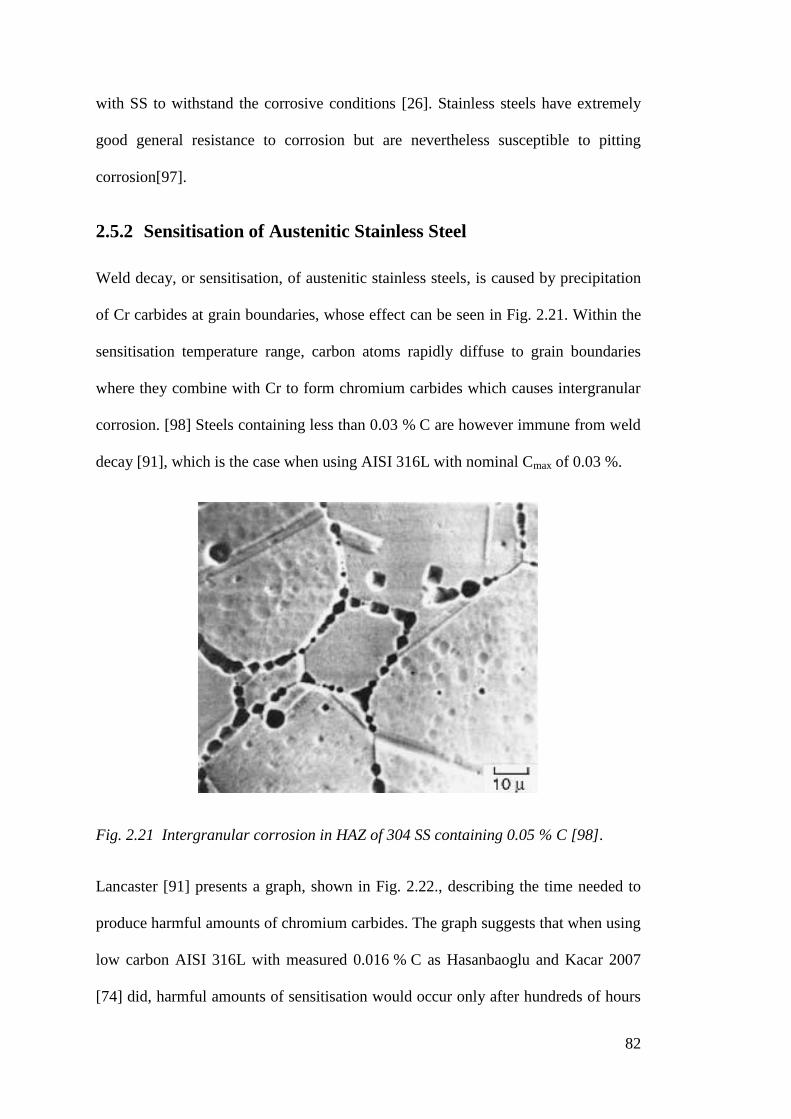
82
with SS to withstand the corrosive conditions [26]. Stainless steels have extremely
good general resistance to corrosion but are nevertheless susceptible to pitting
corrosion[97].
2.5.2 Sensitisation of Austenitic Stainless Steel
Weld decay, or sensitisation, of austenitic stainless steels, is caused by precipitation
of Cr carbides at grain boundaries, whose effect can be seen in Fig. 2.21. Within the
sensitisation temperature range, carbon atoms rapidly diffuse to grain boundaries
where they combine with Cr to form chromium carbides which causes intergranular
corrosion. [98] Steels containing less than 0.03 % C are however immune from weld
decay [91], which is the case when using AISI 316L with nominal Cmax of 0.03 %.
Fig. 2.21 Intergranular corrosion in HAZ of 304 SS containing 0.05 % C [98].
Lancaster [91] presents a graph, shown in Fig. 2.22., describing the time needed to
produce harmful amounts of chromium carbides. The graph suggests that when using
low carbon AISI 316L with measured 0.016 % C as Hasanbaoglu and Kacar 2007
[74] did, harmful amounts of sensitisation would occur only after hundreds of hours

83
of heat treatment at 600 °C. This indicates a possibility to heat treat the troublesome
ferritic-nickel boundary post welding and avoid the buttering altogether, as opposed
to current practice.
Fig. 2.22 The effect of carbon content on carbide precipitation [91]
Huang et al. studied the environmentally assisted cracking of DM welds of SA 508
using Alloy 52 and Alloy 82 in a simulated BWR environment. Their observation
was that a PWHT of 24 h at 621 °C increased the crack growth rates compared to the
as welded state. However, a PWHT of 8 h at 621 °C continued for 200 h at 400 °C
showed improvement of the corrosion resistance [58].
If the rationale for avoiding PWHT of the stainless steel safe-end is to avoid the
sensitisation of the stainless steel component, it can be argued, that according to this
literature review the sensitisation of real-life 316L stainless steels is not going to
occur during a typical PWHT cycle. Combining the chemical analysis of a real 316L
carbon content from Table 2.10 and the effect of carbon content on carbide
precipitation from Fig. 2.22 indicates, that a 0.016 % C steel would stand well over
100 h of heat treatment at any temperature.

84
2.5.3 Residual Stresses
The external loadings are important factors in designing any mechanical structures
and usually the external loading is the most easily considered factor. However, other
factors often play a determining role. The other contributing elements include
unfavourable microstructures, the likelihood of pre-existing defects and residual
stresses. There are many ways in which failure can occur including brittle fracture,
plastic collapse, fatigue, creep and stress corrosion cracking. Compared with the
attention received by the microstructure and defects, the residual stresses have
received relatively little attention. It is clearly important that the origins of residual
stresses are recognised [99].
Residual stresses are stresses that would exist in a body if all external loads were
removed. They are sometimes called internal stresses. Residual stresses that exist in
a body that has previously been subjected to non-uniform temperature changes, such
as those during welding, are often called thermal stresses [98]. Welding is one of the
most significant causes of residual stresses and typically produces large tensile
stresses. The development of residual stresses in dissimilar metal welding has been
widely studied [100-103].
There are several ways to estimate and compute the residual stresses created in
dissimilar welding and the necessary cladding thereafter. In 2006 Gilles & Nouet
[104] developed a numerical method for prediction of residual stresses in a PWR
PCC weld. Deng et.al. (2009) [105] suggested a simplified method considering
cladding, buttering, post weld heat treatment and multi-pass welding using a united
fashion. In 2011 they [101] presented a time-effective 3-D finite element model to
simulate welding residual stresses through a simplified moving heat source.

85
One of the biggest motives for investigating NGLW on thick dissimilar welding is
probably from the results published by Elmesalamy et al. in 2014 [11]. They
compared residual stresses of GTA welding and NGLW in 20 mm AISI 316L welds
and found the longitudinal tensile stresses to be 30 – 40 % lower in the case of
NGLW [11]. It should be noted that these tests were made using only 20 mm
thickness plate and the weld was not dissimilar.
2.5.3.1 Types of Residual Stresses
Different types of stress are characterised according to the characteristic length scale
over which they self-equilibrate. Residual stresses originate from misfits between
different regions. In many cases, these misfits span large distances, for example,
those caused by welding or heat treatment operations [106]. Fig. 2.23 illustrates
examples of residual stresses. In this study, the residual stresses resulting from
welding are to be evaluated.
Fig. 2.23 Examples of different types of residual macro- and micro-residual stress
[99]

86
There are at least four ways in which macro residual stresses can form: due to
misfitting parts in an assembly, and due to the generation of chemical, thermal, and
plastically induced misfits between different regions within one part [107]. Residual
stresses formed by a simple case of welding are presented in Fig. 2.24.
Fig. 2.24 Schematic representation of changes of temperature and longitudinal
thermal residual stresses during bead-on-plate welding [99]
The residual stresses caused by welding are of type I stresses because they span over
large distances. The residual stresses that vary over the grain scale are type II and in
atomic-scale type III. It is worth noting, that different scale residual stresses don’t
record in tests of other scales. For example, type II and III stresses don’t show in
measurements for type I [106].
In a single pass weld, the following observations have been reported. In the case of a
solid-state transforming material, the stress distribution has a distinctive M-shape
[108]. The residual stress distribution in a non-transforming material weld is more
like an inverted U shape with a single peak, see Fig. 2.24.
87
In a multi-pass weld, the overlaying passes heat treat the passes already made. This
will reduce the residual stresses considerably and the M or inverted U shapes are
only observed close to the top of the weld.
2.5.4 Environmentally Assisted Cracking and Stress Corrosion
Cracking
In 1991 Marston and Jones [9] state that in the last three decades environmentally-
assisted cracking (EAC) of structural materials in light water reactors (LWR) has
been one of the major causes of lost availability in both boiling water reactors
(BWR) and PWRs. They conclude that this has resulted in significant economic
losses.
An understanding of EAC, more accurately stress corrosion cracking is especially
important in the case of welded structures. One important challenge is the residual
stresses which are emphasised with differences in thermal coefficients in the
materials joined [11].
SCC is sometimes understood either in a narrow sense: EAC under purely static
mechanical loading or as part of the broader spectrum of EAC including the
transition to strain-induced corrosion cracking (SICC) and low-cycle corrosion
fatigue (LCF). When classified by the external loading the types can be related to
different operational states of an NPP. SICC and LCF are experienced during
transitions in operation, e.g. start-up or shutdown. SCC occurs during steady-state
operation due to static loading [109]. Different types of EAC are described in Table
2.17.

88
Table 2.17 Basic types of EAC [33].
Designation Type of mechanical loading
Stress corrosion cracking (SCC) Static
Strain-induced corrosion cracking
(SICC)
Dynamic — slow monotonically rising
or very low-cycle
Corrosion fatigue (CF) Cyclic — low-cycle, high-cycle
Several studies acknowledge SCC being observed in primary cooling circuit nozzles
near the dissimilar weld [7, 58, 95, 100, 110]. Ihara et al. 2011 [110] report SCC
being found near the weld zone of the core shroud and primary loop recirculation
pipes made of Type 304 austenitic stainless steel. The initiation and propagation of
SCC result from the superposition effect of sensitisation due to the temperature
history of welds, the corrosive atmosphere and the residual stress due to welding.
The problems have been addressed by changing the steel to low-carbon type 316L
austenitic stainless steel. Nevertheless, SCC has been found regardless of the
absence of sensitisation. The conclusion has been that residual stresses have a bigger
effect on SCC than the material or sensitisation. Ihara et al. 2011 [110] conclude that
the effect of machining is significant, especially in the early stages of crack growth,
and should be studied further. The SCC happening with or without sensitisation
gives an opportunity to consider PWHT of the whole weld avoiding buttering
altogether as the buttering is only made to avoid exposing the SS nozzle to the
PWHT temperature cycle.
As a result of full suppression of water radiolysis in the PWR primary coolant
circuit, it has been reported that the major water chemistry factor to determine
primary water stress corrosion cracking is not oxygen but hydrogen [111].

89
Chung [85] studied the microstructure and SCC behaviour in dissimilar welds
between A508 and Alloy52. They noticed in their study that post weld heat treatment
caused the near weld interface layer to transform to martensite, carbides and Type II
boundaries. The presence of Type II boundaries causes a reduction of resistance to
SCC and formed intergranular cracking under simulated PWR conditions [85]. The
welding process was conventional multipass GTAW and the microstructural
conditions may not be transferable to NGLW as such.
Karlsen (2010) [112] addressed the significance of localised deformations to the
development of stress corrosion cracking in stainless steels in PWR PCC
environment. The sources of deformations listed included the welding distortions.
2.5.5 DMW Creep Failure in the HAZ of Low Alloy Steel
The decisive factor for selecting nickel alloys for ferritic – austenitic steel dissimilar
metal welding is the similarity of the coefficient of thermal expansion (CTE) of the
ferritic steel and Ni alloys. Previously the difference in CTEs between the austenitic
stainless steel filler and the ferritic steel caused detrimental tensile thermal stresses in
the ferritic steel. This phenomenon was explained by Klueh and King in 1982 [113].
Creep failure in a low alloyed steel (LAS) heat affected zone after 10 to 15 years of
elevated temperature service had been reported when an austenitic stainless steel
filler was used [113]. The phenomenon was found to onset by a soft LAS HAZ
microstructure formed due to carbon migration to the Cr rich weld metal. The carbon
migration starts during welding and develops during PWHT and elevated
temperature use. The soft ferritic microstructure creep fails along the ferrite grain
boundaries under residual and thermal stresses due to the difference in CTE in HAZ
and WM [113]. To avoid the high thermal stresses the CTE mismatch is shifted to

90
the stainless steel fusion line by using nickel alloy as weld metal. The stainless steel
fusion line is much stronger and more crack-resistant [113].
Research made by W. Childs at EPRI (Electric Power Research Institute) shows a
significant increase in the service life of dissimilar welds using nickel alloys, see Fig.
2.25. The data is collected from various power plants around the world. The use of
Ni-alloys is recommended for service temperatures exceeding 425°C [75].
Fig. 2.25 Comparison of the average life of dissimilar welds, Type 309 austenitic
steel = 1. FM82 both high (H) and low (L) heat input welds are included
[75].
2.5.6 Radiation Damage
Electrons, gamma rays, neutrons and heavy charged particles can cause excitation,
ionisation and disassociation of materials. Organic materials are relatively weak but,
although stronger, metals are also affected. Metals in nuclear reactors exhibit
increases in tensile strength and hardness, but a reduction in ductility. The degree of
damage tends to be lower the higher the temperature because displaced atoms can
more easily return to their original places [25].
91
As continuous neutron irradiation changes the properties of materials in a nuclear
reactor, the effects on the ductile-brittle-transition-temperature (DBTT) are
monitored using prefabricated Charpy test pieces put into the RPV before bringing
the reactor to critical. These are then tested destructively at regular intervals. This
procedure poses a challenge in extending the plants’ operational life beyond the
originally planned service life. It is not possible to add these test pieces during the
operation of the plant and if they run out, a new non-destructive testing (NDT)
method of testing has to be implemented. This can be tedious since no NDT method
can give direct mechanical results as a Charpy test does. Therefore several tests have
to be conducted and correlation to DBTT statistically proved [114].
It has been found that the embrittlement process is very complicated and depends on
several factors such as chemical composition, irradiation temperature, irradiation
flux and fluence etc. Some semi-empirical laws have been established, based on the
macroscopic data, but unfortunately, these laws are never completely consistent with
all data and do not yield the wanted accuracy [115]. This, maybe one of the reasons
for the nuclear industry’s well known conservative attitude towards new
technologies, indicates that using tried and practice proven materials is beneficial
when introducing new methods to the industry.
2.6 Dissimilar Metal Welding (DMW)
Discontinuities in grain structure are characteristic for dissimilar metal welding. In
ferritic steel welds using nickel filler, instead of normal epitaxial grain growth,
different growth types occur and the resulting microstructure can be complex [75].
The focus of this study is at the ferritic steel to austenitic weld metal fusion line.
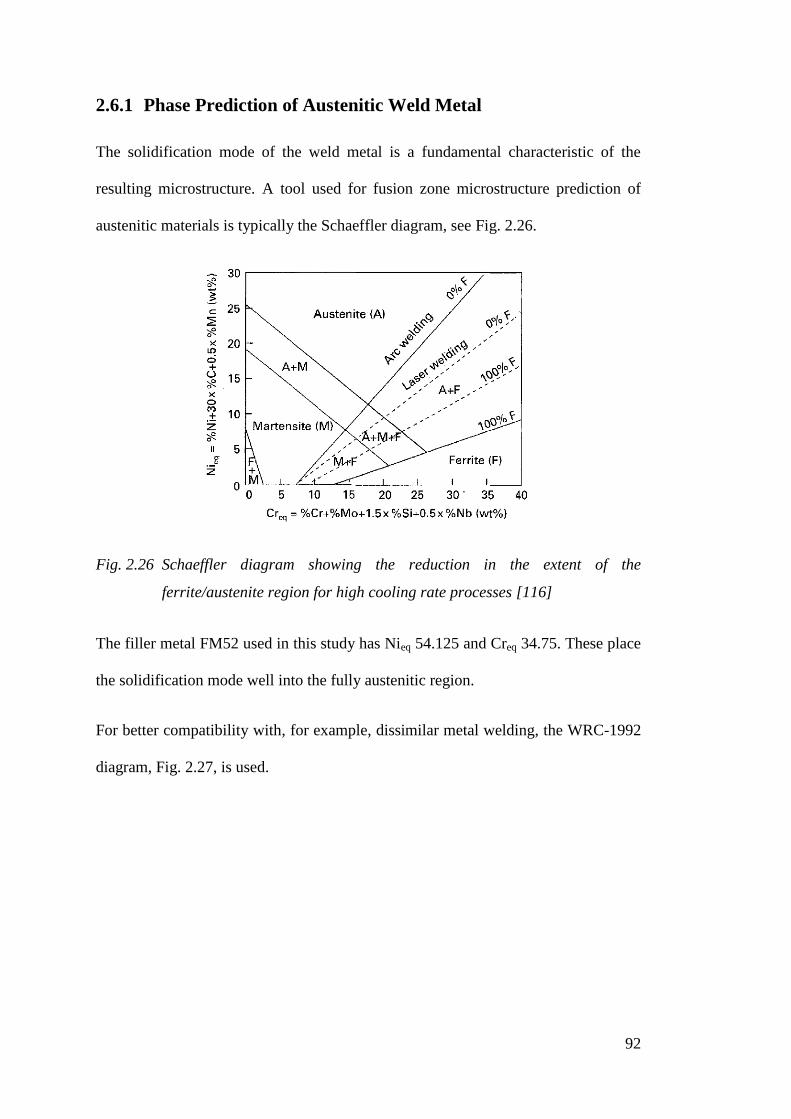
92
2.6.1 Phase Prediction of Austenitic Weld Metal
The solidification mode of the weld metal is a fundamental characteristic of the
resulting microstructure. A tool used for fusion zone microstructure prediction of
austenitic materials is typically the Schaeffler diagram, see Fig. 2.26.
Fig. 2.26 Schaeffler diagram showing the reduction in the extent of the
ferrite/austenite region for high cooling rate processes [116]
The filler metal FM52 used in this study has Nieq 54.125 and Creq 34.75. These place
the solidification mode well into the fully austenitic region.
For better compatibility with, for example, dissimilar metal welding, the WRC-1992
diagram, Fig. 2.27, is used.

93
Fig. 2.27 WRC-1992 diagram for predicting ferrite content and solidification mode
[98]
The equations for WRC-1992 give Nieq 53.9 and Creq 32.07 for FM52. These place
the predicted solidification mode again strongly in the fully austenitic area. This
mode will be expected even with a relatively high dilution of the ferritic or the
austenitic steels.
2.6.2 Solidification Mechanisms in Dissimilar Metal Welding
In similar metal welds, where the crystal structure does not differ between weld
metal and base material, epitaxial nucleation during solidification along the fusion
boundary gives rise to grain boundaries that are continuous from the base metal into
weld metal across the fusion boundary. These boundaries are roughly perpendicular
to the fusion boundary and have been referred to as Type I boundaries, see “Normal
Fusion Boundary” in Fig. 2.28 [75, 98]. This is the case, at the austenitic stainless
steel to austenitic filler metal fusion line in this study.

94
Fig. 2.28 “Normal” grain growth with Type I grain boundaries and the grain
growth exhibiting Type II boundaries in a dissimilar metal weld [98]
In the case of body centric cubic (BCC) ferritic LAS being welded with austenitic
face centric cubic (FCC) nickel filler metal the epitaxial growth is not possible, but
the new grains have to nucleate differently. In this case heterogeneous nucleation
starts at random misorientations at the fusion boundary [98].
In dissimilar welds, where an austenitic weld metal and ferritic base metal exist, a
second type of boundary that runs roughly parallel to the fusion boundary is often
observed; see Fig. 2.28. This has been referred to as a Type II boundary [117]. Type
II boundaries form at the prior austenite boundaries of the base material, a few
microns into the weld metal from the fusion boundary, Fig. 2.29 [75]. These
boundaries typically have no continuity across the fusion boundary to grain
boundaries in the base metal. Several investigators have reported that hydrogen-
induced disbonding typically follows Type II grain boundaries. The disbonding

95
phenomenon that occurs following fabrication and prior to service has also been
associated with these Type II boundaries [117].
Fig. 2.29 Dissimilar metal fusion line and the formation mechanism of Type II
boundaries [75]
The grain growth in weld metal continues, regardless of the initiation, as competitive
growth [98]. This makes the weld metal bulk near symmetric in general appearance.
2.6.3 The Heat Affected Zone
In welding, the part of BM which undergoes metallurgical changes but does not melt
is called the heat affected zone (HAZ). Properties of the HAZ are important in
achieving a proper weld. The yield and ultimate strength of HAZ are almost always
higher than the base material, causing no problems. The properties of main interest
are fracture toughness and hardness. In a weld of low carbon steel, there can be
defined three major regions. The least affected area is called the partial grain-
refining region, which is followed by a grain-refining region and often the most
important grain-coarsening region [118]. A diagram of the HAZ zones of a low

96
carbon steel by Easterling [119] is presented as Fig. 2.30. Another classification
often used is presented as Fig. 2.31
Fig. 2.30 A diagram of the zones in the HAZ of a 0.15 wt.% C steel [119]
Fig. 2.31 Another classification of the low alloy steel HAZ subzones [120].
97
Depending on the distance from the fusion zone the HAZ goes through different heat
cycles. The coarse-grained region is the part that has been heated above 1100 °C.
The fine-grained region is heated to between 900 °C and 1100 °C. Finally, the
tempered region is heated to below 700 °C. Of these regions, the coarse-grained
region is the most vulnerable to embrittlement and is often called as the local brittle
zone (LBZ) [121].
In a multipass weld, the average grain size of the HAZ is smaller than in the fusion
zone. Therefore when the fusion zone is replaced by the HAZs of the subsequent
weld passes, the fusion zone is “grain-refined” which is often desired [118].
In stainless steels, the metallurgical changes in HAZ are less prominent. The main
reactions involved are grain growth, ferrite formation, precipitation and grain
boundary liquation [122].
Grain growth is usually modest unless the heat input is exceptionally high. Ferrite
formation on grain boundaries in the HAZ can be beneficial as it restricts grain
growth and lessens susceptibility to liquation cracking. Ferrite formation is usually
sluggish and not very commonplace in welding, due to the fast heat cycles [122].
In the parts of HAZ which are heated near the solidus temperature, the precipitates
dissolve in the austenite. When they precipitate from the austenite again, they can
form at the grain boundaries and the ferrite-austenite interface. The most common
precipitates are carbides and nitrides. They may be challenging to detect using
metallography, but are very likely to be present in most austenitic alloys [98].
Extensive chromium precipitation can lead to degradation of corrosion resistance via
sensitisation induced intergranular corrosion [98].
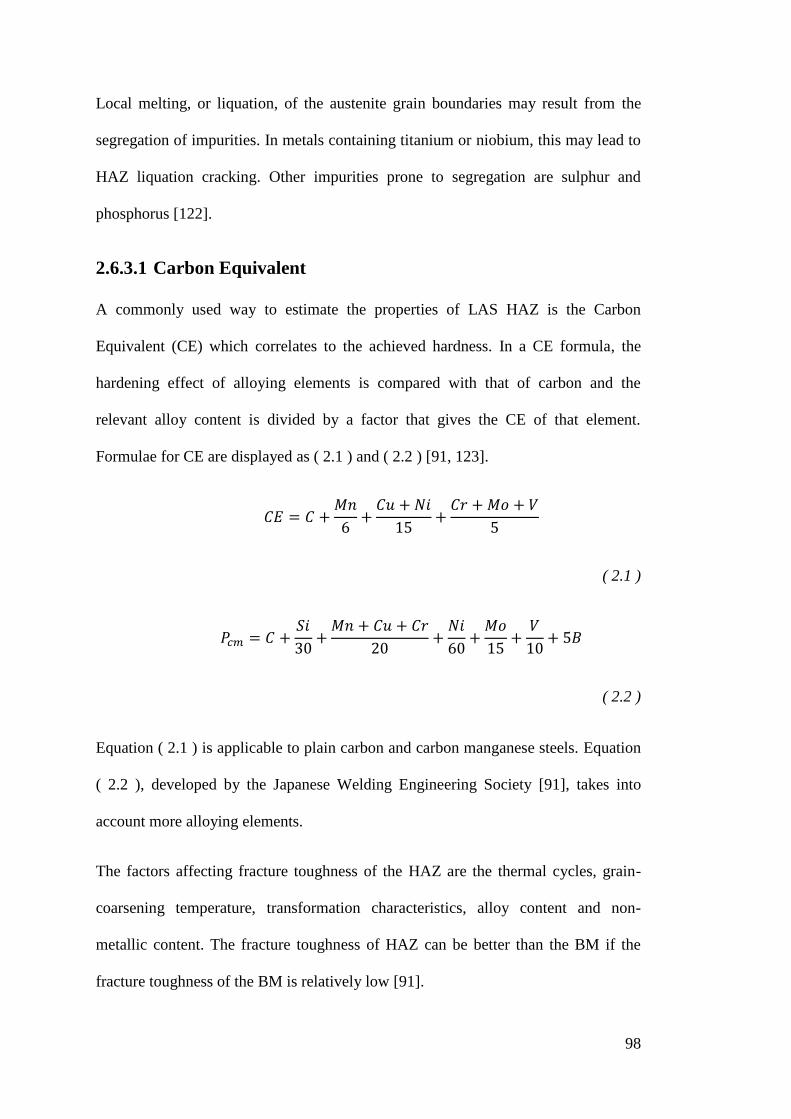
98
Local melting, or liquation, of the austenite grain boundaries may result from the
segregation of impurities. In metals containing titanium or niobium, this may lead to
HAZ liquation cracking. Other impurities prone to segregation are sulphur and
phosphorus [122].
2.6.3.1 Carbon Equivalent
A commonly used way to estimate the properties of LAS HAZ is the Carbon
Equivalent (CE) which correlates to the achieved hardness. In a CE formula, the
hardening effect of alloying elements is compared with that of carbon and the
relevant alloy content is divided by a factor that gives the CE of that element.
Formulae for CE are displayed as ( 2.1 ) and ( 2.2 ) [91, 123].
𝐶𝐸 = 𝐶 +𝑀𝑛
6+
𝐶𝑢 + 𝑁𝑖
15+
𝐶𝑟 + 𝑀𝑜 + 𝑉
5
( 2.1 )
𝑃𝑐𝑚 = 𝐶 +𝑆𝑖
30+
𝑀𝑛 + 𝐶𝑢 + 𝐶𝑟
20+
𝑁𝑖
60+
𝑀𝑜
15+
𝑉
10+ 5𝐵
( 2.2 )
Equation ( 2.1 ) is applicable to plain carbon and carbon manganese steels. Equation
( 2.2 ), developed by the Japanese Welding Engineering Society [91], takes into
account more alloying elements.
The factors affecting fracture toughness of the HAZ are the thermal cycles, grain-
coarsening temperature, transformation characteristics, alloy content and non-
metallic content. The fracture toughness of HAZ can be better than the BM if the
fracture toughness of the BM is relatively low [91].

99
When considering SA508 it can be noted that Ni addition (0.96 %) improves the
toughness of the HAZ. Nickel lowers the ductile-brittle transition temperature.
Chromium (0.17 %) and molybdenum (0.47 %) affect toughness by modifying the
transformation characteristics. Carbon increases hardenability and decreases
toughness [91].
Kim & Yoon [124] state that traditionally, the HAZ adjacent to the weld fusion line
has been known to give lower toughness values than the other regions since the local
temperature peak from the welding process rises above 1100°C and produces the
coarse-grained microstructures in this region. However, they [124] conclude that
studies on this subject have shown that the toughness of the coarse-grained HAZ
region is not as bad as predicted but even better than that of the base metal. They
produced a weld of 220 mm thickness with a multipass narrow-gap SAW process.
Their conclusion was that in a case of multipass weld the minimum toughness values
were noted at the intercritically or subcritically reheated region of 4-5 mm apart from
the fusion line. Although the tests mentioned here were made with SA508 Class 1.3
this phenomenon will probably also occur in NGLW of SA508 Gr3 Cl2.
2.7 Weldability of Alloy 52 Filler Metal
High chromium up to 30 % wt. nickel alloy filler metals are desirable for improved
resistance to general corrosion, local corrosion and environmentally assisted
cracking. Higher chromium content Alloy 52 is more resistant to stress corrosion
cracking than the more common Alloy 82. It is, therefore, the preferred choice of
additive in nuclear power systems [125]. However, several weldability issues have
been observed in the use of high chromium nickel alloy filler metals [126]. The
welds are susceptible to ductility-dip cracking, (DDC) as the molten metal cools
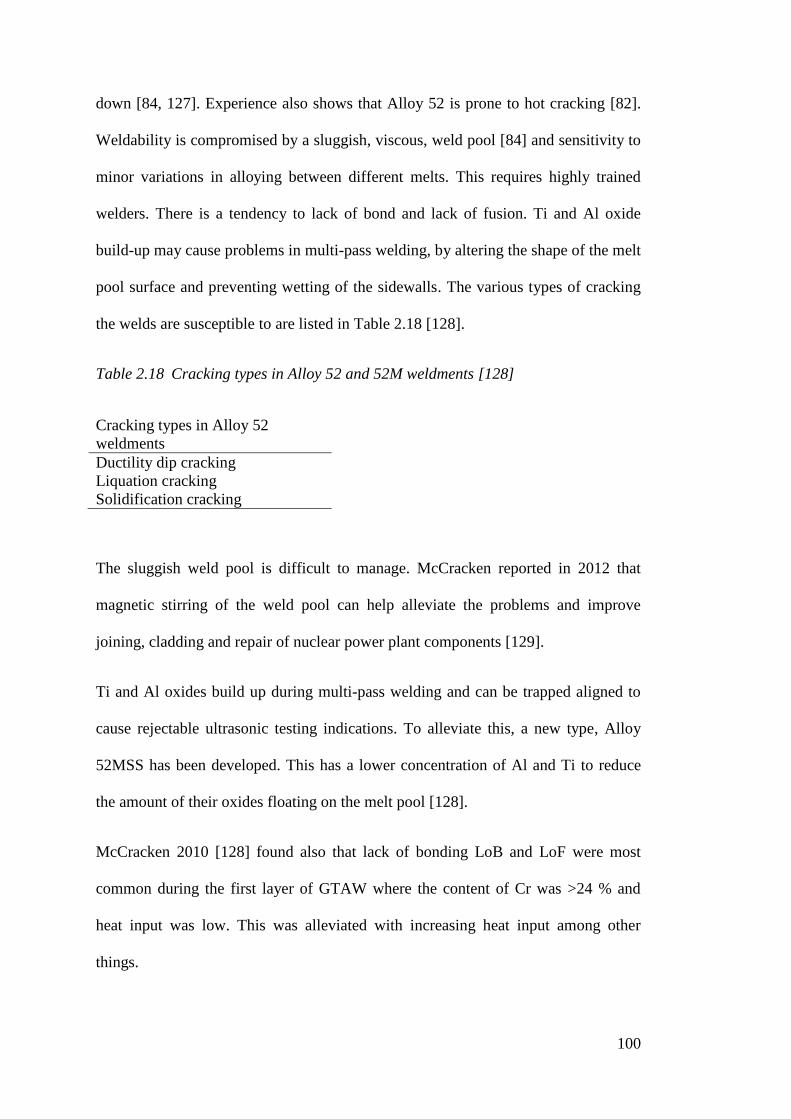
100
down [84, 127]. Experience also shows that Alloy 52 is prone to hot cracking [82].
Weldability is compromised by a sluggish, viscous, weld pool [84] and sensitivity to
minor variations in alloying between different melts. This requires highly trained
welders. There is a tendency to lack of bond and lack of fusion. Ti and Al oxide
build-up may cause problems in multi-pass welding, by altering the shape of the melt
pool surface and preventing wetting of the sidewalls. The various types of cracking
the welds are susceptible to are listed in Table 2.18 [128].
Table 2.18 Cracking types in Alloy 52 and 52M weldments [128]
Cracking types in Alloy 52
weldments
Ductility dip cracking
Liquation cracking
Solidification cracking
The sluggish weld pool is difficult to manage. McCracken reported in 2012 that
magnetic stirring of the weld pool can help alleviate the problems and improve
joining, cladding and repair of nuclear power plant components [129].
Ti and Al oxides build up during multi-pass welding and can be trapped aligned to
cause rejectable ultrasonic testing indications. To alleviate this, a new type, Alloy
52MSS has been developed. This has a lower concentration of Al and Ti to reduce
the amount of their oxides floating on the melt pool [128].
McCracken 2010 [128] found also that lack of bonding LoB and LoF were most
common during the first layer of GTAW where the content of Cr was >24 % and
heat input was low. This was alleviated with increasing heat input among other
things.

101
2.7.1 Solidification Cracking
Solidification cracking is a form of intergranular cracking. It occurs at the final stage
of solidification when the tensile stresses developed exceed the tensile strength of the
almost completely solidified weld metal. The solidifying metal shrinks both due to
thermal contraction and solidification shrinkage. This contraction is prevented by the
surrounding solid base material, which is often restrained. Consequently, tensile
stresses develop. When solidification cracking occurs in nickel alloy weld metal it is
almost always along solidification grain boundaries, see Fig. 2.32 and Fig. 2.33 [98].
Fig. 2.32 Boundaries developing in austenitic weld metals [75]

102
Fig. 2.33 Migrated grain boundary (MGB), Solidification grain boundary (SGB)
and Solidification subgrain boundaries (SSGB) in austenitic Filler Metal
52 weld metal [75].
The various theories of solidification cracking agree that the solidifying grain
structure is separated by a continuous thin liquid film. This film is then ruptured by
the stresses induced, see Fig. 2.34 and Fig. 2.35. If a sufficient amount of liquid is
available, the cracks can get backfilled and thus “healed” [98].

103
Fig. 2.34 Examples of weld solidification cracking in Filler Metal 52M (ERNiCrFe -
7A) dissimilar weld overlays on a) carbon steel A36, and b) stainless steel
Type 304L [75]

104
Fig. 2.35 Hot cracking propagated to the surface of narrow groove laser hybrid
welding of AISI 316L-IG (ITER-grade) using Thermanit 19/15 filler [130]
In the case of dissimilar welds, weld metals that solidify as austenite and are fully
austenitic at room temperature are inherently susceptible to weld solidification
cracking. This is due to the segregation that occurs during solidification and the
tendency for liquid films to wet the austenite grain boundaries. With many Ni filler
materials dilution increases the susceptibility to cracking by the tendency of liquid
films to wet the grain boundaries. When dilution is low Alloy 52M has good
resistance for solidification cracking [75]. Avery has established limits for dilution to
avoid solidification cracking, see Table 2.19.

105
Table 2.19 Approximate limit of diluting elements in Fe – Ni – Cr welds. Adapted
from [131]
Weld metal Iron Nickel Chromium
Nickel 30% — 30%
Ni-Cr-Fe† 25% Unlimited 30%
The limit values should be treated only as guides. Absolute limits are
influenced by the welding process, weld restraint and small variations in
weld filler and base metal compositions
† Silicon should be less than 0.75% in the weld.
The impurity content of the weld can also influence the solidification cracking. If
steel base materials have high levels of S and P dilution can cause these impurities to
segregate during solidification increasing the susceptibility for solidification
cracking. Most Ni filler materials are extremely pure. As general rule the sulphur
should not exceed 0.010 wt% and phosphorus should be less than 0.020 wt%. At the
limit levels, the welding process requires careful control in heat input, dilution and
weld geometry. [75]
2.7.2 Ductility Dip Cracking
Ductility dip cracking (DDC) is a solid state phenomenon typically occurring in re-
heated metals between 400 and 900°C. A dip in tensile ductility, see Fig. 2.36, has
been reported in different alloys such as Ni-based and stainless steels. In Ni-Cr
alloys, the DDC typically occurs as intergranular cracks the length of one grain or
less [125]. The cracks develop at grain boundaries which have lower ductility than
the grain interiors [64]. Highly localised stresses have been suspected to trigger grain
boundary sliding as the cracking mechanism [132, 133]. This previously rare
phenomenon has become more common with the introduction of high Cr filler
materials [64, 98].

106
Fig. 2.36 Ductility as a function of temperature and ductility dip [75]
DDC is known to be a serious weldability issue in many nickel-based filler metals.
The issue is prominent at particularly highly restrained thick section multipass welds
such as is the case in the welds in this study. Fig. 2.37 displays a multi-pass weld in
FM52 having DDC. The cracking has occurred along the weld metal migrated grain
boundaries [75].
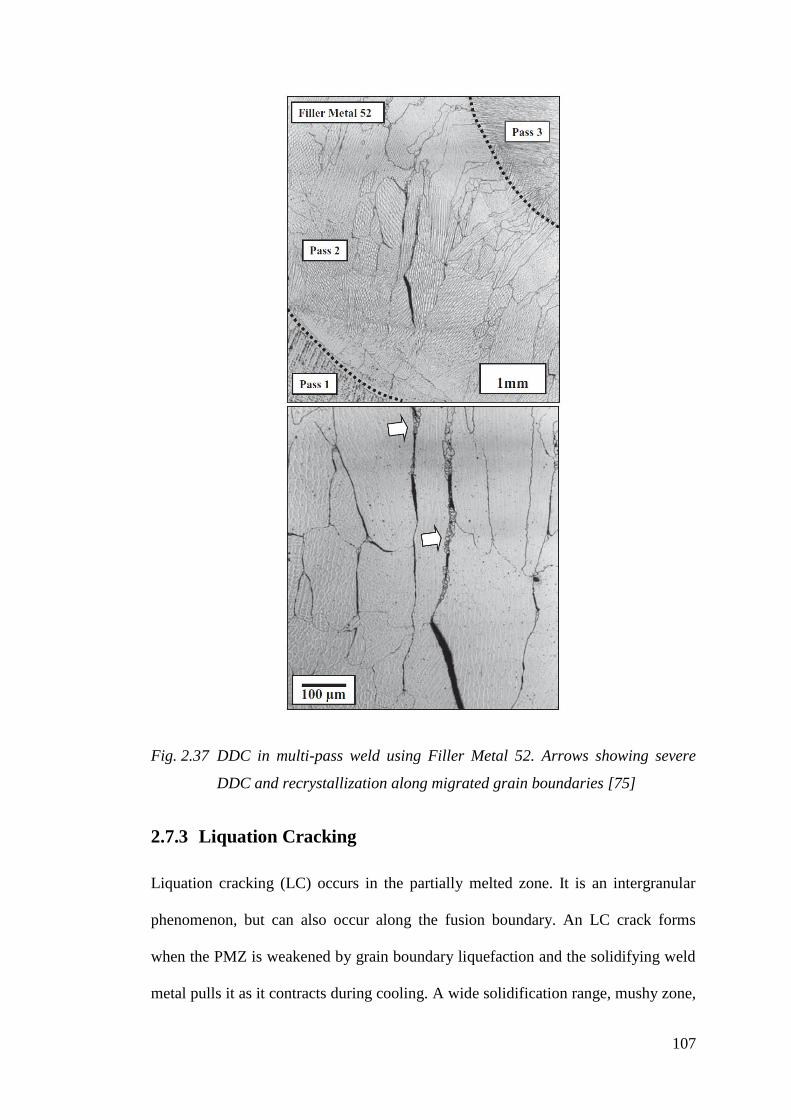
107
Fig. 2.37 DDC in multi-pass weld using Filler Metal 52. Arrows showing severe
DDC and recrystallization along migrated grain boundaries [75]
2.7.3 Liquation Cracking
Liquation cracking (LC) occurs in the partially melted zone. It is an intergranular
phenomenon, but can also occur along the fusion boundary. An LC crack forms
when the PMZ is weakened by grain boundary liquefaction and the solidifying weld
metal pulls it as it contracts during cooling. A wide solidification range, mushy zone,

108
increases the problem [98], as does the grain structure relative to the stress field.
The principle of liquation cracking is shown in Fig. 2.38 and an example is given as
Fig. 2.39.
Fig. 2.38 The principle of liquation cracking [98]
Fig. 2.39 Weld metal contraction tearing PMZ of 7075 aluminium welded with filler
1100 [134]

109
Kou [98] introduces four categories of sources for PMZ problems: filler metal, heat
source, degree of restraint, and base metal. Of these, in this study, the only variable
is the heat source. The smaller the welding energy the more narrow the PMZ is.
Multi-pass welding process in itself allows for smaller heat inputs to be used. Kou
also mentions arc oscillation during GTAW as a way to reduce the melt pool size
and to narrow the PMZ. As the base materials used in this study are not susceptible
to liquation cracking, liquation cracking may occur at previously welded Alloy 52
beads of the multi-pass weld, rather than in base materials and their fusion
boundaries.
2.8 Laser Welding of Dissimilar Materials
The potential of laser for dissimilar metal welds has been researched at least since
1968 [135]. Several studies have been made since [116, 136-138]. The subjects of
the studies have varied from mechanical properties of the weld, for example [137,
139], effects of shielding gas mixtures [140] to microstructural and fatigue properties
[141].
Simulation of different aspects of dissimilar laser welding has also taken place.
Mahmoud et al. 2012 have studied simulation of the temperature distribution in a
case of austenitic to a ferritic steel weld [142]. Ranjbarnodeh et al. 2011 used the
finite element method to model the effect of heat input on residual stresses in
dissimilar welds [143]. Hu et al. 2012 found that temperature fields close to the heat
source are very different in a case of laser spot welding of SS and nickel alloy when
compared to traditional spot welding [144].
Optimising the parameters of laser dissimilar welding with numerical analysis has
proven to be efficient by several studies [136, 145, 146]. Kraetzsch et al 2011

110
studied high-frequency beam oscillation to control the melting behaviour, seam
geometry, melt pool turbulence and solidification behaviour. They achieved crack-
free welds with good mechanical properties for Al-Cu dissimilar joints [147].
Sun 1996 [148] discusses the benefits and restrictions of laser welding. The low heat
input produces a small heat affected zone with limited residual stresses and
distortion. Subsequent rapid cooling can lead to beneficial fine microstructures
during solidification, but also non-equilibrium phases which can be detrimental. The
use of a laser will give precise control of the weld location and chemistry [148].
These comments are still valid today. Sun points out the classical critical points in
dissimilar ferritic/austenitic welding in Fig. 2.40. This description is made with
autogenous welding. When using filler material the composition and therefore
properties of the weld metal can be controlled, which can eliminate one possible
difficulty.
Fig. 2.40 Sketch of critical locations in the ferritic/austenitic laser welds [148]
Example of dissimilar laser welding is the laser weldability table of different metal
combinations cited from Belforte and Levitt, presented as Table 2.20.
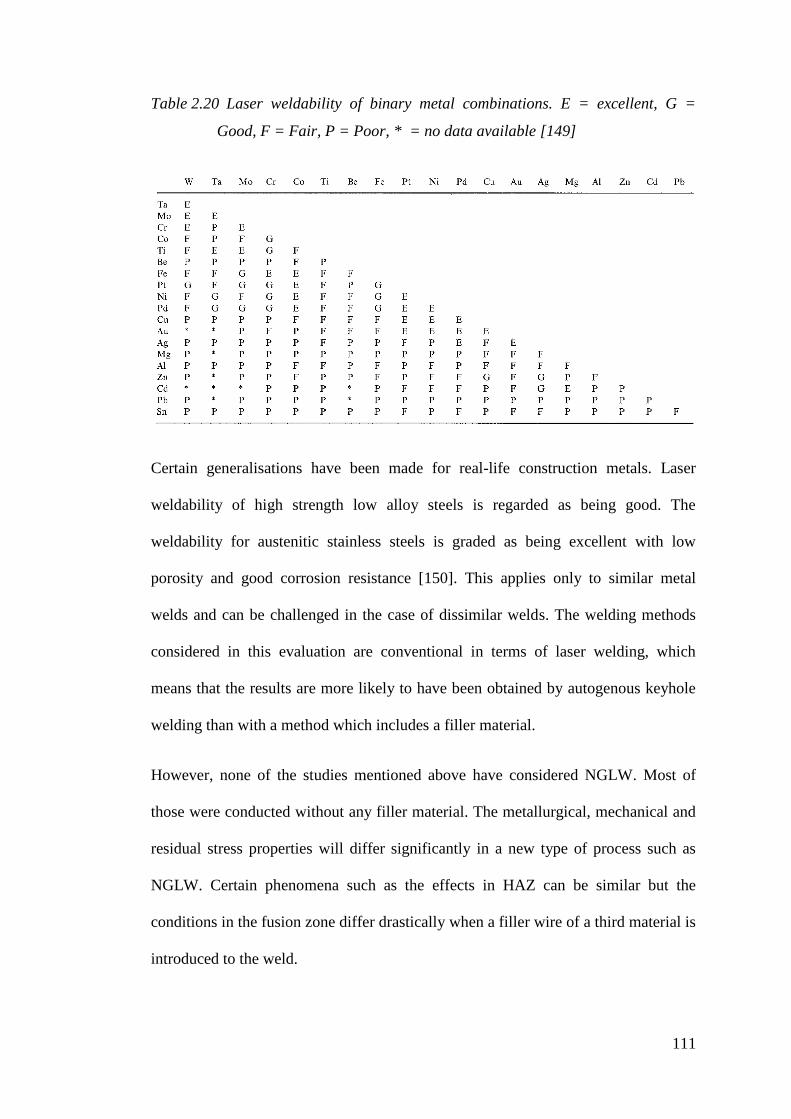
111
Table 2.20 Laser weldability of binary metal combinations. E = excellent, G =
Good, F = Fair, P = Poor, * = no data available [149]
Certain generalisations have been made for real-life construction metals. Laser
weldability of high strength low alloy steels is regarded as being good. The
weldability for austenitic stainless steels is graded as being excellent with low
porosity and good corrosion resistance [150]. This applies only to similar metal
welds and can be challenged in the case of dissimilar welds. The welding methods
considered in this evaluation are conventional in terms of laser welding, which
means that the results are more likely to have been obtained by autogenous keyhole
welding than with a method which includes a filler material.
However, none of the studies mentioned above have considered NGLW. Most of
those were conducted without any filler material. The metallurgical, mechanical and
residual stress properties will differ significantly in a new type of process such as
NGLW. Certain phenomena such as the effects in HAZ can be similar but the
conditions in the fusion zone differ drastically when a filler wire of a third material is
introduced to the weld.

112
2.8.1 HAZ in Laser Welding
Martensite is normally not observed in the HAZ of low-carbon steel, as illustrated in
Fig. 2.41. High-carbon martensite can form when both the heating and the cooling
rates are very high, as in laser beam welding. The HAZ microstructure of AISI 1018
steel produced by a high power CO2 laser beam is shown in Fig. 2.42. At the least
affected part of the HAZ high carbon martensite (and, perhaps, a small amount of
retained austenite) is formed in the prior-pearlite colonies. The austenite formed in
these colonies during heating has not had enough time to allow carbon to diffuse,
and it transformed into hard and brittle high-carbon martensite during the rapid
cooling. Hard martensite embedded into softer ferrite can significantly degrade the
mechanical properties of the HAZ. In HAZ positions C and D, both the peak
temperature and the time available for diffusion increase. This allows the prior-
pearlite colonies to expand while transforming into austenite and form martensite
colonies of lower carbon contents during the subsequent cooling [98].

113
Fig. 2.41 HAZ of GTA weld of AISI 1018 steel [98]

114
Fig. 2.42 HAZ microstructure of 1018 steel by a high-power CO2 laser.
Magnification of (A)–(D) 415x and of (E) 65x. B, High carbon martensite
[98]

115
2.8.2 Laser Welding Parameters
The basic parameters in laser welding are welding power, welding speed and focal
point position. Also affecting the properties are the focal length, the laser wavelength
and the shielding gases, to mention a few. In the case of dissimilar welding, a set of
new parameters is introduced. There are the two different BMs and the possible filler
material. Also in several studies, the dilution and properties of the weld have been
controlled by diverting the laser beam to one of the materials [151-153].
Duley 1999 gives a checklist about parameters in laser welding. It is presented in
Table 2.21. The optimisation of these parameters can be done only in terms of
“good” and “bad”. In many cases, this optimisation involves sectioning the welds
and mechanical, metallurgical and microstructural analysis [150].
Table 2.21 Critical parameters in laser welding [150]
Critical parameters
Laser power
Amplitude
CW or pulse wave
CW plus pulse
Pulse shape and repetition rate
Focusing
Location of the focal spot on surface
Focus above or below surface
Depth of focus
Intensity distribution within spot on surface
Shielding gas
Gas type
Flow rate
Orientation relative to focus;
trailing, leading, coaxial
Root side
Nozzle flow pattern

116
One of the parameters in dissimilar welding is the beam deflection or offset. During
dissimilar welding of Ti-6Al-4V and AZ31B magnesium, it was found that deviating
the beam to one side of the butt joint had significant effects on the weld. Gao et al.
2012 state that the laser offset plays an important role in the process stability and
weld characterisation [152]. This may not affect NGLW as much as autogenous laser
welding, but it may have some effect.
Using electron beam welding (EBW), Lin et al. 2010 experimented dissimilar
autogenous welding of SUS-304L SS and nickel-based Alloy 690. They conclude
that deviating the beam 0.30 mm to Alloy 690 enhances the interdendtritic corrosion
resistance [153]. This can have a significant effect on laser welding also.
2.8.3 Laser Welding With Filler Material
In many cases, the stringent joint requirements are the major drawback of laser
keyhole welding. The use of filler material alleviates these challenges. In laser
welding, the filler material is usually introduced in the form of a filler wire.
However, the use of filler wire is often considered as too difficult for industrial
applications, having too many parameters and too stringent requirements for wire
positioning [154].
During laser keyhole welding of a low alloy steel, the requirements for filler wire
positioning were found to be relatively strict. Tolerance in the order of 0.2 [155] to
0.25 mm [154] in the positioning of the filler wire was found to be acceptable. The
inaccuracies can be compensated to a degree by increasing the heat input [156]. The
increased heat input widens the melt pool and helps the melting of the wire. The
studies on this subject have concentrated mostly on the metallurgical and mechanical

117
properties of the weld in a certain application [154]. These studies have been made
mostly with single pass keyhole welding.
The parameters of filler feed position relative to the laser beam (Wy, Wx, WZ),
workpiece surface (FZ) and joint during laser welding are depicted in Fig. 2.43. The
filler wire is usually introduced from the front of the weld pool. This gives more
even distribution of the filler material. The feed angle (αW) has been reported to be
between 30°-75° to the surface of the work piece. The geometrical features of the
setup often dictate the angle chosen [154]. In NGLW the feed angle cannot be at the
lower end of the scale due to the geometrical restrictions of a deep weld groove. In a
study of NGLW of SS, the angle was 45°[35].
Fig. 2.43 The parameters of laser welding with filler wire [154].
A relatively steep angle can be beneficial in some cases. When using leading feed a
tendency of uneven heat distribution has been found. This may lead to a beneficial
weld geometry that has a wider root than the top [156]. A greater portion of the heat
conducting deeper into a weld may be a benefit in the case of NGLW, but the uneven
heat distribution may cause issues.

118
A filler wire introduced into the keyhole process is not an optimal solution. The
interaction angle and power intensity are not optimal for the wire. The interaction
takes place outside of the focal point where power intensity is low. Also, the wire is
fed at such a speed that any pre-heating does not occur [154]. In practice in most
applications, authors don’t mention having significant problems with adding filler as
wire [35].
The angle of incidence of the laser beam is of great importance, as the absorption is
at its best at near 90° but decreases rapidly when deviating from perpendicular to the
surface when considering low alloy steels. The absorption increases with rising
temperature. Iron alloys vaporise when the beam intensity exceeds 106 W/cm
2. This
triggers the creation of the keyhole. When the keyhole is formed the reflectivity
closes to zero [154]. This and the possibility to reduce back-reflections to the optical
system allows for slight tilting of the laser head. An angle of 5° is mentioned in the
literature [20].
In a study, the highest welding speed was achieved with a trailing feed filler wire.
This is due to the wire being fed partly to the weld pool (instead of the focal point)
which has a high heat content contributing to the melting of the wire. In this case,
more laser power is introduced to melt the base material via the keyhole [156].
The wire diameter did not have a significant effect on weld quality. The use of thin
wire is recommended because its more compact size makes it possible to feed it to
the desired point [156].

119
2.9 Testing of Weldments
2.9.1 Destructive Testing
Tensile tests and impact toughness tests are the most important destructive tests
considering testing of weldments. A bend test, either in the longitudinal or in the
transverse direction is applicable in some cases. [123]
For tensile testing, a standardised flat specimen is cut out of the weld. This can be
done in a longitudinal or transverse direction. In transverse, composite tests, the
main observation is whether the breaking occurs in the weld zone, HAZ or base
material. The tensile strength measured correlates to the part which has failed.
Different variations of the test can be made, such as making several smaller test
pieces or cutting a piece longitudinally inside the fusion zone. [123]
The results are displayed as a stress-strain diagram. An example with key points is
presented as Fig. 2.44.

120
Fig. 2.44 Engineering stress-strain diagram [157]
Fracture toughness is the material’s ability to resist crack growth by plastic
deformation. Charpy V is the commonly applied impact fracture energy test for
weldments. Its benefits are simplicity and the ability to induce the crack in a
predetermined location allowing localised determination of properties. The test can
easily be conducted for pieces at different temperatures and the practice is to state
the toughness at graded temperatures. Standards commonly add flexibility by
allowing the use of reduced size samples. [158] [123] A diagram of a typical ductile
to brittle transformation curve is presented as Fig. 2.45.

121
Fig. 2.45 Ductile to brittle transition region. Energy shelves and fracture
descriptions [158].
In nuclear manufacturing, an important design parameter is the minimum fracture
toughness requirement for ferritic materials of pressure-retaining components of the
reactor coolant boundary of light water nuclear power reactors set by the United
States Nuclear Regulatory Commission in Appendix G to Part 50 of the NRC
Regulations (10 CFR) [159]. This applies to A) Low alloyed ferritic steel plates,
forgings, castings and pipes, B) Welds and heat affected zones of the mentioned
materials and C) Fasteners. The appendix states that the upper shelf energy (USE)
must be no less than 75 lb-ft (102 J).
Many standards, codes and regulations, such as ASTM E 185, RCC-M App. SI,
KTA 3203 and JEAC 4210 require that the Charpy-V notch should be located less
than 1 mm from the fusion line. However, studies have shown that the toughness of
the coarse grain HAZ may be even better than that of the base material. In 1998 Kim
& Yoon propose placing the notch at the intercritical or subcritical zone of the HAZ,
although they acknowledge that this does not correspond with the regulatory
standards or codes [124].
122
2.9.2 Non-Destructive Testing
By Hellier 2001 the definition of non-destructive testing (NDT) is an examination,
test or evaluation performed on any type of test object without changing or altering
that object in any way, in order to determine the absence or presence of conditions or
discontinuities that may have an effect on the usefulness or serviceability of that
object. [160]
NDT can be divided into different categories. Halmshaw 1996 lists visual,
radiographic, ultrasonic, magnetic, penetrant, electrical and other methods [161].
Hellier presents a slightly different list adding eddy current, acoustic and thermal
infrared testing. [160]
It is important for non-destructive testing (NDT) to understand that some flaws are
more significant than others. Certain flaws can be considered acceptable. Certain
methods can detect smaller flaws than others and acceptable flaw sizes are related to
the methods used [161]. In this study, the emphasis on NDT is on visual and
radiographic methods.
2.9.2.1 Visual Testing
Visual checks after welding are the first indicator of the success of the weld. Table
2.22 explains the details which should be checked after each welding.
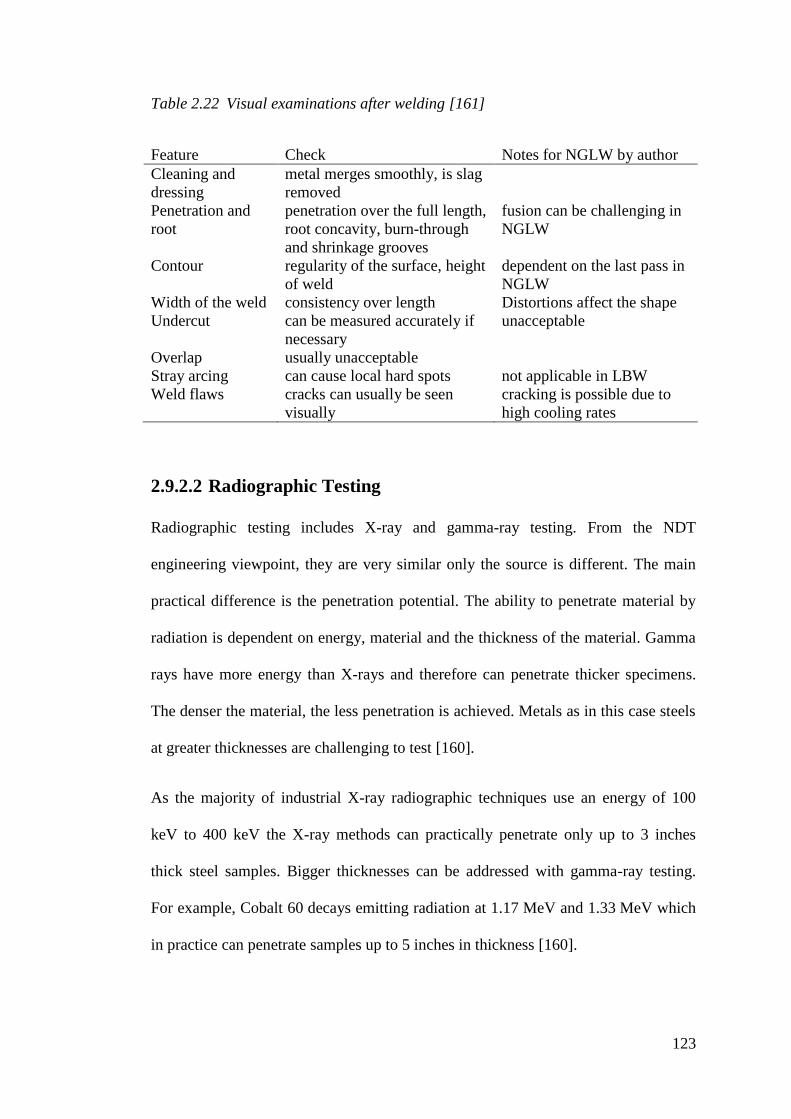
123
Table 2.22 Visual examinations after welding [161]
Feature Check Notes for NGLW by author
Cleaning and
dressing
metal merges smoothly, is slag
removed
Penetration and
root
penetration over the full length,
root concavity, burn-through
and shrinkage grooves
fusion can be challenging in
NGLW
Contour regularity of the surface, height
of weld
dependent on the last pass in
NGLW
Width of the weld consistency over length Distortions affect the shape
Undercut can be measured accurately if
necessary
unacceptable
Overlap usually unacceptable
Stray arcing can cause local hard spots not applicable in LBW
Weld flaws cracks can usually be seen
visually
cracking is possible due to
high cooling rates
2.9.2.2 Radiographic Testing
Radiographic testing includes X-ray and gamma-ray testing. From the NDT
engineering viewpoint, they are very similar only the source is different. The main
practical difference is the penetration potential. The ability to penetrate material by
radiation is dependent on energy, material and the thickness of the material. Gamma
rays have more energy than X-rays and therefore can penetrate thicker specimens.
The denser the material, the less penetration is achieved. Metals as in this case steels
at greater thicknesses are challenging to test [160].
As the majority of industrial X-ray radiographic techniques use an energy of 100
keV to 400 keV the X-ray methods can practically penetrate only up to 3 inches
thick steel samples. Bigger thicknesses can be addressed with gamma-ray testing.
For example, Cobalt 60 decays emitting radiation at 1.17 MeV and 1.33 MeV which
in practice can penetrate samples up to 5 inches in thickness [160].

124
The discontinuities detectable by radiographic testing include cracks, lack of fusion,
incomplete penetration, inclusions and porosity. Also, certain geometric conditions
can be detected, such as concavity, convexity, undercut, underfill and
overreinforcement. This is noteworthy as the radiographic images are by far the most
important permanent records achieved by NDT [160].
2.9.3 Measurement of Residual Stresses and the Contour Method
Residual stresses can be measured with many methods. Methods include X-ray
diffraction [103], hole drilling, neutron diffraction and the contour method [106,
162]. NDT methods for determining residual stresses usually measure some
parameter related to the stress. Many methods are based on diffraction, which is used
to measure the elastic strain of specific atomic lattice planes. Conventional X-ray
diffraction is limited to a depth of 5 µm due to poor penetration capability of the
wavelength of the X-rays. Where larger penetration is needed neutron diffraction is
usually applied giving the ability to penetrate up to 50 mm steel. [163]
Advances in synchrotron X-ray sources have made very intense high-energy (80 –
300 keV) X-rays available. They are only slightly inferior to neutrons for penetration
in steel, but due to their very high intensity, they offer a better spatial resolution.
Synchrotron techniques can be considered more suitable for mapping experiments
for FE model validation while neutron diffraction is more suited to deep line stress
profiling [163].
Other NDT methods for evaluating residual stresses are based on the influence of
stress on the magnetic properties, conductivity, speed of sound, Raman excitations or
optical fluorescence. Based on lasers, the last two have a high spatial resolution,
whereas the former are more suitable for bulk testing with lesser resolution. Three of
125
the methods mentioned are worth noting as they are the ones widely available,
namely the magnetic, high energy synchrotron and contour methods. [163].
Withers 2008 [163] compared three different residual stress measurement techniques
in Table 2.23. The contour method is shown as a process which is still
developmental. Remaining challenges listed are concerns of the quality of the
contour cutting process and the effect of cutting induced plasticity to the results.
However, developmental work has been done on understanding these issues for
example by Sun 2017 [164]. Geometrical and resolution capabilities of different
methods are presented in Fig. 2.46. It shows that the contour method is well suited to
the purpose of this study.

126
Table 2.23 Comparison of three strain mapping methods [163]
Magnetic Synchrotron Contour
NDT YES YES NO
Scope Suitable for in-situ
plant
measurements and
stress state
monitoring
Test-pieces and mock-
ups can provide detailed
maps as a function of
life suited to
testing/validating FE
models
Suited to ex-situ
examination of
plant components
as well as test-
pieces
Capability Ferritics: near-
surface < 10 mm
Samples less than 35mm
thick. Best suited for in-
plane strain
measurement in thick /
thin plates.
Components must
fit within EDM and
CMM
Maturity-
repeatability
Mature but a
unified theory
relating magnetic
signals to basic
magnetic
parameters lacking.
At present signals
are equipment
supplier-specific
Very mature; Bragg’s
equation provides a
straightforward link to
lattice strains from
which stress can be
derived
Tools for repeatable
extraction of stress
fields from
measured profiles
under development
Remaining
challenges
Can be sensitive to
microstructure
effects especially
in welds; for
accurate result
requires extensive
calibration tests on
alloy using biaxial
loading
Can be difficult to apply
for coarse-grained
materials. Need
industrial standard for
repeatable measurement,
validated software
analysis procedures and
instruments dedicated to
engineering strain
measurement.
Sensitive to
material movement
during the cutting
process. This may
lower the maximum
stresses and distort
recovered stress
field if not
prevented. The
importance of
plasticity is yet to
be quantified

127
Fig. 2.46 Schematic indicative of the approximate current capabilities of various
techniques. Destructive techniques shaded grey [163].
The contour method residual stress mapping method published by Prime [162] in
2001 is a destructive method for generating a map of the perpendicular residual
stresses of a cross section. Johnson [165] describes the contour method as an
elegantly simple technique with modest instrumentation requirements but laborious
in the data processing stages.
The contour method consists of experimentally cutting the sample, Fig. 2.47, to
allow the residual stresses to relax as translations, Fig. 2.48. The resulting
deformation is measured scanning the resulting surface contour and then analytically
forcing the resulting surface back to flat, Fig. 2.49. The resulting forces are displayed
as a 2D map [166, 167].

128
Fig. 2.47 The intact sample with original stresses [166]
Fig. 2.48 The cut sample with deformation induced by the residual stresses [166]
Fig. 2.49 The analytically flattened surface with residual stress map [166]
The ideal cut would be straight, not remove any material from the already cut
surfaces and not induce any additional residual stresses. Wire EDM is proven to
meet these requirements [168] and is widely used [11, 46, 167, 169, 170]. The
methods for scanning the distortion include using a coordinate measuring machine
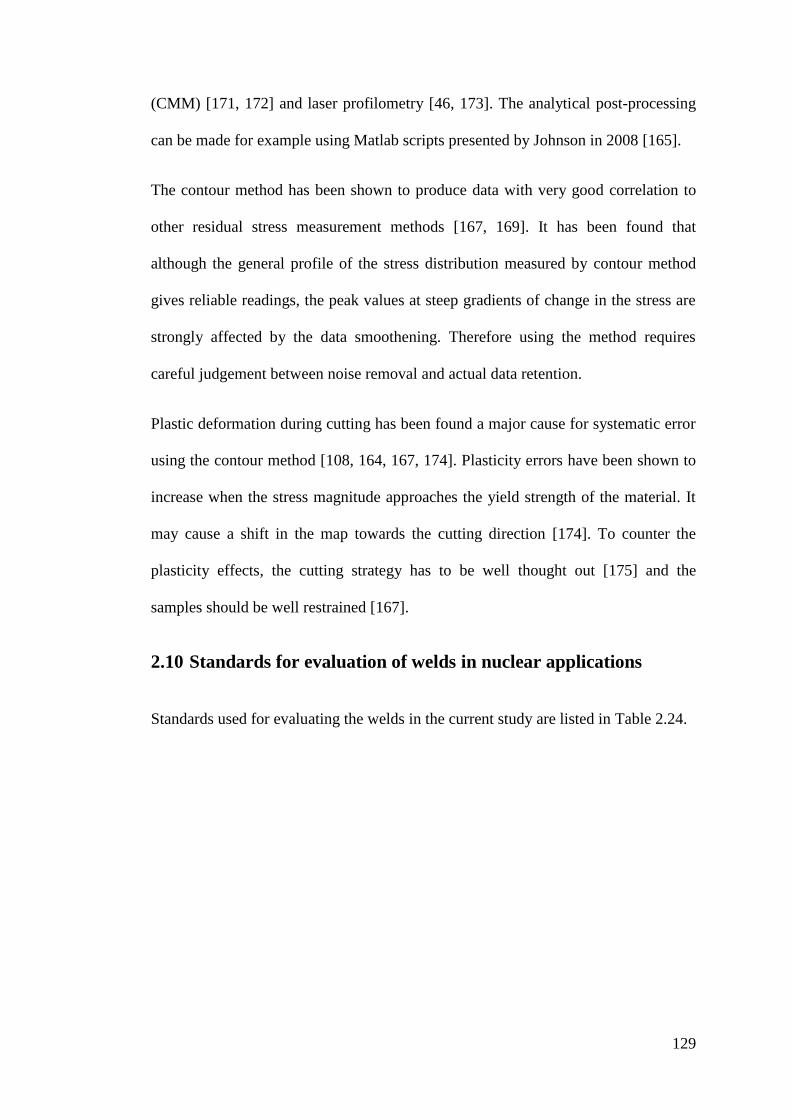
129
(CMM) [171, 172] and laser profilometry [46, 173]. The analytical post-processing
can be made for example using Matlab scripts presented by Johnson in 2008 [165].
The contour method has been shown to produce data with very good correlation to
other residual stress measurement methods [167, 169]. It has been found that
although the general profile of the stress distribution measured by contour method
gives reliable readings, the peak values at steep gradients of change in the stress are
strongly affected by the data smoothening. Therefore using the method requires
careful judgement between noise removal and actual data retention.
Plastic deformation during cutting has been found a major cause for systematic error
using the contour method [108, 164, 167, 174]. Plasticity errors have been shown to
increase when the stress magnitude approaches the yield strength of the material. It
may cause a shift in the map towards the cutting direction [174]. To counter the
plasticity effects, the cutting strategy has to be well thought out [175] and the
samples should be well restrained [167].
2.10 Standards for evaluation of welds in nuclear applications
Standards used for evaluating the welds in the current study are listed in Table 2.24.

130
Table 2.24 Standards used for evaluation of the weldments
Standard Description
ASME IX Boiler and Pressure Vessel Code
BS EN ISO 13919-1:1997 Beam welded joints
BS EN ISO 148-1:2016 Charpy impact toughness
U.S. NRC NRC10 appG Fracture toughness requirements
BS EN ISO 6507-1:2005 Vickers hardness testing
ASTM E384-17 Microhardness testing
ASTM E8 Tensile testing
The “Section IX of the ASME Boiler and Pressure Vessel Code relates to the
qualification of welders, welding operators, brazers, and brazing operators, and the
procedures that they employ in welding and brazing according to the ASME Boiler
and Pressure Vessel Code and the ASME B31 Code for Pressure Piping [176].”
The ASME IX code is a vast source of information. It presents many of the
commonly used welding practices, procedures and nomenclature. It defines the
welding positions. It presents tensile test and bending test procedures for each
thickness for groove welds as well as for fillet, spot, laser lap joint, flash and stud
welds. The code presents radiographic and Charpy V-notch impact toughness test
acceptance criteria [176].
To establish an industry-standard assessment for the integrity of the welds in this
study a radiographic acceptance according to ASME IX was applied. The code
defines two types of indications, linear and rounded. Linear indications are defined
longer than 3 times their width and include cracks, incomplete fusion, inadequate

131
penetration and slag. Rounded indications may be circular, elliptical or irregular in
shape and represent porosity and different inclusions [176].
The following indications will be unacceptable (thickness t = 40 mm) [176]:
A) Linear indications
1) Any type of crack or zone of incomplete fusion or penetration
2) Any elongated slag inclusion over 1/3 t
3) Any group of slag inclusions in line that have an aggregate length greater
than t in a length of 12t, except when the distance between the successive
imperfections exceeds 6L where L is the length of the longest imperfection in
the group
B) Rounded indications
1) The maximum permissible dimension shall be 1/5 T or 3 mm whichever is
smaller
2) For materials thicker than 3 mm the code presents charts for acceptable
types of rounded indications, see Fig. 2.50. However, indications smaller than
0.8 mm shall be omitted.
Fig. 2.50 Appendix I of ASME IX defining the acceptable appearance of rounded
radiographic indications [176]

132
To further evaluate the quality of the welds in addition to ASME IX also BS EN ISO
13919-1:1997 [177] was used. It describes permitted imperfections for laser and
electron beam welds in three categories; moderate, intermediate and stringent. The
standard considers welding imperfections such as cracks, porosity, lack of fusion,
undercut, filling, misalignment etc. see Fig. 2.51.
Fig. 2.51 Example of BS EN ISO 13919-1. The maximum height of undercut
The BS EN ISO 148 [178] presents a standard procedure for pendulum impact
toughness tests. It defines the standard sample geometry and test conditions. ASME
IX refers to the Charpy V-notch test procedure to be used for impact toughness
verifications [176]. ISO technical specification ISO/TS 7705 provides guidelines for
implementing the ISO 148 for steel [179].
The Charpy impact test uses a standardised pendulum to impact the test sample. The
standard V- notch sample is presented as Fig. 2.52.
Fig. 2.52 Charpy V-notch impact toughness sample according to BS EN ISO 148

133
In the case of mild and low alloyed steels, the Charpy impact test will result in an
impact test curve, Fig. 2.53. The curve is plotted following: X-test temperature, °C,
Y-absorbed energy, J. The results form three distinct zones, 1-lower shelf, 2-
transition zone and 3-upper shelf. A specified energy 4 can be presented at a
specified temperature 5. The scatter of results on the upper and lower shelves is
relatively small but the scatter in the transition part of the curve is relatively large
[179].
Fig. 2.53 Example of an impact test curve
Many materials, such as stainless steels are ductile even at very low temperatures
and instead of a curve, their results yield a straight rising line without a distinct steep
incline for the transition zone [179].
U.S. NRC 10 CFR Appendix G to part 50 [159] specifies fracture toughness
requirements for ferritic materials of pressure-retaining components of the reactor

134
coolant pressure boundary of light water nuclear power reactors. It states that the
requirements also apply to welds and heat affected zones of the materials.
The code specifies that reactor vessel materials and welds must have Charpy upper
shelf energy of no less than 102 J and must maintain a level of no less than 68 J
throughout the operation.
BS EN ISO 6507-1:2005 specifies the Vickers hardness test for metallic materials
[180]. The test is performed by indenting the material with a standardised diamond
indenter, see Fig. 2.54, with a specified force. The resulting indent is then measured.
The Vickers hardness is proportional to the quotient obtained by dividing the test
force by the sloping area of the indentation [180].
Fig. 2.54 Principle of the Vickers hardness test
Considerations for the Vickers test to ensure reliable results include a minimum
material thickness and a minimum distance between indentations and to the edge of
the test piece. ASTM E384-17 specifies the minimum distance to be 2.5 dV, where
dV is the Vickers indent diagonal [181].

135
ASTM E8/E8M − 16a specifies test methods for metallic materials at room
temperature. It specifies the nomenclature, procedure and test samples [182]. The
rectangular test piece is presented as Fig. 2.55.
Fig. 2.55 ASTM E8 rectangular tensile test sample [182]
The dimensions of the sample are very flexible and using subsize specimens is
acceptable. The key dimensions are G-gauge length, W-sample width and T-
thickness [182].
The tensile test results in a stress-strain diagram, see Fig. 2.56. The key figures are
the ultimate yield strength (UYS), the ultimate tensile strength (UTS) and the
elongation.
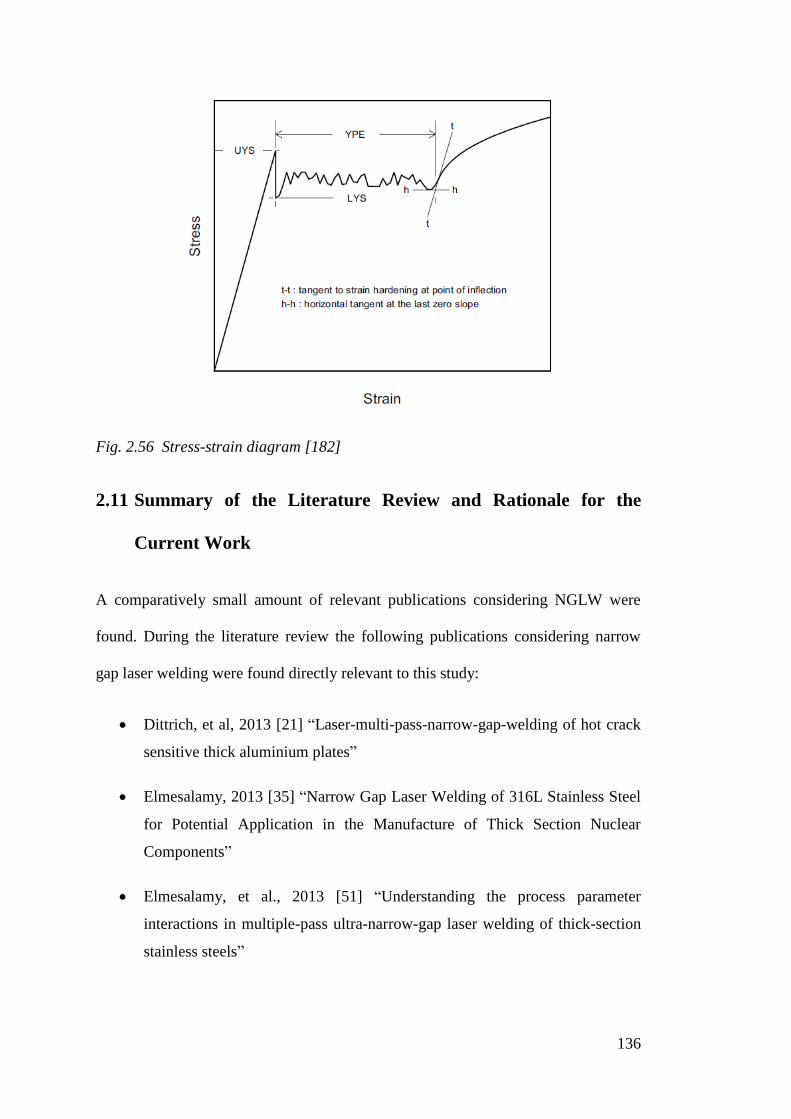
136
Fig. 2.56 Stress-strain diagram [182]
2.11 Summary of the Literature Review and Rationale for the
Current Work
A comparatively small amount of relevant publications considering NGLW were
found. During the literature review the following publications considering narrow
gap laser welding were found directly relevant to this study:
Dittrich, et al, 2013 [21] “Laser-multi-pass-narrow-gap-welding of hot crack
sensitive thick aluminium plates”
Elmesalamy, 2013 [35] “Narrow Gap Laser Welding of 316L Stainless Steel
for Potential Application in the Manufacture of Thick Section Nuclear
Components”
Elmesalamy, et al., 2013 [51] “Understanding the process parameter
interactions in multiple-pass ultra-narrow-gap laser welding of thick-section
stainless steels”

137
Elmesalamy, et al., 2014 [11] “A comparison of residual stresses in multi-
pass narrow gap laser welds and gas-tungsten arc welds in AISI 316L
stainless steel”
Feng, et al., 2016, [45] “Narrow gap laser welding for potential nuclear
pressure vessel manufacture”
Ficquet, X. et a.l., 2009, [102] “Residual Stress Measurement on a Narrow
Gap Dissimilar Metal Weld Pipe”
Jokinen et al. 2003, [44] “High power Nd:YAG laser welding in
manufacturing of vacuum vessel of fusion reactor”
Jokinen, 2004, [17] “Novel ways of using Nd:YAG laser for welding thick
section austenitic stainless steel”
Kong, et al., 2013 [19] “Feasibility study of laser welding assisted by filler
wire for narrow-gap butt-jointed plates of high-strength steel”
Yu, et al., 2013 [18] “Multi-pass laser welding of thick plate with filler wire
by using a narrow gap joint configuration”
Zhang, X. D. et a.l., 2011 [20] “Welding of thick stainless steel plates up to
50 mm with high brightness lasers”
By a very small welding groove volume, NGLW is proposed to offer geometrical
benefits over conventional welding. These include less filler material required,
smaller distortions and shorter process times. This study investigates these
experimentally.
NGLW offers a significant improvement over the conventional laser keyhole
welding, as the thickness of the weld can be increased without the need for
increasing the laser power. Conventionally laser welding of thick section steels has
required approximately 500 – 1000 W per 1 mm of penetration [51]. With NGLW
138
there is no such technical lower limit, as each welding pass melts only a relatively
thin bead [183]. Thicknesses up to 50 mm have been reported being welded using
NGLW [20].
The austenitic stainless steel to ferritic low alloyed steel dissimilar welds commonly
use nickel-based filler materials. A key feature of these welds is the ferritic to
austenitic microstructure fusion line, which has a very different microstructure from
conventional similar metal welding fusion line. This fusion line and the adjacent
HAZ can suffer from different issues like microfissures, carbon migration/depletion
and ductility dip cracking. The development of these possible flaws during NGLW is
investigated.
There are several nuclear codes and standards for welding. The resulting welds are
evaluated using the industry-standard codes for quality. These analyses consist of
optical, radiographical, and mechanical analysis.
The key findings of the literature review can be summarised as:
NGLW is expected to cause smaller welding distortions and residual stresses
leading to longer service life.
Elmesalamy et al. 2014 [11] reported reduced residual stresses in NGLW
compared to GTAW of stainless steels. Reduction of residual stresses is
beneficial to counter stress corrosion cracking. Primary water SCC of
dissimilar welds in PWR reactors has been reported to be a significant issue
for safety, longevity and costs of the power plants.
NGLW will reduce the number of welding passes compared to MMAW and
GTAW.
Welding time will be reduced as the number of passes reduces. This will lead
to savings in labour costs. The reduction of passes also leads to fewer
inspection cycles.
139
Gap volume reduction from NG-GTAW and especially MMAW will grant
significant material savings.
Welding without buttering is justifiable. Buttering is performed to enable
PWHT of the ferritic steel HAZ before adding the austenitic stainless safe-
end. The rationale is to prevent sensitisation of the austenitic steel component
during the PWHT. Real-life low carbon austenitic stainless steels were found
to have very low carbon content, and therefore be capable of withstanding the
required dwell times at elevated temperatures without sensitisation.
2.11.1 Knowledge gaps
A knowledge gap was established as no publications considering dissimilar metal
NGLW were found. The similar metal welding research published does not answer
many of the questions rising in DMW.
There is no data on the behaviour of the challenging materials, such as FM52, in
NGLW DMW’s. There is no published research on the resulting grain structures,
which will be characteristically different in DMW. The multi-pass tempering effect
in NGLW will cause variation of mechanical and microstructural properties along
with the depth of the weld and has not been addressed for this type of materials. The
mechanical and the residual stress properties of this type dissimilar metal NGLW
have not been studied.
The following questions arise as the main interests of this study:
Is NGLW able to produce acceptable weld integrity for nuclear
manufacturing?
Does the impact toughness meet the acceptance criteria?
What are the resulting microstructures, are they sound?
140
What is the effect of multi-pass tempering; is there variation in hardness,
grain structure, tensile strength or impact toughness between samples near
the root, middle or top of the weld?
Can an improvement on the residual stresses be achieved compared to
conventional methods?
The work described in the following chapters aims to provide answers to these
questions.
141
3 Materials, Methods and Equipment
This chapter describes the welding programme structure. It presents the choice of
materials and the methods for experimental work. The construction of the welding
setup with its various challenges is discussed. The monitoring and measurement
practices during the welding process are presented. The methods and equipment for
analysis of the welds is described.
3.1 Welding Programme Stages
The welding conducted in this study can be divided into three main stages, in which
different materials were used. The first stage was to use similar metal welding of
316L stainless steel to develop the welding procedures and equipment. The second
stage was a series of dissimilar metal welding trials using S275 mild steel as a
cheaper substitute to the SA508 steel. Last, when previous stages were completed
satisfactorily, the dissimilar metal welds were made using SA508 Gr3 Cl2.
The three welding programme stages are described, with the materials applied, in
Table 3.1. Detailed material information is presented in appropriate chapters.
Alongside the monitored welds, numerous simpler tests were made to evaluate
changes in the equipment and parameters. All monitored welds are presented
individually in Appendix I.

142
Table 3.1 Welding programme stages and corresponding materials used
Stage I II III
Identifier TV DS SA
Base
materials
316L +
316L
S275 +
316L
SA508 Gr3 Cl2 +
316L
Filler
material
ER 316L
Alloy 52 Alloy 52
Description Stainless steel similar
metal welds to
develop equipment
and procedures
Mild steel
dissimilar welds for
further process
development
Pedigree steel
dissimilar welds for
full analysis
3.2 Materials
The dissimilar metal welds investigated in this study consist of ferritic low alloyed
steel and austenitic stainless steel. These base materials are normally fusion welded
using nickel alloy filler material. Ferritic LAS is a typical material for pressure
vessels in a PWR. Stainless steel is used for the PCC piping. Nickel alloys are
commonly used filler materials for dissimilar welding due to their resistance to creep
failure in prolonged elevated temperature use. Narrow gap laser welding using these
materials has not been reported in the literature.
3.2.1 Stage I – Similar Metal Welding in Stainless Steel
In the similar metal welding trials, 316L austenitic stainless steel was welded using
ER 316L filler wire. The composition of the base material was analysed by energy
dispersive spectroscopy (EDS) by Elmesalamy 2013 [35]. The analysis is presented
in Table 3.2. The literature states the nominal composition of ER 316L, it is
presented in Table 3.3.

143
Table 3.2 EDS analysis of the 316L stainless steel used throughout the study, wt.%
[35]
C Mn Cr Ni Mo N S
316L 0.027 2.02 16.68 9.9 2.03 0.05 0.02
Table 3.3 Nominal chemical composition of ER 316L, wt.% [184]
C Mn Si Cr Ni Mo S P Cu
ER
316L
0.04 –
0.08
1.0 –
2.5
0.30 –
0.65
18 –
20
11 –
14
2 –
3
0.03
max
0.03
max
0.75
max
3.2.2 Stage II – Dissimilar Metal Welding with Mild Steel
To start the dissimilar metal welding trials a preliminary, cheaper substitute mild
steel S275 was used instead of the actual nuclear grade LAS. The filler material was
Alloy 52 Ni alloy. The mechanical properties of the materials used are described in
Table 3.4. Table 3.5 and Table 3.6 describe the chemical compositions of the
materials. The 316L stainless steel was analysed by EDS and its composition is
presented earlier as Table 3.2.
Table 3.4 Mechanical properties of materials used [185] [80] [186]
AISI 316L FM52 S275
Tensile strength (MPa) 530 – 680 536 410 - 560
Yield strength (MPa) 240 240 275 -
Elongation (%) 40 30 23
Equivalent standards 1.4404 (X2CrNiMo17-12-2) ERNiCrFe-7 1.0044
Table 3.5 Chemical properties of the base materials used [185-187]
C max Mn max P max S max Si max Cr Ni Fe
316L 0.03 2.0 0.045 0.03 1.0 16.00 – 10.00 – Rem.

144
18.00 14.00
S275 0.25 1.6 0.04 0.05 0.5 - - Rem.
Table 3.6 Chemical properties of the filler material used [80]
Ni + Co Cr C Ti Mn Al Fe
FM52 Rem 28.0 –
31.5
0.04
max
1.0
max
1.0
max
1.10
max
7.0 –
11.0
P S Nb+ Ta Si Al + Ti Mo Cu Others
0.02
max
0.015
max
0.10
max
0.50
max
1.5
max
0.50
max
0.30
max
0.50
max
3.2.3 Stage III - Dissimilar Metal Welding with Pedigree Steel
The final welding trials to produce the samples for full analysis programme was
welded using the target materials, AISI 316L, Alloy 52 and SA 508 Gr3 Cl2. Table
3.7 describes the mechanical properties of the materials used for welding the
stage III of welds. Table 3.8, Table 3.9 and Table 3.10 show the chemical properties.
Table 3.7 Mechanical properties of materials used in the SA series of experiments
[185], [80], [188]
Tensile
strength
(MPa)
Yield strength
(MPa)
Elongation
(%)
Equivalent standards
AISI 316L 530 – 680 240 40 1.4404 (X2CrNiMo17-12-2)
FM52 536 240 30 ERNiCrFe-7
SA508
Gr3 Cl2
701 576 24
Table 3.8 EDS analysis of the 316L stainless steel used, wt.% [35]
C Mn Cr Ni Mo N S
316L 0.027 2.02 16.68 9.9 2.03 0.05 0.02

145
Table 3.9 Analysis of SA508 Gr3 Cl2 material used, wt.%, Appendix IV
C Si Mn P S Cr Mo
SA508 0.18 0.24 1.32 0.019 0.022 0.24 0.53
Ni Cu V Nb Ca B Ti Al
0.47 0.052 0.003 0.004 0.0004 0.0001 0.001 0.003
Table 3.10 Analysis of Inconel Alloy FM52 material used, wt.%, Appendix V
C S P Si Mn Ni Cr
FM52 0.025 <0.001 0.003 0.14 0.24 60.46 28.87
Co Mo Cu Fe Ti Al N2
0.003 0.01 0.01 8.98 0.52 0.72 0.005
3.3 Sample Geometry
The samples used for the welding trials were 200 mm long and 40 mm thick, see Fig.
3.1. The width of the samples was 100 mm each, which was determined by using
calculations and the clamp manufacturer specifications. The choice of plate form
samples instead of a self-restraining tubular geometry was chosen as several authors
in literature were found to have used it for their studies [11, 45, 189] and it was used
as a standard approach in the NNUMAN programme [6]. It was acknowledged that
this approach is suitable only for preliminary studies as the restraint conditions vary
considerably when using different real-life geometries.

146
Fig. 3.1 Dimensions and design of NGLW samples.
3.4 Welding Groove Design
To fully exploit the benefits of NGLW the welding groove geometry was decided to
be kept as narrow as possible as this would increase efficiency; accelerate the
production speed and reduce the amount of filler material needed. The main
limitation was seen to be the nozzle design, sufficient rigidity of a thin nozzle being
difficult to achieve. Special nozzles for the wire feed and shielding gas delivery had
to be developed. After some study, it was decided to use a 5 mm groove width to be
able to construct gas and wire nozzles with sufficient rigidity.
In literature certain authors had used a straight wall welding groove [45, 56], many
used a straight V-groove [18, 20, 43].
First welding tests with 40 mm thick 316L stainless steel were conducted with 5 mm
wide parallel sidewall geometry to explore the groove contraction under the

147
experimental setup conditions. The resulting measurements after each welding pass
are presented as Fig. 3.2. The measurements were made at A 1/3 and B 2/3 along the
length of the weld. It can be seen that the groove contracts 1.3 mm by average. This
indicated a need for a slight V-groove to counter the effects of butterfly distortion
experienced during the process.
0 2 4 6 8 10 12 14 16 183
4
5
Ga
p W
idth
(m
m)
Pass no:
A [mm]
B [mm]
Fig. 3.2 5 mm parallel groove contraction, TV4
For the following trials a 4° V-groove, Fig. 3.3, was chosen as the basis of the
development. The aim was to keep the groove 5 mm wide for each actual pass by
anticipating the distortion caused by the welding.
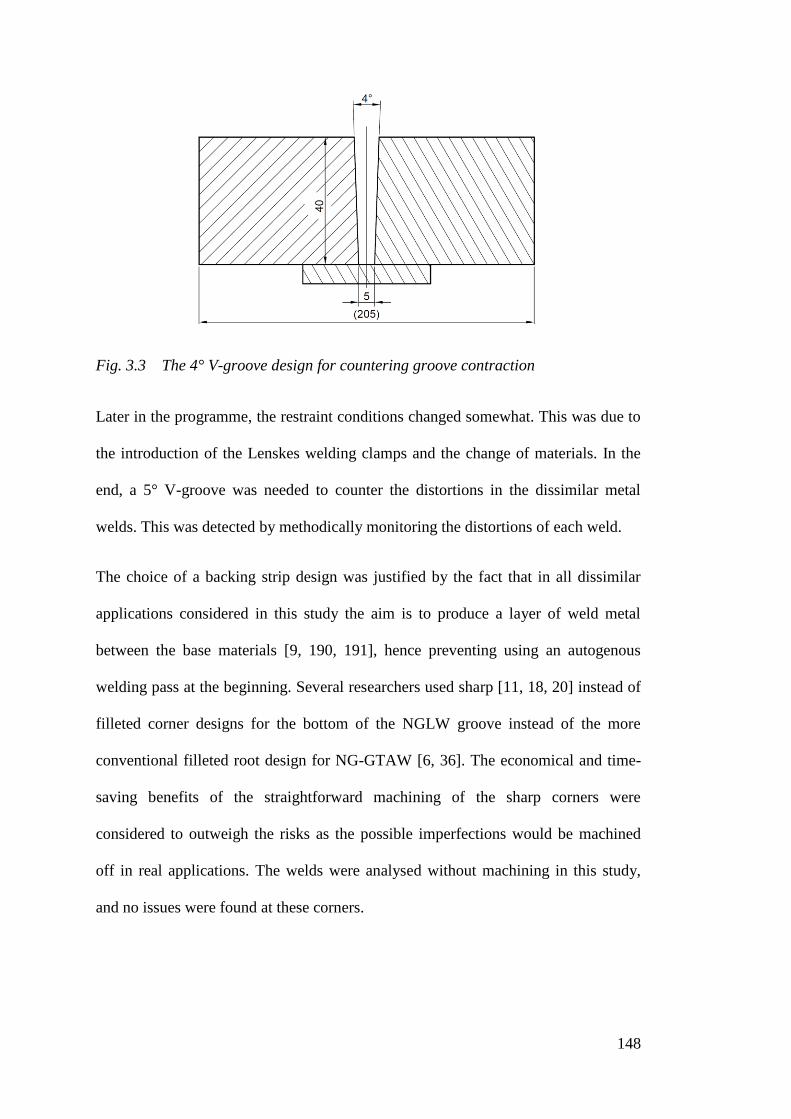
148
Fig. 3.3 The 4° V-groove design for countering groove contraction
Later in the programme, the restraint conditions changed somewhat. This was due to
the introduction of the Lenskes welding clamps and the change of materials. In the
end, a 5° V-groove was needed to counter the distortions in the dissimilar metal
welds. This was detected by methodically monitoring the distortions of each weld.
The choice of a backing strip design was justified by the fact that in all dissimilar
applications considered in this study the aim is to produce a layer of weld metal
between the base materials [9, 190, 191], hence preventing using an autogenous
welding pass at the beginning. Several researchers used sharp [11, 18, 20] instead of
filleted corner designs for the bottom of the NGLW groove instead of the more
conventional filleted root design for NG-GTAW [6, 36]. The economical and time-
saving benefits of the straightforward machining of the sharp corners were
considered to outweigh the risks as the possible imperfections would be machined
off in real applications. The welds were analysed without machining in this study,
and no issues were found at these corners.
149
3.5 Welding Parameters
The NGLW in this study were made using the laser in conduction mode. This means
that the power density at the focal spot would be kept below the threshold of
evaporation. Literature states a power density of 5 x 10^5 W/cm2 as the upper limit
for conduction limited welding mode [40]. This was however found to be just a
guideline, as factors such as heat conduction conditions, wire feed rate and welding
speed were found to affect the propensity to evaporation.
The welds conducted shared some basic specifications. The same sample geometry,
the effective width of the welding groove and the shielding gas BOC Pureshield
Argon (99.9998% purity) were used throughout the tests. The parameters which
were changed over the tests were laser power, travel speed, spot size, wire feed rate
and shielding gas flow rate.
The laser power was indicated by the laser system. The travel speed was set using
the robotic system. The wire feed rate was controlled by the closed-loop wire feeder.
Generic rotameter gas flow meters were used for gas flow control.
For the similar metal stainless steel welds, a set of parameters was developed, see
Table 3.11. The parameters were optimised for maximum bead thickness to reduce
the number of passes thus allowing for the highest possible deposition rate and fast
processing time.
In the dissimilar metal welds the parameters, Table 3.11, were developed based on
an unpublished technical report of NG-GTAW. The characteristics, such as the heat
cycle to which the materials were exposed were replicated. It was found that the
parameters as such did not yield satisfactory results but development was required.
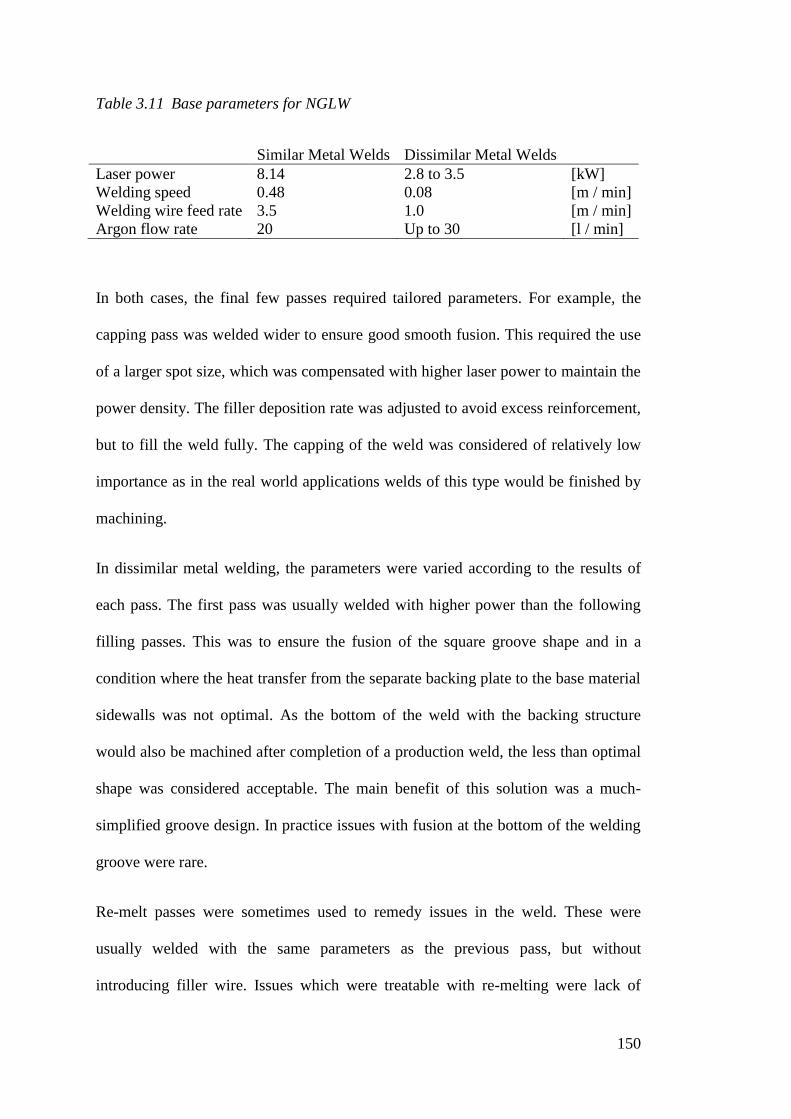
150
Table 3.11 Base parameters for NGLW
Similar Metal Welds Dissimilar Metal Welds
Laser power 8.14 2.8 to 3.5 [kW]
Welding speed 0.48 0.08 [m / min]
Welding wire feed rate 3.5 1.0 [m / min]
Argon flow rate 20 Up to 30 [l / min]
In both cases, the final few passes required tailored parameters. For example, the
capping pass was welded wider to ensure good smooth fusion. This required the use
of a larger spot size, which was compensated with higher laser power to maintain the
power density. The filler deposition rate was adjusted to avoid excess reinforcement,
but to fill the weld fully. The capping of the weld was considered of relatively low
importance as in the real world applications welds of this type would be finished by
machining.
In dissimilar metal welding, the parameters were varied according to the results of
each pass. The first pass was usually welded with higher power than the following
filling passes. This was to ensure the fusion of the square groove shape and in a
condition where the heat transfer from the separate backing plate to the base material
sidewalls was not optimal. As the bottom of the weld with the backing structure
would also be machined after completion of a production weld, the less than optimal
shape was considered acceptable. The main benefit of this solution was a much-
simplified groove design. In practice issues with fusion at the bottom of the welding
groove were rare.
Re-melt passes were sometimes used to remedy issues in the weld. These were
usually welded with the same parameters as the previous pass, but without
introducing filler wire. Issues which were treatable with re-melting were lack of
151
fusion and unevenness of the bead among others. One important observation of re-
melting was that a re-melt pass causes as much distortion as a filling pass. Therefore
a carefully optimised welding groove design may become too narrow if re-melting is
applied.
3.6 Welding Setup
The setup for thick section NGLW was developed based on literature, mainly on the
work by Elmesalamy [35] and Feng [45]. The narrow gap laser welding setup
consisted of a laser welding head, which was manipulated by a robotic arm, and a
sample which was restrained to a welding table. Auxiliary devices, such as wire
feeding nozzle were mainly mounted to the welding head. Larger apparatus like the
filler wire feeder or parts of the monitoring system were mounted externally. The
thick section weld required a substantial restraint system to counter the welding
distortions.
3.6.1 Laser and Robot Used
The laser used in this study was a 16 kW IPG YLS ytterbium fibre laser and the
welding head was Precitec with 300 mm focal length optical system. The laser was
conveyed to the welding head via means of an optical fibre. The fibre diameter was
300 µm and the collimation focal length 150 mm. The head was manoeuvred with a
KUKA KR 30 HA industrial robot. The welding setup was developed constantly
during the course of this study. An example of an early welding setup is pictured in
Fig. 3.4.

152
Fig. 3.4 The laser welding setup during wire feeder nozzle prototype trials
3.7 Development of the Equipment and Procedures
Narrow gap laser welding is a novel welding process. The required equipment is not
commercially available. Therefore a considerable portion of the research had to be
dedicated to developing the welding equipment and setup.
Producing the welds posed unique demands for the welding equipment. The welding
groove was deep and unusually narrow, hence reaching to the bottom required long
focal length laser optics and special nozzles for the filler wire and shielding gas. The
thickness of the weld necessitated the use of a highly rigid welding restraint to
manage the welding distortion forces. Observing the welding distortions was done
using HandySCAN 700 3D scanning and mechanical measurements. Video
monitoring of the welds was developed to allow real-time viewing and recording of
Wire
feeder
unit
Wire
feed
conduit
Wire feed
nozzle
Laser welding
head
Optical
fibre
(yellow)
Rotary
table and
shielding
gas
nozzles
Restraint
clamps
153
the welding process. Originally the alignment of the robot for laser head movement
was programmed by using the low power pilot laser. Later the coaxial camera system
was applied to improve precision.
Numerous different shielding gas nozzle arrangements were experimented. Two wire
feeder units were tried as well as various wire feeder nozzle setups. Four different
restraint systems were used. During the tests, three different video camera systems
were developed and applied and several mechanical distortion measurement
strategies devised.
3.7.1 Welding Restraint
The most significant component of the welding setup was the restraint system. The
properties of the restraint had a direct influence on the distortions occurring during
welding. These, in turn, determined the welding groove design. It was established
that safety, rigidity, reliability and repeatability were the main characteristics of a
good welding restraint.
The welding restraint system was developed during the similar metal weld tests. The
buttress clamp setup used to restrain the samples was found satisfactory for up to
30 mm material thickness. However, the distortions observed were severe enough to
indicate the need for a more rigid setup for thicker section welds. The rigidity of the
table used was also suspected. The first 40 mm weld TV4, using similar metal
stainless steel, was restrained with a strongback arrangement and the butterfly
distortion was well constrained. Later a setup with 3 pairs of 42 kN welding clamps
was used on an 80 mm thick steel table.

154
The first tests and trials up to 10 mm stainless steel were conducted by using
machining clamps on the rotary table of the robotic system, as in Fig. 3.4. However,
they were found to be less than satisfactory in their capability to prevent distortion
and concerns arose about their safety in case of overloading.
Welds up to 30 mm thickness were still restrained with clamps on the rotary robot
system table. The clamps used were Carver buttress clamps, Fig. 3.5, with a
maximum loading of 62.5 kN. They were found to be much stiffer. The 60 mm thick
robot table was identified to be a major contributor to the distortion during thick
section welds.
Fig. 3.5 Sample TV1 restrained by one pair of Carver buttress clamps
The flexibility of the buttress clamp setup was found unsatisfactory. The mounting
threads on the robot table were too close to each other to allow clamping the samples
from the outer edges. To work around the less than optimal clamps available at the
time, a strongback arrangement, Fig. 3.6 and Fig. 3.7, was trialled. Two steel plates
were welded to the actual weld sample. As a backing strip was used, machining of
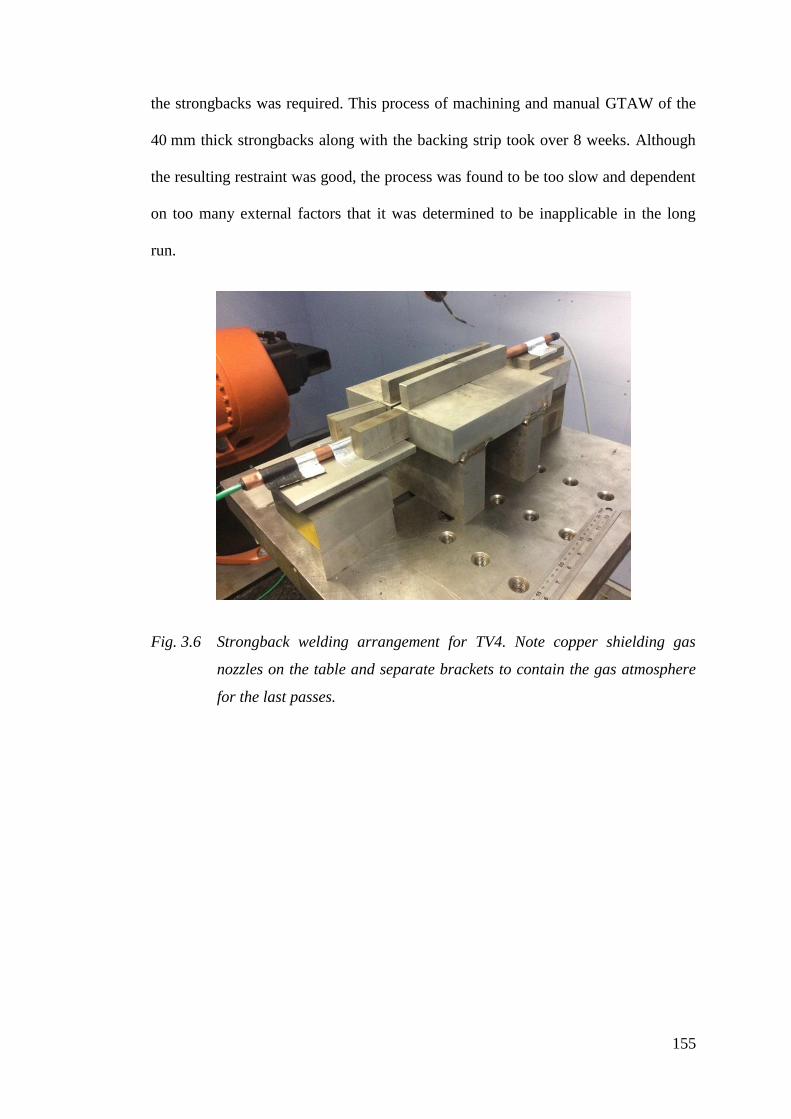
155
the strongbacks was required. This process of machining and manual GTAW of the
40 mm thick strongbacks along with the backing strip took over 8 weeks. Although
the resulting restraint was good, the process was found to be too slow and dependent
on too many external factors that it was determined to be inapplicable in the long
run.
Fig. 3.6 Strongback welding arrangement for TV4. Note copper shielding gas
nozzles on the table and separate brackets to contain the gas atmosphere
for the last passes.

156
Fig. 3.7 Strongback welding restraint arrangement for TV4 viewed from below.
Note the machined slot to accommodate the backing plate and the
extensive manual GTAW-welding required.
A calculation for integer value for the number of pairs of clamps, ( 3.1 ), revealed a
need for a stronger setup to ensure the safety of the work. In the equation NC =
number of pairs of clamps, PL = plate length, PW = plate width, PH = plate height,
σy = yield strength and CN = maximum allowed force on the clamp. An 80 mm
thick steel table, Fig. 3.8, with T-grooves, was obtained with 3 pairs of 42-ton
welding clamps. The clamps were tightened to 100 Nm using a torque wrench. This
setup was then used throughout the dissimilar metal welding programme giving
reliable and repeatable restraint.
𝑁𝑐 = ⌈𝑃𝐿𝜎𝑦𝑃𝐻
2
4𝐶𝑁𝑃𝑤⌉
( 3.1 )
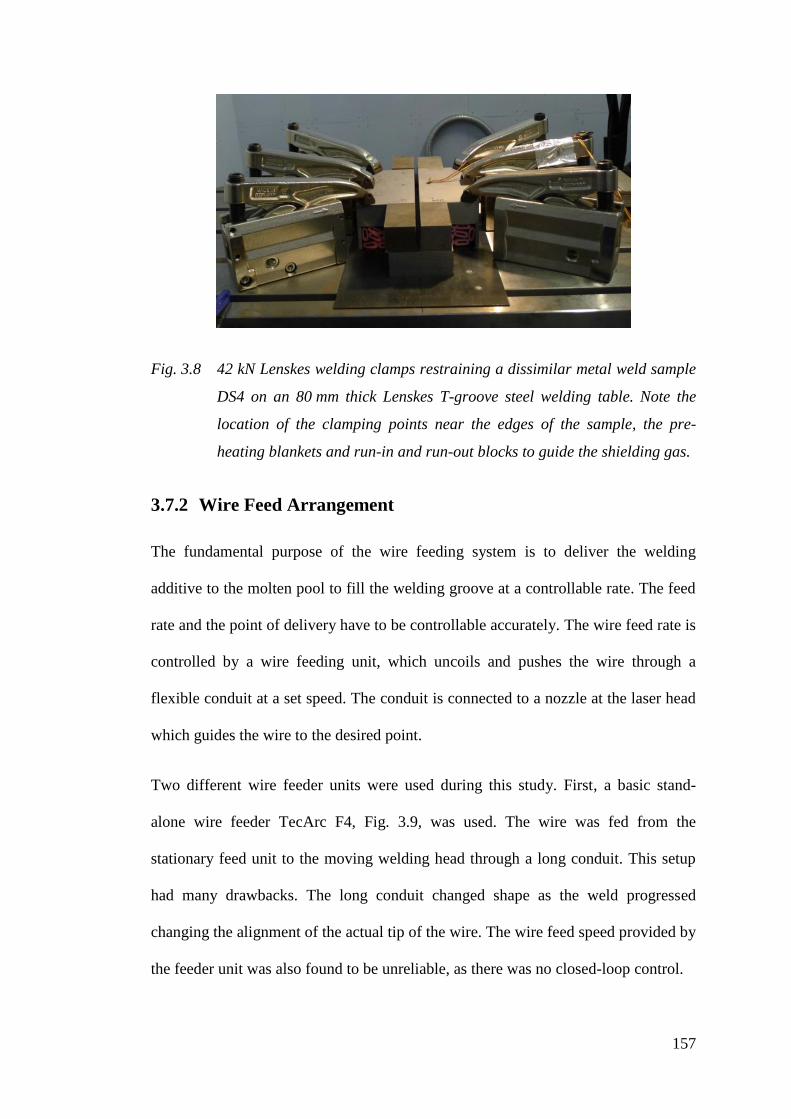
157
Fig. 3.8 42 kN Lenskes welding clamps restraining a dissimilar metal weld sample
DS4 on an 80 mm thick Lenskes T-groove steel welding table. Note the
location of the clamping points near the edges of the sample, the pre-
heating blankets and run-in and run-out blocks to guide the shielding gas.
3.7.2 Wire Feed Arrangement
The fundamental purpose of the wire feeding system is to deliver the welding
additive to the molten pool to fill the welding groove at a controllable rate. The feed
rate and the point of delivery have to be controllable accurately. The wire feed rate is
controlled by a wire feeding unit, which uncoils and pushes the wire through a
flexible conduit at a set speed. The conduit is connected to a nozzle at the laser head
which guides the wire to the desired point.
Two different wire feeder units were used during this study. First, a basic stand-
alone wire feeder TecArc F4, Fig. 3.9, was used. The wire was fed from the
stationary feed unit to the moving welding head through a long conduit. This setup
had many drawbacks. The long conduit changed shape as the weld progressed
changing the alignment of the actual tip of the wire. The wire feed speed provided by
the feeder unit was also found to be unreliable, as there was no closed-loop control.

158
Fig. 3.9 TecArc F4 wire feeder and the wire conduit (red).
The second wire feed unit was a more sophisticated, closed-loop control capable
Jetline Engineering series 9600 CWF-50Z, Fig. 3.10. The design of the unit made it
possible to mount the feeder on the robot arm, providing a much shorter conduit with
much less change in the geometry of the wire conduit during the welding process and
therefore much more reliable performance. The control unit, Fig. 3.11, was separate
and was mounted at an easily accessible location. The closed-loop control provided
steady and repeatable wire speed unaffected by friction variations in the wire guiding
system.

159
Fig. 3.10 Jetline Engineering 9600 wire feeder unit mounted on top of the robot
Fig. 3.11 Jetline engineering 9600 wire feeder control unit
At the beginning of the tests, several wire feeding parameters considering the wire
feed nozzle design were settled by doing bead on plate tests using 316L samples and
filler wire. The wire feeding arrangement would be a leading wire type and the wire
feeding angle was determined to be less than 45°. In the bead on plate tests, the
reliability of the arrangement quickly deteriorated with steeper angles causing
160
inadequate wire melting and buckling. Maximum working depth was set according
to target material thickness. The challenge was to keep the width of the nozzle as
narrow as possible up to the desired thickness. The interaction point between the
wire and the molten pool had to be adjustable in all three dimensions. Also, the angle
of the wire had to be controllable. These adjustments were designed into the wire
feeding nozzle assembly at the laser head.
The contradicting demands for the wire feeding assembly were challenging to meet.
The rigidity of the wire feeder nozzle was improved continuously and several
different setups were tested. Even the ease of alignment was found to be less
important than adequate rigidity. Several different designs were experimented. One
particular challenge was that the wire tended to re-coil when exiting the nozzle tip.
This would point the wire tip towards an undesirable direction unless a bend was
added near the tip, to align the wire centrally.
The wire feeder (left in Fig. 3.12) was abandoned mainly because the sharp bend
needed at the lower part created unacceptably high friction for the wire, causing
uneven feed speed, vibrations and buckling of the wire at the feed rollers. The wire
feeder nozzle on right in Fig. 3.12 shows stepless sliding brackets which allowed for
adjustment of the height and distance of the wire to achieve proper alignment of the
beam and wire. The aligning of the wire feeder nozzle to the centreline of the weld
was achieved by rotating the bracket. The actual nozzle was built in two components
the flat main copper nozzle supports a thin pipe for guiding the wire. The angle of
the wire αW was adjustable by bending the final bend of the wire feeding pipe. The
angle achieved with this setup was variable at 30° +- 5°. This nozzle was shared with
ferritic steel welding research and was designed to be capable of welding up to 130

161
mm deep grooves. The nozzle thickness was 5 mm with the tip of the wire guide
diameter 3.2 mm.
Fig. 3.12 Two examples of different experimental wire feeder versions. A) A simple
feeder pipe attached to the welding head (arrow) and B) the MTRL NGLW
nozzle which was used in welding the TV-series stainless steel tests
The first wire feeder nozzles were found to have several issues including instability
of the wire tip due to uneven friction, poor adjustability and poor survivability from
reflections of the laser beam. It was also realised that a rapid and reliable means of
adjustment of the Z-axis (FZ) was crucial for the ability to finely adjust the spot size
between passes and for the much wider capping passes. In the next stage, a setup
using precision linear stages was developed.
A commercial wire feed nozzle holder, Fig. 3.13, was obtained. This allowed for
precise, 1 mm per revolution, adjustment of the wire position in three dimensions
(Wy, Wx, WZ). Also, the angle αW of the nozzle was adjustable. The access to the
B
A
A
A

162
deep NGLW groove was solved by introducing a sufficiently long and thin nozzle.
The design weld thickness was 40 mm. The drawback in this system was that the
stroke of adjustment of each axis was only 30 mm. This was sufficient for X- and Y-
directions, where the adjustments usually fell within a few mm, but insufficient for
the Z. The Z-axis or the height of the wire had to be adjustable by at least 100 mm
due to the large changes in wire height during the exceptionally large offset required
for the last passes of the welds. The last setup was augmented with a 300 mm linear
stage to allow for this.
Fig. 3.13 Final wire feeder nozzle bracket (silver) and 300 mm stage (black) used
The wire nozzle tip was developed in three stages. First, a thin copper tube was used
as the nozzle, as per Fig. 3.12 b. This was very versatile and highly adjustable. It
provided acceptable rigidity, being mainly limited by the other components of the
setup used at that time. After a period of use, this tip was found to have a detrimental
flaw. Even the smallest reflections of the laser beam from the melt pool damaged the
163
nozzle immediately, melting several millimetres of its length and depositing the
molten copper into the weld. This also led to extensive repair work, as the whole
nozzle had to be replaced and the setup completely re-aligned.
The second version of the nozzle tip was designed using a slimmed-down
commercial contact tip for GTAW. This was based on a 6 mm diameter stainless
steel tube, which was threaded to accept the replaceable tip. The tip width was 4 mm,
tapering up gradually to the nominal 6 mm of the tube. This setup had three benefits
over the previous design. Firstly, the tip was much heavier, having a larger heat
capacity and therefore it was considerably less prone to detrimental melting.
Secondly, the tip was quickly replaceable in case of any indications of damage,
without the need to do extensive re-alignment. Thirdly, the stainless steel tube was
found to increase the rigidity of the tip, reducing wire vibrations considerably.
Working in the 5 mm wide 4° to 5° V-groove was found viable with the 6 mm tip
setup. An immediate improvement over the previous design was observed. However,
the tip width did not allow for enough adjustment as the wire was often found
bending to one side after exiting the nozzle. A tight-fitting 0.9 mm diameter tip was
used to minimize the curving of the wire after exiting the nozzle. Over time the
friction in the nozzle tip was found to be excessive causing incidents of buckling of
the welding wire at the wire feeder rollers interrupting the welding process. The soft
Alloy 52 welding wire was extremely prone to this.
To overcome the issues with the second design, an improvement was designed with
a smaller overall diameter, see Fig. 3.14.

164
Fig. 3.14 The improved 5 mm diameter wire feed nozzle
This tip holder was designed using a 5 mm tube and a milled down nozzle tip. The
tip had to be fully re-machined to reduce the thread to M4. The nozzle tip thickness
was reduced to 2.8 mm. This arrangement doubled the practically available travel
allowing for precise alignment of the wire-melt pool interaction point.
Also, at the time when the 5 mm tip holder was introduced, a wire straightener was
installed to the system. The wire straightener was placed immediately after the feed
rollers on the robot arm. By carefully adjusting the straightener, only minor
corrections were needed by the tip alignment. This improved the reliability and
usability of the wire weed system significantly.
3.7.3 Shielding Gas Setup
In literature Feng et.al.2017 [46] completed 30 mm SA508 steel NGLW with a
single leading shielding gas nozzle. Zhang et. al.2011 [20] used a single trailing
nozzle. Elmesalamy 2013 [35] welded 316L NGLW with a leading nozzle and a
trailing gas shower tube. In this study, the stainless steel similar metal welds trials
indicated that single fast-flowing shielding gas jets would drag in ambient air and
cause oxidation. This was found harmful for the quality of the similar metal welds,
and unacceptable for the more sensitive DMW. Fast shielding gas jets were also
suspected of causing disturbance to the weld pool.

165
Severe contamination by oxidation, vaporised metal and burnt contaminants was
found in the first bead on plate test runs. This was assessed with a multitude of
arrangements, involving stationary and moving nozzles of various designs. Only the
shielding gas, 100 % argon, was not changed during the development.
First, a single nozzle of 6 mm diameter was placed at 45° from horizontal in trailing
position behind the laser spot to provide the shielding gas. The nozzle was attached
to the welding head and the flow was directed 2 mm above the melt pool according
to literature. The results were unsatisfactory, so improvements were developed.
To keep the oxygen in the surrounding atmosphere from mixing with the shielding
gas jet, two designs of gas shoes were experimented. The shoes were attached to the
laser head and were, therefore, moving with the welding process. Gas shoes are
pictured in Fig. 3.15.
Fig. 3.15 Different gas shoe designs. A) A version constructed for first trials.
B) A proposed design to alleviate dust accumulation issues.
These provided good protection from the oxidation, but they did not allow the fumes
created by the high-intensity laser beam to escape. This caused contamination of the
test pieces and better solutions were needed.
A
A
B
A

166
At the beginning of the shielding shoe development, it was understood that a shoe
type setup couldn’t supply a reliable flow of shielding gas to a deep and narrow
NGLW groove. Therefore a parallel design process was started to create a blade type
welding apparatus to provide both shielding and wire feeding to the bottom of a deep
groove. Fig. 3.16 depicts a blade setup for delivering both the shielding gas and the
welding wire, attached to the laser welding head.
Fig. 3.16 Blade shielding gas and wire feed design
Developing the blade type nozzle was found to be very challenging. The maximum
thickness allowed by the narrow gap was very small and the brass blades would have
to be cut with EDM. The holder bracket for the blades would have to be machined
from steel. Both of these would have to incorporate several separate functions. After
numerous design iterations, the construction was deemed to be too expensive and
time consuming to manufacture. The idea was shelved as overly complicated.

167
Consequently, a far simpler and more flexible setup was developed. It consisted of
two stationary large-diameter shielding gas nozzles and steel blocks for guiding the
gas. These copper nozzles were placed on the welding table at the ends of the
workpiece. The heavier than air shielding gas was guided into the weld groove with
the aid of steel blocks close to the edges of the weld. The nozzle diameter was 13
mm and the length of the large-diameter tube was 130 mm to reduce the turbulence
of the flow. These nozzles were placed on the top of the test piece. This shielding gas
setup is pictured in Fig. 3.17. This setup was found to work satisfactorily with
stainless steel similar metal welding.
Fig. 3.17 Shielding gas setup used during welding of TV4 set up with stationary
nozzles aided by steel blocks to guide the gas flow. The nozzles were
raised according to the progression of the weld.
Gas shielding of the Alloy 52 based dissimilar metal welds proved challenging. The
well-known tendency of Alloy 52 to generate Al and Ti oxides [87, 89, 128] was
detrimental to the quality of fusion. The amount of oxides generated during a single
pass was not found detrimental, but the gradual accumulation of the oxides after 12
to 14 passes caused fusion problems regularly. In some cases, especially when the
laser power was low, the oxide layer was also trapped between passes, causing lack
168
of fusion type defects. Generally, the light oxides, as well as gas bubbles, had
enough time to float to the surface of the weld pool.
Physically removing the oxides was found to be an effective approach to improving
the resulting weld integrity and was regularly used. Each bead was wire brushed
after welding. The dust produced was removed by compressed air.
Using pre-heating also reduced the effectiveness of the stationary nozzles by
generating a strong rising thermal column of air, thus destabilising the gas
atmosphere generated by the nozzles. A more sophisticated design had to be
developed for use in dissimilar metal welding.
The final gas shielding setup was based on the blade principle. It was realised that
the only way to avoid the ejector phenomenon to drag ambient air and therefore
oxygen into the weld was to inject the gas very close to the weld pool and the
cooling weld bead. Nozzles capable of reaching the bottom of the 40 mm welding
groove were sourced and the design was based on these.
Firstly, the commercial nozzles had to be thinned to fit the welding groove. The
originally 5 mm thick nozzles were worked down to 3 mm. A nozzle was placed on a
bracket on the welding head. It was positioned to follow the melt pool as close as
possible without being damaged by the heat. Later another nozzle was added after
that and the nozzles ended up covering nearly 100 mm of the cooling weld bead.
During trials with one trailing nozzle, it was found that a leading nozzle was required
to prevent air from entering the weld from the front. Four different designs were
experimented. Development of the leading nozzles was found to be challenging due
to the wire feed nozzle occupying the space. Gas nozzles placed between the wire
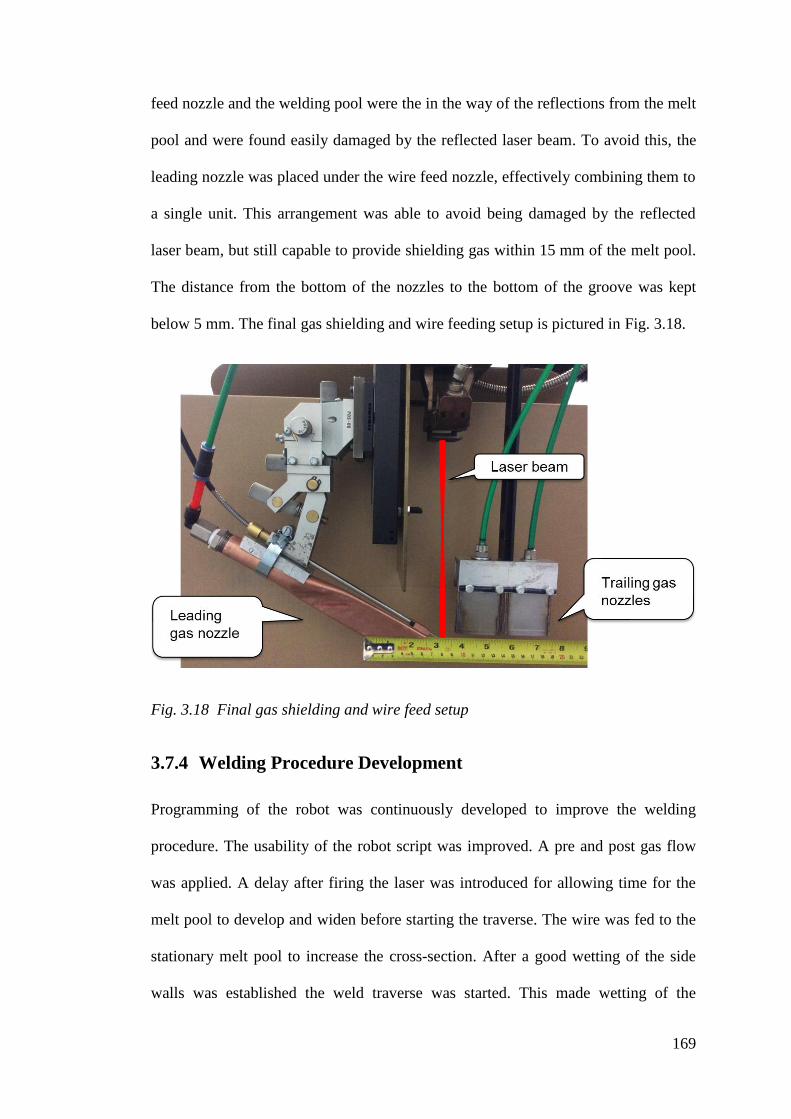
169
feed nozzle and the welding pool were the in the way of the reflections from the melt
pool and were found easily damaged by the reflected laser beam. To avoid this, the
leading nozzle was placed under the wire feed nozzle, effectively combining them to
a single unit. This arrangement was able to avoid being damaged by the reflected
laser beam, but still capable to provide shielding gas within 15 mm of the melt pool.
The distance from the bottom of the nozzles to the bottom of the groove was kept
below 5 mm. The final gas shielding and wire feeding setup is pictured in Fig. 3.18.
Fig. 3.18 Final gas shielding and wire feed setup
3.7.4 Welding Procedure Development
Programming of the robot was continuously developed to improve the welding
procedure. The usability of the robot script was improved. A pre and post gas flow
was applied. A delay after firing the laser was introduced for allowing time for the
melt pool to develop and widen before starting the traverse. The wire was fed to the
stationary melt pool to increase the cross-section. After a good wetting of the side
walls was established the weld traverse was started. This made wetting of the

170
sidewalls more reliable and therefore improved the sidewall fusion, especially at the
beginning of the dissimilar metal welds. Stainless steel welds were not found prone
to problems with this as good quality cross-sections may be made within less than
5 mm from the beginning of the weld.
3.7.5 Alignment of the Weld and Equipment
The alignment of the robot to the sample was originally done by eye and the pilot
laser. By careful execution, this procedure proved satisfactory for stainless steel
welding. During the dissimilar metal welds, this was challenged. The accuracy of the
method was found to be insufficient and the increasing number of nozzles in the
weld groove made observing the actual alignment very difficult.
A coaxial camera system was implemented to improve the precision of the
alignment. This provided a view through the welding head coaxially with the
processing laser. To align the image to the laser a test firing of the laser was
performed producing a spot weld on a sample. Crosshairs were then centred to the
produced spot weld. The crosshair was then available for aligning the weld, with
good precision. The crosshairs are pictured during a test weld in Fig. 3.19. It can be
seen, that in this case, the alignment is wrong by 0.5 mm as the right-hand side
bottom corner of the welding groove is not melted properly. The coaxial camera and
crosshairs allowed the weld to be aligned with a precision matching the repeatability
of the robotic system.

171
Fig. 3.19 Cross-hairs aligned to the centre of the laser spot seen during a trial weld
1) Top of base materials, 2) Welding groove sidewalls, 3) Backing plate.
Later the Phantom Miro IV high-speed camera was used in the coaxial system to
allow recording of the resulting videos. This replaced the original analogue camera
system and the crosshair feature was not available. In this case, the camera itself was
aligned to the weld. This was found less convenient, but also very robust and re-
adjustment was rarely required.
3.8 Monitoring of the Welding Process
The welds conducted were monitored using several techniques. The temperature of
the samples was monitored. The welding distortions were measured after each pass
to develop the welding groove design. The weld pool behaviour was observed using
laser illumination imaging and the coaxial camera system of the welding head. These
methods were crucial to the development of the welding process and weld pool
management.
1 1 2 2 3

172
3.8.1 Interpass Temperature Measurement
The pre-heat and interpass temperature measurements were conducted with a
thermocouple thermometer from the middle of the sample. The measurement was
made 20 mm offset from the weld centreline, see Fig. 3.20. In cases of dissimilar
metal welds, the measurements were made on both base materials.
Fig. 3.20 Measurement of the pre-heat and interpass temperature
3.8.2 Measurement of Welding Distortions
The transverse welding distortions were measured using various methods to help the
development of the welding groove design. The groove width was measured directly
between the top corners of the welding groove. An indirect contraction measurement
was calculated from measurements over a wider area. 3D scanning was implemented
to support the mechanical measurements.
Direct groove width measurement by a calliper was applied after each pass, as well
as two indirect measurements between points on the top surfaces of the samples. The

173
measurements were found to be concordant. This observation was later utilised by
concentrating on the direct measurements and one type of point measurement.
Choice of measurement locations was limited by the three pairs of welding clamps
occupying much of the space on top of the sample. Direct manual measurements of
the gap top width were made at two locations at 1/3 and 2/3 of the length of the
weld. Indirect measurements were made between points punched to the top surface
of the samples approximately 20 and 75 mm from the centreline of the weld, see Fig.
3.21 and Fig. 3.22.
Fig. 3.21 Punch mark locations for indirect distortion measurements

174
Fig. 3.22 Conducting the indirect gap measurement between punch marks.
The direct gap width measurement provided reliable data until the groove top corners
would get rounded by heat. In some cases, the edges were damaged prematurely by
contact with the laser beam. This was due to the groove contracting faster than
predicted and the laser beam touching the sidewalls. This was corrected by changing
the groove design.
The indirect measurement using the punch marks was continued until the completion
of the weld. The indirect gap was calculated as per ( 3.2 ), in which Gn = gap at pass
n, G0 = original gap pre welding, dn = measurement at pass n and d0 = original
measurement pre-welding.
𝐺𝑛 = 𝐺0 − (𝑑0 − 𝑑𝑛)
( 3.2 )
A hand-held 3D scanner was used to measure the welding distortions. The butterfly
angle measurement of the top surface was studied. The scanned model was divided
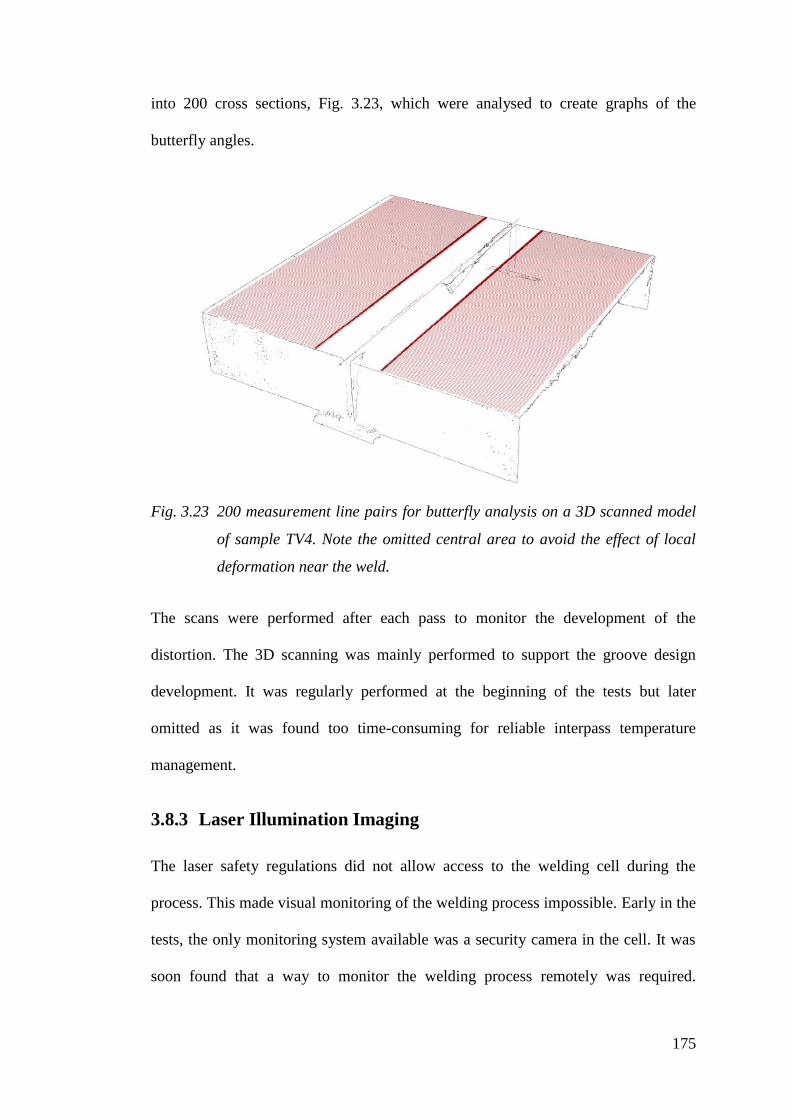
175
into 200 cross sections, Fig. 3.23, which were analysed to create graphs of the
butterfly angles.
Fig. 3.23 200 measurement line pairs for butterfly analysis on a 3D scanned model
of sample TV4. Note the omitted central area to avoid the effect of local
deformation near the weld.
The scans were performed after each pass to monitor the development of the
distortion. The 3D scanning was mainly performed to support the groove design
development. It was regularly performed at the beginning of the tests but later
omitted as it was found too time-consuming for reliable interpass temperature
management.
3.8.3 Laser Illumination Imaging
The laser safety regulations did not allow access to the welding cell during the
process. This made visual monitoring of the welding process impossible. Early in the
tests, the only monitoring system available was a security camera in the cell. It was
soon found that a way to monitor the welding process remotely was required.

176
Monitoring the progressing weld was found to be crucial for observing the weld pool
phenomena and evaluating the equipment in real-time and retrospect.
Laser illumination imaging (LII) is a novel way of monitoring welding processes.
The images are free of glare by the hot glowing gases or electric arc. The digital
camera systems used allow for easy adjustment and recording of the video material.
An LII system consists of a single wavelength laser light source, a narrow bandpass
filter and a digital camera. The working principle is that the target is illuminated by a
powerful light of a particular wavelength and only this wavelength light passes to the
camera sensor through the bandpass filter. All other light is omitted to produce an
image free of disturbance from ambient light sources. The laser used as the light
source is usually pulsed and the camera shutter has to be synchronised to the light
pulses. This is achieved by using a high-speed camera which can be triggered frame
by frame.
First, a laser illumination imaging system was borrowed from EPSRC equipment
loan pool (EIP). The setup consisted of a Cavitar Cavilux illumination laser and a
Phantom MIRO IV high-speed camera. This system provided state-of-the-art
monitoring of the welding process. In the Cavilux system, the illumination laser
aperture unit was a small cylindrical unit at the end of an optical fibre. This was
fitted to the welding head parallel with the processing laser. The camera was fitted
next to the light source. The triggering was provided by the camera system, the
Cavilux acting as a slave. The welding head setup is pictured in Fig. 3.24.

177
Fig. 3.24 Laser illumination imaging setup on the welding head. Experimental LED
light source pictured, Cavilux laser aperture unit similar in size
As the EPSRC EIP closed in mid-2016 a replacement for the Cavitar Cavilux LII
system was needed. The MIRO IV high-speed camera was received as a donation
from the EIP, but a new light source had to be sourced. First a high power single
wavelength LED pictured in Fig. 3.24 was trialled, but it proved to be too low-
powered for satisfactory operation.
Later an Oxford Laser illumination system became available from the EPSRC EIP.
This was then received as a donation. The Oxford Laser illumination system differed
from Cavilux by having no optical fibre to guide the laser. This meant that the large
laser source itself had to be pointed to the weld. The laser unit was mounted
stationary on a tripod. This proved cumbersome but was applied with success to
several welds. The resulting image quality can be seen in Fig. 3.25 depicting a weld
pool 36 mm deep in the welding groove with no glare or other disturbances.
Camera
lens
Light source

178
Fig. 3.25 A frame from Laser illumination imaging video. 3rd
pass of test DS1. 1)
Top of the stainless steel plate, 2) Top of the ferritic steel plate, 3) Weld
bead, 34 mm below the previous, 4) Wire feed nozzle and 5) welding
groove side wall (dark area).
As the gas shielding arrangement became more intrusive by the introduction of the
trailing gas nozzles, the Oxford Laser LII system had to be removed as there was no
way to deliver the illumination light to the welding groove. The previously untried
built-in coaxial camera system was put into use, using ambient light from the
welding process.
The coaxial camera system in the welding head had previously been examined for
use with the LII systems. Two main issues had prevented the application. The main
problem was that in the coaxial optics there was no space for the bandpass filter,
which is essential to the operation. Secondly, it was found that the optical system
was not designed to focus at the exceptionally large focal offset used in conduction
mode welding.
During ambient light coaxial imaging, the inability to focus on the subject was
overcome by using the smallest aperture available in the optics. This provided the
maximum depth of field and the image obtained was found satisfactory for
observation of some important phenomena, see Fig. 3.26.
1
2
3 4
5

179
Fig. 3.26 A frame from the coaxial camera system video. 1st pass of test SA5.
1) Welding groove sidewalls, 2) Filler wire and 3) wetting of the sidewall
One major limitation of all the imaging systems used was the limited memory of the
MIRO IV camera used. The 2 GB memory was only able to record the full length of
the weld at a frame rate of 50 fps. High-speed imaging was possible only for shorter
periods, preventing the recording of the whole welding pass. The inflexibility of the
Oxford Laser light source placement was also a big issue. By using a more modern
larger memory camera and an optical fibre delivered illumination these issues would
be easily overcome.
Wire feeder stability, alignment of the weld and equipment, wetting of the sidewalls,
oxidation, smoke generation (overheating), undercut formation, sidewall or nozzle
damage by reflections, overheating of the groove top corners were among the issues
detected and rectified by using the imaging systems. The resulting recordings were
imperative for the development of a successful welding process.
1
1
2
3

180
3.9 Measurement Uncertainties
3.9.1 Laser Power
In the IPG laser system, the desired laser power was set fundamentally as a
percentage of the full power. For clarity, the percentage was expressed in kilowatts.
Due to the operating principle and the construction of the laser system, there was a
slight difference in the laser power set using the software compared to the emitted
power monitored by the software and furthermore to the actual power at the
workpiece.
The emitted power was monitored by the IPG laser system and it was displayed as
each weld was being made. The IPG system displays the output power based on the
pump current for the diodes. As the efficiency of the diode system varies, the pump
current is not a fully reliable measure of the laser power. Another source of error was
that the system cannot take into account the losses in the beam delivery system, for
example, the losses at the fibre connections and inside the welding head.
To assess the issues mentioned above, a calibration of the system was required. In
Fig. 3.27 a calibration chart is presented. The chart displays the relation of set power
(Analogue Input) to the displayed power (Monitor) and actual power (Actual) on the
workpiece. The power measurements were made with the current setup of the fibre
delivery system, such as the fibre, collimator and the welding head. For the
calibration chart, the power at the workpiece was measured by a Primes
PowerMonitor 100 laser power meter. The calibration was executed during the laser
system acceptance trials before this study begun.

181
Fig. 3.27Laser power calibration chart
The fibre laser source used in this study consists of 16 1 kW fibre modules. These as
a whole are protected for back reflection from the workpiece. Occasionally a single
module may develop a fault due to back reflection or other reasons and is
automatically disconnected from use. This phenomenon was found to occur only
when power near the maximum 16 kW was used, which was not the case in the
welds in this study, although it happened several times over the course of this work.
The laser system reacts to the absence of a module by increasing the power of other
modules, allowing the laser to be used within the reduced power range available. The
reverse happens as the modules are repaired and returned to use. This response,
however, is not entirely perfect and some change in power results. Over the course of
this work, this offset in laser power varied between +5.3% and -9.7%.
The laser power was found stable during a single welding pass. A maximum
variation of 0.7% was recorded. This was considered insignificant. When the laser
power was changed, the offset also changed. At worst, the variation was 3.4% for
weld DS2. For other welds of the study, the variation was within 1.0%.

182
3.9.2 Spot Size Control
The spot size control was compiled from spot on plate tests, the LII videos and was
measured manually from the experiments. Using a calculated spot size for the
records was considered, but the long working distance, working at large offsets, was
found to give considerable discrepancy between the theoretical and practical spot
diameters. One phenomenon not taken into account, if a calculated value would have
been used, was the change of the focal length of the optics due to heat during the
process, also known as focus shift [192, 193]. An increase of 40% in focal spot
diameter was reported just after 50 s at 7 kW laser power [193]. Also, the variation
of laser power, which could’ve caused a change in the effective spot size, was
considered small, especially during the critical filling passes.
The size of the actual effective spot size was kept just small enough to prevent
damaging the upper corners of the welding groove. This gap was then measured with
a calliper and the laser head offset was recorded. The spot on plate tests were used as
a starting point. The measurement accuracy for the spot size was considered to be
±0.2 mm, in the case of measurement from the welding groove top gap.
3.9.3 Accuracy of Welding Consumable Feed
The wire feed speed of the feeder used in early trials was found prone to fluctuation.
This was partly due to the friction in the long conduit required and the bending of the
conduit during a welding pass. The issue was solved by introducing a closed-loop
control feeder unit mounted on the robotic arm, reducing the length of the feed
conduit to 1 m and lessening the changes in bends during welding. The speed of the
wire feed was calibrated by allowing the feed to run 1 min at the speed of 1 m/min.
The feed rate was found reliable to within 2%.
183
The accuracy of the generic gas flow rotameters used was +-10% stated by the
supplier.
3.9.4 Welding Robot Accuracy
The welding speed and positioning of the welding head were controlled by the
KUKA KR 30 HA (high accuracy) robotic system. The manufacturer states ISO
9283 repeatability of 0.05 mm [194].
3.9.5 Accuracy of the Alignment of the Welds
As the first welds were aligned manually using the pilot laser, the alignment error
was considered to be 0.2 mm. Later, when the coaxial camera was used for aligning
the welds as well as monitoring, the accuracy matched the accuracy of the robotic
system.
3.9.6 Welding Groove Dimensional Accuracy
The welding groove angle was machined by Agie Charmilles Fi400CCS multi-axis
wire cutting machine. The machine has a 0.05 µm resolution. The width of the
welding groove varied because of the manual welding required for the attachment of
the backing plate. This variation was measured to be ±0.3 mm.
3.9.7 Accuracy of the Distortion Measurements
The mechanical measurements, such as the direct and indirect distortion
measurements were done by a calliper. Accuracy of the calliper was 0.02 mm [195]
and by comparing repeated measurements on test spots the repeatability of the
measurements was considered to be 0.05 mm.

184
The accuracy of the Handy Scan 3D scanner was 0.030 mm with a resolution of
0.050 mm [196]. These values were stated as maximum, the ISO 10360 volumetric
accuracy was 0.020 mm + 0.060 mm / m.
3.9.8 Summary
Table 3.12 displays typical parameter and measurement values and their errors.
Table 3.12 Typical values of different parameters and measurements with errors
Typical
Value
Error Error %
Laser Power 3500 W ± 35 W 1.0
Spot Size 5 mm ± 0.2 mm 4.0
Welding Wire Feed Rate 1.0 m / min ± 0.01 m / min 1.0
Welding Speed 0.48 m / min m / min
Positioning Accuracy n.a.* 0.050 mm
Argon Flow Rate 20 l / min 2 l / min 10
Welding Groove Angle 2.5 ° 0.05 µm
Welding Groove Gap 5 mm 0.30 mm 0.6
Mechanical Measurements ~50 mm 0.05 mm 0.1
3D Scanning n.a. 0.020 mm
* not applicable
3.10 Analysis Methods for the Weldments
The integrity of the welds produced was evaluated using several methods. The
evaluation was begun with an industry-standard X-ray analysis and complemented
with further assessment of grain structure, residual stresses and mechanical
properties.
All welds were subjected to visual examination. The visual examination results were
supported with process monitoring data, mainly videos and groove behaviour
measurements to assess the outcome. If the weld was found free of flaws it was sent
185
to X-ray analysis for more precise evaluation. The decision for further analysis was
made using these results.
To utilize each sample as effectively as possible, the order in which the analysis
would be conducted had to be planned carefully. The first destructive test would be
contour cutting as this would require cutting an intact sample. Other destructive tests
were conducted after the contour scanning was completed and the data quality found
satisfactory for processing.
3.10.1 X-ray Radiography and Acceptance
Welds in this study were radiographically analysed by X-ray radiography as per BS
EN ISO 17636-1: 2013, ASME V Article 2:2015, British Engineering Services 02-
111-I063 and British Engineering Services 02-111-I085. The welds were subjected
to acceptance by BS EN ISO 13919-1 [177] & ASME IX QW 191: 2015. ASME IX
describes a standard method for analysing welds in nuclear applications and was
conducted to provide an industry-standard assessment of the integrity of the welds.
Radiography was found to be a reliable and quick way to establish the quality of the
welds. Using a non-destructive method was essential to save the sample integrity for
the consequent mechanical analysis, especially for the residual stress measurements.
Issues caused by welding flaws were also avoided by X-ray analysis. For example,
severe lack of fusion or other similar discontinuities were avoided to reduce the risk
of EDM wire breakages during contour cutting.
3.10.2 Microstructural Analysis and Triple Etching
The machining of samples for advanced destructive testing was performed mainly by
EDM. Some simpler samples for microstructural and hardness analysis were cut

186
manually using a band saw and a disc cutter. Usually, the backing plate was left
attached to the sample, see Fig. 3.28. The microstructural analysis was conducted
entirely on full-size cross-sectional samples. These were extracted at points of
interest in the weld.
Fig. 3.28 Typical sample for microstructural and hardness analysis, thickness
varying from 2 mm to 10 mm
The tri-metal nature of the cross-sectional samples required three different etchants
to be used to reveal the microstructures of the three different areas in the welds. The
etching procedure was performed in three separate stages from the weakest etchant
to the strongest.
The first etching stage was to etch the ferritic steel segment of the cross-section. This
was achieved by using 2% Nital. The sample was swabbed with cotton wool
immersed in the etchant for 5 – 7 s and rinsed and dried immediately.
For the subsequent stages, the previously etched parts of the sample were covered
with Lacomit lacquer to protect them from the strong etchants which would
otherwise destroy the surface. The lacquer was applied manually, leaving as narrow
a strip as possible of the already etched material uncovered. This was to ensure

187
etching to reach the fusion line, but simultaneously limit the contamination of the
etchant by excessive by-products of the rapidly etching low-alloyed material.
The second stage was performed to etch the Ni-alloy weld metal. For this 10%
Ammonium persulfate in aqueous solution (Rawdon etchant) was used. The process
was electrolytic etching at 6 V. The processing time was 5 - 10 s.
The third stage of etching was using 2% Oxalic acid in aqueous solution to reveal the
microstructure of the stainless steel. The other areas were covered with Lacomit. The
etchants and processes used are listed in Table 3.13.
Table 3.13 Etchants, compositions and applications
Etchant Composition Type Target Duration
Nital 2% HNO3 –
Ethanol
Chemical Ferritic steel 5 – 7 s
Ammonium
persulfate
10% (NH4)2S2O8-
Water
Electrochemical 6 V Nickel alloy 5 – 10 s
Oxalic acid 10% C2H2O4 -
Water
Electrochemical 6 V Stainless steel 40 – 50 s
3.10.3 Hardness Mapping and Hardness Line Scanning
There are several phenomena causing hardening of steels in welds. Formation of
metastable martensite phase caused by rapid cooling and work hardening due to
strain were considered in this study. Generally, hardening is considered as negative,
as it leads to a decrease in ductility. Hardening of the weld metal and the heat
affected zones were to be expected. The hardness testing was used as a valuable tool
for phase recognition in the microstructural analysis.
Two types of hardness testing were applied to the samples. Firstly, a hardness map
was generated over the whole sample to display the overall hardness change due to

188
the welding process. After the large scale maps, more detailed hardness testing was
conducted to reveal small scale phenomena and to support microstructural analysis.
The hardness tests were made using a Struers DS-80 890 automated hardness tester.
The hardness was measured in the Vickers scale, using small indentation forces
0.3 kg and 1.0 kg, regarded as low-force Vickers hardness. Equation ( 3.3 ) [180]
describes the Vickers number calculation.
𝐻𝑉 =1
9.80665×
2𝐹𝑠𝑖𝑛136°
2𝑑2
( 3.3 )
To avoid interaction between indentations caused by work hardening, the distance
between indents was increased by using an alternating multi-row pattern instead of a
straight line of indents. Standards ASTM E384 [181] and ISO 6507-1 [180] give the
following Table 3.14 for minimum distances.
Table 3.14 Minimum distances to prevent work hardening artefacts in hardness
testing. d = indent diagonal [180, 181]
Distance between
indentations
Distance to the edge of specimen
ASTM E384 2.5 d 2.5 d
ISO 6507-1 > 3 d for steel and copper
alloys > 6 d for light metals
2.5 d for steel and copper alloys >
3 d for light metals
The expected lowest hardness numbers were in 316L stainless base materials, 152
HV [197]. Using HV 0.3 scale this translated to an indent diagonal of 60 µm,
yielding minimum spacing of 150 - 180 µm. The mapping was made to reveal the
effect of the heat input to the material properties. As the welds in question are multi-
pass welds the effect of multi-pass tempering was studied.
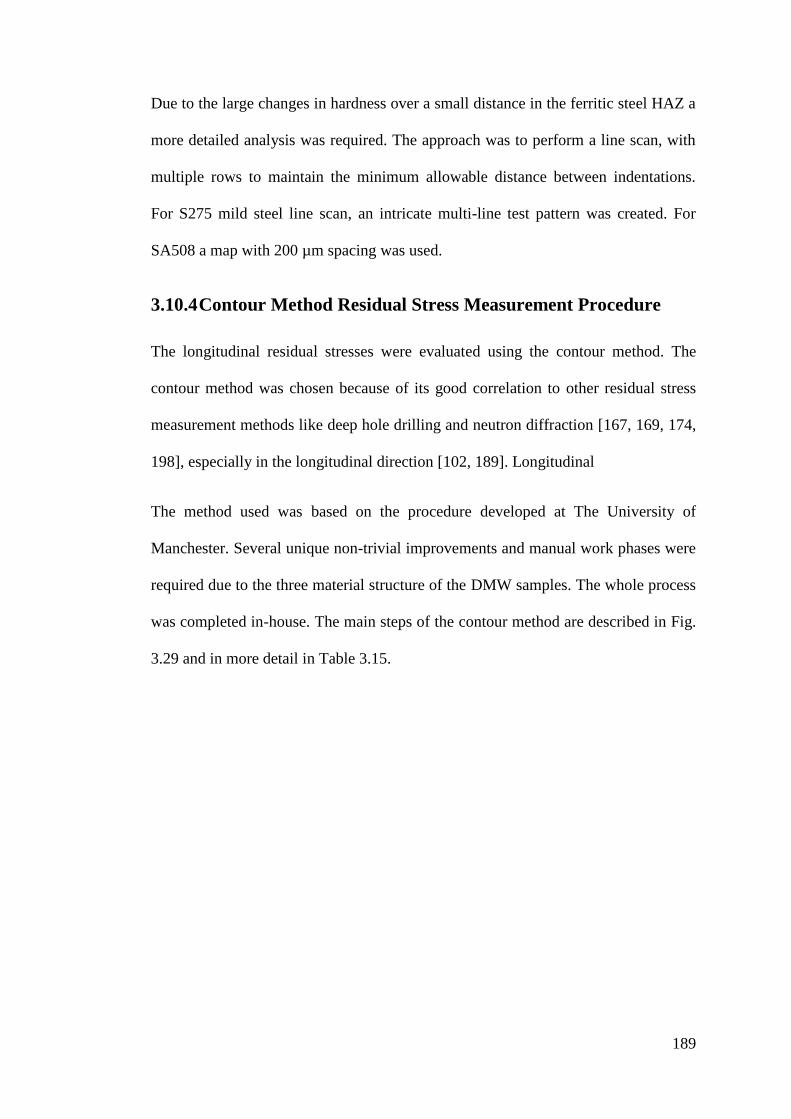
189
Due to the large changes in hardness over a small distance in the ferritic steel HAZ a
more detailed analysis was required. The approach was to perform a line scan, with
multiple rows to maintain the minimum allowable distance between indentations.
For S275 mild steel line scan, an intricate multi-line test pattern was created. For
SA508 a map with 200 µm spacing was used.
3.10.4 Contour Method Residual Stress Measurement Procedure
The longitudinal residual stresses were evaluated using the contour method. The
contour method was chosen because of its good correlation to other residual stress
measurement methods like deep hole drilling and neutron diffraction [167, 169, 174,
198], especially in the longitudinal direction [102, 189]. Longitudinal
The method used was based on the procedure developed at The University of
Manchester. Several unique non-trivial improvements and manual work phases were
required due to the three material structure of the DMW samples. The whole process
was completed in-house. The main steps of the contour method are described in Fig.
3.29 and in more detail in Table 3.15.

190
Fig. 3.29 High level overview of contour method analysis

191
Table 3.15 Contour method workflow
Step Name Comments Equipment /
SW
1 Contour Cut Sample cut transversely to the
direction of forces in interest
EDM
2 Surface profilometry
(Contour scan)
Resulting cross-sectional surfaces
scanned for deviation from perfect
straight surface
Nanofocus
laser scanner
3 Surface profile data
processing
Removing areas of no interest and
excess noise
Matlab
4 Automated data cleaning Generates also outline of the
sample
Matlab
5 Surface averaging 2 surfaces averaged into one Matlab
6 Noise removal Averaged surface cleaned Matlab
7 3D model extrusion Outline extruded into a 3D model. Abacus
8 3D model meshing and
surface data import
Linear quadratic elements Abacus
9 Calculation of forces
required to flatten the
surface
Using the model generated and
boundary conditions
Abacus
10 Contour map generation Data filtering plays important role Abacus or
Matlab
The contour cutting for the samples used was performed by EDM. In order to
prevent plasticity artefacts due to cutting the samples were restrained very carefully.
A special jig, Fig. 3.30, was used to restrain the sample during cutting to reduce
plasticity.
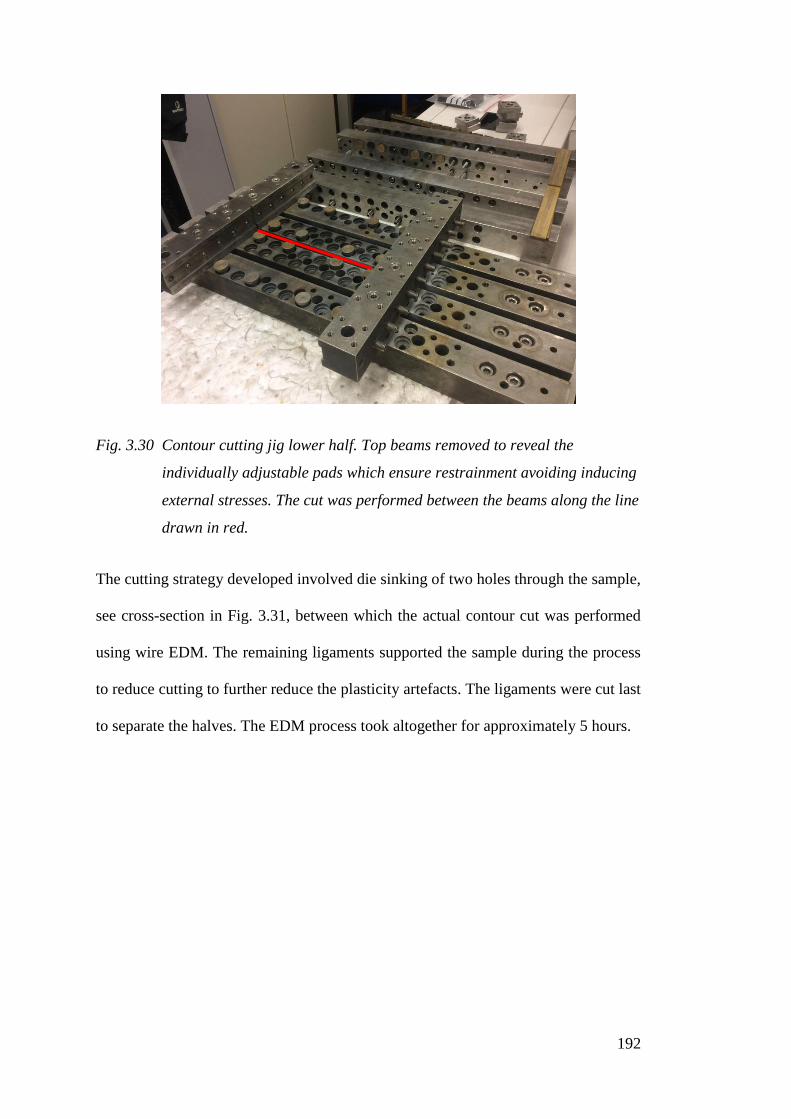
192
Fig. 3.30 Contour cutting jig lower half. Top beams removed to reveal the
individually adjustable pads which ensure restrainment avoiding inducing
external stresses. The cut was performed between the beams along the line
drawn in red.
The cutting strategy developed involved die sinking of two holes through the sample,
see cross-section in Fig. 3.31, between which the actual contour cut was performed
using wire EDM. The remaining ligaments supported the sample during the process
to reduce cutting to further reduce the plasticity artefacts. The ligaments were cut last
to separate the halves. The EDM process took altogether for approximately 5 hours.

193
Fig. 3.31 Contour cut sample, cross-sectional view. Contour cut made first, with
ligaments in place to support the sample.
After the contour cut the sample was restrained in a jig, Fig. 3.32, for surface
profilometry. The sample was levelled horizontally using a test dial indicator and a
measurement table. This was to reduce digital data processing and make the
scanning process more reliable. The laser scanner used was NanoFocus µScan. The
resulting raw data was converted from a proprietary format to a .DAT ASCII data
file using the proprietary software.
Fig. 3.32 Sample of SA5 mounted to a jig undergoing the contour scanning
Pilot hole
Ligament
Contour cut
40 mm

194
The profilometry was conducted to both resulting halves of the sample. It provided
two 3D point cloud files; see an example in Fig. 3.33. The data would go through a
series of processing steps to provide a filtered average of the two samples, Fig. 3.34.
Decisions between under and overfitting were made to avoid excess noise while not
removing vital data. The averaged point cloud was also used to generate a silhouette
profile spline with seeds for mesh generation later in the process, Fig. 3.35.
Fig. 3.33 Profilometry raw data example, (µm)
Fig. 3.34 Averaged data with some residual noise, not in scale

195
Fig. 3.35 Profile outline silhouette spline with seeds (circles) for mesh generation
The surface outline spline generated was used to generate a 3D model of the sample,
Fig. 3.36. The outline silhouette was used to extrude a model of the real sample. The
model was divided into three materials using the fusion lines to separate different
material properties. The processed profile data was used with a mesh of linear
quadratic elements to create a solid model. Solid lines with seeds at regular intervals
were added to the model at three locations. This was to generate data points with
regular intervals for line plotting the results at certain predetermined depths.

196
Fig. 3.36 Finite element mesh (left) and the 3D extrusion (single material sample
shown)
Different knot spacings were used for the contour maps, see Fig. 3.37 and Fig. 3.38.
It was noted that different data processing yielded very dissimilar results. The main
observation was the sensitivity of extreme values to the data smoothening.
Fig. 3.37 Contour method residual stress map plotted using dense knot spacing
Fig. 3.38 Contour method residual stress map plotted using less dense knot spacing

197
3.10.5 Tensile Testing
The tensile testing was conducted according to ASTM E8/E8M – 16a [182]. The
tester used was an Instron 4507 two ball screw tension and compression testing
machine. The standard presents 450 mm and 200 mm overall length samples as
standard and specifies a 100 mm coupon as sub size. However, it was decided to use
a smaller size due to limitations by the material available to conserve material for
further tests. The test samples used, Fig. 3.39, were 75 mm long. The samples were
extracted by EDM and tested in as-machined condition.
Fig. 3.39 Tensile test sample ASTM E8/E8M. Longitudinal and composite similar.
Two types of tensile tests were made, longitudinal and transverse (composite). The
longitudinal tests were conducted in both base materials, heat affected zones and the
weld metal. The transverse tests were made across the entire weld. These tests were
made in triplicate. All tensile tests were recorded for DIC processing.
The correlation between tensile strength σ and hardness HV can be described as per
( 3.4 ) [73].
𝐻𝑉 ≈σY
3
( 3.4 )

198
3.10.6 Digital Image Correlation
Digital image correlation was used to analyse the strain localisation in the tensile test
samples. The equipment used was LaVision Strainmaster Portable. The raw data was
processed using DaVis 8.3.1 software to produce strain maps. Further analysis was
performed by Strainmaster DIC 1.0.0 software. The test setup Fig. 3.40 consisted of
a stereo camera arrangement where both cameras were equipped with separate
flashlights.
Fig. 3.40 DIC setup for tensile testing. 1) cameras, 2) flashlights and 3) tensile
test sample.
The samples were prepared by spraying a contrast speckle pattern on one side. This
was done by spraying a speckle pattern with alternating contrasting colours. Black
and white paints were used. The resulting pattern is displayed as Fig. 3.41.
1 1 2 2 3

199
Fig. 3.41 Tensile test samples used for DIC by spraying a speckle pattern
3.10.7 Charpy-V Impact Toughness Analysis
A series of Charpy-V impact tests were conducted to the samples. The tests were
made according to ASTM E23 [199] and ISO 148-1:2016 [178]. Standard size
coupons were used, Fig. 3.42.
Fig. 3.42 Charpy-V impact toughness test coupon as per ASTM E23 and ISO 148-1
Impact toughness tests were concentrated on the HAZ of the ferritic steel. This area
is the most prone to ductility issues in these types of welds. The United States
Nuclear Regulatory Commission sets the minimum impact energy of 102J for ferritic
materials of nuclear reactors [159]. A comparison set was provided by tests in the
ferritic base material. The tests were performed at several different temperatures to
study the ductile-brittle transition temperature. Results were plotted according to BS
Standards Publication PD ISO/TS 7705:2017 [179]. The temperatures used ranged
between 150°C and -120°C.

200
201
4 Thick Section Narrow Gap Laser Welding of
316L Stainless Steel
4.1 Introduction
At the beginning of this study, a series of stainless steel similar metal NGLW
experiments were made. These thick section welds up to 40 mm were made using
200 mm long samples. They were named Stage I. Their purpose was to serve as the
basis for the development of the welding protocol, equipment, groove geometry,
monitoring and analysis methods for the future dissimilar welding trials. These
experiments were also found valuable for familiarising the staff to the welding
process and the principal analysis methods of the weldments.
The main points of interest and challenges encountered by previous researchers were
mainly in groove design and tolerances [36, 44], and the gas shielding efficiency [17,
18, 20]. Several studies were found considering challenges in NGLW. Jokinen 2004
[17] reported oxidation increasing porosity. Yu et al. 2013 [18] concluded high-
speed shielding gas jets distorting the weld pool shape. Zhang et al. 2011 [20]
discussed using different shielding gases but did not find issues in their 3 pass welds
while using a simple single leading gas jet. They also found two types of lack of
fusion, interpass and sidewall, which were also examined in this study.
During the welding, the process was monitored using different methods. The
preheating and interpass temperatures were recorded. The welding distortion was
observed by mechanical measurements and laser 3D scanning. Each pass was
visually checked for wetting, undercut and fusion quality. As the programme
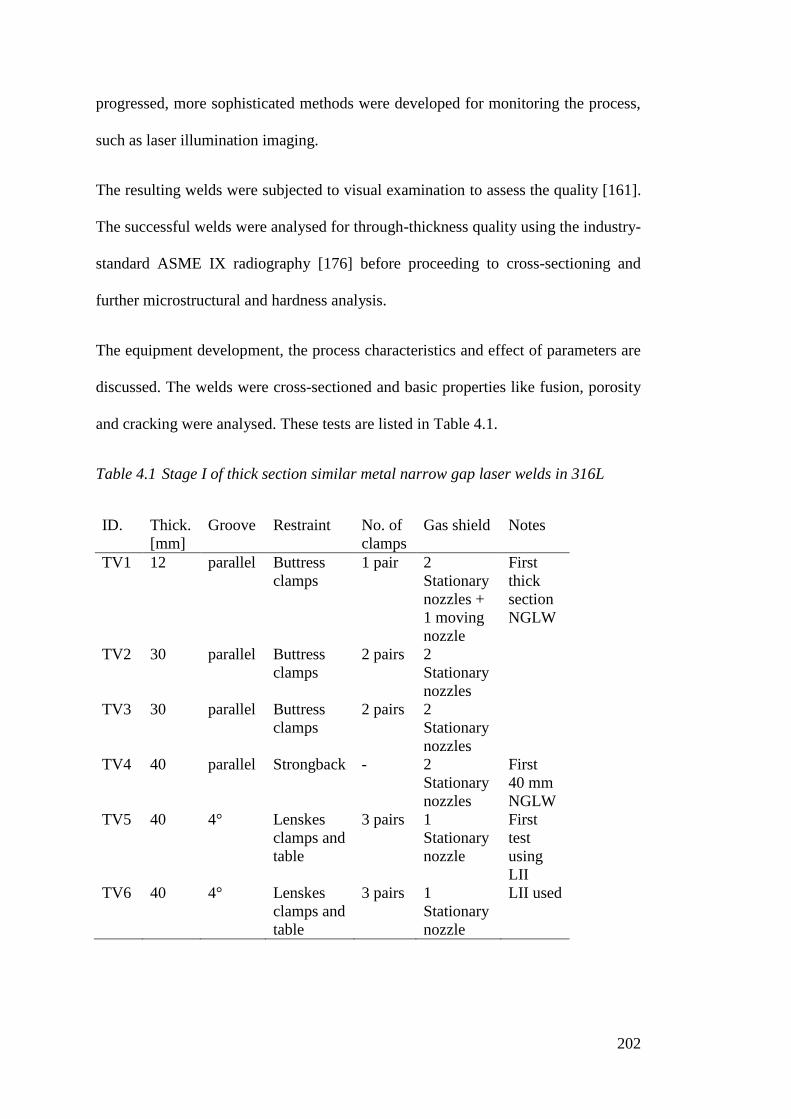
202
progressed, more sophisticated methods were developed for monitoring the process,
such as laser illumination imaging.
The resulting welds were subjected to visual examination to assess the quality [161].
The successful welds were analysed for through-thickness quality using the industry-
standard ASME IX radiography [176] before proceeding to cross-sectioning and
further microstructural and hardness analysis.
The equipment development, the process characteristics and effect of parameters are
discussed. The welds were cross-sectioned and basic properties like fusion, porosity
and cracking were analysed. These tests are listed in Table 4.1.
Table 4.1 Stage I of thick section similar metal narrow gap laser welds in 316L
ID. Thick.
[mm]
Groove Restraint No. of
clamps
Gas shield Notes
TV1 12 parallel Buttress
clamps
1 pair 2
Stationary
nozzles +
1 moving
nozzle
First
thick
section
NGLW
TV2 30 parallel Buttress
clamps
2 pairs 2
Stationary
nozzles
TV3 30 parallel Buttress
clamps
2 pairs 2
Stationary
nozzles
TV4 40 parallel Strongback - 2
Stationary
nozzles
First
40 mm
NGLW
TV5 40 4° Lenskes
clamps and
table
3 pairs 1
Stationary
nozzle
First
test
using
LII
TV6 40 4° Lenskes
clamps and
table
3 pairs 1
Stationary
nozzle
LII used

203
4.1.1 Expectations
The Stage I stainless steel welding was expected to give insight to the narrow gap
welding process. In order to understand the future dissimilar welds, these welds were
to be used as a benchmark. The similar metal welding removed the complexity of
dilution issues and the multitude of microstructures at different metallurgical zones
when using dissimilar metals. Therefore, by studying both similar and dissimilar
welds the phenomena related to the metallurgical properties were expected to be
distinguishable from the properties of the actual process itself.
The objectives were to develop robust welding equipment and procedures for
monitoring, measuring and documenting the process and start analysing the welded
samples using basic analysis equipment.
The 316L material for this stage NGLW was chosen as in literature the most work
had been executed on stainless steels. The non-phase transforming behaviour of
austenitic steels [98] was considered an important factor simplifying the
microstructural behaviour of the welds. Challenges in ferritic steel welding like
issues with cracking encountered by Feng 2016 [45] reinforced the choice, as the aim
was to simplify the effect materials have on the process at this stage as much as
possible.
The welding distortions were a major point of interest. The distortion measurements
were expected to allow detailed development of the welding groove geometry. The
development of the restraint system was central to this work as the equipment was to
be developed from scratch. The mechanisms leading to the contraction of the
welding groove were to be understood. The butterfly distortion angle and linear

204
contraction of the welding groove were to be measured and the correlation between
the grove contraction and the butterfly angle was to be analysed.
The gas shielding efficiency was to be analysed in order to avoid welding flaws. The
performance of the shielding was evaluated visually. The effect of oxidation on the
behaviour of the weld pool was to be monitored using LII. The resulting welds were
to be analysed for flaws by ASME IX radiography and macrography.
4.2 Materials
The materials used for the Stage I similar metal welding were 316L austenitic
stainless steel and ER 316L filler wire. They are described in detail in chapter 3.2.1.
4.3 Experimental Work and Results
The welding setup used in Stage I was based on previous experiences found in the
literature [17, 20, 35, 45] and fast prototyping with thinner materials. The
development of the experimental setup is described in detail in Chapter 3. During the
Stage I a welding protocol was developed. A procedure for accomplishing a 40 mm
multi-pass weld in 8 hours was accomplished. A systematic approach for recording
data from the experiments was developed and constantly improved. Laser
illumination imaging was implemented for the welds. Basic analysis for assessing
the quality of the weldments was executed.
The development of the equipment was one of the key topics at this stage of the
programme. A major part of the work was to reach the positional accuracy for the
wire feeder nozzle matching literature [44, 156]. There were issues like porosity,
reported by Jokinen 2004 [17] and fusion issues Zhang et a.l.2011 [20] found. The

205
gas shielding was improved in numerous ways to avoid them. The work was
complicated by very limited access to observe the welding process. Numerous
different nozzles for the filler wire and the shielding gas were studied and several
monitoring arrangements were developed and investigated.
4.3.1 Experiments 1-3
For experiments TV1, TV2 and TV3 the aim was mainly equipment development.
This included in principal development of the various nozzles required and
integrating the wire feeder control to the robotic system. Also, the gas shielding
arrangement was created and tested during these welds. The thicknesses of these
welds varied from 12 mm to 30 mm to save material and not to exceed the maximum
loading of the clamping system.
These first tests were made using parallel sidewall welding grooves. The filler wire
was 316L at 1.2 mm in diameter. The shielding gas was injected using two 15 mm
nozzles placed at the ends of the welds. The welding parameters for these tests are
displayed in Table 4.2.
Table 4.2 Welding parameters TV1 to TV3
ID. Groove
width
[mm]
Thick.
[mm]
Passes
welded
Power [kW] Focal
offset
[mm]
Speed
[m/min]
Wire
speed
[m/min]
TV1 4 12 4 3 40 0.72 3, 5, 5, 5
TV2 5 30 11 11, 7, ->
8.14
99 0.72 5
TV3 5 30 14 8.14 91 0.48 4 x 5, ->7
As a welding pass cools down, it shrinks and causes welding distortion. The
distortion pulls the sidewalls of the welding preparation together. In NGLW the main
issue resulting from this is that the welding nozzles will not eventually fit in. In

206
conduction mode NGLW the change in welding groove width would also require
adjustment of the laser spot size. To develop a groove design capable of anticipating
the welding distortion in order to keep the bottom of the groove width similar for
each pass, the welding distortions were monitored from the beginning of this study.
The contraction of the welding groove was monitored with measurements of the
welding groove width before the welding and the un-welded ends of the groove after
the welding, see Table 4.3.
Table 4.3 Groove contraction measurements TV1 to TV3
ID. Gap pre
welding
[mm]
Gap post
welding
[mm]
Contraction
[mm]
Contraction
[%]
Calculated
angle
[mm]
Clamps
TV1 4.0 2.9 1.1 28 6.3 Machining
TV2 5.0 damaged* - - - Buttress
TV3 5.5 3.6 1.9 35 3.6 Buttress
* The groove ends were damaged during welding preventing measurement
The welds were cross-sectioned, etched with 2% Nital and macrographed to see the
fusion quality. Generally, the fusion was good with no porosity, cracking or
inclusions, see Fig. 4.1. However, misalignment of the welding apparatus gave poor
results for the capping, see Fig. 4.2.

207
Fig. 4.1 Cross-section of TV1 showing a successful weld with no fusion issues and
good penetration to the backing plate
Fig. 4.2 Cross-section of TV2 showing asymmetry and poor capping due to
misalignment of the sample.
4.3.2 Experiment 4
The experiment TV4 was the first full-thickness weld. At 40 mm thickness, it was
not possible to use the buttress clamping available at the time, but a strongback

208
restraint was welded to the underside of the samples. This weld was the last to use a
parallel sidewall welding preparation and the welding distortion measurements were
used for developing the V-groove capable of accommodating the distortions.
The parameters for the 21 pass TV4 are presented as Table 4.4. The parameters were
kept constant during the entire weld, except for the passes no. 2 and 15 which were
re-melting passes and therefore performed without filler feed. The pass no. 2 was
needed to seal some apparent poor wetting of the first pass. The pass no. 15 was an
attempt to re-melt a large droplet off the sidewall, which was caused by interruption
of the previous pass due to unexpected movement of the sample. The droplet was
melted partially but prevented filling the groove fully as it intersected with the
leading filler wire nozzle. The weld was filled only partially for passes 16 to 21.
Table 4.4 Welding parameters TV4, all passes.
ID. Groove
width
[mm]
Thick.
[mm]
Passes
welded
Power [kW] Focal
offset
[mm]
Speed
[m/min]
Wire
speed
[m/min]
TV4 4.8 40 21 8.14 91 0.72 7 or 0
The distortions in TV4 were recorded manually at each end of the welding sample,
see Fig. 4.3. The gaps in data are due to the gap not being measured for re-melt
passes at the time.

209
Fig. 4.3 Average groove width per pass, measured directly between the top corners
of the welding groove, TV4.
4.3.3 Experiment 5
The parameters for TV5 were as with TV4, refer to Table 4.4. This weld was used
mainly for testing the laser illumination imaging setup in real NGLW conditions. All
welding passes were recorded and the resulting imagery found a valuable tool for
analysing irregularities in the process. A sample image is presented as
TV5 was also cross-sectioned and etched using oxalic acid. The macrographs
indicate a regular weld and good fusion, see Fig. 4.4. There were no cracks,
inclusions or pores.

210
Fig. 4.4 Macrographical cross-section showing no issues with fusion, cracks or
porosity TV5.
The laser illumination imaging was used to observe and record the welding process.
A frame of the video is shown as Fig. 4.5.
Fig. 4.5 A LII video frame, showing wire, nozzle and the welding pool. Note the
stable welding process. Stainless steel similar metal weld TV5

211
4.3.4 Experiment 6
The aim for the last Stage I weld was to investigate the groove contraction behaviour
of a 4° V-angle chosen based on contraction measurements on previous welds. The
groove contraction was measured manually from several points along the weld, both
directly from the groove edges and from punch mark points on the top surface. Also,
3D scanning was improved and the results analysed further. The laser illumination
imaging was also implemented for these welds.
Weld butterfly distortion of TV6 was measured using a hand-held 3D scanner. The
scanning was performed after each pass to examine the development of the
distortion. The butterfly distortion angle was measured from 200 cross-sections in
the 3D models. Fig. 4.6 describes the results for weld TV6.
0 25 50 75 100 125 150 175 200-0.50
-0.25
0.00
0.25
0.50
0.75
1.00
1.25
1.50
1.75
2.00
2.25
2.50
2.75
Released
Pass 15
Pass 14
Pass 13
Pass 12
Pass 11
Pass 10
Pass 9
Pass 8
Pass 7
Pass 6
Pass 5
Pass 4
Pass 3
Pass 2
Pass 1
Initial
Dis
pla
cem
ent A
ngle
(D
egre
es)
Length Along Sample (mm)
Fig. 4.6 The generation of butterfly distortion, 3D scan data analysis, test TV6
In Fig. 4.6 the concentration of the distortion towards the mid-length of the weld is
unmistakably displayed. This was later seen also as the welding groove getting

212
similarly slightly narrower at mid-length, causing the middle of the weld to fill
sooner than the ends.
From the distortion measurement results of experiment TV6, one may conclude that
a variable angle welding groove might be required. In the tests, it was found that the
welding groove width at the bottom of each pass stayed constant enough for reliable
welding when a 5° V-groove straight wall welding groove was used.
The groove top gap contraction was measured manually at 5 points; two direct
measurements and three measurements from punch marks offset ca. 20 mm from the
weld centreline. The distance between punch marks was then converted to a
calculated gap width. The following Table 4.5 and Fig. 4.7 describe the results. It is
noteworthy that the direct measurements match the calculated groove width very
well until the end of the weld. This divergence near the top was found to be due to
local yielding of the edge of the welding groove continuing even when the
completed weld had sufficient thickness and rigidity to counter larger scale butterfly
distortion.

213
Table 4.5 Groove contraction measurements, test TV6
Pass Point 1 Point 2 Point 3 GAP 1 GAP 2
0 38.40 37.82 38.78 8.20 8.26
1 38.11 37.24 38.14 7.85 7.69
2 37.80 36.95 37.80 7.55 7.33
3 37.50 36.73 37.50 7.26 7.04
4 37.26 36.39 37.44 7.00 6.81
5 37.05 36.15 37.32 6.81 6.60
6 36.72 36.06 36.93 6.49 6.37
7 36.48 35.68 36.60 6.13 5.95
8 36.18 35.40 36.34 5.87 5.70
9 36.02 35.14 36.29 5.63 5.47
10 35.23 34.82 36.18 5.51 5.36
11 35.86 34.75 36.12 5.40 5.27
12 35.77 34.84 36.20 5.31 5.14
13 35.81 34.91 36.20 5.20 5.08
14 35.80 34.86 36.10 5.08 4.92
15 35.70 35.01 36.03 -* -
16 35.73 34.78 36.21 - -
* accurate measurement not possible
0 1 2 3 4 5 6 7 8 9 10 11 12 13 14 15 16 17 18 19 204
5
6
7
8
Ga
p w
idth
(m
m)
Pass no:
Direct Measurements
Indirect Measurements
Fig. 4.7 Groove top contraction development of a 5° V-groove 40 mm thick 316L
similar metal weld. See the minimum staying over 5 mm. Direct
measurement was not applicable for last 2 passes due to melting of the
groove top edges, test TV6.

214
The results in Fig. 4.6 and Fig. 4.7 show an apparent discrepancy. A rapid increase
of butterfly distortion was seen in the 3D scanning during the passes from 5 to 9. In
the groove top gap contraction measurements, the results were near linear. This can
be explained by the overall distortion happening in different stages. The first stage
was found to be a nearly pure linear translation, as the first passes melted almost the
entire depth of the weld, which did generate contraction but was not able to cause a
change in the butterfly angle. At the second stage, passes 5 – 9, the existing
solidified weld was acting as a fulcrum and as the present pass contracted, a
considerable increase of butterfly angle was generated. When the proportion of the
already existing weld reached a sufficient level, the generation of butterfly distortion
was essentially stopped by this added restraint. From that on, the local yielding of
the welding groove was found to be the major contributor to the groove gap
contraction This can also be seen as a deviation of the direct and indirect
measurements near the end of the weld in Fig. 4.7, where the indirect measurements
from a distance away from the weld indicate no change, but the direct measurement
shows ongoing contraction.
The welding test TV6 was also used for trialling pre-heating by the processing laser
to demonstrate the versatility of laser systems [40]. Four passes were made with no
wire feed, using the parameters for pre-heating. The aim was to create a local pre-
heating effect. The welding parameters used are displayed in Table 4.6. The
parameters were kept constant from the first to the last pass where the welding speed
was slightly lowered to ensure good penetration due to signs of imperfect fusion on
the previous pass and to give a slightly higher deposition rate to fill the pass
adequately.

215
Table 4.6 The preheating and welding parameters for similar metal welding, test
TV6.
weld Preheat unit note
Power 8.14 0.5 kW
Welding speed 0.012 0.004 m/s
0.72 0.24 m/min Last pass 0.10
Focal offset 91 91 mm
Measured Spot Size 5.1 5.1 mm
Power density 6719 2448 W/cm2
Head angle 2 2 °
Wire speed 7 0 m/min
0.117 0 m/s
The preheat and interpass temperatures were monitored before each pass. The
temperatures were measured at the top of the samples at the middle of the weld,
20 mm from the weld centreline. Also, the thickness of the bead accumulated was
measured using a calliper. Results are displayed in Table 4.7.

216
Table 4.7 Temperature and thickness development of TV6 similar metal 316L weld
Pass no: Sample temp.
(°C)
Thickness
(mm)
pre-weld 20.2
preheat 1 21.5 0
preheat 2 22.6 0
preheat 3 23.9 0
preheat 4 25.0 0
1 25.0 3.3
2 34.4 6.6
3 44.4 9.9
4 45.9 13.0
5 46.0 14.0
6 48.1 17.0
7 47.6 20.4
8 27.2 23.6
9 36.6 26.0
10 39.3 28.6
11 42.9 31.2
12 43.1 33.4
13 39.2 35.4
14 38.8 37.3
15 40.2 39.5
16 41.2 n.a.
4.4 Discussion
4.4.1 Welding Restraint, Welding Distortions and Groove Design
Detailed results of welding distortions in NGLW were found scarce in the literature.
Yu et a.l. 2013 [18] discuss the benefits of NGLW as a low heat input process over
arc welding. Elmesalamy et a.l. 2014 [11] conclude that butterfly distortion of a
20 mm NGLW is approximately 1/3 of similar GTAW. They also discuss the crucial
role of restraint conditions on the distortion.
During the welding of TV1, it became evident that a 4 mm wide groove would not
be large enough to allow sufficiently rigid nozzles to be used. To reach the sufficient

217
positional accuracy reported by other researchers [44, 156], a nominally 5 mm wide
groove was used from that on.
The calculated groove angle distortion changed considerably when the restraint
changed from the relatively thin section TV1 restrained with lightweight machining
clamps to the almost 3 times as thick TV2 and TV3 restrained by the buttress
clamping system. This was a clear indication of the effect of restraint conditions on
the welding groove design, as investigated by Elmesalamy et a.l. 2014 [11]. The
conclusion of this was that the groove design would have to be tailored to suit the
restraint conditions on a case by case basis, which in the case of this study required
the decision on the final restraint system to be made before a more detailed design
was possible.
A 5 mm parallel sidewall groove design was used for the first full-thickness 40 mm
stainless steel welding test TV4. As predicted, the welding groove was found to
contract during the welding. It was found wide enough, although the groove width
decreased severely as the weld filled up; the tip of the wire was able to fit in as the
actual nozzle moved above the groove.
The originally 5 mm wide groove top decreased to 3.5 mm for the last passes. The
strongback restraint used was found able to constrain the overall butterfly distortion
to 2° over the width of the sample, but not capable of preventing the local yielding of
the material in proximity of the groove. Therefore the total contraction of the groove
was calculated to require a 4° V-groove to maintain each individual pass 5 mm wide.
The 3D scanning of the weld TV6, pass by pass, was found to yield interesting
insights into the development of welding distortion. However, it was found to be
somewhat unreliable and prohibitively time-consuming. Each scan took several

218
minutes during which time other measurements had to be suspended. This allowed
additional time for the weld to cool, which caused a decrease in the interpass
temperature compared to welds without 3D scanning. For stainless steel welds, this
was known not to cause issues. For dissimilar welding, the extra delay between
passes would have caused an unacceptable drop in the interpass temperature and the
3D scanning was not implemented during these welds.
It was also noted that although a remelt pass was found able to heal irregularities and
slight lack of sidewall fusion it contracted the groove as much as a regular filling
pass.
Results of the weld TV6 confirmed that the 42 kN welding clamps offer similar
restraint as the cumbersome strongback setup and that the 4° V-groove was suitable
for this application also. The slight drop below 5 mm suggested by Fig. 4.7 at the last
2 passes was not an issue since all nozzles were already clear of the groove. Instead,
it was found beneficial for fusion at the top of the weld, allowing the standard 5 mm
wide spot to generate a weld pool wide enough to cover the edges of the base
materials reliably.
4.4.2 Gas Shielding
In literature issues with the oxidation in NGLW were not often reported [17, 18, 20].
This was concluded to be mainly due to the much lower number of passes generally
used by the researchers due to the smaller material thicknesses or two-sided welding.
In Stage I welding, the gas shielding using the stationary nozzles was considered
satisfactory for welding the one-sided 40 mm thick 316L stainless steel similar metal
weld. The welds needed 15 to 19 passes to fill the gap, including re-melts. Some

219
oxidation was observed to accumulate on top of the weld bead, but as the sidewall
and interpass fusion were mostly acceptable it was not considered an issue. The
oxide layer was able to fully float to the surface of the weld pool during the process
leaving no inclusions.
4.4.3 Wire Feeding
The TecArc F4 wire feeder unit, described in 3.7.2, was found not to give
satisfactorily repeatable feed rate, leading to unwanted irregularities and some flaws
in the welds. Wire conduit bending was found to affect the alignment of the actual
wire tip coming out of the nozzle. The interaction point of the wire and melt pool
would move by up to 3 mm during the length of the weld.
An optimal wire feed angle was found to be approximately 30° and an optimal free
wire length 16 - 20 mm. A shorter free wire would cause overheating of the nozzle
and longer would jeopardise positional accuracy. The ultimate limiting factor for
wire feed rate was found to be buckling when unmelted wire penetrated to the
bottom of the weld pool, as happened during the TV4. Because the wire speed was
considerably higher than the welding speed, the wire would buckle and slip under
compression, ejecting molten metal out of the melt pool causing spatter. The spatter
droplets were big enough to prevent the welding nozzle from entering the groove for
the subsequent pass.
The filler wire nozzle used was made from a copper tube. This was found to get
easily damaged by two main mechanisms. The more common issue was the relative
softness of the copper. The nozzle tip was easily bent by mishandling or even the
forces encountered during the welding process. Another very severe flaw was the
220
low heat capacity of the nozzle, which led to instantaneous melting of the nozzle
when exposed to the random reflections of the laser from the melt pool.
In the similar metal tests, it was agreed with the literature [44, 156] that the wire
alignment in the NGLW groove had to be precisely controlled. Horizontal wire
alignment was found to have little effect on the weld pool. It was concluded that the
turbulence in the weld pool was able to counteract the effect of the asymmetry. The
vertical alignment was found to be more critical. In cases where the wire overshot
the weld pool, the wire was heated by direct laser power. This would lead to
overheating of the wire and cause evaporation and oxidation. If the alignment was
too low, the wire would run erratically due to scraping on the previous bead. When
the vertical wire alignment was correct, the heat was able to conduct from the melt
pool to the wire.
The 3D scanning of TV6 showed the welding groove contracting faster at the middle
due to the welding distortions, thus generating a convex profile for the weld. As the
robot trajectory was linear, the convex weld would cause the actual vertical
alignment to change during the pass. This would have a slight influence on the spot
size, which was found insignificant as very long focal length optics were used. The
effect on the wire feeder vertical alignment was found more severe. If the wire
height was too low, the wire would hit the welding groove bottom prematurely and
risk getting stuck to the possible irregularities in the previous bead and buckling. If
the wire overshot the weld pool, the deposition would be compromised as described
earlier. The wire height would have to be set between these limits. In the worst cases,
the bead height would change approximately 2 mm. A compromise in wire
alignment was found in most cases and the effects of this issue were limited to the
top layers of the weld.

221
4.4.4 Laser Illumination Imaging
Laser illumination imaging was used for analysing the welds. An example of the
versatility of the information the system was able to provide is illustrated in Fig. 4.8
and Fig. 4.9. The observations are listed in the captions.
Fig. 4.8 Laser Illumination Image of pass 1 in a similar metal NGLW. 1) Uneven
wetting of side walls due to too small spot size, oxidation of weld bead,
2) Wire nozzle melting due to reflected laser beam, 3) Wire contamination
by particles of nozzle and vibration (in video material), 4) Smoke
generation due to excess laser power
Fig. 4.9 12th
pass of a similar metal NGLW. 1) Good smooth fusion, 2) Gap
contracting excessively, laser beam heats the corners of the groove
prematurely, 3) Wire alignment off-centre and 4) Accumulated oxides
floating on top of the melt pool
1 3
2
4
4
1
2
2
3 4

222
Comparison of Fig. 4.8 and Fig. 4.9 shows the improvement achieved during a single
welding test. The laser power was optimised to prevent evaporation of the molten
pool. The wire nozzle was moved further away from the weld pool to prevent
damage. The accumulation of an oxide layer can also be seen.
4.4.5 Pre-Heating and Interpass Temperature Control
Pre-heating by using the laser beam was examined during weld TV6. Running four
passes at a power density just below melting the bottom of the groove was able to
raise the temperature of the samples only about 3.5°C. This was far less than desired
for the future dissimilar welds. Also, it was noted that the oxidation of small surface
irregularities during the pre-heating had a possibly negative effect on quality. Pre-
heating by using the laser was found ineffective and slow and a more efficient
method of applying heating blankets was chosen for the consequent welds.
Control of the interpass temperature was examined. To keep the interpass
temperature at a certain range, the welding passes were repeated with regular
intervals. In practice, this meant that only limited time was available for taking the
photographs and making the measurements. Often the following pass would have to
be welded as soon as possible after the procedures.
The preliminary stainless steel welds were designed for maximum speed and
deposition rate. To reach the maximum heat input whilst still staying in the
conduction mode the limit power density could not be exceeded. Bearing in mind the
main variables affecting the mode in laser welding are spot size and laser power, the
narrow gap geometry limited the maximum spot size leaving the laser power to be
the only effective parameter to vary.

223
4.5 Conclusions
The Stage I stainless steel NGLW was conducted mainly for developing the welding
procedure, groove design and equipment. The weld geometries and practices
developed were later used as a starting point for dissimilar welding. A significant
product was the development of the welding procedure, documentation and
familiarisation to the practice of welding a multi-pass weld which would take hours
to complete.
The welding process was found robust and not sensitive to welding parameters, for
example, laser power varying from 3 kW to 11 kW were experimented with no
significant change in weld quality as observed from metallographic and visual
inspection, including the undercut, solidification cracking, lack of fusion defects,
oxidation, and porosity.
Sufficient precision in weld and laser alignment and spot size control were
fundamental to achieving good fusion. The requirements were found less stringent
than in laser keyhole welding. For wire alignment, the transverse tolerance Wy was
found very forgiving, as little effect was observed. The wire height Wz and
longitudinal alignment Wx were found more critical as over- or undershooting of the
weld pool caused imperfections. A tolerance of ±2 mm was found to produce
satisfactory results.
Accuracy in the region of ±0.5 mm was required for the equipment positioning and
welding groove preparation. Laser spot size matching the welding groove width was
found to give the best results, too small leading to lack of fusion, too wide to damage
to sidewalls. See Fig. 4.8 and Fig. 4.9. The laser spot size tolerance was ±0.2 mm. A
continuously adjustable spot size using online visual monitoring would’ve alleviated

224
the tolerance related issues. High level of reliability of the equipment and
repeatability of the welding process had to be attained even for experimental work,
as a single momentary imperfection was able to invalidate a substantial amount of
work.
Control of the restraint was found to be crucial as it had direct influence on the
butterfly distortion generated and therefore the welding groove design. Local
yielding of the welding groove contracted the groove in addition to a larger scale
butterfly distortion. Local yielding was responsible for 50 % of the total contraction
and the butterfly for the other 50 %.
The analysis of the welding distortion using parallel side wall groove indicated a
need for a 4° V-angle. A single bevel design was considered accurate enough for
accommodating the distortions and maintaining a constant gap at the bottom of the
groove for each pass and maintaining access to the groove.
Flawless gas shielding was obtained for single passes. However, oxidation was
found accumulating during the course of multi-pass welding.
In comparison to conventional arc welding, the NGLW was found require more
precise geometries in the weld preparation and equipment. The access limitations to
the welding cell placed higher than usual importance to the electronic process
monitoring equipment. LII equipment was found highly beneficial as it was also
capable of recording the welds. It was concluded that a more flexible welding robot,
as usually used for narrow gap welding applications, capable of online parameter
adjustments during welding, would have made work with the developmental setup
and parameters more efficient and faster.
225
5 Thick Section Narrow Gap Laser Welding of
Dissimilar Metals S275 and AISI 316L
5.1 Introduction
As the second step in this study, 40 mm thick section dissimilar metal NGLW was
investigated. This stage was performed using 316L stainless and S275 mild steels as
base materials and Inconel Alloy FM52 as the filler. This stage was named Stage II.
The Stage II dissimilar NGLW using 316L and S275 was aimed to verify the
suitability of the welding process and equipment developed during Stage I for the
dissimilar materials. The development of the analysis methods for the welds was
given more emphasis. Hardness mapping, microhardness testing, dilution and
microstructural analysis were developed.
The purpose of this stage was to develop the welding process and analysis methods
using cheaper LAS compared to the more expensive nuclear grade SA508 LAS. This
stage was found necessary due to the very different characteristics of the FM52
nickel filler metal and the environment in the dissimilar metal weld pool compared
with the Stage I stainless steel welding. The viscose weld pool of FM52 [129], the
tendency to DDC [64, 84, 127], liquation [98] and solidification cracking [82, 128]
and the tendency to oxidation [89, 128] were to be studied. The lack of bonding and
lack of fusion reported by McCracken 2010 [128] were to be investigated.
The welds were monitored in a similar way to the previous stage, using mechanical
and optical means, but omitting the 3D scanning. This was mainly due to the time
needed for the scan allowing the interpass temperatures to drop excessively. The

226
quality of the welds was assessed by visual inspection, online monitoring by an LII
system and mechanical measurements of the distortions. The preheat and interpass
temperatures were logged.
To assess the integrity of the welds, they were subjected to the industry-standard
ASME IX radiographical inspection [176]. Cross-sections of the welds were
hardness mapped and microhardness analysed applying BS EN ISO 6507-1:2005
[180] and ASTM E384-17 [181] standards. These results were used together with
microscopy to perform microstructural analysis. Etching of the samples was
conducted according to Chapter 3.10.2. To assess the possible issues with the
compositional changes, the dilution of the weld metal was analysed using EDX.
Stage II samples were named DS1-5, see Table 5.1.

227
Table 5.1 The Stage II of dissimilar thick section narrow gap laser welds using
S275, Alloy 52 and 316L
DS1 DS2 DS3 DS4 DS5
Aim Parameter
development:
preheat
Parameter
development:
preheat
Lack of
fusion
study
Weld pool
management
Undercut
management
Thickness 40 mm 40 mm 40 mm 40 mm 40 mm
Groove 4° 4° 4° 5° 5°
Restraint Lenskes
clamps and
table
Lenskes
clamps and
table
Lenskes
clamps
and table
Lenskes
clamps and
table
Lenskes
clamps and
table
No of
clamps
3 pairs 3 pairs 3 pairs 3 pairs 3 pairs
Gas shield 1 Stationary
nozzle
1 Stationary
nozzle
1
Stationary
nozzle
3 blade
nozzle
3 blade
nozzle
Video Laser
Illumination
Imaging
Laser
Illumination
Imaging
Laser
Illuminati
on
Imaging
Coaxial
camera
Coaxial
camera
Notes Final version
wire feeder
Final version
wire feeder
5.1.1 Expectations
The Stage II dissimilar metal welding using a non-pedigree ferritic steel was
performed to test and compare the effect of the FM52 filler metal with the similar
metal welds performed at Stage I and the findings in the literature. The main result
expected was the ASME IX integrity of the NGLW, considering the various known
challenges found in literature and during the similar metal welding.
The questions to be researched in this stage include:
What is the optimal welding groove angle for these materials?
228
Is NGLW capable of accomplishing ASME IX radiographical requirements?
Will the susceptibility to oxidation of FM52 cause issues? Are there ways to
reduce the possible problems?
How does the material mix affect fusion; how the different materials will
affect weld bead shape and wetting?
How does the weld pool turbulence distribute the elements, is the dilution
homogenous across the weld or between the passes?
Is there DDC, solidification or liquation cracking in FM52?
Could pre-heating be omitted for this type of material?
What is the hardness distribution, are there possibly brittle areas of high
hardness?
How does the multi-pass tempering change the microstructure and hardness
of the materials?
5.2 Materials and Experimental Methods
The first dissimilar metal welds using S275 as the ferritic steel were conducted in
two stages. The main differences were in the welding head setup. First three tests
were made using stationary gas shielding nozzles. For the last two welds, the setup
was developed by adding an improved wire feeding nozzle and a new moving
shielding gas nozzle capable of injecting the shielding gas deep into the welding
groove. Another significant difference between the two stages was the change of
groove angle from 4° to 5°.
229
5.2.1 Materials
Materials used for the Stage II welds were AISI 316L and S275 base materials and
Inconel Alloy 52 filler wire. The weld thickness was 40 mm and the filler wire
diameter 0.9 mm. The materials are described in detail in chapter 3.2.2.
5.2.2 Weld Setup and Parameters
Welding parameters for S275 dissimilar metal welding were based on earlier tests
made with similar metal stainless steel welds and an unpublished technical report
considering dissimilar NG-GTAW. This vast report demonstrated that a thick section
unbuttered weld using materials similar to the ones used in this study can be
completed to the industry-standard specifications. Modifications were made to
achieve similar heat cycle and cooling conditions while using a laser as the heat
source to produce crack-free welds.
The 40 mm thick weld samples were 200 mm long, providing an effective weld
length of 160 mm. The weld preparation was a 4° V-groove with straight sidewalls
and a 5 mm wide root, refer to Fig. 3.1. The samples of 316L and S275 were
100 x 200 x 40 mm in size, providing a weld length of approximately 170 mm. The
sample size was mainly limited by the capacity of the restraint. The weld preparation
design was based on the results of the earlier similar metal welds. It was wire-EDM
machined to have straight sidewalls at a shallow V-angle. 4° and 5° V-angles were
used. The width of the groove was set at 5.0 mm at the root, increasing linearly to the
top to compensate for the welding distortions during the process, see Fig. 5.1. The
aim was to keep the actual width of the welding groove bottom constant for each
pass and allow free access for the wire-feeding nozzle. The welding process was
started from a backing plate with a normal filling parameter set without a separate
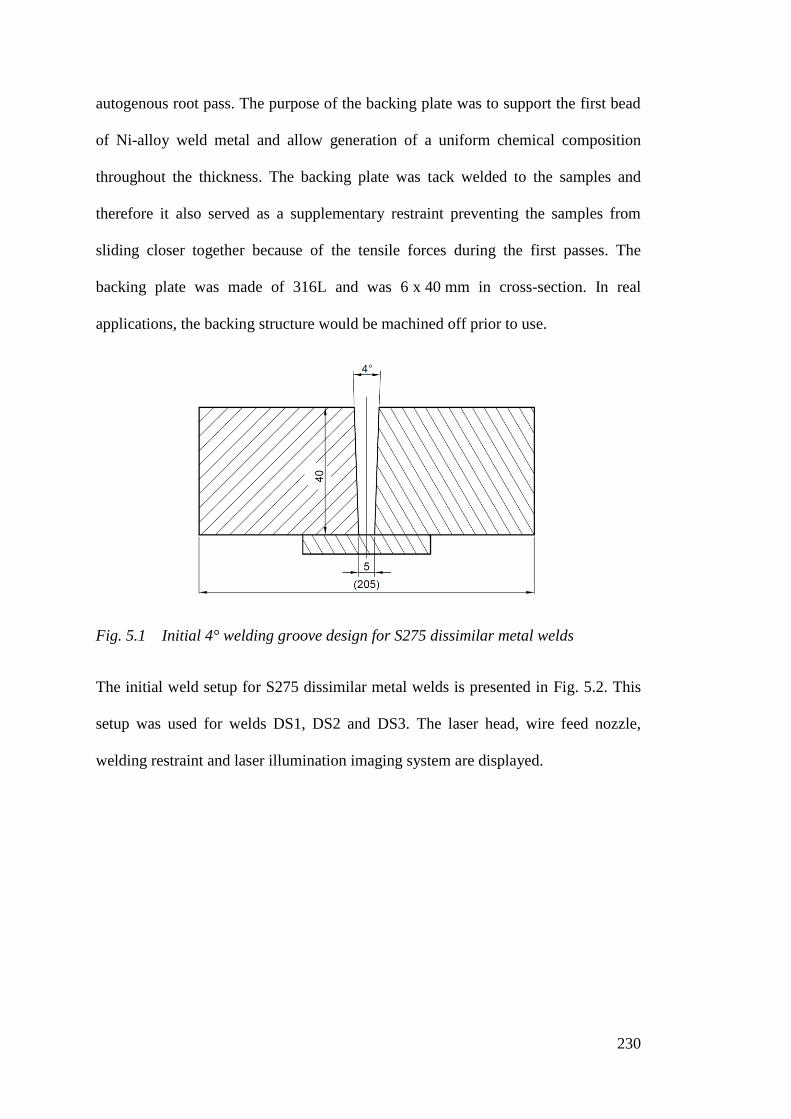
230
autogenous root pass. The purpose of the backing plate was to support the first bead
of Ni-alloy weld metal and allow generation of a uniform chemical composition
throughout the thickness. The backing plate was tack welded to the samples and
therefore it also served as a supplementary restraint preventing the samples from
sliding closer together because of the tensile forces during the first passes. The
backing plate was made of 316L and was 6 x 40 mm in cross-section. In real
applications, the backing structure would be machined off prior to use.
Fig. 5.1 Initial 4° welding groove design for S275 dissimilar metal welds
The initial weld setup for S275 dissimilar metal welds is presented in Fig. 5.2. This
setup was used for welds DS1, DS2 and DS3. The laser head, wire feed nozzle,
welding restraint and laser illumination imaging system are displayed.

231
Fig. 5.2 Experimental setup for a DMW aligned for the first pass. 1) Laser head, 2)
coaxial wire feeding and shielding gas nozzle, 3) stationary shielding gas
nozzle, 4) welding clamps and 5) high-speed camera lens. Laser
illumination laser is just outside the picture on right.
5.3 Experimental Work
The work on Stage II built on Stage I results and literature. Relevant work on NGLW
was reported by Jokinen 2004 [17], Elmesalamy 2013 [35], Feng et a.l. 2016 [45],
Zhang et a.l. 2011 [20] and Yu et a.l. 2013 [18] but no published reports on
dissimilar metal NGLW were found.
5.3.1 Experiments 1-3
The first dissimilar NGLW DS1 was welded using a 4° V-groove and 169°C pre-
heat. The welding was started with one pass with high power to ensure melting of
the sidewalls via the separate backing plate. For the rest of the weld, the parameters
were kept constant throughout the process, see Table 5.2.
1
2
3 4
5

232
Table 5.2 Welding parameters DS1.
ID. Groove
width
[mm]
Thick.
[mm]
Passes
welded
Power [kW] Focal
offset
[mm]
Speed
[m/min]
Wire
speed
[m/min]
DS1 5 40 18 8.14 to 2.6 91 0.72 7 or 0
DS1 was hardness analysed by hardness mapping. Altogether 5 maps were produced
along with line scans. The weld was also etched for ferritic steel HAZ to analyse the
microstructure of the HAZ and the areas of high hardness.
Fig. 5.3 DS1 dual etched with Nital and oxalic acid. The hardness mapping
indentations also visible
For DS2 the welding parameters were revised. The unnecessarily high power for the
first pass was omitted and to improve fusion the power was increased for the filling
passes. No pre-heat was applied. The parameters were kept constant throughout the
weld as per Table 5.3. DS2 was used for low force Vickers hardness test
development.
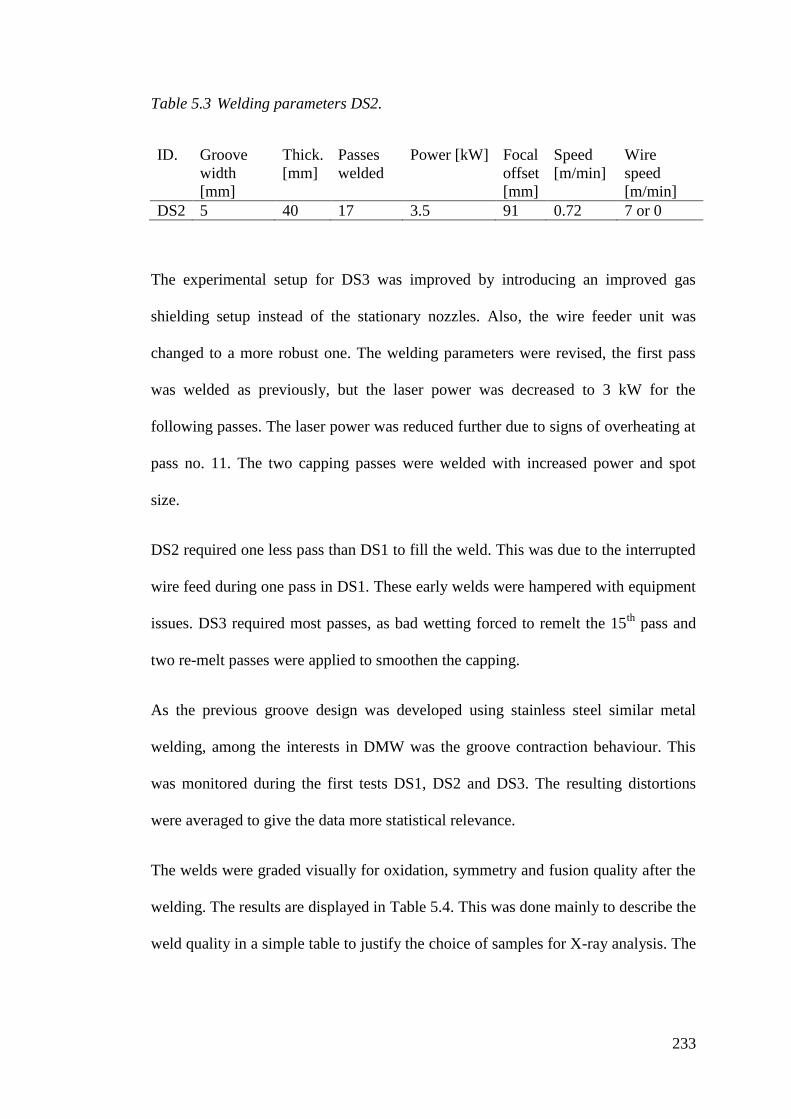
233
Table 5.3 Welding parameters DS2.
ID. Groove
width
[mm]
Thick.
[mm]
Passes
welded
Power [kW] Focal
offset
[mm]
Speed
[m/min]
Wire
speed
[m/min]
DS2 5 40 17 3.5 91 0.72 7 or 0
The experimental setup for DS3 was improved by introducing an improved gas
shielding setup instead of the stationary nozzles. Also, the wire feeder unit was
changed to a more robust one. The welding parameters were revised, the first pass
was welded as previously, but the laser power was decreased to 3 kW for the
following passes. The laser power was reduced further due to signs of overheating at
pass no. 11. The two capping passes were welded with increased power and spot
size.
DS2 required one less pass than DS1 to fill the weld. This was due to the interrupted
wire feed during one pass in DS1. These early welds were hampered with equipment
issues. DS3 required most passes, as bad wetting forced to remelt the 15th
pass and
two re-melt passes were applied to smoothen the capping.
As the previous groove design was developed using stainless steel similar metal
welding, among the interests in DMW was the groove contraction behaviour. This
was monitored during the first tests DS1, DS2 and DS3. The resulting distortions
were averaged to give the data more statistical relevance.
The welds were graded visually for oxidation, symmetry and fusion quality after the
welding. The results are displayed in Table 5.4. This was done mainly to describe the
weld quality in a simple table to justify the choice of samples for X-ray analysis. The

234
weld DS3 was chosen for radiographical analysis and subjected to ASME IX
acceptance.
Table 5.4 Visual examination of welds DS1 to DS3
DS1 DS2 DS3
Oxidation unacceptable unacceptable acceptable
Symmetry acceptable unacceptable acceptable
Fusion unacceptable acceptable very good
5.3.2 Experiments 4 and 5
The severity of the oxidation issues forced the development of a trailing gas nozzle
inserted into the welding groove, see Fig. 5.4. The distortion measurements
suggested a wider welding groove should be applied. Therefore the welding tests
DS4 and DS5 were conducted in a 5° V-groove using the tri-blade shielding gas
nozzle. The laser power was varied, pass by pass, according to the conditions in the
welding groove. Two new phenomena were monitored, pass by pass basis, the
undercutting of the stainless steel due to excess laser power and poor wetting of the
sidewalls due to insufficient power. The analysis was done visually, as the
measurement of the phenomena was found impossible. The undercut was graded
from 0 to 50, 0 being no undercut, 30 meaning unacceptable. The fusion quality was
graded 50 to 0, 50 being flawless and 30 meaning unacceptable.

235
Fig. 5.4 The nozzle with added trailing nozzles as used for DS4.
The parameters used in test DS4 are displayed in Table 5.5.

236
Table 5.5 Welding parameters and notes DS4
Pass Temp
316L
Temp
S275
Depth Power Undercut Fusion
1 64.2 66.6 0.0 3500 0 50
2 65.4 67.3 2.2 3000 0 40
3 79.3 79.1 4.3 3500 10 50
4 86.7 86.5 6.6 3250 10 50
5 88.0 87.6 9.2 3250 10 50
6 68.9 66.3 12.0 3250 0 50
7 86.9 88.1 14.5 3250 2 50
8 86.5 88.1 15.2 3250 2 30
9 91.1 92.0 17.9 3500 15 50
10 90.6 90.0 19.5 3250 10 40
11 81.0 84.3 22.0 3500 15 50
12 85.2 86.1 24.5 3250 10 50
13 82.5 81.8 26.3 3250 10 50
14 82.0 82.3 28.4 3000 10 10
15 86.0 84.6 30.0 3250 * 40
16 70.0 70.5 ** 3250 50
17 66.0 64.0 3400 50
18 68.3 66.7 3500 10
19 76.3 73.5 4000 50
20 78.5 78.9 4000 10
21 70.0 70.0 3500 30
22 47.0 47.0 3000
* Sidewalls damaged, no estimate applicable
** Surface distorted, laser depth measurement not applicable
The weld DS4 suffered from undercutting, which widened the groove and made the
shape irregular near the surface, see Fig. 5.5. Closer inspection of the imagery
reveals lack of fusion at the area of an undercut, illustrated as Fig. 5.6. The issue of
the widened groove was rectified by two parallel capping passes to ensure fusion.
This corrected most of the fusion issues superficially, Fig. 5.7. The weld was X-ray
analysed to analyse the sub-surface integrity of the weld as the ability of penetration
to fix the fusion was unknown.
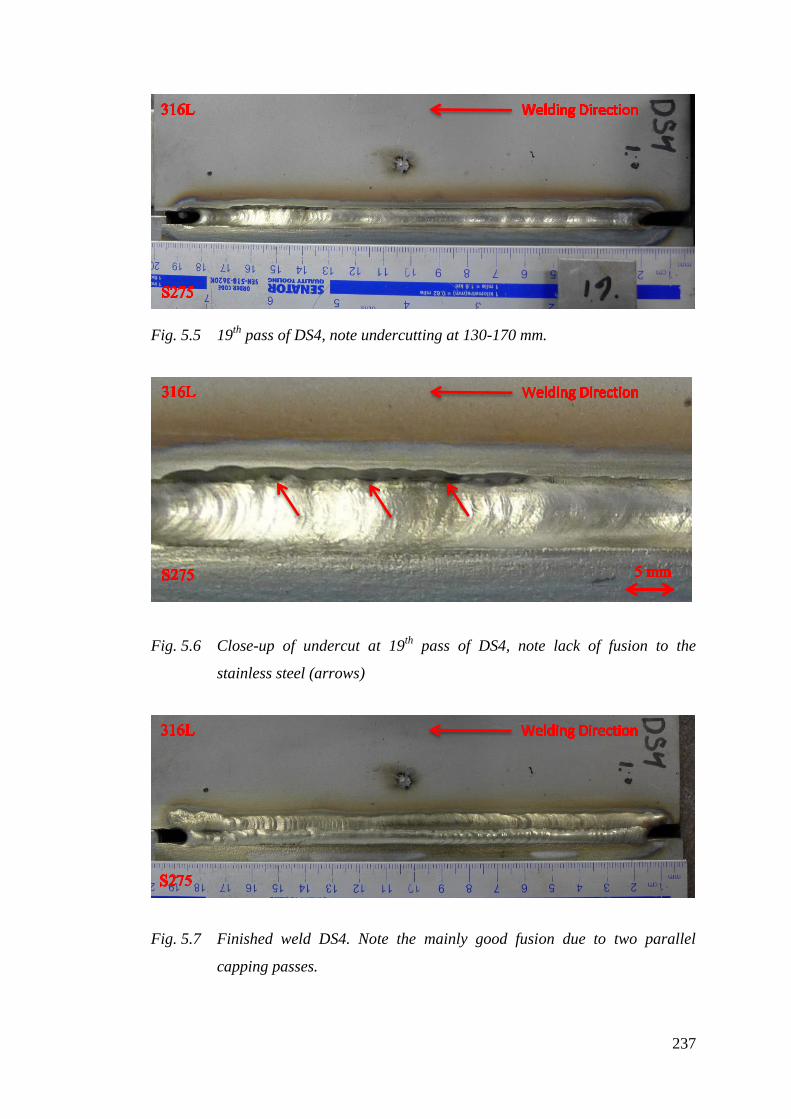
237
Fig. 5.5 19th
pass of DS4, note undercutting at 130-170 mm.
Fig. 5.6 Close-up of undercut at 19th
pass of DS4, note lack of fusion to the
stainless steel (arrows)
Fig. 5.7 Finished weld DS4. Note the mainly good fusion due to two parallel
capping passes.

238
The weld DS5 was free of undercutting and equipment issues. The parameters used
in test DS5 are displayed as Table 5.6. Photograph of the first pass is presented as
Fig. 5.8. Some oxidation occurred, but it was removed using a wire brush to good
effect as the beads were smooth with good wetting to the sidewalls. Fig. 5.9
illustrates the weakest quality fusion encountered during this weld. Although it was
known from previous work that increasing the power would alleviate the poor
fusion, it was decided not to change the power as the previous experience suggested
the generation of undercut if the power was increased. Fig. 5.10 displays the fusion
and oxidation quality of the finished weld.
Table 5.6 Welding parameters and notes DS5
Pass Temp
316L
Temp
S275
Depth Power Undercut Fusion
1 71.7 79.1 0.0 3500 0 50
2 81.0 78.1 2.1 3250 0 40
3 87.0 87.9 4.4 3250 0 50
4 87.0 88.2 6.4 3250 0 50
5 85.0 85.2 8.4 3250 0 50
6 86.0 87.0 10.5 3250 0 50
7 87.6 89.0 12.9 3250 0 50
8 87.1 88.0 14.9 3250 0 20
9 80.3 79.1 16.8 3250 0 40
10 88.1 87.6 18.4 3250 0 40
11 80.5 80.0 20.4 3250 0 50
12 73.3 73.0 23.0 3250 0 50
13 82.8 85.7 25.2 3250 0 30
14 85.3 85.7 26.4 3250 0 25
15 83.0 84.1 28.4 3250 0 20
16 84.1 85.2 30.4 3350 0 20
17 85.4 85.8 32.4 3500 0 30
18 82.0 82.5 33.4 3500 0 35
19 79.9 77.0 35.1 3500 0 35
20 68.0 68.0 36.4 3600 0 45

239
Fig. 5.8 First pass of DS5. Note smooth, symmetrical wetting, oxidation and no
irregularities
Fig. 5.9 Close-up of the 8th
pass of DS5. Note unacceptable irregular oxidation and
wetting.

240
Fig. 5.10 The finished weld DS5 prior to wire brushing.
The finished welds DS4 and DS5 were analysed visually to justify the radiographical
analysis. The results are displayed as Table 5.7. Both welds were subjected to the
radiographical analysis.
Table 5.7 Visual examination of welds DS4 and DS5
DS4 DS5
Oxidation acceptable very good
Symmetry acceptable very good
Fusion acceptable very good
5.4 Analysis of Process Characteristics
5.4.1 Weld Pool Behaviour Analysis
Due to the laser safety regulations regarding class 4 lasers, access to the welding cell
was prohibited during the welding process. This made conventional real-time
observation of the weld pool behaviour impossible. This limitation was overcome by
obtaining a Cavitar Cavilux laser illumination system and a Phantom Miro 4 high-
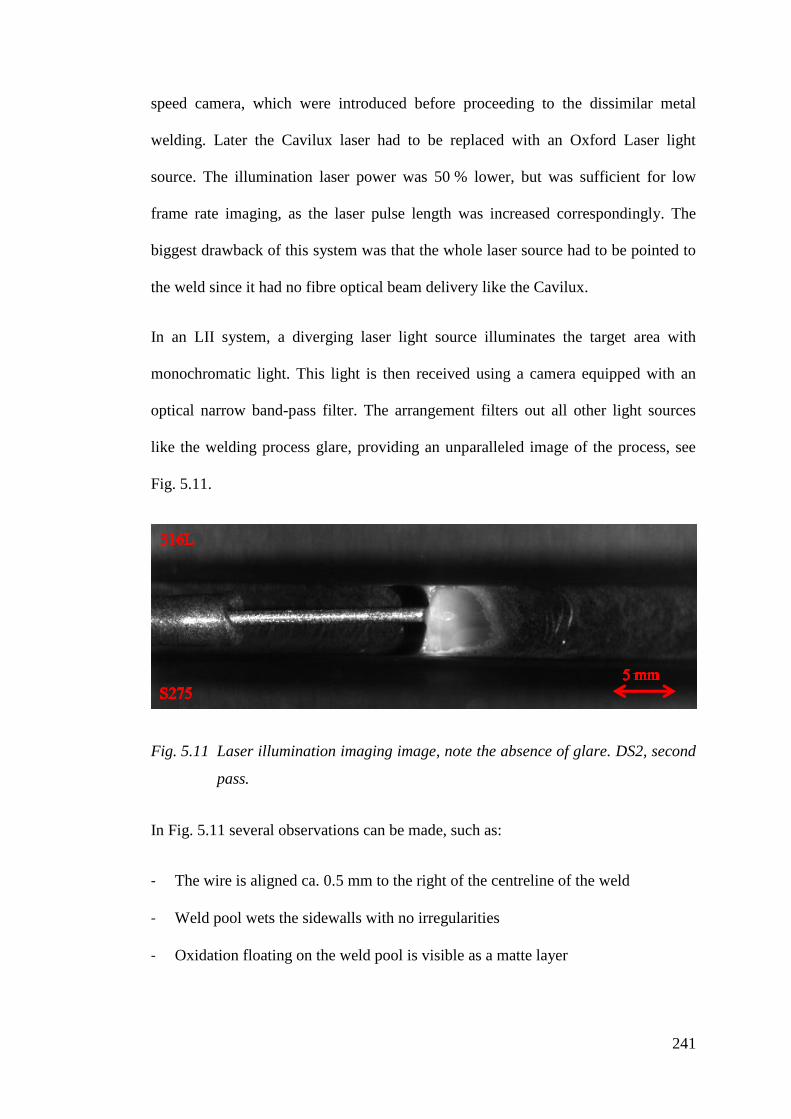
241
speed camera, which were introduced before proceeding to the dissimilar metal
welding. Later the Cavilux laser had to be replaced with an Oxford Laser light
source. The illumination laser power was 50 % lower, but was sufficient for low
frame rate imaging, as the laser pulse length was increased correspondingly. The
biggest drawback of this system was that the whole laser source had to be pointed to
the weld since it had no fibre optical beam delivery like the Cavilux.
In an LII system, a diverging laser light source illuminates the target area with
monochromatic light. This light is then received using a camera equipped with an
optical narrow band-pass filter. The arrangement filters out all other light sources
like the welding process glare, providing an unparalleled image of the process, see
Fig. 5.11.
Fig. 5.11 Laser illumination imaging image, note the absence of glare. DS2, second
pass.
In Fig. 5.11 several observations can be made, such as:
- The wire is aligned ca. 0.5 mm to the right of the centreline of the weld
- Weld pool wets the sidewalls with no irregularities
- Oxidation floating on the weld pool is visible as a matte layer

242
Laser illumination imaging material was recorded in video format, which allowed
much easier observations than still photography. Phenomena like vibrations and
irregular behaviour of the filler wire, wetting of the sidewalls and behaviour of the
oxide slag were easily observed. Some of the passes were recorded at high frame
rates in an attempt to see the melt pool turbulence more clearly.
One of the main outcomes of the laser illumination monitoring was the effect of the
oxides to fusion. Especially in video format lack of fusion was possible to detect
with good accuracy. An example of a local inadequate wetting leading to lack of
fusion is shown as Fig. 5.12.
Fig. 5.12 Formation of lack of fusion / inadequate wetting (arrow) and oxidation of
the weld bead viewed by laser illumination imaging
When the need for a more efficient shielding gas system became evident, the laser
illumination system had to be dropped. This was mainly due to the illumination light
being blocked by the trailing shielding gas nozzles. From this point on imaging was
achieved by ambient light coaxial camera optics built in the Precitech laser welding
head, using the Miro IV camera, see Fig. 5.13.
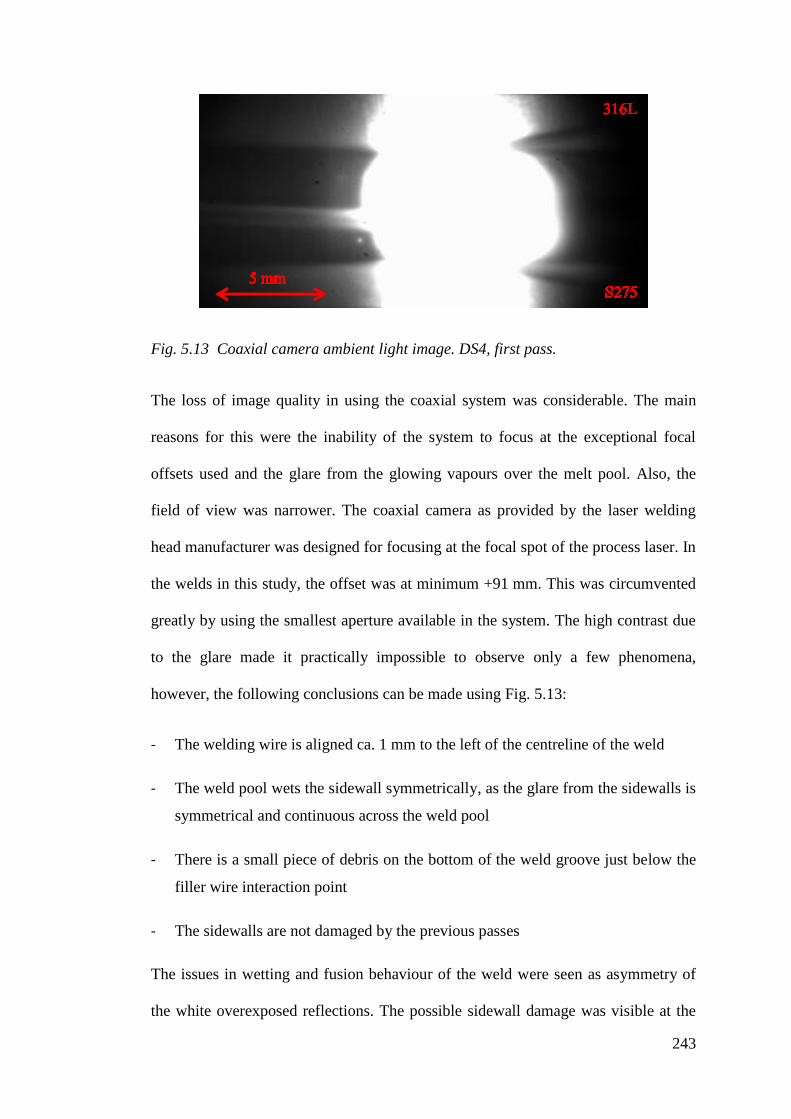
243
Fig. 5.13 Coaxial camera ambient light image. DS4, first pass.
The loss of image quality in using the coaxial system was considerable. The main
reasons for this were the inability of the system to focus at the exceptional focal
offsets used and the glare from the glowing vapours over the melt pool. Also, the
field of view was narrower. The coaxial camera as provided by the laser welding
head manufacturer was designed for focusing at the focal spot of the process laser. In
the welds in this study, the offset was at minimum +91 mm. This was circumvented
greatly by using the smallest aperture available in the system. The high contrast due
to the glare made it practically impossible to observe only a few phenomena,
however, the following conclusions can be made using Fig. 5.13:
- The welding wire is aligned ca. 1 mm to the left of the centreline of the weld
- The weld pool wets the sidewall symmetrically, as the glare from the sidewalls is
symmetrical and continuous across the weld pool
- There is a small piece of debris on the bottom of the weld groove just below the
filler wire interaction point
- The sidewalls are not damaged by the previous passes
The issues in wetting and fusion behaviour of the weld were seen as asymmetry of
the white overexposed reflections. The possible sidewall damage was visible at the
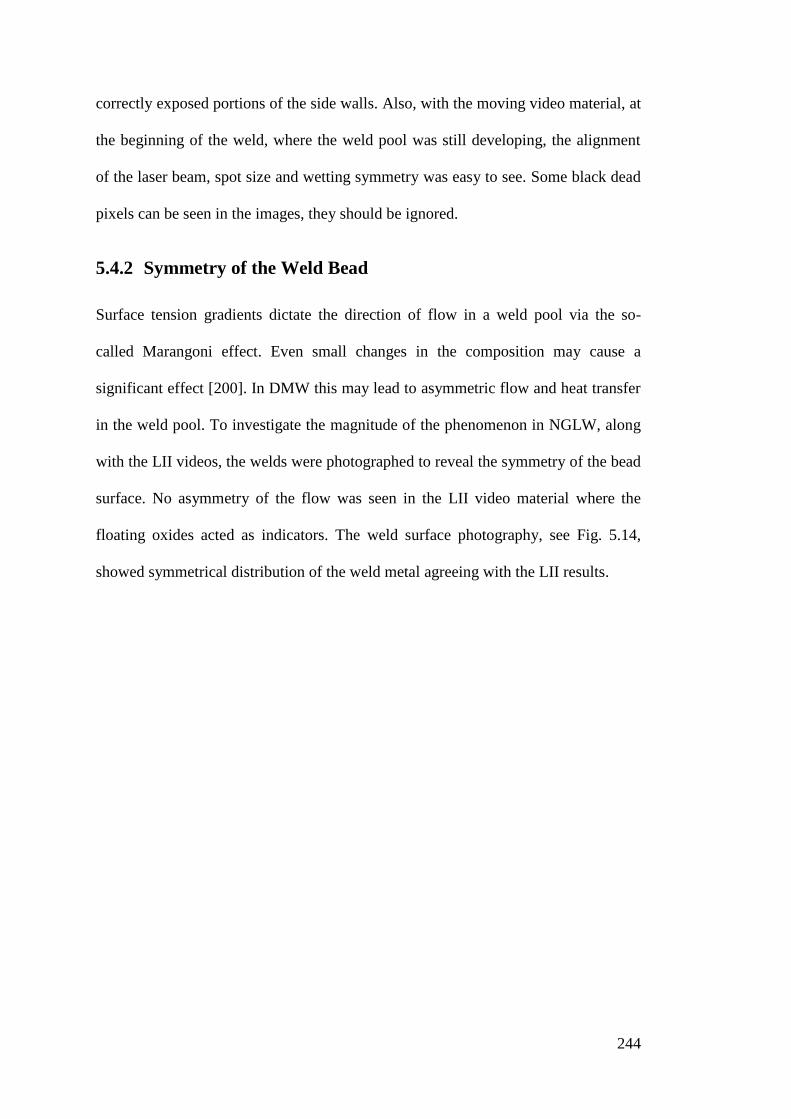
244
correctly exposed portions of the side walls. Also, with the moving video material, at
the beginning of the weld, where the weld pool was still developing, the alignment
of the laser beam, spot size and wetting symmetry was easy to see. Some black dead
pixels can be seen in the images, they should be ignored.
5.4.2 Symmetry of the Weld Bead
Surface tension gradients dictate the direction of flow in a weld pool via the so-
called Marangoni effect. Even small changes in the composition may cause a
significant effect [200]. In DMW this may lead to asymmetric flow and heat transfer
in the weld pool. To investigate the magnitude of the phenomenon in NGLW, along
with the LII videos, the welds were photographed to reveal the symmetry of the bead
surface. No asymmetry of the flow was seen in the LII video material where the
floating oxides acted as indicators. The weld surface photography, see Fig. 5.14,
showed symmetrical distribution of the weld metal agreeing with the LII results.

245
Fig. 5.14 DS4 second pass pictured from the end of the welding groove. Note the
level surface of the bead with no inclination to either metal and the sharp
corners instead of smooth wetting.
5.4.3 Welding Distortion Analysis
The direct and indirect measurements were found to be concordant and consistent as
shown in Fig. 5.15.

246
0 1 2 3 4 5 6 7 8 9 10 11 12 13 14 15 16 17 18 19 204
5
6
7
8
Ga
p W
idth
(m
m)
Pass no:
direct measurements
indirect measurements
Fig. 5.15 Welding groove contraction measured directly and calculated from
indirect measurements. Test DS2. Error bars represent min and max
values measured.
The distortion data showed that the groove contraction behaviour matched the
predictions. In S275 dissimilar metal welding, three distinct stages of contraction
were recognised. The first stage was rapid shrinkage when there was little or no
material connecting the halves other than the fully melted weld pool, which would
cause shrinkage partly as horizontal translation. This can be seen at passes 1 to 3 in
Fig. 5.15. At the second stage, there was a fulcrum of solid metal just under the
shrinking and contracting melt pool. At this stage, the contraction slowed down
significantly, as shown in Fig. 5.15 passes 4 - 13. As the solid connection between
the halves thickened, the contraction slowed down even further. Towards the end of
the weld, the groove contraction occurred only very slowly, only due to local
yielding of the materials. This can also be observed as sinking of the top surfaces of
the samples adjacent to the weld.

247
During the comparison of the different weld distortion measurements, it was found
that the results from the indirect measurement were similar whether the indent
distance from the centreline was 20 mm or 70 mm. The difference between these
measurements in DS2 was on average 0.06 mm, which was similar to the accuracy
achieved during the manual measuring process. This finding led to time savings
during the welding as the indirect measurements were later conducted using only the
20 mm offset method.
Averaging the data from all DS welding tests using 4° V-groove proved that the gap
contracts below the desired 5 mm after 12 passes, see Fig. 5.16. This was while the
groove remained approximately 15 mm deep. Therefore there were difficulties with
fitting the nozzle setup in the groove and the laser spot had to be adjusted smaller to
avoid damaging the groove top corners. As a consequence, the groove angle was
increased to 5° to accommodate the distortion.
0 1 2 3 4 5 6 7 8 9 10 11 12 13 14 15 16 17 18 19 204
5
6
7
8
Ga
p W
idth
(m
m)
Pass no:
direct measurements
indirect measurements
Fig. 5.16 Welding groove top width of DS series of welds using 4° V-groove. Note
the groove contracting to below 5 mm. Average of three tests, DS1-DS3.
Error bars represent min and max values measured.

248
The contraction behaviour of the 5° V-groove is displayed in Fig. 5.17. It can be
seen, that the contraction effectively stops at 14 passes. The resulting width was
5.4 mm. While this is larger than the desired 5.0 mm it was found not to cause
issues. Increasing the spot size was not required, as the wetting and fusion were
found satisfactory. This was attributed to the heat conduction conditions changing
towards the top of the weld. Deep in the groove, the heat had almost 360° of solid
steel to dissipate the heat. Near the surface this was closing in to 180° of steel and
180° air. Therefore it was concluded that there was a beneficial increase in the weld
pool temperature as the weld approached the surface.
0 1 2 3 4 5 6 7 8 9 10 11 12 13 14 15 16 17 18 19 204
5
6
7
8
Ga
p W
idth
(m
m)
Pass no:
direct measurements
indirect measurements
Fig. 5.17 Welding groove top width of DS series of welds using 5° V-groove. Note
the groove width staying above 5 mm until the end. Average of tests DS4
and DS5. Error bars represent min and max values measured.
The distortion data was used to design a groove shape which would allow the use of
constant spot size. The benefits were obvious, as the laser head with the shielding
gas and filler wire feeding apparatuses could be moved up as a single unit after each
pass without needing to offset the laser and the auxiliaries separately which is

249
required should the spot size be changed. At the specific material thickness,
materials, restraint and welding parameters used, it was found that a V-angle of 5°
with straight sidewalls was sufficient to counter the effect of the distortions. Some
small adjustment of the spot size was implemented during the welding, as the
welding parameters used and the distortion behaviour were not entirely constant.
5.5 Analysis of Weldments
A set of analysis was conducted on selected samples. First, the welds were
characterised using an industry-standard NDT approach. Then further analysis was
conducted to examine the properties of the welds such as hardness, grain structure
and residual stresses.
5.5.1 Radiographical Analysis of Welding Flaws and ASME IX
Acceptance
Of the DS series of dissimilar welds DS3, DS4 and DS5 were selected to be analysed
by radiography. Results were subjected to acceptance by ASME IX. None of the
samples was acceptable over the whole length, see Table 5.8. Nonetheless,
acceptable quality was achieved for certain parts of the welds. DS3 had issues only
at the very end of the weld which could be discarded as a run-off area and the first
50 % of the DS4 was found flawless. The full radiographical reports are presented as
Appendix II.

250
Table 5.8 Summary of radiographical acceptance reports of DS series of welds
ID ASME IX Location 1-2 Location 2-3
DS3 Unacceptable “Lack of sidewall fusion in approximately the last 40 mm of
the weld”
DS4 Unacceptable Intermittent lack of sidewall
fusion
No visible defects
DS5 Unacceptable Intermittent lack of sidewall
fusion
Intermittent lack of sidewall
fusion
The flaws leading to rejection were entirely fusion related. The X-ray reports note
intermittent lack of fusion as the defect. LoF related issues in multi-pass HWLW had
also been reported by Todo et. al. in 2015 [54]. It was concluded that some of the
fusion issues were equipment or operator related. The alignment of the laser and
filler wire was found to be critical for good wetting and fusion. Excess oxidation was
found to lead to very poor wetting of the side walls which led to lack of fusion to the
sidewalls and the occasional case of lack of fusion/oxide inclusion between the
passes in the weld. The equipment was later improved by developing a precision
adjustable wire feed nozzle and the tri-blade gas shielding system.
5.5.2 Hardness Mapping
The mechanical analysis of the DS series of welds was started by performing
hardness mapping. Performing the hardness analysis first was to give valuable data
for further investigations. Several hardness maps were made. Different Vickers
hardness scales were used and different grid spacing experimented for displaying the
hardness profile. First hardness maps were plotted using HV 1.0 scale, see Fig. 5.18.
The resulting indentations at the softest areas detected were 123 µm in diagonal
corresponding to 124 HV1. This limited the grid spacing and edge distance to a level
which was not determined to be accurate enough. To minimise the issue, the
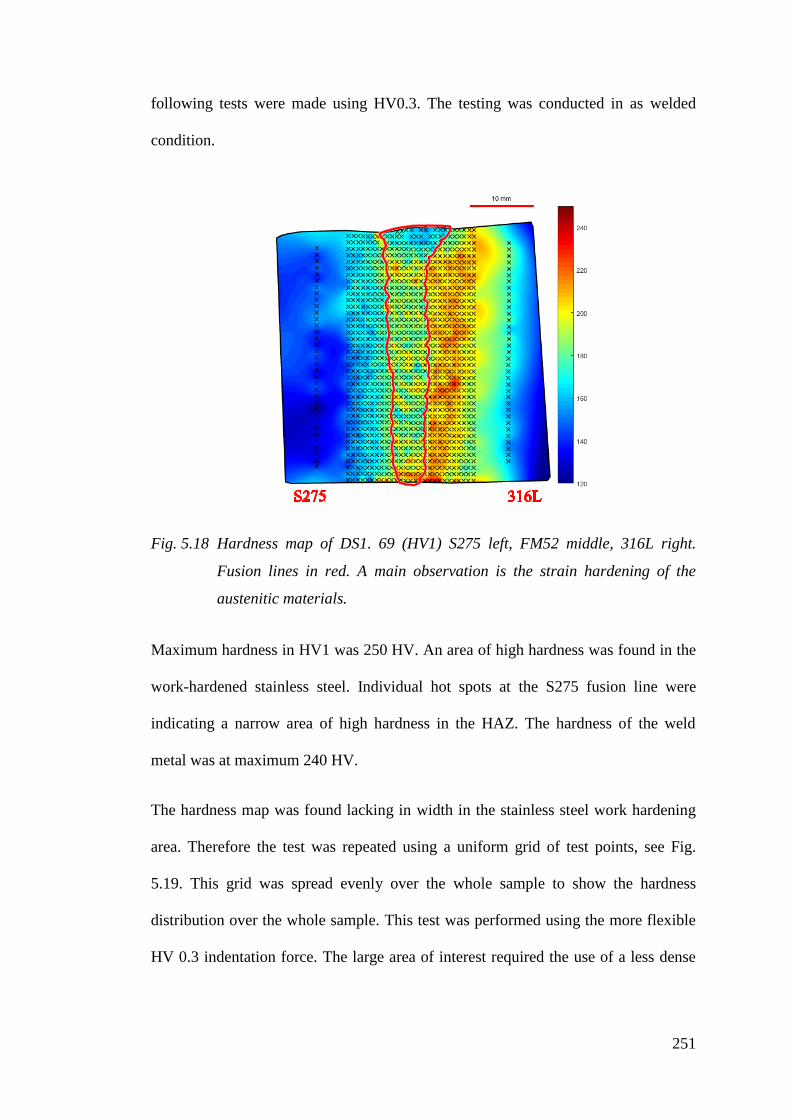
251
following tests were made using HV0.3. The testing was conducted in as welded
condition.
Fig. 5.18 Hardness map of DS1. 69 (HV1) S275 left, FM52 middle, 316L right.
Fusion lines in red. A main observation is the strain hardening of the
austenitic materials.
Maximum hardness in HV1 was 250 HV. An area of high hardness was found in the
work-hardened stainless steel. Individual hot spots at the S275 fusion line were
indicating a narrow area of high hardness in the HAZ. The hardness of the weld
metal was at maximum 240 HV.
The hardness map was found lacking in width in the stainless steel work hardening
area. Therefore the test was repeated using a uniform grid of test points, see Fig.
5.19. This grid was spread evenly over the whole sample to show the hardness
distribution over the whole sample. This test was performed using the more flexible
HV 0.3 indentation force. The large area of interest required the use of a less dense
252
grid to limit the number of test points to reduce the test time. The same sample was
used re-grinded and polished.
Fig. 5.19 Hardness map of DS1 69 (HV0.3. Approximate fusion lines in red. Note
the narrow area of high hardness at the S275 FL.
Comparisons of the maps showed, that the apparent area of each point measurement
was much larger in the latter test. This was due to the sparser grid spacing allocating
a larger surface area for each point, making single points look more pronounced.
In the hardness map in HV 0.3, the hardening of the stainless steel was fully covered.
The analysis revealed a smooth hardness transition to the base material. The area of
highest hardness was found at strain hardened 316L on the right and the lowest in
S275 base material. The profile of the area of SS strain hardening was explained by
the welding distortions being the largest near the top of the weld, including the very
surface of the sample.
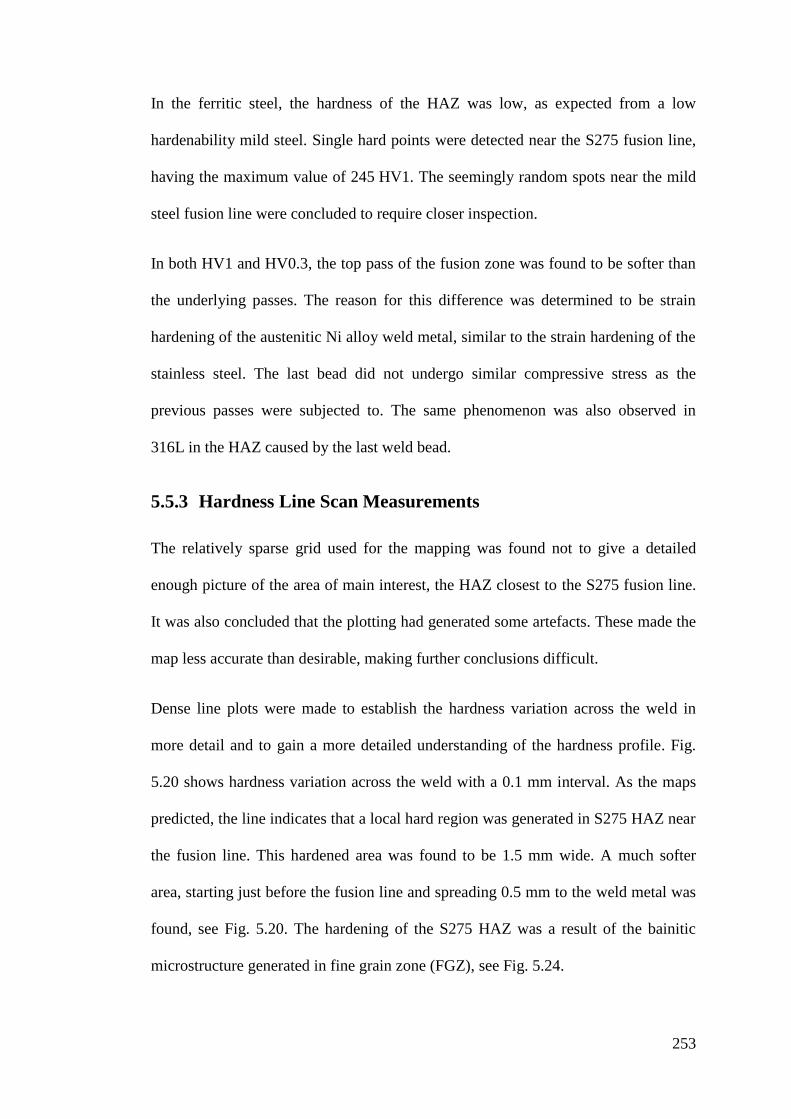
253
In the ferritic steel, the hardness of the HAZ was low, as expected from a low
hardenability mild steel. Single hard points were detected near the S275 fusion line,
having the maximum value of 245 HV1. The seemingly random spots near the mild
steel fusion line were concluded to require closer inspection.
In both HV1 and HV0.3, the top pass of the fusion zone was found to be softer than
the underlying passes. The reason for this difference was determined to be strain
hardening of the austenitic Ni alloy weld metal, similar to the strain hardening of the
stainless steel. The last bead did not undergo similar compressive stress as the
previous passes were subjected to. The same phenomenon was also observed in
316L in the HAZ caused by the last weld bead.
5.5.3 Hardness Line Scan Measurements
The relatively sparse grid used for the mapping was found not to give a detailed
enough picture of the area of main interest, the HAZ closest to the S275 fusion line.
It was also concluded that the plotting had generated some artefacts. These made the
map less accurate than desirable, making further conclusions difficult.
Dense line plots were made to establish the hardness variation across the weld in
more detail and to gain a more detailed understanding of the hardness profile. Fig.
5.20 shows hardness variation across the weld with a 0.1 mm interval. As the maps
predicted, the line indicates that a local hard region was generated in S275 HAZ near
the fusion line. This hardened area was found to be 1.5 mm wide. A much softer
area, starting just before the fusion line and spreading 0.5 mm to the weld metal was
found, see Fig. 5.20. The hardening of the S275 HAZ was a result of the bainitic
microstructure generated in fine grain zone (FGZ), see Fig. 5.24.

254
-20 -15 -10 -5 0 5 10 15 20 25
125
150
175
200
225
250
275
300
FM52 SA508
Ha
rdness (
HV
1)
Distance from S275 fusion line (mm)
S275
Fig. 5.20 Hardness line plot across the weld, second to top pass. Note the narrow
area of high hardness in S275. Fusion lines marked on the graph. Sample
DS1 69.
Solid-state carbon diffusion to the Cr rich fusion zone (decarburisation) during
cooling was considered to contribute to the premature drop of hardness. The
apparent drop of hardness before the fusion line was determined to be possibly an
artefact due to hardness measurement indents partially reaching the adjacent softer
weld metal. It was also recognised, that although this test did not fill the
requirements for indent spacing set by standards, the measured hardness values were
in good accordance with the results from the first map. The measurement was
concluded to give a good overview of the hardness changes over the weld.
Further hardness investigation was made for sample DS2 116 in order to investigate
the S275 fusion line in fine detail and assess the multipass tempering effect. To
comply with the indent spacing minimums, these tests were made using a grid of
indents to space the measurements further apart. The locations of the indents on the
sample are presented in Fig. 5.21. In the figure, the first grid of indentations is
already measured and the indents are visible.

255
Fig. 5.21 Hardness test grid and locations. Note top bead being considerably wider
than previous passes to ensure smooth capping. Sample DS2 116.
The actual distance of each indent perpendicular to the fusion line was measured and
the results were plotted. Points from the less dense measurements at the same height
were added to extend the graphs to BM and FZ. The four topmost line plots are
presented in Fig. 5.22. Abnormally high hardness values were occasionally measured
in the FZ near the fusion line. These were due to the automatically distributed test
point striking an unmixed ferrite stringer. They were removed from the line plot.

256
-2000 -1500 -1000 -500 0 500 1000140
160
180
200
220
240
260
280
300
320
FM52
Hard
ne
ss (
HV
0.3
)
Distance from FL (µm)
TOP
-1
-2
-3
S275
Fig. 5.22 Hardness of S275 HAZ at different states of multipass tempering.
Multipass tempering can easily be noticed from the results. This tempering has a
strong beneficial reductive effect on hardness. The maximum hardness of the S275
HAZ reduced when approaching passes which have gone through tempering cycles.
By comparing results from different weld beads it can be seen that three heat cycles
temper almost all the hardening caused by the welding.
A drop in hardness in the S275 HAZ, 50 µm from the fusion line can be seen in a
close up of the FL in Fig. 5.23. The HV 0.3 indents in the HAZ near the FL were
approximately 50 µm in diagonal. This would suggest horizontal accuracy of a
similar scale. Decarburization of the S275 HAZ was a suggested reason. The drop in
the S275 HAZ hardness before the FL can be explained by the indents being affected
by the proximity of the softer FZ.

257
-500 0 500140
160
180
200
220
240
260
280
300
320
Hard
ne
ss (
HV
0.3
)
Distance from FL (µm)
TOP
-1
-2
-3
S275 FM52
Fig. 5.23 Hardness of the S275 HAZ. Close up near the fusion line.
5.5.4 Microstructural Analysis
Microstructural analysis was conducted on the cross-sectional samples of the weld.
The main areas of interest were the austenitic to ferritic/bainitic fusion line of the
S275 and overall grain size.
A cross-section of the whole S275 HAZ is displayed as Fig. 5.24. The width of the
HAZ was approximately 2.5 mm. The different grain structures at different areas of
the welds were examined in further detail.
Fig. 5.24 S275 HAZ of a tempered filling pass, BM-tempered-ICHAZ-FGHAZ-
CGHAZ-WM
In the S275 base material, Fig. 5.25, the grain size was found to be 15 – 20 µm. In
the grain growth zone of the HAZ, the grain size was practically unchanged, Fig.
5.26. The HAZ grain size was found to have increased to 30 µm near the top where
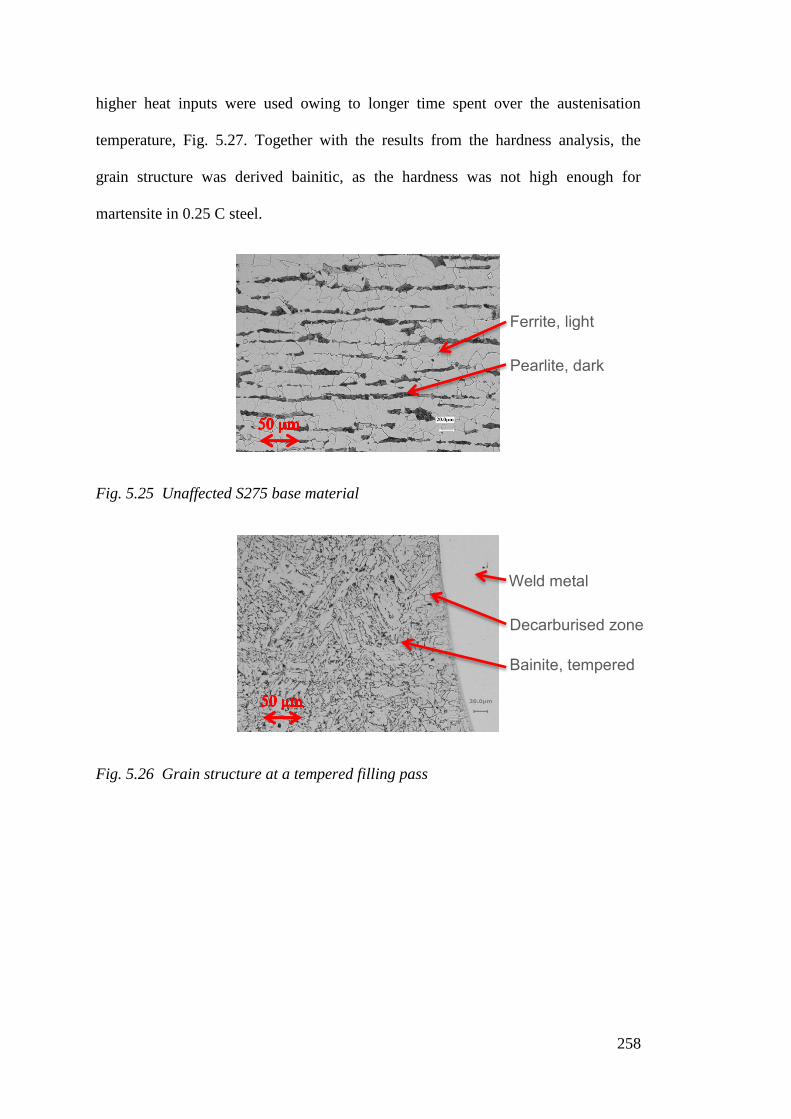
258
higher heat inputs were used owing to longer time spent over the austenisation
temperature, Fig. 5.27. Together with the results from the hardness analysis, the
grain structure was derived bainitic, as the hardness was not high enough for
martensite in 0.25 C steel.
Fig. 5.25 Unaffected S275 base material
Fig. 5.26 Grain structure at a tempered filling pass
Bainite, tempered
Decarburised zone
Weld metal
Pearlite, dark
Ferrite, light
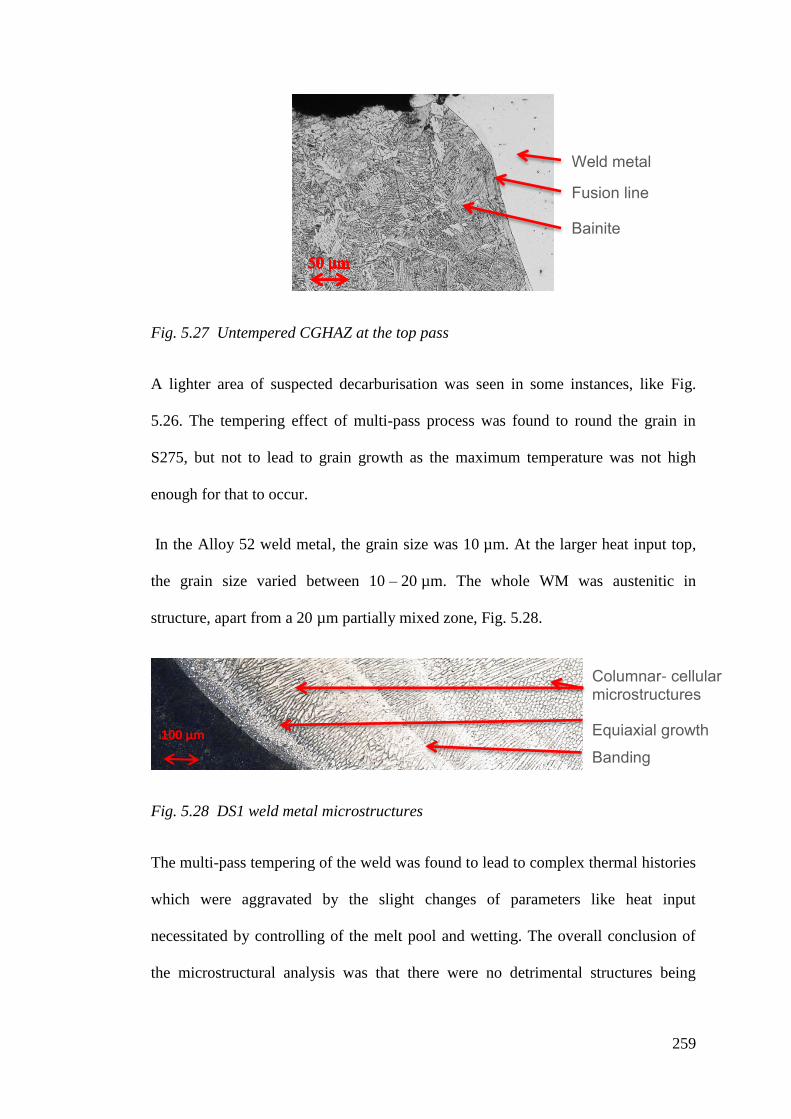
259
Fig. 5.27 Untempered CGHAZ at the top pass
A lighter area of suspected decarburisation was seen in some instances, like Fig.
5.26. The tempering effect of multi-pass process was found to round the grain in
S275, but not to lead to grain growth as the maximum temperature was not high
enough for that to occur.
In the Alloy 52 weld metal, the grain size was 10 µm. At the larger heat input top,
the grain size varied between 10 – 20 µm. The whole WM was austenitic in
structure, apart from a 20 µm partially mixed zone, Fig. 5.28.
Fig. 5.28 DS1 weld metal microstructures
The multi-pass tempering of the weld was found to lead to complex thermal histories
which were aggravated by the slight changes of parameters like heat input
necessitated by controlling of the melt pool and wetting. The overall conclusion of
the microstructural analysis was that there were no detrimental structures being
100 µm
Columnar- cellular microstructures
Equiaxial growth
Banding
Bainite
Weld metal
Fusion line

260
developed in the weld. The grain size was small in every area of the weld. The multi-
pass tempering effect was seen as banding in the HAZ microstructure, Fig. 5.29.
Fig. 5.29 S275 HAZ banding due to multi-pass tempering
5.5.5 EDX Dilution Analysis
The weld DS1 was analysed for weld metal dilution using EDX. Scans were made at
three depths in the weld. One at the root pass, one at the 3rd
pass and one at the top
pass.
The root pass line scan is presented in Fig. 5.30. The left-hand side of the scan
presents the S275 mild steel fusion line, while the 316L fusion line is just outside of
the field of view. The first observation was that the weld metal composition was very
consistent. There were no distinct signs of banding or grouping of elements. In the
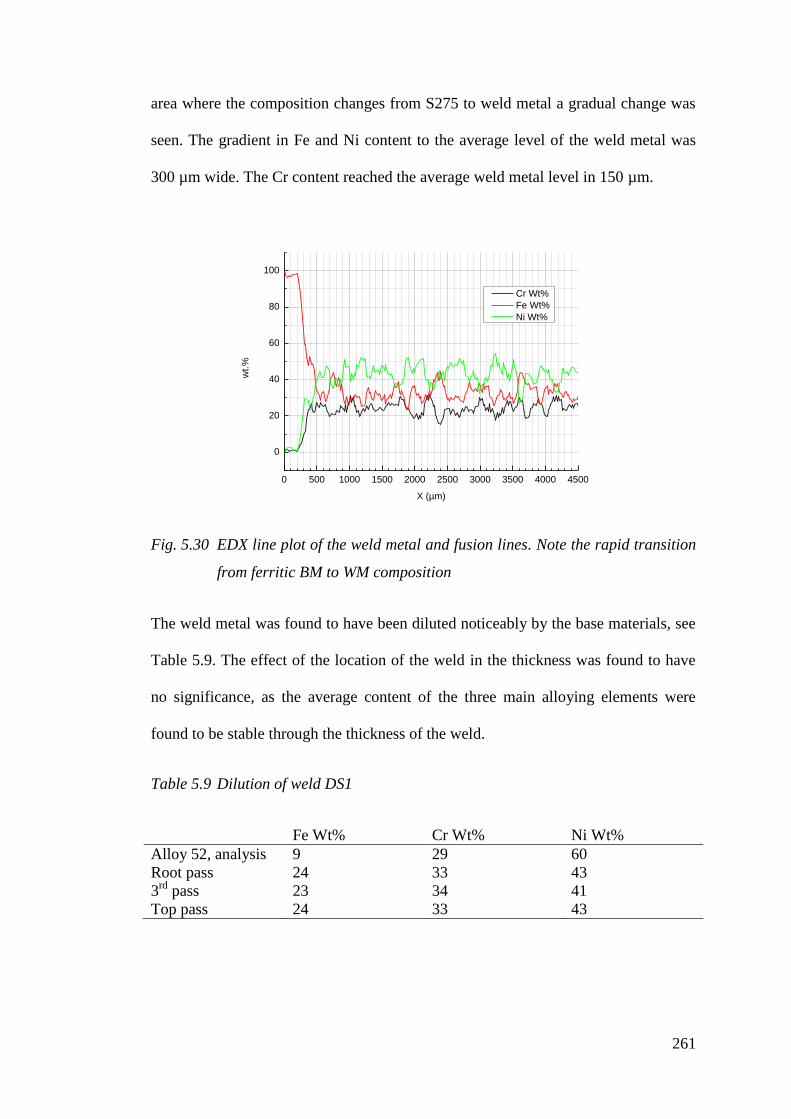
261
area where the composition changes from S275 to weld metal a gradual change was
seen. The gradient in Fe and Ni content to the average level of the weld metal was
300 µm wide. The Cr content reached the average weld metal level in 150 µm.
0 500 1000 1500 2000 2500 3000 3500 4000 4500
0
20
40
60
80
100
wt.
%
X (µm)
Cr Wt%
Fe Wt%
Ni Wt%
Fig. 5.30 EDX line plot of the weld metal and fusion lines. Note the rapid transition
from ferritic BM to WM composition
The weld metal was found to have been diluted noticeably by the base materials, see
Table 5.9. The effect of the location of the weld in the thickness was found to have
no significance, as the average content of the three main alloying elements were
found to be stable through the thickness of the weld.
Table 5.9 Dilution of weld DS1
Fe Wt% Cr Wt% Ni Wt%
Alloy 52, analysis 9 29 60
Root pass 24 33 43
3rd
pass 23 34 41
Top pass 24 33 43

262
The S275 fusion line at top bead is displayed as Fig. 5.31. The change of
composition to the average weld metal can be seen happening in a shorter distance
than in the root pass. The width of this transitional zone is 30 µm. Ni is again the
element reaching the weld metal composition the quickest. This shorter transitional
zone can be attributed to the larger heat input at the top pass contributing to a more
turbulent weld pool. Unmixed ferrite can be seen 180 µm from the FL as a drop in
Ni and an increase in Fe content.
200 400 600 800 1000 12000
20
40
60
80
100
wt.
%
X (µm)
Fe Wt%
Ni Wt%
Cr Wt%
Fig. 5.31 EDX line plot for top bead at the S275 fusion line. The transition in the
composition is prompt.
In Fig. 5.32 of the 316L fusion line a more gradual change in chemical composition
was seen. The transition of Fe spreads over a distance of 200 µm. The Cr has no
distinct transition zone, as the change in content spreads to a wide area and the
change in content is relatively small. In this case, also, the Ni content has the steepest
gradient which is only 10 – 20 µm wide.

263
2600 2800 3000 3200 34000
20
40
60
80
100
wt.
%
X (µm)
Cr Wt %
Fe Wt %
Ni Wt %
Fig. 5.32 EDX line plot for top bead at the 316L fusion line.
5.6 Discussion
Weld quality acceptable by ASME IX examination was produced, but not achieved
along an entire length of a weld. The acceptance was performed radiographically and
inspected for linear indications, generally for incomplete fusion or slag inclusions,
and rounded indications, usually porosity. Very few issues with rounded indications
were detected. The main challenge was control of lack of fusion defects. See
radiographical acceptance examination reports for welds DS3, DS4 and DS5, in
Appendix II. Two mechanisms leading to poor fusion were found; a floating layer of
accumulated oxides affecting wetting due to inadequate gas shielding and the oxide
layer not separating from the previous pass due to lack of penetration.
The fusion issues in the dissimilar metal welds were caused partly by the limited
laser power that could be applied to the weld pool. The laser power, the directly
proportional heat input and hence the penetration was limited by the appearance of
undercut in the stainless steel sidewall when using excessively high power. This was
detrimental to the symmetry of the weld and fusion, see Fig. 5.5. and Fig. 5.6.

264
The weldability of FM52 filler metal was known to be challenging [80, 89, 128]. The
melt pool behaved sluggishly, evident from the angle of wetting in Fig. 5.14, and the
spot size control had to be precise to ensure acceptable wetting and fusion. The
higher viscosity of FM52 compared to S275 was known to cause a Marangoni flow
away from the S275 base material, making the wetting more difficult. Although
observations of the floating oxide particles on the LII video material did not indicate
a visible effect, this may have had an effect at the immediate vicinity of the material
interface.
The filler metal was also found to oxidise strongly, as suggested by literature [89,
128], the de-oxidising alloying elements, oxide floaters, forming a crust of Ti and Al
oxides on top of the weld pool. This was found to be an issue especially as in the
multi-pass welding the oxides accumulated over the passes. Improved shielding gas
nozzles were able to alleviate the problem, but the issue persisted.
One major challenge in NGLW of S275 to 316L using FM52 was the precision
required from the process. The spot size and alignment of the weld had to be correct
within approximately 0.2 mm. If the spot size was too small, the wetting of the
sidewalls was compromised, see Fig. 5.14. If it was too large, the sidewalls were
damaged by reflections, see conclusions in Chapter 5.4.1, page 240. Filler wire
alignment was found critical in the vertical direction, overshooting being more
detrimental. The overshooting filler wire would be heated in direct interaction with
the laser beam, leading to droplet formation at the tip of the wire. This droplet would
oxidise keenly and drop into the melt pool causing irregular bead surface, the effects
shown in Fig. 5.9. The required precision was approximately ±1 mm, tolerances
being similar to Jokinen’s findings [17]. The horizontal alignment was not found to
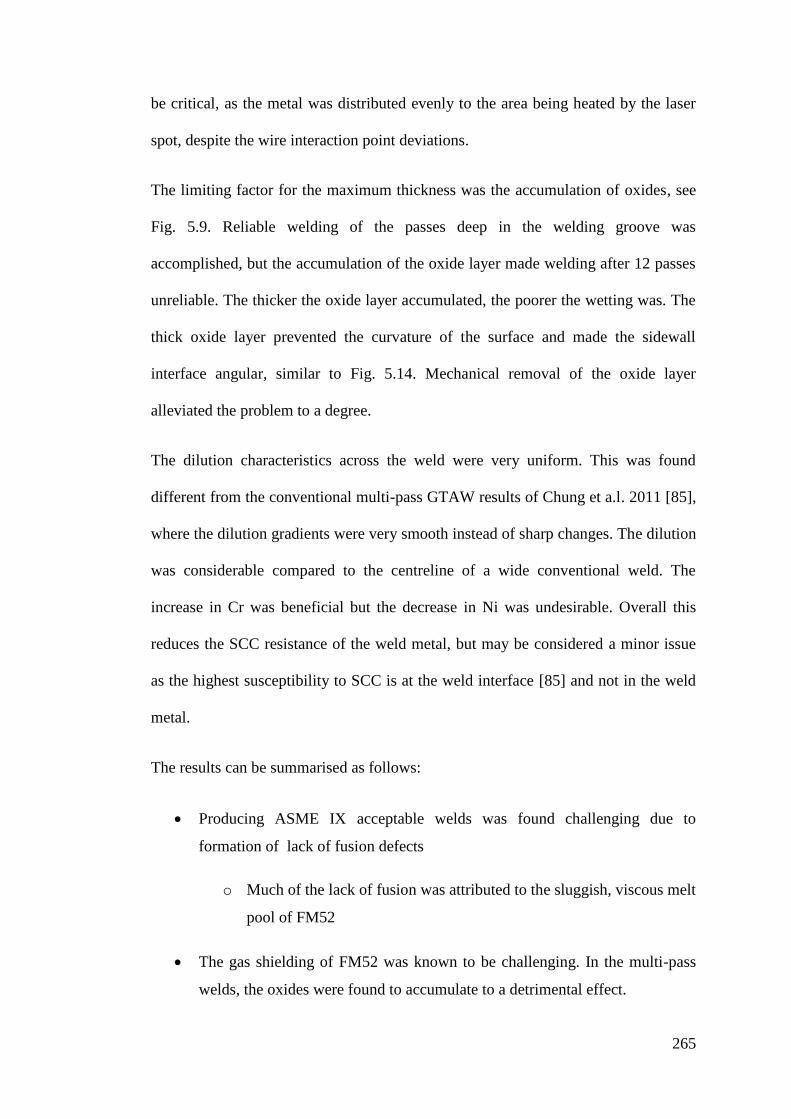
265
be critical, as the metal was distributed evenly to the area being heated by the laser
spot, despite the wire interaction point deviations.
The limiting factor for the maximum thickness was the accumulation of oxides, see
Fig. 5.9. Reliable welding of the passes deep in the welding groove was
accomplished, but the accumulation of the oxide layer made welding after 12 passes
unreliable. The thicker the oxide layer accumulated, the poorer the wetting was. The
thick oxide layer prevented the curvature of the surface and made the sidewall
interface angular, similar to Fig. 5.14. Mechanical removal of the oxide layer
alleviated the problem to a degree.
The dilution characteristics across the weld were very uniform. This was found
different from the conventional multi-pass GTAW results of Chung et a.l. 2011 [85],
where the dilution gradients were very smooth instead of sharp changes. The dilution
was considerable compared to the centreline of a wide conventional weld. The
increase in Cr was beneficial but the decrease in Ni was undesirable. Overall this
reduces the SCC resistance of the weld metal, but may be considered a minor issue
as the highest susceptibility to SCC is at the weld interface [85] and not in the weld
metal.
The results can be summarised as follows:
Producing ASME IX acceptable welds was found challenging due to
formation of lack of fusion defects
o Much of the lack of fusion was attributed to the sluggish, viscous melt
pool of FM52
The gas shielding of FM52 was known to be challenging. In the multi-pass
welds, the oxides were found to accumulate to a detrimental effect.

266
o Accumulation of oxides was found to be a major contributor to lack
of fusion to sidewalls and between the welding passes
o Considerable development of the gas shielding system was required
to achieve the repeatability required in multi-pass welding
Asymmetrical undercutting of the stainless steel was observed
o The undercut distorted the weld geometry, especially at the top passes
o The undercut contributed to lack of fusion defects
The welding distortions were high enough to warrant an increase of the V-
groove angle to 5°
The two different indirect groove contraction measurements investigated
produced similar results
Re-melting a pass was found able to repair small fusion defects and abnormal
bead shape to some extent
A very narrow area of high hardness was found in the S275 mild steel HAZ.
This is typical for low-carbon mild steels, where hardenability is low and
only the most intense heat cycle just adjacent to the fusion line can cause
hardening.
Microstructural analysis confirmed an area of fine-grain bainite in S275
HAZ, see Fig. 5.26. This was formed by the heat cycle of the welding and the
heat treatment caused by the multi-pass welding
The fusion zone grain structure was fully austenitic as expected for a high-
nickel alloy, as per the Schaeffler diagram, Fig. 2.26. It was found free of
solidification and liquation cracking, which often are issues with highly
restrained welds [98].
Multi-pass tempering effect produced strain hardening in the austenitic weld
metal and stainless steel HAZ, see Fig. 5.19.

267
5.7 Conclusions
The dissimilar metal welding using EN S275 mild steel and AISI 316L austenitic
stainless steel with Inconel filler metal FM52 was found to pose considerably more
difficult challenges compared to the previous similar metal NGLW. Although nearly
all the questions set at the beginning were answered, the ductility dip cracking
investigation was found to require more detailed work. The following conclusions
were reached:
From the direct and indirect welding groove distortion measurement results
of the DMW tests with a 4° V-groove it was seen that the welding distortions
contracted the gap below the nominal 5 mm. In conclusion, a 5° V-groove
was introduced for the following tests. The increased contraction was
concluded to be caused by the increased number of passes and heat input
compared to the Stage I welds.
ASME IX radiographical acceptance was not achieved for an entire length of
a weld due to lack of fusion type defects. It was concluded that adding a run-
in and run-out sections to the weld would help to solve the issue, as most
issues were concentrated at the ends of the welds. However, lengths of
acceptable joint were accomplished.
The accumulation of oxides on the FM52 was recognised increasing the
propensity for lack of fusion as the welds progressed. Controlling the gas
shielding environment and removal of the oxide layer between passes were
found crucial to the success of the welds. A sufficient purity shielding gas
environment was established after introducing large low-velocity gas nozzles
as close as possible to the weld pool inside the groove. Using small diameter
high-velocity gas jets was found to cause turbulence, which was found to
cause contamination of the gas by the ambient air.

268
Weld symmetry was investigated visually between passes. No significant
asymmetry was found. However wetting issues occurred mainly at the 316L
fusion boundary.
No solidification or liquation cracks were found in the FM52 fusion zone.
The dilution of base materials to the FM52 weld metal analysed by EDX was
noticeable. This was not considered an issue, as literature [85] states that in a
DMW the weakest SCC properties are found at the fusion interface in any
case, and depend on the complex local microstructure. The elemental
composition of the entire fusion zone was found evenly distributed. This was
confirmed both across the weld and vertically through the thickness. This
indicates good mixing of the weld pool which leads to uniform properties.
Hardness mapping suggested phase transformation hardening at a very
narrow region next to the FL in the S275 mild steel HAZ. This was
confirmed by detailed microhardness analysis and found 1.5 mm wide. The
resulting grain structure was found bainitic.
In hardness mapping strain hardening was observed in the FM52weld metal
and 316L stainless steel. The last welding pass and the resulting HAZ were
found softer than the underlying areas due to lack of additional heat cycles
and the consequent strain hardening.
Hardness mapping showed uniform hardness through the thickness of the
weld. This supports the uniformity of the properties.
The geometrical positioning tolerances were found similar to the Stage I
similar metal welding, the dissimilar materials having no notable effect.
Very careful control of the laser power was required, on the contrary to the
Stage I findings. By comparing the records of welding parameters and cross-
section macrographs of the welds, the limits of laser power were established.
The laser power lower limit was set by the interpass lack of fusion. The upper
limit was set by the generation of asymmetrical undercutting of the stainless
steel.
269
A beneficial multi-pass tempering effect was found to produce small grain
size in the S275 HAZ. This suggests good mechanical properties and impact
toughness. There was little change in microstructure after 3 heat cycles. From
there on the weld was uniform.

270
Blank page
271
6 Thick Section Narrow Gap Laser Welding of
Dissimilar Metals SA508 Gr3 Cl2 and 316L
6.1 Introduction
Stage III and the main aim of this study was dissimilar NGLW of nuclear grade
SA508 LAS to 316L SS. These welds were made using high chromium-nickel alloy
filler Inconel FM52. The material thickness used was 40 mm representing the wall
thickness of a pressuriser surge line piping to pressuriser vessel dissimilar metal
weld. The plate form samples were 200 mm long.
Stage III was performed to produce and analyse welds resembling actual applications
in light water reactors as closely as possible within the budget and in laboratory
conditions. The welds were subjected to the same acceptance criteria as real-life
production welds. These were further supported by several additional analyses to
further assess the quality and to compare the properties achieved to literature.
The Stage III welding trials were conducted using all the knowledge developed
during this programme. The pre-heat and interpass temperatures were controlled and
monitored. Each welding pass was monitored visually and distortions measured
mechanically as per the experiences of the previous stages. The welding process was
recorded using the coaxial camera video system.
Visually sound, according to BS EN ISO 13919 [177], samples were subjected to
ASME IX radiographical acceptance as a production piece would be [176]. Industry-
standard, U.S. NRC Regulation 10 CFR Appendix G, [159] Charpy-V impact
toughness tests were conducted, with additional SEM analysis of the fracture

272
surfaces. Residual stress distribution was analysed using the contour method [162] to
assess the susceptibility to stress corrosion cracking [10]. Macrographical and
hardness investigations were conducted on full-size cross-sectional samples to
support microstructural analysis. Longitudinal and transverse (composite) tensile
tests were made after BS EN ISO 13919 [177] with added DIC analysis.
The sample design was as per Chapter 3. Two different V-groove angles, 4° and 5°
were examined; all tests are displayed in Table 6.1.
Table 6.1 Stage III of dissimilar metal narrow gap laser welds,
SA508 to 316L using Alloy 52
Target Groove Gas shield Notes
SA1 4° Stationary nozzles Thermocoupled
SA2 Gas shielding &
Groove angle study
5° Tri-blade nozzle
SA3 Sample generation 5° Tri-blade nozzle
SA4 Undercut control study 5° Tri-blade nozzle
SA5 Undercut control study 5° Tri-blade nozzle
SA6 Undercut control study 5° Tri-blade nozzle
SA7 Sample generation 5° Tri-blade nozzle
SA8 Sample generation 5° Tri-blade nozzle
6.1.1 Expectations
The Stage III trials were expected to provide samples with sufficient integrity for the
various analyses and comparisons planned, although there were several known
challenges. One challenge was the sluggish weld pool of FM52 [129] and the
susceptibility to solidification, ductility dip and liquation cracking [98, 128].
Accumulation of Al and Ti oxides to the weld during the repeated passes was also
reported causing lack of fusion [87, 128]. Observations from the previous stages in
this study were in line with the literature; achieving good fusion being the main
challenge. There were no indications in the literature to suspect inferior properties

273
for successful NGLW samples compared with conventional welding, although it was
recognized that the smaller weld pool would be subjected to faster cooling than the
larger melt pools of arc welding processes.
Many characteristics of the FM52 filler were already embarked upon on Stage II, this
stage being concentrated on the properties of the final pedigree materials and the
weld as a whole. Special emphasis was put on investigating the multi-pass tempering
effect; could it replace the costly PWHT usually required? The research questions
set for this stage were:
Is there a difference in weldability between S275 and SA508 Gr3 Cl2? Does
the change in materials affect the tendency or mechanisms leading to lack of
fusion?
Is ASME IX radiographical acceptance achievable using the actual
application materials?
How does the different hardenability in the different low-alloy steels affect
the hardness of the HAZ?
What are the resulting microstructures in HAZ and weld metal, are there
potentially brittle areas?
Are the welds capable of exceeding the U.S. NRC impact toughness
requirements for PCC boundary components?
Are there other known flaws like FM52 DDC, liquation or solidification
cracking or porosity?
What is the effect of multi-pass tempering to the hardness, microstructure,
grain size, impact toughness and tensile properties?
Is the multi-pass tempering effect uniform? Is there variation in the properties
through the thickness?
How do the residual stress properties compare to literature?

274
6.2 Materials and Experimental Methods
The experimental setup was based on the findings of the earlier stages of this study.
The pedigree materials were found to set new challenges for the welding setup.
Improvements to the equipment were conducted up to the fifth welding test and from
then on the equipment was kept unchanged.
6.2.1 Materials
The base materials of the Stage III welds were ASME SA508 Gr3 Cl2, a nuclear
grade pressure vessel steel and AISI 316L austenitic stainless steel. The filler wire
used was a high chromium-nickel alloy Inconel FM 52 (Alloy 52, ERNiCrFe+7).
The materials used for this stage of the study are presented in detail in chapter 3.2.3.
6.2.2 Experimental Setup and Welding Parameters
The experiences from the previous welding trials had narrowed the usable parameter
window. Therefore all the pedigree welds were started with similar parameters, see
Appendix I. The welding speed was maintained at 0.08 m / min. The starting laser
power was 3500 W. During the welding the laser power was adjusted according to
observations of fusion and undercut in stainless steel. Offset was set to provide a
spot size similar to the width of the welding groove bottom, although Feng et a.l.
2106 [45] recommended a slightly wider for their ferritic steel welds. Increasing the
spot size to touch the sidewalls was found to generate undercut. Pre-heat was varied
between room temperature and 125°C. Shielding gas flow rates varied up to
14 l / min.
The first pedigree metal weld experiment SA1 was conducted with 4° V-groove.
Based on the observations during the previous welds, stationary shielding gas

275
nozzles with brackets guiding the gas flow were applied to provide gas shielding, see
Fig. 6.1. The wire feed nozzle arrangement was changed to an adjustable holder, see
Fig. 6.2. Otherwise, the setup was similar to the previous similar metal and S275
dissimilar metal welds. One reason for using a stationary shielding gas arrangement
was that it allowed the crucial view to the weld with the laser illumination imaging
system. The weld was also thermocoupled with 16 thermocouples.
Fig. 6.1 Experimental setup for SA1 pedigree metal weld. Thermocoupling,
stationary gas shielding arrangement, pre-heating blankets and Lenskes
clamps.
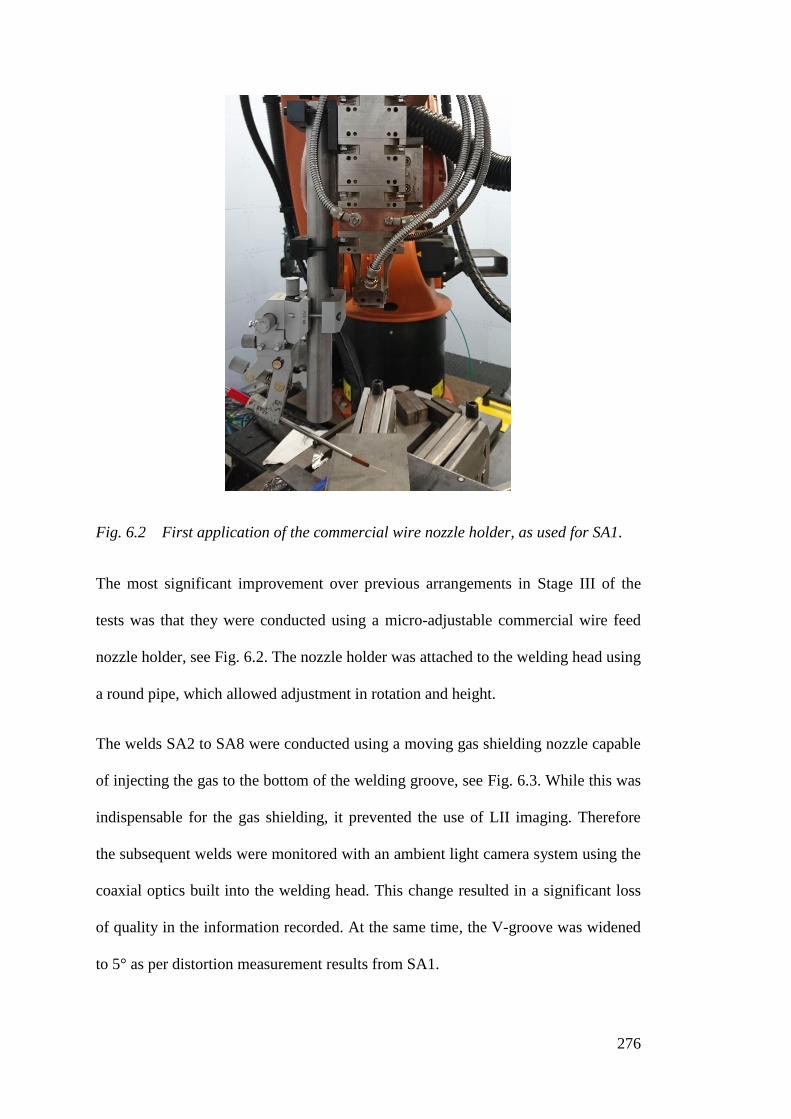
276
Fig. 6.2 First application of the commercial wire nozzle holder, as used for SA1.
The most significant improvement over previous arrangements in Stage III of the
tests was that they were conducted using a micro-adjustable commercial wire feed
nozzle holder, see Fig. 6.2. The nozzle holder was attached to the welding head using
a round pipe, which allowed adjustment in rotation and height.
The welds SA2 to SA8 were conducted using a moving gas shielding nozzle capable
of injecting the gas to the bottom of the welding groove, see Fig. 6.3. While this was
indispensable for the gas shielding, it prevented the use of LII imaging. Therefore
the subsequent welds were monitored with an ambient light camera system using the
coaxial optics built into the welding head. This change resulted in a significant loss
of quality in the information recorded. At the same time, the V-groove was widened
to 5° as per distortion measurement results from SA1.

277
Fig. 6.3 Wire feed setup with a linear stage for height adjustment and tri-blade gas
nozzle arrangement. As used from SA2 onwards.
From SA2 onwards the design was improved by implementing a linear stage for
quicker and more precise height adjustment, avoiding unnecessary rotation, see
Fig. 6.3. This allowed reliable adjustment of the nozzle height needed when
changing the focal offset to adjust the spot size. The nozzle was first fitted with a
4 mm wide tip and later improved to a design with a 2.8 mm tip allowing more
transverse adjustability in the narrow welding groove. When the range of
adjustability of the nozzle was sufficient and the alignment of the wire was
satisfactory the results were good regardless of the tip design.
6.3 Experimental Work and Results
The experiments on Stage III were based on previous work. The welding parameters
were initially the same as for the DMW in Stage II, as only the ferritic LAS was
changed.

278
6.3.1 Experiment 1
The first experiment of SA508 DMW was named SA1. This weld was designed to
include temperature monitoring by 16 thermocouples. Pre-heating was used under
the SA508 LAS. To allow the use of the LII recording system the gas shielding was
done by using brackets at either end of the welding groove.
Fig. 6.4 The welding setup for SA1. SA508 LAS nearer the camera.
The welding of SA1 was started with 3500 W laser power and 1 m/min wire feed
rate. The SA1 took 16 filling passes which were then covered with one cosmetic
pass. All the passes used the mentioned wire feed rate, but the laser power was
varied according to Table 6.2. The gas shielding performed very poorly, so this
experiment was not given much emphasis. The thermocoupling data proved valuable
for the following work, the resulting graphs are displayed as Appendix VI and VII.

279
Table 6.2 Welding parameters and notes SA1.
Pass Temp
316L
Temp
S275
Thickness Power
[°C] [°C] [mm] [W]
pre 125 202 2.1 3500
1 128 155.0 5.1 3500
2 133.0 148.0 7.5 3000
3 142.0 152.0 10 3000
4 147.0 155.0 12.2 3000
5 138.0 144.0 14.7 3000
6 131.0 134.0 17 2900
7 81.0 81.0 20 2900
8 101.0 116.0 23 2900
9 121.0 124.0 25.7 2900
10 135.0 142.0 27.8 2900
11 130.0 146.0 30 2900
12 118.0 126.0 32.5 2900
13 119.0 131.0 35.5 2900
14 124.0 136.0 36.5 3500
15 38.7 3500
16 39.7 3500
17 5200
6.3.2 Experiment 2
The test SA2 was conducted with the latest gas shielding arrangement which had
three nozzles delivering the gas to the bottom of the groove, see Fig. 6.5. The weld
was started without pre-heat to limit the turbulent airflow over the sample.

280
Fig. 6.5 The gas and wire nozzle used for SA2
The filler wire rate was 1 m/min, except for the second pass, which was a re-melt to
rectify an apparent centreline crack. No crack was found in the analysis of the weld.
The starting welding power of 3500 W was later lowered to decrease the undercut,
which was removed by the pass 10, see Table 6.3. This, however, caused the wetting
of the sidewalls to become less reliable, which can be seen as poor fusion at passes
13 and 16.

281
Table 6.3 Welding parameters and notes SA2.
Pass Temp
316L
Temp
S275
Thickness Power Feed
Rate
Fusion Under-
cut
[°C] [°C] [mm] [W] [m/min]
1 21.5 21.5 3500 1.0 50 20
2 42.5 43.5 1.2 3000 0.0 50 40
3 67.8 69.6 2.5 3000 1.0 50 20
4 63.0 63.4 4.2 3000 1.0 50 30
5 67.3 69.1 6.8 3000 1.0 50 40
6 66.0 68.8 9.4 3000 1.0 50 50
7 68.2 70.0 11.5 2500 1.0 50 30
8 72.5 76.7 14.0 2500 1.0 50 10
9 69.9 69.7 15.5 2500 1.0 50 5
10 77.0 75.9 17.7 2500 1.0 50 0
11 72.2 76.2 19.9 2500 1.0 50 0
12 65.2 69.5 21.8 2500 1.0 50 0
13 60.6 65.6 24.0 2500 1.0 10 0
14 69.0 68.7 26.0 2700 1.0 50 10
15 62.8 68.1 28.0 2500 1.0 50 5
16 71.5 72.9 30.0 2500 1.0 10 0
17 63.5 63.0 31.5 2700 1.0 50 5
18 68.8 71.6 33.5 2700 1.0 50 0
19 74.1 74.6 35.0 2700 1.0 50 0
20 50.0 50.5 37.5 3000 1.0 50 0
21 55.7 62.6 57.0 3500 1.0 50 0
22 60.0 64.5 77.0 5000 1.0 50 0
The weld suffered from undercutting in 316L from the beginning and laser power
had to be reduced to alleviate the problem. The occurrence of small undercut inside
the weld was not found detrimental as the geometry of the weld was not
compromised. The challenge was mainly to keep the undercut from growing too big
causing the type of sidewall collapse shown earlier in Fig. 5.6. Fig. 6.6 shows a
typical shielding and wetting performance for the weld SA2.

282
Fig. 6.6 SA2 first pass. The smooth wetting, symmetrical concave bead shape and
good gas shielding were characteristic for the first passes of all Stage III
welds. A and B are separate blocks to guide the shielding gas.
6.3.3 Experiment 3
The use of separate blocks as gas guides at the ends of the samples required manual
work for setting after each pass. For SA3 the gas shielding was further improved by
introducing fixed run in and –out grooves, instead of separate loose arrangements,
see Fig. 6.7. The weld was started 20 mm inside the bracket to allow for a longer
sample to be created. The gas shielding was good, see Fig. 6.8. The parameters used
are shown in Table 6.4

283
Fig. 6.7 The welding setup for SA3 with welded run in and –out brackets. Welding
direction down. Stainless steel on the left.
Fig. 6.8 3rd
pass of SA3. Note the oxide-free weld extending to the run on bracket
at start.

284
Table 6.4 Welding parameters and notes SA3.
Pass Temp
316L
Temp
S275
Power Feed
Rate
Fusion Under-
cut
[°C] [°C] [W] [m/min]
1 54.7 89.2 3500 1.0 20 50
2 75.3 123.5 3500 0.0 30 50
3 102.4 131.0 3000 1.0 30 45
4 117.0 136.5 3000 1.0 20 50
5 131.3 135.6 3000 1.0 15 50
6 126.8 139.1 3000 1.0 30 50
7 127.8 134.9 2800 1.0 25 50
8 130.0 132.6 2800 1.0 25 50
9 128.2 129.5 2800 1.0 25 50
10 131.0 144.4 2800 1.0 25 50*
11 67.6 67.6 3500 25 50
12 101.4 101.6 3000 1.0 10 50
13 123.8 128.8 3000 1.0 10 50
14 116.6 109.2 2800 1.0 15 50
15 122.0 128.0 2800 1.0 25 40
16 114.0 117.4 2800 1.0 25 40
17 108.2 110.4 2800 1.0 25 40
18 102.3 104.3 2800 1.0 10 10
19 109.1 112.5 2800 0.0 10 0
20 98.2 101.7 2800 1.5
21 87.1 91.0 5500 1.5
22 81.0 85.0 7500 1.5
23 77.7 76.4 7500 1.5
24 114.9 114.5 7500 0.0
* Nozzle pinched due to run in plate breaking
The poor fusion of the first pass was remedied with a re-melt pass. The fusion
improved the fusion to what was considered satisfactory. The weld was interrupted
at pass no 10 as the run in arrangement contracted rapidly as a tack weld cracked.
The same issue stopped the pass no 11 after 50 mm had been welded. This can be
seen as a loss of interpass temperature control in the data.
285
Initial gas shielding experiences for the first passes were good. After the weld had
gathered some thickness, the gas was able to escape more easily via the rear corner
of the trailing nozzles at the starting position of the pass. This was seen as increased
oxidation until all the nozzles were directly above the previous bead. This was
solved in the following welds by manually lifting also the run in bracket bottom as
the weld progressed.
6.3.4 Experiment 4
SA 4 was welded using the best practices developed. A pre-heat of 75°C was
applied. The welding parameters were the same as previously, laser power being
varied according to the observations on undercut and fusion. The shielding gas setup
was improved by filling in the gap under the trailing nozzles at the starting position
to ensure even gas flow distribution. The course of welding is displayed in Table 6.5.

286
Table 6.5 Welding parameters and notes SA4.
Pass Temp
316L
Temp
S275
Power Feed
Rate
Fusion Under-
cut
[°C] [°C] [W] [m/min]
1 75.7 75.0 3500 1.0 50 0
2 85.6 87.4 3000 1.0 50 20
3 87.7 91.1 3000 1.0 50 20
4 85.7 87.9 3000 1.0 50 20
5 85.6 92.0 3000 1.0 50 20
6 75.0 76.3 2900 1.0 50 5
7 86.1 89.4 2900 1.0 50 1
8 87.6 90.4 2900 1.0 50 1
9 79.9 81.3 2900 1.0 50 0
10 84.3 86.0 2900 1.0 50 5
11 87.9 90.5 2900 1.0 50 5
12 86.6 88.9 2900 1.0 50 5
13 85.9 86.7 2900 1.0 50 10
14* 78.9 80.8 2900 1.0 50 30
15** 70.0 70.0 2900 1.0 - -
16** 93.0 92.0 2900 1.0 - -
17** 79.5 78.7 2900 1.0 - -
18 69.5 69.5 2900 1.0 50 30
19 75.2 78.2 2650 1.0 40 40
20 76.2 71.8 2650 5.2 50 -
21 71.6 73.5 2650 3.5 - -
22 66.2 66.2 3100 1.5 - -
23 61.0 61.0 3100 0
24
* Filler wire stuck
** Partial welds to fill the layer
The SA4 started with good fusion quality and acceptable undercut characteristics.
However at pass no. 14 the wire feeder system failed and the pass was interrupted.
The repair of the pass was unsuccessful, requiring three separate runs to fill the layer
leaving lots of discontinuities and flaws in the weld. Although the small undercut
near the top allowed a smooth, Fig. 6.9, and symmetrical, Fig. 6.10, capping, this
weld was not analysed further.

287
Fig. 6.9 Smooth capping of SA4 with just some minor lack of fusion type defects.
Fig. 6.10 Symmetrical capping of SA4.
6.3.5 Experiment 5
The experiment SA5 was welded as the previous passes. After careful examination
of the previous interpass temperatures, the pre-heat temperature was set at 95°C. The
interpass temperature was held between 92°C and 105°C. There were no issues with
interruptions to the welding. The shielding gas performance was acceptable and
augmented by mechanical cleaning after each pass. The resulting weld was very
good. The parameters for the weld are displayed as Table 6.6.

288
Table 6.6 Welding parameters and notes SA5.
Pass Temp
316L
Temp
S275
Thickness Power Feed
Rate
Fusion Under-
cut
[°C] [°C] [mm] [W] [m/min]
1 94.7 86.1 0.0 3500 1.0 50 0
2 99.5 97.2 1.9 3250 1.0 49 0
3 97.7 95.9 4.0 3500 1.0 50 0
4 101.4 103.8 5.5 3500 1.0 50 0
5 102.4 106.8 7.5 3500 1.0 50 0
6 88.8 87.3 9.7 3500 1.0 50 0
7 101.4 99.7 12.0 3500 1.0 50 0
8 104.8 106.9 13.5 3500 1.0 50 0
9 104.3 105.6 15.5 3500 1.0 50 0
10 96.8 97.9 17.5 3500 1.0 50 0
11 91.9 93.0 19.5 3500 1.0 50 0
12 99.0 100.8 21.5 3500 1.0 50 0
13 103.4 105.7 23.5 3500 1.0 50 0
14 103.8 106.0 25.5 3500 1.0 50 0
15 97.3 98.4 27.5 3500 1.0 50 0
16 94.3 96.1 29.5 3500 1.0 50 0
17 93.3 95.0 30.5 3500 1.0 50 15
18 93.5 93.2 33.0 3350 1.0 40 3
19 88.4 89.2 34.7 3500 1.0 45 0
20 89.8 91.3 - 3500 1.0 49 0
21 78.3 78.6 - 3800 1.3 50 0
The fusion quality of SA5 was good throughout the weld, compare Fig. 6.11 and Fig.
6.12. The undercut was kept under control except for a brief occurrence at pass no.
17, which was remedied by a slight reduction of power for the subsequent pass. Fig.
6.13 presents the finished weld showing little oxidation and good fusion.
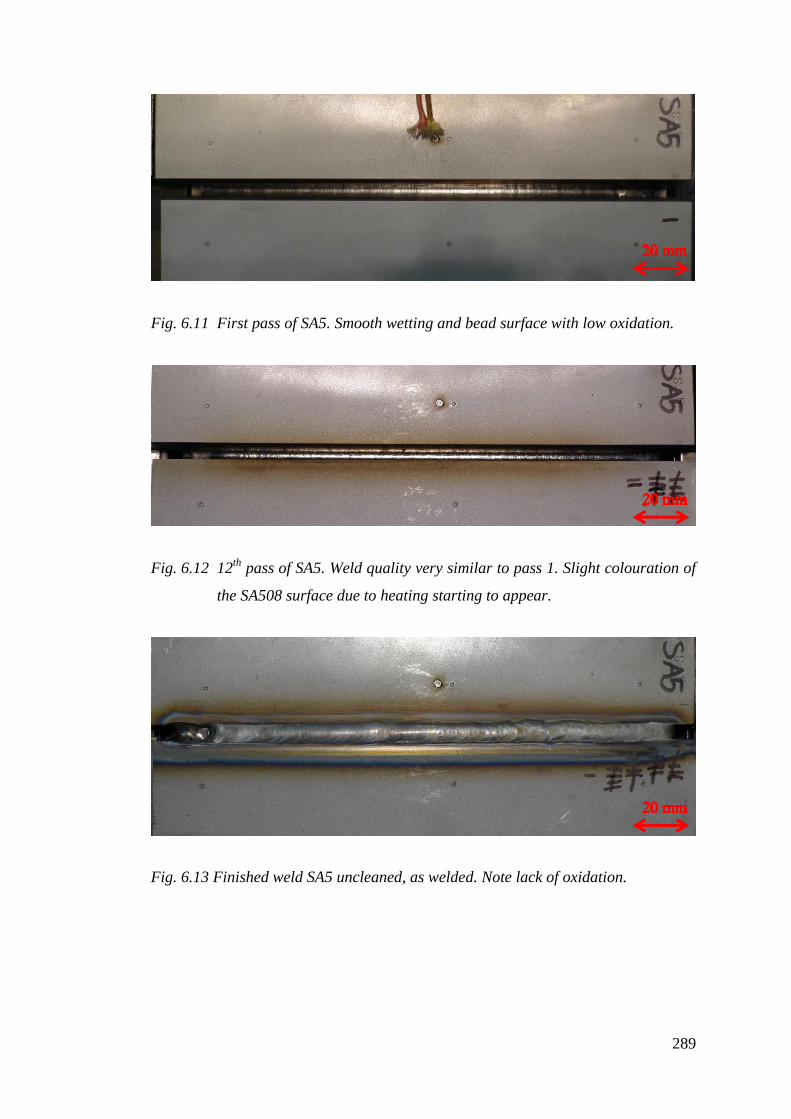
289
Fig. 6.11 First pass of SA5. Smooth wetting and bead surface with low oxidation.
Fig. 6.12 12th
pass of SA5. Weld quality very similar to pass 1. Slight colouration of
the SA508 surface due to heating starting to appear.
Fig. 6.13 Finished weld SA5 uncleaned, as welded. Note lack of oxidation.

290
6.3.6 Experiment 6
The SA6 was welded to replicate the good results of SA5. The pre-heat temperature
was matched as closely as possible at 92°C. The welding setup was the same. The
progress of the welding was good with no significant issues. Minute undercut was
noticed on several passes, but the extent was considered insignificant. The weld
filled at the same rate as previously and there were no interruptions. The parameters
are displayed in Table 6.7.
Table 6.7 Welding parameters and notes SA6.
Pass Temp
316L
Temp
S275
Thickness Power Feed
Rate
Fusion Under-
cut
[°C] [°C] [mm] [W] [m/min]
1 92.2 88.3 0.0 3500 1.0 50 0
2 100.2 98.6 1.7 3500 1.0 50 0
3 99.5 100.7 3.5 3500 1.0 50 1
4 99.8 101.3 5.3 3500 1.0 50 4
5 97.7 98.5 7.2 3500 1.0 50 4
6 97.0 96.7 9.7 3500 1.0 50 2
7 99.2 98.3 12.0 3500 1.0 50 1
8 100.0 99.7 13.7 3500 1.0 50 0.5
9 100.3 101.6 15.3 3500 1.0 50 0
10 97.6 98.2 17.4 3500 1.0 50 0
11 93.3 94.0 19.2 3500 1.0 50 0
12 99.6 102.8 21.4 3500 1.0 50 4
13 100.5 101.9 23.2 3500 1.0 50 6
14 100.2 102.2 25.5 3450 1.0 50 1
15 97.8 100.6 26.9 3500 1.0 50 0
16 92.7 92.8 28.9 3500 1.0 50 0
17 93.4 96.6 30.9 3500 1.0 50 0
18 99.9 102.8 32.5 3500 1.0 50 0
19 99.3 100.3 34.6 3500 1.0 50 0
20 95.0 96.3 36.3 3500 1.0 40 0
21 80.3 83.1 * 3850 1.3 50 0
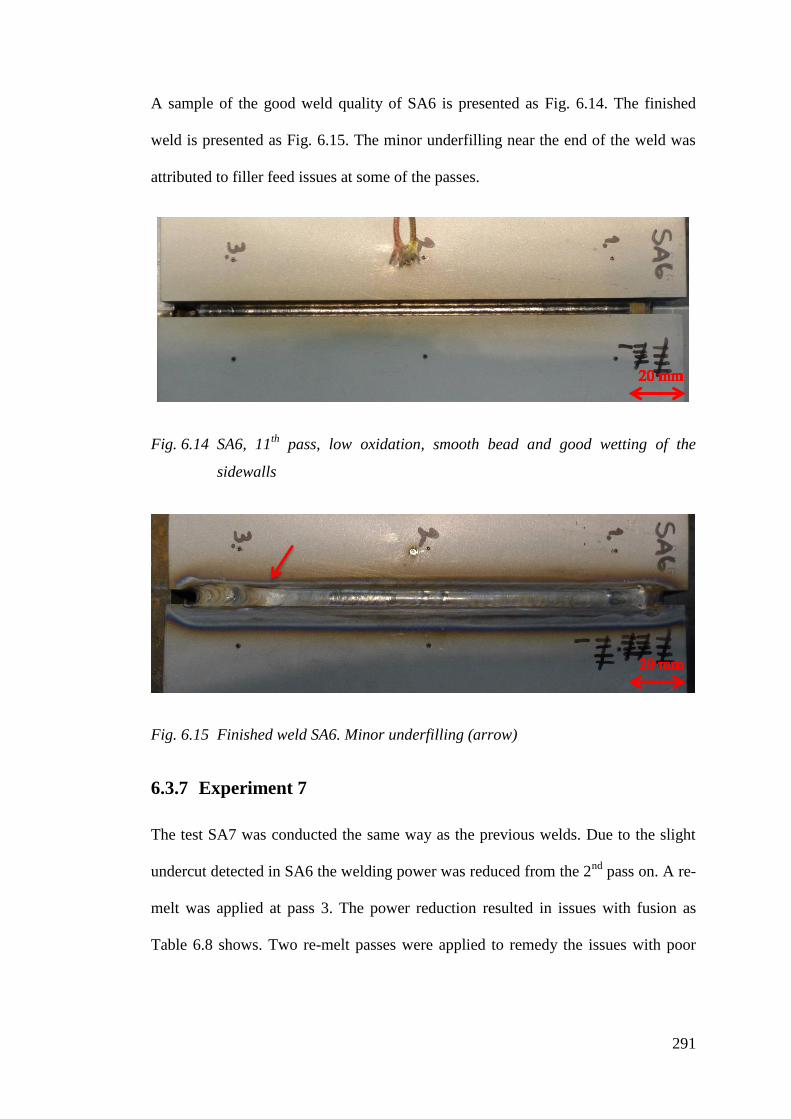
291
A sample of the good weld quality of SA6 is presented as Fig. 6.14. The finished
weld is presented as Fig. 6.15. The minor underfilling near the end of the weld was
attributed to filler feed issues at some of the passes.
Fig. 6.14 SA6, 11th
pass, low oxidation, smooth bead and good wetting of the
sidewalls
Fig. 6.15 Finished weld SA6. Minor underfilling (arrow)
6.3.7 Experiment 7
The test SA7 was conducted the same way as the previous welds. Due to the slight
undercut detected in SA6 the welding power was reduced from the 2nd
pass on. A re-
melt was applied at pass 3. The power reduction resulted in issues with fusion as
Table 6.8 shows. Two re-melt passes were applied to remedy the issues with poor
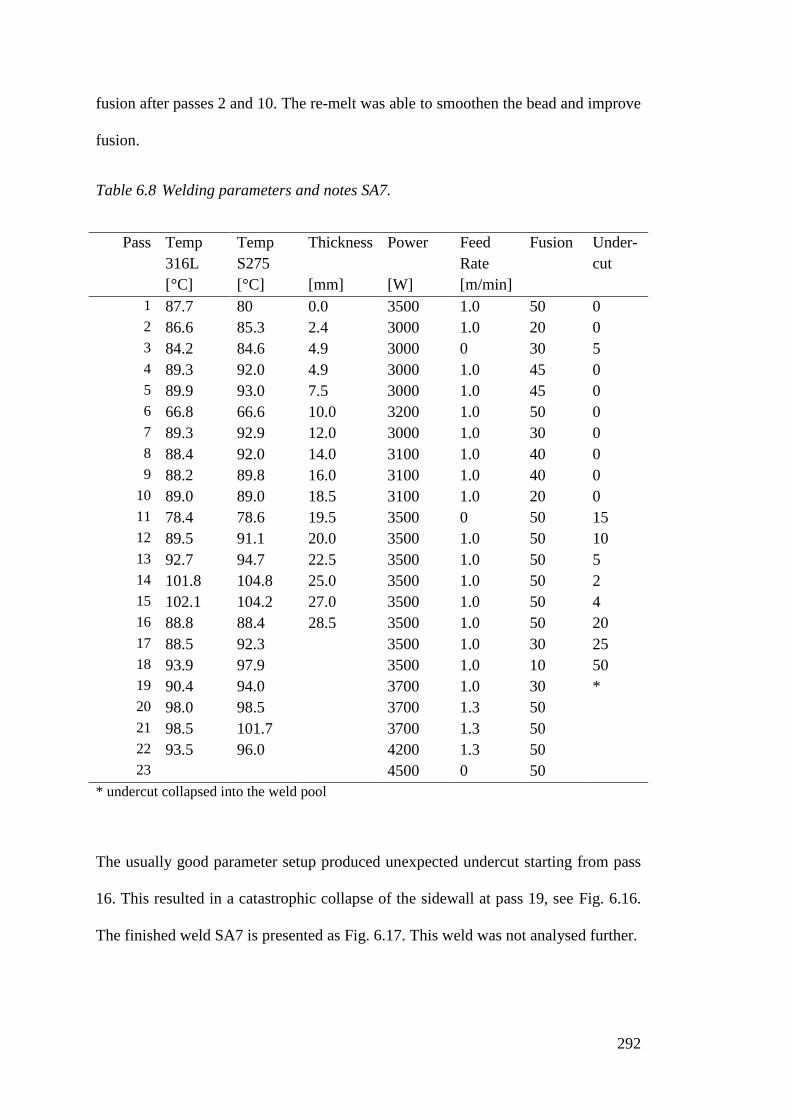
292
fusion after passes 2 and 10. The re-melt was able to smoothen the bead and improve
fusion.
Table 6.8 Welding parameters and notes SA7.
Pass Temp
316L
Temp
S275
Thickness Power Feed
Rate
Fusion Under-
cut
[°C] [°C] [mm] [W] [m/min]
1 87.7 80 0.0 3500 1.0 50 0
2 86.6 85.3 2.4 3000 1.0 20 0
3 84.2 84.6 4.9 3000 0 30 5
4 89.3 92.0 4.9 3000 1.0 45 0
5 89.9 93.0 7.5 3000 1.0 45 0
6 66.8 66.6 10.0 3200 1.0 50 0
7 89.3 92.9 12.0 3000 1.0 30 0
8 88.4 92.0 14.0 3100 1.0 40 0
9 88.2 89.8 16.0 3100 1.0 40 0
10 89.0 89.0 18.5 3100 1.0 20 0
11 78.4 78.6 19.5 3500 0 50 15
12 89.5 91.1 20.0 3500 1.0 50 10
13 92.7 94.7 22.5 3500 1.0 50 5
14 101.8 104.8 25.0 3500 1.0 50 2
15 102.1 104.2 27.0 3500 1.0 50 4
16 88.8 88.4 28.5 3500 1.0 50 20
17 88.5 92.3 3500 1.0 30 25
18 93.9 97.9 3500 1.0 10 50
19 90.4 94.0 3700 1.0 30 *
20 98.0 98.5 3700 1.3 50
21 98.5 101.7 3700 1.3 50
22 93.5 96.0 4200 1.3 50
23 4500 0 50
* undercut collapsed into the weld pool
The usually good parameter setup produced unexpected undercut starting from pass
16. This resulted in a catastrophic collapse of the sidewall at pass 19, see Fig. 6.16.
The finished weld SA7 is presented as Fig. 6.17. This weld was not analysed further.

293
Fig. 6.16 Collapse of the sidewall (arrow) SA7, 19th
pass.
Fig. 6.17 SA7 finished, with fusion flaws.
6.3.8 Experiment 8
Experiment SA8 was a repetition test to replicate the results of SA5 for sample
production. The welding parameters and data are presented in Table 6.9.

294
Table 6.9 Welding parameters and notes SA8.
Pass Temp
316L
Temp
S275
Thickness Power Feed
Rate
Fusion Under-
cut
[°C] [°C] [mm] [W] [m/min]
1 99.2 96.3 0.0 3500 1.0 50 1
2 95.2 92.1 2.3 3500 1.0 50 5
3 99.1 98.3 2.3 3500 1.0 50 3
4 100.1 100.0 4.6 3500 1.0 50 3
5 103.4 101.9 6.8 3500 1.0 50 3
6 86.2 84.8 9.3 3500 1.0 50 8
7 98.8 100.3 11.3 3500 1.0 50 7
8 102.0 103.2 13.1 3500 1.0 50 7
9 101.3 102.3 15.3 3500 1.0 50 7
10 101.6 102.4 17.3 3500 1.0 50 9
11 90.0 89.8 19.5 3500 1.0 50 9
12 96.6 100.7 21.7 3450 1.0 50 11
13 100.2 101.5 23.5 3400 1.0 40 15
14 88.3 89.5 25.8 3500 1.0 45 * 15
15 94.5 97.2 27.8 3500 1.0 30 -
16 102.4 106.3 29.3 3500 1.0 40 -
17 90.2 89.5 29.9 3500 1.0 45 -
18 72.5 71.0 3800 1.3 43 -
19 82.5 84.4 3800 1.2 45 -
20 89.0 91.3 4000 1.2 45 -
21 95.1 97.1 3900 1.0 45 -
* A single deep depression appeared at the 316L fusion boundary
The SA8 progressed well until pass no. 13 when the fusion quality unexpectedly
decreased. Although the grading for the average fusion quality does not show it, a
deep lack of fusion related recession appeared in the weld at pass no. 14 see Fig.
6.18. This rendered the weld unusable for further analysis.

295
Fig. 6.18 A depression in the 14th
pass, SA8.
6.4 Analysis of Process Characteristics
6.4.1 Welding Process Monitoring
Due to the limitations set by the shielding gas arrangement the laser illumination
imaging was only used for monitoring SA1. The rest of the welds were monitored
using the coaxial camera system.
The SA1 LII video material shows a stable melt pool with good wetting to the
sidewalls, but with severe oxidation, see Fig. 6.19. The wire feed was functioning
well and alignment was considered good. The melt pool did not appear to have a
strong Marangoni flow to either side, as the oxides spread evenly on the weld, with
only a slight tendency to drift towards the stainless steel.

296
Fig. 6.19 SA1, first pass. LII snapshot. Good wetting and alignment. Excessive
oxidation.
The 13th
pass of SA1 is displayed in Fig. 6.20. The groove has contracted below
4.37 mm and the laser is severely overheating the stainless steel top corner. Small
indications of this were already observed during the previous pass where the top gap
was measured at 4.44 mm after the welding. The sidewalls were not damaged
previously due to the conicality of the defocused laser beam.
Fig. 6.20 SA1 13th
pass. LII snapshot. Groove contracting excessively, laser beam
melting the stainless steel prematurely, very severe oxidation.
LII imaging of SA1 displayed that the parameters used generated a stable melt pool
and acceptable wetting of the side walls. The observations of the large amounts of
oxides with the stationary gas shielding arrangement emphasized the need for the
297
development of gas shielding. The wire feed setup used was proven reliable,
adjustable and free from vibrations.
The second phase of optical monitoring of the welds was the use of the coaxial
camera system provided by the laser head manufacturer. The camera provided was
changed to the one used with LII for allowing the recording of the videos. The
decrease in image quality was significant, but some crucial observations could still
be made.
6.4.2 Mechanical Distortion Measurements
The need for a wider V-groove was confirmed by the mechanical measurements of
the weld SA1. The resulting graph is displayed as Fig. 6.21. The minimum gap
measured and calculated was 4.25 mm. Geometrical calculations indicated that a 5°
V-groove would be required. The discontinuity in the graph was due to an
exceptionally long break between passes, during which the interpass temperature
control was lost and the sample cooled excessively.

298
0 1 2 3 4 5 6 7 8 9 10 11 12 13 14 15 16 17 18 19 204
5
6
7
8
Ga
p W
idth
(m
m)
Pass no:
direct measurements
indirect measurements
Fig. 6.21 Welding groove top width of SA1 using 4° V-groove. Note gap contracting
below 5 mm. Error bars represent min and max values measured.
The average of successful tests using the new 5° groove angle is displayed in Fig.
6.22. It indicates that the groove contracts very close to the set 5 mm as the groove
fills up. This allows the use of constant spot size, leading to using constant focal
offset. This translates to no need for wire or shielding gas nozzle height changes
during the welding.

299
0 2 4 6 8 10 12 14 16 18 204
5
6
7
8
Ga
p W
idth
(m
m)
Pass no:
direct measurements
indirect measurements
Fig. 6.22 Welding groove top width of SA series using 5° V-groove. Note gap
remaining over 5 mm until the end of the weld. Average of 6 tests. Error
bars represent min and max values measured.
Unlike in the mild steel dissimilar tests the groove contraction did not appear to have
distinct phases, but it contracted near linearly. As a conclusion, the 5° V-groove was
proven to provide near-constant welding pass width for each pass of the weld.
6.4.3 Effect of Remelting
Re-melting was applied in certain cases to repair an uneven or poorly fused welding
pass. Generally, the re-melting was able to heal some of the irregularities, but not all.
A poor beginning of the second pass of SA7 is presented as Fig. 6.23. The same bead
after a re-melting pass is displayed as Fig. 6.24. The re-melt effect on the bead
roughness and fusion can be seen as a reduction of the length of the irregular weld.

300
Fig. 6.23 2nd
pass SA7, poor wetting and fusion of the first 75 mm, see arrow.
Fig. 6.24 3rd
pass SA7, a re-melt applied to the previous pass has reduced the length
of the poorly fused area by 50 %, see arrow.
6.4.4 Temperature Distribution
The weld SA1 was monitored by thermocoupling. The data is presented as
Appendices VI and VII. The thermocouples were welded to the top and root sides of
the samples as Fig. 6.25 and Table 6.10.

301
Fig. 6.25 Thermocoupling of SA1, top side. Bottom similar.
Table 6.10 Thermocouple numbering SA1
TC Location Material
1-4 Root SA508
5-8 Root 316L
9-12 Top SA508
13-16 Top 316L
From the thermocoupling data, it can be seen that the samples need one hour for the
temperature to be fully soaked. The weld in question was pre-heated from the ferritic
steel side only. The data indicates that using this setup the asymmetric pre-heating
temperature evens out after just 3 passes. As the issues with the welding emerged
typically after 10 or more passes, the conclusion was that a single-sided pre-heating
did not produce benefits.
6.5 Analysis of Weldments
As with the previous dissimilar welds, the successful Stage III welds were subjected
to the industry-standard ASME IX radiographical acceptance. The radiographical
analysis was followed by cutting for contour method residual stress analysis. The
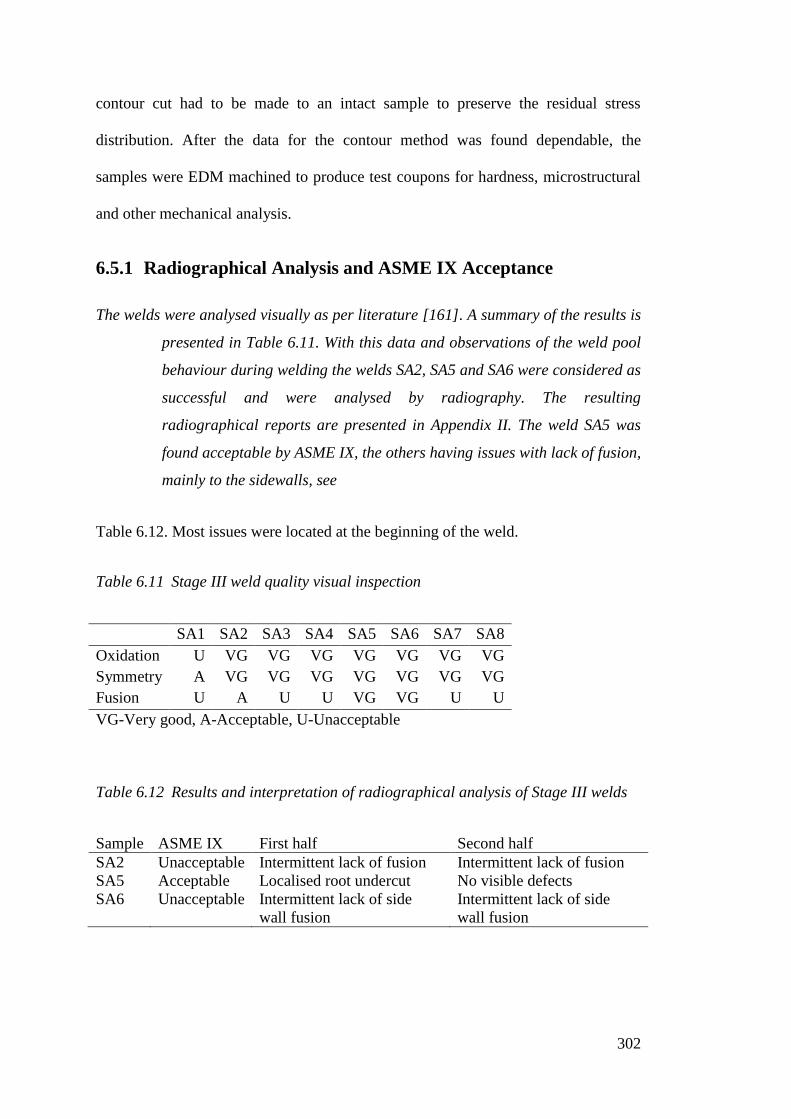
302
contour cut had to be made to an intact sample to preserve the residual stress
distribution. After the data for the contour method was found dependable, the
samples were EDM machined to produce test coupons for hardness, microstructural
and other mechanical analysis.
6.5.1 Radiographical Analysis and ASME IX Acceptance
The welds were analysed visually as per literature [161]. A summary of the results is
presented in Table 6.11. With this data and observations of the weld pool
behaviour during welding the welds SA2, SA5 and SA6 were considered as
successful and were analysed by radiography. The resulting
radiographical reports are presented in Appendix II. The weld SA5 was
found acceptable by ASME IX, the others having issues with lack of fusion,
mainly to the sidewalls, see
Table 6.12. Most issues were located at the beginning of the weld.
Table 6.11 Stage III weld quality visual inspection
SA1 SA2 SA3 SA4 SA5 SA6 SA7 SA8
Oxidation U VG VG VG VG VG VG VG
Symmetry A VG VG VG VG VG VG VG
Fusion U A U U VG VG U U
VG-Very good, A-Acceptable, U-Unacceptable
Table 6.12 Results and interpretation of radiographical analysis of Stage III welds
Sample ASME IX First half Second half
SA2 Unacceptable Intermittent lack of fusion Intermittent lack of fusion
SA5 Acceptable Localised root undercut No visible defects
SA6 Unacceptable Intermittent lack of side
wall fusion
Intermittent lack of side
wall fusion
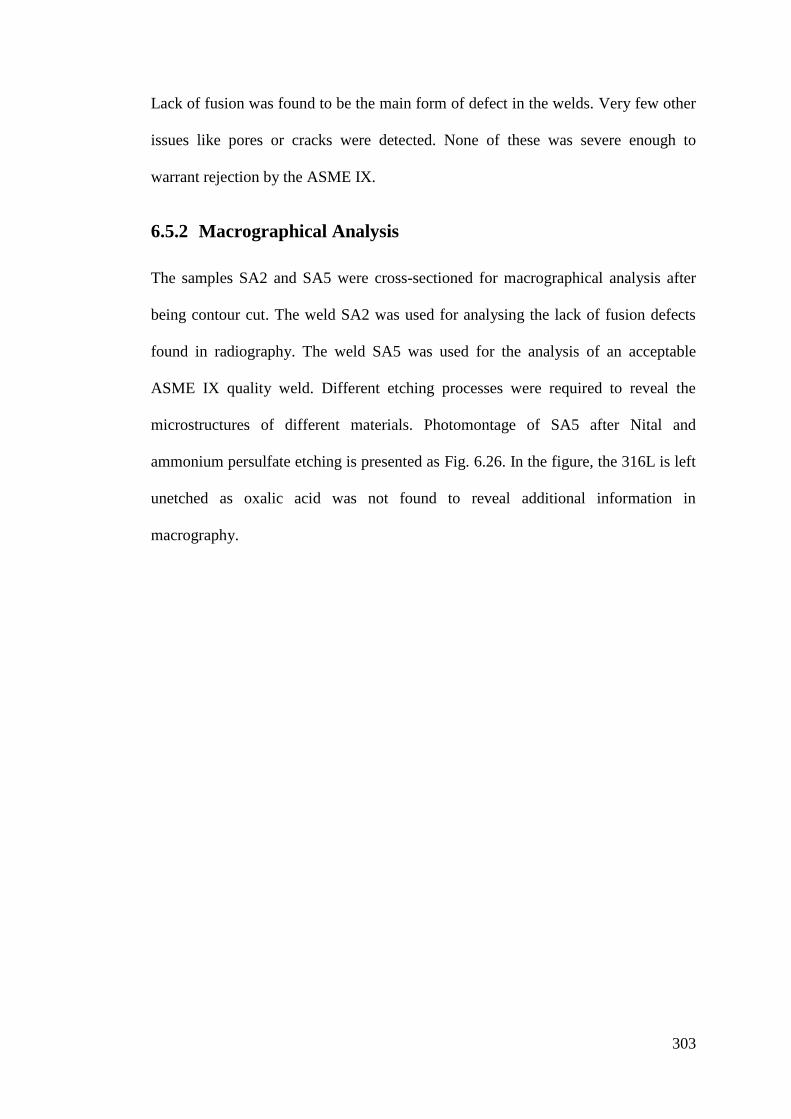
303
Lack of fusion was found to be the main form of defect in the welds. Very few other
issues like pores or cracks were detected. None of these was severe enough to
warrant rejection by the ASME IX.
6.5.2 Macrographical Analysis
The samples SA2 and SA5 were cross-sectioned for macrographical analysis after
being contour cut. The weld SA2 was used for analysing the lack of fusion defects
found in radiography. The weld SA5 was used for the analysis of an acceptable
ASME IX quality weld. Different etching processes were required to reveal the
microstructures of different materials. Photomontage of SA5 after Nital and
ammonium persulfate etching is presented as Fig. 6.26. In the figure, the 316L is left
unetched as oxalic acid was not found to reveal additional information in
macrography.
304
Fig. 6.26 Photomontage of Nital (for SA508) and ammonium persulfate (FM52)
etched weld cross-section. Sample SA5 161.
The main challenges in the welding were the propensity to lack of fusion and
undercutting of the stainless steel. These were found to be related to the welding
parameters used. The fusion results for each individual welding pass and parameters
can be interpreted from the cross-sectional macrographs. The fusion line shape will
correspond to the amount of undercut occurring.
6.5.2.1 SA2
To explain the resulting weld quality of each pass, the welding parameters used must
be known. The welding of SA2 is presented as an example. The fusion quality of
each pass was monitored during the welding process. Fusion to side walls was given
a score out of 50 where 50 indicates flawless fusion. A completely flat bead profile

305
would be graded as 0 and smooth stepless fusion as 50. A verbal comment was
added to address properties like the regularity of the fusion and the trend of change.
Undercutting of stainless steel was also monitored. The undercut was rated on a
similar scale, 0 indicating no undercut and 50 severe undercut bound to cause issues
later in the weld. For scale, a 1 mm deep undercut was considered detrimental and
graded 50.
An abridged presentation of the main welding parameters and the resulting weld
quality for each pass, as commented during welding, are presented as Table 6.13.
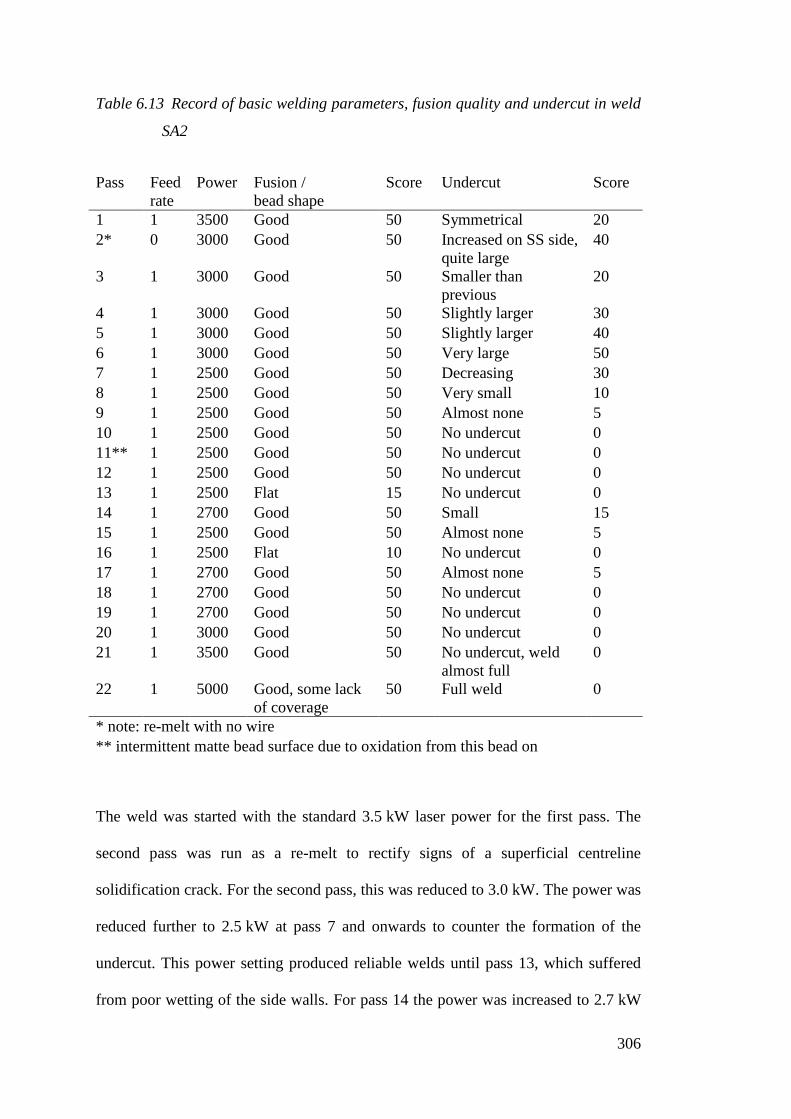
306
Table 6.13 Record of basic welding parameters, fusion quality and undercut in weld
SA2
Pass Feed
rate
Power Fusion /
bead shape
Score Undercut Score
1 1 3500 Good 50 Symmetrical 20
2* 0 3000 Good 50 Increased on SS side,
quite large
40
3 1 3000 Good 50 Smaller than
previous
20
4 1 3000 Good 50 Slightly larger 30
5 1 3000 Good 50 Slightly larger 40
6 1 3000 Good 50 Very large 50
7 1 2500 Good 50 Decreasing 30
8 1 2500 Good 50 Very small 10
9 1 2500 Good 50 Almost none 5
10 1 2500 Good 50 No undercut 0
11** 1 2500 Good 50 No undercut 0
12 1 2500 Good 50 No undercut 0
13 1 2500 Flat 15 No undercut 0
14 1 2700 Good 50 Small 15
15 1 2500 Good 50 Almost none 5
16 1 2500 Flat 10 No undercut 0
17 1 2700 Good 50 Almost none 5
18 1 2700 Good 50 No undercut 0
19 1 2700 Good 50 No undercut 0
20 1 3000 Good 50 No undercut 0
21 1 3500 Good 50 No undercut, weld
almost full
0
22 1 5000 Good, some lack
of coverage
50 Full weld 0
* note: re-melt with no wire
** intermittent matte bead surface due to oxidation from this bead on
The weld was started with the standard 3.5 kW laser power for the first pass. The
second pass was run as a re-melt to rectify signs of a superficial centreline
solidification crack. For the second pass, this was reduced to 3.0 kW. The power was
reduced further to 2.5 kW at pass 7 and onwards to counter the formation of the
undercut. This power setting produced reliable welds until pass 13, which suffered
from poor wetting of the side walls. For pass 14 the power was increased to 2.7 kW

307
to improve the wetting. Power had to be reduced back to 2.5 kW immediately to
counter emerging undercut. Power was increased again at pass 17 due to poor
wetting. Last filling pass using normal focal spot size was no. 20 and it was covered
by two passes with increased spot size.
Intermittent lack of fusion was found in SA2 in the radiographical analysis. No
cracking was reported. These results can be confirmed by the cross-sectional
samples. Nital was found to be the best etchant to show up the lack of fusion,
although the stainless steel fusion line is not visible, see SA2 98 presented as Fig.
6.27. The fusion issues detected are several interpass lack of fusion defects
beginning at pass no. 11, lack of fusion to both base materials at pass 17, lack of
fusion to SA508 at pass 19.
Fig. 6.27 Cross-section of an ASME IX rejected dissimilar metal weld showing
various fusion defects. Nital etch. 316L fusion line superimposed as dotted
line. Sample SA2 98

308
When comparing Table 6.13 and Fig. 6.27 several connections were made. The re-
melt pass was seen as a slight widening of the fusion zone above the first pass. The
interpass fusion issues found after pass 11 began at a point corresponding to
comments of the bead surface starting to show signs of excess accumulated
oxidation. The 16th
pass was noted to have a nearly flat bead shape, which resulted in
lack of fusion to the sidewalls during the following pass.
The interpass lack of fusion defects were concluded to have their origin in the
accumulation of oxides on the weld bead. No indications of fusion issues were
observed until several repetitions of individual welding passes and they appear
simultaneously with the first notes of signs of excess surface oxidation. As the best
available gas nozzle design was being used different gas flow rates were trialled to
counter this in subsequent welding trials. A significant improvement was also
achieved by reducing the accumulation of oxides by meticulous cleaning of each
pass with a wire brush.
A connection between poor wetting and lack of fusion to the sidewalls was observed.
Poor wetting caused square-cornered shape for the weld bead. The following pass
would not be able to penetrate and melt the extremes of the corners reliably. In SA2
the 16th
pass was found not to wet the sidewalls properly resulting in the 17th
pass
having lack of fusion to the side walls. As the radiographical report indicated that the
lack of fusion was intermittent, it is possible that the effects of a similar flat bead
shape at pass 13 were missed at the location of this particular cross-section.
The poor wetting observed in welding of SA2 was found to be related to too low
laser power. The limiting factor for laser power was the undercut generation in the
stainless steel. The laser power reduction at pass 7 was conducted after the undercut

309
was found to have increased to an unacceptable level. The reduction of power kept
the undercut well under control. However, when, at pass 14, the power was increased
by just 200 W to remedy the effect of poor wetting, the undercut began to increase
immediately.

310
6.5.2.2 SA5
For comparison, an ASME IX acceptable weld SA5 is presented. An abbreviated
version of the welding parameters and observations is presented as Table 6.14. The
macrograph of the weld is displayed as Fig. 6.28. The LAS HAZ in SA5 is more
uniform than in SA2 due to the welding parameters being kept more constant over
the progression of the weld.
Table 6.14 Record of basic parameters and fusion quality in test SA5
Pass Feed rate Power Fusion / wetting Score Undercut Score
1* 1 3500 Good 50 No undercut 0
2* 1 3250 Good 49 No undercut 0
3 1 3500 Good 50 No undercut 0
4 1 3500 Good 50 No undercut 0
5 1 3500 Good 50 No undercut 0
6 1 3500 Good 50 No undercut 0
7 1 3500 Good 50 No undercut 0
8 1 3500 Good 50 No undercut 0
9 1 3500 Good 50 No undercut 0
10 1 3500 Good 50 No undercut 0
11 1 3500 Good 50 No undercut 0
12 1 3500 Good 50 No undercut 0
13 1 3500 Good 50 No undercut 0
14 1 3500 Good 50 No undercut 0
15 1 3500 Good 50 No undercut 0
16 1 3500 Good 50 No undercut 0
17** 1 3500 Good 50 Small 15
18 1 3350 Poor 40 No undercut 3
19 1 3500 Acceptable 45 No undercut 0
20 1 3500 Good 49 No undercut 0
21 1.3 3800 Good 50 No undercut 0
* poor wetting for ~30 mm at the beginning
** shielding nozzle failure at the beginning of the weld
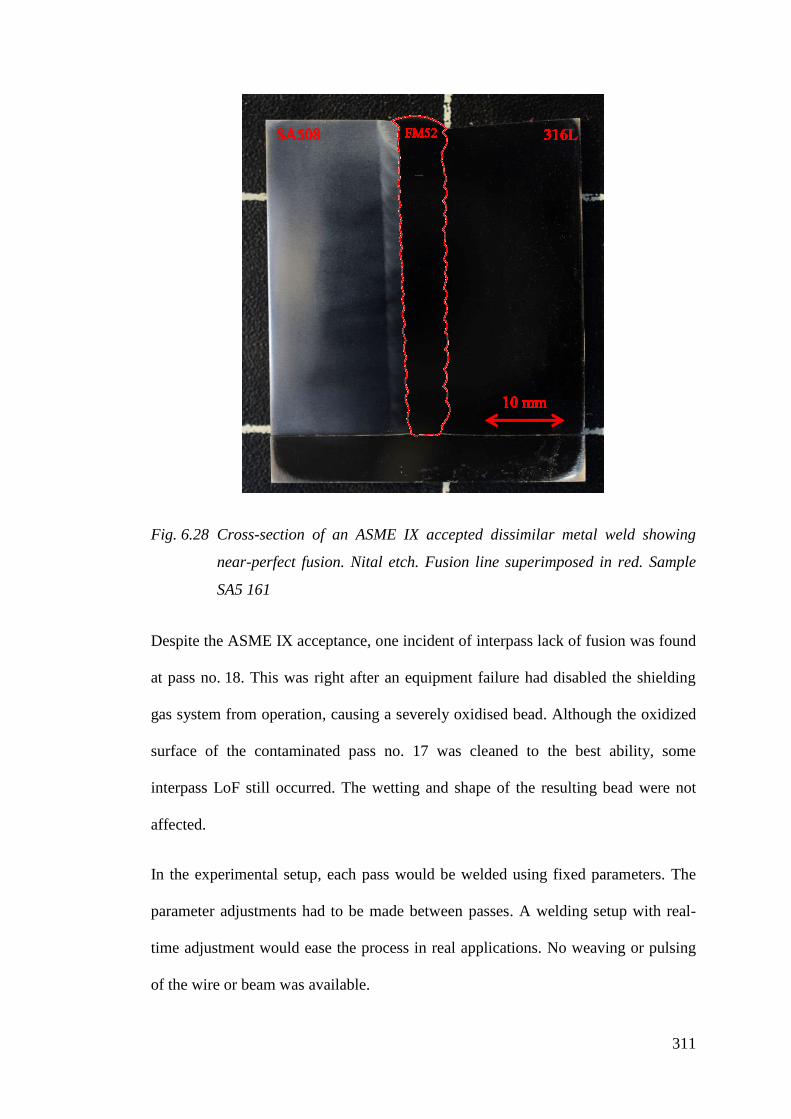
311
Fig. 6.28 Cross-section of an ASME IX accepted dissimilar metal weld showing
near-perfect fusion. Nital etch. Fusion line superimposed in red. Sample
SA5 161
Despite the ASME IX acceptance, one incident of interpass lack of fusion was found
at pass no. 18. This was right after an equipment failure had disabled the shielding
gas system from operation, causing a severely oxidised bead. Although the oxidized
surface of the contaminated pass no. 17 was cleaned to the best ability, some
interpass LoF still occurred. The wetting and shape of the resulting bead were not
affected.
In the experimental setup, each pass would be welded using fixed parameters. The
parameter adjustments had to be made between passes. A welding setup with real-
time adjustment would ease the process in real applications. No weaving or pulsing
of the wire or beam was available.
312
The weld SA2 shows the challenges involved in NGLW of dissimilar metals SA508
Gr2 Cl2 and 316L using FM52 filler. SA5 demonstrates that near-perfect fusion was
achieved. The main issue in the welding was lack of fusion. Two modes, LoF to the
base materials and interpass LoF were observed.
One major contributor to fusion challenges was found to be the propensity to
oxidation of the FM52 nickel alloy. Possible solutions include improving the gas
shielding and removing the accumulated oxide layer mechanically after each pass.
Another viable option is using FM52 only to the thickness considered necessary for
achieving desired corrosion properties and filling the rest of the weld using FM82.
Alloy 82 is much less prone to oxidation during welding. Although inferior in
corrosion resistance, Alloy 82 has very similar mechanical properties as the CTE to
Alloy 52 and would yield a mechanically similar weld.
6.5.3 Hardness Evaluation
Hardness testing was performed to assess the effect of NGLW on the hardness of the
dissimilar metal weld sample. Sample SA5 157 was hardness mapped using Vickers
method HV 0.3. The choice of Vickers load chosen was a compromise between the
sensitivity for small local variations in the material and minimum spacing of the
indents to achieve good resolution. A base grid of 2 x 2 mm was used to cover the
whole sample. The grid density of the map was increased to 0.4 x 1 mm at the areas
with steep gradients. The dense grid was used near and inside the fusion zone, where
hardening phenomena were expected. Base materials were of less interest and were
mapped mainly to provide large enough area of even hardness points to minimise
interpolation artefacts in the produced maps. The resulting hardness map for SA5
157 is presented as Fig. 6.29.

313
Fig. 6.29 Hardness map of SA5 157. SA508 on the left, FM52 middle and 316L
right. Approximate fusion line in red. (HV 0.3)
In a dissimilar metal weld, the opposing sides were known to generate very different
hardness profiles. For base materials, the highest hardness in SA508 was 275 HV
and for the 316L it was 175 HV. Significant hardening was found in SA508 heat
affected zone, the hardest single point measurement being 480 HV. This was reduced
by multi-pass tempering to 350 HV. The 316L HAZ was found to harden via strain
hardening to a maximum of 275 HV.
From the SA5 157 hardness profile, it can be seen that the high hardness HAZ is
2.4 mm wide. The area is very uniform along with the depth of the weld. The highest
hardness was measured only at a small area near the top of the weld. The area of
high hardness is only 3.5 mm deep, matching the HAZ caused by the last pass.
314
Two mechanisms leading to hardening were found. The ferritic steel hardened by
phase transformation hardening via the martensite reaction. This was found to
generate the highest hardness observed in the sample. The austenitic stainless steel
and the austenitic weld metal were hardened by strain hardening due to the stresses
generated by the contraction of the solidified but still cooling weld metal.
The increase in hardness in the SA508LAS HAZ was generated by the rapid cooling
initiating the martensite reaction in the LAS. A detailed map, see Fig. 6.30, using a
grid of 200 x 200 µm was generated to provide more precise information of the
extent of the hardening. The map was generated on the same sample previously
mapped with a less dense grid. Some points were manually offset to avoid previous
indents and discontinuities. Only the HAZ generated by the last pass was observed to
have high hardness, the HAZ of underlying passes having been tempered by the
subsequent welding passes, indicating an effective multi-pass tempering. One factor
contributing to different HAZ hardness near the top was that the last pass was
welded using a larger laser spot size and with higher power increasing the heat input.
This, however, does not manifest itself as widening of the HAZ in hardness or
microstructure as the hardened area is uniform up to the top surface of the sample.
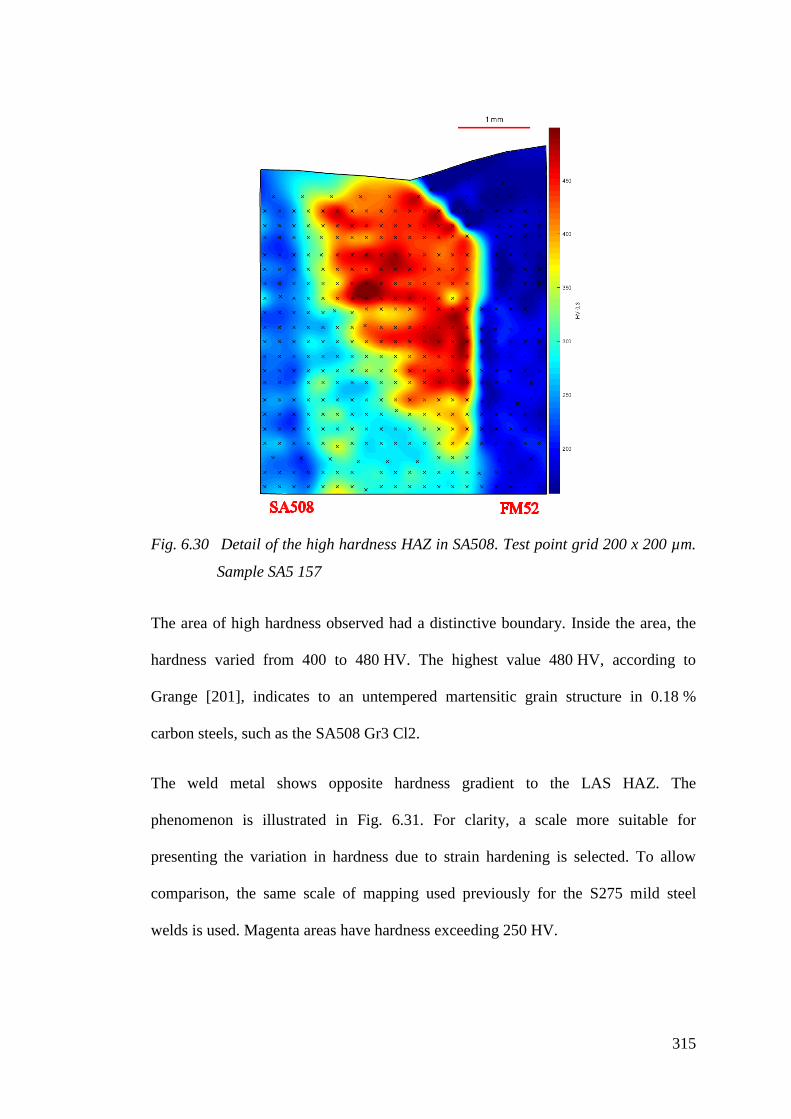
315
Fig. 6.30 Detail of the high hardness HAZ in SA508. Test point grid 200 x 200 µm.
Sample SA5 157
The area of high hardness observed had a distinctive boundary. Inside the area, the
hardness varied from 400 to 480 HV. The highest value 480 HV, according to
Grange [201], indicates to an untempered martensitic grain structure in 0.18 %
carbon steels, such as the SA508 Gr3 Cl2.
The weld metal shows opposite hardness gradient to the LAS HAZ. The
phenomenon is illustrated in Fig. 6.31. For clarity, a scale more suitable for
presenting the variation in hardness due to strain hardening is selected. To allow
comparison, the same scale of mapping used previously for the S275 mild steel
welds is used. Magenta areas have hardness exceeding 250 HV.
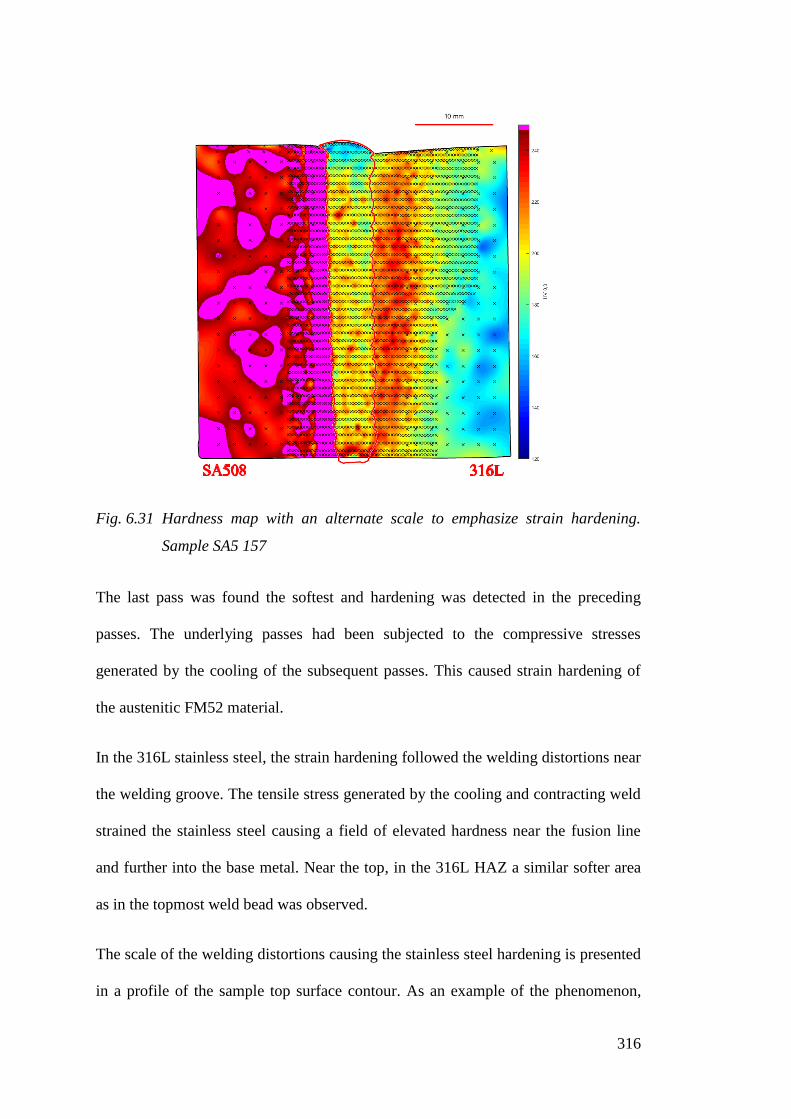
316
Fig. 6.31 Hardness map with an alternate scale to emphasize strain hardening.
Sample SA5 157
The last pass was found the softest and hardening was detected in the preceding
passes. The underlying passes had been subjected to the compressive stresses
generated by the cooling of the subsequent passes. This caused strain hardening of
the austenitic FM52 material.
In the 316L stainless steel, the strain hardening followed the welding distortions near
the welding groove. The tensile stress generated by the cooling and contracting weld
strained the stainless steel causing a field of elevated hardness near the fusion line
and further into the base metal. Near the top, in the 316L HAZ a similar softer area
as in the topmost weld bead was observed.
The scale of the welding distortions causing the stainless steel hardening is presented
in a profile of the sample top surface contour. As an example of the phenomenon,

317
Fig. 6.32 displays the local distortions on the top surface of the sample SA5 157. The
stainless steel was distorted in the vertical direction by 1.5 mm. The distortion spread
to at least the 17 mm area observed in the sample, gradually tapering off. The
amount of distortion in the much higher strength SA508 is negligible in comparison.
Fig. 6.32 Outline of top of the weld SA5.
6.5.4 Microstructural Analysis
Hardness analysis indicated considerable hardening in all three metals involved in
the weld. The grain structural changes in non-phase transforming austenitic materials
were diffusion and grain size analysis. The complicated thermal histories
experienced by the ferritic phase transformation hardened SA508 steel was predicted
to give more varied results.
The SA508 Gr3 Cl2 is a quenched and tempered alloy. The grain structure of the
base material is martensite with cementite precipitates, see Fig. 6.33.
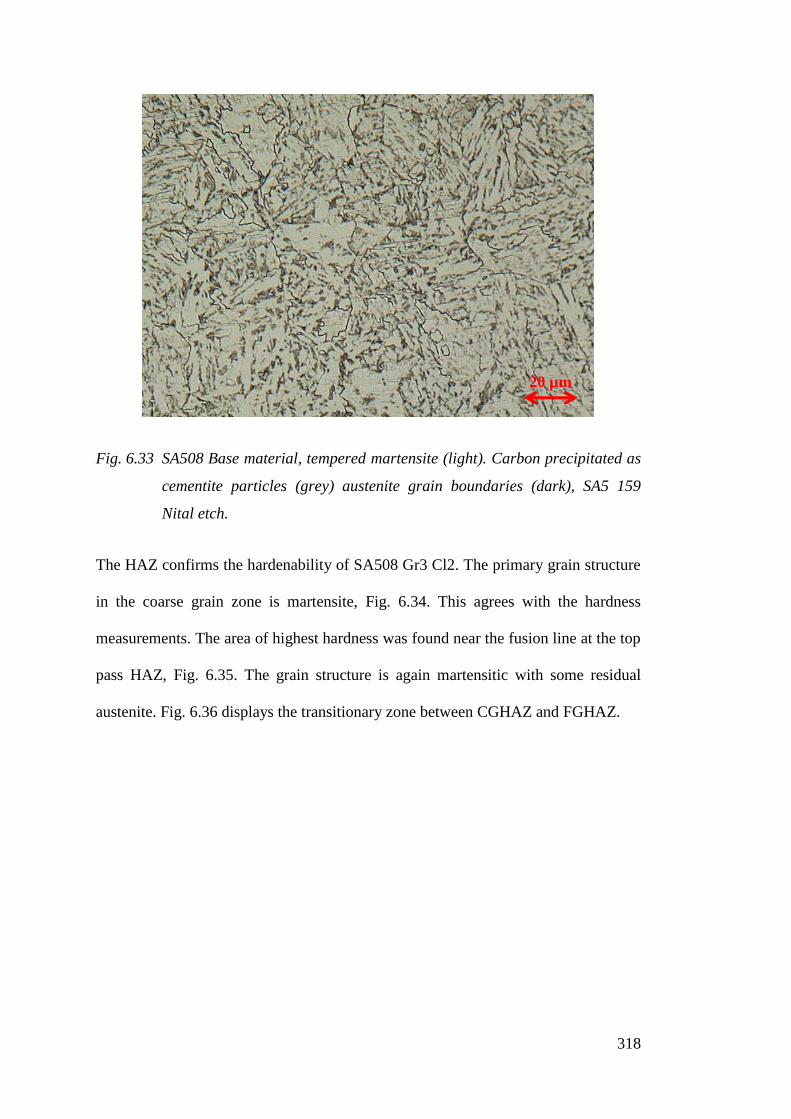
318
Fig. 6.33 SA508 Base material, tempered martensite (light). Carbon precipitated as
cementite particles (grey) austenite grain boundaries (dark), SA5 159
Nital etch.
The HAZ confirms the hardenability of SA508 Gr3 Cl2. The primary grain structure
in the coarse grain zone is martensite, Fig. 6.34. This agrees with the hardness
measurements. The area of highest hardness was found near the fusion line at the top
pass HAZ, Fig. 6.35. The grain structure is again martensitic with some residual
austenite. Fig. 6.36 displays the transitionary zone between CGHAZ and FGHAZ.
20 µm

319
Fig. 6.34 Martensitic (dark) HAZ with bainite (light) adjacent to FL of the top pass,
SA5 159 Nital etch.
Fig. 6.35 Martensitic/bainitic structure at the area of highest hardness, 200 µm
perpendicular) from FL, top pass, SA5 159 Nital etch.
20 µm
20 µm

320
Fig. 6.36 Transition from CGHAZ (right) to FGHAZ (left), approx. 1 mm from FL,
top pass, SA5 159 Nital etch.
In the FGZ the grain is very small, Fig. 6.37, and the hardness is still high. The
structure was a mixture of bainite and martensite. The IGHAZ is presented as
Fig. 6.38.
20 µm

321
Fig. 6.37 FGHAZ, approx. 1.5 mm from FL top pass, SA5 159 Nital etch.
The intercritical HAZ is displayed as Fig. 6.38
Fig. 6.38 ICHAZ, approx. 2 mm from FL, top pass, SA5 159 Nital etch.
20 µm
20 µm

322
The multi-pass tempering effect can best be seen in Fig. 6.39 as banding. The HAZ
caused by top pass is visible with much coarser grain structure.
Fig. 6.39 Vertical stitched image of SA508 HAZ. SA5 159 Nital etch.

323
The multi-pass effect is uniform through the thickness of the HAZ. No significant
visible change can be observed beyond three tempering cycles. The largest change is
caused by the first tempering as predicted by the hardness maps. Although the multi-
pass tempering produces a uniform structure in general, significant banding can be
observed. The fine spheroidised grain structure is banded by more coarse regions.
After two tempering cycles, the CGHAZ in the weld can be seen refined to a fine
equiaxial grain structure. The tempered SA508 HAZ is presented as Fig. 6.40. The
pictured location is the 7th
to the last pass, which has gone through 6 tempering
cycles by the overlaying passes. A significant change in microstructure in
comparison to the martensitic HAZ at top pass Fig. 6.34 can be seen. The grain is
small which suggests good impact toughness. Phase recognition was found
challenging as the tempering history was complex.
Fig. 6.40 Multi-pass tempered CGHAZ, 7th
to last pass, 15 mm from top, SA5 161
Nital etch.
20 µm

324
Using ammonium persulfate etching the weld metal microstructure was revealed.
The nickel Alloy 52 solidifies as austenite and there is no solid-state phase
transformation during cooling [75]. The microstructure of the weld metal was found
austenitic, with the distinct microstructure of fully austenitic Type A solidification.
Three main grain boundary types, solidification subgrain boundaries (SSGB),
solidification grain boundaries (SGB), Fig. 6.41 and migrated grain boundaries
(MGB), Fig. 6.42 and Fig. 6.43, were detected.
Fig. 6.41 Austenitic weld metal at 316L FL. 1) SSGB and 2) SGB. SA5 161
Ammonium persulfate etch.
1
2 100 µm
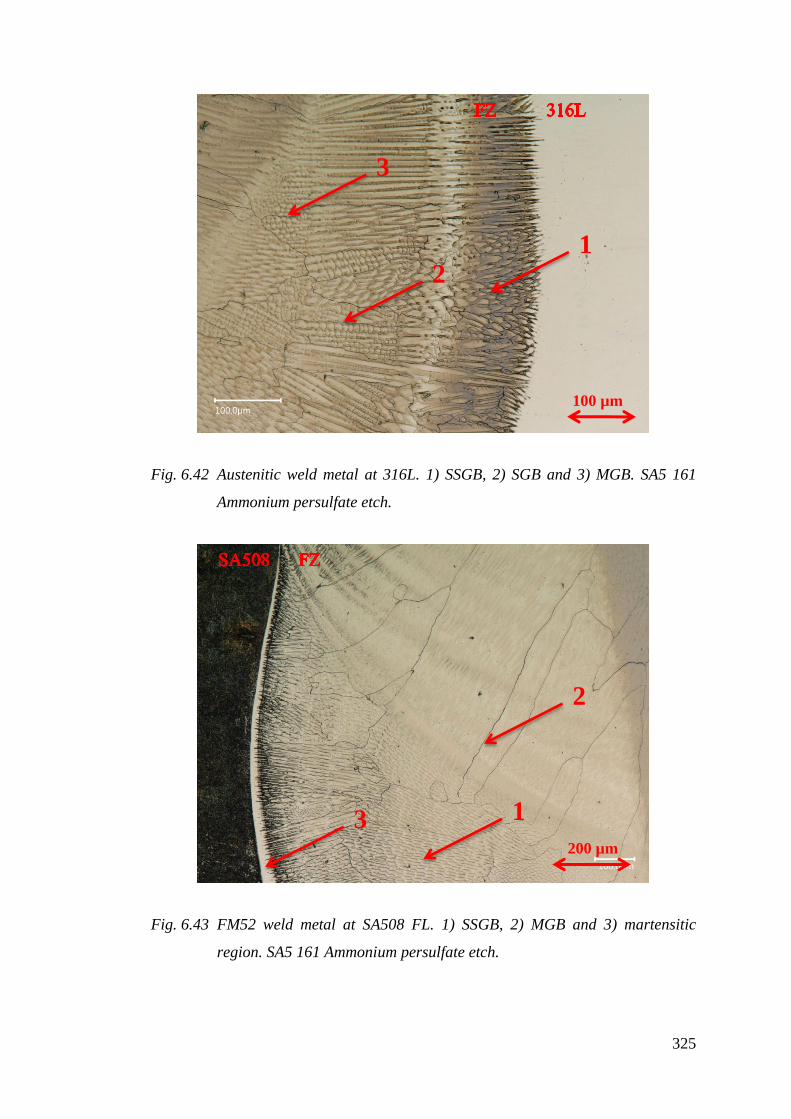
325
Fig. 6.42 Austenitic weld metal at 316L. 1) SSGB, 2) SGB and 3) MGB. SA5 161
Ammonium persulfate etch.
Fig. 6.43 FM52 weld metal at SA508 FL. 1) SSGB, 2) MGB and 3) martensitic
region. SA5 161 Ammonium persulfate etch.
2 1
3
1
2
100 µm
200 µm
3
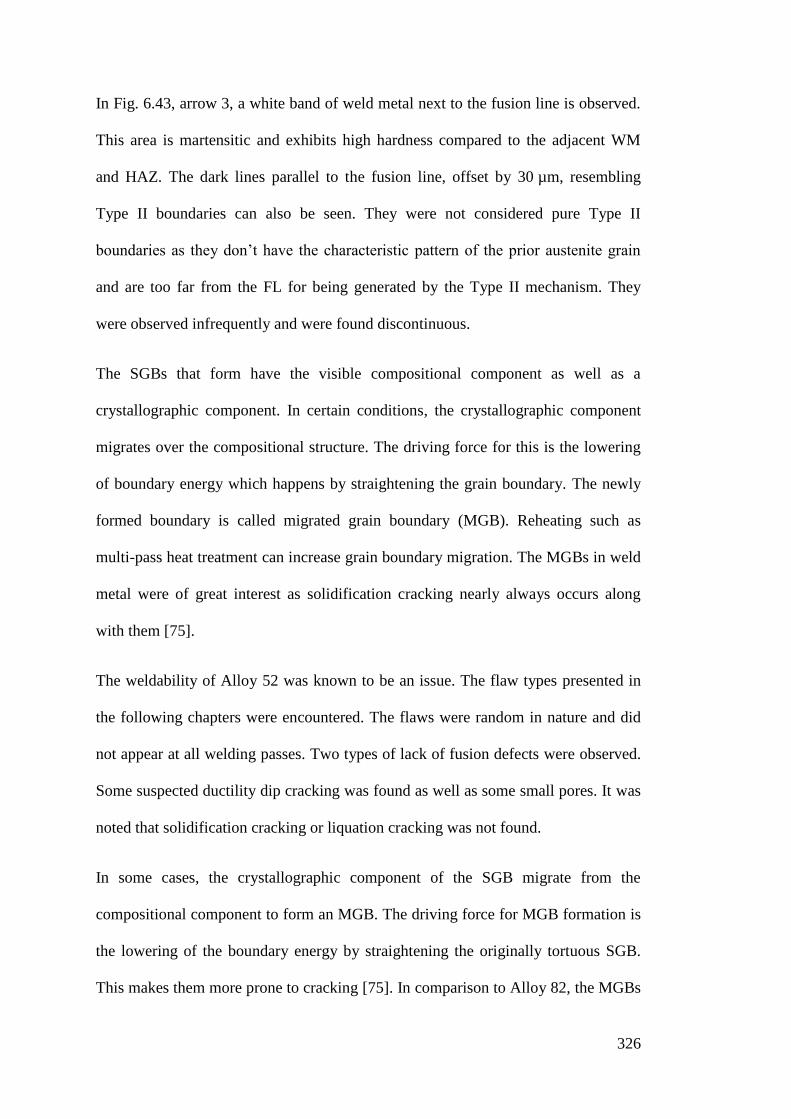
326
In Fig. 6.43, arrow 3, a white band of weld metal next to the fusion line is observed.
This area is martensitic and exhibits high hardness compared to the adjacent WM
and HAZ. The dark lines parallel to the fusion line, offset by 30 µm, resembling
Type II boundaries can also be seen. They were not considered pure Type II
boundaries as they don’t have the characteristic pattern of the prior austenite grain
and are too far from the FL for being generated by the Type II mechanism. They
were observed infrequently and were found discontinuous.
The SGBs that form have the visible compositional component as well as a
crystallographic component. In certain conditions, the crystallographic component
migrates over the compositional structure. The driving force for this is the lowering
of boundary energy which happens by straightening the grain boundary. The newly
formed boundary is called migrated grain boundary (MGB). Reheating such as
multi-pass heat treatment can increase grain boundary migration. The MGBs in weld
metal were of great interest as solidification cracking nearly always occurs along
with them [75].
The weldability of Alloy 52 was known to be an issue. The flaw types presented in
the following chapters were encountered. The flaws were random in nature and did
not appear at all welding passes. Two types of lack of fusion defects were observed.
Some suspected ductility dip cracking was found as well as some small pores. It was
noted that solidification cracking or liquation cracking was not found.
In some cases, the crystallographic component of the SGB migrate from the
compositional component to form an MGB. The driving force for MGB formation is
the lowering of the boundary energy by straightening the originally tortuous SGB.
This makes them more prone to cracking [75]. In comparison to Alloy 82, the MGBs

327
of the high chromium Alloy 52 are straighter which increases the susceptibility to
cracking [75]. At certain locations observations of MGB widening, suggesting DDC
were made. The worst cases found are presented in Fig. 6.44 and Fig. 6.45. The
images show the slight widening of some MGBs and no cracking of the SGBs. In
weld metal, DDC always occurs at MGBs, [200] ruling out the possibility of the
cracks being solidification cracking (hot tearing). Compared to examples in literature
[75], and the rarity of these findings in all the material observed, these findings were
not considered severe. The DDC was mainly found near the fusion boundaries,
which is consistent with the literature suggesting high restraint levels and thermal
tensile stresses during cooling contributing to susceptibility to DDC cracking [75].
Fig. 6.44 Suspected DDC (arrow) at MGB near 316L fusion line. SA5 161
Ammonium persulfate etch.
50 µm

328
Fig. 6.45 Suspected DDC in weld metal near SA508 fusion line with possible
recrystallization (arrow) SA5 161 Ammonium persulfate etch.
Local lack of fusion type defects were also found in weld SA5 in spite of
radiographical ASME IX acceptance. They are presented in Fig. 6.46 and Fig. 6.47.
The interpass LoF detected at the 18th
pass in weld SA5 was determined to be caused
by the excess oxidation in the previous pass caused by an equipment failure
interrupting the shielding gas flow mid weld. Sidewall LoF was found to have had its
origin in the square shape of the previous pass. The bottom of the defect was found
to coincidence with the corner. This can be seen in Fig. 6.46.
50 µm
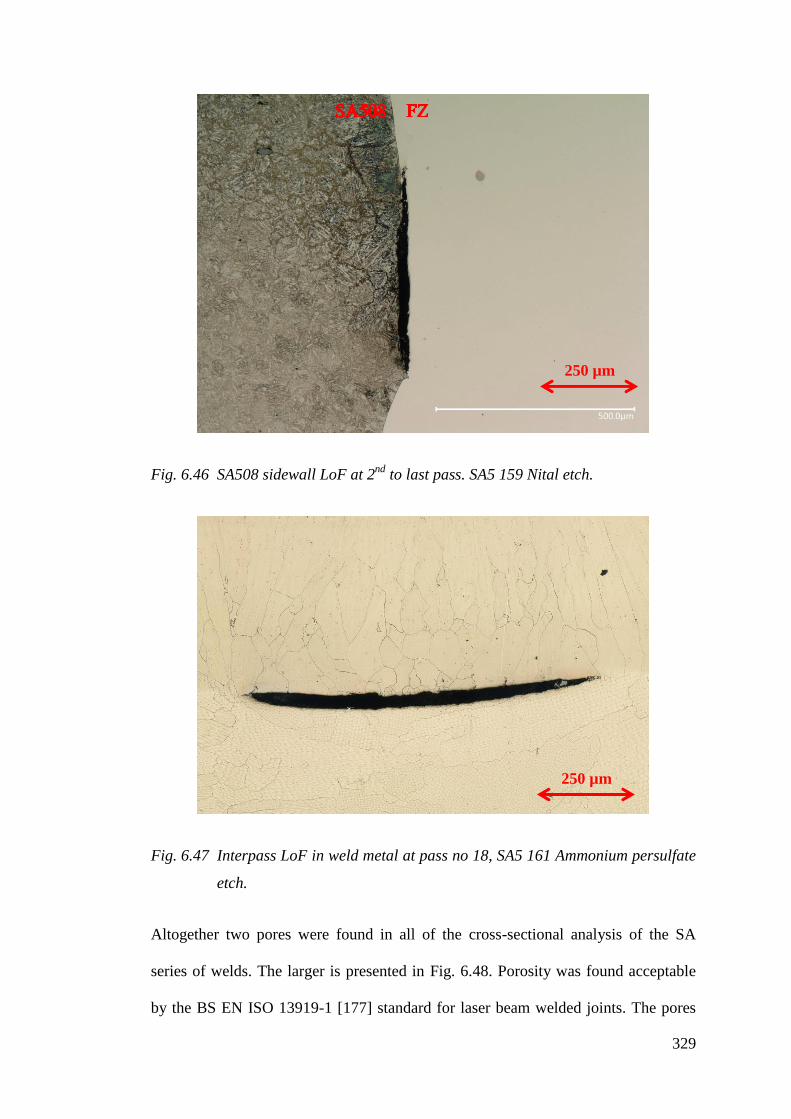
329
Fig. 6.46 SA508 sidewall LoF at 2nd
to last pass. SA5 159 Nital etch.
Fig. 6.47 Interpass LoF in weld metal at pass no 18, SA5 161 Ammonium persulfate
etch.
Altogether two pores were found in all of the cross-sectional analysis of the SA
series of welds. The larger is presented in Fig. 6.48. Porosity was found acceptable
by the BS EN ISO 13919-1 [177] standard for laser beam welded joints. The pores
250 µm
250 µm
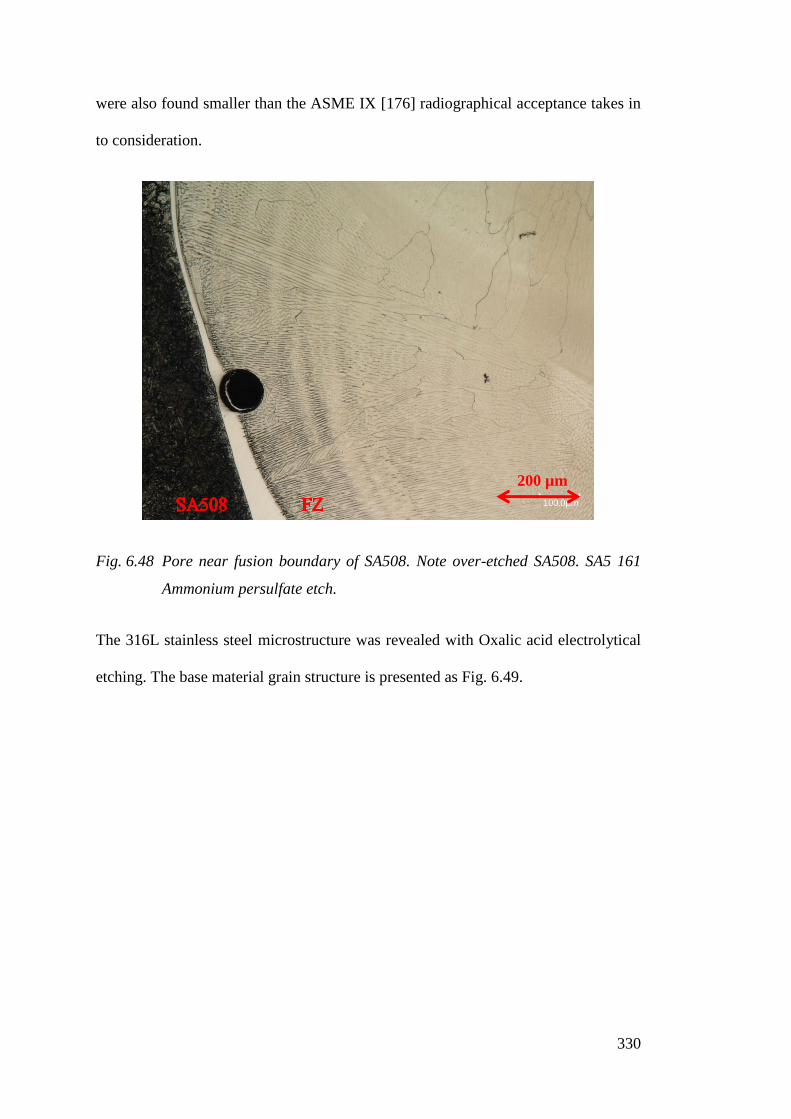
330
were also found smaller than the ASME IX [176] radiographical acceptance takes in
to consideration.
Fig. 6.48 Pore near fusion boundary of SA508. Note over-etched SA508. SA5 161
Ammonium persulfate etch.
The 316L stainless steel microstructure was revealed with Oxalic acid electrolytical
etching. The base material grain structure is presented as Fig. 6.49.
200 µm

331
Fig. 6.49 316L base material. Austenitic grain structure with δ-ferrite stringers in
rolling direction. SA5 159.
The ferrite distribution in the 316L base material was found uneven: the ferrite
stringers being absent from the top and bottom 3 mm. It was also found, that at some
locations the grain size was exceptionally large, see Fig. 6.50.
500 µm

332
Fig. 6.50 Local cluster of large grain in 316L base material. SA5 159 Oxalic acid
etch.
The austenitic steel HAZ was known to be susceptible to HAZ hot cracking. This
was observed at the surface, where solidification stresses and welding distortions
were the highest, see Fig. 6.51. No other cracking was observed.
300 µm

333
Fig. 6.51 Hot crack in 316L HAZ near the top SA5. Note heavily over-etched weld
metal SA5 159 Oxalic acid etch.
Where the δ-ferrite stringers were present; the fusion line had experienced skeletal
ferrite formation, see Fig. 6.52 and Fig. 6.53.
100 µm

334
Fig. 6.52 Intergranular ferrite formation at fusion line. SA5 159 Oxalic acid etch.
Fig. 6.53 Skeletal δ-ferrite formation at fusion boundary. SA5 159 Oxalic acid etch.
Overall grain size in 316L HAZ was very similar to the base material. Grain growth
was suspected to be partly limited by the ferrite formation.

335
6.5.5 Residual Stress Analysis
Samples of the SA pedigree series of welds were tested for residual stresses using the
contour method. The welds were analysed in the as welded condition and the results
were not affected by post weld heat treatment. As the contour method required an
intact sample, the selection was based on the radiographical analysis. The samples
selected were SA2 and SA5.
The contour cut was performed using EDM, see Fig. 6.54. The sample was
restrained in a jig during the cutting. The jig was designed not to input any external
forces on the sample, but to hold it stationary. The round marks left by the restraint
used during the cutting are visible on the surface.
Fig. 6.54 Sample SA5 showing the contour cut
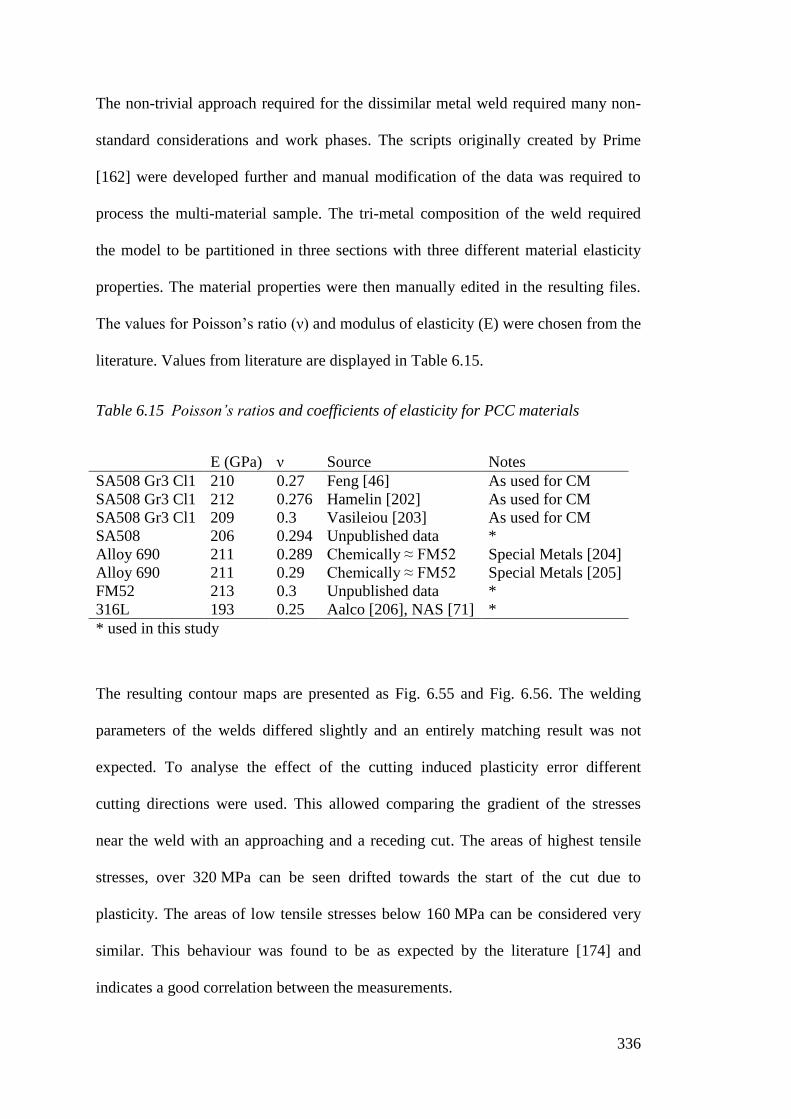
336
The non-trivial approach required for the dissimilar metal weld required many non-
standard considerations and work phases. The scripts originally created by Prime
[162] were developed further and manual modification of the data was required to
process the multi-material sample. The tri-metal composition of the weld required
the model to be partitioned in three sections with three different material elasticity
properties. The material properties were then manually edited in the resulting files.
The values for Poisson’s ratio (ν) and modulus of elasticity (E) were chosen from the
literature. Values from literature are displayed in Table 6.15.
Table 6.15 Poisson’s ratios and coefficients of elasticity for PCC materials
E (GPa) ν Source Notes
SA508 Gr3 Cl1 210 0.27 Feng [46] As used for CM
SA508 Gr3 Cl1 212 0.276 Hamelin [202] As used for CM
SA508 Gr3 Cl1 209 0.3 Vasileiou [203] As used for CM
SA508 206 0.294 Unpublished data *
Alloy 690 211 0.289 Chemically ≈ FM52 Special Metals [204]
Alloy 690 211 0.29 Chemically ≈ FM52 Special Metals [205]
FM52 213 0.3 Unpublished data *
316L 193 0.25 Aalco [206], NAS [71] *
* used in this study
The resulting contour maps are presented as Fig. 6.55 and Fig. 6.56. The welding
parameters of the welds differed slightly and an entirely matching result was not
expected. To analyse the effect of the cutting induced plasticity error different
cutting directions were used. This allowed comparing the gradient of the stresses
near the weld with an approaching and a receding cut. The areas of highest tensile
stresses, over 320 MPa can be seen drifted towards the start of the cut due to
plasticity. The areas of low tensile stresses below 160 MPa can be considered very
similar. This behaviour was found to be as expected by the literature [174] and
indicates a good correlation between the measurements.

337
Fig. 6.55 SA2 residual stress map
Fig. 6.56 SA5 residual stress map
A directly comparable study of residual stress formation in DMW was not found;
however, some comparisons were made. The distribution of the stress along the
thickness in the weld metal was found matching with findings by Kankanala
et al. 2011 [207], with a gradual increase from near zero level towards the top. They
studied ferritic austenitic dissimilar NG-GTAW using FM52 to for pipe form
samples of 40 mm wall thickness. The largest tensile hoop stress was 264 MPa. The
residual stress levels they reported were lower as the welds were in post weld heat
treated condition.
When compared to contour method analysis performed to pressuriser relief nozzles
from a cancelled power plant project by DeWald et al. [208] a similar concentration

338
of tensile stresses to the top or outer surface can be seen. These nozzles were made
by conventional MMA welding with Alloy 182 welding rod and were post weld heat
treated. The maximum tensile stresses were similarly inclined towards the stainless
steel and were approximately 300 MPa.
The maximum longitudinal tensile stresses in a GTAW DMW bead on plate study by
Kerr et al. [189] were found considerably higher. They reported tensile stresses up to
500 MPa using the contour method and neutron diffraction. The filler material was
Alloy82 and the base material 304L and the weld was investigated in as welded
condition.
A very good resolution of the decreasing tensile stress gradient (considering the
cutting direction) can be observed in both cases. The results from SA2 indicate a
steep gradient of the residual stress distribution at the SA508 material. The SA5 map
shows a gradual decrease of tensile stresses towards the 316L base material. The
sharp decrease of tensile stresses at the SA508 fusion line was attributed to the solid-
state phase transformation causing expansion of the LAS HAZ during cooling [209].
The expansion is due to the face centred cubic (FCC) crystal lattice austenite
transitioning to body centred cubic (BCC) allotropies, which causes an increase in
volume.
The sample SA5 was suspected to have slight corrosion due to water-based EDM
dielectric fluid. This was assumed to have contributed to an area lower tensile stress
in the results. This was later found to have cancelled during the averaging of the two
samples from the same cut. However, it was not entirely certain, as averaging only
filters out the expansion by corrosion if both samples have the same issue.
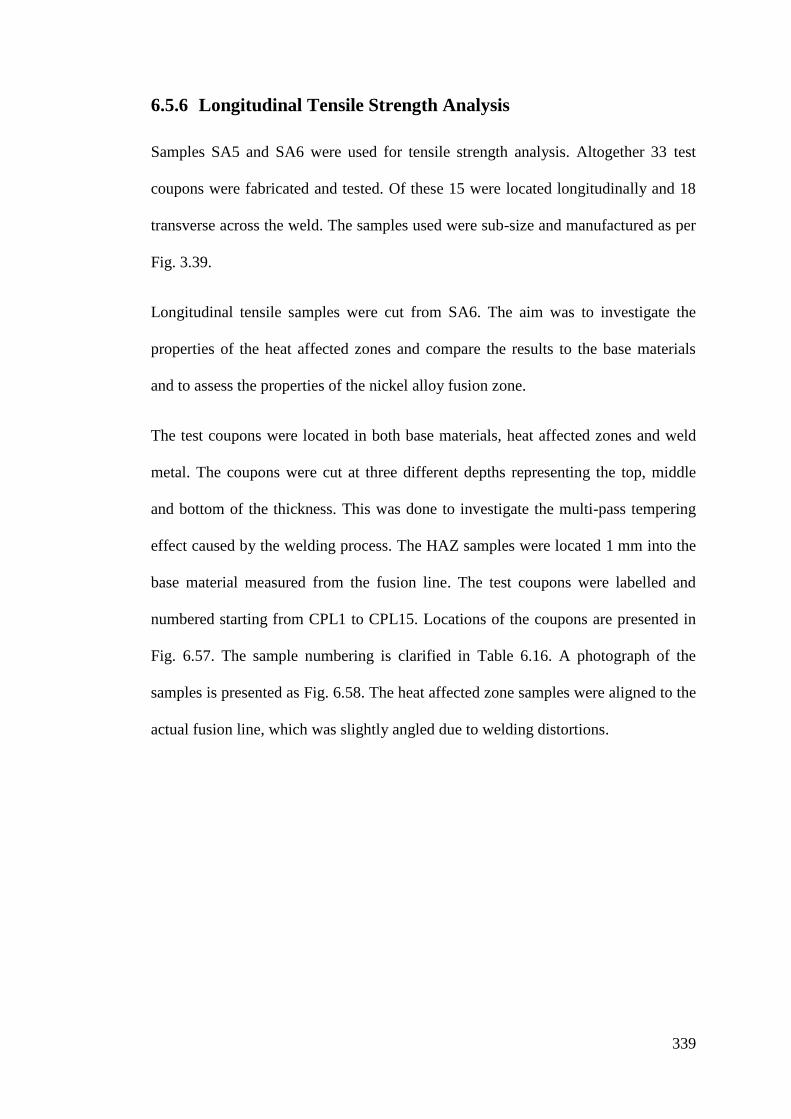
339
6.5.6 Longitudinal Tensile Strength Analysis
Samples SA5 and SA6 were used for tensile strength analysis. Altogether 33 test
coupons were fabricated and tested. Of these 15 were located longitudinally and 18
transverse across the weld. The samples used were sub-size and manufactured as per
Fig. 3.39.
Longitudinal tensile samples were cut from SA6. The aim was to investigate the
properties of the heat affected zones and compare the results to the base materials
and to assess the properties of the nickel alloy fusion zone.
The test coupons were located in both base materials, heat affected zones and weld
metal. The coupons were cut at three different depths representing the top, middle
and bottom of the thickness. This was done to investigate the multi-pass tempering
effect caused by the welding process. The HAZ samples were located 1 mm into the
base material measured from the fusion line. The test coupons were labelled and
numbered starting from CPL1 to CPL15. Locations of the coupons are presented in
Fig. 6.57. The sample numbering is clarified in Table 6.16. A photograph of the
samples is presented as Fig. 6.58. The heat affected zone samples were aligned to the
actual fusion line, which was slightly angled due to welding distortions.
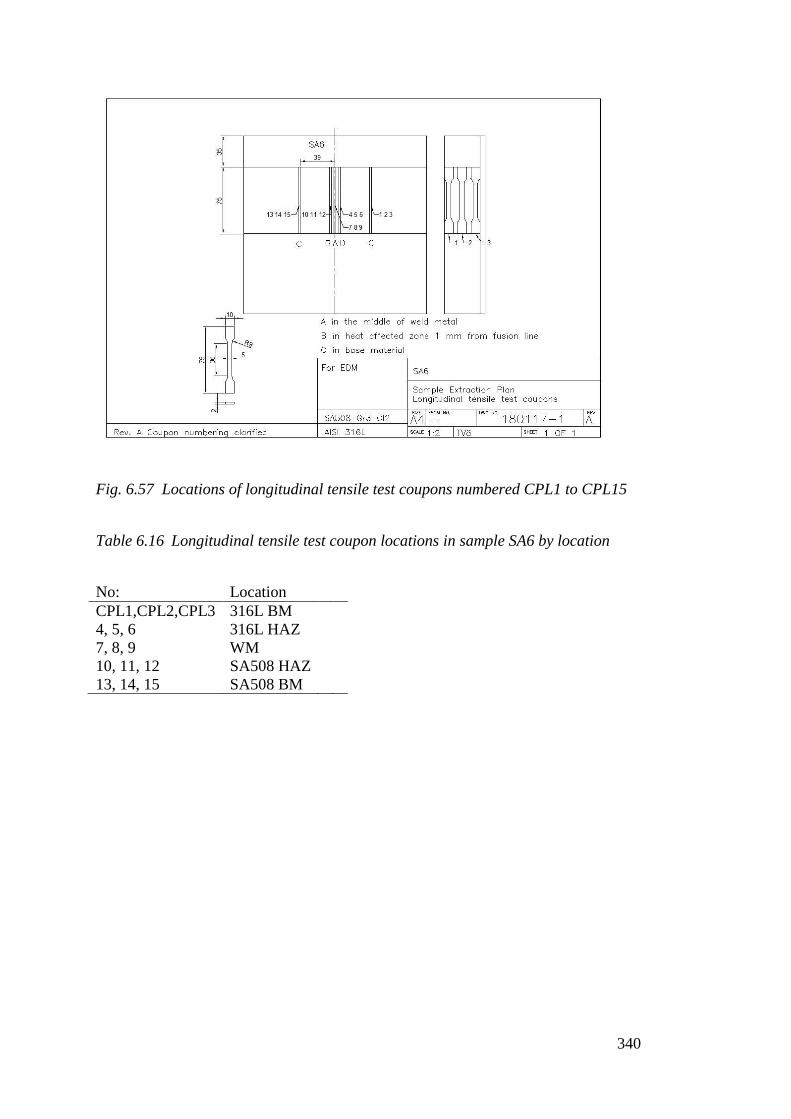
340
Fig. 6.57 Locations of longitudinal tensile test coupons numbered CPL1 to CPL15
Table 6.16 Longitudinal tensile test coupon locations in sample SA6 by location
No: Location
CPL1,CPL2,CPL3 316L BM
4, 5, 6 316L HAZ
7, 8, 9 WM
10, 11, 12 SA508 HAZ
13, 14, 15 SA508 BM
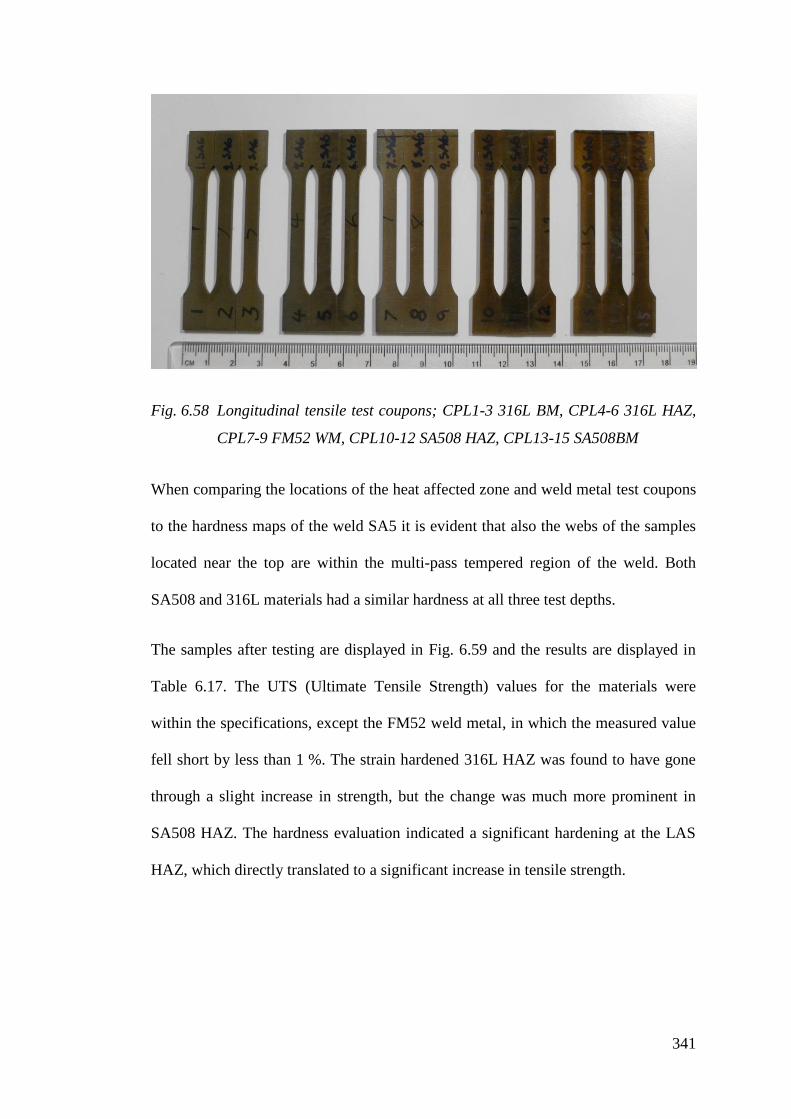
341
Fig. 6.58 Longitudinal tensile test coupons; CPL1-3 316L BM, CPL4-6 316L HAZ,
CPL7-9 FM52 WM, CPL10-12 SA508 HAZ, CPL13-15 SA508BM
When comparing the locations of the heat affected zone and weld metal test coupons
to the hardness maps of the weld SA5 it is evident that also the webs of the samples
located near the top are within the multi-pass tempered region of the weld. Both
SA508 and 316L materials had a similar hardness at all three test depths.
The samples after testing are displayed in Fig. 6.59 and the results are displayed in
Table 6.17. The UTS (Ultimate Tensile Strength) values for the materials were
within the specifications, except the FM52 weld metal, in which the measured value
fell short by less than 1 %. The strain hardened 316L HAZ was found to have gone
through a slight increase in strength, but the change was much more prominent in
SA508 HAZ. The hardness evaluation indicated a significant hardening at the LAS
HAZ, which directly translated to a significant increase in tensile strength.
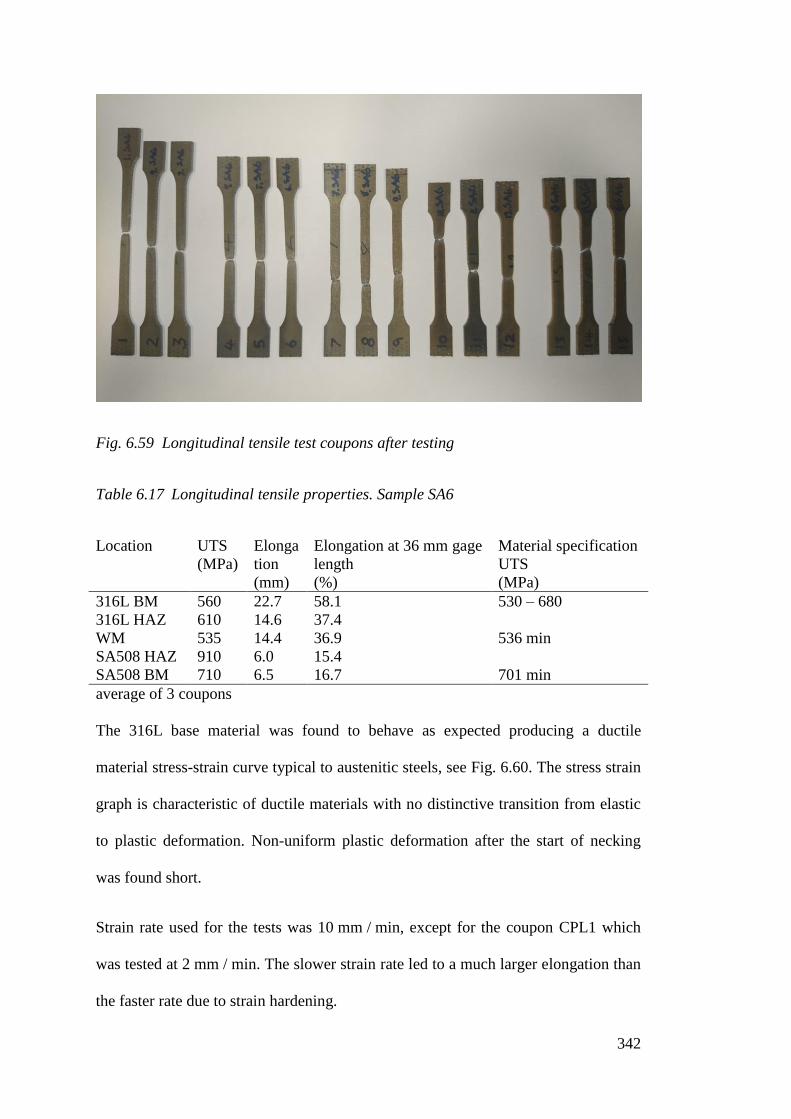
342
Fig. 6.59 Longitudinal tensile test coupons after testing
Table 6.17 Longitudinal tensile properties. Sample SA6
Location UTS
(MPa)
Elonga
tion
(mm)
Elongation at 36 mm gage
length
(%)
Material specification
UTS
(MPa)
316L BM 560 22.7 58.1 530 – 680
316L HAZ 610 14.6 37.4
WM 535 14.4 36.9 536 min
SA508 HAZ 910 6.0 15.4
SA508 BM 710 6.5 16.7 701 min
average of 3 coupons
The 316L base material was found to behave as expected producing a ductile
material stress-strain curve typical to austenitic steels, see Fig. 6.60. The stress strain
graph is characteristic of ductile materials with no distinctive transition from elastic
to plastic deformation. Non-uniform plastic deformation after the start of necking
was found short.
Strain rate used for the tests was 10 mm / min, except for the coupon CPL1 which
was tested at 2 mm / min. The slower strain rate led to a much larger elongation than
the faster rate due to strain hardening.

343
0 10 20 30 400
100
200
300
400
500
600
Str
ess (
MP
a)
Strain (mm)
CPL1
CPL2
CPL3
Fig. 6.60 316L BM stress-strain curves, test coupons CPL1 to 3
The 316L HAZ stress-strain curve is presented in Fig. 6.61. A more pronounced
yield point is present. Elongation is significantly reduced. Strength increases
averaging 610 MPa.
0 10 200
100
200
300
400
500
600
Str
ess (
MP
a)
Strain (mm)
CPL4
CPL5
CPL6
Fig. 6.61 316L HAZ stress-strain curves, test coupons CPL4 to 6
The ultimate tensile strength for Alloy 52 material is stated as 356 MPa, see Fig.
6.62. This was found slightly, although insignificantly, inferior in the actual weld

344
metal. The reasons for this may be the less than optimal heat treatment of the as
welded material and the inevitable dilution by the base materials.
0 10 200
100
200
300
400
500
600
Str
ess (
MP
a)
Strain (mm)
CPL7
CPL8
CPL9
Fig. 6.62 Filler Metal 52 weld metal stress-strain curves, test coupons CPL7 to 9
An area of significant interest in the DMW was the SA508 HAZ. This was found to
have gone through a substantial increase in strength, compare Fig. 6.63 and Fig.
6.64. This was supported by the fine grain microstructure found in metallography.
This also manifested itself as a substantial increase in hardness. Decrease of
plasticity as elongation was found small.
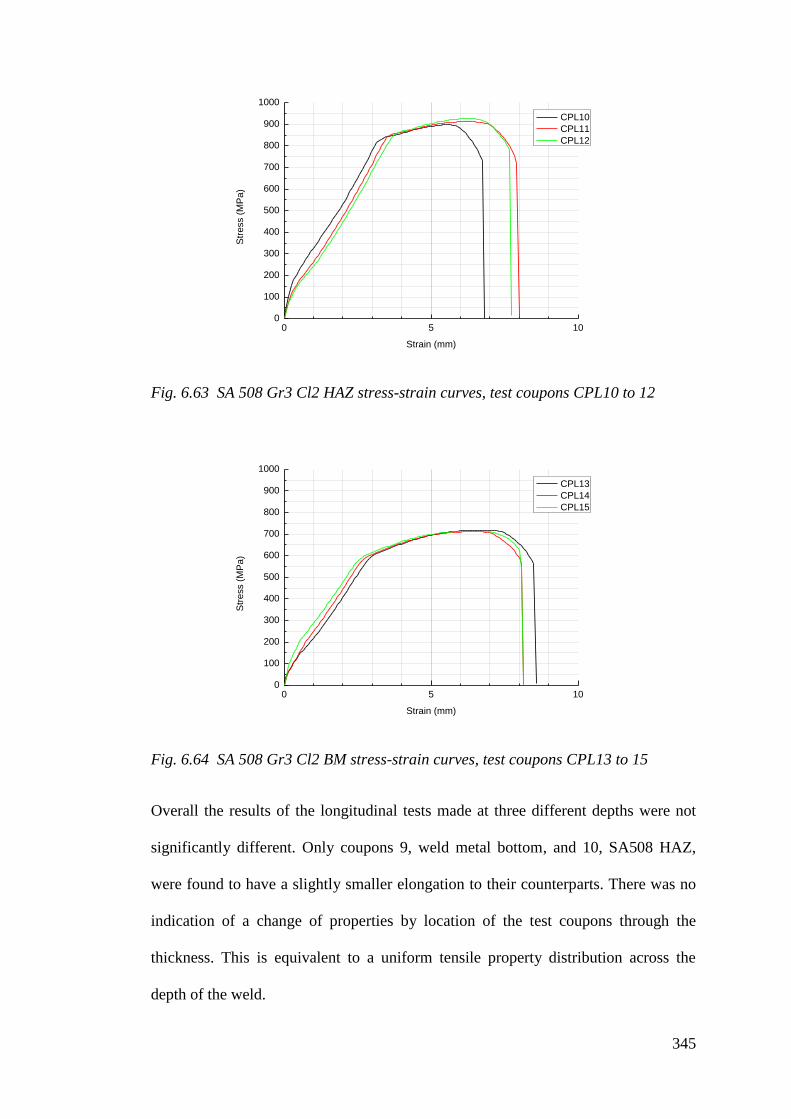
345
0 5 100
100
200
300
400
500
600
700
800
900
1000
Str
ess (
MP
a)
Strain (mm)
CPL10
CPL11
CPL12
Fig. 6.63 SA 508 Gr3 Cl2 HAZ stress-strain curves, test coupons CPL10 to 12
0 5 100
100
200
300
400
500
600
700
800
900
1000
Str
ess (
MP
a)
Strain (mm)
CPL13
CPL14
CPL15
Fig. 6.64 SA 508 Gr3 Cl2 BM stress-strain curves, test coupons CPL13 to 15
Overall the results of the longitudinal tests made at three different depths were not
significantly different. Only coupons 9, weld metal bottom, and 10, SA508 HAZ,
were found to have a slightly smaller elongation to their counterparts. There was no
indication of a change of properties by location of the test coupons through the
thickness. This is equivalent to a uniform tensile property distribution across the
depth of the weld.

346
6.5.7 Composite Tensile Analysis
In composite tensile tests, the aim was to establish the tensile strength of the weld as
a whole. Three coupons were cut at three different depths. Test coupons and their
locations are displayed in Fig. 6.65 and described in Table 6.18. The fractured
coupons are displayed in Fig. 6.66. The composite tests were compared to SA508
base material. The averaged results of the tests are displayed in Table 6.19.
Fig. 6.65 Charpy-V coupon and composite tensile test coupons CPT1-18 locations
in sample SA5
Table 6.18 Transverse tensile test locations
No: Location Depth
CPT1, CPT4, CPT7 Weld Top
2,5,8 Weld Mid
3,6,9 Weld Root
10,13,16 SA508 BM Top
11,14,17 SA508 BM Mid
12,15, 18 SA508 BM Root

347
Fig. 6.66 Composite (CPT1-9) and transverse 508 base material (CPT10-18) test
coupons, 316L steel top
Table 6.19 UTS and elongation of transverse tensile tests, SA5, average of 9
coupons
Location UTS
(MPa)
UTS
Max
UTS
Min
Elongation
(mm)
Elongation at 39 mm gage
length (%)
SA 508
BM
720 733 712 6.3 16.0
Composite 595 608 582 10.0 25.7
The variation of tensile properties was found to be small. The measured UTS of the
base material coupons were within 2.9 % of each other. For the composite samples,
the variation was 4.5 %. The fracture location was in the FM52 weld metal, except
samples 1 and 8, where the fracture occurred at the 316L stainless steel base
material. This variation can be expected as the nominal UTS of these materials are
similar.
The multi-pass tempering effect was investigated by comparing the top, middle and
bottom samples. The results are presented in Table 6.20. The variation in the
measurements was found too small to allow for judgements of benefits or drawbacks
of the multi-pass tempering effect. This agrees well with the hardness test results.

348
Table 6.20 Variation of transverse tensile properties according to location of the
sample, SA5
Location UTS
(MPa)
Elongation
(mm)
Elongation at 39 mm gage length
(%)
Composite Top 595 11.4 29.1
Composite Middle 600 11.0 28.1
Composite Bottom 585 11.1 28.5
BM Top 725 6.4 16.5
BM Middle 715 6.2 15.9
BM bottom 720 6.1 15.7
Average of 3 coupons
The stress-strain graphs for the composite tensile tests are presented in Fig. 6.67, Fig.
6.68 and Fig. 6.69.
0 5 10 150
100
200
300
400
500
600 CPT1
CPT2
CPT3
Str
ess (
MP
a)
Strain (mm)
Fig. 6.67 Composite test stress-strain curves, test coupons CPT1 to 3.

349
0 5 10 150
100
200
300
400
500
600 CPT4
CPT5
CPT6
Str
ess (
MP
a)
Strain (mm)
Fig. 6.68 Composite test stress-strain curves, test coupons CPT4 to 6.
0 5 10 150
100
200
300
400
500
600
Str
ess (
MP
a)
Strain (mm)
CPT7
CPT8
CPT9
Fig. 6.69 Composite test stress-strain curves, test coupons CPT7 to 9.
For comparison, the transverse direction stress-strain curve of the SA508 base
material is provided as Fig. 6.70. The 9 BM tests conducted display very consistent
results and are in accordance with the previous longitudinal analysis.

350
0 5 10 150
100
200
300
400
500
600
700
800
Str
ess (
MP
a)
Strain (mm)
CPT10
CPT11
CPT12
CPT13
CPT14
CPT15
CPT16
CPT17
CPT18
Fig. 6.70 Transverse 508 BM test stress-strain curves, test coupons CPT10 to 18.
6.5.8 Digital Image Correlation Analysis
DIC analysis was conducted on the tensile test samples for strain localisation
mapping for the composite tests. Most composite samples failed at the weld metal,
which was expected as the FM52 nickel alloy had the lowest UTS of the materials
involved refer to longitudinal test results in Table 6.17. During the composite tensile
testing 7 of the 9 tested samples failed at the middle of the weld metal.
The minimum stated yield strength for both FM52 and 316L is 240 MPa. In the
coupons failing at the nickel weld metal a considerable amount of strain was
observed also at the stainless steel. In all these cases the first area to yield was the
stainless steel, which then work hardened and caused the ultimate failure to occur at
the weld metal. Fig. 6.71 displays this behaviour. In Fig. 6.71 A, the first indications
of strain are observed. At first, the strain is entirely in the 316L base material. The
next stage is when the weld metal starts yielding more than the stainless, see Fig.
6.71 B. These stages fluctuated, both materials straining in turn. Fig. 6.71 C is the
point just before breakage when the yielding has transferred entirely to the weld

351
metal. The 316L part of the coupon was found to neck in width by 0.90 mm (18 %)
without failure. No measurable necking was observed in SA508 portion of the
coupons, which was due to the yield strength of SA508 (600 MPa) being higher than
the UTS of the austenitic materials.
Fig. 6.71 Strain localisation images for composite tensile test SA5, coupon 5.
Stainless steel at bottom.
Samples 1 and 8 failed at the 316L stainless steel. Sample 1 was located near the top
and subjected to a higher than average heat input due to the capping passes being
welded at the top. The sample 8 was located in the middle of the thickness and was
representative of an average heat cycle. The small number of samples did not allow
for further conclusions to be made of the origin of this behaviour. A three-stage
description of the strain history of Sample 8 is presented in Fig. 6.72. The stainless
steel yields first Fig. 6.72 A. This is followed by a stage where both the 316L and
weld metal strain, Fig. 6.72 B. Towards the end of the test, the already heavily
deformed weld metal hardens and seizes to yield, Fig. 6.72 C. A detail showing the
considerable deformation of the weld metal is displayed as Fig. 6.73. The weld metal
was found necked by 0.45 mm or 9 % in width.
A B C

352
Fig. 6.72 Strain localisation images for composite tensile test SA5, coupon 8.
Stainless steel at bottom.
Fig. 6.73 Deformation of the fusion zone in SA5, coupon 8, arrow
6.5.9 Impact Toughness Analysis of SA508 Base Material
The HAZ of ferritic steel weld is susceptible to embrittlement via phase
transformation hardening. Therefore the emphasis of the fracture toughness tests was
on examining the SA508 and its heat affected zone. Two sets of test coupons were
EDM machined to allow comparison between the SA508 HAZ and the SA508 base
material. The test coupons were standard size according to ASTM E23 [199] and
ISO 148-7:2016 [178]. First set of samples, numbered from 1 to 9 were machined
from the base material of the sample. The HAZ samples were aligned perpendicular
to the LAS fusion line and the V-notches were aligned 1 mm into the BM from the
fusion line. This was to provide the crack propagation start in the coarse grain zone
A B C
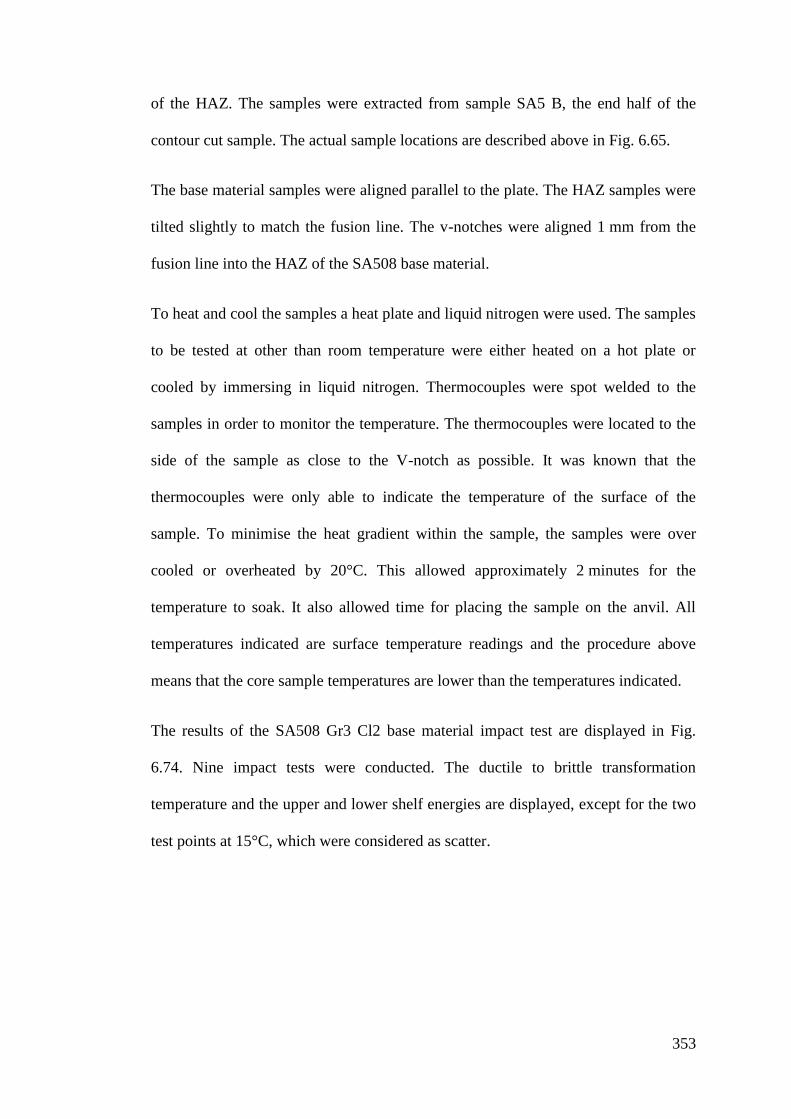
353
of the HAZ. The samples were extracted from sample SA5 B, the end half of the
contour cut sample. The actual sample locations are described above in Fig. 6.65.
The base material samples were aligned parallel to the plate. The HAZ samples were
tilted slightly to match the fusion line. The v-notches were aligned 1 mm from the
fusion line into the HAZ of the SA508 base material.
To heat and cool the samples a heat plate and liquid nitrogen were used. The samples
to be tested at other than room temperature were either heated on a hot plate or
cooled by immersing in liquid nitrogen. Thermocouples were spot welded to the
samples in order to monitor the temperature. The thermocouples were located to the
side of the sample as close to the V-notch as possible. It was known that the
thermocouples were only able to indicate the temperature of the surface of the
sample. To minimise the heat gradient within the sample, the samples were over
cooled or overheated by 20°C. This allowed approximately 2 minutes for the
temperature to soak. It also allowed time for placing the sample on the anvil. All
temperatures indicated are surface temperature readings and the procedure above
means that the core sample temperatures are lower than the temperatures indicated.
The results of the SA508 Gr3 Cl2 base material impact test are displayed in Fig.
6.74. Nine impact tests were conducted. The ductile to brittle transformation
temperature and the upper and lower shelf energies are displayed, except for the two
test points at 15°C, which were considered as scatter.

354
-30 -20 -10 0 10 20 3030
40
50
60
70
80
90
100
I
H
G
F
E
DC
B
Impact
Energ
y (
J)
Test Temperature (°C)
A
Fig. 6.74 SA508 base material Charpy-V impact energy, J
The change in the proportion of ductile shear fracture can be seen in Fig. 6.75.
Samples are displayed in rising order of temperature. Samples A to D located at the
lower shelf of the ductile to brittle transition curve. The fracture mode is almost
entirely brittle with a characteristic flat surface and very little necking of the sample.
Sample E shows a significant increase in the ductile fraction of the fracture area as it
approaches the upper shelf of the transition diagram. Ductile fracture is
characteristically more uneven and the necking observed in samples is significant.
Samples F and G are located on the upper shelf of energy and considered ductile.

355
Fig. 6.75 SA508 Base material fracture surfaces. A – D, G and H brittle fracture, E
transition and I ductile facture
The scattered nature of the Charpy test results is observed in samples G and H,
which were found brittle at near room temperature, where adjacent samples F and I
A B
I
F E
D C
G H
5 mm

356
were found ductile. The reasons for that were concluded to be involved with the
suspected material flaw in sample H and the temperature measurement inability to
represent the core temperature as the thermocouple location was on the surface of the
sample. Impact energies and the proportion of ductile fracture are displayed in Table
6.21.
Table 6.21 Impact energies and proportion of ductile fracture in SA508 Charpy-V
tests
Temp
(°C)
Impact energy
(J)
Proportion of
ductile fracture
(%)
Notes
A -30 37 2.1
B -20 42 2.4
C 0 52 4.4
D +5 54 5.3
E +7.5 73 14.7
F +10 83 18.4
G +15 61 2.2
H +15 43 4.3 suspected inclusion / discontinuity
I +22.5 92 29.1
For comparison, ASME A508/A508M – 17 specification for Gr3 Cl2 [67] is
minimum 48 J at 21°C as average of three, minimum single measurement 41 J. The
material certificate specifies values of three samples of the SA508 material used,
which were 46 J, 66 J and 84 J, at room temperature, see material certificate in
Appendix IV.
The fracture mode was further examined using SEM. In the SA508 base material, the
ductile and brittle fracture areas had a clear distinction. The ductile area had the
typical morphology, see Fig. 6.76, with spherical dimples caused by the tensile load
near the Charpy notch. The brittle fracture, Fig. 6.77, area had the characteristic

357
morphology of the cleavage mechanism. The SEM analysis confirmed the findings
of the optical microscopy.
Fig. 6.76 Ductile fracture area in SA508 base material, 400x, 1000x and 5000x
magnification, sample F

358
Fig. 6.77 Brittle fracture area in SA508 base material, 400x, 1000x and 5000x
magnification, sample F
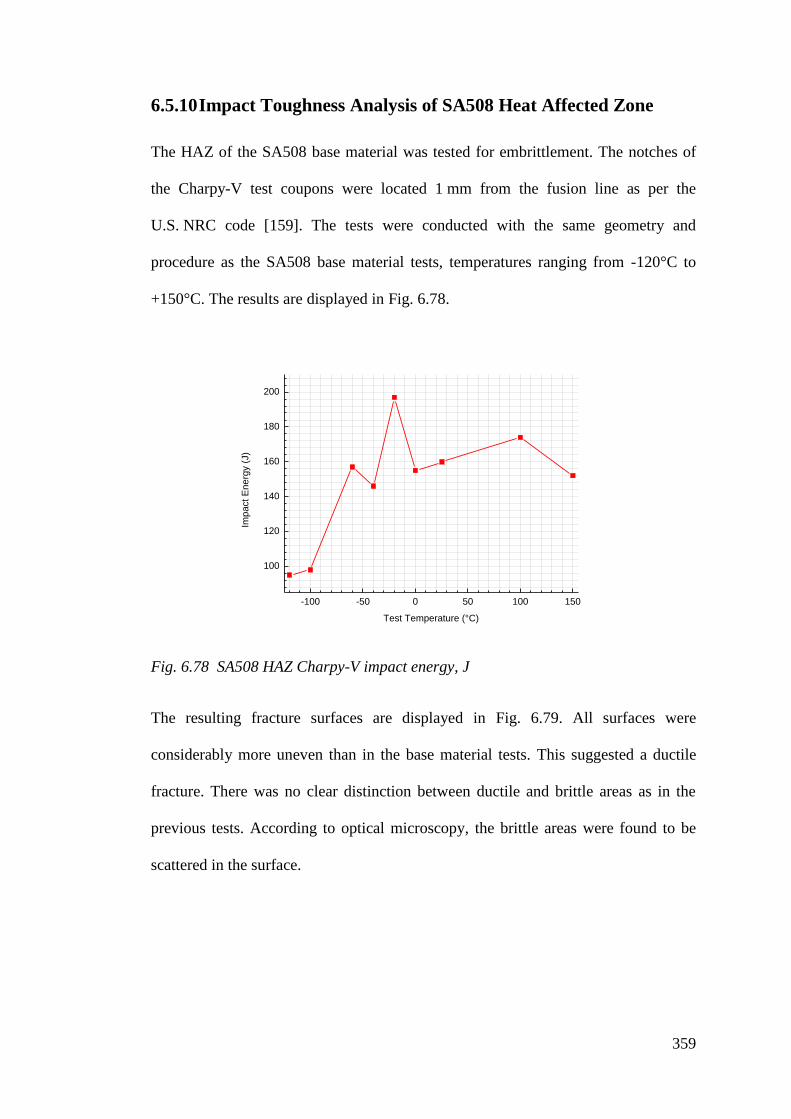
359
6.5.10 Impact Toughness Analysis of SA508 Heat Affected Zone
The HAZ of the SA508 base material was tested for embrittlement. The notches of
the Charpy-V test coupons were located 1 mm from the fusion line as per the
U.S. NRC code [159]. The tests were conducted with the same geometry and
procedure as the SA508 base material tests, temperatures ranging from -120°C to
+150°C. The results are displayed in Fig. 6.78.
-100 -50 0 50 100 150
100
120
140
160
180
200
Imp
act
Ene
rgy (
J)
Test Temperature (°C)
Fig. 6.78 SA508 HAZ Charpy-V impact energy, J
The resulting fracture surfaces are displayed in Fig. 6.79. All surfaces were
considerably more uneven than in the base material tests. This suggested a ductile
fracture. There was no clear distinction between ductile and brittle areas as in the
previous tests. According to optical microscopy, the brittle areas were found to be
scattered in the surface.

360
Fig. 6.79 SA508 HAZ fracture surfaces. A and B brittle, C to I ductile.
Judging the fracture mode was found less obvious in the HAZ tests than the base
material. Samples A and B which were tested at the lowest temperatures had
significantly lower impact energy than the rest. The difference between B and C was
37.6 %. Necking of the surface was also considerable in C – I, which were tested at -
60°C and above. One significant change was also that the sample halves did not
separate in the higher impact energy tests, see Table 6.22. SEM was used to analyse
the fracture mechanisms in more detail.
A
D
C B
E F
G H I
5 mm

361
Table 6.22 Impact energies and proportion of ductile fracture in SA508 HAZ
Charpy-V tests
Sample A B C D E F G H I
Temperature (°C) -120 -100 -60 -40 -20 0 25.3 100 150
Impact energy (J) 95 98 157 146 197 155 160 174 152
Separation of samples Yes Yes No No No No No No No
To confirm the results of the optical analysis, the SA508 HAZ fracture surfaces were
analysed by SEM. The high-temperature samples are represented by images from the
room temperature Sample G, Fig. 6.80. The fracture was found to be entirely ductile.
362
Fig. 6.80 SEM images of ductile fracture. 400x, 1000x and 5000x magnification,
Sample G

363
Sample C, partially presented in Fig. 6.81, was the lowest temperature sample with
high impact energy. The morphologies are much less obvious than in the base
material tests. The increase of brittle fracture in the area below the red line was
confirmed by higher magnification SEM. The images are presented in Fig. 6.82 and
Fig. 6.83.
Fig. 6.81 SEM image of Sample C, low magnification

364
Fig. 6.82 SEM images of Sample C. 400x, 1000x and 5000x magnification, ductile
area

365
Fig. 6.83 SEM images of Sample C. 400x, 1000x and 5000x magnification, brittle
area

366
Results for the brittle sample A is presented in Fig. 6.84. The fracture surface
morphologies were more varied, with less clear distinction of ductile or brittle areas.
Fig. 6.84 SEM images of HAZ Sample A, three different locations A, B and C. 400x,
1000x and 5000x magnification.
The SEM for sample A, location A shows some “cup and cone” morphology due to
ductile tensile loading but also the “river pattern” of a brittle structure. The location
D has indications of parabolic dimples, an indication of shear loading. However, the
majority of the fracture surface of sample A was like the location G, a fine brittle
structure.
The main outcome was that the coldest samples A (-120°C) and B (-100°C) with
impact energies below 100 J were mainly brittle in behaviour. The samples from C
A1 A2 A3
B1
B2 B3
C1 C2 C3
367
to I were mostly ductile. This indicated the ductile to brittle transition to occur
between -100 and -60°C.
Overall the impact energies of the SA508 HAZ were consistently high at test
temperatures including and above -60°C. Below this temperature, the fracture
mechanism was confirmed brittle using SEM. The average energy on what could be
considered the upper shelf was 163 J, which is above the U.S. NRC 10 CFR 50
Appendix G requirement of USE (102 J) [159] by a fair margin.
6.6 Discussion
Achieving the ASME IX radiographical acceptance for the welds proved
challenging. The welding process was found sensitive to alignment and laser spot
size related fusion issues. Lack of fusion defects were the cause for all rejected
welds. However, an acceptable quality was reached in one full weld and in several
segments of welds.
Lack of fusion was contributed partly to the undercut phenomenon which was
observed to affect mostly the stainless steel BM and partly to the accumulation of a
layer of oxides altering the wetting properties of the molten pool. The undercut
phenomenon was considered to be affected by the lower heat diffusivity of the
stainless steel compared to the LAS, the mechanism being that the stainless steel
surface would overheat to the melting point rather than dissipating the heat into the
cool mass of the material causing undercut. The effect of the oxides floating on the
surface of the melt pool was seen in the LII imagery Fig. 6.20 and visual inspection
of incomplete welds, Fig. 6.18.

368
The macrographical analysis showed that when the undercutting of 316L was
controlled, the welds formed symmetrical and the resulting fusion lines were near
parallel. The 316L was found to contract locally, the top of the sample being drawn
into the weld, causing considerable distortion of the top profile. The fusion issues
found in radiography became evident in the macrographical analysis. They were
found occurring only after 10 – 13 passes had been completed. Often they were
found after comments of excess oxidation being observed on the weld bead during
welding. This evidence along with the weld video monitoring observations led to a
conclusion that the oxide accumulation is one major source of fusion issues.
An area of high hardness in SA508 HAZ caused by the last pass was detected in
hardness analysis. The hardness was generated by phase transformation hardening.
The welding heat input had risen the base material temperature up to austenisation
temperature and the material subsequently had quenched by the heat sink of the
material itself. This was only local, as the multi-pass tempering effect reduced the
hardness significantly after only a single additional heat cycle. The reduction of
hardness was from 480 HV to below 350 HV. The hardness profile of the weld
below the last HAZ was found uniform and continuous. This shows the potent
capability of the multi-pass tempering in restoring toughness of the SA508 HAZ.
Hardness testing results in the 316L were concordant with the observation of
significant strain as noticeable strain hardening was found in the material. Strain
hardening due to the stresses caused by the multi-pass welding was also found in the
FM52 weld metal. This was typical behaviour for the austenitic weld metals used.
Microstructural analysis confirmed the existence of a martensitic HAZ of the last
bead in SA508, which was expected to form in a LAS due to the rapid cooling phase

369
of the welding heat-cycle. Effective multi-pass tempering was found to improve the
grain structures. The effect of the grain refining caused by the re-heating of the
martensitic HAZ just over the austenisation temperature, dissolving the existing
phases, but not allowing time for grain growth of the austenite, was observed. A
beneficial small grain size was found in multi-pass heat treated parts of the SA508
HAZ, beginning at the once heat treated second to last pass.
In the weld metal, a very characteristic primary austenitic structure was observed.
The grain growth from the 316L fusion line and the previous weld beads was
epitaxial, developing to competitive growth later on. SSGB, SGB and MGB grain
boundaries were observed. This is typical for the materials used [75, 122]. MGBs
were not found at every weld pass. Some very small suspected DDC cracks were
found in two of the 20 weld passes. No other types of cracks were observed. Other
flaws found were interpass and sidewall lack of fusion and occasional minor pores.
Generally, the welds were solid for such a highly restrained weld. This is an
indication of the potential benefits of NGLW in this type of weld geometries.
Very little grain growth was found in the 316L HAZ, this was contributed to the
relatively rapid heat cycle not allowing time for the growth. The grain structure and
size were found characteristic to an austenitic stainless steel weld. Small amounts of
δ-ferrite had formed on fusion line. The 316L base material was found relatively
non-uniform with uneven distribution of ferrite stringers and some areas of
exceptionally large grain. A solidification crack was found at the top surface in the
HAZ. These irregularities were given no emphasis as in a real application such issues
would be ironed out.

370
The residual stress analysis the two slightly differently executed measurements were
found concordant, giving validity to the findings. The effect of cutting-induced
plasticity was found to distort the high-scale stress map towards the beginning of the
contour cut, as was expected by the literature. Mid-range stresses were not found
affected. Resolution of the maps was concluded to best at a decreasing gradient of
stresses.
In longitudinal tensile analysis, five resulting zones were analysed. All zones were
found matching the nominal material properties. The scatter was small. The multi-
pass tempering effect on the tensile properties was found to be similar irrespective of
the location of the sample in depth; top, mid or root. This was concluded to be due to
the beneficial small grain size being generated already after a single multi-pass
tempering cycle, as the top coupon was cut just below the untempered top pass.
In composite tensile testing, the strength of the weld was proven similar or better
than the properties of the weakest metals used. In most cases, the breakage occurred
in the weld metal, but only after a significant reduction of area in the 316L base
material. The two other breakages occurred in the stainless steel base material. The
UTS of the composite tests was found 595 MPa, which exceeded that of the
longitudinal tests in the FM52 weld metal and 316L base material and material
specifications. Overall this indicates a sound weld.
In the DIC analysis of the composite tensile tests, the deformation of 316L BM and
FM52 FZ was found to alternate between the two materials before breakage. This
was to be expected as in the longitudinal tensile testing the UTS of the FM52 FZ,
535 MPa, was close to the 316L, 560 MPa. As the UTS of the 316L was higher, the
breakage occurred most often at the FM52 fusion zone. The difference in UTS came

371
apparent as considerable strain hardening (during welding) was observed in the
316L HAZ and it showed very little strain during the tensile testing. The SA508
remained practically unchanged as it has the highest yield strength of the materials
involved, results indicating it being higher than the UTS of the other metals.
The results for the Charpy-V analysis of the SA508 Gr3 Cl2 base material provide a
good correlation between observations of the fracture surface and the impact energy
results. The plotted graph shows a distinct ductile to brittle transition. The
temperatures indicated are surface temperatures measured from a warming sample.
This means that the core temperature was lower than the surface temperature stated
in the results. This was compensated by avoiding overcooling the samples and also
allowing the temperature to soak in for a time just before the test. The impact
toughness properties of the SA508 Gr3 Cl2 base material tested was found to be in
good agreement with the material certificate provided with the material and within
the specifications of the A508/A508M – 17 standard.
According to the Charpy-V impact test and the material certificate, Appendix IV, the
SA508 base material upper shelf impact energy varied between 42 and 92 J. Post
welding the impact energy was found increased, the absorbed USE varied from 146 J
to 197 J. This is a good indication of the sound uniform properties NGLW and the
multi-pass heat treatment inherently involved in it produces and a direct consequence
of the fine grain size observed in other analysis.
The impact toughness requirement of 102 J by the U.S. NRC for the SA508 HAZ
was exceeded in tests even without post weld heat treatment. Although the number
of samples was low, relatively little scatter was observed. A clear ductile to brittle
transition zone was established and confirmed using optical and SEM microscopy.
372
Overall the effect of multi-pass tempering was found beneficial, as the tempered
portion of the weld and HAZs had good properties, often exceeding those of the base
materials. Although the first passes were subjected to a larger amount of heat
treatment cycles than the ones nearer to the top, no difference was found between
samples cut from the top, middle or bottom of the weld thickness in any of the
analysis. The top sample was cut at a pass which was heat treated only once. This
shows the uniformity of the resulting weld.
6.7 Conclusions
Answers to the research questions set for this stage were found through a detailed
analysis of the welding process and the resulting welds. The following summarises
the key findings and conclusions in Stage III DMW:
The lack of fusion defects were the main challenge in welding. Lack of fusion was
detected using radiography and analysed further using macrography. This was in
agreement with both literature and previous work in this study. In practical work, it
was found that the SA508 material was found to be more prone to LoF defects than
the S275 previously used, but the development of welding practices was able to
counter the challenges.
Weld quality complying with the industry-standard ASME IX radiographical
acceptance was reached. The weld SA5 was accepted by the inspection for its entire
length. Several other partial sections were also acceptable, issues often concentrating
at the ends of the welds. In cross-sectioning the issues were found to be concentrated
towards the top of the weld, similarly to the findings in previous work in this study.
373
The U.S. NRC impact energy requirement for the ferritic steel HAZ was exceeded in
as welded condition. The multi-pass tempered HAZ was found to comply with the
requirements without PWHT. This suggests that the PWHT is not required for
achieving a sufficient level of ductility for safe operation.
The multi-pass tempering was proven effective in restoring toughness in the LAS
HAZ. The higher hardenability of SA508, compared to S275, produced a maximum
hardness of 480 HV in the HAZ which was tempered to 350 HV suggesting a
significant improvement in ductility. The multi-pass tempering was found to temper
the martensitic microstructure very effectively. Using detailed hardness mapping,
only a single heat cycle was found capable of reducing the hardness of the
martensitic SA508 HAZ to a constant level. The tempering of the microstructure was
demonstrated using microscopy. The multi-pass tempering effect was confirmed to
restore the toughness by using Charpy-V pendulum impact testing.
The multi-pass tempering effect to the SA508 HAZ toughness was shown uniform.
Only the untempered HAZ of the last pass had a potentially brittle microstructure
and hardness. The rest of the weld had much lower hardness and little variation. The
hardness mapping and microstructural analysis indicate that the ductility should be
independent of the depth of the sample. The results agree with previous work in this
study.
The microstructural variation in SA508 HAZ was very small after three heat cycles.
In microstructural analysis, no significant variation in the microstructure was
detected deeper in the weld. This is similar to the Stage II findings, regardless of the
very different hardenability of the SA508 used. The variation of microstructure due
to the multi-pass tempering in the weld metal and the 316L was small.

374
The mechanical properties of the weld were found uniform through the thickness.
The uniformity of the mechanical properties was measured cutting tensile strength
and impact energy test coupons from three depths in the welds. The mechanical
properties were found independent of the location of which the sample was cut. This
further reinforces the notion of a uniform multi-pass tempering effect.
Unexpectedly few indications of cracking or porosity were observed. Very small
signs of DDC were observed in the FM52 weld metal, but no solidification or
liquation cracking were detected. The rarity of this issue was considered as a benefit
of the NGLW process as the FM52 is known for high susceptibility to DDC in high
restraint welding conditions, such as thick section welding.
The residual stress distribution was found analogous to literature. Using the contour
method the distribution of the residual stresses was found similar to a comparable
MMA weld, but the maximum values measured in this study were higher. This was
concluded to be due to the lack of PWHT. This poses an issue, as the higher residual
stress levels make the weld more susceptible to PWSCC. This indicates the need for
further study on the actual EAC properties if the weld is to be used without PWHT.
375
7 General Discussion on Dissimilar Metal NGLW
7.1 Introduction
The welding in this study was conducted in three distinct steps. Different materials
were used at each stage. The materials had very different properties resulting in
equally different results. However, many of the phenomena discovered were
universal and found regardless of the materials used. This chapter discusses the
commonalities and differences in NGLW of different material combinations.
7.2 Process Characteristics
The concept of NGLW is based on trying to reach the narrowest possible welding
groove. This creates a unique environment for welding. All the equipment has to be
concentrated into exceptionally small confines. This generates new types of
challenges compared to conventional welding processes. The following was found
characteristical to NGLW in this study.
Visibility into the process was very limited due to the narrow groove and the various
nozzles involved. Monitoring the melt pool without a coaxial camera system was
found virtually impossible after the trailing shielding gas nozzles were added to the
welding head. Also achieving adequate accuracy in the programming of the weld
path pre welding was inaccurate until the introduction of the camera. Using the
coaxial camera system was used to increase the accuracy of weld programming to
match the precision of the robotic system.

376
Laser illumination imaging was used at the beginning of the study. The resulting
imagery was free of all disturbances and found highly valuable for the process
development. This system was not compatible with the coaxial camera optics as the
band-pass filter could not be applied; hence a much inferior ambient light imaging
had to be used.
Significant reduction of welding passes and filler material required over
conventional GTAW compared to literature [35, 37] was reached. Considerable filler
material savings were reached also over NG-GTAW. This also leads to secondary
benefits such as a reduction in inspection steps. Material and time savings
calculations indicate the capability of over 90 % reduction of welding time in
comparison to GTAW of the reactor pressure vessel nozzle at 80 mm thickness.
Results show over 60 % reduction on the filler material required compared to NG-
GTAW.
7.3 Geometrical Tolerances
Although less stringent than in keyhole laser welding, the narrow gap arrangement
was known to have relatively strict fit and alignment requirements as Jokinen [17,
44] had reported. It was understood that at an industrial scale the tolerances of
welding groove manufacturing would be much inferior to the laboratory setup.
The approach to welding groove design was to design a geometry which would keep
the width of the bottom of the welding groove constant for each pass. The aim was to
minimise the need to adjust the laser spot size between passes.
Some of the tests, see Chapter 5.4.3, in this study indicated a three-stage groove
contraction behaviour, which might have benefitted from a three bevel groove shape.
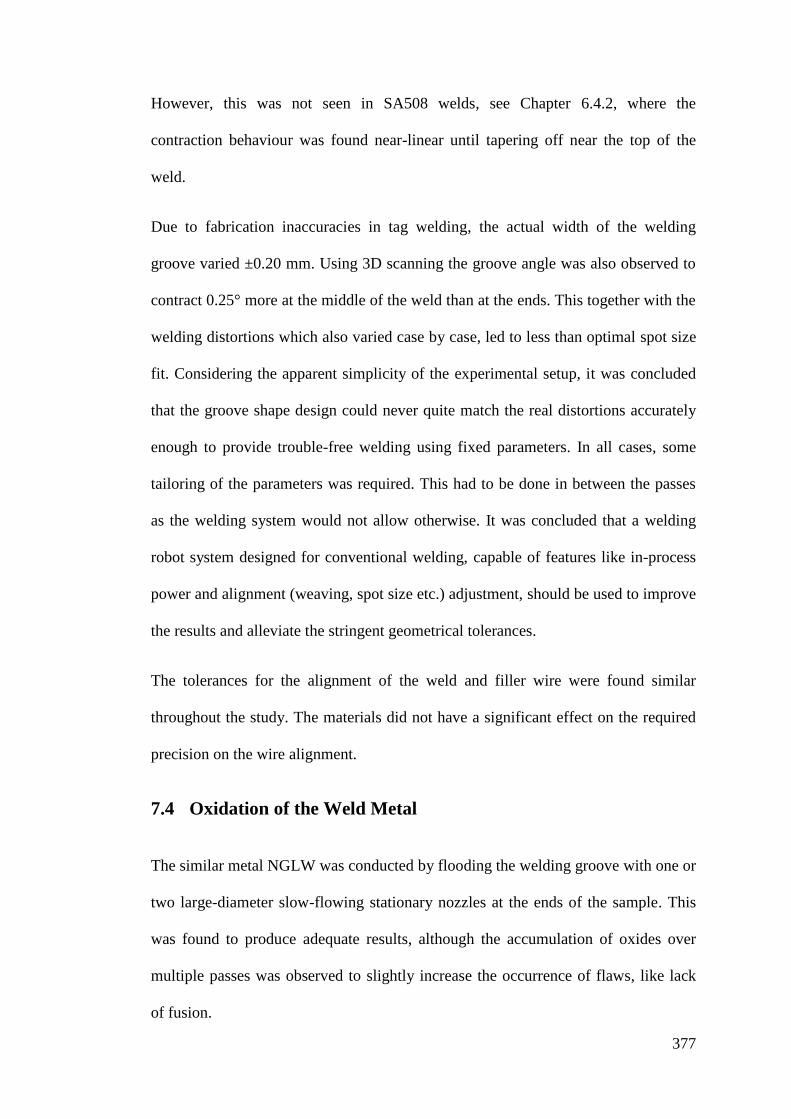
377
However, this was not seen in SA508 welds, see Chapter 6.4.2, where the
contraction behaviour was found near-linear until tapering off near the top of the
weld.
Due to fabrication inaccuracies in tag welding, the actual width of the welding
groove varied ±0.20 mm. Using 3D scanning the groove angle was also observed to
contract 0.25° more at the middle of the weld than at the ends. This together with the
welding distortions which also varied case by case, led to less than optimal spot size
fit. Considering the apparent simplicity of the experimental setup, it was concluded
that the groove shape design could never quite match the real distortions accurately
enough to provide trouble-free welding using fixed parameters. In all cases, some
tailoring of the parameters was required. This had to be done in between the passes
as the welding system would not allow otherwise. It was concluded that a welding
robot system designed for conventional welding, capable of features like in-process
power and alignment (weaving, spot size etc.) adjustment, should be used to improve
the results and alleviate the stringent geometrical tolerances.
The tolerances for the alignment of the weld and filler wire were found similar
throughout the study. The materials did not have a significant effect on the required
precision on the wire alignment.
7.4 Oxidation of the Weld Metal
The similar metal NGLW was conducted by flooding the welding groove with one or
two large-diameter slow-flowing stationary nozzles at the ends of the sample. This
was found to produce adequate results, although the accumulation of oxides over
multiple passes was observed to slightly increase the occurrence of flaws, like lack
of fusion.

378
The FM52 filler relies heavily on Al and Ti to float oxygen out of the weld pool as
oxides [87, 89, 128]. This was seen as the accumulation of an oxide layer to the weld
bead, which was one of the major problems encountered in this study.
One major difference in the similar metal welds over the dissimilar welds was that
the deposition rate was higher and therefore the number of passes required to fill the
up to 40 mm welds was lower, which reduced the accumulation of oxides and
reduced the issue.
7.4.1 Remedies for Oxidation Issues
The oxidation was reduced by improving the gas shielding and introducing a regular
mechanical removal of the oxide layer. One way suggested to address the oxidation
propensity was that the amount of FM52 could be kept to a minimum while most of
the weld should be filled using mechanically similar FM82. The thickness of the
FM52 being decided on the corrosion properties. Changing the FM52 to more
modern variants like FM52M [87] or FM52MSS [89], which are developed specially
to reduce the floating oxides, is recommended.
7.5 Undercutting of Stainless Steel
Undercutting was first observed in the Stage I stainless steel similar metal welds.
The small amount of symmetrical undercut was found to have little adverse effect,
causing only negligible widening of the fusion zone. Signs of undercut were seen in
all stainless steel similar metal welds, but only re-melting would cause measurable
undercut. A cross-sectional sample of undercut is presented as Fig. 7.1.
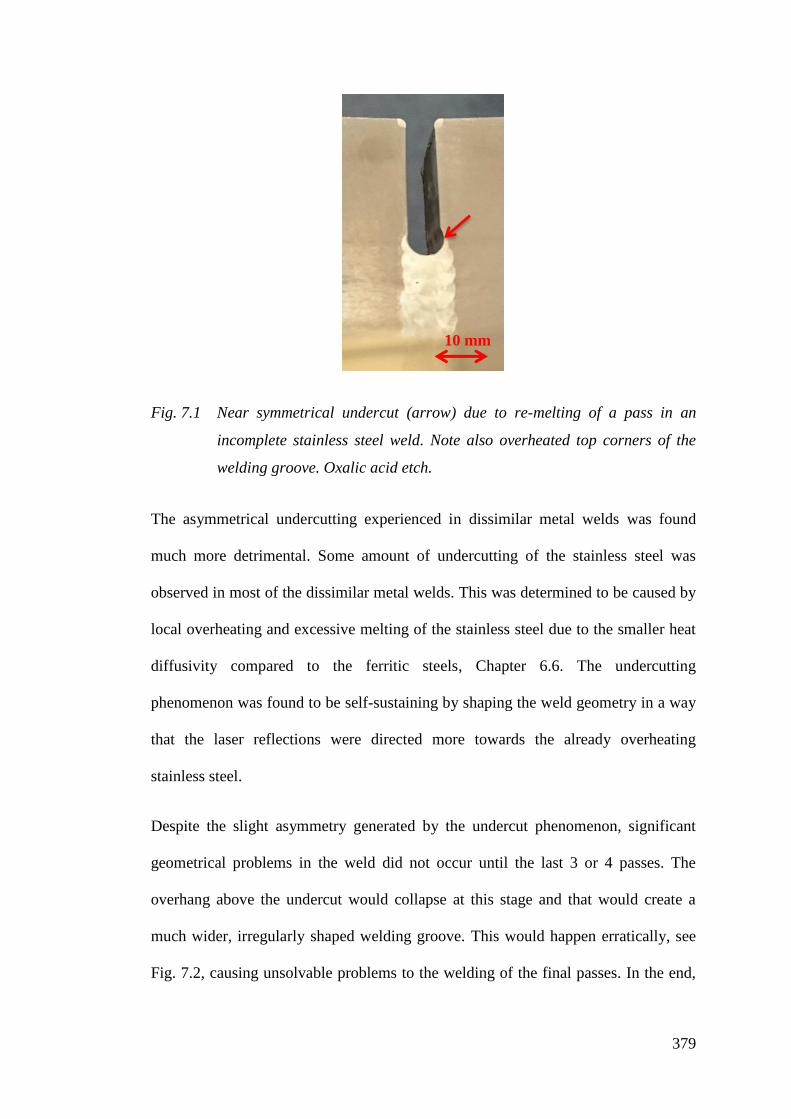
379
Fig. 7.1 Near symmetrical undercut (arrow) due to re-melting of a pass in an
incomplete stainless steel weld. Note also overheated top corners of the
welding groove. Oxalic acid etch.
The asymmetrical undercutting experienced in dissimilar metal welds was found
much more detrimental. Some amount of undercutting of the stainless steel was
observed in most of the dissimilar metal welds. This was determined to be caused by
local overheating and excessive melting of the stainless steel due to the smaller heat
diffusivity compared to the ferritic steels, Chapter 6.6. The undercutting
phenomenon was found to be self-sustaining by shaping the weld geometry in a way
that the laser reflections were directed more towards the already overheating
stainless steel.
Despite the slight asymmetry generated by the undercut phenomenon, significant
geometrical problems in the weld did not occur until the last 3 or 4 passes. The
overhang above the undercut would collapse at this stage and that would create a
much wider, irregularly shaped welding groove. This would happen erratically, see
Fig. 7.2, causing unsolvable problems to the welding of the final passes. In the end,
10 mm
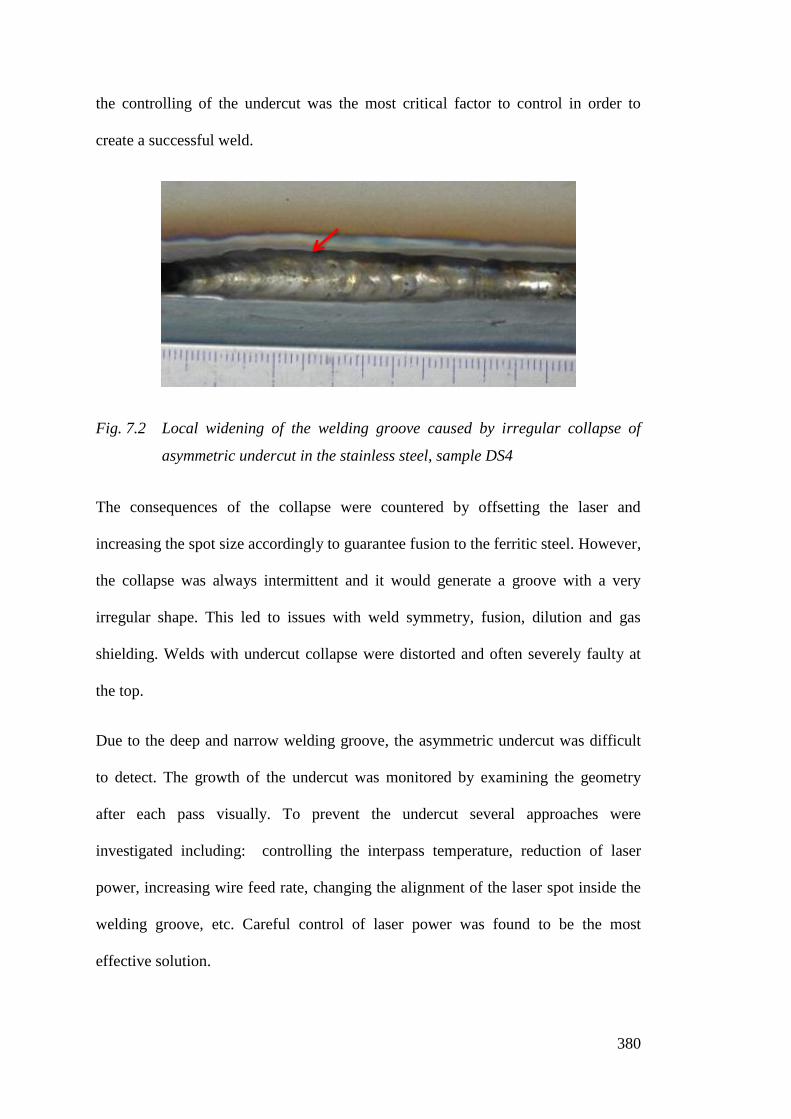
380
the controlling of the undercut was the most critical factor to control in order to
create a successful weld.
Fig. 7.2 Local widening of the welding groove caused by irregular collapse of
asymmetric undercut in the stainless steel, sample DS4
The consequences of the collapse were countered by offsetting the laser and
increasing the spot size accordingly to guarantee fusion to the ferritic steel. However,
the collapse was always intermittent and it would generate a groove with a very
irregular shape. This led to issues with weld symmetry, fusion, dilution and gas
shielding. Welds with undercut collapse were distorted and often severely faulty at
the top.
Due to the deep and narrow welding groove, the asymmetric undercut was difficult
to detect. The growth of the undercut was monitored by examining the geometry
after each pass visually. To prevent the undercut several approaches were
investigated including: controlling the interpass temperature, reduction of laser
power, increasing wire feed rate, changing the alignment of the laser spot inside the
welding groove, etc. Careful control of laser power was found to be the most
effective solution.

381
7.6 Mechanisms Leading to Formation of Lack of Fusion
The repeatability of the NGLW was found challenging mainly due to the well-known
issues related to fusion [18, 41, 46]. Two types of lack of fusion were detected,
interpass LoF and LoF to the sidewalls. The fusion issues were found to be partly to
be caused by the challenging weldability of the FM52 filler material [84, 129] and
partly due to the tendency of 316L to generate undercut.
Lack of fusion, especially to the stainless steel, was considered the main challenge in
the dissimilar metal welding, being the cause of all rejections in the ASME IX X-ray
inspection. Sidewall lack of fusion was found to occur due to two phenomena:
oxidation and undercut. Firstly, the layer of oxide slag floating on the melt pool was
observed to distort the shape of the surface by preventing the capillary effect from
wetting the sidewalls. Secondly, the stainless steel undercut prevented the laser beam
from heating the fusion boundary sufficiently. Interpass lack of fusion was found to
form via lack of penetration due to low laser power the previous oxide layer being
trapped between passes without melting.
7.6.1 LoF Due to Oxidation
Alloy 52 was known to be prone to issues with oxidation [87, 89, 128]. The Al and
Ti in the alloy act as de-oxidisers generating light floating oxides [64]. Generally, the
oxides floated to the top of the weld pool leaving no inclusions in the welds. The
problem was that the layer of oxides floating on the weld pool accumulated pass
after pass. In the first passes of the weld, there were seldom difficulties with
oxidation, but after a certain amount of passes, depending on the gas shielding setup,
the problems became obvious. Using LII imaging videos the layer of oxides was
found to force the surface of the melt pool flat, see example Fig. 7.3. This prevented
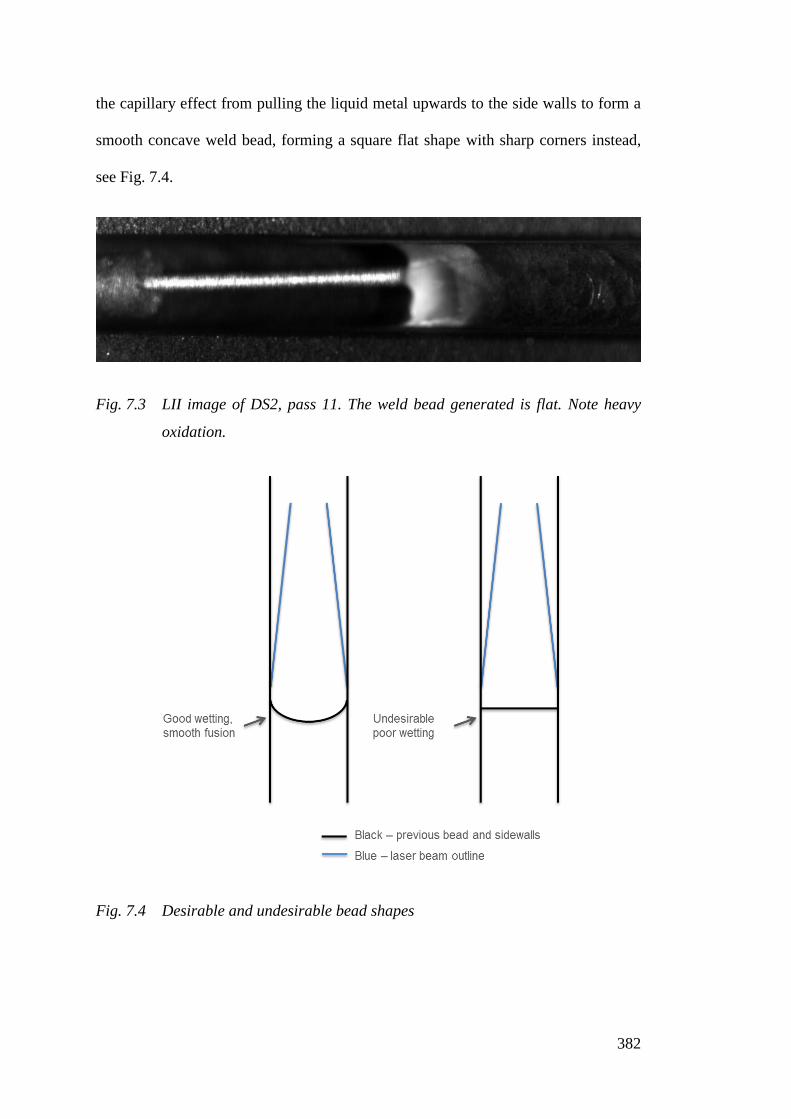
382
the capillary effect from pulling the liquid metal upwards to the side walls to form a
smooth concave weld bead, forming a square flat shape with sharp corners instead,
see Fig. 7.4.
Fig. 7.3 LII image of DS2, pass 11. The weld bead generated is flat. Note heavy
oxidation.
Fig. 7.4 Desirable and undesirable bead shapes

383
The following pass was unable to melt the corners of this flat, square shape reliably
to achieve good fusion and uniform penetration to the previous bead, Fig. 7.5.
Instead, the shape generated a high risk of lack of fusion, see Fig. 7.6.
Fig. 7.5 Optimal penetration between passes and reliable fusion

384
Fig. 7.6 Consequences of inadequate wetting increasing the risk of lack of fusion
This type of lack of fusion was a common challenge and remedies were developed.
The generation of oxide slag was minimised by improving gas shielding. It was
supplemented by manual wire brushing after each pass to reduce the accumulation of
oxides. Laser power was kept as high as possible to keep the penetration at a
maximum level. Together these methods were sufficient to produce for 40 mm
thickness welds fulfilling the requirements of ASME IX radiographical acceptance.
7.6.2 LoF Due to Undercut
The undercut induced lack of fusion defects formed through a mechanism of
asymmetric widening of the bottom of the welding groove towards the stainless steel
base material. Undercutting would put part of the bottom out of reach of the laser
beam, effectively generating a shadow. The shaded area would not receive any direct
heat from the laser beam, and the viscous FM52 weld pool would not be capable to
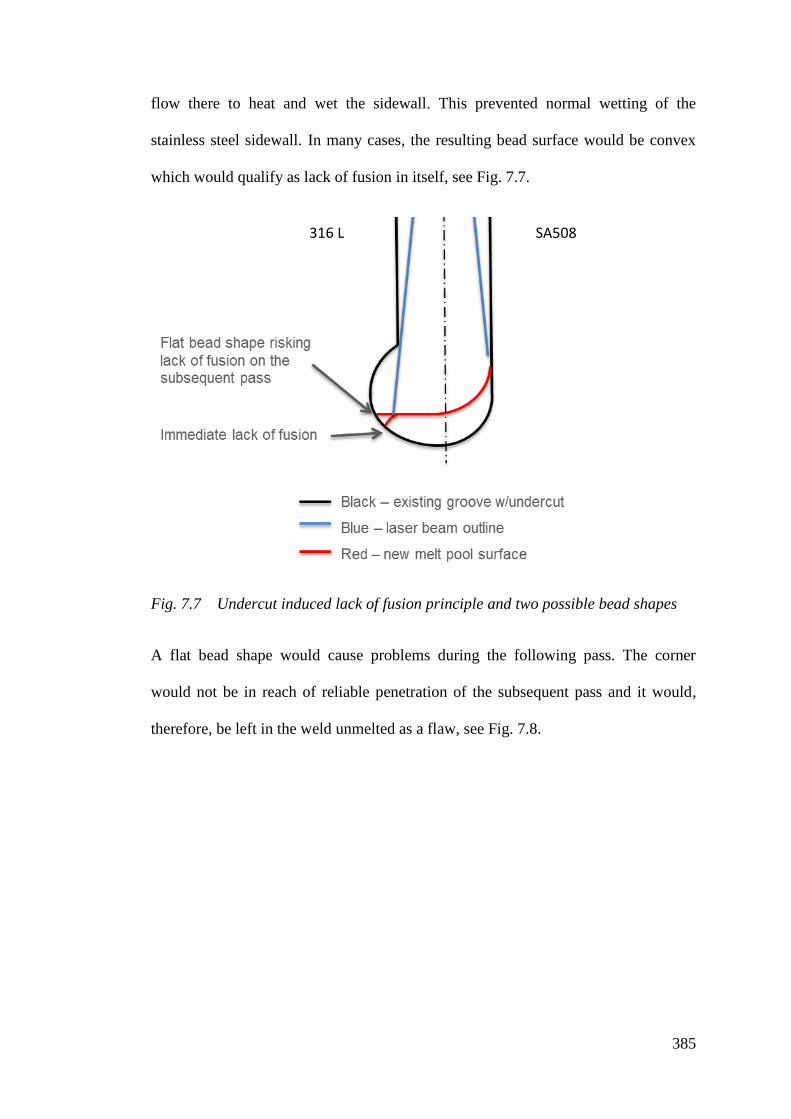
385
flow there to heat and wet the sidewall. This prevented normal wetting of the
stainless steel sidewall. In many cases, the resulting bead surface would be convex
which would qualify as lack of fusion in itself, see Fig. 7.7.
Fig. 7.7 Undercut induced lack of fusion principle and two possible bead shapes
A flat bead shape would cause problems during the following pass. The corner
would not be in reach of reliable penetration of the subsequent pass and it would,
therefore, be left in the weld unmelted as a flaw, see Fig. 7.8.
316 L SA508

386
Fig. 7.8 The effect of undercut induced lack of fusion to the following welding pass
To prevent this type of lack of fusion careful monitoring of the undercut
development was used. If the undercut was not developed too wide, reduction in
laser power was found an effective way of reducing the undercut for the subsequent
passes.
7.6.3 Interpass LoF
Interpass lack of fusion was found to form when the laser power was too low,
confirming the findings in the literature [41, 46]. The weld SA2 was welded with a
power of 2500 to 3000 W. The sidewalls wetted very well and the appearance of the
beads was generally good. This weld, however, was riddled with interpass LoF.
To reduce the susceptibility to interpass LoF a higher laser power was applied to
increase penetration. The weld SA5 was filled with laser power of 3500 W. It was
free of interpass LoF. The power was however limited by the increase in the
316 L SA508
387
asymmetric undercut of the stainless steel, which tended to lead detrimental
distortion of the weld geometry. A careful balance had to be maintained.
One contributing mechanism was the oxide layer on top of the previous bead
stopping the weld penetrating the surface. The hard oxide layer was found acting
effectively as an insulator. In many cases, the interpass lack of fusion was found
corresponding to observations of excess oxidation on the previous bead. The
underlying mechanism was considered to be the less turbulent melt pool of the low
power passes not being able to convey enough heat to dissolve the oxidised surface.
The sluggish nature of the FM52 melt pool [84] was suspected to contribute to this
issue.
7.6.4 Location of Lack of Fusion
The issues with lack of fusion were seen to concentrate to the ends of the samples in
all test stages. Mechanisms leading to this were considered. The smaller contraction
of the welding groove at the ends, see Fig. 4.6, was making the groove relatively
wider nearer the ends. This effectively made the laser spot smaller than optimal
leading to lack of sidewall fusion. Simultaneously the thickness of the bead
previously deposited was relatively lower causing the wire to reach the melt pool at
the top range of the tolerance range, sometimes overshooting the pool and being
melted directly by the laser beam, being deposited discontinuously as droplets, refer
to Fig. 7.13. This was seen to increase oxidation and unevenness of the bead, both of
which were recognised as promoters of lack of fusion.
These issues were challenging to combat using the fixed trajectory robotic system.
The linear trajectory of the robot had to be a compromise between the lower wider
ends of the weld and the higher narrower middle part. The laser spot size to groove

388
width ratio could be optimised if a more flexible robotic system was used. It would
also align the wire correctly, keeping the interaction point with the melt pool
constant.
7.7 Laser Beam Reflections from the Weld Pool Surface
Although literature states that the absorption of a laser beam to metals generally
increases very close to 100% as the temperature rises to temperatures required for
welding [40] a considerable amount of reflections were observed during the trials.
The reflections were generally directed to the welding direction, see Fig. 7.9. Due to
the unstable surface of the melt pool, the direction of the reflections was oscillating
randomly and the power was usually harmlessly distributed over a large area.
Fig. 7.9 Reflection of the laser beam towards the direction of welding

389
The angle of the reflections was dependent on the thickness of the bead being
generated; the thicker the bead, the more obtuse the angle of reflection. During the
low deposition rate bead on plate tests where the weld pool was near horizontal the
almost vertically reflected light occasionally damaged unprotected components such
as the shielding gas piping in the laser head. In the similar metal narrow gap welds,
in which thicker bead was being laid and the weld pool surface was more inclined,
the reflections were directed more forward, out of the groove hitting generally the
filler wire nozzle area. The angle of the reflections was especially harmful for the
dissimilar NGLW, where LII imaging was able to record the melting of the wire
feeder nozzle and the convection of the resulting debris into the weld pool, see Fig.
7.10 and Fig. 7.11.
Fig. 7.10 Overheating of wire nozzle (arrow) due to reflections. DS2 pass 2, 38 s
from the start.
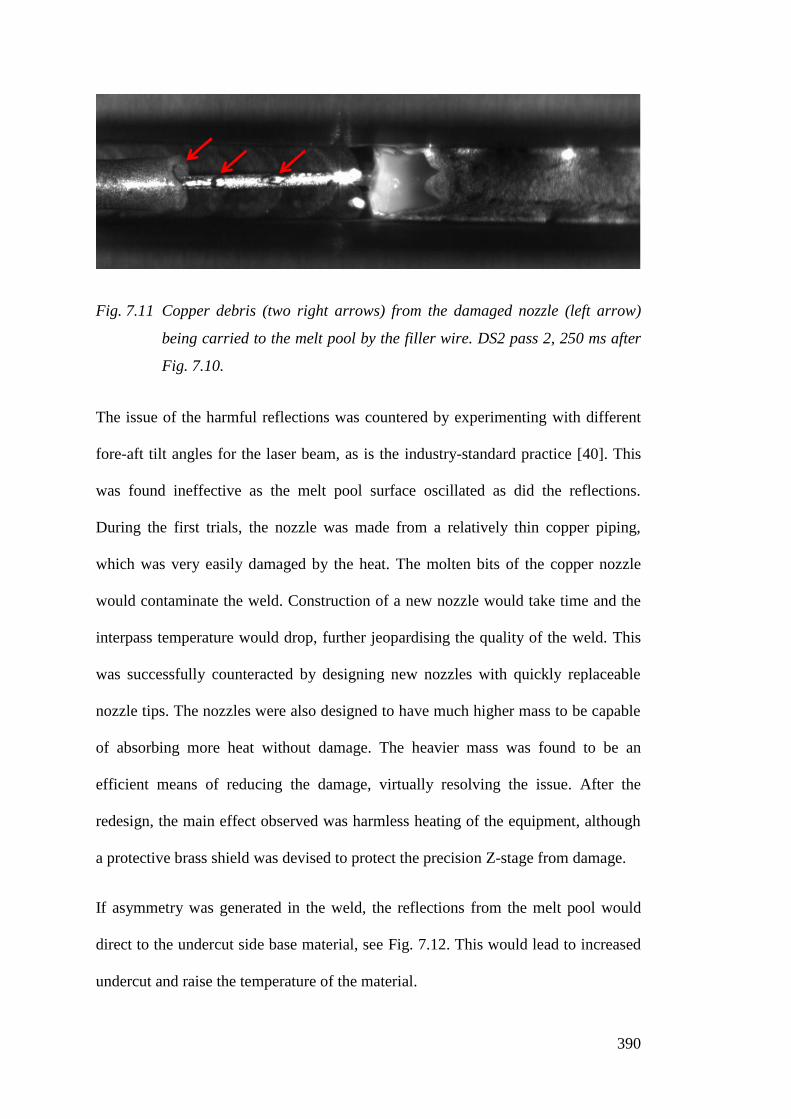
390
Fig. 7.11 Copper debris (two right arrows) from the damaged nozzle (left arrow)
being carried to the melt pool by the filler wire. DS2 pass 2, 250 ms after
Fig. 7.10.
The issue of the harmful reflections was countered by experimenting with different
fore-aft tilt angles for the laser beam, as is the industry-standard practice [40]. This
was found ineffective as the melt pool surface oscillated as did the reflections.
During the first trials, the nozzle was made from a relatively thin copper piping,
which was very easily damaged by the heat. The molten bits of the copper nozzle
would contaminate the weld. Construction of a new nozzle would take time and the
interpass temperature would drop, further jeopardising the quality of the weld. This
was successfully counteracted by designing new nozzles with quickly replaceable
nozzle tips. The nozzles were also designed to have much higher mass to be capable
of absorbing more heat without damage. The heavier mass was found to be an
efficient means of reducing the damage, virtually resolving the issue. After the
redesign, the main effect observed was harmless heating of the equipment, although
a protective brass shield was devised to protect the precision Z-stage from damage.
If asymmetry was generated in the weld, the reflections from the melt pool would
direct to the undercut side base material, see Fig. 7.12. This would lead to increased
undercut and raise the temperature of the material.

391
Fig. 7.12 The detrimental effects of asymmetric reflections
In severe cases the laser power was sufficient to melt the BM sidewall several
millimetres above the undercut, damaging it by melting grooves to it. This pitting
would later cause problems as the side wall would lose its intended shape. When the
weld progressed to the level of these undulations, they effectively acted as undercut
themselves and increased the undercut and asymmetry even further.
7.8 Alignment of the Filler Wire
The wire alignment requirements were found to be concordant with the observations
of Jokinen 2004 [17] and Salminen 2003 [156]. The alignment was found to be near
immune to transverse offset. Even a severely offset wire would produce a
symmetrical weld. This was determined to be related to the weld pool being
turbulent enough to be able to distribute the material evenly. Undershooting the weld
pool slightly caused usually no issues as the previous bead would guide the wire to
the melt pool satisfactorily. Only in severe cases, where the previous bead was
316 L SA508
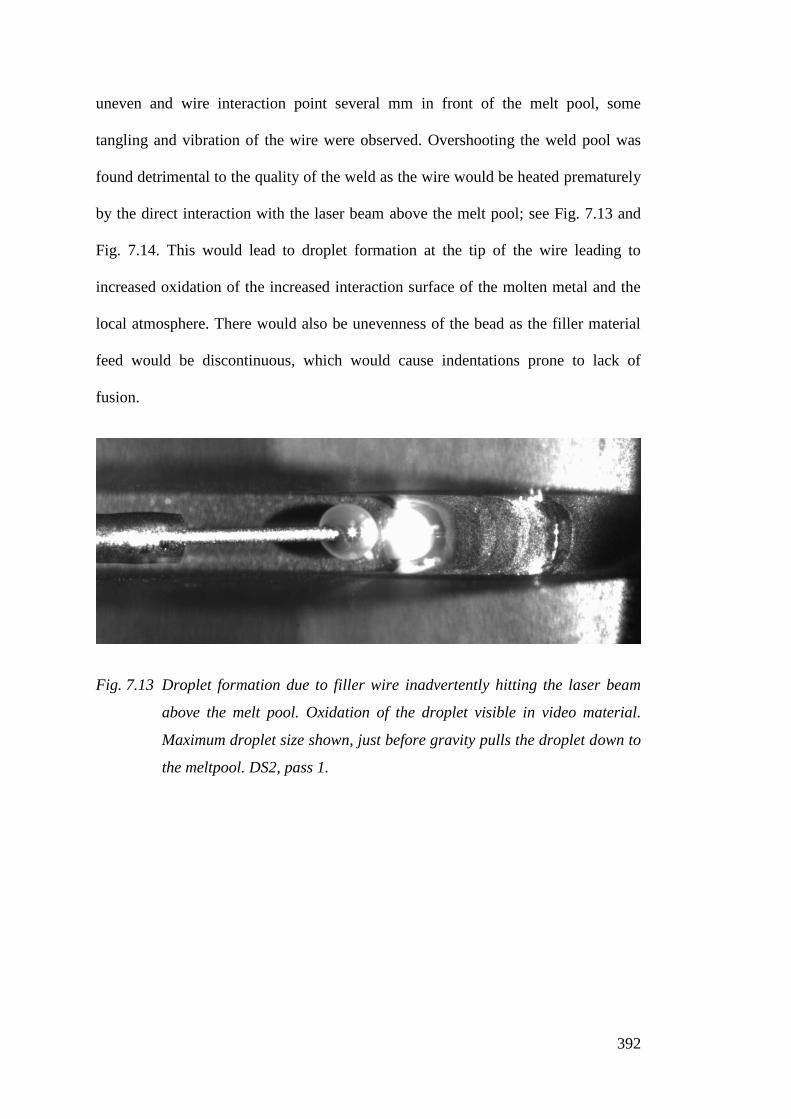
392
uneven and wire interaction point several mm in front of the melt pool, some
tangling and vibration of the wire were observed. Overshooting the weld pool was
found detrimental to the quality of the weld as the wire would be heated prematurely
by the direct interaction with the laser beam above the melt pool; see Fig. 7.13 and
Fig. 7.14. This would lead to droplet formation at the tip of the wire leading to
increased oxidation of the increased interaction surface of the molten metal and the
local atmosphere. There would also be unevenness of the bead as the filler material
feed would be discontinuous, which would cause indentations prone to lack of
fusion.
Fig. 7.13 Droplet formation due to filler wire inadvertently hitting the laser beam
above the melt pool. Oxidation of the droplet visible in video material.
Maximum droplet size shown, just before gravity pulls the droplet down to
the meltpool. DS2, pass 1.

393
Fig. 7.14 Droplet at the moment of being absorbed by the meltpool, 40 ms after Fig.
7.13. DS2, pass 1.

394
Blank page

395
8 Conclusions
8.1 Introduction
Current welding technologies for PWR reactor PCC dissimilar welding are dated,
costly and may not be able to produce the longest possible lifespan. In order to
alleviate these issues, a novel process called narrow gap laser welding is suggested.
In this study, a welding setup capable of 40 mm thick dissimilar NGLW was
developed. A three-stage welding programme was carried out with the intention to
generate dissimilar metal narrow gap laser welds for extensive analysis. The main
goal was to evaluate the welds against two main industry-standard evaluation
criteria, the ASME IX radiographical acceptance and the U.S. NRC impact
toughness requirements for light water reactor coolant boundary components.
Altogether 19 thick section narrow gap laser welds were completed. Of these, 6 were
stainless steel similar metal welds and 13 were dissimilar metal welds using FM52
filler metal. 5 of the dissimilar metal welds were made between S275 mild steel and
316L stainless steel. The 8 pedigree DMW performed were made using
SA508 Gr3 Cl2 low alloyed high strength steel and 316L.
8.2 Conclusions
The following conclusions were reached:
Dissimilar laser narrow gap welding was found to be feasible. This was established
by subjecting the welds to the industry-standard quality requirements. The welds
were first subjected to visual inspection. The welds found flawless were
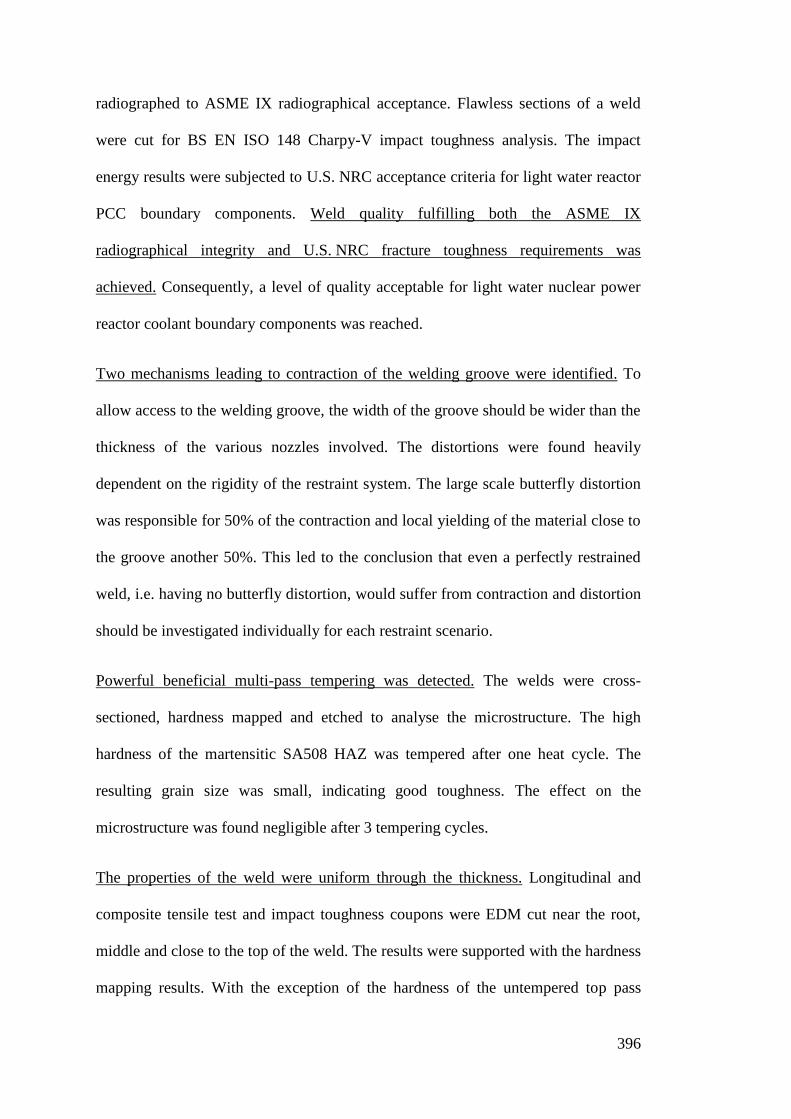
396
radiographed to ASME IX radiographical acceptance. Flawless sections of a weld
were cut for BS EN ISO 148 Charpy-V impact toughness analysis. The impact
energy results were subjected to U.S. NRC acceptance criteria for light water reactor
PCC boundary components. Weld quality fulfilling both the ASME IX
radiographical integrity and U.S. NRC fracture toughness requirements was
achieved. Consequently, a level of quality acceptable for light water nuclear power
reactor coolant boundary components was reached.
Two mechanisms leading to contraction of the welding groove were identified. To
allow access to the welding groove, the width of the groove should be wider than the
thickness of the various nozzles involved. The distortions were found heavily
dependent on the rigidity of the restraint system. The large scale butterfly distortion
was responsible for 50% of the contraction and local yielding of the material close to
the groove another 50%. This led to the conclusion that even a perfectly restrained
weld, i.e. having no butterfly distortion, would suffer from contraction and distortion
should be investigated individually for each restraint scenario.
Powerful beneficial multi-pass tempering was detected. The welds were cross-
sectioned, hardness mapped and etched to analyse the microstructure. The high
hardness of the martensitic SA508 HAZ was tempered after one heat cycle. The
resulting grain size was small, indicating good toughness. The effect on the
microstructure was found negligible after 3 tempering cycles.
The properties of the weld were uniform through the thickness. Longitudinal and
composite tensile test and impact toughness coupons were EDM cut near the root,
middle and close to the top of the weld. The results were supported with the hardness
mapping results. With the exception of the hardness of the untempered top pass

397
SA508 HAZ, all mechanical properties investigated were found uniform through the
thickness of the weld indicating a uniform multi-pass tempering.
The industry-standard impact toughness requirements for the weld were met already
in as welded condition. This indicates that the PWHT is not required for the sake of
restoring the toughness of the SA508 HAZ when using NGLW.
NGLW was able to produce crack-free welds using Inconel Alloy FM52. The Filler
metal FM52 is known for generating solidification, liquation and ductility dip
cracking, especially in highly restrained welding conditions such as thick section
welding. Despite this no cracking of the two first types was observed in the analysis.
Some sporadic signs of discrete ductility dip cracking were found. This is an
indication of the benefits of NGLW considering residual stress generation in thick
section welding.
8.3 Process Characteristics
Certain factors considering the welding process were considered noteworthy. They
were found characteristical to the NGLW performed in this study.
Lack of fusion defects were found to be the principal welding flaw type in dissimilar
metal NGLW. This was judged to be the case based on radiographical analysis and
microscopy. This agrees with earlier findings in the literature of similar metal
NGLW. Three mechanisms causing LoF were found and strategies to reduce them
were developed. The following mechanisms were identified:
I. The (Ti and Al) oxides floating on top of the FM52 weld pool were observed
to flatten the melt pool surface preventing smooth wetting of sidewalls which
caused sidewall lack of fusion. This was seen in LII video monitoring
together with visual analysis of the individual weld beads. The type I LoF

398
was countered by reducing and removing the oxides by improving gas
shielding and removing of the oxide layer mechanically between passes.
Change of filler material to FM52M is recommended, as it is developed
specially to reduce the floating oxide issue by different alloying.
II. Undercutting of the stainless steel was found to distort the welding groove
geometry. The phenomenon was monitored visually, severe cases being
apparent. In cases of excessive undercut, the sluggish FM52 weld pool was
not able to wet the stainless steel sidewall adequately leading to lack of
fusion. The type II mechanism was very harmful. A viable way to avoid the
undercutting was found to be avoiding excess laser power and heat input,
hence reducing the energy projected to overheat the stainless steel.
III. Using lower than optimal laser power resulted in an increase in the
probability of interpass lack of fusion. This was demonstrated by comparing
the cross-sectional macrographs against the laser power applied. The
oxidation of the weld pool was suspected to have added to this issue.
Increasing the laser power reduced the type III issues, as higher heat input
increases penetration and enhances the turbulence in the weld pool which
helps to convey the oxides to the surface.
Lack of sidewall fusion was also generated if the laser spot was too small for the
groove. Irregularities of the previous bead promoted the fusion issues via the less
than optimal geometry and by impeding the removal of oxidation in the crevices.
Very few issues with other welding flaws were encountered.
Minor irregularities during the welding process were found repairable by re-melting
the pass. In some cases, for example welding the root pass, the wetting of the
sidewalls was found inadequate and the weld bead generated was uneven. This was
proven repairable to an extent by re-melting the bead. The limitation of this method
was that each re-melt would introduce as much welding distortion as a normal filling

399
pass. To avoid excess contraction of the welding groove, the number of re-melt
passes should be limited.
Careful control of the welding parameters was required in DMW. In a test in which
lack of fusion between passes was detected due to insufficient laser power, an
increase of 500 W (17%) in the power was able to cause detrimental undercutting of
the stainless steel. Some reliability was sacrificed for targeting high efficiency by
using a maximal filler feed rate. It was concluded that using a more flexible welding
robot capable of real-time adjustment, would ease many of the requirements.
Accumulation of oxides was concluded to be the limiting factor for thickness with
the current welding setup and materials. The quality of fusion was found good until a
certain amount of oxides had accumulated on the weld bead. Fusion defects were
typically only found after several (10 to 13) welding passes had been deposited and a
thickness of 25 to 30 mm had been filled. This was based on macrography of weld
cross-sections. This suggested a limit to the number of individual passes applicable
unless the oxide formation was somehow reduced. Preventing the formation of
oxides by improving the gas shielding performance and removing the accumulated
oxide layer mechanically were found to be efficient in improving fusion quality and
flawless welding up to 40 mm was achieved.

400
Blank page
401
9 Future Work
This exploratory study is not by any means comprehensive. Several aspects in the
process can be improved and during the work, multiple new areas of interest were
found. The following future work is suggested.
Broadening the available weld applications by increasing the thickness
by improvements in weld design and materials
The 40 mm weld thickness achieved in this study is suitable for applications such as
pressuriser nozzles in PWR reactors. To allow the application of NGLW for all PWR
PCC dissimilar welds, the thickness needs to be increased. The maximum thickness
of the welds was limited due to weld oxidation. To address the oxide accumulation,
and allow for higher thickness welds to be made, the weld design could be
reconsidered. Welding only some of the passes with high-chromium nickel filler and
filling the rest with FM82 is suggested. This would create a sufficient corrosion
barrier, but reduce the use of the challenging filler material to a minimum. To further
reduce the oxidation propensity of the weld filler metal options FM52M and
FM52MSS could be considered. They also would address the susceptibility to DDC.
Introducing post weld heat treatment
Post weld heat treatment is required by different nuclear codes for thick section
welds in coolant boundary applications. The objective of the treatment is to temper
the potentially brittle microstructures to restore toughness and reduce susceptibility
to environmentally assisted cracking by reducing residual stresses. The welds in this
study were not post weld heat treated. The microstructures produced in this study
resulted in sound toughness properties due to the multi-pass tempering, but the

402
residual stress levels were still high and could still be reduced by tempering.
Exploring the resulting residual stresses, grain structure, hardness and impact
toughness properties in post weld heat treated condition would allow the properties
of the welds to be investigated in a condition where they are used in the target
applications.
Comparison with conventional welding processes using established
industry practices
Comparable welds with actual application designs and dimensions could be
produced using current standard procedures and welding processes. The welds would
be manufactured according to the industry-standard processes. Resulting welds can
then be analysed in direct comparison with each other.
Comparison of the contour method results with other residual stress
measurement methods
Other residual stress measurement methods, such as neutron diffraction or deep hole
drilling, could be done in order to validate the contour method data.
Investigation of corrosion properties
This study did not address the corrosion properties of the produced welds. A detailed
corrosion study of the welds would increase understanding of the behaviour and
longevity of the welds.
Investigations into laser hot wire welding
Hot wire laser welding has shown good potential in stainless steel similar metal
welding. HWLW has been reported to have a beneficial effect on fusion as part of
the heat is introduced by the hot wire. The additional heat input by the wire has been
reported to allow reduction of the laser power. This would be especially beneficial in
countering the undercutting of the stainless steel found in this study.

403
10 Publications
Journal papers in preparation
o “Thick Section Dissimilar Metal Narrow Gap Laser Welding of S275
to 316L Using Alloy 52 Filler”
o “Microstructural and Process Characterization of Dissimilar Metal
Narrow Gap Laser Welding of SA508 and 316L Using FM52”
o “Mechanical Properties and Residual Stresses of Thick Section
Dissimilar Metal Narrow Gap Laser Welds of SA508 Gr3 Cl2 and
316L”
Podium presentations
o Presentation
The 5th Industrial Laser Applications Symposium ILAS 2017.
“Thick Section Narrow Gap Laser Welding of Dissimilar Metals,
Low Alloyed Steel to Austenitic Stainless Steel”.
Grantham, Belton Woods Hotel 22. - 23.3.2017
o Presentation
39th International MATADOR Conference on Advanced
Manufacturing.
“Dissimilar Metal Narrow Gap Laser Welding of Thick Section Steels
316L and S275”. Manchester, The University of Manchester 5. -
7.7.2017.

404
Blank page
405
11 References
1. IEA, Key world energy statistics, 2017, International Energy Agency. 2. WNA, Nuclear Power in the United Kingdom, 2017, World Nuclear Association. 3. The Authority of the House of Lords, Nuclear Research and Development
Capabilities, 2011, The Authority of the House of Lords. 4. Preuss, M., New Nuclear Manufacturing (NNUMAN), 2012, Engineering and
Physical Sciences Research Council. 5. Nuclear AMRC, Nnuman to address next generation of nuclear manufacturing,
2012, Nuclear Advanced Manufacturing Research Centre 6. Jeyaganesh, B., Callaghan, M.D., Francis, J.A., English, P.D., Vasileiou, A., Roy, M.J.,
Guo, W., Irvine, N.M., Smith, M.C., Li, L. and Sherry, A.H., Overview of Welding Research Under the New Nuclear Manufacturing (NNUMAN) Programme. 2014.
7. Couvant, T., Corrosion in pressurized water reactors (PWRs). Materials' Ageing and Degradation in Light Water Reactors: Mechanisms and Management, 2013(44): p. 70-80.
8. U.S.NRC, Reactor Coolant System Weld Issues, 2017, United States Nuclear Regulatory Commission.
9. Marston, T.U. and Jones, R.L. Materials degradation problems in the advanced light water reactors. 1992. United States: American Nuclear Society, Inc., La Grange Park, IL (United States).
10. IAEA, Stress Corrosion Cracking in Light Water Reactors: Good Practices and Lessons Learned. IAEA Nuclear Energy Series. 2011: IAEA.
11. Elmesalamy, A., Francis, J.A. and Li, L., A comparison of residual stresses in multi pass narrow gap laser welds and gas-tungsten arc welds in AISI 316L stainless steel. International Journal of Pressure Vessels and Piping, 2014. 113: p. 49-59.
12. Wang, H.T., Wang, G.Z., Xuan, F.Z., Liu, C.J. and Tu, S.T., Local mechanical properties of a dissimilar metal welded joint in nuclear power systems. Materials Science and Engineering a-Structural Materials Properties Microstructure and Processing, 2013. 568: p. 108-117.
13. Fang, K.W., Li, G.J., Li, G.F., Yang, W., Zhang, M.L. and Sun, Z.Y., Microstructures and Mechanical Properties of Dissimilar Metal Weld A508/52M/316L Used in Nuclear Power Plants. Engineering Materials V, 2011. 479: p. 40-47.
14. Gong, N., Wang, G.Z., Xuan, F.Z. and Tu, S.T., Leak-before-break analysis of a dissimilar metal welded joint for connecting pipe-nozzle in nuclear power plants. Nuclear Engineering and Design, 2013. 255: p. 1-8.
15. Puska, E.K. and Suolanen, V., Influence of Material, Environment and Strain Rate on Environmentally Assisted Cracking of Austenitic Nuclear Materials (DEFSPEED). Safir2010: The Finnish Research Programme on Nuclear Power Plant Safety 2007- 2010: Final Report, 2011. 2571: p. 440-463.
16. Rebak, R.B., Stress corrosion cracking (SCC) of nickel-based alloys. Stress Corrosion Cracking: Theory and Practice, 2011: p. 273-306.
17. Jokinen, T., Novel ways of using Nd:YAG laser for welding thick section austenitic stainless steel, 2004, Lappeenranta University of Technology: Espoo.
18. Yu, Y.C., Yang, S.L., Yin, Y., Wang, C.M., Hu, X.Y., Meng, X.X. and Yu, S.F., Multi-pass laser welding of thick plate with filler wire by using a narrow gap joint configuration. Journal of Mechanical Science and Technology, 2013. 27(7): p. 2125-2131.

406
19. Kong, F.R., Liu, W., Ma, J.J., Levert, E. and Kovacevic, R., Feasibility study of laser welding assisted by filler wire for narrow-gap butt-jointed plates of high-strength steel. Welding in the World, 2013. 57(5): p. 693-699.
20. Zhang, X.D., Ashida, E., Tarasawa, S., Anma, Y., Okada, M., Katayama, S. and Mizutani, M., Welding of thick stainless steel plates up to 50 mm with high brightness lasers. Journal of Laser Applications, 2011. 23(2).
21. Dittrich, D., Schedewy, R., Brenner, B. and Standfuss, J., Laser-multi-pass-narrow-gap-welding of hot crack sensitive thick aluminum plates. Lasers in Manufacturing (Lim 2013), 2013. 41: p. 225-233.
22. Brust, F.W., Shim, D.J., Wilkowski, G. and Rudland, D., Pwscc Crack Growth Modeling Approaches. Proceedings of the Asme Pressure Vessels and Piping Conference Vol 1, 2012: p. 139-145.
23. U.S.NRC, Reactor Pressure Boundary Integrity Issues for Pressurized Water Reactors, 2017, United States Nuclear Regulatory Commission.
24. IEE, Nuclear Reactor Types, I.o.E. Engineers. 2005, Institution of Electrical Engineers: London.
25. Murray, R.L., Nuclear energy : an introduction to the concepts, systems, and applications of nuclear processes. 1975, New York ; Oxford: Pergamon.
26. Hewitt, G.F. and Collier, J.G., Introduction to nuclear power. 2nd ed. / Geoffrey F. Hewitt, John G. Collier. ed. 2000, New York ; London: Taylor & Francis.
27. IAEA, Nuclear power reactors in the world. 2017: Vienna : International Atomic Energy Agency, 2017.
28. U.S.NRC, Images of Plants PWR and BWR, 2017, United States Nuclear Regulatory Commission.
29. Bodansky, D., Nuclear energy : principles, practices, and prospects. 1996, Woodbury, N.Y.: American Institute of Physics.
30. Wang, H.T., Wang, G.Z., Xuan, F.Z. and Tu, S.T., Fracture mechanism of a dissimilar metal welded joint in nuclear power plant. Engineering Failure Analysis, 2013. 28: p. 134-148.
31. Jo, J.C. and Kang, D.G., CFD Analysis of Thermally Stratified Flow and Conjugate Heat Transfer in a PWR Pressurizer Surgeline. Journal of Pressure Vessel Technology, 2010. 132(2): p. 021301-021301-10.
32. Aaltonen, P. and Hanninen, H., Water chemistry and behavior of materials in PWRs and BWRs, 1997: International Atomic Energy Agency (IAEA). p. 205-222.
33. Nowacki, J., Urbański, M. and Zając, P., FCAW welding of duplex steel in construction of chemical cargo carriers. Welding International, 2008. 23(1): p. 34-42.
34. The Welding Institute, What is narrow gap welding?, 2018. 35. Elmesalamy, A., Narrow Gap Laser Welding of 316L Stainless Steel for Potential
Application in the Manufacture of Thick Section Nuclear Components, in Faculty of Engineering and Physical Sciences2013, The University of Manchester: Manchester.
36. Polysoude, Narrow Gap TIG Welding Guide. 2013, Nantes, France: Polysoude S. A. S.
37. Manring, S. The Art of Narrow-groove Welding. 2015. Available from: https://ewi.org/the-art-of-narrow-groove-welding/.
38. Steen, W.M., Laser material processing. 3rd ed. ed. 2003, London ; New York: Springer.
39. Ion, J.C., Laser processing of engineering materials : principles, procedure and industrial application. 2005, Amsterdam ; Oxford: Elsevier/Butterworth-Heinemann.

407
40. Steen, W.M. and Mazumder, J., Laser material processing. 4th ed. ed. 2010, London: Springer.
41. Katayama, S., Handbook of Laser Welding Technologies. 2013: Woodhead Publishing.
42. Atabaki, M.M., Yazdian, N., Ma, J. and Kovacevic, R., High power laser welding of thick steel plates in a horizontal butt joint configuration. Optics and Laser Technology, 2016. 83: p. 1-12.
43. Barthoux, J., Narrow gap welding of heavy wall thickness materials in nuclear and fossil fuel industries., 2008, Polysoude S. A. S.: Nantes.
44. Jokinen, T. and Kujanpaa, V., High power Nd : YAG laser welding in manufacturing of vacuum vessel of fusion reactor. Fusion Engineering and Design, 2003. 69(1-4): p. 349-353.
45. Feng, J., Guo, W., Francis, J., Irvine, N. and Li, L., Narrow gap laser welding for potential nuclear pressure vessel manufacture. Journal of Laser Applications, 2016. 28(2): p. 022421.
46. Feng, J.C., Rathod, D.W., Roy, M.J., Francis, J.A., Guo, W., Irvine, N.M., Vasileiou, A.N., Sun, Y.L., Smith, M.C. and Li, L., An evaluation of multipass narrow gap laser welding as a candidate process for the manufacture of nuclear pressure vessels. International Journal of Pressure Vessels and Piping, 2017. 157(Supplement C): p. 43-50.
47. Guo, W., Crowther, D., Francis, J.A., Thompson, A. and Li, L., Process-parameter interactions in ultra-narrow gap laser welding of high strength steels. International Journal of Advanced Manufacturing Technology, 2016. 84(9-12): p. 2547-2566.
48. Guo, W., Li, L., Dong, S.Y., Crowther, D. and Thompson, A., Comparison of microstructure and mechanical properties of ultra-narrow gap laser and gas-metal-arc welded S960 high strength steel. Optics and Lasers in Engineering, 2017. 91: p. 1-15.
49. Phaoniam, R., Shinozaki, K., Yamamoto, M., Kadoi, K., Tsuchiya, S. and Nishijima, A., Development of a highly efficient hot-wire laser hybrid process for narrow-gap welding-welding phenomena and their adequate conditions. Welding in the World, 2013. 57(5): p. 607-613.
50. Unt, A., Lappalainen, E. and Salminen, A., Autogeneous laser and hybrid laser arc welding of T-joint low alloy steel with fiber laser systems. Physics Procedia, 2013. 41: p. 140-143.
51. Elmesalamy, A.S., Li, L., Francis, J.A. and Sezer, H.K., Understanding the process parameter interactions in multiple-pass ultra-narrow-gap laser welding of thick-section stainless steels. International Journal of Advanced Manufacturing Technology, 2013. 68(1-4): p. 1-17.
52. Westinghouse Nuclear. Hot Wire Laser Welding. 2015 [cited 2.2.2018]; Available from: http://www.westinghousenuclear.com/Portals/0/Technovation%20Stuff/NS-IMS-0073%20Hot%20Wire%20Laser%20Welding%20.pdf.
53. Näsström, J., Frostevarg, J. and Silver, T., Hot-wire Laser Welding of Deep and Wide Gaps. Physics Procedia, 2015. 78: p. 247-254.
54. Todo, M., Shinozaki, K., Yamamoto, M., Kadoi, K., Yamamoto, M., Phaonaim, R. and Okagaito, T., Hot-wire Laser Welding Process Using Laser Diode for Large-Diameter Pipe with Narrow Gap Joint. QUARTERLY JOURNAL OF THE JAPAN WELDING SOCIETY, 2015. 33(2): p. 107s-110s.
55. Näsström, J., Frostevarg, J. and Kaplan, A., Multipass laser hot-wire welding: Morphology and process robustness. Journal of Laser Applications, 2017. 29(2): p. 022014.
408
56. Kaplan, A.F.H., Kim, K.H., Bang, H.-S., Bang, H.-S., Näsström, J. and Frostevarg, J., Narrow gap laser welding by multilayer hot wire addition. Journal of Laser Applications, 2016. 28(2): p. 022410.
57. Choi, Y.S., Jeong, H. and Lee, J.R., Laser Ultrasonic System for Surface Crack Visualization in Dissimilar Welds of Control Rod Drive Mechanism Assembly of Nuclear Power Plant. Shock and Vibration, 2014.
58. Huang, J.Y., Chiang, M.F., Jeng, S.L., Huang, J.S. and Kuo, R.C., Environmentally assisted cracking behavior of dissimilar metal weldments in simulated BWR coolant environments. Journal of Nuclear Materials, 2013. 432(1-3): p. 189-197.
59. Rudland, D., Csontos, A., Zhang, T. and Wilkowski, G., Welding Residual Stress Solutions for Dissimilar Metal Surge Line Nozzle Welds. Journal of Pressure Vessel Technology, 2010. 132(2): p. 021208-021208-7.
60. Hirano, S.e.a., Maintenance Activities for Alloy 600 in PWR Plants <Part 2>. EJAM, 2010. Vol.2(No3).
61. Song, T.-K., Numerical investigation on welding residual stresses in a PWR pressurizer safety/relief nozzle. Fatigue & Fracture of Engineering Materials & Structures, 2010.
62. Zhang, L.T. and Wang, J.Q., Effect of dissolved oxygen content on stress corrosion cracking of a cold worked 316L stainless steel in simulated pressurized water reactor primary water environment. Journal of Nuclear Materials, 2014. 446(1-3): p. 15-26.
63. Wang, H.T., Wang, G.Z., Xuan, F.Z., Liu, C.J. and Tu, S.T., Local Mechanical Properties and Microstructures of Alloy52M Dissimilar Metal Welded Joint between A508 Ferritic Steel and 316L Stainless Steel. Latest Development of Applied Materials Technology, 2012. 509: p. 103-110.
64. Kiser, S.D.e.a., Nickel alloy welding requirements for nuclear service. Focus on Nuclear Power Generation, 2005.
65. Hanninen, H., Brederholm, A. and Saukkonen, T., Hot Cracking Susceptibility of Ni-Base Alloy Dissimilar Metal Welds. Hot Cracking Phenomena in Welds Ii, 2008: p. 171-191.
66. Allen, T., Busby, J., Meyer, M. and Petti, D., Materials challenges for nuclear systems. Materials Today, 2010. 13(12): p. 14-23.
67. ASTM, A508/A508M − 17 - Standard Specification for Quenched and Tempered Vacuum-Treated Carbon and Alloy Steel Forgings for Pressure Vessels, 2017.
68. Kim, S., Im, Y.R., Lee, S., Lee, H.C., Oh, Y.J. and Hong, J.H., Effects of alloying elements on mechanical and fracture properties of base metals and simulated heat-affected zones of SA 508 steels. Metallurgical and Materials Transactions a-Physical Metallurgy and Materials Science, 2001. 32(4): p. 903-911.
69. Pous-Romero, H., Lonardelli, I., Cogswell, D. and Bhadeshia, H.K.D.H., Austenite grain growth in a nuclear pressure vessel steel. Materials Science and Engineering a-Structural Materials Properties Microstructure and Processing, 2013. 567: p. 72-79.
70. Kim, S., Lee, S., Im, Y.R., Lee, H.C., Kim, S.J. and Hong, J.H., Effects of alloying elements on fracture toughness in the transition temperature region of base metals and simulated heat-affected zones of Mn-Mo-Ni low-alloy steels. Metallurgical and Materials Transactions a-Physical Metallurgy and Materials Science, 2004. 35A(7): p. 2027-2037.
71. North American Stainless, Long Products Stainless Steel Grade Sheet AISI 316 and AISI 316L, 2018, North American Stainless.
409
72. ASTM, A182/A182M − 17 - Standard Specification for Forged or Rolled Alloy and Stainless Steel Pipe Flanges, Forged Fittings, and Valves and Parts for High-Temperature Service, 2017.
73. Steel Express, Hardness Conversion Table, 2018. 74. Hasanbaoglu, A. and Kacar, R., Resistance spot weldability of dissimilar materials
(AISI 316L-DIN EN 10130-99 steels). Materials & Design, 2007. 28(6): p. 1794-1800. 75. DuPont, J.N., Lippold, J.C. and Kiser, S.D., Welding metallurgy and weldability of
nickel-base alloys. 2009, Hoboken, N.J.: Wiley. 76. Sireesha, M., Albert, S.K., Shankar, V. and Sundaresan, S., A comparative evaluation
of welding consumables for dissimilar welds between 316LN austenitic stainless steel and Alloy 800. Journal of Nuclear Materials, 2000. 279(1): p. 65-76.
77. Rudland, D., Csontos, A., Zhang, T. and Wilkowski, G., Welding Residual Stress Solutions for Dissimilar Metal Surge Line Nozzle Welds. Journal of Pressure Vessel Technology-Transactions of the Asme, 2010. 132(2).
78. Special Metals, INCONEL Filler Metal 82, 2014, Special Metals. 79. Special Metals, INCONEL Welding Electrode 182, 2014, Special Metals. 80. Special Metals, INCONEL Filler Metal 52, 2014, Special Metals. 81. Special Metals, INCONEL Welding Electrode 152, 2014, Special Metals. 82. Mc Cracken, S.L. and Smith, R.E., EVALUATION OF FILLER METAL 52M (ERNiCrFe-7A)
HOT CRACKING WHEN WELDING ON CAST AUSTENITIC STAINLESS STEEL BASE MATERIALS. Proceedings of the Asme Pressure Vessels and Piping Conference, Pvp 2011, Vol 6, a and B, 2012: p. 407-420.
83. Le Calvar, M. and de Curieres, I., Corrosion issues in pressurized water reactor (PWR) systems. Nuclear Corrosion Science and Engineering, 2012(22): p. 473-547.
84. Young, G.A., Etien, R.A., Hackett, M.J., Tucker, J.D. and Capobianco, T.E., Physical Metallurgy, Weldability, and in-Service Performance of Nickel-Chromium Filler Metals Used in Nuclear Power Systems. 15th International Conference on Environmental Degradation of Materials in Nuclear Power Systems-Water Reactors, 2011: p. 2431-2441.
85. Chung, W.C., Huang, J.Y., Tsay, L.W. and Chen, C., Microstructure and Stress Corrosion Cracking Behavior of the Weld Metal in Alloy 52-A508 Dissimilar Welds. Materials Transactions, 2011. 52(1): p. 12-19.
86. Wu, W. and Tsai, C.H., Hot cracking susceptibility of fillers 52 and 82 in alloy 690 welding. Metallurgical and Materials Transactions a-Physical Metallurgy and Materials Science, 1999. 30(2): p. 417-426.
87. Special Metals, INCONEL Filler Metal 52M, 2014, Special Metals. 88. Kiser, S.D., Zhang, R. and Baker, B.A., A New Welding Material for Improved
Resistance to Ductility Dip Cracking. Trends in Welding Research, 2009: p. 639-644. 89. Special Metals, INCONEL Filler Metal 52MSS, 2014, Special Metals. 90. Gandy, D., Carbon Steel Handbook. 2007: EPRI. 91. Lancaster, J.F., Metallurgy of welding. 6th ed. ed. 1999, Cambridge: Abington. 92. Callagham, M., Discussions concerning dissimilar welding, 2014. 93. Lyon, S., Overview of corrosion engineering, science and technology. Nuclear
Corrosion Science and Engineering, 2012(22): p. 3-30. 94. Zhang, T., Brust, F.W. and Wilkowski, G., Weld Residual Stress in Various Large
Diameter Nuclear Nozzles. Journal of Pressure Vessel Technology-Transactions of the Asme, 2012. 134(6).
95. Guerre, C., Duhamel, C., Sennour, M., Crepin, J. and Le Calvar, M., Scc Crack Growth Rate of Alloy 82 in Pwr Primary Water Conditions - Effect of a Thermal Treatment -. 15th International Conference on Environmental Degradation of Materials in Nuclear Power Systems-Water Reactors, 2011: p. 1127-1139.

410
96. Feron, D., Nuclear corrosion science and engineering. Woodhead Publishing series in energy. 2012, Cambridge, UK: Woodhead Pub. 1042 p.
97. Ryan, M.P., Williams, D.E., Chater, R.J., Hutton, B.M. and McPhail, D.S., Why stainless steel corrodes. Nature, 2002. 415(6873): p. 770-774.
98. Kou, S., Welding metallurgy. 2nd ed. ed. 2002, New Jersey: Wiley. 99. Withers, P.J., Residual stress and its role in failure. Reports on Progress in Physics,
2007. 70(12): p. 2211-2264. 100. Na, M.G., Kim, J.W., Lim, D.H. and Kang, Y.J., Residual stress prediction of dissimilar
metals welding at NPPs using support vector regression. Nuclear Engineering and Design, 2008. 238(7): p. 1503-1510.
101. Deng, D., Kiyoshima, S., Ogawa, K., Yanagida, N. and Saito, K., Predicting welding residual stresses in a dissimilar metal girth welded pipe using 3D finite element model with a simplified heat source. Nuclear Engineering and Design, 2011. 241(1): p. 46-54.
102. Ficquet, X., Chidwick, L., Gilles, P. and Joly, P., Residual Stress Measurement on a Narrow Gap Dissimilar Metal Weld Pipe. Omae 2009, Vol 6, 2009: p. 193-207.
103. Ihara, R., Hashimoto, T. and Mochizuki, M., Residual stress variation due to piping processes of austenitic stainless steel. International Symposium on Materials Science and Innovation for Sustainable Society: Eco-Materials and Eco-Innovation for Global Sustainability (Eco-Mates 2011), 2012. 379.
104. Gilles, P. and Nouet, L., Residual stress numerical simulation of two dissimilar metal weld junctions. Residual Stress and Its Effects on Fatigue and Fracture, 2006: p. 3-13.
105. Deng, D., Ogawa, K., Kiyoshima, S., Yanagida, N. and Saito, K., Prediction of residual stresses in a dissimilar metal welded pipe with considering cladding, buttering and post weld heat treatment. Computational Materials Science, 2009. 47(2): p. 398-408.
106. Withers, P.J. and Bhadeshia, H.K.D.H., Overview - Residual stress part 1 - Measurement techniques. Materials Science and Technology, 2001. 17(4): p. 355-365.
107. Withers, P.J. and Bhadeshia, H.K.D.H., Overview - Residual stress part 2 - Nature and origins. Materials Science and Technology, 2001. 17(4): p. 366-375.
108. Guo, W., Francis, J.A., Li, L., Vasileiou, A.N., Crowther, D. and Thompson, A., Residual stress distributions in laser and gas-metal-arc welded high-strength steel plates. Materials Science and Technology, 2016. 32(14): p. 1449-1461.
109. Heldt, J. and Seifert, H.P., Stress corrosion cracking of low-alloy, reactor-pressure-vessel steels in oxygenated, high-temperature water. Nuclear Engineering and Design, 2001. 206(1): p. 57-89.
110. Ihara, R., Katsuyama, J., Onizawa, K., Hashimoto, T., Mikami, Y. and Mochizuki, M., Prediction of residual stress distributions due to surface machining and welding and crack growth simulation under residual stress distribution. Nuclear Engineering and Design, 2011. 241(5): p. 1335-1344.
111. Uchida, S. and Katsumura, Y., Water chemistry technology one of the key technologies for safe and reliable nuclear power plant operation. Journal of Nuclear Science and Technology, 2013. 50(4): p. 346-362.
112. Karlsen, W., Diego, G. and Devrient, B., Localized deformation as a key precursor to initiation of intergranular stress corrosion cracking of austenitic stainless steels employed in nuclear power plants. Journal of Nuclear Materials, 2010. 406(1): p. 138-151.
113. King, R.L.K.J.F., Austenitic Stainless Steel-Ferritic Steel Weld Joint Failures. Welding Journal Supplements, 1982.
411
114. Tomas, I., Vertesy, G., Barroso, S.P. and Kobayashi, S., Comparison of four NDT methods for indication of reactor steel degradation by high fluences of neutron irradiation. Nuclear Engineering and Design, 2013. 265: p. 201-209.
115. Vanhoorebeke, L., Vandevelde, J., Segers, D., Dorikensvanpraet, L. and Simula, S., Positron-Annihilation Measurements on Nuclear-Reactor Pressure-Vessel Steels. Journal De Physique Iv, 1995. 5(C1): p. 171-175.
116. Sun, Z. and Ion, J.C., Laser-Welding of Dissimilar Metal Combinations. Journal of Materials Science, 1995. 30(17): p. 4205-4214.
117. Rowe, M.D., Nelson, T.W. and Lippold, J.C., Hydrogen-induced cracking along the fusion boundary of dissimilar metal welds. Welding Journal, 1999. 78(2): p. 31s-37s.
118. Kou, S., Welding metallurgy. 1987: Wiley. 119. Easterling, K., Introduction to the Physical Metallurgy of Welding. Second Edition,
ed. K. Easterling. 1992. 256. 120. NPTEL, Design for welding I. 2018, National Programme on Technology Enhanced
Learning: India. Available from: https://nptel.ac.in/courses/112101005/modules/lec4-3/1.3.html.
121. Kim, S., Kang, S.Y., Oh, S.J., Kwon, S.J., Lee, S., Kim, J.H. and Hong, J.H., Correlation of the microstructure and fracture toughness of the heat-affected zones of an SA 508 steel. Metallurgical and Materials Transactions a-Physical Metallurgy and Materials Science, 2000. 31(4): p. 1107-1119.
122. Lippold, J.C. and Kotecki, D.J., Welding metallurgy and weldability of stainless steels. 2005, Hoboken, N.J. ; [Great Britain]: Wiley.
123. Granjon, H., Fundamentals of welding metallurgy. 1991: Woodhead. 124. Kim, J.H. and Yoon, E.P., Notch position in the HAZ specimen of reactor pressure
vessel steel. Journal of Nuclear Materials, 1998. 257(3): p. 303-308. 125. Young, G.A., Capobianco, T.E., Penik, M.A., Morris, B.W. and McGee, J.J., The
mechanism of ductility dip cracking in nickel-chromium alloys. Welding Journal, 2008. 87(2): p. 31s-43s.
126. Alexandrov, B.T., Hope, A.T., Sowards, J.W., Lippold, J.C. and McCracken, S., WELDABILITY STUDIES of HIGH-Cr, Ni-BASE filler metals for power generation applications. Welding in the World, 2011. 55(3-4): p. 65-76.
127. Mc Cracken, S., Review of thermo-mechanical testing and micro-characterization studies of ductility-dip cracking in nickel-base alloy 52 weld filler metal. Proceedings of the ASME Pressure Vessels and Piping Conference 2005, Vol 6, 2005. 6: p. 927-937.
128. Mc Cracken, S., Alloy 52/52M Welding Issues, 2010, EPRI Welding and Repair Technology Center: Rockville, Maryland.
129. Mc Cracken, S.L., Yu, X., Lim, Y.C., Farson, D.F. and Babu, S.S., Grain Structure Refinement in Nickel Alloy Welds by Magnetic Arc Stirring. Proceedings of the Asme Pressure Vessels and Piping Conference, Pvp 2011, Vol 6, a and B, 2012: p. 1565-1577.
130. Karhu, M. and Kujanpaa, V., Solidification Cracking Studies in Multi Pass Laser Hybrid Welding of Thick Section Austenitic Stainless Steel. Hot Cracking Phenomena in Welds Iii, 2011: p. 161-182.
131. Avery, R.E., Pay Attention to Dissimilar-Metal Welds. Chemical Engineering Progress, 1991. 87(5): p. 70-75.
132. Noecker Ii, F.F. and DuPont, J.N., Metallurgical Investigation into Ductility Dip Cracking in Ni-Based Alloys: Part II. Vol. 88. 2009. 62s-77s.
133. Fink, C., An investigation on ductility-dip cracking in the base metal heat-affected zone of wrought nickel base alloys—part I: metallurgical effects and cracking mechanism. Welding in the World, 2016. 60(5): p. 939-950.
412
134. Huang, C., Cao, G. and Kou, S., Liquation cracking in partial penetration aluminium welds: assessing tendencies to liquate. crack and backfill. Science and Technology of Welding and Joining, 2004. 9(2): p. 149-157.
135. Baranov, M.S., Metashop, L.A. and Geinrikh.In, Laser Welding of Some Dissimilar Metals. Welding Production, 1968. 15(3): p. 23-&.
136. Anawa, E.M. and Olabi, A.G., Optimization of tensile strength of ferritic/austenitic laser-welded components. Optics and Lasers in Engineering, 2008. 46(8): p. 571-577.
137. Parkes, D., Westerbaan, D., Nayak, S.S., Zhou, Y., Goodwin, F., Bhole, S. and Chen, D.L., Tensile properties of fiber laser welded joints of high strength low alloy and dual-phase steels at warm and low temperatures. Materials & Design, 2014. 56: p. 193-199.
138. Schimek, M., Springer, A., Pfeifer, R. and Kaierle, S., Laser Welding of dissimilar Materials for lightweight Construction and special Applications. High-Power Laser Materials Processing: Lasers, Beam Delivery, Diagnostics, and Applications Ii, 2013. 8603.
139. Shamsudin, S. and Yoon, P.C., Investigation on Mechanical Properties of Pulsed Nd:YAG Laser Welding on AISI 304 Stainless Steel to AISI 1008 Steel. Materials and Computational Mechanics, Pts 1-3, 2012. 117-119: p. 402-408.
140. Sathiya, P. and Jaleel, M.Y.A., Influence of shielding gas mixtures on bead profile and microstructural characteristics of super austenitic stainless steel weldments by laser welding. International Journal of Advanced Manufacturing Technology, 2011. 54(5-8): p. 525-535.
141. Parkes, D., Xu, W., Westerbaan, D., Nayak, S.S., Zhou, Y., Goodwin, F., Bhole, S. and Chen, D.L., Microstructure and fatigue properties of fiber laser welded dissimilar joints between high strength low alloy and dual-phase steels. Materials & Design, 2013. 51: p. 665-675.
142. Mahmoud, A.K., Taha, Z.A. and Shehab, A.A., Temperature Distribution Simulation For Pulsed Laser Spot Welding Of Dissimilar Stainless Steel AISI 302 To Low Carbon Steel AISI 1008. Materials and Manufacturing Technologies Xiv, 2012. 445: p. 412-417.
143. Ranjbarnodeh, E., Serajzadeh, S., Kokabi, A.H., Hanke, S. and Fischer, A., "Finite element modeling of the effect of heat input on residual stresses in dissimilar joints". International Journal of Advanced Manufacturing Technology, 2011. 55(5-8): p. 649-656.
144. Hu, Y.W., He, X.L., Yu, G., Ge, Z.F., Zheng, C.Y. and Ning, W.J., Heat and mass transfer in laser dissimilar welding of stainless steel and nickel. Applied Surface Science, 2012. 258(15): p. 5914-5922.
145. Ruggiero, A., Tricarico, L., Olabi, A.G. and Benyounis, K.Y., Weld-bead profile and costs optimisation of the CO2 dissimilar laser welding process of low carbon steel and austenitic steel AISI316. Optics and Laser Technology, 2011. 43(1): p. 82-90.
146. Olabi, A.G., Alsinani, F.O., Alabdulkarim, A.A., Ruggiero, A., Tricarico, L. and Benyounis, K.Y., Optimizing the CO2 laser welding process for dissimilar materials. Optics and Lasers in Engineering, 2013. 51(7): p. 832-839.
147. Kraetzsch, M., Standfuss, J., Klotzbach, A., Kaspar, J., Brenner, B. and Beyer, E., Laser Beam Welding with High-Frequency Beam Oscillation: Welding of Dissimilar Materials with Brilliant Fiber Lasers. Lasers in Manufacturing 2011: Proceedings of the Sixth International Wlt Conference on Lasers in Manufacturing, Vol 12, Pt A, 2011. 12: p. 142-149.

413
148. Sun, Z., Feasibility of producing ferritic/austenitic dissimilar metal joints by high energy density laser beam process. International Journal of Pressure Vessels and Piping, 1996. 68(2): p. 153-160.
149. Belforte, D.E. and Levitt, M.E., The industrial laser annual handbook : 1990 edition. 1990, Tulsa, OK: PennWell Publishing.
150. Duley, W.W., Laser welding. 1999, New York ; Chichester: Wiley. 151. Serizawa, H., Mori, D., Shirai, Y., Ogiwara, H. and Mori, H., Weldability of dissimilar
joint between F82H and SUS316L under fiber laser welding. Fusion Engineering and Design, 2013. 88(9-10): p. 2466-2470.
152. Gao, M., Wang, Z.M., Li, X.Y. and Zeng, X.Y., Laser Keyhole Welding of Dissimilar Ti-6Al-4V Titanium Alloy to AZ31B Magnesium Alloy. Metallurgical and Materials Transactions a-Physical Metallurgy and Materials Science, 2012. 43A(1): p. 163-172.
153. Lin, Y.D., Lee, H.T., Kuo, T.Y., Jeng, S.L. and Wu, J.L., Effects of beam offset on mechanical properties and corrosion resistance of Alloy 690-SUS 304L EBW joints for nuclear power plant. Journal of Nuclear Materials, 2010. 401(1-3): p. 78-85.
154. Salminen, A., The filler wire - laser beam interaction during laser welding with low alloyed steel filler wire. Mechanika, 2010(4): p. 67-74.
155. Sun, Z. and Salminen, A.S., Current Status of Laser Welding with Wire Feed. Materials and Manufacturing Processes, 1997. 12(5): p. 759-777.
156. Salminen, A.S. and Kujanpaa, V.P., Effect of wire feed position on laser welding with filler wire. Journal of Laser Applications, 2003. 15(1): p. 2-10.
157. IITK, Stress Strain Curve, 2018, Indian Institute of Technology Kanpur. 158. Viehrig, H.W. and Houska, H.W. Toughness behaviour of reactor pressure vessel
steels. Publications Repository - Helmholtz-Zentrum Dresden-Rossendorf, 2018. Available from: https://www.hzdr.de/db/Cms?pOid=11786&pNid=0.
159. U.S.NRC, NRC: 10 CFR Appendix G to Part 50—Fracture Toughness Requirements, 2017, United States Nuclear Regulatory Commission.
160. Hellier, C., Handbook of nondestructive evaluation. 2001, New York: McGraw-Hill. 161. Halmshaw, R., Introduction to the non-destructive testing of welded joints. 2nd ed.
ed. 1996, Cambridge: Abington Pub. 162. Prime, M.B., Cross-sectional mapping of residual stresses by measuring the surface
contour after a cut. Journal of Engineering Materials and Technology-Transactions of the Asme, 2001. 123(2): p. 162-168.
163. Withers, P.J., Turski, M., Edwards, L., Bouchard, P.J. and Buttle, D.J., Recent advances in residual stress measurement. International Journal of Pressure Vessels and Piping, 2008. 85(3): p. 118-127.
164. Sun, Y.L., Roy, M.J., Vasileiou, A.N., Smith, M.C., Francis, J.A. and Hosseinzadeh, F., Evaluation of Errors Associated with Cutting-Induced Plasticity in Residual Stress Measurements Using the Contour Method. Experimental Mechanics, 2017. 57(5): p. 719-734.
165. Johnson, G. Residual stress measurements using the contour method. 2008. 166. Prime, M. Contour Method: Principle. 2014 3/3/2014 [cited 6.3.2015]; Available
from: http://www.lanl.gov/contour/principle.html. 167. Vasileiou, A.N., Smith, M.C., Gandy, D., Ferhati, A., Romac, R. and Paddea, S.,
Residual Stresses in Thick-Section Electron Beam Welds in RPV Steels. Materials and Fabrication, 2016. 6B(50435): p. V06BT06A079.
168. Prime, M. Contour Method: Making the Cut Using Wire EDM. 2015 28/1/2015 [cited 6.3.2015]; Available from: http://www.lanl.gov/contour/cut.html.
169. Kartal, M., Turski, M., Johnson, G., Fitzpatrick, M.E., Gungor, S., Withers, P.J. and Edwards, L., Residual stress measurements in single and multi-pass groove weld

414
specimens using neutron diffraction and the contour method. Residual Stresses Vii, 2006. 524-525: p. 671-676.
170. Hosseinzadeh, F., Traore, Y., Bouchard, P.J. and Muransky, O., Mitigating cutting-induced plasticity in the contour method, part 1: Experimental. International Journal of Solids and Structures, 2016. 94-95: p. 247-253.
171. Prime, M. Contour Method: Measuring the Surface Contour 2007 12/3/2007 [cited 6.3.2015]; Available from: http://www.lanl.gov/contour/measure.html.
172. Javadi, Y., Smith, M.C., Venkata, K.A., Naveed, N., Forsey, A.N., Francis, J.A., Ainsworth, R.A., Truman, C.E., Smith, D.J., Hosseinzadeh, F., Gungor, S., Bouchard, P.J., Dey, H.C., Bhaduri, A.K. and Mahadevan, S., Residual stress measurement round robin on an electron beam welded joint between austenitic stainless steel 316L(N) and ferritic steel P91. International Journal of Pressure Vessels and Piping, 2017. 154: p. 41-57.
173. Prime, M.B., Sebring, R.J., Edwards, J.M., Hughes, D.J. and Webster, P.J., Laser surface-contouring and spline data-smoothing for residual stress measurement. Experimental Mechanics, 2004. 44(2): p. 176-184.
174. Traore, Y., Hosseinzadeh, F. and Bouchard, P.J., Plasticity in the contour method of residual stress measurement. Residual Stresses IX, 2014. 996: p. 337-342.
175. Muransky, O., Hamelin, C.J., Hosseinzadeh, F. and Prime, M.B., Mitigating cutting-induced plasticity in the contour method. Part 2: Numerical analysis. International Journal of Solids and Structures, 2016. 94-95: p. 254-262.
176. ASME, Boiler and Pressure Vessel Code Section IX, Welding General Requirements, 1998.
177. ISO, BS EN ISO 13919-1:1997 - Welding. Electron and laser beam welded joints. Guidance on quality levels for imperfections. Steel, 1997.
178. ISO, BS EN ISO 148-1:2016 - Metallic materials. Charpy pendulum impact test. Test method, 2016.
179. ISO, PD ISO/TS 7705:2017 - Guidelines for specifying Charpy V-notch impact prescriptions in steel specifications, 2017.
180. ISO, BS EN ISO 6507-1:2005 - Metallic materials. Vickers hardness test. Test method, 2006.
181. ASTM, E384 − 17 - Standard Test Method for Microindentation Hardness of Materials, 2017.
182. ASTM, E8/E8M − 16a - Standard Test Methods for Tension Testing of Metallic Materials, 2016.
183. Feng, J.C., Rathod, D.W., Roy, M.J., Francis, J.A., Guo, W., Irvine, N.M., Vasileiou, A.N., Sun, Y.L., Smith, M.C. and Li, L., An evaluation of multipass narrow gap laser welding as a candidate process for the manufacture of nuclear pressure vessels. International Journal of Pressure Vessels and Piping, 2017. 157: p. 43-50.
184. Aircraftmaterials.com., Stainless Steel ER 316 / 316L, Aircraftmaterials.com Ltd. 2018.
185. BSI, BS EN 10088-2:2014 - Stainless steels. Technical delivery conditions for sheet/plate and strip of corrosion resisting steels for general purposes, 2014.
186. BSI, BS EN 10025-1:2004 - Hot rolled products of structural steels Part 1: General technical delivery conditions, 2004.
187. Smiths Metal Centres Ltd., 316 / 316L Stainless Technical Datasheet, 2018. 188. Iidea Ltd., Certificate of conformity SA508 Gr3 Cl2, NAMRC SU1 / 4500793721,
2016. 189. Kerr, M., Prime, M.B., Swenson, H., Buechler, M.A., Steinzig, M., Clausen, B. and
Sisneros, T., Residual Stress Characterization in a Dissimilar Metal Weld Nuclear
415
Reactor Piping System Mock Up. Journal of Pressure Vessel Technology, 2013. 135(4): p. 041205-041205-8.
190. Rathod, D., Aravindan, S., Singh, P.K. and Pandey, S., Metallurgical Characterization and Diffusion Studies of Successively Buttered Deposit of Ni–Fe Alloy and Inconel on SA508 Ferritic Steel. Isij International, 2014. 54(8): p. 1866-1875.
191. Rathod, D.W., Pandey, S., Singh, P.K. and Prasad, R., Experimental analysis of dissimilar metal weld joint: Ferritic to austenitic stainless steel. Materials Science and Engineering: A, 2015. 639: p. 259-268.
192. de Lange, D.F. OPTICAL CHARACTERISTICS OF ND:YAG OPTICS AND DISTORTIONS AT HIGH POWER. in ICALEO 2005. 2005.
193. Reitemeyer, D., Seefeld, T. and Vollertsen, F. Online focus shift measurement in high power fiber laser welding. in 29th International Congress on Applications of Lasers and Electro-Optics, ICALEO 2010 - Congress Proceedings. 2010.
194. KUKA Roboter GmbH, KUKA Robots KR 30, 60 HA. 2017: KUKA GmbH. 195. Mitutoyo, Mitutoyo Measuring Instruments Catalog 2016. 196. Proto3000, Handy Scan 3D. 2017: Proto3000. 197. Atlas Steels, Stainless Steel Grade Datasheets, A.S.T. Department. 2013. 198. Woo, W., An, G.B., Truman, C.E., Jiang, W.C. and Hill, M.R., Two-dimensional
mapping of residual stresses in a thick dissimilar weld using contour method, deep hole drilling, and neutron diffraction. Journal of Materials Science, 2016. 51(23): p. 10620-10631.
199. ASTM, E23 − 16b - Standard Test Methods for Notched Bar Impact Testing of Metallic Materials, 2016.
200. Lippold, J.C., Welding metallurgy and weldability. 2015, Hoboken, New Jersey: John Wiley & Sons Inc. xvii, 400 pages.
201. Grange, R.A., Hribal, C.R. and Porter, L.F., Hardness of tempered martensite in carbon and low-alloy steels. Metallurgical Transactions a-Physical Metallurgy and Materials Science, 1977. 8(11): p. pp 1775-1785.
202. Hamelin, C.J., Muránsky, O., Smith, M.C., Holden, T.M., Luzin, V., Bendeich, P.J. and Edwards, L., Validation of a numerical model used to predict phase distribution and residual stress in ferritic steel weldments. Acta Materialia, 2014. 75: p. 1-19.
203. Vasileiou, A.N., Smith, M.C., Balakrishnan, J., Francis, J.A. and Hamelin, C.J., The impact of transformation plasticity on the electron beam welding of thick-section ferritic steel components. Nuclear Engineering and Design, 2017. 323: p. 309-316.
204. Special Metals, Inconel Alloy 690, 2018, Special Metals. 205. Special Metals, Product Handbook of High-Performance Nickel Alloys. 2018: Special
Metals. 206. Aalco Metals, Stainless Steel 1.4404 Sheet and Plate, 2018. 207. Kankanala, A., James, J., Bouchard, J., Northover, S. and Yescas, M. Measurement of
residual stresses in a dissimilar metal welded pipe. in MECA SENS VI. 208. DeWald, A.T., Hill, M.R. and Willis, E., Measurement of Welding Residual Stress in
Dissimilar Metal Welds Using the Contour Method. 2011: p. 1599-1605. 209. Dai, H., Modelling Residual Stress and Phase Transformations in Steel Welds.
Neutron Diffraction, I. Khidirov, Editor. 2012. Available from: https://www.intechopen.com/books/neutron-diffraction/modelling-residual-stress-and-phase-transformations-in-steel-welds.
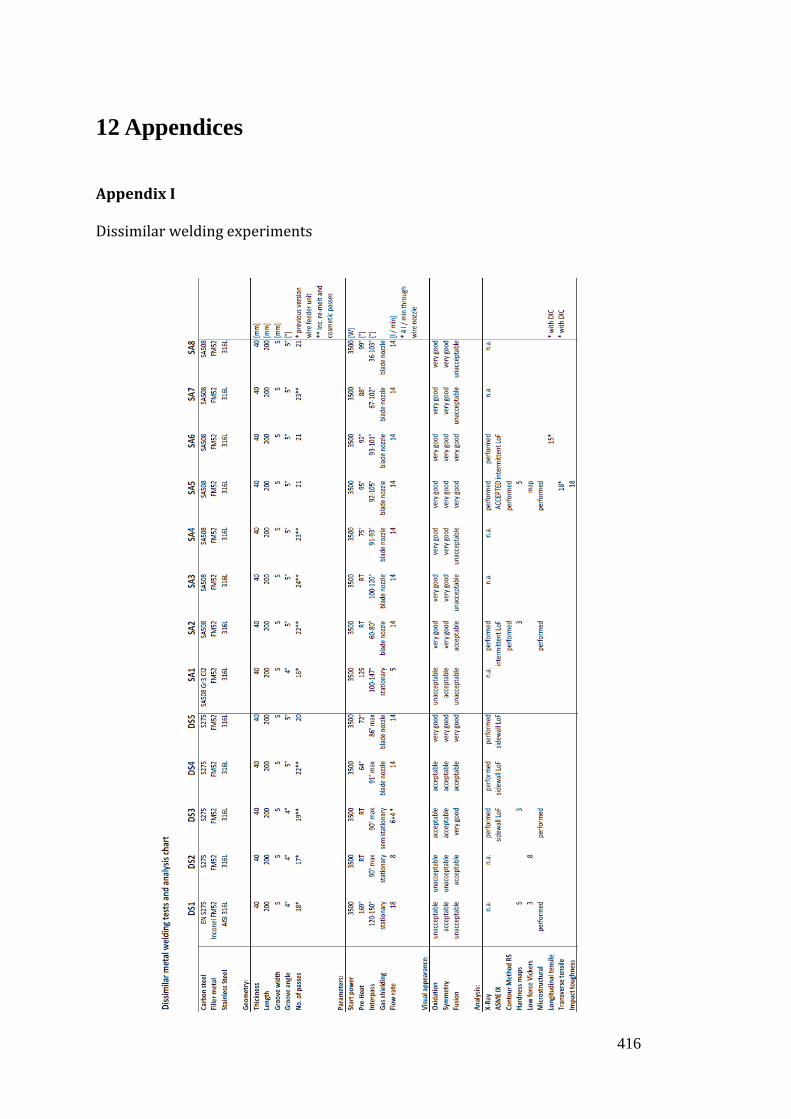
416
12 Appendices
Appendix I
Dissimilar welding experiments

417
Appendix II (1/8)
Radiographical examination report, sample DS3 (1/2)

418
Appendix II (2/8)
Radiographical examination report, sample DS3 (2/2)
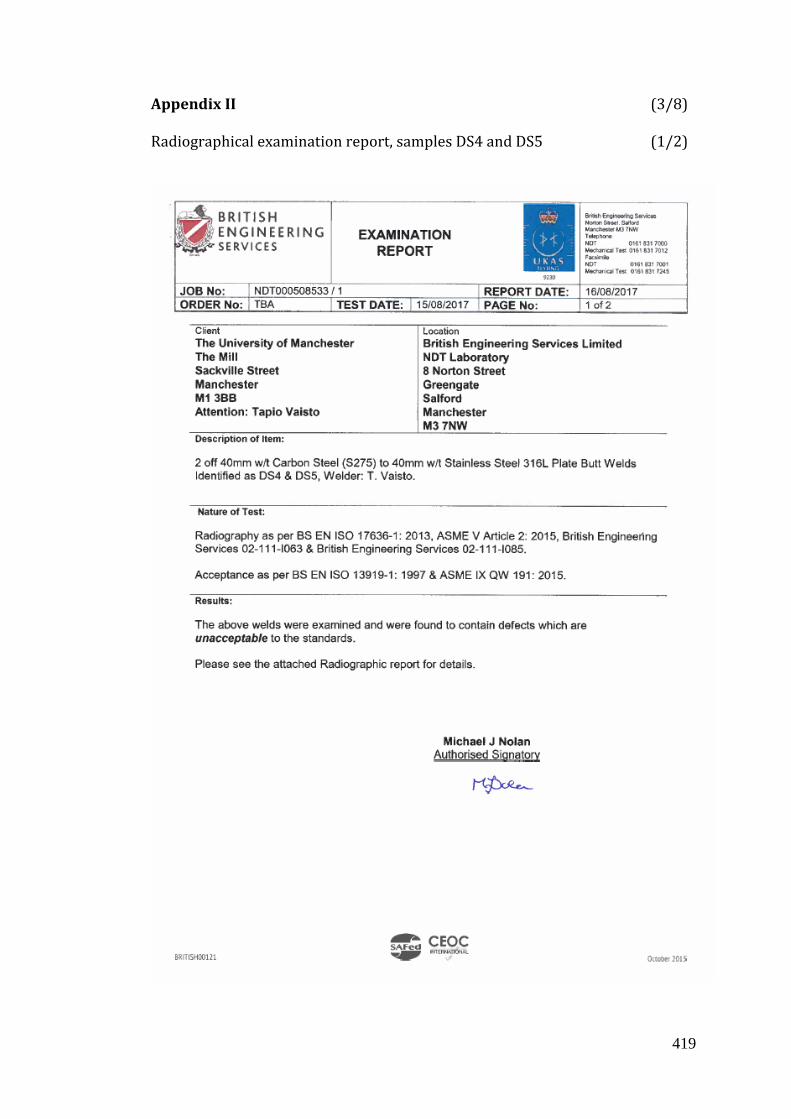
419
Appendix II (3/8)
Radiographical examination report, samples DS4 and DS5 (1/2)

420
Appendix II (4/8)
Radiographical examination report, samples DS4 and DS5 (2/2)

421
Appendix II (5/8)
Radiographical examination report, sample SA2 (1/2)

422
Appendix II (6/8)
Radiographical examination report, sample SA2 (2/2)

423
Appendix II (7/8)
Radiographical examination report, samples SA5 and SA6 (1/2)

424
Appendix II (8/8)
Radiographical examination report, samples SA5 and SA6 (2/2)

425
Appendix III
AISI 316L material data sheet [187]

426
Appendix IV
SA508 Gr3 Cl2 material certificate

427
Appendix V
Inconel Alloy FM52 material certificate
Melt no: NX5611JK, [Areva SA, 2016].

428
Appendix VI
Root thermocouple data SA1

429
Appendix VII
Top thermocouple data SA1