SPECMON3/6 Real Time Spectrum Analyzers Quick Start ... - Tektronix
106
x SPECMON3 Real Time Spectrum Analyzer and SPECMON6 Real Time Spectrum Analyzer ZZZ Quick Start User Manual *P071306406* 071-3064-06
-
Upload
khangminh22 -
Category
Documents
-
view
0 -
download
0
Transcript of SPECMON3/6 Real Time Spectrum Analyzers Quick Start ... - Tektronix

x
SPECMON3 Real Time Spectrum Analyzer andSPECMON6 Real Time Spectrum AnalyzerZZZ
Quick Start User Manual
*P071306406*
071-3064-06


SPECMON3 Real Time Spectrum Analyzer andSPECMON6 Real Time Spectrum AnalyzerZZZ
Quick Start User Manual
xx
www.tektronix.com071-3064-06

Copyright © Tektronix. All rights reserved. Licensed software products are owned by Tektronix or its subsidiaries or suppliers, and areprotected by national copyright laws and international treaty provisions.
Tektronix products are covered by U.S. and foreign patents, issued and pending. Information in this publication supersedes that in allpreviously published material. Specifications and price change privileges reserved.
TEKTRONIX and TEK are registered trademarks of Tektronix, Inc.
Bluetooth is a registered trademark of Bluetooth SIG, Inc.
LTE is a trademark of ETSI.
Contacting Tektronix
Tektronix, Inc.14150 SW Karl Braun DriveP.O. Box 500Beaverton, OR 97077USA
For product information, sales, service, and technical support:In North America, call 1-800-833-9200.Worldwide, visit www.tektronix.com to find contacts in your area.

Warranty
Tektronix warrants that this product will be free from defects in materials and workmanship for a period of one (1) year from the date ofshipment. If any such product proves defective during this warranty period, Tektronix, at its option, either will repair the defectiveproduct without charge for parts and labor, or will provide a replacement in exchange for the defective product. Parts, modules andreplacement products used by Tektronix for warranty work may be new or reconditioned to like new performance. All replacedparts, modules and products become the property of Tektronix.
In order to obtain service under this warranty, Customer must notify Tektronix of the defect before the expiration of the warranty periodand make suitable arrangements for the performance of service. Customer shall be responsible for packaging and shipping thedefective product to the service center designated by Tektronix, with shipping charges prepaid. Tektronix shall pay for the return of theproduct to Customer if the shipment is to a location within the country in which the Tektronix service center is located. Customer shallbe responsible for paying all shipping charges, duties, taxes, and any other charges for products returned to any other locations.
This warranty shall not apply to any defect, failure or damage caused by improper use or improper or inadequate maintenance andcare. Tektronix shall not be obligated to furnish service under this warranty a) to repair damage resulting from attempts by personnelother than Tektronix representatives to install, repair or service the product; b) to repair damage resulting from improper use orconnection to incompatible equipment; c) to repair any damage or malfunction caused by the use of non-Tektronix supplies; ord) to service a product that has been modified or integrated with other products when the effect of such modification or integrationincreases the time or difficulty of servicing the product.
THIS WARRANTY IS GIVEN BY TEKTRONIX WITH RESPECT TO THE PRODUCT IN LIEU OF ANY OTHER WARRANTIES,EXPRESS OR IMPLIED. TEKTRONIX AND ITS VENDORS DISCLAIM ANY IMPLIED WARRANTIES OF MERCHANTABILITY ORFITNESS FOR A PARTICULAR PURPOSE. TEKTRONIX' RESPONSIBILITY TO REPAIR OR REPLACE DEFECTIVE PRODUCTSIS THE SOLE AND EXCLUSIVE REMEDY PROVIDED TO THE CUSTOMER FOR BREACH OF THIS WARRANTY. TEKTRONIXAND ITS VENDORS WILL NOT BE LIABLE FOR ANY INDIRECT, SPECIAL, INCIDENTAL, OR CONSEQUENTIAL DAMAGESIRRESPECTIVE OF WHETHER TEKTRONIX OR THE VENDOR HAS ADVANCE NOTICE OF THE POSSIBILITY OF SUCHDAMAGES.
[W2 – 15AUG04]


Table of Contents
Table of Contents
Important safety information . . . . . . . . . . . . . . . . . . . . . . . . . . . . . . . . . . . . . . . . . . . . . . . . . . . . . . . . . . . . . . . . . . . . . . . . . . . . . . . . . . . . . . . . . . . . . . . . . . . . . . . . . . iiiGeneral safety summary. . . . . . . . . . . . . . . . . . . . . . . . . . . . . . . . . . . . . . . . . . . . . . . . . . . . . . . . . . . . . . . . . . . . . . . . . . . . . . . . . . . . . . . . . . . . . . . . . . . . . . . . . iiiService safety summary . . . . . . . . . . . . . . . . . . . . . . . . . . . . . . . . . . . . . . . . . . . . . . . . . . . . . . . . . . . . . . . . . . . . . . . . . . . . . . . . . . . . . . . . . . . . . . . . . . . . . . . . . vTerms in this manual . . . . . . . . . . . . . . . . . . . . . . . . . . . . . . . . . . . . . . . . . . . . . . . . . . . . . . . . . . . . . . . . . . . . . . . . . . . . . . . . . . . . . . . . . . . . . . . . . . . . . . . . . . . . . vSymbols and terms on the product . . . . . . . . . . . . . . . . . . . . . . . . . . . . . . . . . . . . . . . . . . . . . . . . . . . . . . . . . . . . . . . . . . . . . . . . . . . . . . . . . . . . . . . . . . . . . . v
Compliance information . . . . . . . . . . . . . . . . . . . . . . . . . . . . . . . . . . . . . . . . . . . . . . . . . . . . . . . . . . . . . . . . . . . . . . . . . . . . . . . . . . . . . . . . . . . . . . . . . . . . . . . . . . . . . . . viEMC compliance . . . . . . . . . . . . . . . . . . . . . . . . . . . . . . . . . . . . . . . . . . . . . . . . . . . . . . . . . . . . . . . . . . . . . . . . . . . . . . . . . . . . . . . . . . . . . . . . . . . . . . . . . . . . . . . . . viSafety compliance. . . . . . . . . . . . . . . . . . . . . . . . . . . . . . . . . . . . . . . . . . . . . . . . . . . . . . . . . . . . . . . . . . . . . . . . . . . . . . . . . . . . . . . . . . . . . . . . . . . . . . . . . . . . . . . viiEnvironmental considerations . . . . . . . . . . . . . . . . . . . . . . . . . . . . . . . . . . . . . . . . . . . . . . . . . . . . . . . . . . . . . . . . . . . . . . . . . . . . . . . . . . . . . . . . . . . . . . . . . . . ix
Preface . . . . . . . . . . . . . . . . . . . . . . . . . . . . . . . . . . . . . . . . . . . . . . . . . . . . . . . . . . . . . . . . . . . . . . . . . . . . . . . . . . . . . . . . . . . . . . . . . . . . . . . . . . . . . . . . . . . . . . . . . . . . . . . . . xKey Features . . . . . . . . . . . . . . . . . . . . . . . . . . . . . . . . . . . . . . . . . . . . . . . . . . . . . . . . . . . . . . . . . . . . . . . . . . . . . . . . . . . . . . . . . . . . . . . . . . . . . . . . . . . . . . . . . . . . . xiDocumentation . . . . . . . . . . . . . . . . . . . . . . . . . . . . . . . . . . . . . . . . . . . . . . . . . . . . . . . . . . . . . . . . . . . . . . . . . . . . . . . . . . . . . . . . . . . . . . . . . . . . . . . . . . . . . . . . . . xiiSoftware Upgrades. . . . . . . . . . . . . . . . . . . . . . . . . . . . . . . . . . . . . . . . . . . . . . . . . . . . . . . . . . . . . . . . . . . . . . . . . . . . . . . . . . . . . . . . . . . . . . . . . . . . . . . . . . . . . . xiiConventions Used in This Manual. . . . . . . . . . . . . . . . . . . . . . . . . . . . . . . . . . . . . . . . . . . . . . . . . . . . . . . . . . . . . . . . . . . . . . . . . . . . . . . . . . . . . . . . . . . . . . xii
Installation. . . . . . . . . . . . . . . . . . . . . . . . . . . . . . . . . . . . . . . . . . . . . . . . . . . . . . . . . . . . . . . . . . . . . . . . . . . . . . . . . . . . . . . . . . . . . . . . . . . . . . . . . . . . . . . . . . . . . . . . . . . . . . 1Before Installation . . . . . . . . . . . . . . . . . . . . . . . . . . . . . . . . . . . . . . . . . . . . . . . . . . . . . . . . . . . . . . . . . . . . . . . . . . . . . . . . . . . . . . . . . . . . . . . . . . . . . . . . . . . . . . . . 1Standard Accessories. . . . . . . . . . . . . . . . . . . . . . . . . . . . . . . . . . . . . . . . . . . . . . . . . . . . . . . . . . . . . . . . . . . . . . . . . . . . . . . . . . . . . . . . . . . . . . . . . . . . . . . . . . . . 1Optional Accessories . . . . . . . . . . . . . . . . . . . . . . . . . . . . . . . . . . . . . . . . . . . . . . . . . . . . . . . . . . . . . . . . . . . . . . . . . . . . . . . . . . . . . . . . . . . . . . . . . . . . . . . . . . . . 3Options . . . . . . . . . . . . . . . . . . . . . . . . . . . . . . . . . . . . . . . . . . . . . . . . . . . . . . . . . . . . . . . . . . . . . . . . . . . . . . . . . . . . . . . . . . . . . . . . . . . . . . . . . . . . . . . . . . . . . . . . . . . 3Operating Considerations. . . . . . . . . . . . . . . . . . . . . . . . . . . . . . . . . . . . . . . . . . . . . . . . . . . . . . . . . . . . . . . . . . . . . . . . . . . . . . . . . . . . . . . . . . . . . . . . . . . . . . . . 4Connecting to the Instrument . . . . . . . . . . . . . . . . . . . . . . . . . . . . . . . . . . . . . . . . . . . . . . . . . . . . . . . . . . . . . . . . . . . . . . . . . . . . . . . . . . . . . . . . . . . . . . . . . . . . 5Powering On the Instrument . . . . . . . . . . . . . . . . . . . . . . . . . . . . . . . . . . . . . . . . . . . . . . . . . . . . . . . . . . . . . . . . . . . . . . . . . . . . . . . . . . . . . . . . . . . . . . . . . . . . . 6Powering Off the Instrument . . . . . . . . . . . . . . . . . . . . . . . . . . . . . . . . . . . . . . . . . . . . . . . . . . . . . . . . . . . . . . . . . . . . . . . . . . . . . . . . . . . . . . . . . . . . . . . . . . . . . 6Removing the Power. . . . . . . . . . . . . . . . . . . . . . . . . . . . . . . . . . . . . . . . . . . . . . . . . . . . . . . . . . . . . . . . . . . . . . . . . . . . . . . . . . . . . . . . . . . . . . . . . . . . . . . . . . . . . 6Operating System Restore. . . . . . . . . . . . . . . . . . . . . . . . . . . . . . . . . . . . . . . . . . . . . . . . . . . . . . . . . . . . . . . . . . . . . . . . . . . . . . . . . . . . . . . . . . . . . . . . . . . . . . . 7Adding an External Monitor . . . . . . . . . . . . . . . . . . . . . . . . . . . . . . . . . . . . . . . . . . . . . . . . . . . . . . . . . . . . . . . . . . . . . . . . . . . . . . . . . . . . . . . . . . . . . . . . . . . . . . 8Inspecting the Instrument . . . . . . . . . . . . . . . . . . . . . . . . . . . . . . . . . . . . . . . . . . . . . . . . . . . . . . . . . . . . . . . . . . . . . . . . . . . . . . . . . . . . . . . . . . . . . . . . . . . . . . . 12User Maintenance. . . . . . . . . . . . . . . . . . . . . . . . . . . . . . . . . . . . . . . . . . . . . . . . . . . . . . . . . . . . . . . . . . . . . . . . . . . . . . . . . . . . . . . . . . . . . . . . . . . . . . . . . . . . . . . 13
Operation. . . . . . . . . . . . . . . . . . . . . . . . . . . . . . . . . . . . . . . . . . . . . . . . . . . . . . . . . . . . . . . . . . . . . . . . . . . . . . . . . . . . . . . . . . . . . . . . . . . . . . . . . . . . . . . . . . . . . . . . . . . . . . 14Getting Acquainted with Your Instrument . . . . . . . . . . . . . . . . . . . . . . . . . . . . . . . . . . . . . . . . . . . . . . . . . . . . . . . . . . . . . . . . . . . . . . . . . . . . . . . . . . . . . . 14Basic Concepts. . . . . . . . . . . . . . . . . . . . . . . . . . . . . . . . . . . . . . . . . . . . . . . . . . . . . . . . . . . . . . . . . . . . . . . . . . . . . . . . . . . . . . . . . . . . . . . . . . . . . . . . . . . . . . . . . . 23Navigating Displays . . . . . . . . . . . . . . . . . . . . . . . . . . . . . . . . . . . . . . . . . . . . . . . . . . . . . . . . . . . . . . . . . . . . . . . . . . . . . . . . . . . . . . . . . . . . . . . . . . . . . . . . . . . . . 25Selecting Displays. . . . . . . . . . . . . . . . . . . . . . . . . . . . . . . . . . . . . . . . . . . . . . . . . . . . . . . . . . . . . . . . . . . . . . . . . . . . . . . . . . . . . . . . . . . . . . . . . . . . . . . . . . . . . . . 26Connecting a Signal. . . . . . . . . . . . . . . . . . . . . . . . . . . . . . . . . . . . . . . . . . . . . . . . . . . . . . . . . . . . . . . . . . . . . . . . . . . . . . . . . . . . . . . . . . . . . . . . . . . . . . . . . . . . . 34Starting and Stopping Acquisitions . . . . . . . . . . . . . . . . . . . . . . . . . . . . . . . . . . . . . . . . . . . . . . . . . . . . . . . . . . . . . . . . . . . . . . . . . . . . . . . . . . . . . . . . . . . . . 35Markers . . . . . . . . . . . . . . . . . . . . . . . . . . . . . . . . . . . . . . . . . . . . . . . . . . . . . . . . . . . . . . . . . . . . . . . . . . . . . . . . . . . . . . . . . . . . . . . . . . . . . . . . . . . . . . . . . . . . . . . . . . 37Touchscreen Actions . . . . . . . . . . . . . . . . . . . . . . . . . . . . . . . . . . . . . . . . . . . . . . . . . . . . . . . . . . . . . . . . . . . . . . . . . . . . . . . . . . . . . . . . . . . . . . . . . . . . . . . . . . . . 40Printing . . . . . . . . . . . . . . . . . . . . . . . . . . . . . . . . . . . . . . . . . . . . . . . . . . . . . . . . . . . . . . . . . . . . . . . . . . . . . . . . . . . . . . . . . . . . . . . . . . . . . . . . . . . . . . . . . . . . . . . . . . 42Saving Data . . . . . . . . . . . . . . . . . . . . . . . . . . . . . . . . . . . . . . . . . . . . . . . . . . . . . . . . . . . . . . . . . . . . . . . . . . . . . . . . . . . . . . . . . . . . . . . . . . . . . . . . . . . . . . . . . . . . . 44Recalling Data. . . . . . . . . . . . . . . . . . . . . . . . . . . . . . . . . . . . . . . . . . . . . . . . . . . . . . . . . . . . . . . . . . . . . . . . . . . . . . . . . . . . . . . . . . . . . . . . . . . . . . . . . . . . . . . . . . . 45Plotting Measurements on a Map . . . . . . . . . . . . . . . . . . . . . . . . . . . . . . . . . . . . . . . . . . . . . . . . . . . . . . . . . . . . . . . . . . . . . . . . . . . . . . . . . . . . . . . . . . . . . . 47Advanced Techniques. . . . . . . . . . . . . . . . . . . . . . . . . . . . . . . . . . . . . . . . . . . . . . . . . . . . . . . . . . . . . . . . . . . . . . . . . . . . . . . . . . . . . . . . . . . . . . . . . . . . . . . . . . . 61
SPECMON3 & SPECMON6 Quick Start User Manual i

Table of Contents
Index
ii SPECMON3 & SPECMON6 Quick Start User Manual

Important safety information
Important safety information
This manual contains information and warnings that must be followed by the user for safe operation and to keep theproduct in a safe condition.
To safely perform service on this product, additional information is provided at the end of this section. (See page v,Service safety summary.)
General safety summaryUse the product only as specified. Review the following safety precautions to avoid injury and prevent damage to this productor any products connected to it. Carefully read all instructions. Retain these instructions for future reference.
Comply with local and national safety codes.
For correct and safe operation of the product, it is essential that you follow generally accepted safety procedures in additionto the safety precautions specified in this manual.
The product is designed to be used by trained personnel only.
Only qualified personnel who are aware of the hazards involved should remove the cover for repair, maintenance, oradjustment.
Before use, always check the product with a known source to be sure it is operating correctly.
This product is not intended for detection of hazardous voltages.
Use personal protective equipment to prevent shock and arc blast injury where hazardous live conductors are exposed.
While using this product, you may need to access other parts of a larger system. Read the safety sections of the othercomponent manuals for warnings and cautions related to operating the system.
When incorporating this equipment into a system, the safety of that system is the responsibility of the assembler of the system.
To avoid fire or personal injury
Use proper power cord. Use only the power cord specified for this product and certified for the country of use.
Do not use the provided power cord for other products.
Ground the product. This product is grounded through the grounding conductor of the power cord. To avoid electricshock, the grounding conductor must be connected to earth ground. Before making connections to the input or outputterminals of the product, make sure that the product is properly grounded.
Do not disable the power cord grounding connection.
Power disconnect. The power cord disconnects the product from the power source. See instructions for the location. Donot position the equipment so that it is difficult to disconnect the power cord; it must remain accessible to the user at alltimes to allow for quick disconnection if needed.
Connect and disconnect properly. Do not connect or disconnect probes or test leads while they are connectedto a voltage source.
Observe all terminal ratings. To avoid fire or shock hazard, observe all ratings and markings on the product. Consultthe product manual for further ratings information before making connections to the product.
SPECMON3 & SPECMON6 Quick Start User Manual iii

Important safety information
Do not apply a potential to any terminal, including the common terminal, that exceeds the maximum rating of that terminal.
The measuring terminals on this product are not rated for connection to mains or Category II, III, or IV circuits.
Do not operate without covers. Do not operate this product with covers or panels removed, or with the case open.Hazardous voltage exposure is possible.
Avoid exposed circuitry. Do not touch exposed connections and components when power is present.
Do not operate with suspected failures. If you suspect that there is damage to this product, have it inspected byqualified service personnel.
Disable the product if it is damaged. Do not use the product if it is damaged or operates incorrectly. If in doubt about safety ofthe product, turn it off and disconnect the power cord. Clearly mark the product to prevent its further operation.
Before use, inspect voltage probes, test leads, and accessories for mechanical damage and replace when damaged.
Examine the exterior of the product before you use it. Look for cracks or missing pieces.
Use only specified replacement parts.
Wear eye protection. Wear eye protection if exposure to high-intensity rays or laser radiation exists.
Do not operate in wet/damp conditions. Be aware that condensation may occur if a unit is moved from a cold to awarm environment.
Do not operate in an explosive atmosphere.
Keep product surfaces clean and dry. Remove the input signals before you clean the product.
Provide proper ventilation. Refer to the installation instructions in the manual for details on installing the productso it has proper ventilation.
Slots and openings are provided for ventilation and should never be covered or otherwise obstructed. Do not push objectsinto any of the openings.
Provide a safe working environment. Always place the product in a location convenient for viewing the displayand indicators.
Avoid improper or prolonged use of keyboards, pointers, and button pads. Improper or prolonged keyboard or pointer usemay result in serious injury.
Be sure your work area meets applicable ergonomic standards. Consult with an ergonomics professional to avoid stressinjuries.
Use care when lifting and carrying the product. This product is provided with handles for lifting and carrying.
WARNING. The product is heavy. To reduce the risk of personal injury or damage to the device get help when lifting orcarrying the product.
Use only the Tektronix rackmount hardware specified for this product.
iv SPECMON3 & SPECMON6 Quick Start User Manual

Important safety information
Service safety summaryThe Service safety summary section contains additional information required to safely perform service on the product. Onlyqualified personnel should perform service procedures. Read this Service safety summary and the General safety summarybefore performing any service procedures.
To avoid electric shock. Do not touch exposed connections.
Do not service alone. Do not perform internal service or adjustments of this product unless another person capable ofrendering first aid and resuscitation is present.
Disconnect power. To avoid electric shock, switch off the product power and disconnect the power cord from the mainspower before removing any covers or panels, or opening the case for servicing.
Use care when servicing with power on. Dangerous voltages or currents may exist in this product. Disconnectpower, remove battery (if applicable), and disconnect test leads before removing protective panels, soldering, or replacingcomponents.
Verify safety after repair. Always recheck ground continuity and mains dielectric strength after performing a repair.
Terms in this manualThese terms may appear in this manual:
WARNING. Warning statements identify conditions or practices that could result in injury or loss of life.
CAUTION. Caution statements identify conditions or practices that could result in damage to this product or other property.
Symbols and terms on the productThese terms may appear on the product:
DANGER indicates an injury hazard immediately accessible as you read the marking.
WARNING indicates an injury hazard not immediately accessible as you read the marking.
CAUTION indicates a hazard to property including the product.
When this symbol is marked on the product, be sure to consult the manual to find out the nature of thepotential hazards and any actions which have to be taken to avoid them. (This symbol may also be used torefer the user to ratings in the manual.)
The following symbol(s) may appear on the product:
SPECMON3 & SPECMON6 Quick Start User Manual v

Compliance information
Compliance information
This section lists the EMC (electromagnetic compliance), safety, and environmental standards with which the instrumentcomplies.
EMC complianceEC Declaration of Conformity – EMC
Meets intent of Directive 2004/108/EC for Electromagnetic Compatibility. Compliance was demonstrated to the followingspecifications as listed in the Official Journal of the European Communities:
EN 61326-1 2006, EN 61326-2-1 2006. EMC requirements for electrical equipment for measurement, control, andlaboratory use. 1 2 3
CISPR 11:2003. Radiated and conducted emissions, Group 1, Class A
IEC 61000-4-2:2001. Electrostatic discharge immunity
IEC 61000-4-3:2002. RF electromagnetic field immunity 5
IEC 61000-4-4:2004. Electrical fast transient / burst immunity
IEC 61000-4-5:2001. Power line surge immunity
IEC 61000-4-6:2003. Conducted RF immunity 6
IEC 61000-4-11:2004. Voltage dips and interruptions immunity 4, 7
EN 61000-3-2:2006. AC power line harmonic emissions
EN 61000-3-3:1995. Voltage changes, fluctuations, and flicker
European contact.Tektronix UK, Ltd.Western PeninsulaWestern RoadBracknell, RG12 1RFUnited Kingdom
1 This product is intended for use in nonresidential areas only. Use in residential areas may cause electromagnetic interference.
2 Emissions which exceed the levels required by this standard may occur when this equipment is connected to a test object.
3 For compliance with the EMC standards listed here, high quality shielded interface cables should be used.
4 At the IEC 61000-4-11 Voltage-Interruption Transient Immunity test at 0% for 250 cycles, the EUT reboots and can take greaterthan 10 seconds to recover.
5 Performance degradation information for the IEC 61000-4-3 test: Residual spurious signals can typically increase to -55 dBm withexposure to the disturbance levels of this test.
6 Performance degradation information for the IEC 61000-4-6 test: Residual spurious signals can typically increase to the worse ofeither 55 dB below reference level or -75 dBm, with exposure to the disturbance levels of this test.
7 Performance Criterion C applied at the 70%/25 cycle Voltage-Dip and the 0%/250 cycle Voltage-Interruption test levels (IEC61000-4-11).
vi SPECMON3 & SPECMON6 Quick Start User Manual

Compliance information
Australia / New Zealand Declaration of Conformity – EMC
Complies with the EMC provision of the Radiocommunications Act per the following standard, in accordance with ACMA:
CISPR 11:2003. Radiated and Conducted Emissions, Group 1, Class A, in accordance with EN 61326-1:2006 andEN 61326-2-1:2006.
Australia / New Zealand contact.
Baker & McKenzieLevel 27, AMP Centre50 Bridge StreetSydney NSW 2000, Australia
Safety complianceThis section lists the safety standards with which the product complies and other safety compliance information.
EU declaration of conformity – low voltage
Compliance was demonstrated to the following specification as listed in the Official Journal of the European Union:
Low Voltage Directive 2006/95/EC.
EN 61010-1. Safety Requirements for Electrical Equipment for Measurement, Control, and Laboratory Use – Part1: General Requirements.
U.S. nationally recognized testing laboratory listing
UL 61010-1. Safety Requirements for Electrical Equipment for Measurement, Control, and Laboratory Use – Part1: General Requirements.
Canadian certification
CAN/CSA-C22.2 No. 61010-1. Safety Requirements for Electrical Equipment for Measurement, Control, and LaboratoryUse – Part 1: General Requirements.
Additional compliances
IEC 61010-1. Safety Requirements for Electrical Equipment for Measurement, Control, and Laboratory Use – Part1: General Requirements.
Equipment type
Test and measuring equipment.
Safety class
Class 1 – grounded product.
SPECMON3 & SPECMON6 Quick Start User Manual vii

Compliance information
Pollution degree descriptions
A measure of the contaminants that could occur in the environment around and within a product. Typically the internalenvironment inside a product is considered to be the same as the external. Products should be used only in the environmentfor which they are rated.
Pollution degree 1. No pollution or only dry, nonconductive pollution occurs. Products in this category are generallyencapsulated, hermetically sealed, or located in clean rooms.
Pollution degree 2. Normally only dry, nonconductive pollution occurs. Occasionally a temporary conductivity that iscaused by condensation must be expected. This location is a typical office/home environment. Temporary condensationoccurs only when the product is out of service.
Pollution degree 3. Conductive pollution, or dry, nonconductive pollution that becomes conductive due to condensation.These are sheltered locations where neither temperature nor humidity is controlled. The area is protected from directsunshine, rain, or direct wind.
Pollution degree 4. Pollution that generates persistent conductivity through conductive dust, rain, or snow. Typicaloutdoor locations.
Pollution degree rating
Pollution degree 2 (as defined in IEC 61010-1). Rated for indoor, dry location use only.
Measurement and overvoltage category descriptions
Measurement terminals on this product may be rated for measuring mains voltages from one or more of the followingcategories (see specific ratings marked on the product and in the manual).
Category II. Circuits directly connected to the building wiring at utilization points (socket outlets and similar points).
Category III. In the building wiring and distribution system.
Category IV. At the source of the electrical supply to the building.
NOTE. Only mains power supply circuits have an overvoltage category rating. Only measurement circuits have ameasurement category rating. Other circuits within the product do not have either rating.
Mains overvoltage category rating
Overvoltage category II (as defined in IEC 61010-1).
viii SPECMON3 & SPECMON6 Quick Start User Manual

Compliance information
Environmental considerationsThis section provides information about the environmental impact of the product.
Product end-of-life handling
Observe the following guidelines when recycling an instrument or component:
Equipment recycling. Production of this equipment required the extraction and use of natural resources. The equipmentmay contain substances that could be harmful to the environment or human health if improperly handled at the product’send of life. To avoid release of such substances into the environment and to reduce the use of natural resources, weencourage you to recycle this product in an appropriate system that will ensure that most of the materials are reusedor recycled appropriately.
This symbol indicates that this product complies with the applicable European Union requirements accordingto Directives 2012/19/EU and 2006/66/EC on waste electrical and electronic equipment (WEEE) andbatteries. For information about recycling options, check the Support/Service section of the Tektronix Website (www.tektronix.com).
Perchlorate materials. This product contains one or more type CR lithium batteries. According to the stateof California, CR lithium batteries are classified as perchlorate materials and require special handling. Seewww.dtsc.ca.gov/hazardouswaste/perchlorate for additional information.
Restriction of hazardous substances
This product is classified as an industrial monitoring and control instrument, and is not required to comply with the substancerestrictions of the recast RoHS Directive 2011/65/EU until July 22, 2017.
SPECMON3 & SPECMON6 Quick Start User Manual ix

Preface
Preface
This manual describes the installation and basic operation of the SPECMON3 Real-Time Spectrum Analyzers andSPECMON6 Real-Time Spectrum Analyzers. For more detailed information, see the Help for your instrument.
SPECMON3
SPECMON6
x SPECMON3 & SPECMON6 Quick Start User Manual

Preface
Key FeaturesLeading real time technologies help to troubleshoot the toughest transient interferences in the field:
Unique Swept DPX enables “Real Time Scanning” of the whole 3 GHz – 26.5 GHz frequency range for transientinterference discovery (Opt. 200)
Up to 165 MHz ultra-wide real-time BW for "close-in" signal discovery, capture and real-time demodulation
DPX density™ trigger (Opt. 200) on frequency domain events (Opt. 52) and distinguish between continuous signals vsinfrequent events
Save hours of post-capture review time with optional advanced triggering capabilities such as Save-on-Trigger, whichintelligently saves events of interest automatically
Integrated solution design reduces total cost of ownership with lower initial purchase cost and annual maintenance cost
Both manual and automatic drive test are supported by built-in mapping software. Commercial off-the-shelf 3rd partyGPS receiver supported via USB or Bluetooth connection
Field pulse analysis (for example, airport radar) is easier than ever with automated Pulse Analysis suite
Save up to 12 years of gap-free DPX Spectrogram/Real-Time Waterfall Traces (Opt. 53) or up to 5.37 seconds of IQdata at full 165 MHz BW (Opt. B16x) with extra-large real-time memory, eliminating the need for an external datarecorder in many cases
25, 40, 85, 125, or 165 MHz acquisition bandwidths
Full 165 MHz bandwidth real-time IQ data can be streamed to external, data recording devices (Opt. 65) forcomprehensive post analysis
Instrumentation needs for frequency-domain, modulation-domain and time-domain analysis are simplified by native3-in-1 multiple-domain correlation and analysis capability
Modulation analysis for 20+ general purpose analog and digital signal types, including AM/FM demodulation, APCO P25transmitter and flexible WLAN signal analysis
Built-in versatile field measurement items including Field Strength, Signal Strength, EMI test, Channel Power, ACPR,OBW, and Spurious Search
Ruggedness and data security achieved with standard field-removable solid-state drive
Open data format improves asset utilization through compatibility with industry-standard products
Captured IQ data can be saved into Matlab, CSV or other formats for use with third-party software analysis tools
RSA MAP supports MapInfo format and scanned version maps, also supports exporting to popular Google Earthand MapInfo map format for post analysis
Open interface for integration into customer applications
Ease-of-use platform improves field-test efficiency and lowers system training cost
10.4 inch ultra-bright touchscreen display
Windows 7 Ultimate (64-bit) with support to Microsoft language localization
SPECMON3 & SPECMON6 Quick Start User Manual xi

Preface
DocumentationThe following documentation is available with your Tektronix SPECMON3 or SPECMON6 Real Time Spectrum Analyzers.For the most current documentation, refer to the Tektronix Web site.
To read about Use these documents
Installation and operation(overviews)
Quick Start User ManualThe quick start user manual contains general information about how to put your instrumentinto service and guides to user interface controls.
In-depth operation anduser interface help
Instrument HelpThe online help contains detailed information about how to operate the instrument.
Application examples Application Examples ManualThis manual provides practical examples of using the analyzer to accomplish tasks.
Programming commands Programmer ManualThis manual contains descriptions of programming commands and their use. This manualis located in a PDF file located on the Documents CD.
Specifications andperformance verification
Specifications and Performance Verification ManualThis manual contains the instrument specifications and a procedure to check instrumentperformance against warranted characteristics. This manual is in a PDF file locatedon the Documents CD.
User service Service Manual.A manual that provides a list of replaceable parts, care and maintenance information, andinformation for servicing the instrument to the module level. This manual is in a PDF filelocated on the Product Documentation CD.
Software UpgradesSoftware option upgrades are available. Software upgrades for options become operational only after you enter a validoption key for the specific analyzer model and serial number.
To check for upgrades:
1. Use your Web browser to go to www.tektronix.com/software.
2. Enter the product name (for example SPECMON3 or SPECMON6) to find available software upgrades.
Conventions Used in This ManualThe following icons are used throughout this manual:
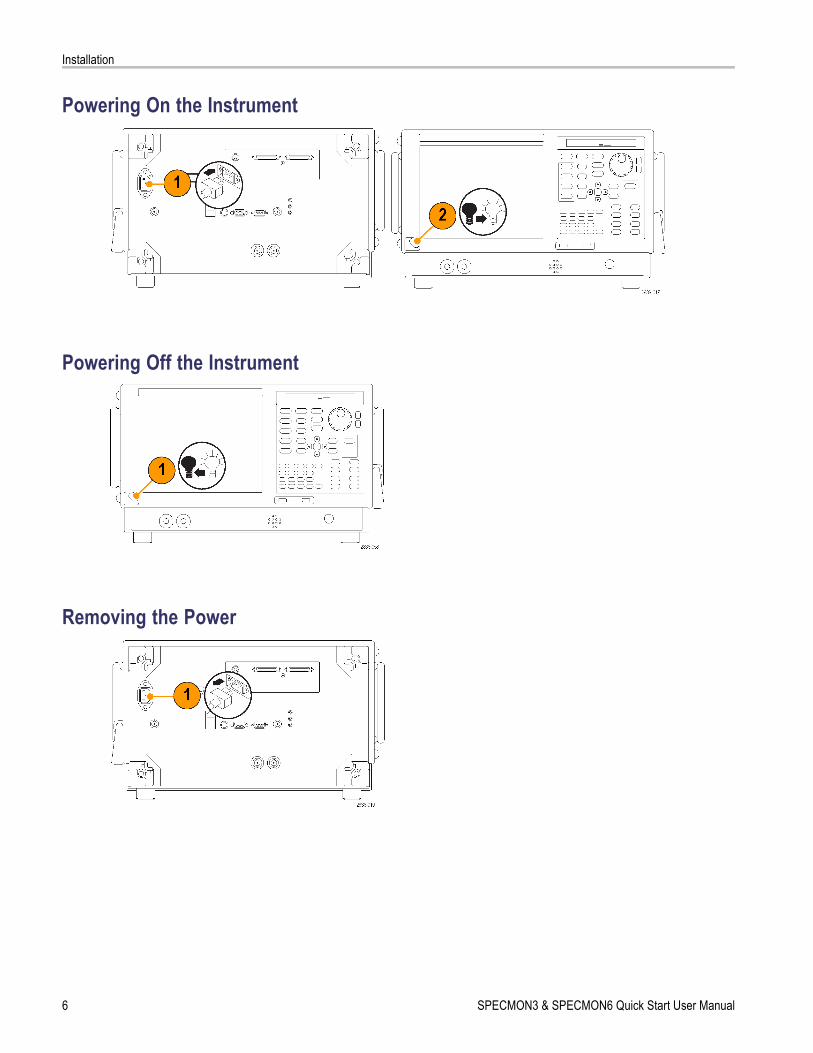
SequenceStep
Front panelpower
Connectpower
Network PS2 SVGA USB
xii SPECMON3 & SPECMON6 Quick Start User Manual

Installation
Installation
Before InstallationUnpack the instrument, and check that you received all items listed as Standard Accessories. Optional accessories andinstrument options are also listed in this section. Check the Tektronix Web site (www.tektronix.com) for the most currentinformation.
Standard AccessoriesYour instrument comes with the following accessories: quick start user manual (languages are listed below), programmermanual (on CD), specifications and performance verification manual (on CD), declassification and security instructions (onCD), service manual (on CD), power cord, BNC-N adapter, USB keyboard, USB mouse, and instrument front cover.
Product Documentation
SPECMON3 Real-Time Spectrum Analyzers and SPECMON6 Real-Time Spectrum Analyzers Quick Start User Manualis available in the following languages:
English, Tektronix part number 071-3064-XX.
Simplified Chinese, Tektronix part number 071-3066-XX.
Japanese, Tektronix part number 071-3068-XX.
Russian, Tektronix part number 071-3070-XX.
SPECMON3 Real-Time Spectrum Analyzers and SPECMON6 Real-Time Spectrum Analyzers Application ExamplesManual is available in the following languages:
English, Tektronix part number 071-3065-XX.
Simplified Chinese, Tektronix part number 071-3067-XX.
Japanese, Tektronix part number 071-3069-XX.
Russian, Tektronix part number 071-3071-XX.
SPECMON3 and SPECMON6 Product Documentation CD, Tektronix part number 063-4468-XX.
SPECMON3 & SPECMON6 Quick Start User Manual 1

Installation
The Product Documentation CD contains PDF versions of the following manuals:
SPECMON3 Real-Time Spectrum Analyzers and SPECMON6 Real-Time Signal Analyzers Quick Start User Manual,in English, Japanese, Russian and Simplified Chinese.
SPECMON3 Real-Time Spectrum Analyzers and SPECMON6 Real-Time Signal Analyzers Application ExamplesManual, in English, Japanese, Russian and Simplified Chinese.
SPECMON3 Real-Time Spectrum Analyzers and SPECMON6 Real-Time Spectrum Analyzers Printable Online Help,Tektronix part number 077-0740-XX.
SPECMON3 Real-Time Spectrum Analyzers and SPECMON6 Real-Time Spectrum Analyzers Programmer Manual,Tektronix part number 077-0741-XX.
SPECMON3 and SPECMON6 Real-Time Spectrum Analyzers Service Manual,Tektronix part number 077-0755-XX.
SPECMON3 and SPECMON6 Real-Time Spectrum Analyzers Specifications and Performance Verification Manual,Tektronix part number 077-0742-XX.
SPECMON3 and SPECMON6 Real-Time Spectrum Analyzers Declassification and Security Instructions,Tektronix part number 077-0754-XX.
Power Cords
The analyzer is shipped with one of the following power cord options. Power cords for use in North America are UL listedand CSA certified. Cords for use in areas other than North America are approved by at least one authority acceptable inthe country to which the product is shipped.
International Power Plugs
Opt. A0 - North America power
Opt. A1 - Universal EURO power
Opt. A2 - United Kingdom power
Opt. A3 - Australia power
Opt. A4 - 240 V, North America power
Opt. A5 - Switzerland power
Opt. A6 - Japan power
Opt. A10 - China power
Opt. A11 - India power
Opt. A12 - Brazil power
Opt. A99 - No power cord
2 SPECMON3 & SPECMON6 Quick Start User Manual

Installation
Optional AccessoriesSPECMON3 and SPECMON6
RTPA2A - Real-Time Spectrum Analyzer Probe Adapter; Supports TekConnect probes P7225, P7240, P7260, P7330,P7313, P7350, P7350SMA, P7380, P7380SMA.
RSAVu - Offline analysis software based on the RSA3000 platform for analysis supporting 3G wireless standards.
065-0852-XX – Additional Removable Hard Drive for use with Opt. 56 (Windows 7 and instrument software pre-installed).
Transit Case – Tektronix part number 016-1963-00.
OptionsYou can add the following options to your analyzer:
Option 09 - Adds Enhanced Real Time.
Option 10 - Adds AM/FM/PM and Audio Analysis.
Option 11 - Adds Phase Noise and Jitter Measurement.
Option 12 - Adds Settling Time Measurement (Frequency and Phase).
Option 14 - Adds Noise Figure and Gain Measurement.
Option 21 - Adds general-purpose digital modulation analysis.
Option 22 - Adds flexible OFDM analysis.
Option 23 - Adds WLAN 802.11a/b/g/j/p analysis.
Option 24 - Adds WLAN 802.11n analysis.
Option 25 - Adds WLAN 802.11ac analysis.
Option 26 - Adds APCO P25 measurement application.
Option 27 - Adds Bluetooth® LE and Bluetooth® Basic Rate RF transmitter measurements.
Option 28 - Adds LTE™ Downlink (Base Station) RF transmitter measurements (includes Cell ID).
Option 40 - 40 MHz Acquisition BW (SPECMON3 only).
Option 52 - Adds frequency mask triggering.
Option 53 - Adds Memory, 4 GB Acquisition Memory Total.
Option 55 - Adds Digital I and Q output.
Option 110 - 110 MHz Acquisition BW.
Option 200 - Adds Advanced DPX with Density, Time Qualified and Runt Triggers and Zero-Span.
Option MAP - Adds mapping capability.
RSA56KR - Rackmount for RSA5100A/B Series, SPECMONB Series, and RSA6100B Series analyzers.
SPECMON3 & SPECMON6 Quick Start User Manual 3
Installation
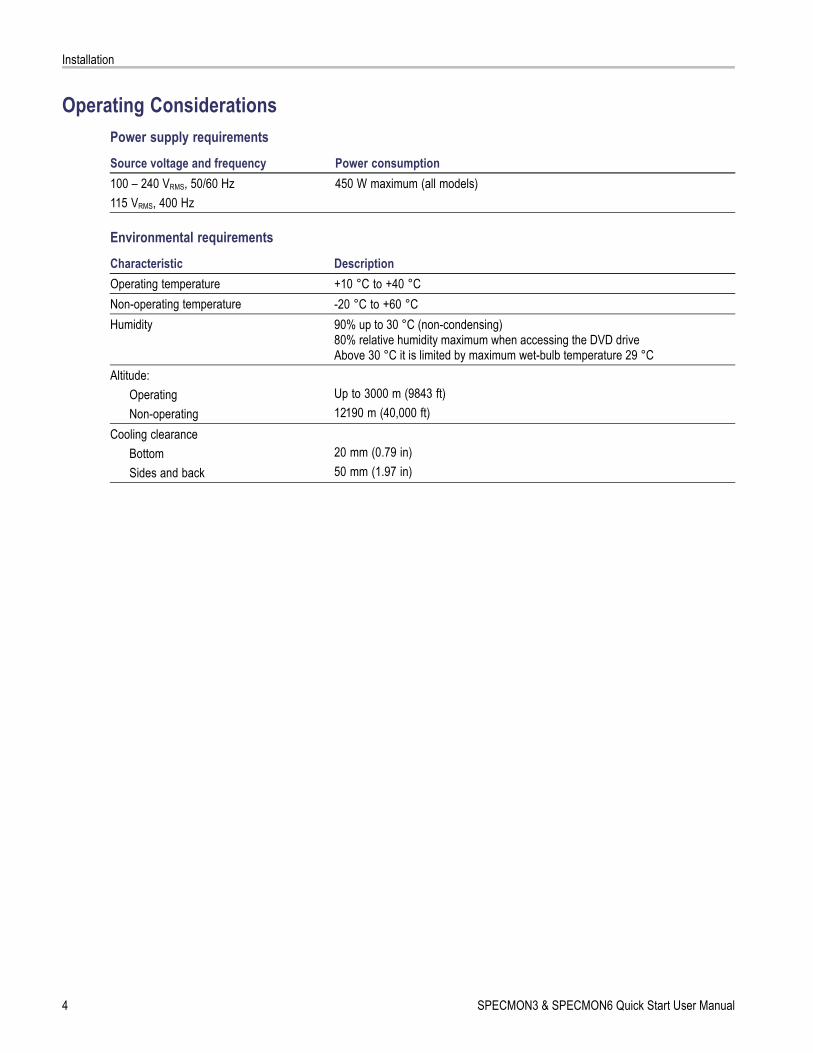
Operating ConsiderationsPower supply requirements
Source voltage and frequency Power consumption
100 – 240 VRMS, 50/60 Hz
115 VRMS, 400 Hz
450 W maximum (all models)
Environmental requirements
Characteristic Description
Operating temperature +10 °C to +40 °C
Non-operating temperature -20 °C to +60 °C
Humidity 90% up to 30 °C (non-condensing)80% relative humidity maximum when accessing the DVD driveAbove 30 °C it is limited by maximum wet-bulb temperature 29 °C
Altitude:
Operating
Non-operating
Up to 3000 m (9843 ft)
12190 m (40,000 ft)
Cooling clearance
Bottom
Sides and back
20 mm (0.79 in)
50 mm (1.97 in)
4 SPECMON3 & SPECMON6 Quick Start User Manual
Installation
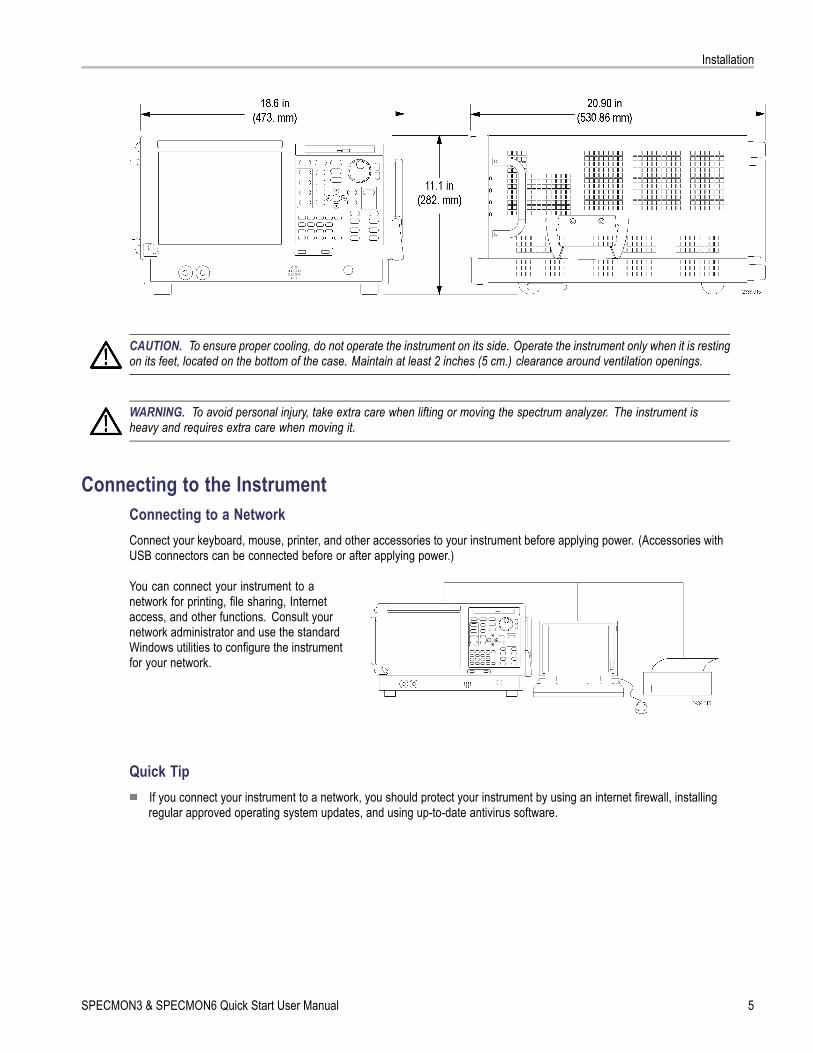
CAUTION. To ensure proper cooling, do not operate the instrument on its side. Operate the instrument only when it is restingon its feet, located on the bottom of the case. Maintain at least 2 inches (5 cm.) clearance around ventilation openings.
WARNING. To avoid personal injury, take extra care when lifting or moving the spectrum analyzer. The instrument isheavy and requires extra care when moving it.
Connecting to the InstrumentConnecting to a Network
Connect your keyboard, mouse, printer, and other accessories to your instrument before applying power. (Accessories withUSB connectors can be connected before or after applying power.)
You can connect your instrument to anetwork for printing, file sharing, Internetaccess, and other functions. Consult yournetwork administrator and use the standardWindows utilities to configure the instrumentfor your network.
Quick Tip
If you connect your instrument to a network, you should protect your instrument by using an internet firewall, installingregular approved operating system updates, and using up-to-date antivirus software.
SPECMON3 & SPECMON6 Quick Start User Manual 5
Installation
Powering On the Instrument
Powering Off the Instrument
Removing the Power
6 SPECMON3 & SPECMON6 Quick Start User Manual

Installation
Operating System RestoreThe instrument contains an operating system restore file on a separate partition of the hard drive.
The preferred method to restore the instrument operating system is to use the hard disk restore file.
CAUTION. Using the restore process reformats the hard drive and reinstalls the operating system. All saved data is lost. Ifpossible, save important files to external media before performing a system restore.
1. Restart the instrument. During the boot-up process you will see the following message at the top of the screen: StartingAcronis Loader... press F5 for Acronis Startup Recovery Manager
2. Repeatedly press the F5 key until the Acronis True Image Tool opens. There is a 5-second time period from when themessage appears until the instrument proceeds with the normal instrument startup. If the instrument does not open theAcronis application, power off the instrument, then power on the instrument and try again.
3. Click Restore.
4. In the Confirmation dialog box, click Yes to restore the instrument operating system, or No to exit the restore process.The restore process takes approximately 30 minutes; the actual time depends on the instrument configuration.
SPECMON3 & SPECMON6 Quick Start User Manual 7

Installation
Adding an External MonitorUse the following procedure to add an external monitor for dual monitor configuration. Both the analyzer and the secondmonitor must have the color set to True Color.
1. Power off the analyzer and the externalmonitor.
2. Connect the external monitor to theanalyzer.
3. Power on the analyzer and the externalmonitor.
8 SPECMON3 & SPECMON6 Quick Start User Manual
Installation
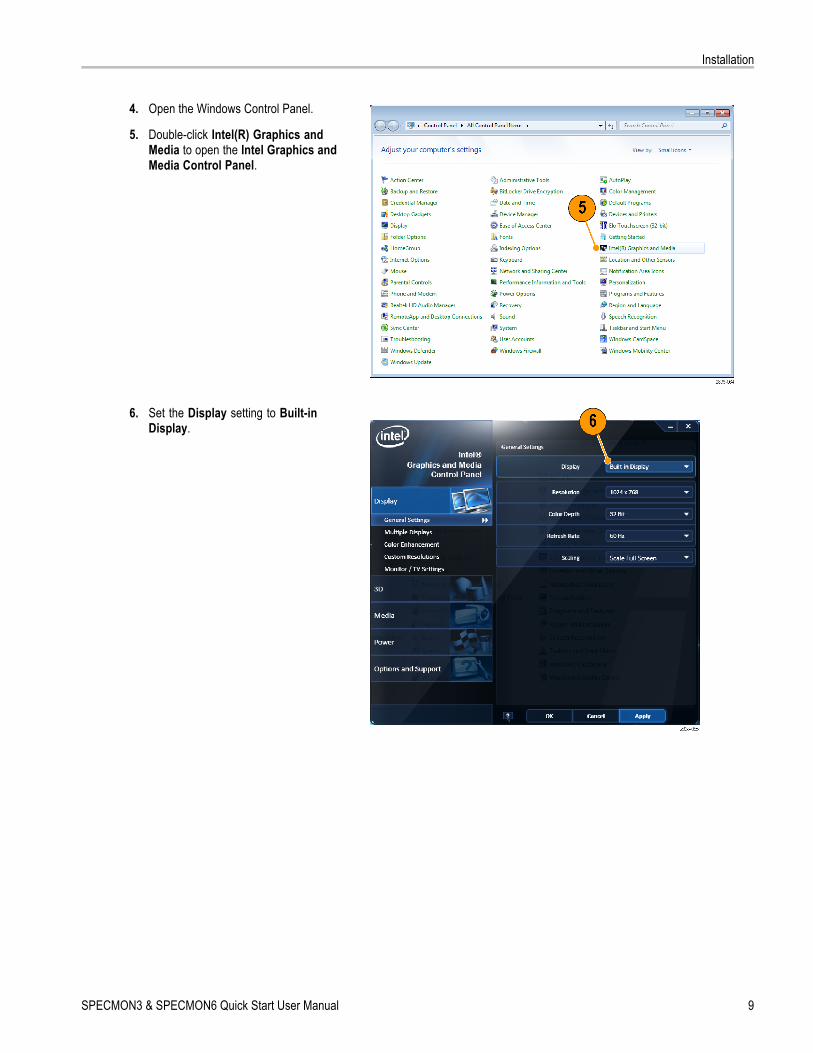
4. Open the Windows Control Panel.
5. Double-click Intel(R) Graphics andMedia to open the Intel Graphics andMedia Control Panel.
6. Set the Display setting to Built-inDisplay.
SPECMON3 & SPECMON6 Quick Start User Manual 9

Installation
7. Click Multiple Displays.
8. Set the Operating Mode to CloneDisplays or Extended Displays aspreferred.
9. If you select Extended Desktop, be sureto set the Positioning to align the twodesktop displays.
10 SPECMON3 & SPECMON6 Quick Start User Manual

Installation
Adjusting the Windows Display Settings
To change the instrument display settings, use the Intel Graphics Driver instead of the default Windows display properties.The Intel Graphics Driver provides additional capabilities that are not accessible from the Windows display propertiesdialog box.
1. Open the Windows Control Panel.
2. Double-click Intel(R) Graphics andMedia to open the Intel Graphics andMedia Control Panel.
3. Adjust the settings as necessary.
NOTE. Not all of the selections in theproperty page will be available if there is noexternal monitor connected to the instrument.
4. Click OK to apply the settings and toclose the properties page.
NOTE. Although it is not recommended, you can attach a second monitor after the analyzer is powered on; however, afterconnecting, you will still need to enable the Extended Desktop from the Intel Extreme Graphics 2M control panel.
SPECMON3 & SPECMON6 Quick Start User Manual 11

Installation
Inspecting the InstrumentRun the diagnostics application (Tools > Diagnostics). If failures occur, perform the following steps to get more informationabout them. You can also use the following steps as a detailed incoming inspection to verify the functionality of yourinstrument. If you want to check the accuracy specifications of your instrument, see the SPECMON3 and SPECMON6Real-Time Spectrum Analyzers Specifications and Performance Verification Technical Reference manual PDF (Tektronix partnumber 077-0742-XX) located on the Product Documentation CD.
1. Select Tools > Diagnostics.
2. On the Diagnostics tab, click AllModules, All Tests.
3. Click Single Test.
4. Click RUN.
The instrument will run through thetests one at a time. A check markor X icon will appear to the rightof each check box as that test iscompleted. The check icon meansthe test was passed. The X meansthe test was failed.
5. For tests that require manualintervention, follow the on-screeninstructions to complete the tests.
NOTE. Select the Diagnostics Failure Information tab to see basic diagnostic failure information. Use the Windows EventViewer (Control Panel > System and Security > Administrative Tools > Event Viewer) to view failure history and nondiagnosticfailures reported by the application.
12 SPECMON3 & SPECMON6 Quick Start User Manual

Installation
User MaintenanceCleaning Your Instrument
Clean the exterior surfaces of the chassis with a dry lint-free cloth or a soft-bristle brush. If any dirt remains, use a cloth orswab dipped in a 75% isopropyl alcohol solution. Use a swab to clean narrow spaces around controls and connectors. Donot use abrasive compounds on any part of the instrument because they might damage the instrument.
CAUTION. Avoid getting moisture inside the instrument during exterior cleaning; use just enough moisture to dampen thecloth or swab. Do not wash the front-panel On/Standby switch. Cover the switch while washing the instrument. Use onlydeionized or distilled water when cleaning. Use a 75% isopropyl alcohol solution as a cleanser and rinse with deionizedor distilled water. Do not use chemical cleaning agents; they might damage the chassis. Avoid chemicals that containbenzene, toluene, xylene, acetone, or similar solvents.
CAUTION. To prevent damage to the flat panel display, do not use improper cleaning agents or methods. Avoid usingabrasive cleaners or commercial glass cleaners to clean the display surface. Avoid spraying liquids directly on the displaysurface. Avoid scrubbing the display with excessive force.
Clean the display surface by gently rubbing the display with a clean-room wipe. If the display is very dirty, moisten the wipewith distilled water or a 75% isopropyl alcohol solution and gently rub the display surface. Avoid using excess force; thismight damage the display surface.
Upgrading the Instrument Software
Software upgrades are available from Tektronix. They can either be downloaded from the Tektronix Web site or they can beordered from your local Tektronix representative. To add additional software options or features, you will need an option keyfrom Tektronix. When you receive the software from Tektronix, install it on your instrument. When prompted, enter the optionkey, and then follow the online instructions to complete the upgrade.
Returning Your Instrument
If you return your instrument to Tektronix:
Back up any user software on the hard disk. You may need to reinstall the software after your instrument is returned.
When repacking the instrument for shipment, use the original packaging. If the packaging is unavailable or unfit for use,contact your local Tektronix representative to obtain new packaging.
Seal the shipping carton with an industrial stapler or strapping tape.
SPECMON3 & SPECMON6 Quick Start User Manual 13

Operation
Operation
Getting Acquainted with Your InstrumentControls and display elements are shown in the following illustrations and tables.
Front Panel Controls
Most front panel controls are shortcuts for opening control panels.
Ref number Item Description Menu equivalent
1 Media Removable solid-state drive.
2 Displays Opens the Displays dialog box to select measurementdisplays.
Setup > Displays
3 Settings Opens the Settings control panel for the selected display. Setup > Settings
4 Trigger Opens the Trigger control panel. Setup > Trigger
5 Acquire Opens the Acquire control panel. Setup > Acquire
6 Analysis Opens the Analysis control panel. Setup > Analysis
7 Freq Adjusts the measurement frequency. Setup > Analysis >Frequency tab 2
8 Span (Spectrum) Adjusts the span or frequency range shown in the Spectrumdisplay. 1
Setup > Settings >Freq & Span 1 2
9 Amplitude Adjusts the reference level. Setup >Amplitude 2
14 SPECMON3 & SPECMON6 Quick Start User Manual

Operation
Ref number Item Description Menu equivalent
10 BW (Spectrum) Adjust the resolution bandwidth (RBW). 1 Setup > Settings >BW tab 1 2
1 Applicable only when the selected display is Spectrum, DPX Spectrum, or Spectrogram.2 Press and hold for one second to open the associated control panel.
Ref number Item Description Menu equivalent
12 Run (Stop) Push to start and stop acquisitions. Run > Run
13 Markers, Peak Moves the active marker to the maximum peak of the tracein the selected display. If markers are turned off, the MR(marker reference) marker will appear at the maximum peak.
14 Markers, Select Selects the next marker.
15 Markers, Define Opens the Markers control panel.
17 Control knob Increments/decrements numbers with fine resolution.
18 Arrow keys Move the Markers. The Up arrow moves the selectedmarker 10 trace points to the right. The down arrow movesthe selected marker 10 trace points to the left. The left andright arrows move the selected marker to the next peak.(Turning the knob moves the marker one trace point left orright.)
19 Increment /decrement keys
Increments or decrements numbers with coarse resolution.
20 Markers, Delete Deletes the highest-numbered marker.
21 Markers, Add Adds a marker to the selected trace.
22 Replay Replays the current acquisition record.
23 Single Sets the Run mode to Single Sequence and initiates a singlesequence acquisition cycle.
SPECMON3 & SPECMON6 Quick Start User Manual 15

Operation
Ref number Item Description Menu equivalent
24 Keypad Enters values in controls.
25 Enter Completes the data entry in controls. Same as pressing theEnter key on the keyboard.
Ref number Item Description Menu equivalent
26 Recall Opens the Recall dialog box. File > Recall
27 Save Saves working file using the same user selections as for theprevious Save action.
File > Save
28 Touch Screen Off Turns the touch screen on and off.
16 SPECMON3 & SPECMON6 Quick Start User Manual

Operation
Ref number Item Description Menu equivalent
29 Help Displays the online help. Help >User Manual
31 Application Opens the Application preset dialog box. You can changethe effect of pressing Application using the settings atPresets > Preset Options > Preset type/action.
Preset >Application
32 DPX For instruments with Option 200, opens a DPX display setto the same span as the Spectrum display. If the Spectrumdisplay is not open, the span is set to the last span of theSpectrum display. Without Option 200, the maximum spanof the DPX display is limited to the maximum acquisitionbandwidth of the instrument. You can change the effect ofpressing DPX using the settings at Presets > Preset Options> Preset type/action.
Presets > DPX
33 User Opens the User preset dialog box. You can change theeffect of pressing User using the settings at Presets > PresetOptions > Preset type/action.
Presets > User
34 Preset Resets the instrument to its factory default settings. You canchange the effect of pressing Preset using the settings atPresets > Preset Options > Preset type/action.
Presets > Main
SPECMON3 & SPECMON6 Quick Start User Manual 17

Operation
Front Panel Connectors
Ref number Item Description
1 Trig Out Trigger output connector. 50 Ω, BNC, High > 2.0 V, Low < 0.4 V, (output current 1 mA)
2 Trig In External Trigger input connector, –2.5 V to +2.5 V range,trigger level is user adjustable
3 USB port USB 2.0 connector
4 USB port USB 2.0 connector
5 RF Input RF input connector 50 Ω
18 SPECMON3 & SPECMON6 Quick Start User Manual

Operation
Rear Panel
Ref number Connector, Description
1 AC Input, main power connector
2 GPIB
4, 5 Real Time IQ Out (Option 55)
6 +28 VDC output, switched
7 Microphone in; Headphone, audio output; and Line In connectors
8 External Trigger 2 Input
9 COM 2, serial port for connecting peripherals
10 VGA external monitor output (resolution not limited to VGA)
11 PS2 Keyboard input
12 USB 2.0 ports for mouse and other peripherals (printers, external hard disks)
13 Ref Out, reference frequency output
14 Ref In, reference frequency input
15 LAN, Ethernet network connector
SPECMON3 & SPECMON6 Quick Start User Manual 19

Operation
Interface and Display Elements
Commonly-used buttons and controls are located in the tool bar. Most of the buttons open control panels for changing theinstrument setups. The contents of the control panels vary depending on the selected display. You can also access thecontrol panels from the front panel buttons or from the keyboard.
Refnumber
Setting Description
1 Displays the Open window in order to recall setup files, acquisition data files,or trace files.
2 Opens the Save As dialog in order to save setup files, pictures (screencaptures), acquisition data files, or export measurement settings or acquisitiondata.
3 Undo / Redo Undoes or redoes the previous edit to a display or measurement settings, apreset, or a measurement change.
4 Displays Opens the Select Displays dialog box so that you can select measurementdisplays.
5 Markers Opens or closes the Marker toolbar at the bottom of the window.
6 Settings Opens the Settings control panel for the selected display. Each display hasits own control panel.
20 SPECMON3 & SPECMON6 Quick Start User Manual
Operation
Refnumber
Setting Description
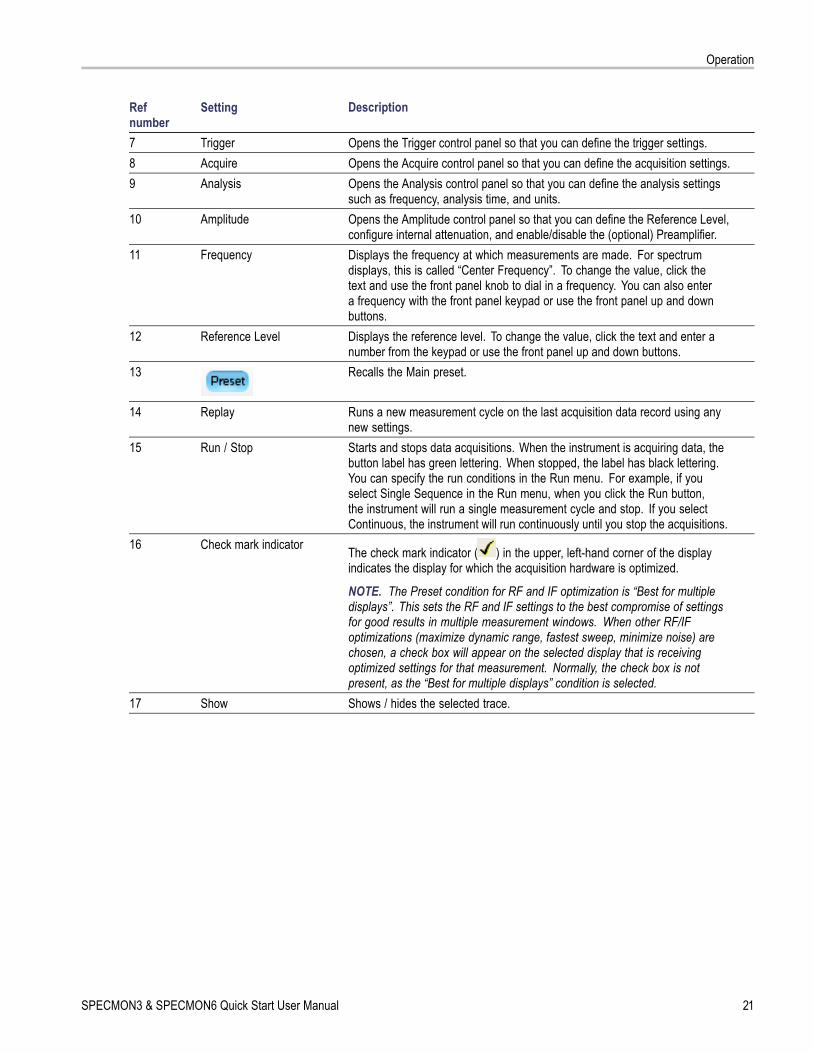
7 Trigger Opens the Trigger control panel so that you can define the trigger settings.
8 Acquire Opens the Acquire control panel so that you can define the acquisition settings.
9 Analysis Opens the Analysis control panel so that you can define the analysis settingssuch as frequency, analysis time, and units.
10 Amplitude Opens the Amplitude control panel so that you can define the Reference Level,configure internal attenuation, and enable/disable the (optional) Preamplifier.
11 Frequency Displays the frequency at which measurements are made. For spectrumdisplays, this is called “Center Frequency”. To change the value, click thetext and use the front panel knob to dial in a frequency. You can also entera frequency with the front panel keypad or use the front panel up and downbuttons.
12 Reference Level Displays the reference level. To change the value, click the text and enter anumber from the keypad or use the front panel up and down buttons.
13 Recalls the Main preset.
14 Replay Runs a new measurement cycle on the last acquisition data record using anynew settings.
15 Run / Stop Starts and stops data acquisitions. When the instrument is acquiring data, thebutton label has green lettering. When stopped, the label has black lettering.You can specify the run conditions in the Run menu. For example, if youselect Single Sequence in the Run menu, when you click the Run button,the instrument will run a single measurement cycle and stop. If you selectContinuous, the instrument will run continuously until you stop the acquisitions.
16 Check mark indicatorThe check mark indicator ( ) in the upper, left-hand corner of the displayindicates the display for which the acquisition hardware is optimized.
NOTE. The Preset condition for RF and IF optimization is “Best for multipledisplays”. This sets the RF and IF settings to the best compromise of settingsfor good results in multiple measurement windows. When other RF/IFoptimizations (maximize dynamic range, fastest sweep, minimize noise) arechosen, a check box will appear on the selected display that is receivingoptimized settings for that measurement. Normally, the check box is notpresent, as the “Best for multiple displays” condition is selected.
17 Show Shows / hides the selected trace.
SPECMON3 & SPECMON6 Quick Start User Manual 21
Operation
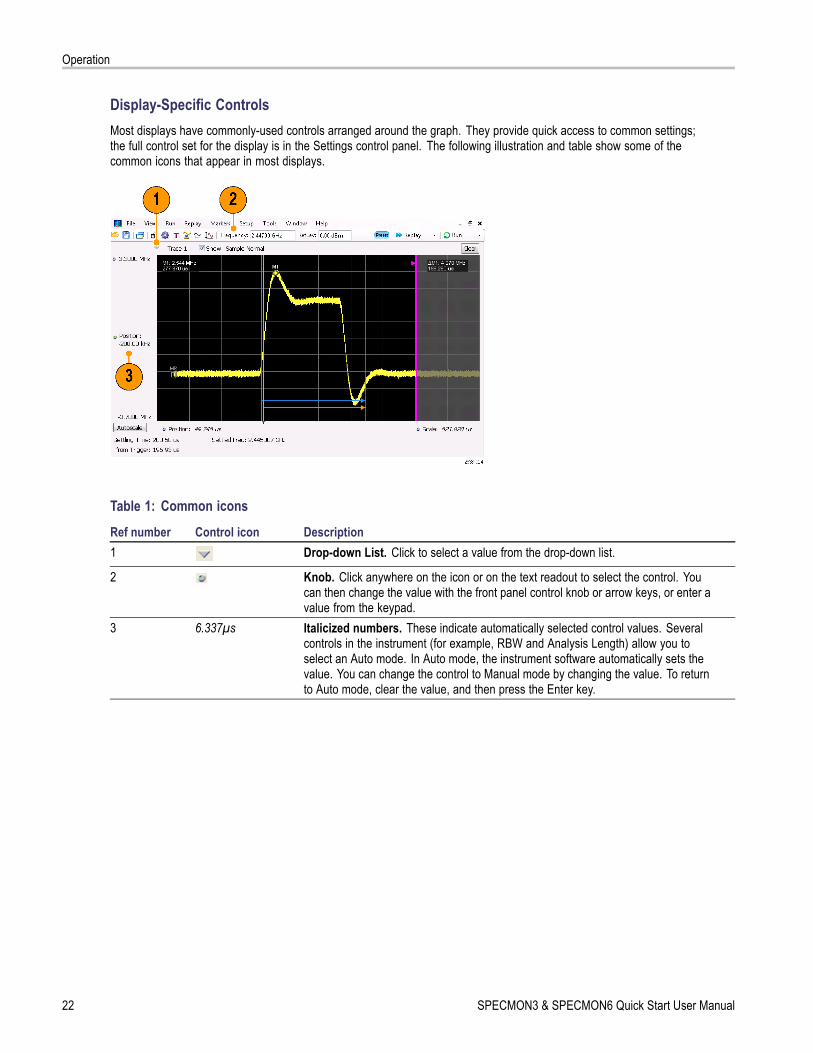
Display-Specific Controls
Most displays have commonly-used controls arranged around the graph. They provide quick access to common settings;the full control set for the display is in the Settings control panel. The following illustration and table show some of thecommon icons that appear in most displays.
Table 1: Common icons
Ref number Control icon Description
1 Drop-down List. Click to select a value from the drop-down list.
2 Knob. Click anywhere on the icon or on the text readout to select the control. Youcan then change the value with the front panel control knob or arrow keys, or enter avalue from the keypad.
3 6.337μs Italicized numbers. These indicate automatically selected control values. Severalcontrols in the instrument (for example, RBW and Analysis Length) allow you toselect an Auto mode. In Auto mode, the instrument software automatically sets thevalue. You can change the control to Manual mode by changing the value. To returnto Auto mode, clear the value, and then press the Enter key.
22 SPECMON3 & SPECMON6 Quick Start User Manual

Operation
Basic ConceptsReal Time Analyzers
Tektronix real-time analyzers have an optional frequency mask trigger. The frequency mask trigger allows you to set up aspectral mask to capture a signal when a spectral anomaly occurs. This allows the real-time spectrum analyzer to check100% of the input signal before acquiring, and then capture precisely the intermittent RF event of interest.
DPX™ technology allows you to view the RF signal as a live display. You can view very short transient signals, multilevelsignals, and time-varying events. Option 200 includes the ability to measure and trigger on signal density values in theDPX display.
The analyzers allow you to view the captured signals in a wide variety of time-correlated displays. This is useful for devicetroubleshooting and signal characterization applications. All of the measurements, other than the DPX display, are basedon the same underlying set of time domain sample data.
Measurement Displays
The analyzer window can show one or any combination of general purpose and application-specific displays.
This example shows a DPX Spectrum Splitdisplay. A DPXogram display appearson the top and a DPX Spectrum displayappears on the bottom.
SPECMON3 & SPECMON6 Quick Start User Manual 23
Operation
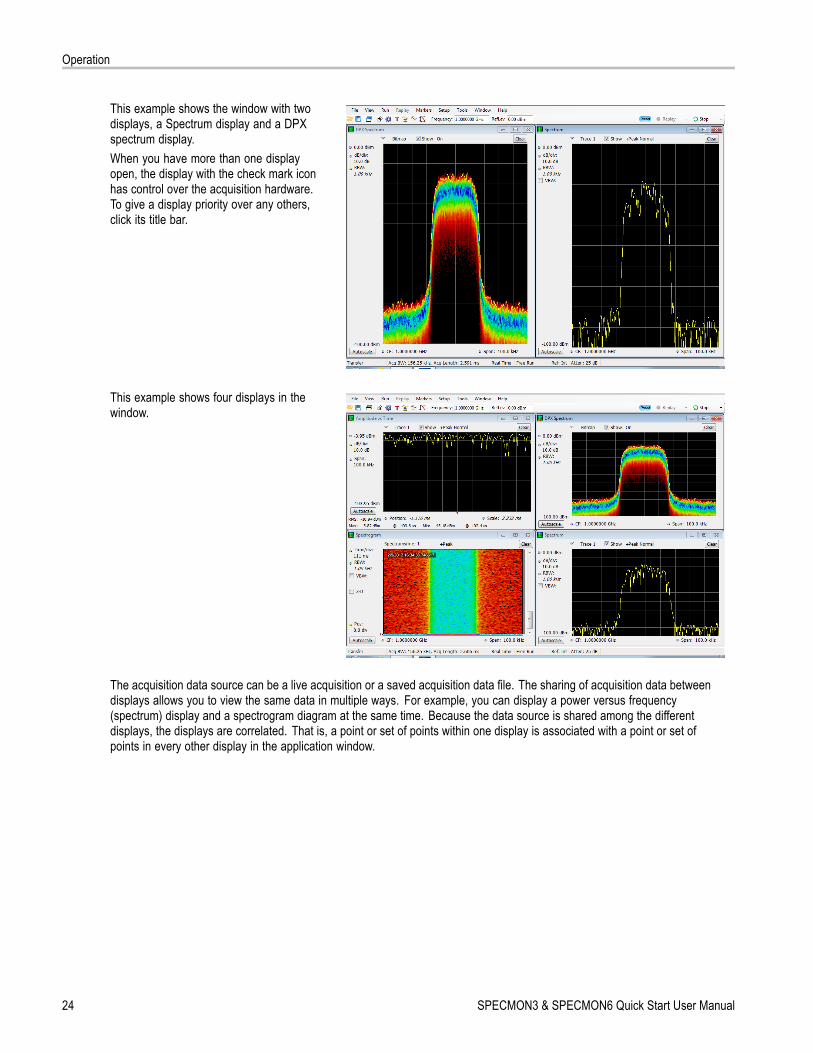
This example shows the window with twodisplays, a Spectrum display and a DPXspectrum display.
When you have more than one displayopen, the display with the check mark iconhas control over the acquisition hardware.To give a display priority over any others,click its title bar.
This example shows four displays in thewindow.
The acquisition data source can be a live acquisition or a saved acquisition data file. The sharing of acquisition data betweendisplays allows you to view the same data in multiple ways. For example, you can display a power versus frequency(spectrum) display and a spectrogram diagram at the same time. Because the data source is shared among the differentdisplays, the displays are correlated. That is, a point or set of points within one display is associated with a point or set ofpoints in every other display in the application window.
24 SPECMON3 & SPECMON6 Quick Start User Manual

Operation
Navigating DisplaysThe analyzers use multiple displays to keep operations simple, and yet provide advanced functionality when needed. Someof the display categories include:
General Signal Viewing displays. These displays show graphs for basic signal parameters such as amplitude, phase,and frequency plotted against frequency or time. Examples of these displays include: Spectrum, DPX, Spectrogram,Time Overview, and Phase vs Time.
Analog Modulation. These displays show graphs and measurements for Analog Modulation, Frequency Modulation,and Phase Modulation.
General Purpose Digital Modulation displays. Available with Option 21, General Purpose Modulation Analysis.These displays show the results of demodulating signals and analyzing them in multiple domains. Examples of thesedisplays include: Constellation, EVM vs Time, Eye, Symbol Table, and Trellis diagrams.
RF Measurements displays. These displays show the results of automated measurements on RF signals. Examples ofthese displays include: Channel Power/Field Strength and ACPR, MCPR, Phase Noise, and CCDF.
OFDM Analysis. These displays provide OFDM analysis for WLAN 802.11a/j/g and WiMax 802.16-2004 signals.
Pulsed RF displays. Available with Option 20, Advanced Signal Analysis. These displays show the results of advancedanalysis for pulsed RF signals. Examples of these displays include: Pulse Statistics, Pulse Table, and Pulse Trace.
Audio Analysis. These displays measure basic time- and frequency-domain parameters of analog audio signalsmodulated on a carrier (AM, FM and PM modulation) or unmodulated (non-carrier) audio signals (Direct).
WLAN Analysis. Available with Options 23, 24, and 25. Each of these options provide OFDM analysis of WLAN802.11standards. All three options combined provide analysis for WLAN802.11a/b/g/j/p/n/ac signals.
APCO P25 Analysis. Available with Option 26. This complete set of push-button Telecommunication IndustryAssociation TIA-102 standard-based transmitter measurements includes modulation measurements, powermeasurements, and timing measurements. These measurements are also compared with the limits that best fit thesignal for which the standard applies to provide pass/fail results.
Bluetooth® LE and Bluetooth® Basic Rate RF. Available with Option 27. Bluetooth LE (Low Energy) and BluetoothBasic Rate RF (Radio Frequency) provides 13 transmitter performance measurements for 10 different test setups incompliance with Bluetooth RF PHY Test Specifications 4.1.1 and Radio Frequency (RF) Test Specifications 4.1.1.
LTE™ Downlink Analysis. Available with Option 28. LTE Downlink (Base Station) RF analysis provides transmitterperformance measurements for both TDD and FDD (for example, Channel Power, Occupied Bandwidth, ACLR,SEM, Cell ID, and TDD LTE Transmit Power Off) in compliance with Test Specifications 36.104 (Base Station radiotransmission and reception) and 36.141 (Base Station conformance testing).
Noise Figure. Available with Option 14. These displays measure the noise contributions in a system. Displays includeNoise Figure, Gain, Y-factor, Noise Temperature, Uncertainty Calculator, and tabular results. Single-frequency meteringand swept-trace results are available, as well as support for industry-standard noise sources. Measurements for amplifiersand other non-frequency converting devices, and fixed local-oscillator up and down converters are also available.
SPECMON3 & SPECMON6 Quick Start User Manual 25

Operation
Selecting DisplaysThe analyzer provides an easy way to select displays.
1. Click the Displays icon to openthe Select Displays dialog box.
There are two ways to select displays: choose any combination of displays or use an Application Preset.
Choose any Combination of Displays. Select displays one by one as needed.
1. Click the desired application folderin the Select Displays dialog box.
The available displays for eachfolder are listed in the AvailableDisplays pane.
2. Click one of the display icons.
3. Click Add (or double-click theicon) to add the selected displayto the Selected displays list.Repeat the procedure to add otherdisplays.
4. Click OK to close the dialog box.The selected displays will open.
26 SPECMON3 & SPECMON6 Quick Start User Manual

Operation
Use an Application Preset. Select displays from the presets for your application.
1. Click Application Presets in the SelectDisplays dialog box.
2. Use the pull down list to display thepresets.
NOTE. Some presets appear only if theassociated instrument option is installed.
3. Select a preset from the list.
SPECMON3 & SPECMON6 Quick Start User Manual 27

Operation
4. The default displays for the selectedpreset are shown.
5. Click OK to close the dialog box. Thepreset displays will open. (See Table 2.)
Table 2: Application presets
Presets Displays
Modulation Analysis (Option 21 only) Constellation, DPX Spectrum, Signal Quality, Symbol Table
Pulse Analysis (Option 20 only) DPX Spectrum, Pulse Table, Pulse Trace, Time Overview
Spectrum Analysis Spectrum
Spur Search Multi Zone 9k-1GHz Spurious
Time-Frequency Analysis Frequency vs Time, Spectrogram, Spectrum, Time Overview
Noise Figure (Option 14) Gain, Noise Figure, Noise Table
Phase Noise Phase Noise
28 SPECMON3 & SPECMON6 Quick Start User Manual

Operation
Use a Standards Preset. When you select a specific standard from the Standards presets, the analyzer automaticallyloads the displays and settings that are optimal for analysis of signals based on that standard.
1. Select Presets > Standards from themain menu bar.
2. Use the Preset pull down list to displayand select a preset from the list.
3. The default displays for the selectedpreset are shown.
4. Click OK to close the dialog box. Thepreset displays will open. (See Table 3.)
NOTE. Some presets appear only if theassociated instrument option is installed.
Table 3: Standards presets
Presets Displays
WLAN (Option 25) SEM, Time Overview, WLAN Summary, WLAN Constellation
P25 (Option 26) MCPR, Time Overview, P25 Summary, P25 Constellation
Bluetooth® (Option 27) BT Eye Diagram, BT Frq Dev vs Time, BT Summary, BT CFOffset and Drift, Spectrum, Time Overview
NOTE. Bluetooth displays vary depending on the selected TestSetup.
LTE™ (Option 28) LTE Summary, LTE Constellation, Time Overview, Spectrum,LTE ACLR, LTE Channel Spectrum, SEM
NOTE. LTE displays vary depending on the selected Test Setup.
SPECMON3 & SPECMON6 Quick Start User Manual 29
Operation
Quick Tips
Push the Displays button on the front panel to open the Select Displays dialog box.
To add a display, double-click the icon.
To remove displays, do one of the following:
Select a display icon in the Selected Displays list, and then click Remove.
Double-click a display icon in the Selected Displays list.
Click the Close button in the upper right hand corner of the selected display.
You can mix displays from multiple application folders.
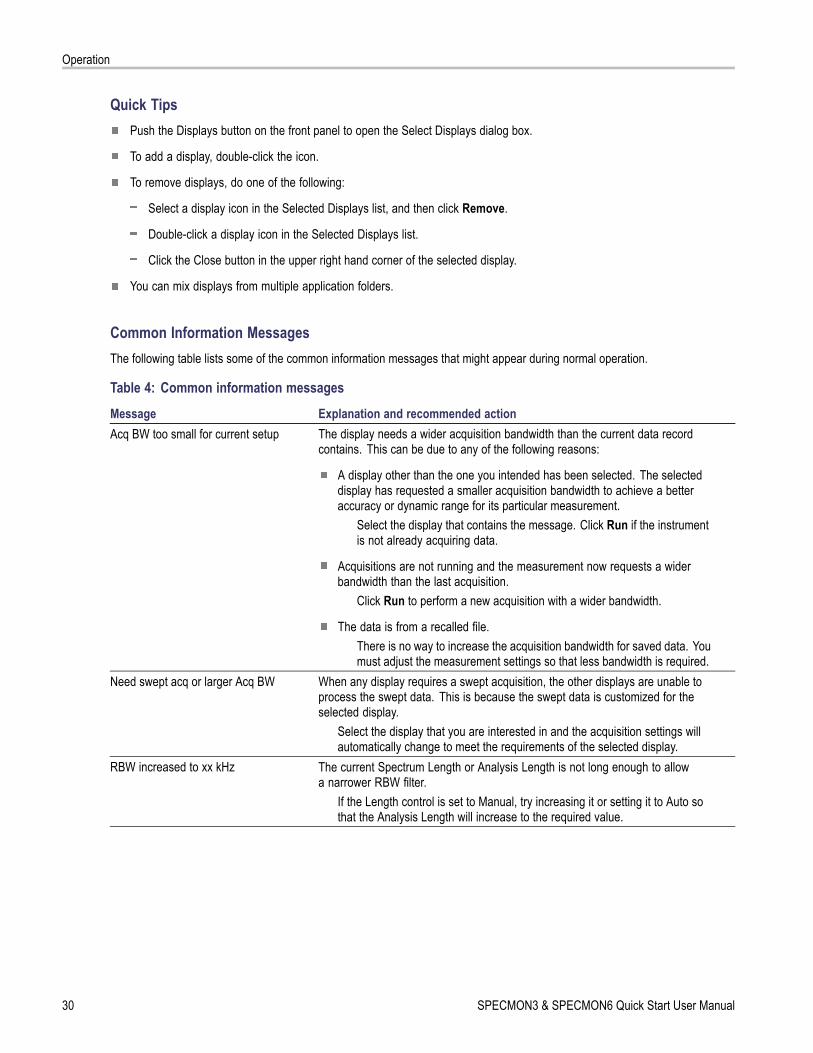
Common Information Messages
The following table lists some of the common information messages that might appear during normal operation.
Table 4: Common information messages
Message Explanation and recommended action
Acq BW too small for current setup The display needs a wider acquisition bandwidth than the current data recordcontains. This can be due to any of the following reasons:
A display other than the one you intended has been selected. The selecteddisplay has requested a smaller acquisition bandwidth to achieve a betteraccuracy or dynamic range for its particular measurement.
Select the display that contains the message. Click Run if the instrumentis not already acquiring data.
Acquisitions are not running and the measurement now requests a widerbandwidth than the last acquisition.
Click Run to perform a new acquisition with a wider bandwidth.
The data is from a recalled file.
There is no way to increase the acquisition bandwidth for saved data. Youmust adjust the measurement settings so that less bandwidth is required.
Need swept acq or larger Acq BW When any display requires a swept acquisition, the other displays are unable toprocess the swept data. This is because the swept data is customized for theselected display.
Select the display that you are interested in and the acquisition settings willautomatically change to meet the requirements of the selected display.
RBW increased to xx kHz The current Spectrum Length or Analysis Length is not long enough to allowa narrower RBW filter.
If the Length control is set to Manual, try increasing it or setting it to Auto sothat the Analysis Length will increase to the required value.
30 SPECMON3 & SPECMON6 Quick Start User Manual
Operation
Changing Measurement Settings
The displays have settings that control how signals are acquired and processed. The settings that you can change dependon the selected display.
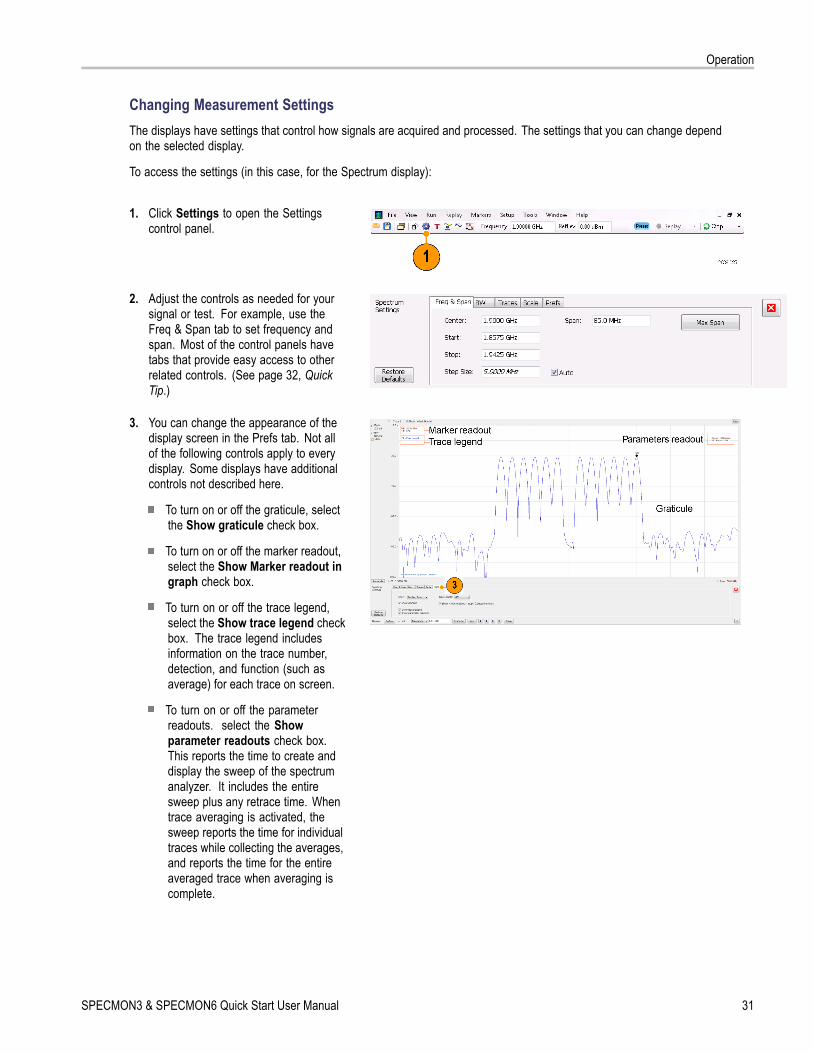
To access the settings (in this case, for the Spectrum display):
1. Click Settings to open the Settingscontrol panel.
2. Adjust the controls as needed for yoursignal or test. For example, use theFreq & Span tab to set frequency andspan. Most of the control panels havetabs that provide easy access to otherrelated controls. (See page 32, QuickTip.)
3. You can change the appearance of thedisplay screen in the Prefs tab. Not allof the following controls apply to everydisplay. Some displays have additionalcontrols not described here.
To turn on or off the graticule, selectthe Show graticule check box.
To turn on or off the marker readout,select the Show Marker readout ingraph check box.
To turn on or off the trace legend,select the Show trace legend checkbox. The trace legend includesinformation on the trace number,detection, and function (such asaverage) for each trace on screen.
To turn on or off the parameterreadouts. select the Showparameter readouts check box.This reports the time to create anddisplay the sweep of the spectrumanalyzer. It includes the entiresweep plus any retrace time. Whentrace averaging is activated, thesweep reports the time for individualtraces while collecting the averages,and reports the time for the entireaveraged trace when averaging iscomplete.
SPECMON3 & SPECMON6 Quick Start User Manual 31

Operation
Quick Tip
If you have multiple displays on the screen, click anywhere inside one of the other displays to change to the controlpanel for that display.
You can adjust many of the parameters of your measurement by clicking on the readout in the display. For example,in the spectrum display, dB/div, RBW, VBW, Span, and Center Frequency can all be accessed on the display withoutbringing up the Settings panel.
32 SPECMON3 & SPECMON6 Quick Start User Manual

Operation
Presetting the Instrument
You can preset the instrument to restore the setups to their default values.
1. To start with the default instrumentsettings, push the Preset button on thefront panel or select Preset from theSetup menu.
Quick Tip
Preset does not change any of the settings specified from the Config In/Out control panel or from the Tools menu, suchas GPIB address, Save/Export preferences, or the Auto Alignment setting.
SPECMON3 & SPECMON6 Quick Start User Manual 33

Operation
Connecting a SignalThe analyzer has a single RF signal input located on the front panel. Make sure that you observe the input signalrequirements before connecting a signal to the input.
CAUTION. To prevent static damage to the instrument or to any instrument accessories, discharge to ground anyelectrostatic charge that may be present on the center and outer conductors of cables, before attaching the cables to theinstrument inputs. Do not create an ESD (electrical static damage) antenna by leaving cables attached to the instrument withthe other ends of the cables open.
Required Signal Levels
The following table shows the input signal levels over which the analyzer can be used for measurements. The accuracy isguaranteed at a signal amplitude and frequency (normalization point). Measurements can be made on signals within theentire range of allowable inputs, but the accuracy of the measurement is affected by the frequency and amplitude of thesignal to be measured (see the SPECMON3 and SPECMON6 datasheet for more information).
RF signal input range (CW or peak envelope power)
Characteristic Description
Maximum DC voltage ±5 V (RF input)
Maximum safe input power +30 dBm (RF Input, RF ATT≥10dB, Pre-amp Off)
+20 dBm (RF Input, RF ATT≥10dB, Pre-amp On)
+50 Watts peak (RF Input, RF ATT≥30dB, (<10 μs, 1% Duty Cyclerepetitive Pulses))
Maximum measurable input power +30 dBm (RF Input, RF ATT Auto)
+10 Watts peak (RF Input, RF ATT Auto (<10 μs, 1% Duty Cyclerepetitive Pulses))
CAUTION. To prevent damage to the instrument, do not connect CW signals greater than 1 Watt (+30 dBm). The maximumvoltage rating is ±5 V DC. The maximum pulse specifications are 50 W peak, <10 µs pulse width, 0.001 duty cycle and≥30 dB attenuation.
34 SPECMON3 & SPECMON6 Quick Start User Manual

Operation
To connect an RF signal:
Connect the signal to the RF INPUTconnector on the front panel.
Quick Tip
If the source signal exceeds the specified maximum input rating, connect the source signal to an attenuator. Connect theattenuator output to the RF Input connector.
Starting and Stopping Acquisitions
1. Click the Run button to start anacquisition.
To select the Run mode, click thedrop-list icon to the right of the Runbutton.
Select Single or Continuous toset the Run mode as necessary.
If the analyzer is in ContinuousRun mode, the Replay button isdimmed while acquisitions areactive. If there are no acquisitionsactive, the Replay button is blue.
SPECMON3 & SPECMON6 Quick Start User Manual 35
Operation
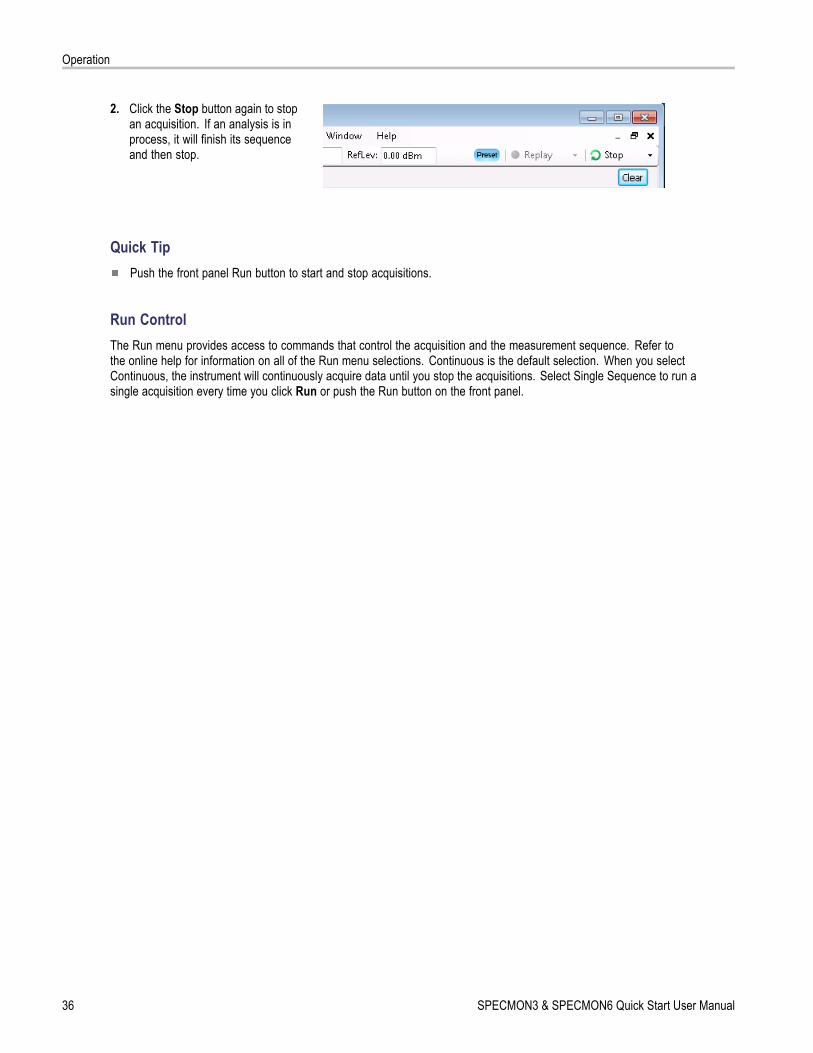
2. Click the Stop button again to stopan acquisition. If an analysis is inprocess, it will finish its sequenceand then stop.
Quick Tip
Push the front panel Run button to start and stop acquisitions.
Run Control
The Run menu provides access to commands that control the acquisition and the measurement sequence. Refer tothe online help for information on all of the Run menu selections. Continuous is the default selection. When you selectContinuous, the instrument will continuously acquire data until you stop the acquisitions. Select Single Sequence to run asingle acquisition every time you click Run or push the Run button on the front panel.
36 SPECMON3 & SPECMON6 Quick Start User Manual

Operation
MarkersUse markers to measure time, frequency, power and other results. Markers measure absolute values and can also measurethe difference between markers.
Using Markers to Measure Frequency and Power
The following procedure shows how to use markers in the Spectrum display to measure frequency and power. The exampleassumes that all markers are turned off and that a signal is on the screen.
1. Click Markers to open theMarker toolbar at the bottom ofthe Analysis window.
2. Select Add Marker from thedrop-down list on the MarkerToolbar.
The first marker is designatedthe marker reference (MR).
3. Position the marker on thescreen using the arrow buttons inthe Marker toolbar. You can alsodrag the marker to the desiredposition using the touch screenor the mouse.
4. Read the frequency and powerlevel from the marker readout onthe display.
SPECMON3 & SPECMON6 Quick Start User Manual 37

Operation
Markers Display
You can display up to five markers including the reference marker. Markers can all be placed on the same trace or they canbe placed on different traces. There are three types of Markers:
Reference Marker: This marker type is labeled MR in the graph. It makes absolute measurements and is also used forcalculating differences when Delta or Power readouts are enabled.
Delta Markers: This marker type is labeled M1 to M4 in the graph. It is used to measure other points on the trace or thedifference between the Marker Reference and the Delta marker.
Power Markers: This marker type is labeled M1 to M4 in the graph. It function the same way as Delta Markers, except itshows power density and integrated power density (dBm/Hz) instead of power level (dBm).
The following information tells you more about how markers function. For more detailed information about markers, seethe instrument Help.
When you drag markers along a trace with either the touch screen or the mouse, the marker will seek the high points.The marker stays within 20 trace points of the mouse position. If there are no peaks within the current range of tracepoints, the marker finds the highest point.
When you attach the marker to the bitmap trace in the DPX spectrum display, the marker readout indicates the hit countfor pixels (maximum 65,536) along with frequency and power (see the following figure). You can position the markerat any point in the graph.
In an instrument with Option 200, markers attached to the DPX bitmap display the signal density in percent at theselected pixel, rather then the hit count.
Quick Tips
If markers are turned off, click Peak in the Marker toolbar or on the front panel to add the marker reference (MR) and toposition it on the maximum peak level on the trace in the selected display.
Click Table in the Marker toolbar to open a tabular display showing the marker information.
38 SPECMON3 & SPECMON6 Quick Start User Manual

Operation
Marker Toolbar
The Marker toolbar has several controls to work with markers. (See Table 5.) Some of these controls are similar to thoseon the front panel.
Table 5: Marker toolbar
Icon Description
Opens the Define Markers control panel. Use the control panel to add and remove markers andto set marker parameters.
Sets the Measurement Frequency of the instrument to the frequency of the selected marker. Thisbutton is only present when the selected display has frequency on the horizontal axis.
Moves the marker to the maximum peak level on the trace. The maximum peak can be either thehighest or the lowest point in displays with both positive and negative values on their vertical axis(such as Frequency Error or Phase).
Moves the selected marker to the next peak to the left of the current position.
Moves the selected marker to the next peak to the right of the current position.
Moves the selected marker to the next lower peak value. The peak value refers to the absolutevalue of the peak amplitude. When repeatedly moving the marker, it can move in any directiondepending on the location of the next peak. If the marker is attached to the DPX bitmap trace, thisbutton moves it to the next-lower-amplitude density peak at the same frequency.
Moves the selected marker to the next higher peak value. The peak value refers to the absolutevalue of the peak amplitude. When repeatedly moving the marker, it can move in any directiondepending on the location of the next peak. If the marker is attached to the DPX bitmap trace, thisbutton moves it to the next-higher-amplitude density peak at the same frequency.
Opens or closes the marker table in the display.
Adding Markers
You can have up to five markers. The first marker (MR) is a reference marker. The other markers (M1, M2, M3, and M4) canshow absolute values or can show both absolute values and the difference values between them and the reference marker.
To add another marker, select Add Marker from the drop-down list in the toolbar.
Markers can also be added by right-clicking in the desired display and selecting Add marker.
SPECMON3 & SPECMON6 Quick Start User Manual 39

Operation
Defining Markers
Use the Define Markers control panel to define the marker settings.
1. Click Define to open the Define Markerscontrol panel.
Use the control panel to:
Add or delete markers.
Turn markers off.
Assign markers to specific traces.
Set the marker readouts to absolute,delta, or power.
Define the threshold and excursionvalues.
Quick Tip
You can add or delete markers using the drop-down list next to Define in the Marker toolbar, or by right-clicking in thedesired display and selecting Add marker.
Touchscreen ActionsYou can use the touchscreen to change marker settings and how waveforms are displayed by using the Touchscreen Actionsmenu. To use the Touchscreen Actions menu, touch the display and hold for one second, then remove your finger. You canalso use a mouse to display the Touchscreen Action menu by clicking the right mouse button.
Some selections in the Touchscreen Actionsmenu are selectable only when a marker isdefined.
Touchscreen Actions menu
40 SPECMON3 & SPECMON6 Quick Start User Manual

Operation
Table 6: Touchscreen actions menu
Icon Menu item Description
Select Selects markers and adjusts their position.
Span Zoom Zooms the graph area about the selected point. Touch the graph display at a pointof interest and drag to increase or decrease the span about the point of interest.Span Zoom adjusts the span control and can affect the acquisition bandwidth.
CF Pan Adjusts the Center Frequency according to horizontal movement.
Zoom Adjusts horizontal and vertical scale of the graph. The first direction withenough movement becomes the primary scale of adjustment. Adjustment in thesecondary direction does not occur until a threshold of 30 pixels of movement iscrossed.
Dragging to the left or down zooms out and displays a smaller waveform(increases the scale value). Dragging to the right or up zooms in and displays alarger waveform (decreases the scale value).
Pan Adjusts horizontal and vertical position of the waveform. The first direction withenough movement becomes the primary direction of movement. Movement inthe secondary direction does not occur until a threshold of 30 pixels of movementis crossed.
– Reset Scale Returns the horizontal and vertical scale and position settings to their defaultvalues.
– Marker to peak Moves the selected marker to the highest peak. If no marker is turned on, thiscontrol automatically adds a marker.
– Next Peak Moves the selected marker to the next peak. Choices are Next left, Next right,Next lower (absolute), and Next higher (absolute).
– Add marker Defines a new marker located at the horizontal center of the graph.
– Delete marker Removes the last added marker.
– All markers off Removes all markers.
Trigger On This Positions the DPX Density measurement box at the click point, measures thecurrent signal density, sets up the DPX Density Trigger function based on themeasurement result, and starts acquisitions.
SPECMON3 & SPECMON6 Quick Start User Manual 41

Operation
PrintingYou can print a copy of the screen and its contents (a screen shot) to a printer or a file.
1. Push the Print button on the front panelor select Print from the File menu.
42 SPECMON3 & SPECMON6 Quick Start User Manual
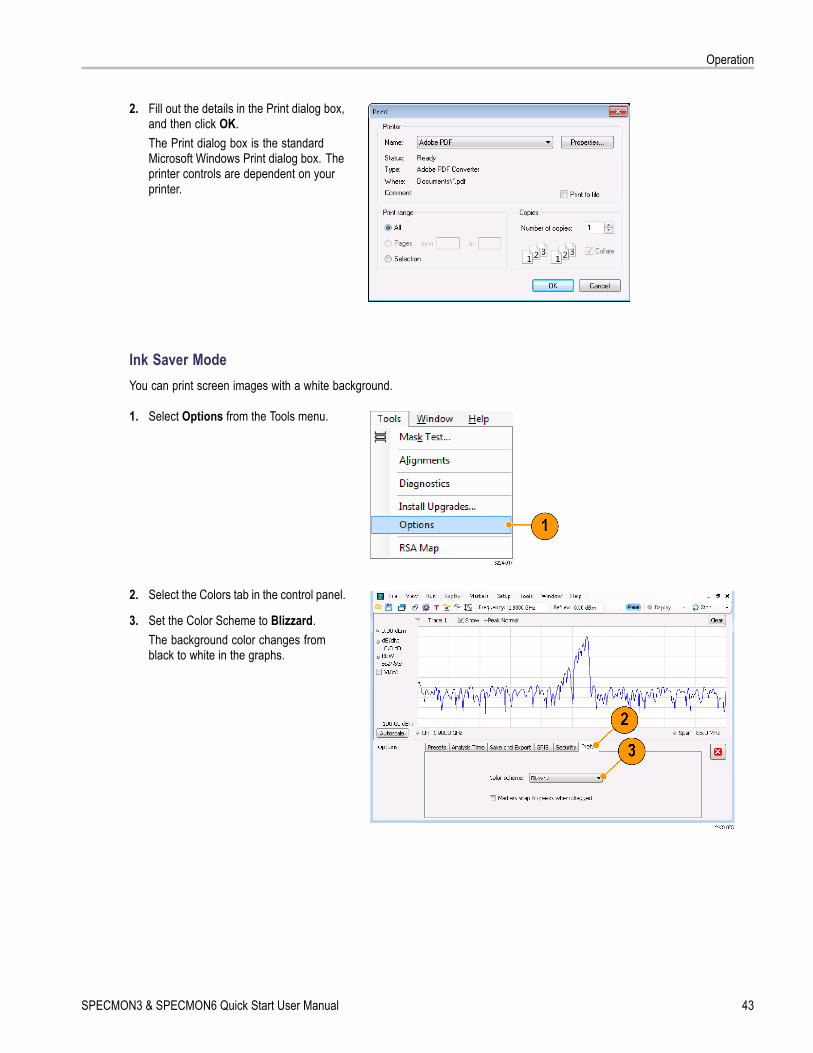
Operation
2. Fill out the details in the Print dialog box,and then click OK.
The Print dialog box is the standardMicrosoft Windows Print dialog box. Theprinter controls are dependent on yourprinter.
Ink Saver Mode
You can print screen images with a white background.
1. Select Options from the Tools menu.
2. Select the Colors tab in the control panel.
3. Set the Color Scheme to Blizzard.
The background color changes fromblack to white in the graphs.
SPECMON3 & SPECMON6 Quick Start User Manual 43

Operation
Saving DataYou can save different types of data for future use.
1. Select Save As. from the File menu toopen the Save As dialog box.
2. Navigate to the folder where you wantto save the setups, or use the defaultlocation.
3. Enter a file name.
4. Select the type of file to save. (SeeTable 7.)
5. Click Save.
Table 7: File types for save
File types Description
Setup files Saves all of the setup information for all settings displays, except those settings thatare specified under the Tools menu (Alignments and Options) or in the Config In/Outcontrol panel.
Results Export files Saves the trace and numeric data for the selected display. The trace and numeric dataare saved in CSV format as text files.
Picture (PNG/JPG/BMP) Saves a graphical representation of the screen in the specified format. This option isuseful for including the graphic in reports or other applications. Marker readouts andother information are included.
Selected Trace Saves a trace for later recall back into the display from which it was saved.
Data (acquisition data andacquisition data export)
Saves data for reanalysis by the SPECMON3 and SPECMON6 analyzers or as CSV(comma-separated value) or MAT (Matlab) format to use with external software.
44 SPECMON3 & SPECMON6 Quick Start User Manual

Operation
Quick Tips
Select File > Save or press the Save button to save the information to a file using the same name, path, and data typeas the last time that you saved. If the file already exists, the file name suffix number will increment if you previouslyselected that option in the Tools > Options > Auto Filename control panel tab.
Select File > Save As to open the standard Windows Save dialog box where you can edit the file name, choose whatdata type to save, and select a folder for storing the file.
Recalling DataYou can recall and reanalyze acquisition data and setup files previously saved by the analyzer.
1. Push the Recall button on the front panelor select Recall from the File menu.
SPECMON3 & SPECMON6 Quick Start User Manual 45

Operation
2. In the Open dialog box, browse to thelocation of the file.
3. If you do not see the file, select the typeof file from the drop-down list.
4. Double click the file name to load the file.
Quick Tip
If you recall a trace that has an x-axis range that does not fall within the x-axis range of the current graph, the trace will not bevisible. A small arrow will point off-screen in the direction of the recalled trace. Use the Frequency and Span (or Span andOffset) controls to bring the trace on the screen in the Spectrum display. In other displays, use Horizontal Scale and Offset(which can also be used in the Spectrum display). These controls are on the Settings > Scale tab.
46 SPECMON3 & SPECMON6 Quick Start User Manual

Operation
Plotting Measurements on a MapThe analyzer includes a program named RSA Map that allows you to record measurement results and their location on a map.
Map Files
RSA Map uses MIF format map files or Windows bitmap files (.bmp) to indicate location. The .bmp format map files canbe either geo-referenced (using world map file format to specify geographic location) or non geo-referenced (which doesnot have a geographic location information).
Launching RSA Map
To launch RSA Map:
1. In the SPECMON application, selectTools > RSA Map from the menu bar.
RSA Map will launch in a separate window.
Loading a Map
Before you can use the RSA Map tool to record measurements you must load a map. If you loaded a map in a previoussession, that map will remain loaded until it is replaced by a new map.
1. Select File > Load Map.
SPECMON3 & SPECMON6 Quick Start User Manual 47
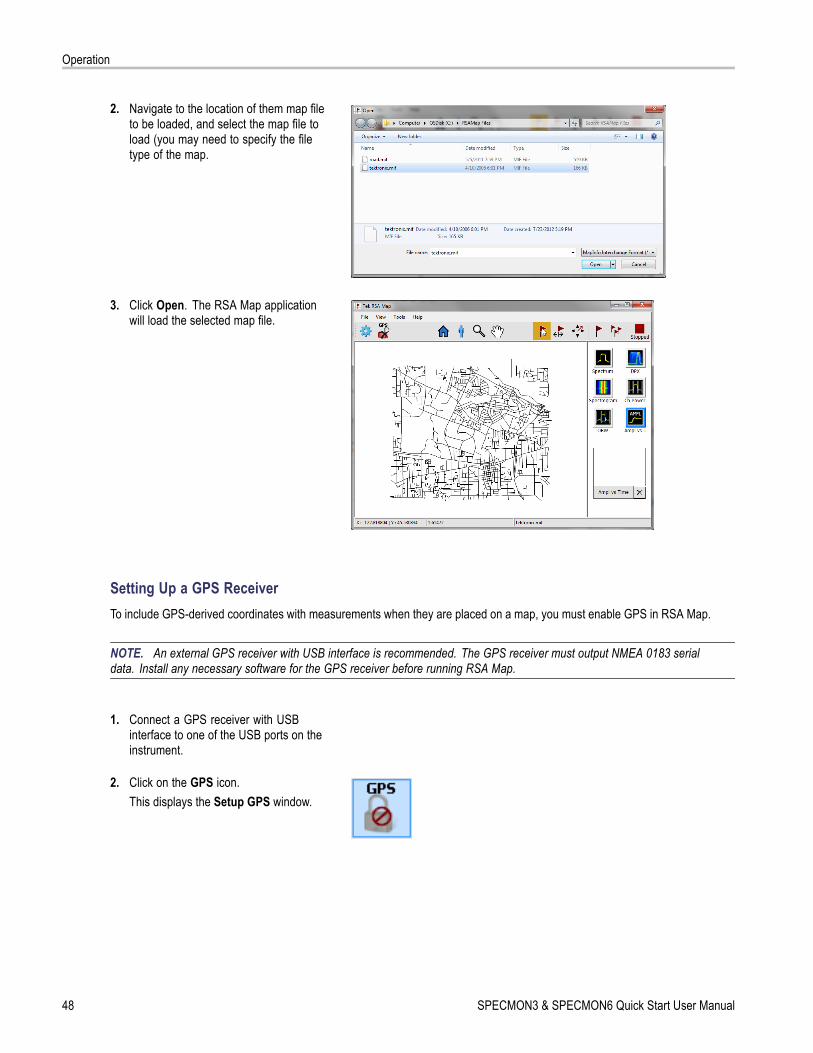
Operation
2. Navigate to the location of them map fileto be loaded, and select the map file toload (you may need to specify the filetype of the map.
3. Click Open. The RSA Map applicationwill load the selected map file.
Setting Up a GPS Receiver
To include GPS-derived coordinates with measurements when they are placed on a map, you must enable GPS in RSA Map.
NOTE. An external GPS receiver with USB interface is recommended. The GPS receiver must output NMEA 0183 serialdata. Install any necessary software for the GPS receiver before running RSA Map.
1. Connect a GPS receiver with USBinterface to one of the USB ports on theinstrument.
2. Click on the GPS icon.
This displays the Setup GPS window.
48 SPECMON3 & SPECMON6 Quick Start User Manual

Operation
3. Click the Enable check box.
4. Click the COM port drop-down list arrowand scroll through the list. Select the portthat displays the name of the attachedGPS receiver.
5. Set the Baud Rate as appropriate for theconnected GPS receiver.
6. Click Apply to enable GPS.
When the GPS receiver is communicatingwith the analyzer, the readouts in the Statusarea will update to display current locationinformation.
SPECMON3 & SPECMON6 Quick Start User Manual 49

Operation
7. Click OK to accept the GPS settings youhave entered and close the Setup GPSwindow.
When the analyzer is locked onto the GPSsignal, the GPS icon displays a green lockicon.
Mapping a Measurement
Use the following procedure to map measurement results. Before you use the following procedure, do the following:
Load a map. (See page 47, Loading a Map.).
Select Tools > SPECMON to switch to the SPECMON application and set up the measurement you wish to map inthe analyzer application. If you want to map Signal Strength, set up the Chan Power/STR and ACPR display on theanalyzer as required for the signal you will be measuring.
1. In the RSA Map application, selectone of the measurement buttons. Theselected measurement is surroundedwith a blue highlight and the name ofthe measurement appears below theThumbnail area.
2. Click the Single Measurement button.
50 SPECMON3 & SPECMON6 Quick Start User Manual

Operation
3. Click or tap on the map.
If a GPS receiver is active, and you areusing a geo-referenced map, a singlemeasurement is placed at the currentGPS coordinates.
If a GPS receiver is not active, or ifyou are using an image map, a singlemeasurement is placed where youtapped the map
4. You can select a different measurementbutton, and then tap the map to add anew measurement to the map. Multiplemeasurement icons at the same locationstack on top of each other.
5. To move an measurement result (forexample, if two or more results arestacked), tap the Move Result button.
6. Tap and drag the measurement resultto a new position. If the icon is movedto a new stack of measurements,then the icon is placed in the stack intime-of-measurement order.
SPECMON3 & SPECMON6 Quick Start User Manual 51

Operation
NOTE. The number of measurements that can be placed on a map is limited to 200. When the limit is reached, RSA Mapshows a message stating that the limit has been reached, and discards any following measurements. Select File > SaveAs to save the map and measurements to a file, or select File > Clear All Measurements to clear the map and resumeadding measurements to the map.
NOTE. To add measurements at a new location on a geo-referenced map with an active GPS receiver, you must physicallymove to the new location. If you want to add a measurement at a point other than the current GPS location, disable GPSbefore placing the measurement.
NOTE. To move measurement icons on a map, select the Move Result button ( ). Click on the measurement anddrag it to the new location.
Repeat RSA Map Measurements
Repeat measurements lets you automatically map a single measurement at a set time interval or change in GPS position. Toperform repeat measurements, GPS must be enabled and locked. The map used must be a geo-referenced map.
NOTE. The RSA Map program maps only completed measurement results. If the specified time interval is less than thatrequired to take a measurement, RSA Map ignores the specified time interval and maps results as soon as the measurementacquisition is done. For example, if the instrument requires 20 seconds to take a measurement, but the time interval is set to10 seconds, then the instrument maps results every 20 seconds.
1. Set up the measurement parameters(frequency, bandwidth, and so on) in theSPECMON application.
2. Select Tools > RSA Map to return to theRSA Map application.
3. Enable GPS as previously described.
4. Tap the Repeat Measurements button.
5. Tap the Settings button display theSettings window.
52 SPECMON3 & SPECMON6 Quick Start User Manual

Operation
6. Set the type of measurement interval(time or distance between measurementpositions) as needed.
7. Tap Done.
8. Tap the map at any point to start repeatmeasurements. The instrument adds ameasurements to the map at the currentGPS position.
The instrument will repeat measurementsbased on time or distance as specified on the
(Settings) > Repeat Measurement tab.
9. Tap the map to stop measurements:
SPECMON3 & SPECMON6 Quick Start User Manual 53

Operation
10. Tap the Single Measurement or theSelect icons to exit the RSA Map loggingmeasurements mode.
NOTE. The number of measurements that can be placed on a map is limited to 200. For repeat measurements, when theinstrument reaches the measurement limit, a message is briefly displayed, the measurements and map are automaticallysaved to the current Save Results directory, the map is cleared, and then RSA Map continues adding measurementsto the map.
RSA Map Measurement Icons
The RSA Map application uses icons on the map to represent a measurement taken at that location. You can performvarious actions on measurement icons, including viewing the measurement results of an icon, moving the icon, deletingan icon, and attaching a measurement direction arrow to an icon. See the following sections, and the RSA Map onlinehelp for more information.
Viewing and Deleting Measurement Icons
To view or delete the measurement results associated with an RSA Map measurement icon:
1. Tap the RSA Map Select button.
2. Tap a measurement icon to open theMap Measurements dialog box.
3. Tap the measurement of interest in thelist.
54 SPECMON3 & SPECMON6 Quick Start User Manual

Operation
4. Tap Open Measurement to open themeasurement screen for the selectedmeasurement. Select Tools > RSA Mapto return to the RSA Map screen.
5. Tap the Delete Measurement buttonto delete the selected measurement.If there are multiple measurements todelete, repeatedly select and tap DeleteMeasurement.
6. Tap OK to close the dialog box.
NOTE. To delete all the measurement icons from a map, select File > Clear All Measurements.
Draw a Measurements Azimuth (Direction) Arrow
The RSA Map azimuth direction arrow function lets you draw an arrow on a mapped measurement to indicate the directionyour antenna was pointing when you took a measurement.
1. Tap the Change Azimuth button.
SPECMON3 & SPECMON6 Quick Start User Manual 55
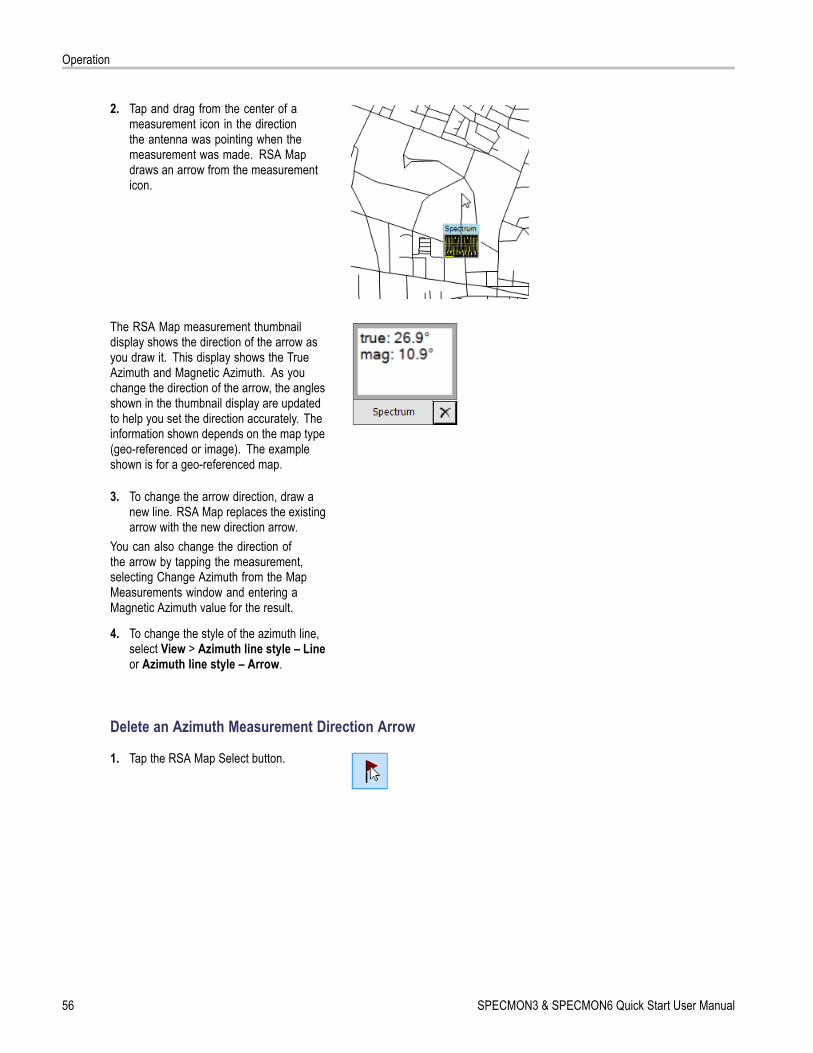
Operation
2. Tap and drag from the center of ameasurement icon in the directionthe antenna was pointing when themeasurement was made. RSA Mapdraws an arrow from the measurementicon.
The RSA Map measurement thumbnaildisplay shows the direction of the arrow asyou draw it. This display shows the TrueAzimuth and Magnetic Azimuth. As youchange the direction of the arrow, the anglesshown in the thumbnail display are updatedto help you set the direction accurately. Theinformation shown depends on the map type(geo-referenced or image). The exampleshown is for a geo-referenced map.
3. To change the arrow direction, draw anew line. RSA Map replaces the existingarrow with the new direction arrow.
You can also change the direction ofthe arrow by tapping the measurement,selecting Change Azimuth from the MapMeasurements window and entering aMagnetic Azimuth value for the result.
4. To change the style of the azimuth line,select View > Azimuth line style – Lineor Azimuth line style – Arrow.
Delete an Azimuth Measurement Direction Arrow
1. Tap the RSA Map Select button.
56 SPECMON3 & SPECMON6 Quick Start User Manual

Operation
2. Single-tap the measurement icon withthe direction arrow to delete. RSA Mapopens the Map Measurements dialogbox.
SPECMON3 & SPECMON6 Quick Start User Manual 57

Operation
3. Tap the measurement name that has thedirection arrow to delete.
4. Tap the Delete Azimuth button.
5. Tap OK. RSA Map closes the dialog boxand deletes the direction arrow.
Saving Measurement Results
RSA Map allows you to save measurement results to a file for documentation. Saved results can also be recalled to reviewresults. RSA Map saves results in a compressed .zip format. The saved results contain several types of files:
Measurement data files (exported results)
Map file used for the measurements
Google Earth KMZ file
Recallable results files (trace and setup files)
MapInfo-compatible MIF/MID files
For complete details on the saved archive contents, see the RSA Map Help.
To save measurement results:
1. Select File > Save As.
58 SPECMON3 & SPECMON6 Quick Start User Manual

Operation
2. Navigate to the location where you wantto save the results and type a name forthe file.
3. Select Save to save the results.
Recalling Measurement Results
To recall saved measurement results:
1. Select File > Recall.
2. Navigate to the location where you wantto save the results and type a name forthe file.
3. Select Save to save the results.
SPECMON3 & SPECMON6 Quick Start User Manual 59

Operation
RSA Map loads the contents of the recalledmeasurement archive.
60 SPECMON3 & SPECMON6 Quick Start User Manual

Operation
Advanced TechniquesThis section contains advanced operating techniques. For examples of practical applications, see the SPECMON3Real-Time Spectrum Analyzers and SPECMON6 Real-Time Spectrum Analyzers Application Examples Manual.
Setting Up Triggering
The analyzer offers real-time power-level triggers, line trigger, and external triggers. Option 52 adds frequency mask triggers,and Option 200 includes frequency edge, DPX density, and runt triggering. It uses a trigger event as a reference point in timefor the seamless acquisition of the signal. This allows the analyzer to store both pretrigger and posttrigger information.
The analyzer has two triggering modes:
Free Run mode. In Free run mode, the instrument initiates acquisitions without considering any trigger conditions. Itis a fast and easy way to see the signals. Free Run is usually adequate for the Spectrum display unless you need tospecify a particular time at which to collect the data record.
Triggered mode. In Triggered mode, the instrument initiates an acquisition when a trigger event is recognized. Theconditions that define a trigger event depend on the selected trigger source. There are several source selections available forchoosing the signal to monitor for a trigger event.
Once you select the Triggered mode, you must select the source. The trigger sources are:
RF Input
Trig In
Trig 2 In
Gated
Line
Once you select the trigger source, you can set additional parameters to specify the trigger event. If you specify the RF Inputas the trigger source, you can chose from two trigger types:
DPX Density Triggering. This trigger type enables the instrument to capture any signal you can see in the DPX display,including difficult to see signals hiding beneath other signals that have a higher amplitude or a greater repetition rate. Usingthe Trigger On This™ feature, you can draw a box around the area of interest in the graph, set a Density threshold, andthe instrument will trigger when the measured Density exceeds your threshold.
Time Qualified Triggering. Time Qualified triggers allow you to trigger the instrument based on when signal transitionsoccur in time. You can apply time qualification to the basic trigger types. For example, if you select the Power type andconfigure it to trigger on a rising edge, Time Qualification allows you to screen rising-edge events based on how long thesignal stays high after it exceeds the trigger threshold. You may wish to trigger only on pulses that last longer than aspecified time or shorter than a specified time. You can set Time Qualified to accept only pulse widths between two specifiedvalues, or outside of these two values.
You can also time qualify Frequency Edge, Frequency Mask, DPX Density, and Runt trigger events. For each trigger type,the instrument finds all events that meet the basic trigger criteria, then further tests them against your time qualificationparameters.
Frequency Edge Triggering. Frequency Edge triggering triggers the instrument on time-domain signal characteristics.The incoming data is compared to a user-selected level in Hertz. Frequency edge trigger is similar to Power triggering,except you also need to set a power threshold to avoid triggering on the apparent frequency fluctuations that occur at lowamplitude. You can select the time-domain bandwidth and trigger on the rising or falling edge.
SPECMON3 & SPECMON6 Quick Start User Manual 61
Operation
Frequency Mask Triggering. Frequency Mask Triggering allows you to trigger the instrument when a signal in thefrequency domain violates the mask. You can draw a mask to define the conditions within the real-time bandwidth that willgenerate the trigger event. It allows you to trigger on weak signals in the presence of strong signals. This triggering isalso useful for capturing intermittent signals.
Power Triggering. Power triggering triggers the instrument on time-domain signal characteristics. The incoming data iscompared to a user-selected level in dBm. You can select the time-domain bandwidth and trigger on the rising or falling edge.
Runt Triggering. Runt triggering defines a trigger event based on a pulse amplitude that crosses one threshold but failsto cross a second threshold before recrossing the first.
In addition to defining the trigger event, you can define the following parameters by selecting the appropriate tab inthe Trigger control panel:
Position and Delay parameters that define where a trigger occurs within the acquired data record and whether todelay the trigger for a set amount of time.
Whether a single event can trigger an entire sweep, or each segment of the sweep requires a new trigger event inswept acquisition mode.
62 SPECMON3 & SPECMON6 Quick Start User Manual

Operation
Accessing Trigger Parameters
1. Click Trig to open the Trigger controlpanel.
2. As shown in the following steps, clickone of the tabs in the Trigger controlpanel to define the trigger parameters.
3. Use the Event tab to set parameters thatdefine trigger events. The parametersvary depending on the trigger Sourceand Type selections.
4. Use the Time Qualified tab to setparameters that qualify trigger eventsbased on their time duration.
5. Use the Advanced tab to set parametersfor trigger position and holdoff settings.
6. Use the Actions tab to set parameters forthe Save on trigger function. The Saveon trigger function allows you to savean acquisition data file and/or a screencapture when a trigger event occurs.
SPECMON3 & SPECMON6 Quick Start User Manual 63

Operation
Quick Tip
Other ways to access the Trigger control panel:
Push the Trigger button on the front panel.
Select Trigger. from the Setup menu.
Setting Up a DPX Density Trigger
The DPX Density trigger captures transients partially obscured by other higher-amplitude or more frequent signals. If youcan see it in the DPX bitmap, you can trigger on it. The DPX Density area measurement is used to select the region ofinterest in the display and to measure its current density. You set a density threshold, and the instrument triggers when thedensity measurement exceeds your threshold.
The quickest way to set up a DPX Density trigger is to use a mouse and right-click on a signal of interest in the DPXgraph, or press on the screen and hold with your finger for one second. A menu will pop up. Select Trigger On This.This action performs several tasks:
Places the density measurement box at the click point
Sets the measurement box to its default size
Measures the average density in the box
Sets the Trigger mode to Triggered
Selects the DPX Density "Higher" trigger type
Adjusts the trigger threshold to a density value slightly below the current measured value
Starts the acquisition process
To optimize DPX Density trigger settings for your particular signals, open the Trigger control panel. Use the controls forchanging the polarity of the trigger's threshold comparison (Higher versus Lower), the Threshold value, and the size andlocation of the measurement box. Use the Frequency and Amplitude settings to locate the center of the box, and set the +/-values to adjust the width and height of the measurement box.
For events that are partially masked by stronger signals, you will often need to adjust the density Threshold based ondensity measurements of the event of interest and of the obscuring signal. For example, if the density of the backgroundcolor representing only the stronger signal is 7% and the density measurement including both signals is 9%, you wouldset the Threshold to 8%.
64 SPECMON3 & SPECMON6 Quick Start User Manual

Operation
If your expected signal is a continuous tone and you want to capture events when it hops to a different frequency or dropsto a lower amplitude, move the Density measurement box to surround the peak of the signal, select Lower in the Densitycontrol, and set Threshold to 100%. The instrument will trigger when the signal is absent from the measurement box.
Hint. The density measurement is the average of the densities for each column of pixels in the box. If your measurementbox is wider than the peak of a CW signal, the density reading will be less than 100%. To get a 100% reading, you canbroaden the peak by increasing RBW or narrow the box until there are no colored pixels either above or below the box. Thesignal should enter the left side of the box and exit the right side. It should not cross the bottom edge of the box.
Creating a Frequency Mask
Use the Mask Editor to create a Frequency Mask. The mask is a set of points defined by frequency and amplitude. Accessthe Mask Editor from the Trigger control panel. (This procedure uses the Spectrum display.)
You can create a Frequency Mask by using either the manual or Auto Draw method. The following procedure explains themanual method. For a procedure on how to use the Auto Draw method, see the topic Mask Editor (Frequency MaskTrigger) in the online help.
1. Click Trig to open the Trigger controlpanel.
SPECMON3 & SPECMON6 Quick Start User Manual 65

Operation
2. Select the Event tab in the control panel.
3. Set the Source to RF Input.
4. Set the Type to Frequency Mask.
5. Click Mask Editor to open the MaskEditor.
The Mask Editor opens with the traces ofthe Spectrum display in the graph.
6. Click New in the tool bar. This removesthe existing mask and then creates adefault 6-point mask.
66 SPECMON3 & SPECMON6 Quick Start User Manual

Operation
7. Click any point in the mask to select it.
The frequency and amplitude of theselected point are highlighted in thegraph.
8. Edit the point by doing one of thefollowing:
Drag and drop the point with themouse.
Enter the frequency and amplitude inthe table.
Adjust amplitude with the up/downarrow keys and frequency with theleft/right arrow keys.
Quick Tips
Click Auto draw to generate a mask automatically adjusted to the Reference.
Right click on the display screen to add a new point.
Click Add Points and then click on the graph to add a new point in the graph.
Click Next to select the next point in the graph.
Click the X (delete button) to delete the selected mask point.
Click Save to save the mask file and continue working with the mask editor.
Click Open to load and edit a previously saved mask file.
Defining Trigger Conditions
After you have set up the mask, you can select whether to trigger on the presence or absence of mask violations.
1. Select a condition.
The choices are described in thefollowing table. (See Table 8.) The iconsat the bottom of the control panel identifywhat is considered true or false.
2. Click Triggered.
The instrument will trigger when thetrigger conditions are met.
SPECMON3 & SPECMON6 Quick Start User Manual 67

Operation
Table 8: Trigger violations
Violation Description
T The instrument triggers whenever the signal violates the mask (above the line).
F The instrument triggers whenever the signal has no points in the mask.
T > F One transition defines the trigger event. The signal must go out of the mask (no violation)after being inside of the mask (violation).
F > T One transition defines the trigger event. The signal must go into the mask after beingoutside of the mask.
T > F > T Two transitions define the trigger event. The signal must start inside of the mask, crossoutside of the mask, and then cross back into the mask.
F > T > F Two transitions define the trigger event. The signal must start outside of the mask (noviolation), cross into the mask, and then cross back outside of the mask.
Controlling Acquisitions
When two or more displays are open, one display controls the acquisition system. The acquisition requirements for theselected display set the acquisition hardware parameters. While the acquisition parameters are optimized for the selecteddisplay, they might not be ideal for other displays. In this case, the other displays might be unable to maintain optimumperformance and consequently might be unable to produce results. (This also happens when you analyze recalled data:measurements attempt to deliver results, but may not be able to comply with all their settings.)
You can specify which display controls the hardware acquisition parameters by clicking anywhere in that display. When thereare multiple displays, the highlighted display controls the hardware acquisition parameters.
In this example, there are two displays, aSpectrum display and a DPX Spectrumdisplay. The highlighted title bar on theSpectrum display indicates that it is theselected display.
The check mark indicator in the upperleft corner of the display indicates thatacquisition hardware is optimized for theSpectrum display.
Some displays do not control the acquisition hardware. These displays just show the captured data. Some displays sharethe same parameters. If any of one of these displays in such a family controls the acquisition hardware, then the acquisitionparameters are optimized for all of the displays in that family.
68 SPECMON3 & SPECMON6 Quick Start User Manual
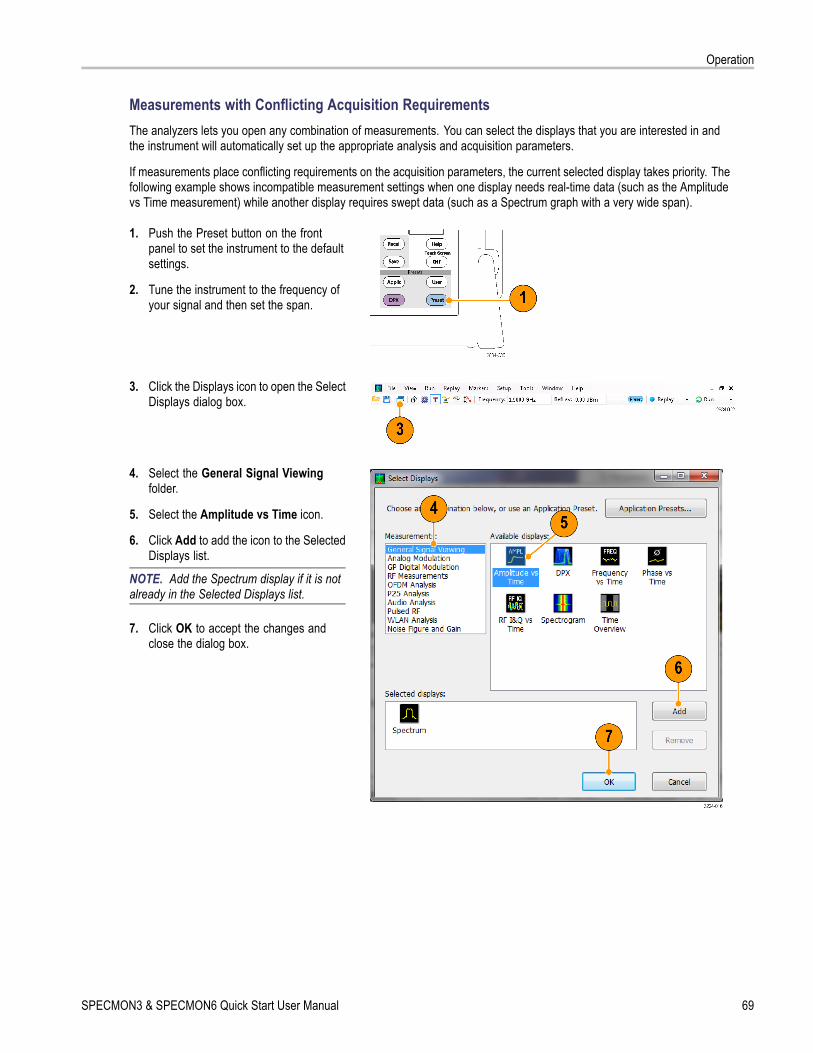
Operation
Measurements with Conflicting Acquisition Requirements
The analyzers lets you open any combination of measurements. You can select the displays that you are interested in andthe instrument will automatically set up the appropriate analysis and acquisition parameters.
If measurements place conflicting requirements on the acquisition parameters, the current selected display takes priority. Thefollowing example shows incompatible measurement settings when one display needs real-time data (such as the Amplitudevs Time measurement) while another display requires swept data (such as a Spectrum graph with a very wide span).
1. Push the Preset button on the frontpanel to set the instrument to the defaultsettings.
2. Tune the instrument to the frequency ofyour signal and then set the span.
3. Click the Displays icon to open the SelectDisplays dialog box.
4. Select the General Signal Viewingfolder.
5. Select the Amplitude vs Time icon.
6. Click Add to add the icon to the SelectedDisplays list.
NOTE. Add the Spectrum display if it is notalready in the Selected Displays list.
7. Click OK to accept the changes andclose the dialog box.
SPECMON3 & SPECMON6 Quick Start User Manual 69
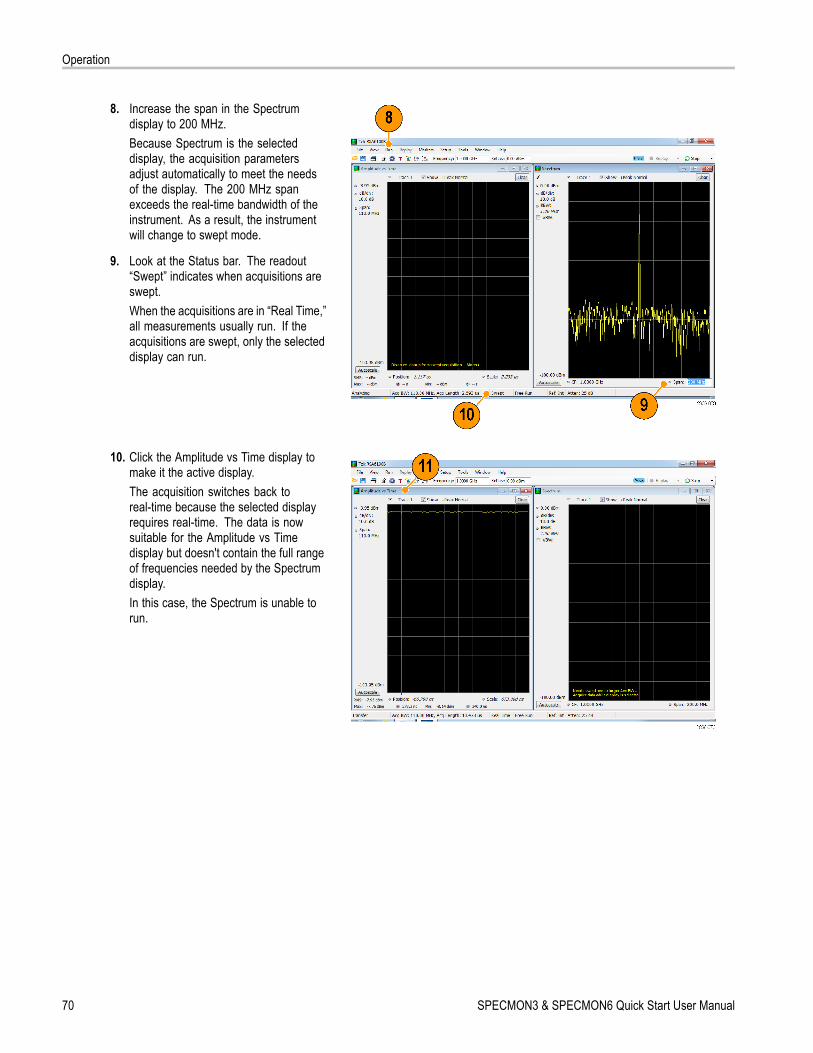
Operation
8. Increase the span in the Spectrumdisplay to 200 MHz.
Because Spectrum is the selecteddisplay, the acquisition parametersadjust automatically to meet the needsof the display. The 200 MHz spanexceeds the real-time bandwidth of theinstrument. As a result, the instrumentwill change to swept mode.
9. Look at the Status bar. The readout“Swept” indicates when acquisitions areswept.
When the acquisitions are in “Real Time,”all measurements usually run. If theacquisitions are swept, only the selecteddisplay can run.
10. Click the Amplitude vs Time display tomake it the active display.
The acquisition switches back toreal-time because the selected displayrequires real-time. The data is nowsuitable for the Amplitude vs Timedisplay but doesn't contain the full rangeof frequencies needed by the Spectrumdisplay.
In this case, the Spectrum is unable torun.
70 SPECMON3 & SPECMON6 Quick Start User Manual

Operation
11. Decrease the span to 25 MHz in theSpectrum display. Now the acquisitionsare real time again.
12. Check the status bar readout to verifythat the acquisition is real-time.
Both of the displays can run now.
SPECMON3 & SPECMON6 Quick Start User Manual 71

Operation
Mask Testing
The analyzer lets you test many trace results for changes in level. You can identify matches crossing a power level oryou can create a mask that specifies power level and frequency range limits. You can select which trace to test andspecify an action to take when a test condition is met for traces in the Spectrum, DPX, Noise Figure, Spurious, and SettingTime displays. The Frequency Settling Time, Phase Settling Time, Spurious, Bluetooth InBand Emission, and OccupiedBandwidth measurements tests provide pass/fail results.
The available choices include only results from displays that are currently open.
Selecting Mask Test from the Tools menu displays the Mask Test control panel. These settings define test parameters andspecify actions to be performed when the test conditions are met.
To start a mask test. Perform the following steps to set up for any mask test.
1. Open the Spectrum display or select theSpectrum display if it is already open.
2. Select Tools > Mask Test.
3. Select the Enable Test check box to setthe application to perform the test oncethe conditions are defined.
4. Select the trace you wish to test from theSearch in drop-down list box.
72 SPECMON3 & SPECMON6 Quick Start User Manual

Operation
5. Verify that the trace you selected in theSearch in list is the selected trace andthat the Show box is checked.
6. Click the Actions tab to specify whatactions the analyzer should take when amatch occurs.
The analyzer can take up to five actionswhen a match occurs, depending on therun mode. In Run mode, the analyzercan sound a beep, stop acquisitions,save acquisition data, save trace data,and save a picture of the display. InReplay mode, it can sound a beep andstop analyzing.
7. To have the analyzer take an actionwhen a match occurs, select the desiredaction.
You can select any combination ofactions to perform on a match. If youselect all actions, they will all occur whena match is found (in Run mode).
SPECMON3 & SPECMON6 Quick Start User Manual 73

Operation
To perform a Greater Than/ Less Than mask test.
1. Specify what to test for by making aselection from the Test for drop-downlist.
To test for signal levels above or belowa specified level, select either is greaterthan or is less than.
2. Press the Run button to initiate a test.Click the Replay button on the toolbar toinitiate a test on the current data record.
3. Notice the vertical red bar. It highlightsresults that match the test definition.
4. Click the close box to remove the MaskTest control panel.
74 SPECMON3 & SPECMON6 Quick Start User Manual

Operation
To perform an Outside/Inside mask test. If you specify a mask-based test, then you need to edit the mask to specifythe levels that define a violation. You can do this as follows.
1. Select is outside mask or is inside mask from the Test for menu.
2. Click the Edit limits button to display the Mask Test Editor window.
3. Click the New button to create a table. This clears the existing points and loads the default table. You can also clickOpen to open an existing table.
4. To edit values, add points, or delete points in a table:
a. To edit an existing value, double-click on the cell you want to edit and enter the desired value. The active pointshows as a red point on the plot.
SPECMON3 & SPECMON6 Quick Start User Manual 75

Operation
b. To add a new point, check the box next to the target mask (located below the Auto draw button).
c. Select Add points located below the Open button.
d. Select the target mask (Upper Mask Table or Lower Mask Table) from the drop-down menu.
e. Click in the desired location on the plot to add the point.
f. To use the auto draw feature to automatically place points on the chosen mask, enable the desired mask from thedrop-down menu and then click the Auto draw button.
NOTE. Units may be changed for measurements other than Noise Figure in Setup > Analysis > Units.
5. To delete a point from the table, select the point to be removed, and click the X button.
6. To save the mask to a file for later recall, click Save As.
7. From the Save As dialog, name the file and save it in the desired location.
76 SPECMON3 & SPECMON6 Quick Start User Manual

Operation
NOTE. Masks are saved in XML format with a .msk extension.
8. To dismiss the Mask Test Editor window, click Done.
Mask Test result examples. The following figure shows the results of a Spectrum is outside mask test with Upper Maskenabled. The vertical red bar highlights results that have exceeded the test limits. The shaded region shows the mask area.
The following figure shows the results of a passing Noise Figure is outside mask test with Upper Mask enabled. Markersare also in use.
SPECMON3 & SPECMON6 Quick Start User Manual 77

Operation
The following figure shows the results of a failing Noise Figure is outside mask test with Lower Mask and Upper Maskenabled. The red area highlights the area of failure, which occurs at the lower mask. Markers are also in use.
78 SPECMON3 & SPECMON6 Quick Start User Manual

Operation
Using Correction Tables
The analyzers let you correct the signal displays and measurement results to account for gains and losses in externalequipment. You can specify a single gain value or you can use an external loss table to adjust the gain/loss value basedon frequency.
To specify external gain/loss corrections:
1. Press the Amplitude icon button todisplay the Amplitude control panel.
2. Select the External Gain/LossCorrection tab.
3. To apply a constant correction factor,select the External Gain value checkbox. Enter a value into the text entry box.
NOTE. You can enter either positive ornegative gain values. Positive valuesrepresent a gain. Negative values representa loss.
4. To use a table that corrects for gain/lossvalues depending on frequency, click acheck box under External Loss Tables.
You can enable all three external losstables at the same time. Thus, you coulduse different external loss tables for anantenna, a preamplifier, and for cabling.
5. To edit the contents of an external losstable, click the Edit button for the tableyou want to edit.
SPECMON3 & SPECMON6 Quick Start User Manual 79

Operation
6. Edit the contents of the table to matchthe loss characteristics of the equipmentyou are correcting for. Click OK whenyou are finished.
NOTE. You can enter either positive ornegative values into the table. But in contrastto the External Gain value setting, positivevalues represent a loss and negative valuesrepresent a gain.
For detailed information on using the TableEditor, select Help > User Manual and lookin the Index for External Loss Tables.
7. You can change the title for each externalloss table. Select the title box and typein a new title.
Note that the title is only a label. It isnot tied to the file name of any table youhave loaded or saved.
8. Specify whether table corrections areapplied to all acquired data or only totraces in the Spectrum, Spectrogram,Spurious and Amplitude vs Timedisplays.
Corrections applied to data areperformed in real time using the digitalfilter capabilities of the instrument. Whilethis has the advantage of correctingthe data for use in all measurements,digital filtering is limited in its ability toapply corrections that change rapidlyin amplitude over small frequencyranges, as may occur when switchingbetween two antennas. When thishappens, the filters may result in anamplitude correction that appears toring in its response, resulting in poorlycorrected data. For that reason, theinstrument offers trace-only correctionfor spectrograms, spectrum, spurious,and amplitude vs. time displays. Thesetrace corrections are similar to thoseapplied in traditional spectrum analyzers,and should be used when discontinuitiesoccur in the amplitude/frequencycorrection table.
80 SPECMON3 & SPECMON6 Quick Start User Manual

Operation
When choosing whether to correctsample data or traces, keep the followingin mind:
If sample data is acquired whiledata correction is enabled, that datarecord is permanently corrected. If theacquisition is saved and recalled, therecalled acquisition includes corrections.Corrections are not saved separatelyfrom the raw data; they are used duringthe acquisition process to adjust the datavalues.
Trace corrections can be appliedat any time, as they are part of themeasurement's computations. UsingReplay will apply trace corrections toa trace if this control is enabled (andan external loss table is specified andenabled).
Be aware that if you recall acquisitiondata that was saved with data correctionsand you use Replay with tracecorrections selected and an externalloss table enabled, the trace will becalculated using corrected data and alsocorrected with trace corrections. Thisusually creates incorrect traces.
9. Click the close box to remove theAmplitude control panel when you arefinished making changes.
SPECMON3 & SPECMON6 Quick Start User Manual 81
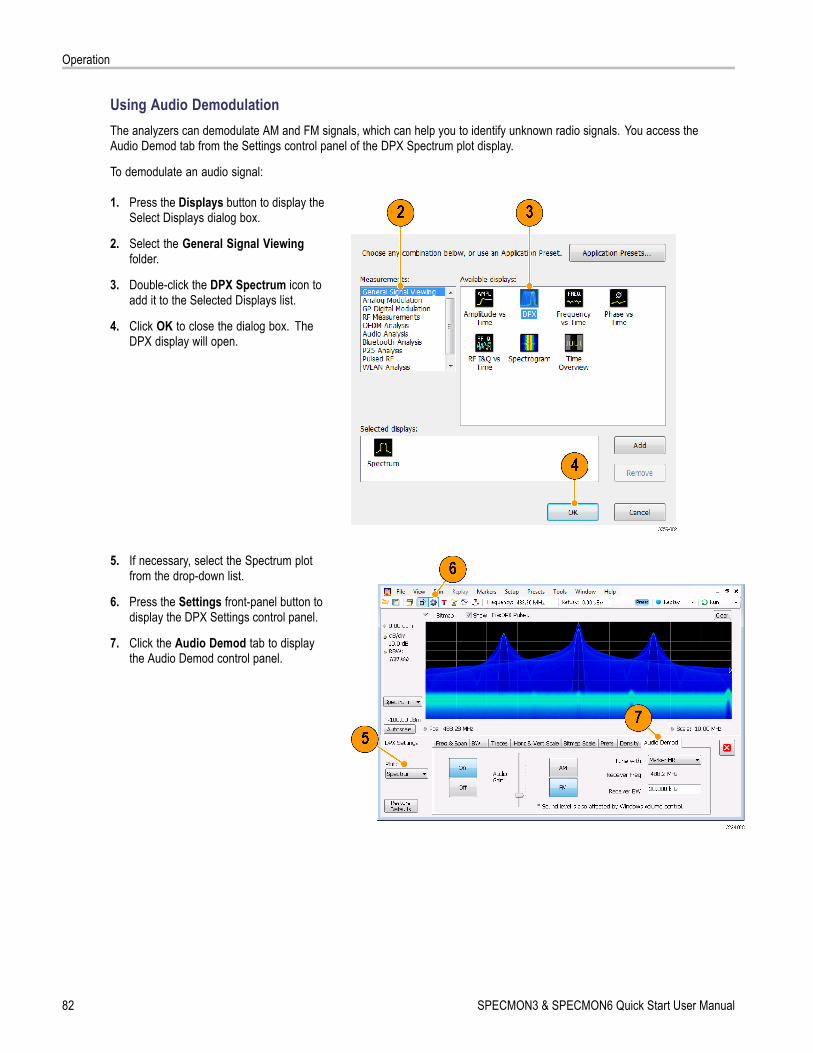
Operation
Using Audio Demodulation
The analyzers can demodulate AM and FM signals, which can help you to identify unknown radio signals. You access theAudio Demod tab from the Settings control panel of the DPX Spectrum plot display.
To demodulate an audio signal:
1. Press the Displays button to display theSelect Displays dialog box.
2. Select the General Signal Viewingfolder.
3. Double-click the DPX Spectrum icon toadd it to the Selected Displays list.
4. Click OK to close the dialog box. TheDPX display will open.
5. If necessary, select the Spectrum plotfrom the drop-down list.
6. Press the Settings front-panel button todisplay the DPX Settings control panel.
7. Click the Audio Demod tab to displaythe Audio Demod control panel.
82 SPECMON3 & SPECMON6 Quick Start User Manual
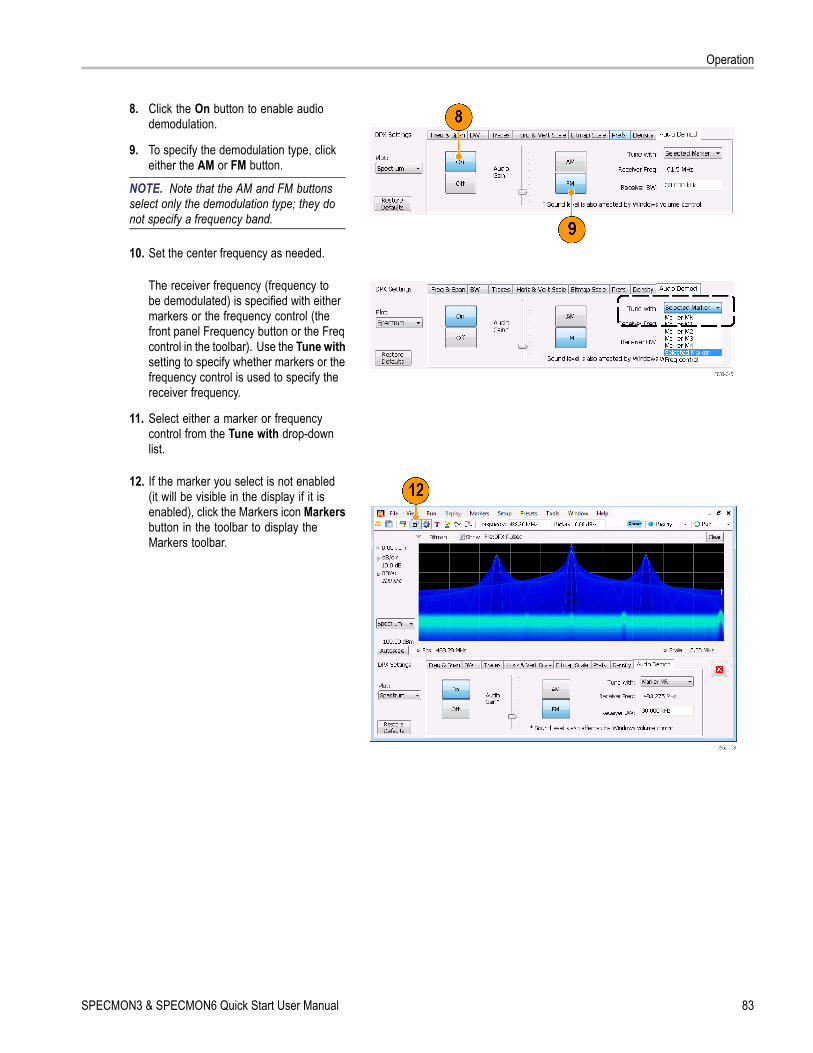
Operation
8. Click the On button to enable audiodemodulation.
9. To specify the demodulation type, clickeither the AM or FM button.
NOTE. Note that the AM and FM buttonsselect only the demodulation type; they donot specify a frequency band.
10. Set the center frequency as needed.
The receiver frequency (frequency tobe demodulated) is specified with eithermarkers or the frequency control (thefront panel Frequency button or the Freqcontrol in the toolbar). Use the Tune withsetting to specify whether markers or thefrequency control is used to specify thereceiver frequency.
11. Select either a marker or frequencycontrol from the Tune with drop-downlist.
12. If the marker you select is not enabled(it will be visible in the display if it isenabled), click the Markers icon Markersbutton in the toolbar to display theMarkers toolbar.
SPECMON3 & SPECMON6 Quick Start User Manual 83

Operation
13. Click the Define button in the Markertoolbar to display the Define Markerscontrol panel.
14. Click Add to add markers as needed.
15. Click the Settings button to return to theAudio Demod control panel.
16. Set the required receiver bandwidth byentering a value into the Receiver BWvalue entry box.
84 SPECMON3 & SPECMON6 Quick Start User Manual

Operation
17. Set the receiver frequency.
If you specified a marker with the Tunewith setting, drag the marker to therequired frequency. Fine tune the markerposition with the front-panel knob oryour mouse wheel. If you selectedFrequency control in the Tune withsetting, press the front-panel FREQbutton, then turn the front-panel knob oruse the Freq setting in the toolbar to setthe required frequency.
The receiver frequency is displayed asReceiver Freq between the Tune withand Receiver BW settings.
18. Adjust the Audio Gain setting so you canhear the demodulated signal. Note thatthe sound level is also affected by thesetting of the Windows volume control.
SPECMON3 & SPECMON6 Quick Start User Manual 85

Operation
86 SPECMON3 & SPECMON6 Quick Start User Manual

Index
Index
AAccessories
optional, 3power cords, 2Product Documentation, 1standard, 1
Acquisitionconflicts, 69controlling, 68data source, 24starting, 35stopping, 35
Analysis window, 23, 25Application presets, 27audio demodulation, 82
CCF Pan
Touchscreen actions menu, 40check mark indicator, 21, 68Cleaning procedures, 13Conflicts
measurement, 69Connectors
front panel, 18rear panel, 19RF signal input, 34, 35
Controlling acquisitions, 68Controls
display-specific, 22front panel, 14interface, 20
Cooling clearances, 4correction tables, 79
DData
recalling, 45saving, 44
Default settings, 33Diagnostics, 12Digital demodulation displays, 25Display
conflicts, 69Display properties
changing, 11
Display settingschanging, 31
Displaysgeneral signal viewing, 25GP digital modulation, 25printing, 42Pulsed RF, 25RF measurement, 25selecting, 26
Documentation, xiiTektronix part numbers, 1
DPX Densitytriggering, 61
EEnvironmental specifications, 4
altitude, 4cooling clearances, 4humidity, 4temperature, 4
Extended desktop, 8external gain/loss correction, 79External monitor, 8
FFeatures, xiFile types, 44Free Run trigger mode, 61Frequency edge
triggering, 61Frequency mask
Mask Editor, 65triggering, 61
Front panelconnectors, 18controls, 14
GGeneral signal viewing displays, 25Graphics driver, 11Greater than (Mask Test), 74
IiMap
launching, 47
Incoming inspection, 12Information messages, 30Ink saver mode, 43Input requirements
max DC voltage, 34max measurable input
power, 34max safe input power, 34RF signal range, 34
Installation, 1network connections, 5
is inside mask (Mask Test), 75is outside mask (Mask Test), 75Italicized numbers, 22
KKey features, xi
LLess than (Mask Test), 74
MMaintenance
cleaning procedures, 13repackaging, 13
Marker toolbar, 39Markers, 37
absolute, 38adding, 39defining, 40delta, 38DPX bitmap trace, 38power, 38reference, 38
Mask Editoradding points, 65editing points, 67
Mask Test, 72Measurement
conflicts, 69Mechanical specifications, 4Messages
on-screen, 30MR, 38
SPECMON3 & SPECMON6 Quick Start User Manual 87

Index
NNetwork connections, 5
OOperating system restore, 7Optional accessories, 3Options
Power cords, 2
PPan
Touchscreen actions menu, 40Part numbers, manuals, 1Power cord options, 2Power level triggering, 62Power supply, 4Preset, 33
selecting displays, 27, 29system settings, 33
Printing, 42ink saver mode, 43
Product features, xiPulsed RF displays, 25
RReal-Time spectrum analyzer, 23Rear panel connectors, 19Recalling data, 45Repackaging, 13Reset scale
Touchscreen actions menu, 40Returning the instrument, 13RF measurement displays, 25RF signal connections, 34, 35RF signal input range, 34Run control, 36Run menu, 36Runt triggering, 62
SSave options, 44
Saving data, 44Screens, printing, 42Select
Touchscreen actions menu, 40Selected window, 68Selecting displays, 26Settings
changing, 31default, 33preset, 33
Setupsrecalling, 45saving, 44
Software upgrades, xiiinstalling, 13
Span ZoomTouchscreen actions menu, 40
Specificationsaltitude, 4cooling clearances, 4environmental, 4humidity, 4input requirements, 34mechanical, 4power supply, 4product dimensions, 4temperature, 4
Spectrum analyzerreal-time concepts, 23
Standard accessories, 1power cord, 2Product Documentation, 1
Standards presets, 29Starting acquisitions, 35Stopping acquisitions, 35
TTest using a mask, 74, 75Testing signals, 72Time Qualified
triggering, 61touchscreen actions menu, 40Trace legend, 31
Triggercontrol panel, 63mask, 65violations, 68
Trigger Event parameters, 62accessing, 63
Triggered trigger mode, 61Triggering
DPX Density, 61free run, 61frequency edge, 61frequency mask, 61parameters, 62power level, 62Runt, 62time qualified, 61triggered mode, 61
UUpgrades
software, xii, 13
VViolations
trigger mask, 68
WWindow
analysis, 23selected, 68
ZZoom
Touchscreen actions menu, 40
88 SPECMON3 & SPECMON6 Quick Start User Manual