HP E1725C and HP E1740A Time Interval Analyzers with the ...
80
Getting Started Guide HP E1725C and HP E1740A Time Interval Analyzers with the HP E1742A/43A/44A/46A/48A Analysis Software
-
Upload
khangminh22 -
Category
Documents
-
view
0 -
download
0
Transcript of HP E1725C and HP E1740A Time Interval Analyzers with the ...

Getting Started Guide
HP E1725C and HP E1740ATime Interval Analyzers with the HP E1742A/43A/44A/46A/48A Analysis Software

Getting Started GuideThis guide describes how to start using the HP E1725C and the HP E1740A Time Interval Analyzers (TIA) with the HP E1742A, HP E1743A, HP E1744A, HP 1746A, and HP E1748A Analysis Software (HP E1725C options 242, 243, 244, 246, and 248, respectively). Information on installation, start-up, and first use of the TIA are provided.
HP E1725C and HP E1740ATime Interval Analyzers with the HP E1742A/43A/44A/46A/48A Analysis Software

Hewlett-Packard Company 7.CD.NL.A.03.11.97.R1.J.CW2FSanta Clara Division5301 Stevens Creek BoulevardSanta Clara, California 95052-8059
Copyright Hewlett-Packard Company 1998
All Rights Reserved. Reproduction, adaptation, or translations without prior written permission is prohibited, except as allowed under the copyright laws.
Printed: April 1998
Printed in USA
Manual part numberE1725-90012
Certificationand Warranty
Certification
Hewlett-Packard Company certifies that this product met its published specification at the time of shipment from the factory. Hewlett-Packard further certifies that its calibration measurements are traceable to the United States National Institute of Standards and Technology (formerly National Bureau of Standards), to the extent allowed by the Institute’s calibration facility, and to the calibration facilities of other International Standards Organization members.
Warranty
HP warrants HP hardware, accessories and supplies against defects in materials and workmanship for a period of one year from date of shipment. If HP receives notice of such defects during the warranty period, HP will, at its option, either repair or replace products which prove to be defective. Replacement products may be either new or like-new.
HP warrants that HP software will not fail to execute its programming instructions, for the period specified above, due to defects in material and workmanship when properly installed and used. If HP receives notice of such defects during the warranty period, HP will replace software media which does not execute its programming instructions due to such defects.
For detailed warranty information, see back matter.
Safety Considerations
General
This product and related documentation must be reviewed for familiarization with this safety markings and instructions before operation.
This product is a safety Class I instrument (provided with a protective earth terminal).
Before Applying Power
Verify that the product is set to match the available line voltage and the correct fuse is installed. Refer to instructions in Chapter 1 of the Manual.
Before Cleaning
Disconnect the product from operating power before cleaning.
Safety Earth Ground
An uninterruptible safety earth ground must be provided from the mains power source to the product input wiring terminals or supplied power cable.
Warning Symbols That May Be Used In This Book
Instruction manual symbol; the product will be marked with this symbol when it is necessary for the user to refer to the instruction manual.
Indicates hazardous voltages.
Safety Considerations (contd)
Indicates earth (ground) terminal.
or
Indicates terminal is connected to chassis when such connection is not apparent.
Indicates Alternatingcurrent.
Indicates Direct current.
WARNINGBODILY INJURY OR DEATH MAY RESULT FROM FAILURE TO HEED A WARNING. DO NOT PROCEED BEYOND A WARNING SIGN UNTIL THE INDICATED CONDITIONS ARE FULLY UNDERSTOOD AND MET.
CAUTIONDamage to equipment, or incorrect measurement data, may result from failure to heed a caution. Do not proceed beyond a CAUTION sign until the indicated conditions are fully understood and met.
For additional safety and acoustic noise information, see back matter.

Contents
In This GuideGuide Organization viiDescription of the High Performance Time Interval Analyzer viiiDocumentation List ixWhere to Find Information x
1 How to BeginIn this Chapter 1-2HP E1725C and HP E1740A Time Interval Analyzers with the HP E1742A/43A/44A/46A/48A Analysis Software 1-4Assembling the TIA 1-5
HP E1725C TIA Assembly 1-5Installing the HP E1742A/43A/44A/46A/48A Analysis Software 1-7
HP E1725C TIA Requirements 1-7Install the HP TIA Software 1-8
To Modify the Directory 1-9Power-Up and Health Check 1-11
Start 1-11Start the HP TIA Software 1-11Verify Communication with the TIA 1-11
Set the Interface Type 1-11Verify Communication 1-12
Where to Now? 1-13
2 Practice Using the TIAIn this Chapter 2-2Conventions Used in the Tutorial 2-4
Selecting Commands with the Mouse 2-4
Getting Started Guide iii

Contents
Hints Provided in Italics 2-4TIA Tutorial 2-5
Presetting the Instrument to a Known State 2-5Recalling a Saved Data File and Setup 2-6Configuring the TIA for a Measurement (Setup Menu) 2-7Initiating a Measurement and Viewing Results (Measure Menu) 2-16Using Cursors, Markers and Zooming 2-19Printing Results 2-25
3 Demo WaveformsIn this Chapter 3-2Demo 1: Voltage-Controlled Oscillator (VCO) Frequency Step Response and Settling 3-3
Start 3-3Overview 3-3Frequency Deviation Results 3-6Cursors and Markers 3-7Zooming 3-7Autoscale and Scaling 3-9
Demo 2: Phase Modulation Analysis (BPSK) 3-12Start 3-12Overview 3-13Phase Deviation Results 3-15DeTilt 3-16FFT Analysis 3-17
Demo 3: Sharing TIA Data With Other Windows Applications 3-20
Sharing Graphics 3-20Open the Windows’ “WordPad” Program 3-21Now Add the Log Information 3-23Sharing Data 3-25
iv Getting Started Guide

In This GuideThis book is the getting started guide for the HP E1725C and HP E1740A Time Interval Analyzers. It consists of a table of contents, this preface, three chapters, and an index.
This preface contains the following information:
Guide Organization
Table of Contents
In This Guide (this preface) introduces you to the getting started guide, and provides general information on the HP E1725C/HP E1740A Time Interval Analyzer (TIA).
Chapter 1, “How to Begin,” provides complete system requirements and information, and step-by-step instructions on how to assemble and start operating your TIA.
Chapter 2, “Practice Using the TIA,” provides a short tutorial that teaches you how to set up the TIA to acquire and analyze measurement data without the need for an actual signal to measure.
Chapter 3, “Demo Waveforms,” provides detailed demonstrations about measuring and analyzing actual signals. Data files are included with your software to be used as examples to illustrate key points.
Index
• Guide Organization pg. vii
• Description of the High Performance Time Interval Analyzer
pg. viii
• Documentation List pg. ix
• Where to Find Information pg. x
Getting Started Guide vii

In This Guide
Description of the High Performance Time Interval Analyzer
The HP E1725C and HP E1740A Time Interval Analyzers provide new insight into critical timing issues for applications in computer, communications, and defense industries. The HP E1725C TIA features a modular architecture that offers both high performance timing measurements and a customized user-interface, which can be configured to specific measurement applications. The HP E1740A Time Interval Analyzer VXI module is the measurement hardware of the system. The HP E1742A/43A/44A/46A/48A series of analysis software is designed to “tune” the TIA to specific needs for greater ease-of-use and higher productivity. The TIA and software provide the following measurement and analysis features:
• Graphical user interface implemented in Windows® 3.1 or Windows® 95
A mouse, or similar pointing device, can be used to set up the TIA, control operation, and analyze results.
• Large sequential data capture
Up to 256 thousand single-channel measurements can be acquired in sequence. This can be useful when studying phenomena which occur over many measurement samples.
• Large histogram capacity
Large amounts of data can be collected into a histogram very quickly. Statistical analysis is enhanced with higher confidence due to large sample sizes.
• Continuous edge sampling up to 80 MHz rate
In the HP E1743A and E1744A, every edge can be timed in a pulse series up to an 80 MHz rate (12.5 ns minimum continuous interval, 3.2 µsec maximum interval). In the HP E1742A, HP E1746A, and HP E1748A (and optionally the HP E1743A and HP E1744A), every
viii Getting Started Guide
In This Guide
edge can be captured up to a 40 MHz rate (25 ns minimum continuous interval, 104 ms maximum interval).
• Easily share data with other applications
Include TIA results in lab reports using Windows word processing software such as Microsoft Word for Windows or Lotus® Amipro®.
• Resolve signal edge timing to within 50 ps LSD
Characterize small amounts of jitter and timing noise on a single-shot basis.
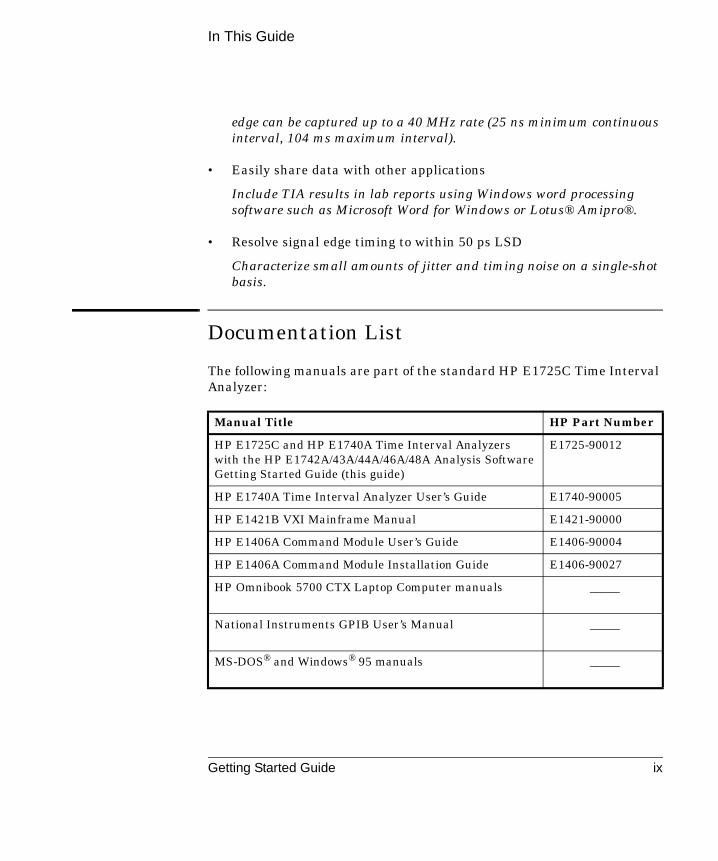
Documentation List
The following manuals are part of the standard HP E1725C Time Interval Analyzer:
Manual Title HP Part Number
HP E1725C and HP E1740A Time Interval Analyzers with the HP E1742A/43A/44A/46A/48A Analysis Software Getting Started Guide (this guide)
E1725-90012
HP E1740A Time Interval Analyzer User’s Guide E1740-90005
HP E1421B VXI Mainframe Manual E1421-90000
HP E1406A Command Module User’s Guide E1406-90004
HP E1406A Command Module Installation Guide E1406-90027
HP Omnibook 5700 CTX Laptop Computer manuals _____
National Instruments GPIB User’s Manual _____
MS-DOS® and Windows® 95 manuals _____
Getting Started Guide ix

In This Guide
Where to Find Information
The order in which you use these resources will depend on your situation. When first starting to use the HP E1725C or HP E1742A/43A/44A/46A/48A, refer to this Getting Started Guide. When setting up the HP E1740A TIA in a VXI system you will find very important information in the HP E1740A User’s Guide.
To find out more about... Refer to the following...
installing the HP E1725C Time Interval Analyzer or HP E1742A/43A/44A/46A/48A Analysis software
HP E1725C and HP E1740A Time Interval Analyzers with the HP E1742/43/44A/46A/48A Analysis Software Getting Started Guide (this guide)
installing the HP E1740A Time Interval Analyzer VXI module
HP E1740A User’s Guide
the specifications for the HP E1725C/HP E1740A TIA
HP E1740A User’s Guide
how to program the HP E1740A Time Interval Analyzer VXI module
HP E1740A User’s Guide
the HP E1421B six-slot mainframe HP E1421B Mainframe Manual
the portable computer for the HP E1725C
HP Omnibook 5700 CTX Laptop Computer manuals
making specific HP E1742A/43A/44A/46A/48A measurements
HP E174XA on-line Help
x Getting Started Guide

1
How to Begin

Chapter 1 How to Begin
In this Chapter
1
In this Chapter
This chapter describes in a step-by-step fashion how to assemble and start operating your Hewlett-Packard TIA (Time Interval Analyzer). The steps also make a good checklist to follow when you suspect a problem with your setup.
Components Needed to Configure a TIA
Components Provided with a Standard HP E1725C Possible Alternatives
VXI mainframe 6-slot mainframe (included) 13-slot mainframe, such as the HP E1401B
Computer HP Omnibook 5700 CTX Laptop Computer
HP Vectra or IBM-compatible PC with HP 82335B or HP 82341B HP-IB card installed
VXI interface/control Included in HP 1406A Slot-0 command module (with HP-IB card in computer)
_____
TIA module HP E1740A (included) None
Measurement control and analysis software
HP E1742A Tributary Jitter Analysis
HP E1743A Clock Jitter Analysis
HP E1744A Token Ring Jitter Analysis
HP E1746A Network Synchronization Measurement Software
HP E1748A Multiple-Channel Network Synchronization Measurement Software
(one included)
Create custom programs to control the HP E1740A TIA module.
1-2 Getting Started Guide

Chapter 1 How to Begin
In this Chapter
1
MS-DOS 6.0 (or later) (included) MS-DOS 5.0 (or later)Windows® 3.1 or Windows® 95
Windows® 95 _____
National Instruments PCMCIA-GPIB Kit
(included) None
Components Needed to Configure a TIA
Components Provided with a Standard HP E1725C Possible Alternatives
Getting Started Guide 1-3

Chapter 1 How to Begin
HP E1725C and HP E1740A Time Interval Analyzers with the
HP E1742A/43A/44A/46A/48A Analysis Software
1
HP E1725C and HP E1740A Time Interval Analyzers with the HP E1742A/43A/44A/46A/48A Analysis Software
The HP E1725C TIA is a stand-alone instrument. Connect the pieces as described below and apply power. Skip the steps that do not apply. The TIA is then ready to start measuring.
The HP E1742A/43A/44A/46A/48A are options to the HP E1725C (option 242, 243, 244, 246 and 248, respectively). These software packages are Microsoft Windows applications, which serve as the user interface and analysis portion of the TIA. At least one of these packages must be included with the HP E1725C.
This guide describes how to assemble the TIA and start using it. If you are assembling the HP E1725C for the first time, reassembling it after some time, or building the TIA using other computers or VXI mainframes, this procedure will help.
The standard HP E1725C TIA instrument consists of the following items:
• HP E1740A Time Interval Analyzer (two-slot, C-size VXI module)
• HP E1406A Slot-0 Command Module (one-slot, C-size VXI module)
• HP E1742A/43A/44A/46A/48A Analysis Software
• HP Omnibook 5700 CTX Laptop Computer
• Six-slot VXI C-size mainframe
• National Instruments PCMCIA-GPIB Kit (includes a PCMCIA card and a GPIB cable)
• DOS and Windows software
• Four oscilloscope probes (three 10:1 and one 1:1)
• Blank panels for covering unused VXI mainframe slots
1-4 Getting Started Guide

Chapter 1 How to Begin
Assembling the TIA
1
Assembling the TIA
HP E1725C TIA Assembly
This section assumes that the HP E1725C is completely disassembled. Just skip the steps that do not apply to your situation. The intention is to meet your needs if in the future you need to rebuild an HP E1725C that has been disassembled. The standard HP E1725C is shipped from the factory assembled and configured.
1 Before you start, make sure power is shut off to all of the components.
2 Install the HP E1406A Command Module in slot 0 of the VXI mainframe. (With the standard HP E1725C 6-slot mainframe, this will be the slot at the bottom or left side, depending on the orientation of the mainframe.)
Line up the module with the slot guides and then press the module firmly into the backplane connectors. Tighten the screws attached to the command module to fully seat the module into the backplane connectors of the mainframe.
3 Install the HP E1740A TIA module in slots 1 and 2 of the VXI mainframe or any other open slots.
NOTE Always check that the mainframe power is OFF before installing any boards or instruments into the backplane connectors. This is also a good time to check that the TIA module address setting is unique and different from other modules already installed in the mainframe. The HP E1740A address (ULA) is set to 48 at the factory, corresponding to a secondary address of 06 when using the HP 82335A/B HP-IB Interface Card. If you are installing multiple TIAs, make sure each one has its own unique address. See the HP E1740A TIA User’s Guide for more information about address switch settings.
4 Line up the module with the slot guides and then press the module firmly into the backplane connectors. Use the screws attached to the module to securely tighten down the module.
Getting Started Guide 1-5

Chapter 1 How to Begin
Assembling the TIA
1
5 Install blank panels over any unused slots of the VXI mainframe to help maintain proper cooling of VXI modules.
6 Apply power to the laptop computer and the VXI mainframe.
1-6 Getting Started Guide

Chapter 1 How to Begin
Installing the HP E1742A/43A/44A/46A/48A Analysis Software
1
Installing the HP E1742A/43A/44A/46A/48A Analysis Software
This section provides instructions for installing the user-interface software onto your computer. This software is already installed on the HP E1725C TIA. If you have purchased the HP E1742A/43A/44A/46A/48A Analysis Software by itself, follow these instructions to install the software.
HP E1725C TIA Requirements
The following are the minimum requirements to support operation of the HP E1725C TIA using the HP E1742A/43A/44A/46A/48A software.
• 20 MHz 386-based PC with a 387 co-processor
• 8 megabytes of RAM
• A hard disk with at least 6 megabytes of free disk space
• DOS version 5.0 (or later) and Microsoft Windows® version 3.1 (or Windows® 95)
• A two-button mouse
It is recommended that you always read any “readme” files associated with the software before proceeding with the installation. These files contain important information which may not be found elsewhere. The HP E174XA readme file can be viewed by one of the following methods:
• Insert the HP E174XA disk 1 in drive a: (or whatever floppy drive is appropriate). Start Windows 95, select Programs group, double-click on Windows Explorer icon, choose drive a:, and double-click on the “readme.wri” file.
• If the HP E174XA software is already installed on the PC, double-click on the “readme” icon in the HP Applications program group.
Getting Started Guide 1-7

Chapter 1 How to Begin
Installing the HP E1742A/43A/44A/46A/48A Analysis Software
1
Install the HP TIA Software
1 Insert the HP E1742A/43A/44A/46A/48A disk 1 into the 3.5-inch floppy drive.
2 Start Windows.
3 Open Windows Explorer and double-click on Setup File to install the software.
NOTE The software cannot be installed while another Visual Basic program is open in Windows. If you see an error message to this effect, close all other Visual Basic programs to proceed with the installation.
Shortly after double-clicking, you will see the installation window shown below. If you see a different window, you may have inserted disk 3 by mistake. (Disk 3 also has a file with the name setup.exe.) Click Cancel and return to step 1.
This window allows you to modify the directory for the software installation, or to cancel the installation completely. To cancel the installation, click Exit Setup or press ALT E.
1-8 Getting Started Guide

Chapter 1 How to Begin
Installing the HP E1742A/43A/44A/46A/48A Analysis Software
1
To Modify the Directory
The default directory is C:\hpe174Xa (where X=2, 3, 4, 6, or 8 depending on the particular software package you have). If you want to install the application software files in a different directory, highlight hpe174Xa and type in the preferred directory name. Highlight the C:\ if you wish to modify the drive location as well. Make a note of the directory you have selected as you will need this information later during the installation. Click the Continue button to continue the installation.
An Interface Options window will appear next. If you are using an HP 82335A HP-IB interface, the appropriate Window’s driver (hpib.dll for the HP 82335A) will be installed for you. If you are certain that the correct interface driver is already available on your system (and in the “path”), you may leave “Other/None” selected. Otherwise, choose the appropriate interface. If the interface you are using is not listed, select “Other/None”. Click Continue to start the actual installation.
Getting Started Guide 1-9

Chapter 1 How to Begin
Installing the HP E1742A/43A/44A/46A/48A Analysis Software
1
After the program files from disks 1 and 2 are copied to your disk, you will be asked to insert disk 3 into the floppy drive. Insert disk 3 into the floppy drive and click Continue. A new setup program will be launched to install the Help system. You will see another “Initializing Setup...” message, and then the opening screen for installing the Help system. Follow the instructions on the screen.
When you are asked to select a directory to install the Help system files (not the shared files to be placed in the Windows System directory), enter the same directory you noted previously.
When the installation is complete, click the OK button. A new program group “HP Applications” will be created. The HP E174XA software, a “read-me” file and the Help icon will be placed in this program group.
Be sure to send in your registration card. This will ensure that you are notified about software updates and other important product information.
1-10 Getting Started Guide

Chapter 1 How to Begin
Power-Up and Health Check
1
Power-Up and Health Check
Start
1 Switch on the VXI mainframe before the computer.
2 Switch on the computer.
Start the HP TIA Software
1 Double-click the HP Applications Program Group icon in Windows to open the group.
2 Double-click the HP E174XA icon to start the application.
Verify Communication with the TIA
The default interface setting for the HP E1742A/43A/44A/46A/48A is “none.”
Set the Interface Type
If this is the first time you have started the software, or if no interface has been previously selected, you will be asked if you wish to select the interface now. Click Yes and continue with step 3. Otherwise, select the interface with the following steps:
1 Select Setup>Instrument Setup... .
2 The HP E1740A setup window will appear. Click on the Interface Setup... button in the lower right hand corner of the window.
3 Select the appropriate interface and addressing. Refer to the on-line Help under the topic of “Interface” and the corresponding documentation that came with the interface. Refer to the HP E1740A User’s Guide for details on address switch settings.
4 Click on OK once the setting is chosen.
Getting Started Guide 1-11

Chapter 1 How to Begin
Power-Up and Health Check
1
Verify Communication
A convenient way to test the interface with the TIA is to check for an error condition in the HP E1740A. This is a fairly comprehensive test as it requires that the interface is configured correctly and that the hardware is operational.
1 Select Setup>Instrument Setup... .
2 Beneath “Calibration & Errors:” (bottom, center of the HP E1740A Setup window), click on the Service button.
3 Click on the Get Error button in the bottom right corner of the “Calibration and Service” window.
4 If the interface is configured correctly, and there are no hardware error conditions, a small dialog box will appear with the message:
System error code:+0, “No error”
5 Click on the OK button to exit this window. Close the Calibration and Service window, and Cancel the HP E1740A Setup window to return to the application.
If you do not see the above error-free condition, check that the correct interface has been configured in the HP E1740A Setup window and that the HP E1740A has a unique address (ULA). For HP E1740A hardware error conditions, refer to the HP E1740A User’s Guide.
6 You can configure the HP E174XA to always use the interface you just selected as follows:
Select File>Save Setup As... .
Select the file inisetup.stp in the c:\hpe174Xa directory. This is the setup file the software uses as its configuration when loaded.
1-12 Getting Started Guide

Chapter 1 How to Begin
Where to Now?
1
Where to Now?
If this is your first time using the TIA, you may want to follow the short tutorial in Chapter 2. It demonstrates how to set up the TIA to acquire and analyze measurement data without the need for an actual signal to measure.
Chapter 3 goes into more detail about measuring and analyzing actual signals. Data files are included with your software to be used as examples to illustrate key points. These data files are “generic” and may not illustrate the specific application for which you purchased the software. The on-line Help file is intended to do this.
Getting Started Guide 1-13

Chapter 1 How to Begin
Where to Now?
1
1-14 Getting Started Guide

2
Practice Using the TIA

Chapter 2 Practice Using the TIA
In this Chapter
2
In this Chapter
This chapter provides the opportunity for you to learn about some of the TIA’s features and operation without the need for connecting actual signals to the instrument. Data files which were measured with the TIA are included with the analysis software. A frequency deviation measurement for a frequency modulated (FM) carrier is recalled in these examples to illustrate specific features and capabilities. This chapter covers the general steps to configure the TIA to capture this data as well as steps to follow to analyze the collected data.
The following items are demonstrated in this chapter:
• Presetting the instrument to a known default state
• Recalling a data file and setup (File Menu)
• How to configure the TIA for a measurement (Setup Menu)
• How to initiate a measurement and view the results (Measure and View Menus)
• Using the cursors and zooming
• Printing results
This Getting Started Guide covers features and functions available in the following software applications:
• HP E1742A SONET/SDH Tributary Jitter Analyzer
• HP E1743A Clock Jitter Analyzer
• HP E1744A Token Ring Jitter Analyzer
• HP E1746A Network Synchronization Measurement Software
• HP E1748A Multiple-Channel Network Synchronization Measurement Software
2-2 Getting Started Guide
Chapter 2 Practice Using the TIA
In this Chapter
2
Each of the above products has functionality specific to a given application, which may not be explicitly covered in this tutorial. Refer to the on-line help in each software package for application-specific information. All features and functions covered in this guide are included in each of these products.
Getting Started Guide 2-3

Chapter 2 Practice Using the TIA
Conventions Used in the Tutorial
2
Conventions Used in the Tutorial
Selecting Commands with the Mouse
You select commands by pointing with the mouse cursor and then clicking on each of the commands by pressing the left mouse button. For example, when you see, Setup>Instrument Setup..., click on the Setup menu and then the Instrument Setup... selection in the pulldown menu.
Hints Provided in Italics
Helpful information is presented throughout this tutorial. The information will help you with the current task or sometimes it is just to let you know that you are progressing properly.
2-4 Getting Started Guide
Chapter 2 Practice Using the TIA
TIA Tutorial
2
TIA Tutorial
You should already have the HP E1742A/43A/44/46A/48A application running. If not, refer to Chapter 1 of this guide for information on how to install the software and start the TIA application.
NOTE The windows and dialog boxes shown in this guide are those of the HP E1742A. The screens on the HP E1743A/44A/46A/48A may have a slightly different appearance.
Presetting the Instrument to a Known State
1 Once the TIA application is started, select File>Load Default Setup.
The default setup will configure the TIA to a known state as determined by a set of parameters fixed at the factory, similar to the “preset” key on many instruments.
You may also customize the initial user-interface configuration by first configuring the instrument as desired and saving the setup in the file “INISETUP.STP” (File>Save Setup (inisetup.stp)). This configuration will automatically be loaded when the Windows application is started. In general, instrument setups are saved by selecting File>Save Setup As.
Note that the INISETUP.STP file and the default parameters are two different files, and may not necessarily result in the same instrument configuration.
Getting Started Guide 2-5

Chapter 2 Practice Using the TIA
TIA Tutorial
2
2 A window will appear with an explanation similar to the one shown here when you retrieve the default setup.
Click on the Yes button to proceed.
Recalling a Saved Data File and Setup
1 Select File>Load Data File... .
Select the file “fm.pan” in the c:\hpe174Xa\demo directory.
You will be using data that was acquired with the TIA and saved as a data file (*.pan). This is a convenient way to experiment with the measurement and analysis features without the need for live input signals.
2 Select File>Load Setup... .
Select the setup file “fm.stp” in the c:\hpe174Xa\demo directory.
This is the instrument configuration used to acquire the data in “fm.pan.”
2-6 Getting Started Guide
Chapter 2 Practice Using the TIA
TIA Tutorial
2
Configuring the TIA for a Measurement (Setup Menu)
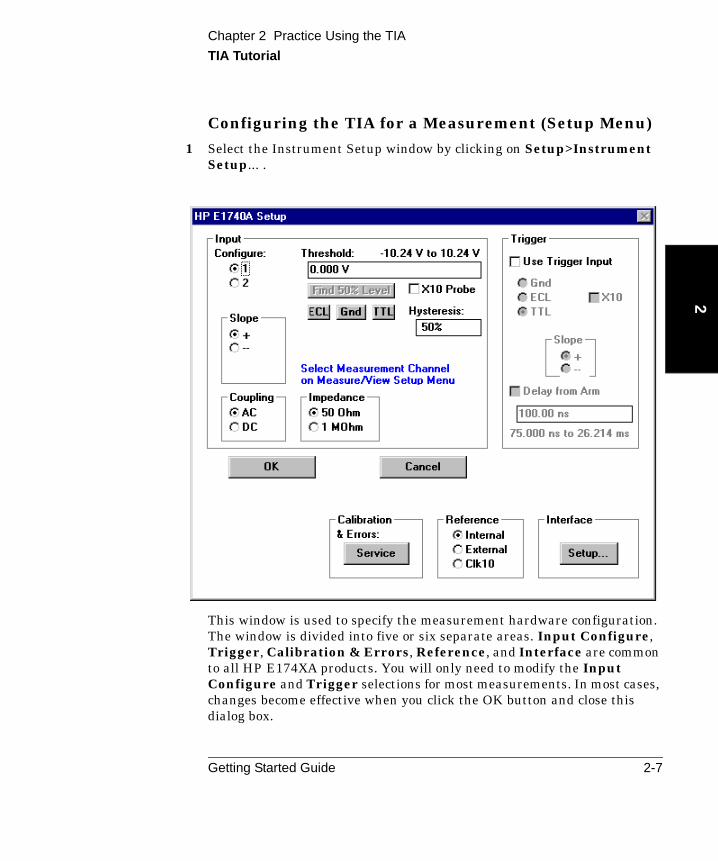
1 Select the Instrument Setup window by clicking on Setup>Instrument Setup... .
This window is used to specify the measurement hardware configuration. The window is divided into five or six separate areas. Input Configure, Trigger, Calibration & Errors, Reference, and Interface are common to all HP E174XA products. You will only need to modify the Input Configure and Trigger selections for most measurements. In most cases, changes become effective when you click the OK button and close this dialog box.
Getting Started Guide 2-7

Chapter 2 Practice Using the TIA
TIA Tutorial
2
Input Configure:
Channels 1 and 2 are configured separately by clicking on the appropriate channel. You can determine the input threshold in volts, the threshold slope, the input coupling, and the input impedance. In the HP E1743A/44A/46A/48A, input channel routing is also selected in this area. All of these selections are modified in the HP E1740A immediately.
This menu configures the measurement hardware parameters. To select the channel used to acquire measurements, select Setup>Measure/View Setup.
Trigger:
You can select whether the TIA will wait for a threshold crossing on the trigger input before acquiring time stamp information. The threshold choices are GND (0 volts), ECL (−1.3 volts) and TTL (1.4 volts). Selecting 10:1 divides these threshold values by 10 if you are using a 10:1 oscilloscope probe on the trigger input.
You may also select a time delay from the trigger edge prior to the acquisition of data. The selectable range of delay is 75 ns to 26.214 ms.
Calibration & Errors:
Clicking on the “Service” button lets you perform a variety of calibration tests on the HP E1740A. Further information on the calibration procedures can be found in the HP E1740A User’s Guide.
The Calibration and Service window also provides a “Get Error” button. If for any reason the HP E1740A front panel “Error” LED (red) is illuminated, you can query the HP E1740A for the type of error. This also clears the error condition on the instrument. The error type will be displayed.
Click the Close button to return to the HP E1740A Setup menu.
2-8 Getting Started Guide

Chapter 2 Practice Using the TIA
TIA Tutorial
2
Reference:
You can choose between three sources for the 10 MHz reference clock for the HP E1740A:
• Internal: clock reference provided by the HP E1740A internal circuitry.
• External: clock reference provided by the user via the input connector on the front panel of the HP E1740A.
• CLK10: clock reference provided by the VXI Slot 0 Controller via the VXI backplane.
Interface
HP E1742A/43A/43A/46A/48A supports various interfaces. Clicking on the Setup... button allows you to select and configure the interface.
The interface configuration is not affected by recalling the Default Setup Parameters.
One additional area on the Instrument Setup dialog box appears if you are using the HP E1743A/44A:
Sample Rate
The Sample Rate parameter controls the maximum rate at which the signal can be sampled. It does not control the rate at which the signal is actually sampled. See the HP E1743A/44A on-line Help for more information about Sample Rate.
2 Click on Cancel to close the HP E1740A Interface window.
Getting Started Guide 2-9

Chapter 2 Practice Using the TIA
TIA Tutorial
2
3 Select the measurement setup window by clicking on Setup>Measure/View Setup... .
This window is used to specify the measurement processing parameters which are inherent in measurement calculations, such as the number of measurements, the duration of the measurement, the number of averages, filtering, clock/carrier determination, etc. You will also select the TIA input channel (1 or 2) which will be used to collect the data for measurement computations. The actual data acquisition and processing will be selected and initiated from the Measure menu. (The HP E1743A/44A/46A/48A dialog boxes will look slightly different than the HP E1742A shown above.)
2-10 Getting Started Guide

Chapter 2 Practice Using the TIA
TIA Tutorial
2
Parameters for:
This portion of the window lets you modify parameters that are inherent in the measurement processing, such as the measurement time, the number of measurement points during that time, window types for FFT computations, etc.
Next to “Phase & Frequency Deviation,” (or “Period, Frequency, TI, & Phase” in the HP E1743A/44A) you will see that you can modify the number of frequency measurements or points to be displayed, and the time duration of the measurement. In general, the “gate time” for each frequency measurement is the measurement time divided by the number of samples. Note however, that the measurement gate is synchronized to the input signal and the actual measurement time may differ from the value entered here.
You can modify each of these parameters by either double-clicking on the desired item, or clicking on the desired item and clicking the Modify>> button. Other measurement types are available with their own sets of parameters to configure.
Filter
You may select a filter type (low pass, high pass, band pass, or smoothing function) to be applied to the measurement results. If either the low pass, band pass, or high pass filters are selected, you can also enter the cut-off frequencies.
Clock/Carrier Frequency
Deviation measurements (phase deviation, frequency deviation, time deviation, etc.) require a reference carrier or clock to compute the relative measurement. This portion of this window lets you enter the frequency of the reference clock directly, or have the HP E1742A/43A/44A/46A/48A estimate the reference frequency for you based upon the acquired data. Various carrier estimation algorithms are also available, depending on the type of signal and modulation you want to measure.
Getting Started Guide 2-11

Chapter 2 Practice Using the TIA
TIA Tutorial
2
Pacing
In general, the TIA does not have to time stamp every zero crossing of the input signal to reconstruct the modulation or jitter on the signal. Selection of Auto pacing allows the HP E174XA software to determine the number of skipped zero crossings in order to capture the specified number of samples in a given measurement time (as specified in the Parameters for: field). You can directly specify the pacing by “unchecking” the auto box, and entering the pacing value directly.
Input
Allows selection of the measurement channel to be used for data acquisition and processing. The threshold parameters for each channel are configured in the Setup>Instrument Setup... menu.
4 Click the Cancel button to close this window without making any changes.
2-12 Getting Started Guide

Chapter 2 Practice Using the TIA
TIA Tutorial
2
5 Select the Display Setup window by clicking on Setup>Display Setup... .
The Display Setup menu lets you annotate the display with a title, date, or other descriptive information which may be useful if you store the data to a file or print a hard copy. You can also set the scaling for both the x and y axis of the measurement display or select the Autoscale function. Display masks can also be turned on in the Display Setup dialog box. Search the HP E1742A/46A/48A on-line Help for Show Masks to obtain more information.
To annotate or title the display, simply click in the box beneath Title and enter the descriptive text. For saved data files, the date the file is stored is automatically appended to the title information.
Getting Started Guide 2-13

Chapter 2 Practice Using the TIA
TIA Tutorial
2
To modify the X or Y scaling, highlight the number of interest and enter the new value. If you don’t know these values, click Get Autoscale Values and the software will determine them for you.
If you click on the Show Points box, each measurement point will be displayed with a “+” on the waveform presentation, and these points are connected with a line.
Autoscale
Click on the Autoscale Always box to autoscale both the X and Y axis to the acquired data with each new data acquisition.
The Get Autoscale Values button provides a convenient way to recall the X and Y axis scale values. This is useful if you modify these values, and then want to return to the autoscale configuration.
6 Click the Cancel button to exit the window without making changes.
2-14 Getting Started Guide

Chapter 2 Practice Using the TIA
TIA Tutorial
2
7 Select the format for measurement units by selecting Setup>Phase Units.
You can select units for the phase measurement results from this window. All phase displays will show the selected units on the Y axis. You can obtain other phase units by clicking on a point. The other units for that point will be shown in the Log display at the bottom of the screen.
Getting Started Guide 2-15

Chapter 2 Practice Using the TIA
TIA Tutorial
2
Initiating a Measurement and Viewing Results (Measure Menu)
1 Click on Measure to view the available measurement selections. Since this demonstration is using a saved data file, do not select any of the measurement choices at this time.
If you wanted to make a “live” measurement with hardware, you would select a choice on the Measure menu at this time. For example, to measure the dynamic frequency characteristics (FM) of this signal you would select Frequency Deviation from the list you see. Subsequent measurement acquisitions can be initiated by clicking on the ReMeasure button.
2-16 Getting Started Guide

Chapter 2 Practice Using the TIA
TIA Tutorial
2
MEASURE MENU VS VIEW MENU. The choices on these two menus are very similar, however the action performed by the instrument is quite different. Selecting any of the choices on the Measure menu will cause the instrument to initiate a measurement and acquire a new set of data points and perform the selected result processing. Selecting any of the choices on the View menu will cause the instrument to perform the selected calculations on the currently acquired data.
The notable difference between the selections on the Measure and View menus is that the View menu also offers the choice to compute an FFT of the data currently on the display.
Note that data files that are saved and subsequently recalled can be “re-processed” to compute other results using the View menu.
The display is now showing Frequency vs. time. This signal is a 100 MHz carrier with sinusoidal frequency modulation (approximately a 11 kHz rate and a 500 kHz p-p deviation). You can re-process the data to display phase power spectral density by performing the following step.
Getting Started Guide 2-17

Chapter 2 Practice Using the TIA
TIA Tutorial
2
2 Select View>Phase Power Spectral Density.
This display was computed from the “fm.pan” data. This is the power spectral density plot of the modulating tone. The 11 kHz modulation is easily seen on this display, as well as other modulation products.
2-18 Getting Started Guide

Chapter 2 Practice Using the TIA
TIA Tutorial
2
Using Cursors, Markers and Zooming
1 Select View>Frequency Deviation.
The results display is divided into two primary areas. The major portion of the display is devoted to the graph of measurement results, in this case frequency deviation vs. time. The very top of this area includes a description of the measurement function and the key processing parameters that apply to the processing and the date the measurement was taken. As shown in this example:
Getting Started Guide 2-19

Chapter 2 Practice Using the TIA
TIA Tutorial
2
“Frequency deviation from Fo as function of time. Fs=9.901 kHz; Fo=100 MHz; 03/07/1994”
Where:
Fs = sampling frequency or the nominal measurement gate time for each data point.
Fo = clock or carrier frequency used in the deviation calculations.
The date is the date the measurement was taken.
Immediately beneath this information is the graph title as entered on the Setup>Display Setup menu, “Frequency Modulation”.
The HP E1742A/43A/44A/46A/48A software prompts you for a graph title the first time a measurement has been made. This title is retained for subsequent measurements and can be modified by selecting Edit>Display Setup.
The bottom portion of the display is a running log of the instrument status and cursor readouts. This includes information about the data files that have been loaded, the current pacing value in the measurement, the total number of measurement points, etc. In addition, cursor information is also displayed in this box. A scroll bar on the right hand side allows you to view a running list of these results.
The cursor is a “crosshair” (+) which is controlled by the mouse when it is positioned in the results area of the display. You can retrieve the current mouse position by clicking the left mouse button.
2-20 Getting Started Guide

Chapter 2 Practice Using the TIA
TIA Tutorial
2
2 Position the cursor on a peak of the sinusoid and click the left button on the mouse.
The last line of the display shows the x value of the cursor (time), the difference between the measured frequency and the carrier frequency Fo (Freq Deviation), and the absolute frequency value (Freq).
You can also display a marker (marker 1) on a clicked point by holding the SHIFT key while you click the left mouse button. The same information as above is displayed as MRK1>.
Getting Started Guide 2-21

Chapter 2 Practice Using the TIA
TIA Tutorial
2
3 Position the cursor at the next peak of the sinusoid and click the left button.
The result log now shows the coordinate values for the new position of the cursor.
Clicking the right mouse button will provide both the current cursor position information and the difference between the current position and the last position where the mouse was clicked. Using the right mouse button you can move the cursor to successive positions and always display the difference (Dtime, Dfreq, etc.) from the last cursor position.
2-22 Getting Started Guide
Chapter 2 Practice Using the TIA
TIA Tutorial
2
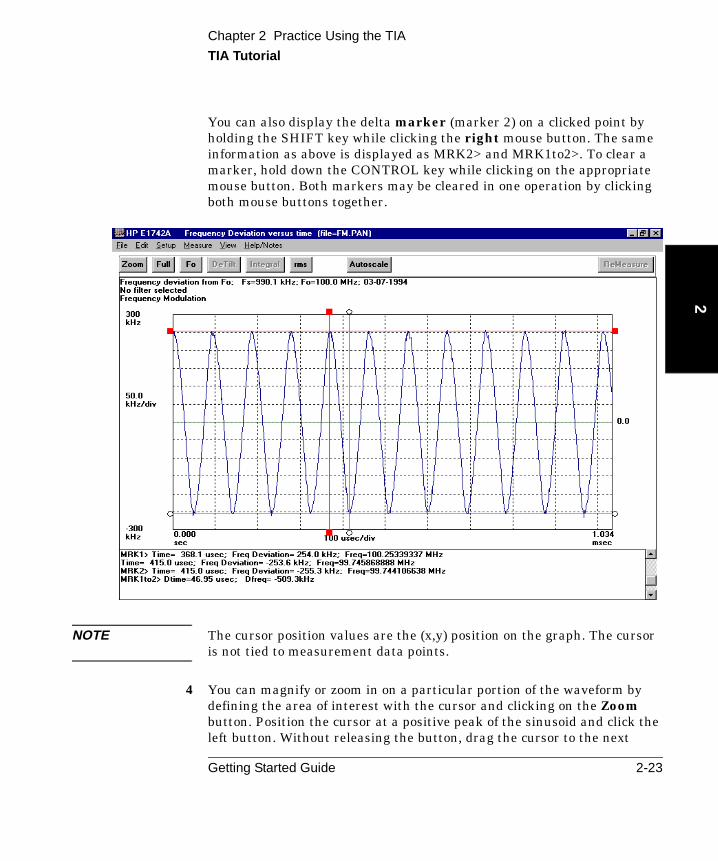
You can also display the delta marker (marker 2) on a clicked point by holding the SHIFT key while clicking the right mouse button. The same information as above is displayed as MRK2> and MRK1to2>. To clear a marker, hold down the CONTROL key while clicking on the appropriate mouse button. Both markers may be cleared in one operation by clicking both mouse buttons together.
NOTE The cursor position values are the (x,y) position on the graph. The cursor is not tied to measurement data points.
4 You can magnify or zoom in on a particular portion of the waveform by defining the area of interest with the cursor and clicking on the Zoom button. Position the cursor at a positive peak of the sinusoid and click the left button. Without releasing the button, drag the cursor to the next
Getting Started Guide 2-23

Chapter 2 Practice Using the TIA
TIA Tutorial
2
negative peak and release it. The green box defines the zoomed display when the Zoom button is clicked.
5 Click the Zoom button.
NOTE You can define the zoom area anywhere in the data display area where the cursor appears as a “+.” Valid points are not confined to the grid portion of the data display.
You can achieve greater and greater magnification by repeating the zoom process on successive displays. To rescale the graph to full view, click on the Full or Autoscale buttons.
2-24 Getting Started Guide

Chapter 2 Practice Using the TIA
TIA Tutorial
2
Printing Results
Select File>Print Graph.
This will print the measurement graph area on the currently active Windows printer. You can configure or modify the Windows printer in the Windows Control Panel application. If a printer is not currently active, the buttons will disappear and you will need to exit and restart the HP E174XA software to get them back.
Selecting File>Print Graph with Log will print both the measurement graph area and the current results displayed in the log area.
To print the entire log, select File>Print Log.
Getting Started Guide 2-25

Chapter 2 Practice Using the TIA
TIA Tutorial
2
2-26 Getting Started Guide

3
Demo Waveforms

Chapter 3 Demo Waveforms
In this Chapter
3
In this Chapter
This chapter provides detailed demonstrations using data that was acquired with the HP E1740A TIA and processed using the applications software. The acquired data was saved in files in the “demo” directory. The examples shown can be duplicated with the HP E1742A, HP E1743A, HP E1744A, HP E1746A, or HP E1748A. These data files are “generic” and may not illustrate the specific application for which you purchased the software. The on-line Help file is intended to provide more application specific information.
You will be recalling this measurement data from stored files that are installed during the application software installation process described in Chapter 1. These demonstrations can be performed with or without having the HP E1740A Time Interval Analyzer hardware present.
3-2 Getting Started Guide

Chapter 3 Demo Waveforms
Demo 1: Voltage-Controlled Oscillator (VCO) Frequency Step Response
and Settling
3
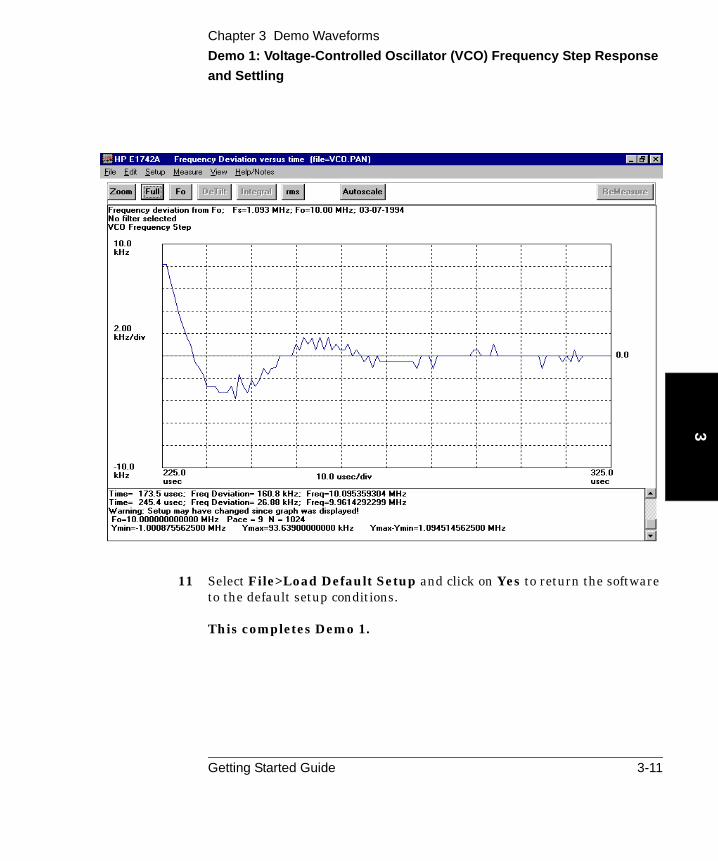
Demo 1: Voltage-Controlled Oscillator (VCO) Frequency Step Response and Settling
This demonstration shows a VCO whose output is stepped from 9 MHz to 10 MHz. The raw data, or “time stamps” were previously recorded and subsequently saved to a file, along with the measurement setup which processes the time stamps into frequency deviation measurements. The following will be demonstrated:
• Recalling data files from disk
• Using the cursors and markers
• Zooming and scaling
• Frequency deviation measurements
• Settling time measurement
• Frequency overshoot measurement
Start
1 Select File>Load Setup... .
2 Open the demo sub directory (c:\hpe174Xa\demo) and click on the file “vco.stp.”
3 Click the OK button.
Overview
The VCO under test has a voltage step applied to the input control voltage causing the frequency output to step from 9 MHz to 10 MHz. A trigger signal occurs approximately 116 µsec prior to the voltage step. This trigger signal is connected to the “Trigger” input of the HP E1740A. The VCO output signal is connected to input 1 of the HP E1740A, and is 1 volt pk-pk, centered at 0 volts (no DC offset).
Getting Started Guide 3-3

Chapter 3 Demo Waveforms
Demo 1: Voltage-Controlled Oscillator (VCO) Frequency Step Response
and Settling
3
1 Select Setup>Instrument Setup... to view the HP E1740A setup menu.
2 This is the Instrument Setup menu for the HP E1740A, configured to measure the VCO signal. The input circuitry for inputs 1 and 2 and the trigger input, as well as the delay from trigger are specified on this menu.
Click Cancel to close this menu without making changes, and proceed to the next step.
3 Select Setup>Measure/View Setup... .
3-4 Getting Started Guide
Chapter 3 Demo Waveforms
Demo 1: Voltage-Controlled Oscillator (VCO) Frequency Step Response
and Settling
3
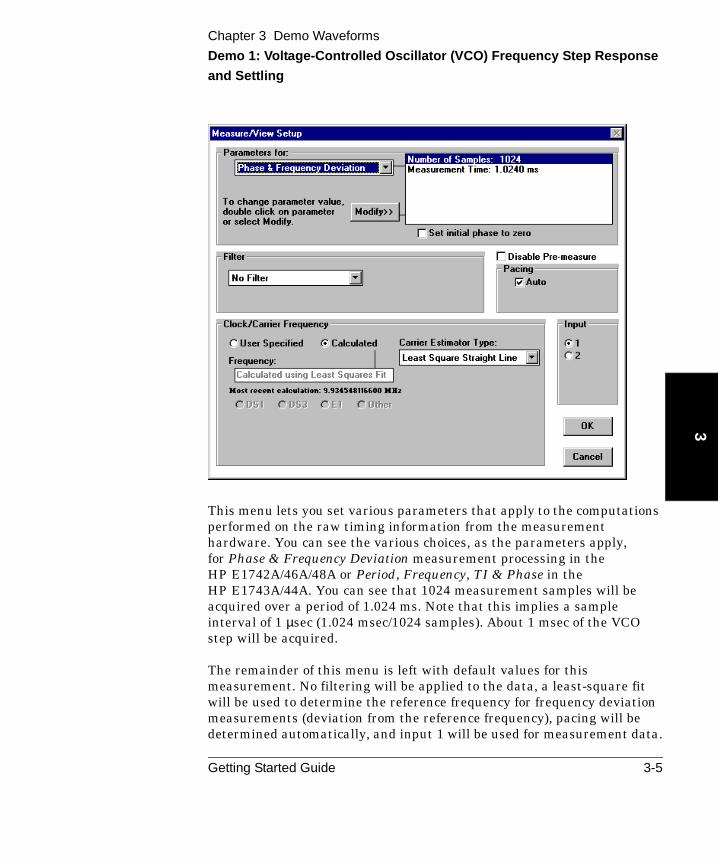
This menu lets you set various parameters that apply to the computations performed on the raw timing information from the measurement hardware. You can see the various choices, as the parameters apply, for Phase & Frequency Deviation measurement processing in the HP E1742A/46A/48A or Period, Frequency, TI & Phase in the HP E1743A/44A. You can see that 1024 measurement samples will be acquired over a period of 1.024 ms. Note that this implies a sample interval of 1 µsec (1.024 msec/1024 samples). About 1 msec of the VCO step will be acquired.
The remainder of this menu is left with default values for this measurement. No filtering will be applied to the data, a least-square fit will be used to determine the reference frequency for frequency deviation measurements (deviation from the reference frequency), pacing will be determined automatically, and input 1 will be used for measurement data.
Getting Started Guide 3-5

Chapter 3 Demo Waveforms
Demo 1: Voltage-Controlled Oscillator (VCO) Frequency Step Response
and Settling
3
4 Click on the Cancel button to close the Measure/View Setup menu.
5 Select File>Load Data File... . Open the demo subdirectory (c:\hpe174Xa\demo) and click on the file “vco.pan.”, and click on OK.
This will retrieve the data and display the computed Frequency Deviation vs. time.
Frequency Deviation Results
This is a display of frequency deviation from a constant reference frequency, Fo. The reference shows up in the display as a green line at a value of zero. The Fo computed by the software is displayed in the log at the bottom of the display. This value can be recalled at any time, along with the pacing value and the total number of samples by clicking the Fo button on the tool bar.
3-6 Getting Started Guide

Chapter 3 Demo Waveforms
Demo 1: Voltage-Controlled Oscillator (VCO) Frequency Step Response
and Settling
3
The step response, frequency overshoot, and settling characteristics can be seen clearly on this display.
Cursors and Markers
The software lets you easily find the (x,y) coordinates of any point on the display (it doesn’t have to be a measurement point.) Position the “crosshair” (+) using the mouse at a point of interest, for example the peak of the VCO step waveform, hold the SHIFT key and click the left mouse button. The bottom entry in the log area (bottom of the display) will show MRK1>, the x value (time in this case), the y value (frequency deviation from Fo), and the absolute frequency value.
Now move the cursor to a point at the bottom of the “ringing” of the waveform, hold the SHIFT key and click the right mouse button. The data log now shows MRK2> and MRK1to2> with the difference in both x (Dtime) and y (Dfreq) from the previous cursor position (D= delta). The peak-to-peak ringing is about 130 kHz. You can continue positioning the cursor at various points and, while holding the SHIFT key, clicking the right mouse button; each new log entry will be the x,y difference from the previous cursor position. To clear a marker, hold down the CONTROL key while clicking on the appropriate mouse button. Both markers may be cleared in one operation by clicking both mouse buttons together.
Zooming
Any portion of the data display may be arbitrarily magnified using the zoom feature. You simply define two diagonal corners of a rectangle which will be the new, magnified display.
1 To magnify the peak overshoot and settling of the VCO response, position the cursor just to the left of the overshoot of the waveform. Click and drag the mouse to define the area you wish to magnify as follows. Click the left mouse button (you’ve just defined the upper left hand corner position of the magnified display) and drag the mouse to a point just to the right of the ringing portion of the waveform, and slightly beneath the 10 MHz frequency level. Release the mouse button. You have defined the lower right hand corner position of the magnified display. The green box outlines the region that will be magnified when you click the “zoom” button.
Getting Started Guide 3-7

Chapter 3 Demo Waveforms
Demo 1: Voltage-Controlled Oscillator (VCO) Frequency Step Response
and Settling
3
2 Click the Zoom button on the tool bar. The display will “zoom” to the area inside the green zoom box.
NOTE Valid cursor positions include any portion of the display where the cursor appears as a crosshair (+). The data area is not confined to the grid portion of the display. You can actually increase the current display range by clicking in positions off of the grid.
3 To return the scaling to the previous full view, click on the FULL button on the toolbar.
3-8 Getting Started Guide

Chapter 3 Demo Waveforms
Demo 1: Voltage-Controlled Oscillator (VCO) Frequency Step Response
and Settling
3
Autoscale and Scaling
The application will normally autoscale to the current data set, placing the minimum value near the bottom of the display, and the maximum value near the top of the display. This is particularly useful when you don’t know the exact values of the acquired data.
However, at other times, you may be interested in manually fixing the scale so you only view a particular portion of the waveform. For example, you may only be interested in the waveform settling characteristics. Suppose that you are only interested in verifying that the VCO output frequency is within ±10 kHz of 10 MHz, 225 µsec after the trigger signal occurs.
1 To change the reference frequency value, Fo to 10 MHz, select Setup>Measure/View Setup... .
2 In the Clock/Carrier Frequency area of the measurement setup menu, select “User Specified.” Enter 10 M (10 MHz) and press ENTER.
3 Click the OK button to close the window.
4 Select View>Frequency Deviation.
The display will be updated with calculations based on Fo = 10 MHz.
5 To fix the display scale in that region, select Setup>Display Setup... .
6 Click on the box Autoscale Always to disable this feature.
7 Enter 10 k into the Max Freq. Deviation field and press ENTER.
8 Enter −10 k into the Min Freq. Deviation field and press ENTER.
Getting Started Guide 3-9

Chapter 3 Demo Waveforms
Demo 1: Voltage-Controlled Oscillator (VCO) Frequency Step Response
and Settling
3
9 Enter 225 and 325 into the Min Time and Max Time fields respectively. Press ENTER after each entry. The Display Setup dialog box will appear as follows:
10 Click OK to close this window.
The display scale is now fixed at these values. This VCO meets the ± 10 kHz after 225 µsec specification.
3-10 Getting Started Guide
Chapter 3 Demo Waveforms
Demo 1: Voltage-Controlled Oscillator (VCO) Frequency Step Response
and Settling
3
11 Select File>Load Default Setup and click on Yes to return the software to the default setup conditions.
This completes Demo 1.
Getting Started Guide 3-11

Chapter 3 Demo Waveforms
Demo 2: Phase Modulation Analysis (BPSK)
3
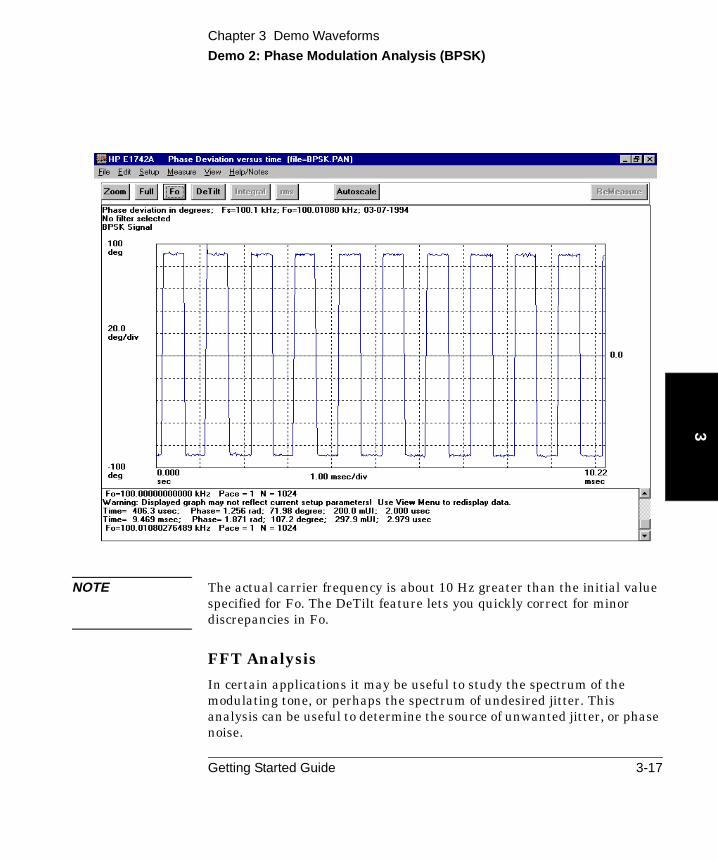
Demo 2: Phase Modulation Analysis (BPSK)
This demonstration shows the phase modulation analysis capabilities of the TIA, using a BPSK signal (binary phase shift keying). This is a common form of intentional phase modulation for digital communication systems, where a carrier is shifted between two phase states (± 180 degrees). A “1” may be represented by one of the phase states, while a “0” is represented by the other.
The HP E1740A is used to gather timing information from the modulated carrier. This information has been processed as deviation in phase from a carrier and stored in a file. The following features will be demonstrated on this waveform:
• Phase Deviation measurements
• De-Tilt feature
• FFT analysis
Start
1 Select File>Load Setup... .
2 Open the demo subdirectory (c:\hpe174Xa\demo) and click on the file “bpsk.stp.”
3 Click the OK button.
3-12 Getting Started Guide

Chapter 3 Demo Waveforms
Demo 2: Phase Modulation Analysis (BPSK)
3
Overview
The signal is a 100 kHz carrier, phase modulated by a 1 kHz square wave. The input signal has an amplitude of 500 mV p-p, and is centered about 0 volts. The signal is connected to input 1 of the HP E1740A.
1 Select Setup>Instrument Setup... to view the HP E1740A setup menu.
This is the HP E1740A Setup menu to configure the instrument to measure the BPSK signal.
2 Click the Cancel button to exit this menu without making changes.
3 Select Setup>Measure/View Setup... .
Getting Started Guide 3-13

Chapter 3 Demo Waveforms
Demo 2: Phase Modulation Analysis (BPSK)
3
Notice that the measurement time for the Phase & Frequency Deviation function in the HP E1742A/46A/48A (Period, Frequency, TI & Phase function in the HP E1743A/44A) is 10.24 msec. This has been done so the display will show a number of cycles of the 1 kHz modulation. The use of automatic pacing will let the TIA determine the appropriate number of cycles of the 100 kHz carrier to skip, so 10 msec of the signal can be captured and analyzed. A measurement time of 10.24 msec while collecting 1024 samples implies that a sample will be captured every 10 µsec.
Since phase deviation is a relative measurement, you have the choice of making the first phase measurement zero, or making the average phase deviation zero. The Set initial phase to zero box is not checked for this measurement, so the average phase deviation will be zero.
3-14 Getting Started Guide

Chapter 3 Demo Waveforms
Demo 2: Phase Modulation Analysis (BPSK)
3
The Carrier Frequency has been entered as a User Specified value of 100.0 kHz. The phase deviation measurements will be computed relative to a constant frequency value of 100 kHz.
4 Click on the Cancel button to close the Measure/View Setup menu.
5 Select File>Load Data File... . Open the demo subdirectory (c:\hpe174Xa\demo) and click on the file “bpsk.pan.” This will retrieve the stored data, and display it as Phase Deviation vs. time.
Phase Deviation Results
Getting Started Guide 3-15

Chapter 3 Demo Waveforms
Demo 2: Phase Modulation Analysis (BPSK)
3
This is a display of phase deviation from the constant reference frequency, Fo = 100 kHz. The square wave modulation can easily be seen. Using the cursor (left mouse button) and delta cursor (right mouse button) features, you can easily determine the period of the modulation (1/mod rate), and the peak-to-peak values.
DeTilt
Notice that the modulating signal has a “tilt” over time. This is because the actual carrier is not exactly 100.0 kHz as we specified as the carrier frequency on the Measure/View Setup menu. The DeTilt feature provides a convenient way to fine tune this value of Fo to get a “flat” display, and determine the precise value of the actual carrier frequency.
1 Position the cursor on one of the “high” phase states near the left side of the plot (point A on the plot shown). Click on the left mouse button.
2 Re-position the cursor on another “high” phase state near the right side of the plot (point B on the plot shown). Click on the left mouse button.
You have now defined two points which should be at the same vertical level, but currently are not due to the “tilt” in the waveform.
3 Click on the DeTilt button. A warning message will appear indicating that the value of Fo will be modified in the DeTilt process. Click OK to acknowledge the warning. After a moment of recalculation, the graph will be re-drawn with a slightly modified value of Fo. The tilt should be removed. Note the new value of Fo (100.01 kHz instead of 100.0 kHz) on the line just below the buttons. You can also verify Fo by clicking on the Fo button and viewing the results log at the bottom of the display.
3-16 Getting Started Guide
Chapter 3 Demo Waveforms
Demo 2: Phase Modulation Analysis (BPSK)
3
NOTE The actual carrier frequency is about 10 Hz greater than the initial value specified for Fo. The DeTilt feature lets you quickly correct for minor discrepancies in Fo.
FFT Analysis
In certain applications it may be useful to study the spectrum of the modulating tone, or perhaps the spectrum of undesired jitter. This analysis can be useful to determine the source of unwanted jitter, or phase noise.
Getting Started Guide 3-17

Chapter 3 Demo Waveforms
Demo 2: Phase Modulation Analysis (BPSK)
3
The analysis software offers two methods to view jitter spectrum or phase noise. FFT computations can be made on the currently displayed data (vs. time views). Phase power spectral density calculations can also be performed. This differs from the FFT calculations in that you may also specify a windowing type and sample frequency for the calculations. (See the Setup>Measure/View Setup menu.) The theoretical noise floor of the instrument is displayed in addition to the measurement data.
1 Select View>FFT of current display.
3-18 Getting Started Guide

Chapter 3 Demo Waveforms
Demo 2: Phase Modulation Analysis (BPSK)
3
Using the cursor and clicking on each peak in the spectrum, the characteristic odd harmonics of the square wave phase modulation can be seen. Note that this is not the same view as a spectrum analyzer would display (spectrum of the modulated carrier), but a direct view of the spectral content of the modulation.
2 Select View>Phase Power Spectral Density.
This plot is very similar to the FFT. Since it is normalized, the units are in dBc/Hz. Note that the top line of the display shows the noise bandwidth.
This completes Demo 2.
Getting Started Guide 3-19
Chapter 3 Demo Waveforms
Demo 3: Sharing TIA Data With Other Windows Applications
3
Demo 3: Sharing TIA Data With Other Windows Applications
A powerful feature of Microsoft Windows is the ability to share data and graphics between various applications using “cut and paste” on files. The HP E174XA takes advantage of these features allowing you to easily share TIA data and graphics with other applications such as spreadsheets (Lotus, Excel, etc.), word processors, and other computational packages such as MathCad.
This demonstration will show how easy it is to share the HP E174XA graphics plots and data with a word processor—in this case the Windows “Write” application.
Sharing Graphics
1 Select File>Load Data File... .
2 Open the demo sub directory (c:\hpe174Xa\demo) and click on the file “fm.pan.”
3 Click the OK button.
4 You have retrieved the FM signal you saw in the TIA Tutorial in this guide. Suppose you want to integrate this data with a report or your lab notebook.
5 Select Edit>Copy Graph.
You have now copied the active window in the HP E174XA application to the Windows Clipboard. If you want, you can verify the current contents of the clipboard by opening the Clipboard Viewer application in the Accessories group under Programs.
3-20 Getting Started Guide

Chapter 3 Demo Waveforms
Demo 3: Sharing TIA Data With Other Windows Applications
3
Open the Windows’ “WordPad” Program
1 Minimize the TIA application by clicking on the minimize ( ) button in the top right corner of the window.
2 In Windows 95, click the Start button, select Programs group, and select the Accessories icon.
3 Double-click on the WordPad icon to open this application.
You have now opened the Windows’ WordPad word-processor application, and you will see a blank space.
4 Select Edit>Paste.
You have just copied the bit mapped graphics from the TIA application to the word processor without a scope camera, printer or plotter as shown in the figure on the following page.
Getting Started Guide 3-21

Chapter 3 Demo Waveforms
Demo 3: Sharing TIA Data With Other Windows Applications
3
NOTE Once the FM signal graphics has been copied into WordPad, click the down arrow (↓) or the right arrow (→) to move outside the graphics.
You need to perform the above step to append the log window contents to the FM signal graphics, which is demonstrated in the next procedure (titled “Now Add the Log Information”).
3-22 Getting Started Guide
Chapter 3 Demo Waveforms
Demo 3: Sharing TIA Data With Other Windows Applications
3
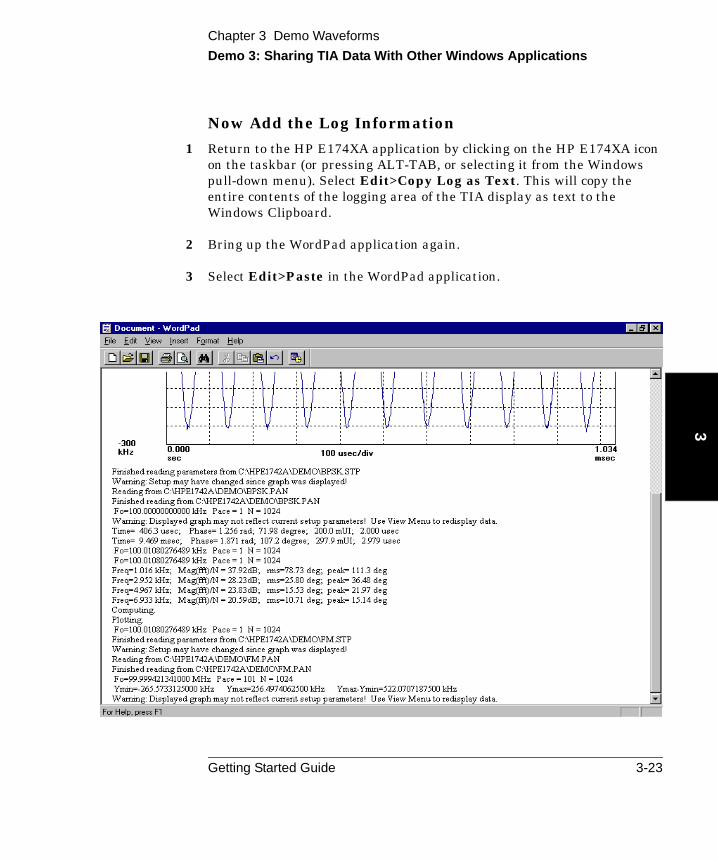
Now Add the Log Information
1 Return to the HP E174XA application by clicking on the HP E174XA icon on the taskbar (or pressing ALT-TAB, or selecting it from the Windows pull-down menu). Select Edit>Copy Log as Text. This will copy the entire contents of the logging area of the TIA display as text to the Windows Clipboard.
2 Bring up the WordPad application again.
3 Select Edit>Paste in the WordPad application.
Getting Started Guide 3-23
Chapter 3 Demo Waveforms
Demo 3: Sharing TIA Data With Other Windows Applications
3
You now have both the graphic results, and the entire log window neatly pasted in your report.
NOTE You may need to modify the font for the logged data. This is easily done in WordPad by highlighting the text to be modified, then going to Format>Font and selecting the desired font and size.
Note also that you can directly edit the logging window in the E174XA application by positioning the cursor in the logging window and typing or using basic edit functions from the keyboard. In this way, you can add annotations to the data, or delete undesired information.
You can copy the entire HP E174XA display using the “Print Screen” key found in the upper right hand corner of most keyboards. Print Screen will copy the entire current display to the Windows clipboard. ALT-Print Screen will copy only the active window to the clipboard.
3-24 Getting Started Guide

Chapter 3 Demo Waveforms
Demo 3: Sharing TIA Data With Other Windows Applications
3
Sharing Data
1 Return to the HP E174XA application.
2 Select File>Save Data for Export As... .
3 Open the demo subdirectory (c:\hpe174Xa\demo).
4 Type the filename “temp.txt” and click the OK button.
You have saved the FM data as ASCII text.
5 Return to the Windows WordPad application.
6 Select File>Open.
The Open dialog box appears.
7 Open the directory c:\hpe174Xa\demo by selecting the path c:\hpe174Xa\demo in the “Look in:” field of the Open dialog box.
8 Type the filename “temp.txt” in the “Filename:” field and click the Open button.
9 Click No button to answer the question “Save changes to document?”.
Getting Started Guide 3-25

Chapter 3 Demo Waveforms
Demo 3: Sharing TIA Data With Other Windows Applications
3
You now have a list of the raw data measured by the HP E1740A TIA (the “time stamps”—see the Help file for more information). Similarly, you could have imported the data into a spread sheet to perform your own custom analysis of the data.
You can also save the data to a file using the File>Save Data As... command. Instead of the time stamps, the data is stored in the format as currently viewed. For instance, if you are viewing a Frequency Deviation display at the time the data is stored, the data is saved as Frequency Deviation vs. Time values. If you are viewing Phase Power Spectral Density display, the data is saved as Frequency vs. Amplitude values.
This completes the Demos.
3-26 Getting Started Guide

Index
Aalternative products, 1-2analysisFFT, 3-17analysis features, viiiassembling, viii, 1-5autoscale, 3-9
Cconfiguting the TIA, 2-7continuous edge sampling, viiiconventions, 2-4cursors, 3-7cursors, using, 2-19
Ddata
sharing, 3-25data capture, viiidemo
phase modulation analysis (BPSK), 3-12
sharing TIA data with other Windows applications, 3-20
VCO frequency step response and settling, 3-3
description of time interval analyzer, viii
detilt, 3-16directory
modifying, 1-9documentation list, ix
Ffeatures
analysis, viiiFFT analysis, 3-17finding information, xfrequecy deviation, 3-6
Ggraphics
sharing, 3-20
Hhealt check, 1-11histogram capacity, viiiHP TIA requirements, 1-7
Iinitiating a measurement
measurement initiation, 2-16installing HP TIA software, 1-8
Llist of documents, ixlog information, 3-21
Mmarkers, 3-7markers, using, 2-19modifying the directory, 1-9mouse, using, 2-4
Ooperating HP TIA software, 1-11
Pphase deviation, 3-15power up, 1-11preface, viipresettig instrument, 2-5printing, 2-25
Rrequirements for TIA, 1-7
Sscaling, 3-9self-test, 1-11sharing data, 3-25sharing data with other applications, ixsharing graphics, 3-20
Getting Started Guide Index-1

Index
signal edge timing, ixsoftware
operation, 1-11software applications
features and functions, 2-2starting a measurement, 2-16starting HP TIA software, 1-11switch on, 1-11
Ttilt, 3-16time interval analyzer, viiiturn on, 1-11tutorial, 2-5
Wwrite program, 3-21
Zzooming, 2-19, 3-7
Index-2 Getting Started Guide

Printed in U.S.AData subject to changeRev 01/98
Technical Support:If you need technical assistance with a Hewlett-Packard test and measurement product or application, please contact the Hewlett-Packard office or distributor in your country.
Asia Pacific:
Hong Kong(852) 2599 7889
India(91-11) 682-6000
JapanHewlett-Packard Japan Ltd.Measurement Assistance Center9-1, Takakura-Cho, Hachioji-Shi,Tokyo 192, JapanTel: (81) 426-56-7832Fax: (81) 426-56-7840
Korea(82-2) 769 0800
Malaysia(60-3) 291 0213
Philippines(63-2) 894 1451
PRC(86-10) 6505-0149
Singapore(1800) 292 8100
Taiwan(886-3) 492 9666
Thailand(66-2) 661 3900
For Countries in Asia Pacific not listed, contact:
Hewlett-Packard Asia Pacific Ltd.17-21/F Shell Tower, Times Square,1 Matheson StreetCauseway BayHong KongTele: (852) 2599 7777Fax: (852) 2506 9285
Australia/New Zealand:Hewlett-Packard Australia Ltd.31-41 Joseph StreetBlackburn, Victoria 3130Australia1 800 629 485
Canada:Hewlett-Packard Canada Ltd.5150 Spectrum WayMississauga, OntarioL4W 5G1(905) 206 4725
Latin America:Hewlett-PackardLatin American Region Headquarters5200 Blue Lagoon Drive9th FloorMiami, Florida 33126U.S.A.Tel: (305) 267 4245 (305) 267-4220Fax: (305) 267-4288
United States:Hewlett-Packard CompanyTest and Measurement Organization5301 Stevens Creek BoulevardBuilding 51L-SCSanta Clara, California 95052-80591 800 452 4844
Europe, Africa, and Middle East:
Austria(0) 1 25000-0
Baltic Countries(358) 08872 2100
Belgium and Luxembourg(02) 778 3417
Czech Republic(0042) 2-4743111
Denmark45 99 10 00
Finland(90) 88 721
France(0) 1 69.82.60.60
Germany(0180) 532 62-33
Greece(1) 7264045
Hungary(1) 252 4705
Ireland(01) 284 4633
Israe:(03) 5380 333
Italy02 - 92 122 241
Netherlands(020) 547 6669
Norway(22) 73 57 50
Poland(22) 608 7700
Portugal(11) 482 85 00
Russia:Tele: (7/095) 928-6885Fax: (7/095) 916-9844
South Africa(011) 806 1000
Spain34 1 631 1323
Sweden(08) 444 22 77
Switzerland(01) 735 7111
Turkey(212) 224 59 25
United Kingdom(01344) 366 666
For countries in Europe/Middle East and Africa not listed, contact:
Hewlett-PackardInternational Sales EuropeGeneva, SwitzerlandTel: +41-22-780-4111Fax: +41-22-780-4770

Continued from front matter. . .
7.CD.NL.A.03.11.97.R1.J.CW2B
Warranty (contd)
HP does not warrant that the operation of HP products will be uninterrupted or error free. If HP is unable, within a reasonable time, to repair or replace any product to a condition as warranted, customer will be entitled to a refund of the purchase price upon prompt return of the product.
HP products may contain remanufactured parts equivalent to new in performance or may have been subjected to incidental use.
The warranty period begins on the date of delivery or on the date of installation if installed by HP. If customer schedules or delays HP installation more than 30 days after delivery, warranty begins on the 31st day from delivery.
Warranty does not apply to defects resulting from (a) improper or inadequate maintenance or calibration, (b) software, interfacing, parts or supplies not supplied by HP, (c) unauthorized modification or misuse, (d) operation outside of the published environmental specifications for the product, or (e) improper site preparation or maintenance.
TO THE EXTENT ALLOWED BY LOCAL LAW, THE ABOVE WARRANTIES ARE EXCLUSIVE AND NO OTHER WARRANTY OR CONDITION, WHETHER WRITTEN OR ORAL, IS EXPRESSED OR IMPLIED AND HP SPECIFICALLY DISCLAIMS ANY IMPLIED WARRANTIES OR CONDITIONS OF MERCHANTABILITY, SATISFACTORY QUALITY, AND FITNESS FOR A PARTICULAR PURPOSE.
HP will be liable for damage to tangible property per incident up to the greater of $300,000 or the actual amount paid for the product that is the subject of the claim, and for damages for bodily injury or death, to the extent that all such damages are determined by a court of competent jurisdiction to have been directly caused by a defective HP product.
TO THE EXTENT ALLOWED BY LOCAL LAW, THE REMEDIES IN THIS WARRANTY STATEMENT ARE CUSTOMER’S SOLE AND EXCLUSIVE REMEDIES. EXCEPT AS INDICATED ABOVE, IN NO EVENT WILL HP OR ITS SUPPLIERS BE LIABLE FOR LOSS OF DATA OR FOR DIRECT, SPECIAL, INCIDENTAL, CONSEQUENTIAL (INCLUDING LOST PROFIT OR DATA), OR OTHER DAMAGE, WHETHER BASED IN CONTRACT, TORT, OR OTHERWISE.
For consumer transactions in Australia and New Zealand: the warranty terms contained in this statement, except to the extent lawfully permitted, do not exclude, restrict or modify and are in addition to the mandatory statutory rights applicable to the sale of this product to you.
Assistance
Product maintenance agreements and other customer assistance agreements are available for Hewlett-Packard products.
For any assistance, contact your nearest Hewlett-Packard Sales and Service Office.
Safety Considerations (contd)
WARNINGANY INTERRUPTION OF THE PROTECTIVE GROUNDING CONDUCTOR (INSIDE OR OUTSIDE THE INSTRUMENT) OR DISCONNECTING THE PROTECTIVE EARTH TERMINAL WILL CAUSE A POTENTIAL SHOCK HAZARD THAT COULD RESULT IN PERSONAL INJURY. (GROUNDING ONE CONDUCTOR OF A TWO CONDUCTOR OUT-LET IS NOT SUFFICIENT PROTECTION.)
Whenever it is likely that the protection has been impaired, the instrument must be made inoperative and be secured against any unintended operation.
If this instrument is to be energized via an autotransformer (for voltage reduction) make sure the common terminal is connected to the earthed pole terminal (neutral) of the power source.
Instructions for adjustments while covers are removed and for servicing are for use by service-trained personnel only. To avoid dangerous electric shock, do not perform such adjustments or servicing unless qualified to do so.
For continued protection against fire, replace the line fuse(s) only with 250V fuse(s) of the same current rating and type (for example, normal blow, time delay). Do not use repaired fuses or short circuited fuseholders.
Acoustic Noise Emissions
LpA<47 dB at operator position, at normal operation, tested per EN 27779. All data are the results from type test.
Geräuschemission
LpA<47 dB am Arbeits platz, normaler Betrieb, geprüft nach EN 27779. Die Angagen beruhen auf Ergebnissen von Typenprüfungen.

���� ������ �Manual Part Number E1725-90012 Printed in U.S.A, APRIL 1998