Local structure analyzers as determinants of preattentive pattern discrimination
10
Biol. Cybern.55, 289-298 (1987) Biological Cybernetics Springer-Verlag 1987 Local Structure Analyzers as Determinants of Preattentive Pattern Discrimination B. J. A. Kr6se Department of Industrial Design Engineering,Delft Universityof Technology, Delft,The Netherlands Abstract. Contemporary literature suggests that pre- attentive texture or pattern discrimination is induced by differences between local structure features or "textons." This paper presents a model for the descrip- tion of such local structure features based on the computation of local autocorrelations within the image. By means of this structure model a measure of structure dissimilarity is introduced. Experiments have been carried out to test a hypothesized relation between the detectability of a target pattern in a field of background patterns and the value of the structure dissimilarity measure. The experimental results show that it seems justified to relate, in a quantitative way, the detectability of the target pattern to the value of the structure dissimilarity measure. 1 Introduction In machine vision literature, texture analyzing al- gorithms may be divided into two categories: a statistical approach or a structural approach. From the statistical point of view texture is defined by a set of statistics extracted from a large ensemble of measure- ments made on the entire image; a "global" procedure. The structural point of view, on the other hand, considers texture to be defined by subpatterns which occur repeatedly within the overall pattern (Haralick 1979). A similar partitioning can be found in theories on human texture perception; the "frequency freaks" versus the "feature creatures." A feature approach has been propagated by Julesz (1981) and Treisman and Gelade (1980). A distinction is made between two processing mechanisms; a parallel, preattentive pro- cess for the extraction of features and a serial, attentive process, which integrates initially separable features into unitary objects. Julesz's first qualitative theory states that effortless texture discrimination occurs when feature or "texton" differences are strong. Does this mean that any spatial frequency ap- proach is in contradiction with a feature approach? This would be the case if a Fourier transformation or, for that matter, any simple harmonic decomposition scheme is carried out on the entire image. However, if the spectral decomposition is considered to be carried out locally (by means of for instance local autocorre- lators) strong parallels with a "feature" or "texton" approach can be observed. Julesz (1981) states that texton differences act as determinants of texture dis- crimination, whereas the exact positions of the textons are of less importance. This implies that (local) phase information can be discarded. A model for the descrip- tion of visual structure based on local autocorrelations is therefore expected to be particularly suited to research on texture discrimination. In experiments on visual pattern discrimination usually a target pattern is presented in a field of background patterns. Each pattern can be described by its structural features; these structural features are, by a process of attention or "tuning," extracted from the local structure. In our research we investigate whether the probability of detecting a target is related to differences between the (local) structure of the target and the (local) structure of the background patterns. 2 Local Structure Analyzers Our description of visual structure is based on rela- tions between image points. A mathematical formula- tion using lower order correlations to describe form, structure or texture is introduced by several authors. Uttal (1975) uses the autocorrelation function in his description of form and gives speculations on neuro- physiological autocorrelations. Moore et al. (1975) use an autocorrelation-like structure function to describe
-
Upload
independent -
Category
Documents
-
view
0 -
download
0
Transcript of Local structure analyzers as determinants of preattentive pattern discrimination
Biol. Cybern. 55, 289-298 (1987) Biological Cybernetics �9 Springer-Verlag 1987
Local Structure Analyzers as Determinants of Preattentive Pattern Discrimination
B. J. A. Kr6se
Department of Industrial Design Engineering, Delft University of Technology, Delft, The Netherlands
Abstract. Contemporary literature suggests that pre- attentive texture or pattern discrimination is induced by differences between local structure features or "textons." This paper presents a model for the descrip- tion of such local structure features based on the computation of local autocorrelations within the image. By means of this structure model a measure of structure dissimilarity is introduced. Experiments have been carried out to test a hypothesized relation between the detectability of a target pattern in a field of background patterns and the value of the structure dissimilarity measure. The experimental results show that it seems justified to relate, in a quantitative way, the detectability of the target pattern to the value of the structure dissimilarity measure.
1 Introduction
In machine vision literature, texture analyzing al- gorithms may be divided into two categories: a statistical approach or a structural approach. From the statistical point of view texture is defined by a set of statistics extracted from a large ensemble of measure- ments made on the entire image; a "global" procedure. The structural point of view, on the other hand, considers texture to be defined by subpatterns which occur repeatedly within the overall pattern (Haralick 1979).
A similar partitioning can be found in theories on human texture perception; the "frequency freaks" versus the "feature creatures." A feature approach has been propagated by Julesz (1981) and Treisman and Gelade (1980). A distinction is made between two processing mechanisms; a parallel, preattentive pro- cess for the extraction of features and a serial, attentive process, which integrates initially separable features
into unitary objects. Julesz's first qualitative theory states that effortless texture discrimination occurs when feature or "texton" differences are strong.
Does this mean that any spatial frequency ap- proach is in contradiction with a feature approach? This would be the case if a Fourier transformation or, for that matter, any simple harmonic decomposition scheme is carried out on the entire image. However, if the spectral decomposition is considered to be carried out locally (by means of for instance local autocorre- lators) strong parallels with a "feature" or "texton" approach can be observed. Julesz (1981) states that texton differences act as determinants of texture dis- crimination, whereas the exact positions of the textons are of less importance. This implies that (local) phase information can be discarded. A model for the descrip- tion of visual structure based on local autocorrelations is therefore expected to be particularly suited to research on texture discrimination.
In experiments on visual pattern discrimination usually a target pattern is presented in a field of background patterns. Each pattern can be described by its structural features; these structural features are, by a process of attention or "tuning," extracted from the local structure. In our research we investigate whether the probability of detecting a target is related to differences between the (local) structure of the target and the (local) structure of the background patterns.
2 Local Structure Analyzers
Our description of visual structure is based on rela- tions between image points. A mathematical formula- tion using lower order correlations to describe form, structure or texture is introduced by several authors. Uttal (1975) uses the autocorrelation function in his description of form and gives speculations on neuro- physiological autocorrelations. Moore et al. (1975) use an autocorrelation-like structure function to describe

290
features of a visual scene and Julesz (Julesz et al. 1973) uses second order statistics in his earlier texture discrimination theories.
All authors apply the structure description on images with only two gray levels. If an image consists of elements with more than two gray levels, an autocorre- lation approach also takes into account relations between points having different gray levels. In partic- ular, in literature on the perception of Moir6 patterns it has been shown that there exists a process of perceptual slicing: Moir6 patterns are only perceived if the points of these patterns have identical gray levels (Glass and Switkes 1976; Prazdny 1984). Instead of a single structure representation for a complex image it can be argued that there exists a multiplicity of structure descriptions, each one based on a (binary) slice of the image. In this paper we restrict ourselves to a structure description of images having only two gray values.
A pattern P can be described by the characteristic function g(x, y) with
g(x, y)= l for (x, y) ~ P , (1)
g(x,y)=O for (x,y)q~P.
The function
h(x, y, r, O) = g(x, y)g(x + r cos 0, y + r sin 0) (2)
characterizes the relations between image points; if two points x, y and x + r cos 0, y + r sin 0 belong to the pattern P the value of h(x, y, r, O) will be 1, in other cases 0. To describe these relations we use the "chord" concept which was formerly introduced by Moore et al. (1975) and Gerrissen (1982).
A chord is a virtual line between image points, defined by location (x, y), length r, and orientation 0. The total number of chords in a given region R can be represented as a function of length and orientation:
f(r, O) = S ~ h(x, y, r, O)dxdy R
= ~ ~ g(x, y)g(x + r cos 0, y + r sin O)dxdy. (3) R
This function (for binary images identical to the autocorrelation function) has been represented in the (r, 0) chord space. Clusters of high intensity in the chord space are characteristic for the structure of the image. We call these clusters "structure features."
Since the correlation process is assumed to take place at an early stage of information transfer, the characteristics of the human image sampling array have to be considered. Based on physiological (Hubel and Wiesel 1974; Schwartz 1977), psychophysical (Wilson 1983) or information theoretical (Gerrissen 1982) considerations, a description in which the retina is constructed from concentric rings of sam- pling units with increasing density in the direction of
the centre is proposed. This "sunflower heart" distri- bution of sampling units can be considered as a particular case of a model which represents the retina as a stack of self similar detector arrays (Crettez and Simon 1982; Koenderink and van Doorn 1978; Bur- ton et al. 1986).
The specific configuration of the sampling units in Koenderink's "stack" model implies two types of transformation distortion. The finiteness of resolution of a certain sheet in the stack causes quantization errors when determining the length and orientation of the chords. The limited size of the sheets has, on the other hand, as a result that the probability that a chord of a certain length falls within this sheet decreases for longer chords. It has been shown (Kr6se 1985) that, if each sheet optimally processes chords of a certain length r' proportional to the diameter of the sheet, the relative error of length quantization is constant. In correspondence with this constant relative error we represent the function f (r , O) in a Oogr, O) space rather than in a (r, 0) space.
As a consequence of using second order relations the transformation to the chord space is translation invariant. When varying the size of the pattern, the relative length variation is equal for all chords. As a result of the logarithmic representation of the length axis this will cause a fixed shift along the logr axis irrespective of the chord length. Dilation (or constric- tion) of the pattern causes the structure features to shift along the log r axis; their configuration remains undis- turbed. If the pattern is rotated over an angle ~b, the orientation of all chords will change with this angle ~b; a rotation thus causes a shift of the structure features along the orientation axis.
A dilation or a rotation of the pattern only causes a shift of the configuration of structure features in the log-polar chord space; it is easy to see that by means of a second autocorrelation transform (in fact, any po- sition invariant transform can be used), a transform which is position, size, and orientation invariant is obtained.
If the integration region R covers the entire image, (3) gives the global structural information of the image. Local structure can be defined by fi(r, O) in which the integration area covers only a predefined region R~ of the entire image. Information on the location and size of this R i can for instance be given by a layer of the stack with large sampling units.
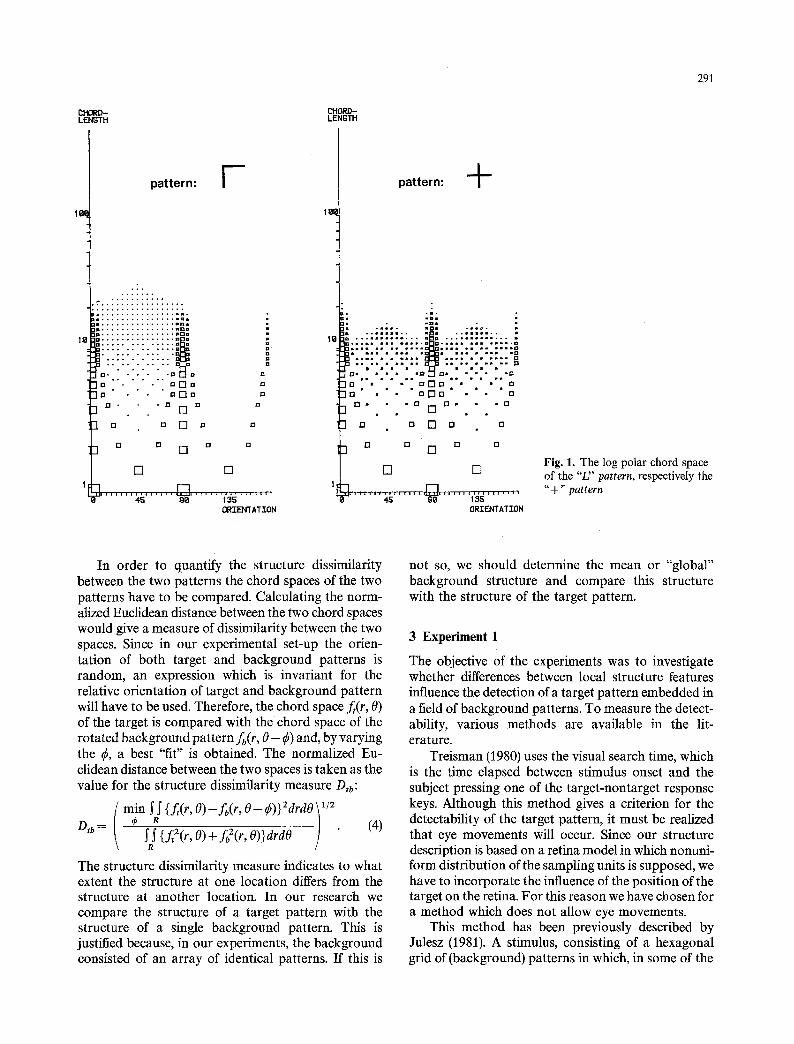
In our experiments on pattern discrimination we investigated the detectability of a target pattern em- bedded in background patterns. Figure 1 gives an example of the local log polar chord space of two patterns which have been used as target background combination. The size of the squares is proportional to f (r, 0).
291
CHORD- LENGTH
CHORD- LENGTH
lel
pattern: J
. c . . : : : : : : : : : : : ....
�9 - n ~m . . . . . . . . . . . . nnB 3n . . . . . . . . . . . . . . . JDo
a . . . . . . . . . " . . . . m n ~ : " : ' : ' " : ' : " : ~ ~ . . . . . . . . . . n
a ~ n n
[] []
ORIENTATION
pattern: +
�9 . ; . . : I : " . . :--:::::- ' : . . : . . : ; : : : : : ; : . . o . . . . . . . . . . . . . . ~ . . . . . . . . . . . . .
~. - ' � 9 " - = ? a - " - ' - ' - " -=g :." ~ : . . ' . . ' . . : '_ - . . . . . . .
[ ] �9 l:I r 7 rm �9 ~1
0 �9 ~ I - I D n El - �9 O D , �9 El []
o ~ [] o o IO o n [ ] n
[]
45 @g 135 ORIENTATION
Fig. 1. The log polar chord space of the "L" pattern, respectively the "+" pattern
In order to quantify the structure dissimilarity between the two patterns the chord spaces of the two patterns have to be compared. Calculating the norm- alized Euclidean distance between the two chord spaces would give a measure of dissimilarity between the two spaces. Since in our experimental set-up the orien- tation of both target and background patterns is random, an expression which is invariant for the relative orientation of target and background pattern will have to be used. Therefore, the chord space ft(r, (7) of the target is compared with the chord space of the rotated background pattern fb(r, 0 - ~b) and, by varying the ~b, a best "fit" is obtained. The normalized Eu- clidean distance between the two spaces is taken as the value for the structure dissimilarity measure Dtb:
D,b---- - j . ~ ; ~ / . (4)
The structure dissimilarity measure indicates to what extent the structure at one location differs from the structure at another location. In our research we compare the structure of a target pattern with the structure of a single background pattern. This is justified because, in our experiments, the background consisted of an array of identical patterns. If this is
not so, we should determine the mean or "global" background structure and compare this structure with the structure of the target pattern.
3 E x p e r i m e n t 1
The objective of the experiments was to investigate whether differences between local structure features influence the detection of a target pattern embedded in a field of background patterns. To measure the detect- ability, various methods are available in the lit- erature.
Treisman (1980) uses the visual search time, which is the time elapsed between stimulus onset and the subject pressing one of the target-nontarget response keys. Although this method gives a criterion for the detectability of the target pattern, it must be realized that eye movements will occur. Since our structure description is based on a retina model in which nonuni- form distribution of the sampling units is supposed, we have to incorporate the influence of the position of the target on the retina. For this reason we have chosen for a method which does not allow eye movements.
This method has been previously described by Julesz (1981). A stimulus, consisting of a hexagonal grid of (background) patterns in which, in some of the

292
comb.
target
ground
mask
1 2 3 4 5 6
+ T + V ,t" 0
I I m /1 + +
FF FF t,'1 Fig. 2. Combinations of target and background patterns used in Experiment 1
presentations, a target is embedded, is briefly flashed and after a variable interval time masked by a stimulus consisting of elements which are the union of the two patterns to be discriminated. In order to compare the discriminability of the target background combina- tions with the values of the previously introduced structure dissimilarity measure, the experiment has been carried out with different combinations.
Figure 2 shows the combinations of target and background patterns which were used in the experi- ment. Combinations 1, 2, and 4 have been previously used by Julesz. The first four combinations consist of a target and background pattern which are built from the same line elements. Since the positions of the line elements differ, the distribution of chords (f(r, 0)) is different for target and background. Combination 5 was chosen to investigate the role of the relative orientation of the line segments. Two patterns which do not share identical line segments (combination 6) were included to serve as a reference for the other
patterns. The stimulus consisted of a hexagonal grid with three "rings" of patterns, as depicted in Fig. 3.
An important aspect of pattern detectability is the eccentricity of target presentation or the area within which a target can be detected. Elaborate research on this aspect has been carried out by Engel (1971), who introduced the "conspicuity area" as a measure for target detectability. This conspicuity area was defined as the retinal field in which the relevant object can be discovered (without foreknowledge of location) in its background, during a brief presentation of the stimu- lus pattern. In our experimental set-up the eccentricity of target presentation is considered as an independent variable.
Procedure
Each trial started with the presentation of a central fixation cross which remained in view for 1 s. The subjects were instructed to look at this fixation cross. After a 200 ms interval, the stimulus was presented during 80 ms. At a variable time after onset of the stimulus, the afterimage was erased by the presentation of the mask during 80 ms (Fig. 3). The patterns of the mask were formed by the sum of the target and the background pattern. The interval between stimulus onset and mask onset is called stimulus onset asyn- chrony, SOA.
Stimuli were presented in blocks within which the SOA was kept constant. During an experimental session five blocks of stimuli have been used. The first block with an SOA of 680 ms served as a training series. The remaining four blocks were presented with
(b) (a) [__ ~. FF
~q
(e) t ~ SOA ~ i
stimulus I mask
0 80 t (ms)
Fig. 3a--e. Examples of stimulus (a) and mask (b) and timing of stimulus presentation (c)

P*(S Is) = {P(S Is)- P(SI n)}/{ 1 - P(S In)}
successively shorter SOA: 480, 320, 240, and 180 ms. A block consisted of 70 trials, in 60% of which a tar- get was present in the stimulus. The position of the tar- get was random.
Subjects were instructed to press a joystick to the right if they detected a target and to the left otherwise. During the experiment, no feedback to the subject was given. Since the subject guesses in case of uncertainty, the observed percentage of correct responses will be an overestimate of the real percentage of correct re- sponses. The corrected percentage of hits has been calculated with the formula, given by Blackwell (1953),
(5)
6
1
4
3
2
in which P(SI s) is the observed percentage of hits and P(SIn) the observed percentage of false alarms. This corrected percentage, averaged over the subjects is called the "discrimination factor" 6tb.
Apparatus The stimuli were displayed on a Barco CD 351 video monitor with short persistence phosphor. The display was controlled by a PDP 11/23 computer via a Matrox video interface. The same PDP 11/23 controlled the experiment and collected the observer responses from the joystick. The stimuli consisted of white (luminance lw=6.366cd/m 2) patterns on a black (luminance lb = 0.318 cd/m z) background. The size of the patterns was 1 ~ visual angle. The observers were seated at a distance of 1 m from the display. The size of the hexagonal stimulus field was 12.8 ~ visual angle.
Subjects The experiment has been carried out with 11 subjects, students of the Department of Industrial Design Engineering, who were paid for their cooperation. All subjects had normal or corrected-to-normal vision.
Results Figure 4 shows the discrimination factor (~tb averaged over the three rings as a function of the SOA. For small SOA an increase in the SOA causes a steep increase of the &tb while for larger SOA the &tb asymptotically approaches a final value, which is different for each combination.
The &~b does not exceed the 50% for three combina- tions (2, 3, and 5) while only for combination 6 the &~b reaches the 100%. Since the &tb for the latter combina- tion remained 100% at the selected measuring points in our experiment (SOA=480, 320, 240, and 180 ms) three extra measuring points have been included: SOA = 120, 80, and 60 ms. In order to obtain the last two values a stimulus presentation time of 40 ms instead of 80 ms has been used.
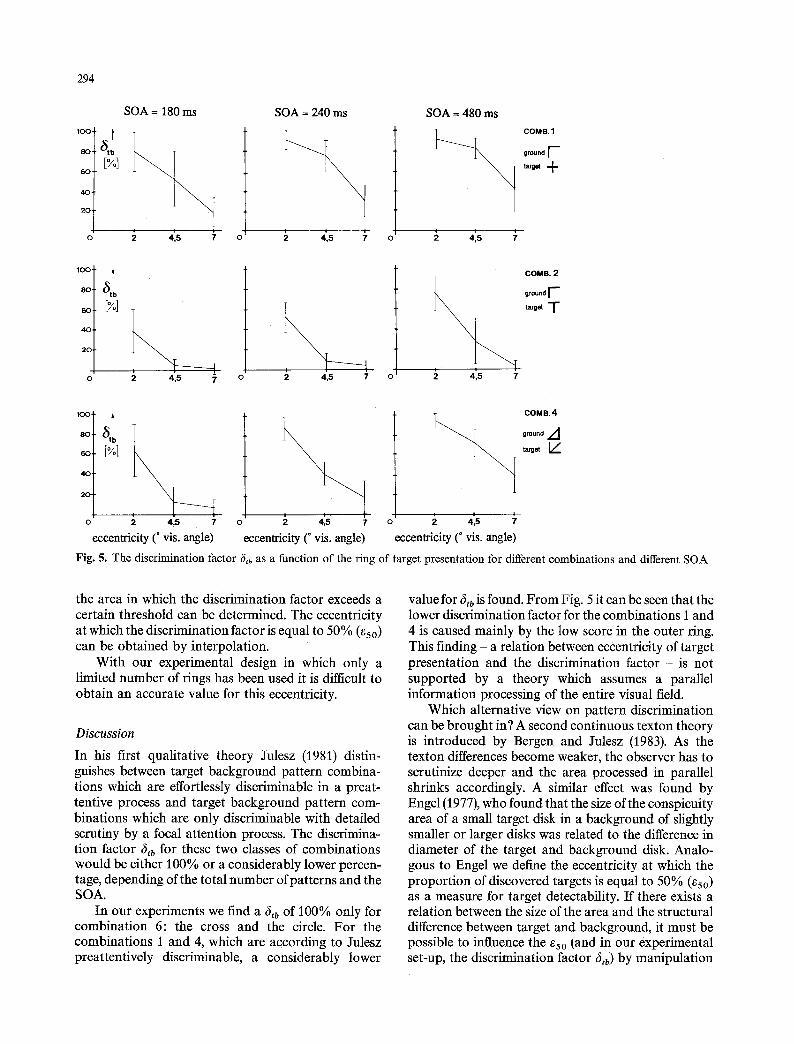
The effect of the target-eccentricity on the dis- crimination factor 6tb is given in Fig. 5. For three different target-background combinations and three different SOA conditions the discrimination factor is shown as a function of the ring in which the target has been presented. For all[ pattern combinations and all SOA a greater target eccentricity is found to cause a lower value of the discrimination factor ~Stb.
In order to quantify the detectability of a target pattern similar to Engel's "conspicuity area," the size of
100
9O
8O
7O
& 60 tb
(%) 50
4O
30
2O
10
0
293
~ornb. g round target
, I - +
2 I I-
T +
, ,d L/
+ ,1"
' -t- O
I ! ! 1 !
0 100 200 300 400 500 SOA (ms)
Fig. 4. The discrimination factor t~tb, averaged over the three rings, as a function of the SOA
294
10o
8o
60
40
20
0
100
80
60
40
20
SOA = 180 ms
[%]
i i
2 4,5 ">
SOA = 240 ms
t
N
2 4,5 7 0 0 0 a[l•,. 2 4,5 7
SOA = 480 ms
I
2 4,5 7
COMB.1
ground [ ~
COMB. 2
ground r "
target T
a, ground A 80' b
~o [%] ,~,~ I L
4 0
2 0 '
I I
0 2 4,5 7 0 2 4,5 7 0 2 4,5
eccentricity (~ vis. angle) eccentricity (~ vis. angle) eccentricity (* vis. angle)
Fig. 5. The discrimination factor 8tb as a function of the ring of target presentation for different combinations and different SOA
the area in which the discrimination factor exceeds a certain threshold can be determined. The eccentricity at which the discrimination factor is equal to 50% (550) can be obtained by interpolation.
With our experimental design in which only a limited number of rings has been used it is difficult to obtain an accurate value for this eccentricity.
Discussion
In his first qualitative theory Julesz (1981) distin- guishes between target background pattern combina- tions which are effortlessly discriminable in a preat- tentive process and target background pattern com- binations which are only discriminable with detailed scrutiny by a focal attention process. The discrimina- tion factor 6tb for these two classes of combinations would be either 100% or a considerably lower percen- tage, depending of the total number of patterns and the SOA.
In our experiments we find a 6,b of 100% only for combination 6: the cross and the circle. For the combinations 1 and 4, which are according to Julesz preattentively discriminable, a considerably lower
value for bib is found. F rom Fig. 5it can be seen that the lower discrimination factor for the combinations 1 and 4 is caused mainly by the low score in the outer ring. This finding - a relation between eccentricity of target presentation and the discrimination factor - is not supported by a theory which assumes a parallel information processing of the entire visual field.
Which alternative view on pattern discrimination can be brought in? A second continuous texton theory is introduced by Bergen and Julesz (1983). As the texton differences become weaker, the observer has to scrutinize deeper and the area processed in parallel shrinks accordingly. A similar effect was found by Engel (1977), who found that the size of the conspieuity area of a small target disk in a background of slightly smaller or larger disks was related to the difference in diameter of the target and background disk. Analo- gous to Engel we define the eccentricity at which the proport ion of discovered targets is equal to 50% (%0) as a measure for target detectability. If there exists a relation between the size of the area and the structural difference between target and background, it must be possible to influence the 550 (and in our experimental set-up, the discrimination factor 6tb) by manipulation
A B C D E
O: [%] 9 18 2 7 3 6 5 0
r,.GET I- I- 1- i-- +
G.ou.o I'- F F F F
Fig. 6. Combinations of target and background patterns used in Experiment 2
of the structural difference between target and back- ground. For this reason we designed Experiment 2.
4 Experiment 2
The aim of this experiment was to investigate the influence of the structural difference between target and background on the discrimination factor 6tb and the eccentricity of 50% detection (es0). For this experiment a series of background patterns has been developed in such a way that the structural differences between target and background could be manipulated.
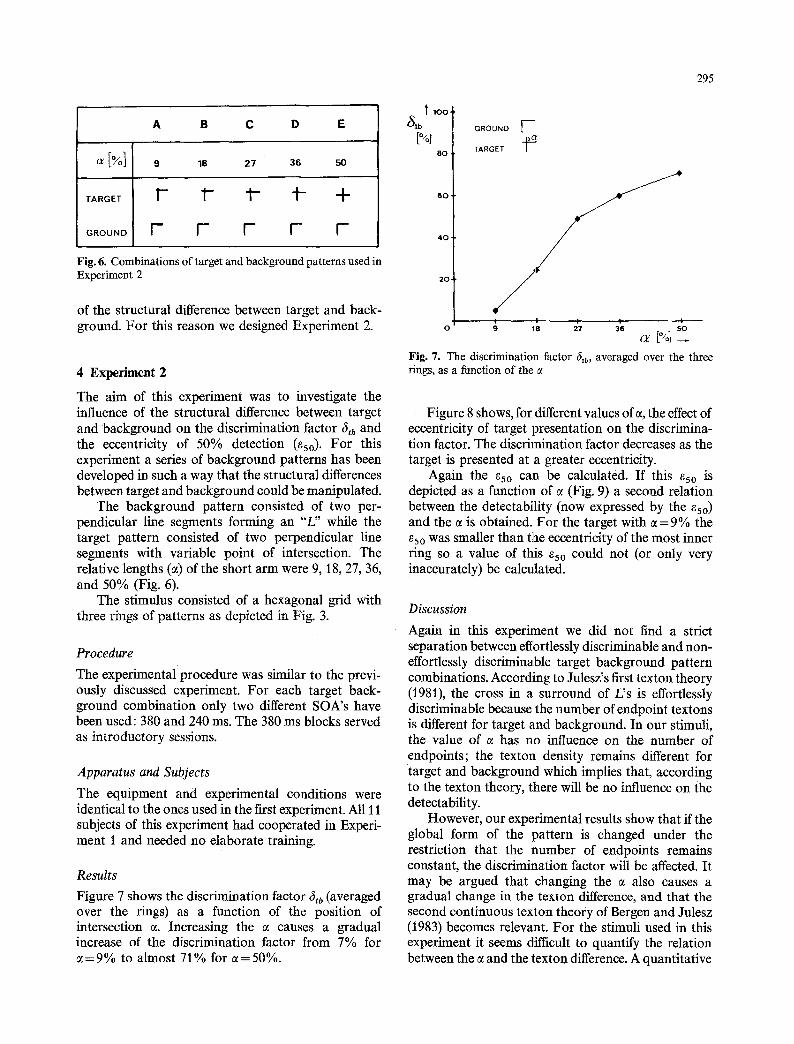
The background pattern consisted of two per- pendicular line segments forming an "L" while the target pattern consisted of two perpendicular line segments with variable point of intersection. The relative lengths (c~) of the short arm were 9, 18, 27, 36, and 50% (Fig. 6).
The stimulus consisted of a hexagonal grid with three rings of patterns as depicted in Fig. 3.
Procedure
The experimental procedure was similar to the previ- ously discussed experiment. For each target back- ground combination only two different SOA's have been used: 380 and 240 ms. The 380 ms blocks served as introductory sessions.
Apparatus and Subjects
The equipment and experimental conditions were identical to the ones used in the first experiment. All 11 subjects of this experiment had cooperated in Experi- ment I and needed no elaborate training.
Results
Figure 7 shows the discrimination factor ~tb (averaged over the rings) as a function of the position of intersection ~. Increasing the ct causes a gradual increase of the discrimination factor from 7% for ~= 9% to almost 71% for ~= 50%.
295
I 1 0 0 "
~tb [%1
8 0 -
GROUND F--
TARGET -~
40'
I I I l O 18 27 36 5 0
cr [%] ~
Fig. 7. The discrimination factor 6tb , averaged over the three rings, as a function of the c~
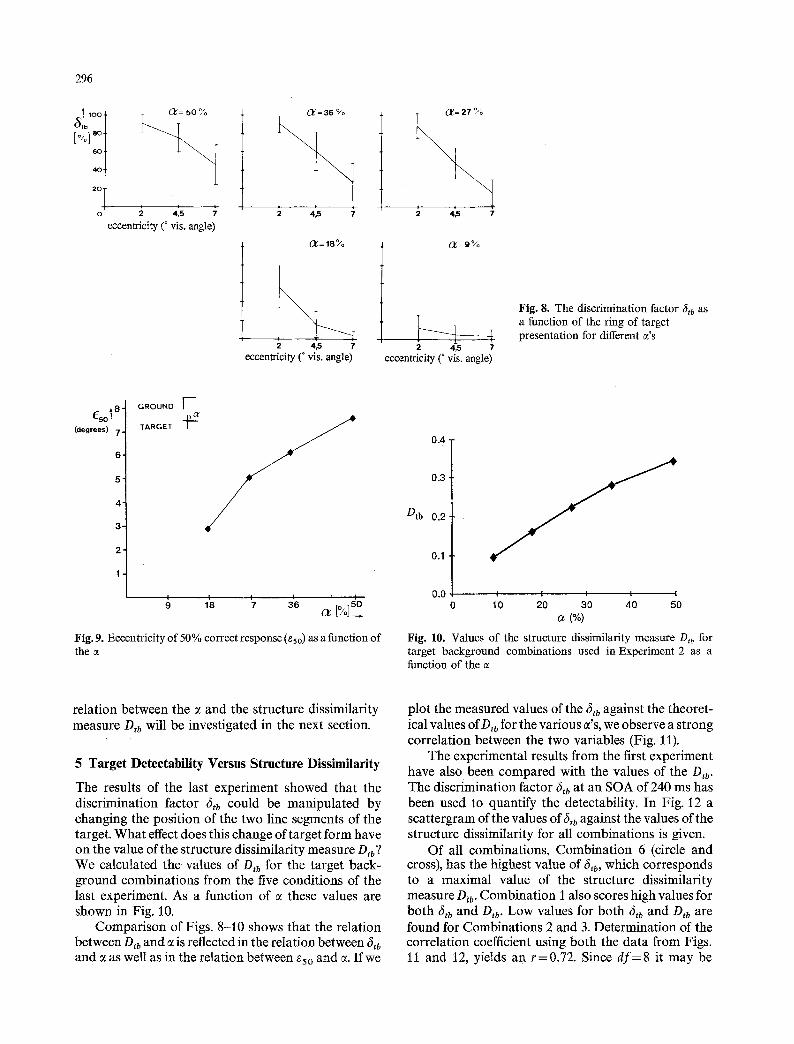
Figure 8 shows, for different values of ~, the effect of eccentricity of target presentation on the discrimina- tion factor. The discrimination factor decreases as the target is presented at a greater eccentricity.
Again the ~5o can be calculated. If this ~5o is depicted as a functio~t of e (Fig. 9) a second relation between the detectability (now expressed by the ~so) and the e is obtained. For the target with cc=9% the eso was smaller than the eccentricity of the most inner ring so a value of this eso could not (or only very inaccurately) be calculated.
Discussion
Again in this experiment we did not find a strict separation between effortlessly discriminable and non- effortlessly discriminable target background pattern combinations. According to Julesz's first texton theory (1981), the cross in a surround of L's is effortlessly discriminable because the number of endpoint textons is different for target and background. In our stimuli, the value of ~ has no influence on the number of endpoints; the texton density remains different for target and background which implies that, according to the texton theory, there will be no influence on the detectability.
However, our experimental results show that if the global form of the pattern is changed under the restriction that the number of endpoints remains constant, the discrimination factor will be affected. It may be argued that changing the e also causes a gradual change in the texton difference, and that the second continuous texton theory of Bergen and Julesz (1983) becomes relevant. For the stimuli used in this experiment it seems difficult to quantify the relation between the e and the texton difference. A quantitative
296
(•Ib 100 '
[%]~o. 6 0 .
4 0 .
2 O
i i 4,5 7
eccentricity (* vis. angle)
( 1 / = 3 6 %
, ,
2 4.5
1 ~ = 1 8 %
2 4,5 7
eccentricity (~ vis. angle)
0g=27 %
2 4,5 7
(1:=9%
4 2 4,5 7
eccentricity (~ vis. angle)
Fig. 8. The discrimination factor 5tb as a function of the ring of target presentation for different c~'s
eso t8: (degrees) 7 =
6-
5-
4-
3-
2-
1
GROUND F-- TARGET "J~ / /
I ! 9 18 i 7 36 ~ ~50
cr [/ol~
Fig. 9. Eccentricity of 50 % correct response (eso) as a function of the
0 . 4
0 , 3 �84
Dtb 0.2
0.1
0.0 l i i l t
0 10 20 30 40 50 (o/<>)
Fig. 10. Values of the structure dissimilarity measure D,b for target background combinations used in Experiment 2 as a function of the a
relation between the ~ and the structure dissimilarity measure Dtb will be investigated in the next section.
5 Target Detectability Versus Structure Dissimilarity
The results of the last experiment showed that the discrimination factor (~tb could be manipulated by changing the position of the two line segments of the target. What effect does this change of target form have on the value of the structure dissimilarity measure Dtb? We calculated the values of Dtb for the target back- ground combinations from the five conditions of the last experiment. As a function of ~ these values are shown in Fig. 10.
Comparison of Figs. 8-10 shows that the relation between Dtb and ~ is reflected in the relation between 5tb and e as well as in the relation between eso and e. If we
plot the measured values of the (~tb against the theoret- ical values of Dtb for the various ~'s, we observe a strong correlation between the two variables (Fig. 11).
The experimental results from the first experiment have also been compared with the values of the D,b. The discrimination factor 6tb at an SOA of 240 ms has been used to quantify the detectability. In Fig. 12 a scattergram of the values of 5tb against the values of the structure dissimilarity for all combinations is given.
Of all combinations, Combination 6 (circle and cross), has the highest value of 5,b, which corresponds to a maximal value of the structure dissimilarity measure D,b. Combination I also scores high values for both 5tb and Dtb. Low values for both 5~b and Dtb are found for Combinations 2 and 3. Determination of the correlation coefficient using both the data from Figs. 11 and 12, yietds an r=0.72. Since df=8 it may be
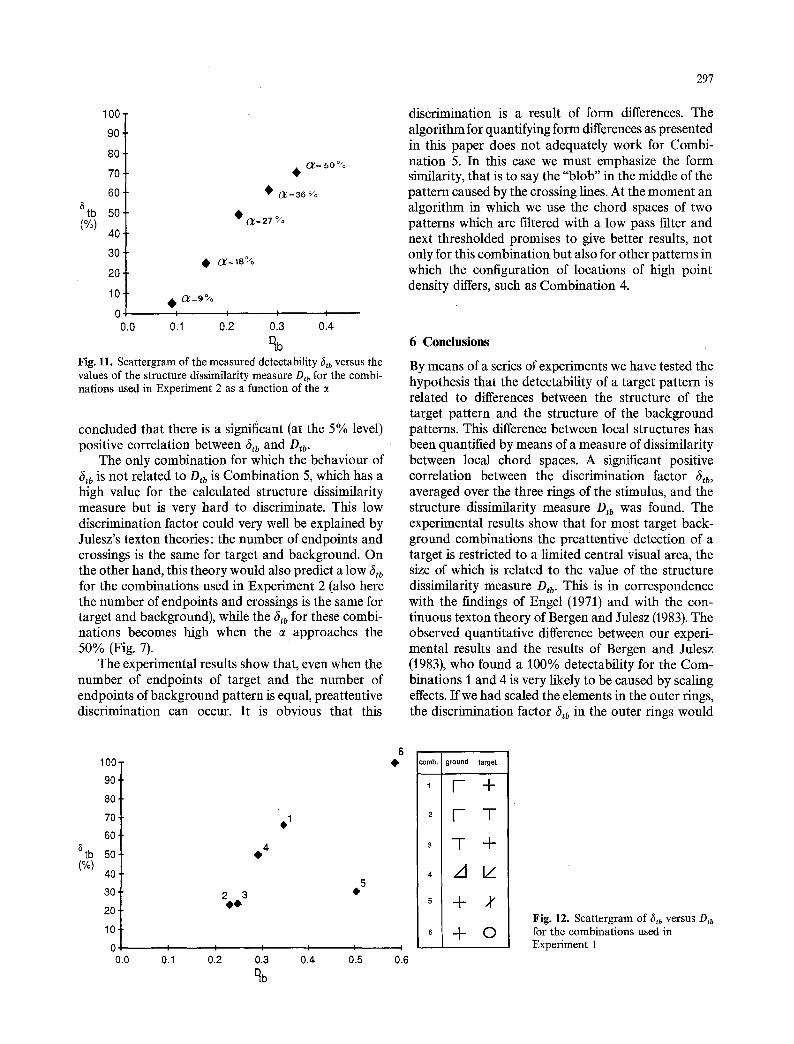
297
tb (%)
100
90
80
70
60
50
40
30
20
10
0 0.0
O'= 5 0 %
�9 ~ = 3 6 ~
�9 O f = 2 7 ~o
�9 O~=a8%
I I I I
0.1 0.2 0.3 0.4
% Fig. 11. Scattergram of the measured detectability fib versus the values of the structure dissimilarity measure Dtb for the combi- nations used in Experiment 2 as a function of the
concluded that there is a significant (at the 5 % level) positive correlation between 6tb and Dtb.
The only combination for which the behaviour of 6~b is not related to Dtb is Combination 5, which has a high value for the calculated structure dissimilarity measure but is very hard to discriminate. This low discrimination factor could very well be explained by Julesz's texton theories: the number of endpoints and crossings is the same for target and background. On the other hand, this theory would also predict a low &tb for the combinations used in Experiment 2 (also here the number of endpoints and crossings is the same for target and background), while the 6tb for these combi- nations becomes high when the e approaches the 50~ (Fig. 7).
The experimental results show that, even when the number of endpoints of target and the number of endpoints of background pattern is equal, preattentive discrimination can occur. It is obvious that this
discrimination is a result of form differences. The algorithm for quantifying form differences as presented in this paper does not adequately work for Combi- nation 5. In this case we must emphasize the form similarity, that is to say the "blob" in the middle of the pattern caused by the crossing lines. At the moment an algorithm in which we use the chord spaces of two patterns which are filtered with a low pass filter and next thresholded promises to give better results, not only for this combination but also for other patterns in which the configuration of locations of high point density differs, such as Combination 4.
6 Conclusions
By means of a series of experiments we have tested the hypothesis that the detectability of a target pattern is related to differences between the structure of the target pattern and the structure of the background patterns. This difference between local structures has been quantified by means of a measure of dissimilarity between local chord spaces. A significant positive correlation between the discrimination factor 6tb, averaged over the three rings of the stimulus, and the structure dissimilarity measure Dtb was found. The experimental results show that for most target back- ground combinations the preattentive detection of a target is restricted to a limited central visual area, the size of which is related to the value of the structure dissimilarity measure Dtb. This is in correspondence with the findings of Engel (1971) and with the con- tinuous texton theory of Bergen and Julesz (1983). The observed quantitative difference between our experi- mental results and the results of Bergen and Julesz (1983), who found a 100% detectability for the Com- binations I and 4 is very likely to be caused by scaling effects. If we had scaled the elements in the outer rings, the discrimination factor 6tb in the outer tings would
5 tb (%)
IOO T
80
70
60.
50-
40.
30
20
10
0 0.0
2 3
0 4
�9
I I I I I
0.1 0.2 0.3 0.4 0.5 %
5
6
I
0.6
comb. ground target
, I - +
2 I - T
3 T -i-
, /J IZ
6 q_ O Fig. 12. Scattergram of 6tb versus Dtb for the combinations used in Experiment 1
298
have been higher, resulting in a higher overall value of 6tb.
As mentioned earlier, models which study second order statistics in relation with texture discrimination have been presented in literature. In this context the work of Caelli and Julesz (1978) must be mentioned. In a series of two papers they showed that there exist textures having identical second order statistics which can be discriminated. What are the differences between their approach and the algorithm proposed in this paper?
Caelli and Julesz use the "iso dipole characteristics" of a texture, comparable with the chord structure. An important difference, however, is the fact that they consider the global structure of a texture field. In case of randomly rotated patterns the information on the orientation of the dipoles (or chords) is lost; what is left is the distribution of the chord lengths. For two patterns similar to those of combinat ion 4 they show that the dipole characteristics are identical. This is true, if only the distribution of the dipole length ~ f(r, O)dO is considered. In our model, however, we use the entire chord space of the pat tern; the distribution of chords as a function of length and orientation. Compar ing these chord spaces results in a high value of the dissimilarity measure. Two textures having the same dipole length characteristics thus can differ if the local chord distributions are considered.
This paper has shown that the use of a local autocorrelat ion algorithm on binary images, in com- bination with a multi-layer, multi-resolution sampling array results in a flexible method for the extraction of local structure features. Considering the quantitative relation between the structure dissimilarity measure and target detectability, the algori thm may give insight in the nature of local feature or "texton" detectors.
References
Bergen JR, Julesz B (1983) Rapid discrimination of visual patterns. IEEE Trans SMC-13: 857-863
Blackwell HR (1953) Psychophysical thresholds: Experimental studies of methods of measurements. Bull Eng Res Inst U Mich 36:227
Burton GJ, Haig ND, Moorhead IR (1986) A self similar stack model for human and machine vision. Biol Cybern 53: 397-403
Caelli T, Julesz B (1978) On perceptual analyzers underlying visual texture discrimination: part 1. Biol Cybern 28:167-175
Crettez JP, Simon JC (1982) A model for cell receptive fields in the striate cortex. Computer Graph Image Proc 20:299-318
Engel FL (1971) Visual conspicuity, directed attention and retinal locus. Vision Res 11:563-576
Engel FL (1977) Visual conspicnity, visual search and fixatioii tendencies of the eye. Vision Res 17:95-108
Gerrissen JF (1982) Theory and model of the human global analysis of visual structure. IEEE Trans SMC-12:805-817
Glass L, Switkes E (1976) Pattern recognition in humans; correlations which cannot be perceived. Perception 5:67-72
Haralick RM (1979) Statistical and structural approaches to texture. Proc IEEE 67 no 5:786--804
Hubel DH, Wiesel TN (1974) Uniformity of monkey striate cortex: a parallel relationship between field size, scatter and magnification factor. J Comp Neurol 158:295-305
Julesz B (1981 ) Textons, the elements of texture perception, and their interactions. Nature 290:91-97
Julesz B, Gilbert EN, Shepp LA, Frisch HL (1973) Inability of humans to discriminate between visual textures that agree in second order statistics - revisited. Perception 2:391-405
Koenderink JJ, van Doorn AJ (1978) Visual detection of spatial contrast; influence of location in the visual field, target extent and llluminance level. Biol Cybern 30:l 57-167
Krtse BJA (1985) A structure description of visual information. Patt Recog Lett 3:41-50
Moore DJH, Seidl RA, Parker DJ (1975) A configurational theory of visual perception. Int J Man-Mach Stud 7:449-509
Prazdny K (1984) On the perception of Glass patterns. Percep- tion 13:469-478
Schwartz EL (1977) Spatial mapping in the primary sensory projection: analytic structure and relevance to perception. Biol Cybern 25:181-194
Treisman AM, Gelade G (1980) A feature integration theory of attention. Cogn Psychol 12:97-136
Uttal WR (1975) An autocorrelation theory of visual form detection. Erlbaum L. Hillsdale, NJ
Wilson SW (1983) On the retino-cortical mapping. Internat J Man-Mach Stud 18:361-389
Received: April 1, 1986
Dr. B. J. A. Kr6se Delft University of Technology Interdisciplinary Department of Industrial Design Engineering Oude Delft 39a 2611 BB Delft The Netherlands