Sulfur Plant Process Control Analyzers - AIMS - Analytical ...
Upload
khangminh22Category
view
0download
0
Operation Manual andProgramming Reference
Universal Gas Analyzers LiteUGALT100, UGALT200, UGALT300
Stanford Research Systems
Revision 1.1 · May, 2014
Stanford Research Systems UGALT Series Universal Gas Analyzers Lite
Certification
Stanford Research Systems certifies that this product met its published specifications at the time of shipment.
Warranty
This Stanford Research Systems product is warranted against defects in materials and workman-ship for a period of one (1) year from the date of shipment.
Service
For warranty service or repair, this product must be returned to a Stanford Research Systems authorized service facility. Some components may be serviceable directly from the supplier. Con-tact Stanford Research Systems or an authorized representative before returning this product for repair.
Trademarks
Ultra-Torr® and VCR® are registered trademarks of Swagelok Co.Tygon® is a registered trademark of Norton Co.All other brand and product names mentioned herein are used for identification purposes only, and are trademarks or registered trademarks of the respective holders.
Contact Information
Stanford Research Systems, Inc.1290-D Reamwood AvenueSunnyvale, CA 94089 USA
Phone: (408)744-9040Fax: (408)[email protected]
Information in this document is subject to change without notice.
Copyright © Stanford Research Systems, Inc., 2007 – 2013. All rights reserved.
Printed in U.S.A.

i
Safety . . . . . . . . . . . . . . . . ii Symbols . . . . . . . . . . . . . . iii Checklist . . . . . . . . . . . . . . iv Materials List . . . . . . . . . . . v Specifications . . . . . . . . . . . vi Quick Start . . . . . . . . . . . . . ix
Chapter 1 UGALT Basics Introduction . . . . . . . . . . . . 1–2 Configuration . . . . . . . . . . . 1–6 Options. . . . . . . . . . . . . . . 1–12
Chapter 2 Guide to Operation Introduction . . . . . . . . . . . . 2–3 Front Panel Operation . . . . . . 2–3 Remote Operation . . . . . . . . 2–14
Chapter 3 Remote Programming Introduction . . . . . . . . . . . . 3–2 Commands . . . . . . . . . . . . 3–4
Chapter 4 UGALT Error Messages Introduction . . . . . . . . . . . . 4–2 Error Messages . . . . . . . . . . 4–3
Chapter 5 Calibration and Input Design Mass Spectrometry Basics . . . . 5–2 Calibration of Partial Pressure. . 5–13 Pressure Reducing Inlet . . . . . 5–21 References . . . . . . . . . . . . . 5–33
Appendices Appendix A UGALT Menu Table A–1 Appendix B UGALT State Diagram A–2 Appendix C Calibration Log A–3
Contents
Stanford Research Systems UGALT Series Universal Gas Analyzers Lite
ii
Safety WarningHazardous voltages, capable of causing injury or death, are present in this instrument. Use extreme caution whenever the top back and the bottom covers of the instrument are removed. Always unplug the unit while removing those covers.
VentilationThe UGALT system requires forced air cooling to operate at a rea-sonable temperature. Do not block the air inlet or exhaust on the back of the unit. Components will fail without this cooling.
LiftingThe UGALT system is heavy; use care when lifting. Two people are recommended for lifting the system. The handles provided are used for lifting. Do not move when system is running.
Line VoltageThe UGALT system is specified for line power of either 110 V / 60 Hz or 220 V / 50 Hz. All the components inside the instrument will only be operated on 24 VDC. Operating at other voltages will damage the components. Two 3 A fuses must be used in the power entry module.
ExhaustAs shipped, the UGALT system exhausts to the atmosphere. If the system is analyzing hazardous gases, the user must make provi-sions to handle the exhaust from the system. A standard 1/4 inch ID Tygon tube connection is provided for this purpose.
Elastomer SealsSilicone has been reported to react adversely and irreversibly with the glass contained in an electron multiplier. Since the UGALT con-tains an electron multiplier, do not use silicone greases or oils on seals; use only hydrocarbon based materials.

Phone: (408)744-9040www.thinkSRS.com
UGALT Series Universal Gas Analyzers Lite
iii
Symbol Description
Alternating current
Caution - risk of electric shock
Frame or chassis terminal
Caution - refer to accompanying documents
Earth (ground) terminal
Battery
Fuse
On (supply)
Off (supply)
Protective bonding terminal
Symbols on SRS products
Stanford Research Systems UGALT Series Universal Gas Analyzers Lite
iv
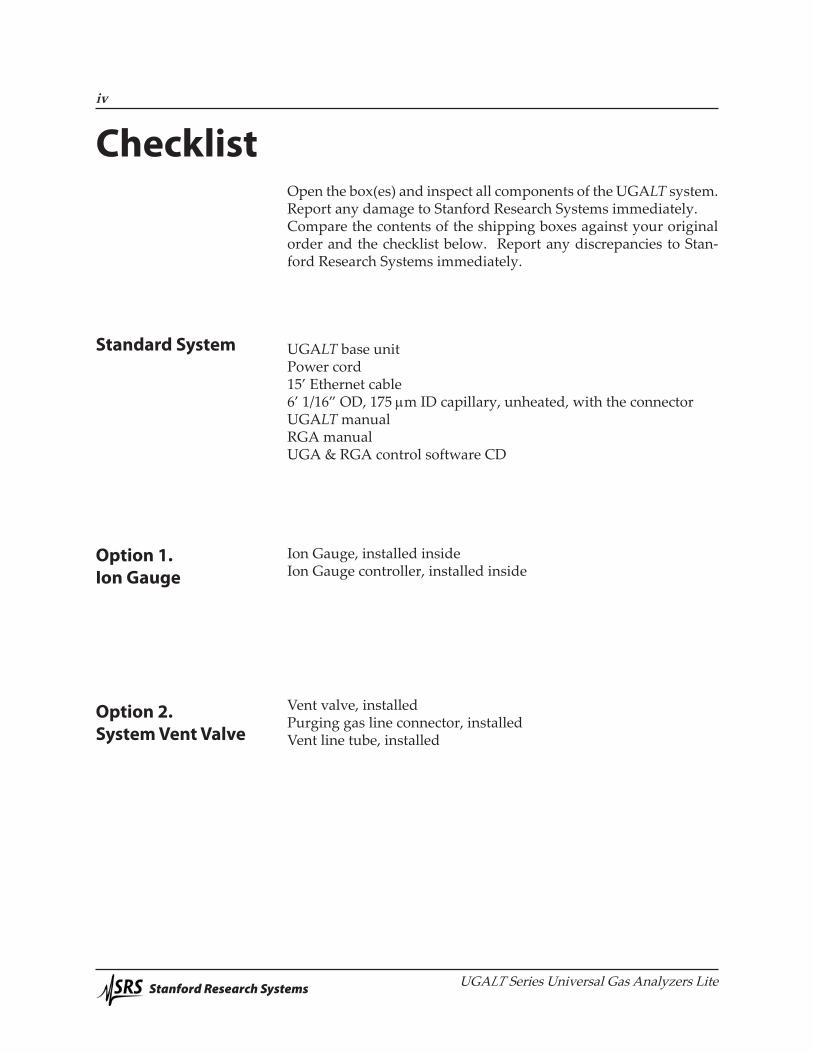
ChecklistOpen the box(es) and inspect all components of the UGALT system.Report any damage to Stanford Research Systems immediately.Compare the contents of the shipping boxes against your original order and the checklist below. Report any discrepancies to Stan-ford Research Systems immediately.
UGALT base unit Power cord15’ Ethernet cable6’ 1/16” OD, 175 mm ID capillary, unheated, with the connectorUGALT manualRGA manualUGA & RGA control software CD
Ion Gauge, installed insideIon Gauge controller, installed inside
Vent valve, installedPurging gas line connector, installedVent line tube, installed
Standard System
Option 1. Ion Gauge
Option 2. System Vent Valve

Phone: (408)744-9040www.thinkSRS.com
UGALT Series Universal Gas Analyzers Lite
v
Materials ListSRS receives many requests for information about corrosion compatibility. It is our policy not to state the compatibility of our system with various corrosive environments. We simply cannot test the myriad combinations of environments that our customers use.
We do provide a list of all the materials exposed to the gas being introduced into the system. Our expectation is that users who need to measure corrosive environments already have some type of system that creates, handles and contains the corrosive gases. Given that they have designed and operate said system, they are the best people to decide the compatibility of the materials in our system with the specific corrosive environment.
The UGALT system contains the following materials:
Body• 304 stainless steel - high vacuum tube • 316 stainless steel - quarter inch tube and fittings• molybdenum - electrical feedthrough• ceramic - electrical feedthrough• AgCuIn - braze material on feedthroughs• alumina - contained in the RGA• aluminum - body of diaphragm pump
Replaceable Components• glass - at an electron multiplier installed in the RGA• chromium - surface of the electron multiplier• IrO2•ThO2 - filament of RGA
Seals• copper - seals in the CF high vacuum flanges• 316SS - major component of VCR® seals• silver - a thin layer on the VCR® seals to prevent gauling• Viton - o-ring seal in the KF flange• buna-N - seal in the high conductivity valve• neoprene - diaphragms in diaphragm pump• Tygon® - connections to diaphragm pump (can be substituted)

Stanford Research Systems UGALT Series Universal Gas Analyzers Lite
vi
Inlet
Type capillary: available in stainless steel, PEEK, and glass lined plasticFlowrate 1 to 10 milliliter per minute at atmospheric pressureResponse time <200 msPressure selectable from 1 x 10⁻² bar to 1 bar Mass Spectrometer
Type quadrupoleDetector Faraday cup (FC) & Electron multiplier (CDEM)Range 1 to 300 atomic mass units (amu)Resolution <0.5 amu at 10% of peak heightDetection limit <10 ppm with Faraday cup detector <1 ppm with electron multiplierOperating pressure 10-4 mbar for FC 10-6 mbar for CDEM Connections
Inlet 1/8 inch Ultra-Torr® fittingExhaust 1/4 inch Tygon tube adapterComputer RS-232C, DB9 connector or EthernetPower 3 pin grounded cable System
Pumps hybrid turbomolecular/drag pump, 81 liter/s, ultimate pressure 2 x 10⁻⁹ mbar diaphragm pump with ultimate pressure less than 1 mbar protection class IP44
Materials (see full materials list for details) construction: SS304 and SS316 insulators: alumina, ceramic seals: Viton and buna-N misc: aluminum, Tygon
Specifications

Phone: (408)744-9040www.thinkSRS.com
UGALT Series Universal Gas Analyzers Lite
vii
General
Startup time 8 minutes from full stop
Max. Ambient Operating 35 °CTemperature
Power requirement either 110 V / 60 Hz or 220 V / 50 Hz (not field selectable) less than 600 W total
Dimensions 28 cm H x 30 cm W x 65 cm D ( 11 in H x 12 in W x 26 in D ) without Handles 33 cm H x 35 cm W x 67.5 cm D (13 in H x 14 in W x 27 in D) with Handles
Weight 36 kg (75 lb. )

Stanford Research Systems UGALT Series Universal Gas Analyzers Lite
viii

Phone: (408)744-9040www.thinkSRS.com
UGALT Series Universal Gas Analyzers Lite
Quick Start ix
Quick Start
Capillaryconnection
This section will describe a quick start procedure for operating the UGALT and getting air analysis data from a remote PC through Ethernet connection. If you find any damage to the UGALT, do not proceed and call SRS at the number below.
For detailed control procedures, please refer to Chapter 2, “Front Panel Operation of UGALT”.
• Pop off the front upper panel by grasping both sides of the panel and pulling up (see photo).

Stanford Research Systems UGALT Series Universal Gas Analyzers Lite
Quick Startx
• Unscrew the Ultra-Torr fitting and remove the pin (see photo). • Keep the pin at the safe place.• Insert your capillary into the Ultra-Torr fitting and tighten. • Replace the panel.
• Insert the UGA/RGA software CD into your PC and follow the prompts to install the UGA and RGA software.
• Power up the UGALT if it is off.
• Setup Ethernet paramters (IP address, Subnet Mask, Gateway, Username, and Password) properly at UGALT. Please refer to the section 2.3.3.1 of this manual for detailed information.
• Connect the provided Ethernet cable between the UGALT and a switch or a router which your PC is connected. If your PC is not connected to Ethernet, then use Serial connection instead (refer to the section 2.3.3.2 of this manual.)
UGALT control through a remote PC
Please note!
You must install the software with administrator account privileges. This is critical for Vista, Windows7 or higher. This program needs the full privilege of writing data.

Phone: (408)744-9040www.thinkSRS.com
UGALT Series Universal Gas Analyzers Lite
Quick Start xi
• Start the UGA software.
The startup window depends on the operating system of the PC. If the software starts with the blank window as shown below, click ‘Main’ menu and select ‘New UGA’ item. (See the following pic-ture.) Then the ‘UGA1’ window will appear. The initial window will be the UGA format. This is fine. It will be changed to UGALT after the successful connection.
• Click the ‘Main’ tab of the UGA software, and select ‘Connection Settings’. The ‘Connection Settings’ dialog box will apper as shown below.
In the ‘Connection Settings’ dialog box, choose the ‘TCP/IP’ tab. Be sure that ‘Enable TCP/IP’ should be marked. Verify that the proper IP resource is checked (as shown below). After the Ethernet param-eters are set properly, the resource should be shown in the list.

Stanford Research Systems UGALT Series Universal Gas Analyzers Lite
Quick Startxii
• Click ‘OK’ button.
• Click on the ‘Main’ tab, and select ‘Connect’. The following ‘Con-nectorDialog’ window will appear. If no instrument name or ID is visible under the connector immediately, hit ‘Update’ button sev-eral times to see the available resource.
• The software will now show available resource(s). Select the ap-propriate Ethernet port and click the ‘Connect’ button. In the exam-ple screenshot above, the UGALT is found on the IP of 172.25.128.14. The instrument is indicated as ‘UGALT’ precisely.
• After the proper port changes status to ‘Connected’ (the icon turns green), close the ‘ConnectorDialog’ window. The title bar of the software indicates the present connection. (See the screenshot in the next page.)
• In the UGA software (see screenshot on the next page), click the green ‘Start’ button (Top right window) to start UGALT and wait until the current status becomes the ready state. (Current Mode in-dicator becomes solid green and the word of ‘Ready’ is shown.) It will take about 8 minutes to reach this state.
In ‘Reading & Operation’ panel at the right bottom sub-window, you can see all kinds of UGALT running data; Pressure, TP, Tem-perature and the statuses of all the items.
If the system fails to reach at the Ready state, please refer to the sec-tion of 2.2.2.4 of this manual.
Phone: (408)744-9040www.thinkSRS.com
UGALT Series Universal Gas Analyzers Lite
Quick Start xiii
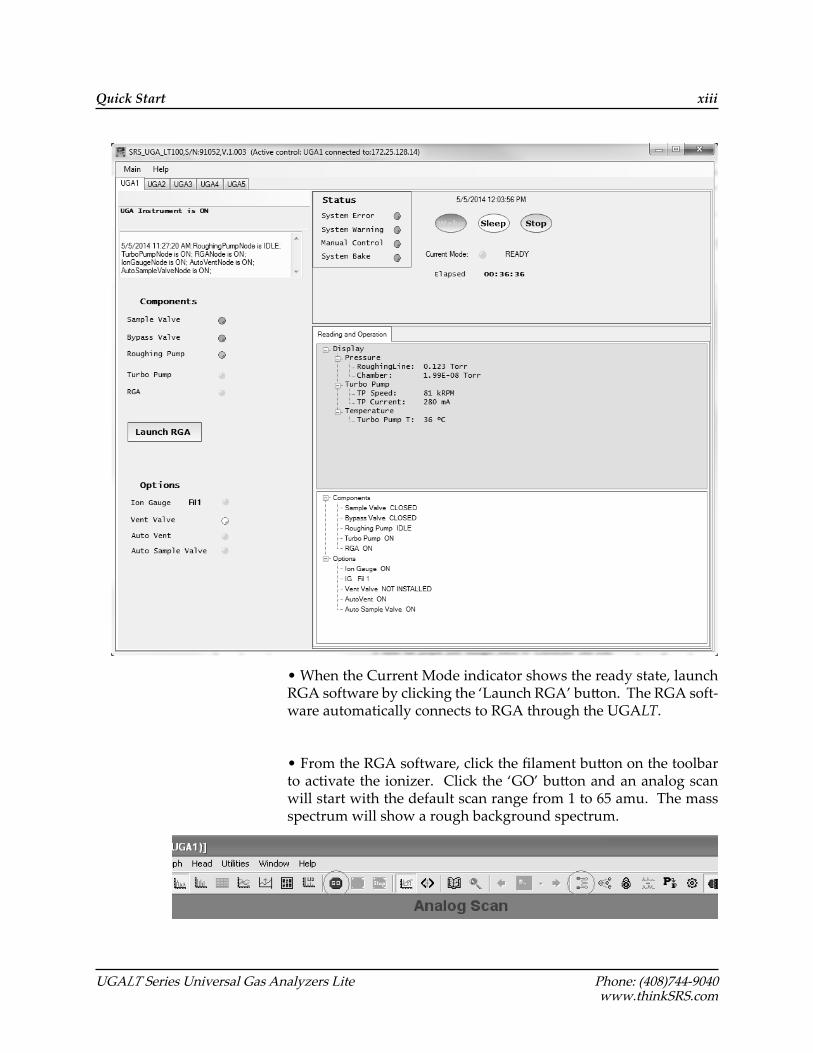
• When the Current Mode indicator shows the ready state, launch RGA software by clicking the ‘Launch RGA’ button. The RGA soft-ware automatically connects to RGA through the UGALT.
• From the RGA software, click the filament button on the toolbar to activate the ionizer. Click the ‘GO’ button and an analog scan will start with the default scan range from 1 to 65 amu. The mass spectrum will show a rough background spectrum.
StartAnalogScan
Stanford Research Systems UGALT Series Universal Gas Analyzers Lite
Quick Startxiv
• Stop the scan.
• If you plan to sample atmospheric pressure, be sure you followed the directions under the previous section, “Capillary Connection”.
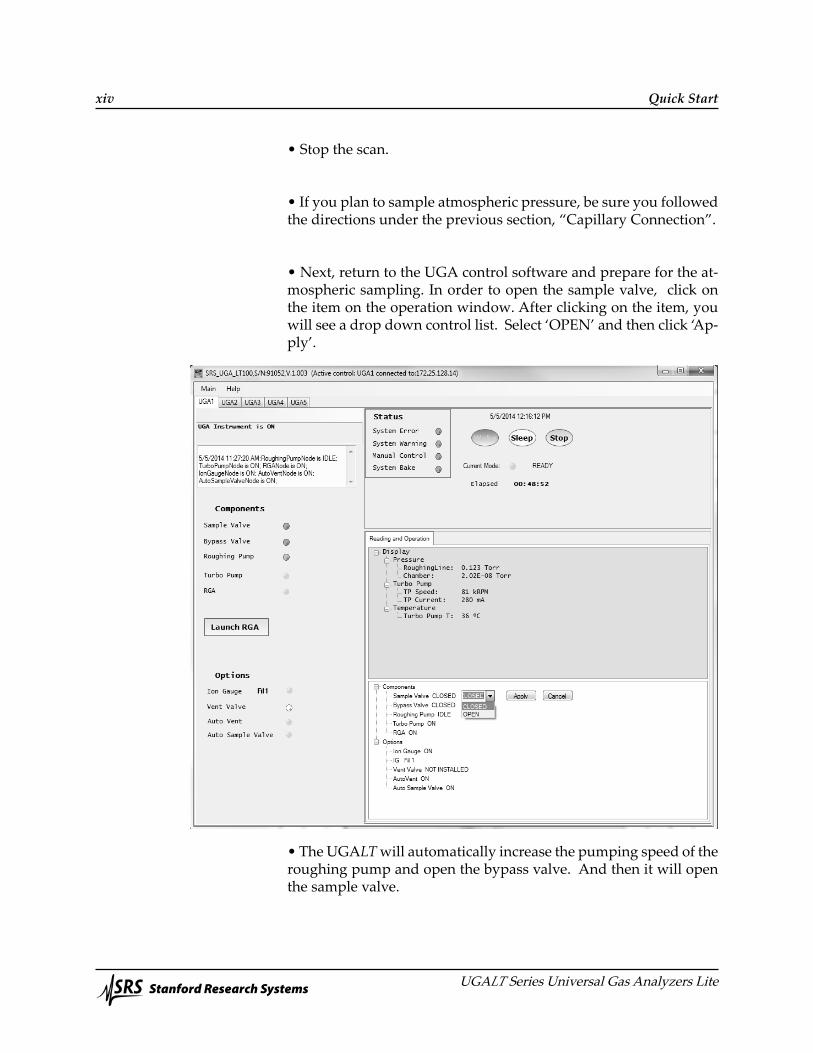
• Next, return to the UGA control software and prepare for the at-mospheric sampling. In order to open the sample valve, click on the item on the operation window. After clicking on the item, you will see a drop down control list. Select ‘OPEN’ and then click ‘Ap-ply’.
• The UGALT will automatically increase the pumping speed of the roughing pump and open the bypass valve. And then it will open the sample valve.

Phone: (408)744-9040www.thinkSRS.com
UGALT Series Universal Gas Analyzers Lite
Quick Start xv
• The system will read approximately 1.0 Torr at the roughing line, and if the Option 2 is installed the ion gauge will read about 5 X 10-
6 Torr for the mass spectrometer chamber if you use the provided 6’ capillary.
• In the RGA software, start scan again by clicking the ‘GO’ but-ton.
• The spectrum of air will be displayed, which can be compared to the example below.

Stanford Research Systems UGALT Series Universal Gas Analyzers Lite
Quick Startxvi
1 – 1
Chapter 1
UGALT Basics
In This Chapter This chapter gives the user the necessary infor-mation for using the Universal Gas Analyzer Lite (UGALT) series.
1.1 Introduction . . . . . . . . . . . . . . . . 1–21.2 Configuration . . . . . . . . . . . . . . . 1–6 Front panel . . . . . . . . . . . . . . . 1–6 Rear panel . . . . . . . . . . . . . . . . 1–7 Top front components . . . . . . . . . 1–8 Top back components . . . . . . . . . 1–9 Bottom components . . . . . . . . . . 1–10 Covers . . . . . . . . . . . . . . . . . . 1–11 Miscellaneous parts . . . . . . . . . . 1–111.3 Options . . . . . . . . . . . . . . . . . . . 1–12 Ion Gauge option . . . . . . . . . . . 1–12 Vacuum purging vent valve option . 1–12

Stanford Research Systems UGALT Series Universal Gas Analyzers Lite
UGALT Basics1 – �
1.1 Introduction
Universal Gas Analyzer Lite(UGALT) series instruments are mod-ern mass spectrometers designed for the analysis of atmospheric gas samples. The three systems, 100, 200 and 300, differ only in the mass range they can detect. A quadrupole mass spectrometer (also called a residual gas analyzer or RGA) performs the task of analyz-ing the gas.
The spectrometer operates at high vacuum and therefore, pumps are required to draw the gas out of the instrument and maintain the vacuum. A turbomolecular pump (TP) is commonly used to generate the high vacuum region (<10-5 Torr) required to operate the ionizer and quadrupole. The inlet continuously samples gases at low flow rate (several milliliters per minute) making the instru-ment ideal for on-line analysis. Not only is data acquired continu-ously (as opposed to batch sampling employed by gas chromato-graphs) but also very quickly. A change in composition at the inlet can be detected in about 0.2 second. The system allows data to be collected quickly - a complete spectrum can be acquired in under one minute and individual masses can be measured at rates up to 25 ms per point.
The SRS UGALT systems enable many new applications where traditional mass spectrometers were too large and heavy. More recently, a variety of applications for atmospheric sampling were developed including fuel cell research, Freon detection, specialty gas production monitoring, fermentation process monitoring, and catalysis studies.
To accommodate atmospheric sampling, a pressure reduction scheme is required. A two-stage pressure reducing inlet samples gases at high pressure - from atmospheric pressure to a few Torr at the first stage and then to a mass spectrometer operating pres-sure (about 10-6 Torr) at the second stage. In order to achieve this performance, most commercially available systems employ a capil-lary tube, pinhole, high vacuum pump (generally TP), and single backing pump. The single backing pump performs double duty, evacuating a bypass line (the first stage) and backing the TP (the second stage). Because of this architecture, the bypass flow is re-combined with the sample flow at the rouging pump. This charac-ter draws special cautions to introduce atmospheric sample gases. The inlet gas pressure is measured using a Pirani gauge all the time. If the pressure of the backing line is above 10 Torr for more than 2 seconds, then the system will be shut down automatically, which

Phone: (408)744-9040www.thinkSRS.com
UGALT Series Universal Gas Analyzers Lite
UGALT Basics 1 – �
prevent the long time pressure shock to the running TP. And this character allows backstreaming through the TP, which shows some limitations to the applications of UGALT systems. The backstream-ing can cause real problems for users checking the changes of low molecular weight gases (e.g. hydrogen, helium) of sample to sam-ple. When high concentrations of corrosive gases are used, this backstreaming pathway also allows a fraction of the corrosive gas to reach the RGA and TP. Exposure to corrosives can dramatically shorten the usable life of the RGA filament and the TP. In these cases, it is better to use SRS UGA systems.
The UGALT systems can be considered as two main subsystems: gas handling and the analyzer. The analyzer is the quadrupole mass spectrometer, which can only operate in high vacuum. The class of quadrupole mass spectrometer employed belongs to a class referred to as residual gas analyzers (RGA). These spectrometers specialize in large dynamic range measurements of light gases. The gas handling system consists of a pump and valves that deliver the sample gas to the analyzer. The UGALT employs single diaphragm pump (DP) for both subsystems. (see figure 1-1)
Figure 1-1. UGALT Schematic

Stanford Research Systems UGALT Series Universal Gas Analyzers Lite
UGALT Basics1 – �
In UGALT systems, an atmospheric pressure gas sample is drawn through a capillary (6 ft of 175 mm ID) which drops the pressure by 3 decades. A small amount of gas sample is drawn by the TP through a pinhole (40 mm) which reduces the pressure to about 10-6 Torr, while most of the inlet gas (about 99.9%) flows directly to the roughing DP.
UGALT systems are also simple to operate and maintain. The en-tire system is under microprocessor control to ensure ideal opera-tion of all pumps and valves. All the components can be controlled from both front-panel and a remote computer. The user can control all the pumps and valves from the front panel using the menu. A convenient display allows menu-driven operation. A Pirani gauge, and an ion gauge (if the option 1 is installed) monitor the status of the system continuously and this data is available on the front panel. The well designed control allows the system to automate the pump down procedure and to implement interlocks for unattend-ed fail-safe operation. This CPU handles all the data flow between the Auxiliary PCB, Ion gauge control PCB (if Option 1 installed), TP driver, and RGA to itself and also to a PC.
The RGA chamber is a six-way cross with 2-3/4” conflat flanges. One port is assigned for a user to use the built-in capillary pressure reduction system to sample atmospheric pressures. Three extra ports are available for direct connection to various gas sampling of customer-designed applications; for example, a direct connection of a leak valve. Some ultra high vacuum and ultra clean chambers cannot tolerate venting with ambient air because of the water vapor present. An optional valve allows venting with dried nitrogen or other gas supply. Windows software controls the UGALT and the RGA, graphically displays the data, and provides analysis.
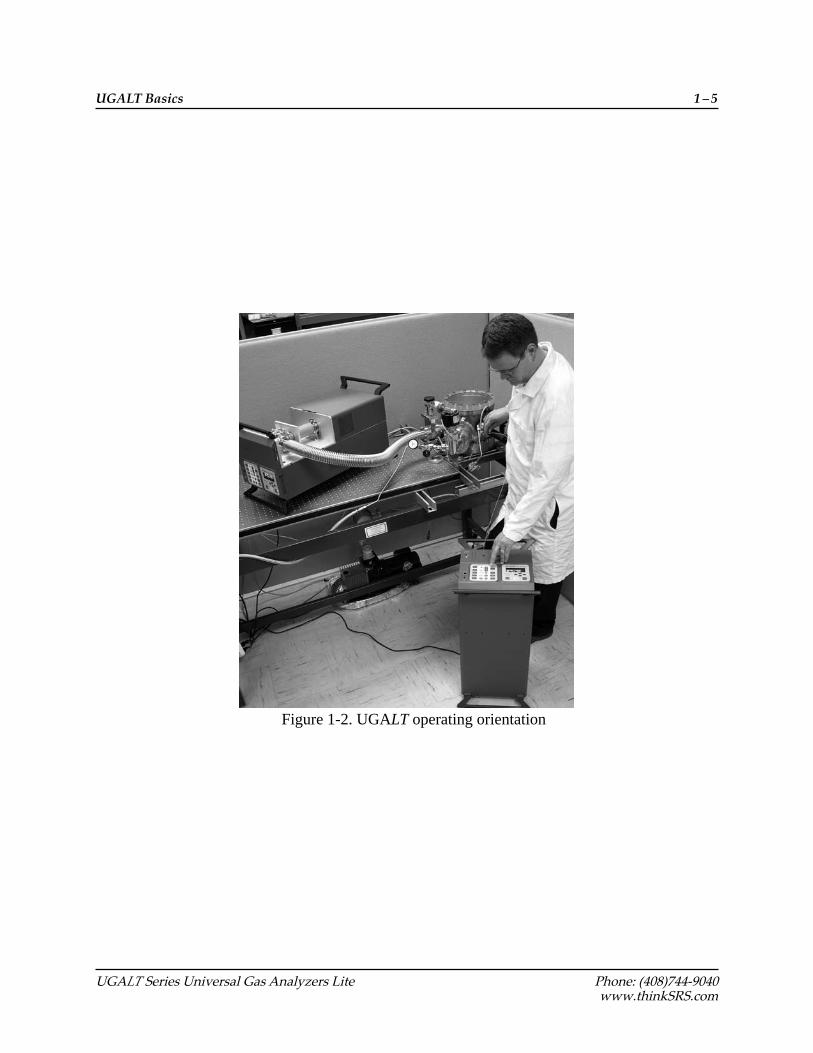
The UGALT is designed to be compact. All the components – one diaphragm pump, one turbo-molecular pump, the chamber, the RGA, two gauges (one is an option), two solenoid valves, and a power supply – fit inside an enclosure of 12”(W) X 11”(H) X 25”(L). The system is designed to run in either horizontal or vertical ori-entation (See figure 1-2). This flexibility in the operating orienta-tion means it can fit almost anywhere, even in space constrained labs. For the vertical orientation, a right angle power cord is recom-mended, which is not supplied from SRS. (A user should buy the cord: ex. Digi-Key AE9887-ND)
Phone: (408)744-9040www.thinkSRS.com
UGALT Series Universal Gas Analyzers Lite
UGALT Basics 1 – �
Figure 1-2. UGALT operating orientation

Stanford Research Systems UGALT Series Universal Gas Analyzers Lite
UGALT Basics1 – �
There are two front panels on the UGALT: the upper panel and the lower panel. The upper panel has a hole for capillary connection. The lower panel holds two pads; one for component indicators and the other for the control, along with one RJ45 Ethernet connector and an RS232 serial connector. (Fig. 1-3)
1.2 Configuration
1.2.1 Front Panel
Figure 1-3. Front Panels

Phone: (408)744-9040www.thinkSRS.com
UGALT Series Universal Gas Analyzers Lite
UGALT Basics 1 – �
On the rear panel (also in two parts), there are a main power AC socket, an electrical ground knob, and a fan for the power distribu-tion PCB on the rear upper panel. There are one BNC connector for a user interlock. One exhaust port for the Roughing pump is also provided. If Option #2 is included, a port for the vent gas for the vacuum chamber is also available. (Fig. 1-4)
1.2.2 Rear Panel
Figure 1-4. Rear Panels

Stanford Research Systems UGALT Series Universal Gas Analyzers Lite
UGALT Basics1 – �
In Fig. 1-5, the main chamber is shown. It consists of a sample line set, a cubic chamber, and an RGA analyzer. The sample line set is composed of 1/8”-UltraTorr connector, sample valve (SV), 40 mm pinhole port, bypass valve (BV), and bypass line. The sample line set and the RGA analyzer connect at a 2.75” cubic chamber as shown in Fig. 1-5.
1.2.3 Top Front Components
Figure 1-5. Top Front Components

Phone: (408)744-9040www.thinkSRS.com
UGALT Series Universal Gas Analyzers Lite
UGALT Basics 1 – �
This area contains all the power supply related components: RGA ECU, a main power supply, and a power distribution PCB. (Fig. 1-6)
1.2.4 Top Rear Components
Power Distribution PCB
Main PS
RGA ECU
Figure 1-6. Components configuration at top rear

Stanford Research Systems UGALT Series Universal Gas Analyzers Lite
UGALT Basics1 – 10
This volume houses vacuum control and system control consisting of TP connection elbow, TP, Diaphragm pump for the bypass line & TP backing (RP), Pirani gauge (PG), Ion gauge (IG; if Option 1 installed), roughing line & part of bypass line, Main control PCB, Auxiliary control PCB, Ion gauge control PCB (if Option 1 installed), TP control PCB, a speaker, and a TP cooling fan. (Fig. 1-7a)
If Option #2 is ordered, a venting valve is shown connected to the TP near the fan. See figure 1-7b. PVC tubes are used to connect exhaust line and the system venting line.
1.2.5 Bottom Components
Figure 1-7a. Bottom view of UGALT - component configuration
Figure 1-7b. Detailed view of the TP vent valve configuration
TP
RP
IG

Phone: (408)744-9040www.thinkSRS.com
UGALT Series Universal Gas Analyzers Lite
UGALT Basics 1 – 11
There are 3 covers; Top front cover, Top back cover, and Bottom cover. (Fig. 1-8a, 8b, 8c)
A 6’ capillary of 175 mm ID and 1/16” OD is provided for atmo-spheric pressure sampling. A 15’ long Ethernet cable, a power cord, one sample inlet plugs, UGALT manual, RGA manual, and the control software CD are also included.
1.2.6 Covers
1.2.7 Miscellaneous parts
Figure 1-8a. Top front cover Figure 1-8b. Top rear cover
Figure 1-8c. Bottom cover

Stanford Research Systems UGALT Series Universal Gas Analyzers Lite
UGALT Basics1 – 1�
There are two system options for the UGALT. - Ion Gauge (IG) option (Option #1), and - Vacuum purging vent valve option (Option #2)
All these options should be ordered at the time of the purchasing.
Parts :
Ion gauge Ion gauge controller Ion gauge controller holder Control cordPower line Signal cord
The ion gauge and its controller is installed inside the UGALT. All the related cords are also connected before the shipment. (See Fig. 1-7a)
Parts :
Vent valvePurge gas line connector Vent line tube
The vent valve is installed on the Turbo molecular pump. (See Fig. 1-7b.) The main controller board controls the function of this valve. The purge gas line should be connected at the rear lower panel be-fore the vent valve is used.
1.3 Options
1.3.1 Option #1. Ion Gauge (IG) option
1.3.2 Option #2. Vacuum purging vent valve option

2– �
Chapter 2
Guide to OperationIn This Chapter This chapter gives the user detailed information on
controlling the UGALT (Universal Gas Analyzer Lite) Series.
2.� Introduction . . . . . . . . . . . . . . . . 2–3
2.2 Front Panel Operation. . . . . . . . . . . 2–3 Keypads . . . . . . . . . . . . . . . . . . 2–3 Status Keypad . . . . . . . . . . . . . 2–3 Control Keypad. . . . . . . . . . . . . 2–4 Front Panel Menu System . . . . . . . . 2–7 Entering Menu System. . . . . . . . . 2–7 Menu Navigation. . . . . . . . . . . . 2–7 Automatic versus Manual . . . . . . . 2–8 Manual Pump-Down Procedure . . . 2–8 Base pressures . . . . . . . . . . . . . 2–9 Manual Venting Procedure . . . . . . 2–�0 Manual Sleeping Procedure . . . . . . 2–�� Options Operation . . . . . . . . . . . . 2–�� Ion Gauge . . . . . . . . . . . . . . . . 2–�� Vent Valve . . . . . . . . . . . . . . . . 2–�� Advanced Operation . . . . . . . . . . . 2–�2 Interlocks . . . . . . . . . . . . . . . . 2–�2 User Interlock Input . . . . . . . . . . 2–�3 Diaphragm Pump Tuning. . . . . . . . . 2–�3 Auto Sample Valve . . . . . . . . . . . 2–�3 Auto Vent Valve . . . . . . . . . . . . 2–�4

Stanford Research Systems UGALT Series Universal Gas Analyzers Lite
Guide to Operation2 – 2
2.3 Remote Operation . . . . . . . . . . . . . 2–�4 Overview . . . . . . . . . . . . . . . . . 2–�4 Communication . . . . . . . . . . . . . 2–�5 Connection to a PC . . . . . . . . . . . 2–�6 TCP/IP Connection . . . . . . . . . . 2–�6 RS232 Serial Connection . . . . . . . 2–23 Menus and Displays . . . . . . . . . . 2–26 Launching RGA Software . . . . . . . 2–34 Option Operation . . . . . . . . . . . . 2–39 Ion gauge . . . . . . . . . . . . . . . . 2–39 Vent Valve . . . . . . . . . . . . . . . . 2–40

2.1 Introduction
2.2 Front Panel Operation
2.2.1 Keypads
2.2.1.1 Status Keypad
The UGALT can be in one of four modes (4 states): STOP(OFF), READY, IDLE, and INDIVIDUAL.
Each state can be reached from the other state The UGALT can be stopped from any condition. The stop command is handled on an emergency basis.
When the system is at vacuum sufficient to support RGA operation, we refer to the state of the system as the “Ready” state. Careful con-trol of the UGALT is required to get to the Ready state safely. This is achieved with proper vacuum control. After the system is in the Ready state, it can perform the function of analyzing gas; running the RGA and collecting data. The UGALT allows automatic control and individual control. Automatic control means that the UGALT will perform the pre-designed sequences to reach the requested state: Ready state by pushing “START/WAKE” button, Idle state by pushing “SLEEP” button, OFF state by pushing “STOP” button. Individual control means that each component of the UGALT can be controlled individually by pushing a component button. These two control modes are easily interchangeable. For the detailed op-erational schematics, refer to Appendix B, the state diagram.
The left-hand pad on the front lower panel of the instrument in-dicates the status of the instrument. It is a flow diagram showing which components are active at any given time. We will refer to this keypad as the “status keypad”.
This keypad shows the status of components by illuminating LED’s. When a component is in the process of changing state, the LED will blink while the UGALT microprocessor verifies it is safe to actuate the component.
Phone: (408)744-9040www.thinkSRS.com
UGA Series Universal Gas Analyzers
Guide to Operation 2 – �

Stanford Research Systems UGALT Series Universal Gas Analyzers Lite
Guide to Operation2 – �
Fig. 2-�. The Status Pad
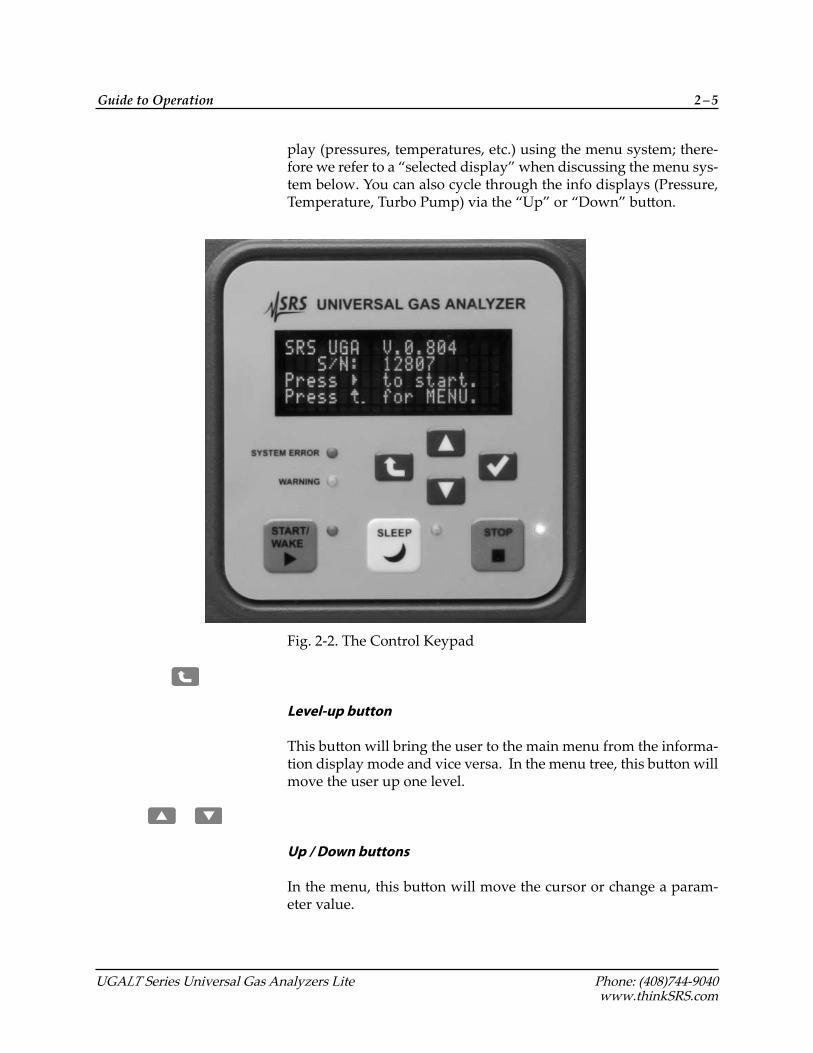
The right-hand pad on the front lower panel of the instrument has a display and buttons to display the status or to control the instru-ment. We will refer to this keypad as the “control keypad”. Any change to the state of the UGALT must be made using this keypad. No changes will occur until the user pushes the enter key or auto control buttons on the control keypad. The control keypad has sev-eral components; each is briefly defined below.
Display device
The display serves two functions. It presents system information, and allows the user to enter menu driven commands. The default function is the information display. You can select a different dis-
2.2.1.2 Control Keypad
Phone: (408)744-9040www.thinkSRS.com
UGALT Series Universal Gas Analyzers Lite
Guide to Operation 2 – �
play (pressures, temperatures, etc.) using the menu system; there-fore we refer to a “selected display” when discussing the menu sys-tem below. You can also cycle through the info displays (Pressure, Temperature, Turbo Pump) via the “Up” or “Down” button.
Fig. 2-2. The Control Keypad
Level-up button
This button will bring the user to the main menu from the informa-tion display mode and vice versa. In the menu tree, this button will move the user up one level.
Up / Down buttons In the menu, this button will move the cursor or change a param-eter value.

Stanford Research Systems UGALT Series Universal Gas Analyzers Lite
Guide to Operation2 – �
Enter button
In the menu, this button confirms the selection of a state, a param-eter, or a submenu item.
System Error LED
This red LED will be lit when the system has a fatal error. An ac-companying error message is shown on the display. A fatal error refers to an error condition that is preventing the UGALT from con-tinuing to operate. Operation cannot continue until the error is cor-rected.
Warning LED
This yellow LED will blink when the system has a warning error and the error message is shown on the display for 4 seconds. The warning error means the unit can not process a command due to the restrictions of the process, a command syntax error, or no com-ponent installed. Because the warning does not affect the perfor-mance of the UGALT, there is no error correction needed.
Start / Wake
When the green button is pushed, the green LED beside the button will blink. The UGALT will perform an automated pumping-down procedure to reach the Ready state. At the end of the sequence, this LED will stop flashing and remain lit.
Sleep
Pushing this button will put the system in an idle state. This state consumes less power and prolongs the useful life of the pumps.
Stop
Pushing this button will cause the UGALT to automatically turn off all components as quickly as possible.

Phone: (408)744-9040www.thinkSRS.com
UGALT Series Universal Gas Analyzers Lite
Guide to Operation 2 – �
2.2.2 Front-Panel Menu System
2.2.2.1 Entering the Menu System
2.2.2.2 Menu Navigation
You can toggle between the menu system and the selected display using the “Level-up” button. To enter the menu system, push the “Level-up” button on the control keypad. To leave the menu sys-tem, push the “Level-up” button again from the top menu. Whenever the user makes a change from the control menu, the dis-play changes from the menu system to the selected display. From non-control menus, the user must hit the “Level-up” button repeat-edly to return to the selected display as shown in the following drawing.
The UGALT menus are navigated by moving a diamond-shaped cursor with the arrow keys on the control keypad. The UGALT menu system indicates you are at the bottom of a menu by putting the cursor at the last visible menu item. Likewise, the top of a menu is indicated by locating the cursor at the first visible menu item. Use the control pad arrow keys to scroll through menu items.
Stanford Research Systems UGALT Series Universal Gas Analyzers Lite
Guide to Operation2 – �
At the end of each menu tree branch is a setting change. The UGALT indicates a setting change menu by showing the current state with an asterisk (*). To change the state, move the cursor to the desired state and push the “Enter” key. The detailed menu tree is summa-rized in Appendix A.
For most day-to-day operations, use of the automatic pump-down and venting functions is adequate. For times in which an automat-ed procedure is not desirable, a manual procedure is given below, along with the key presses required for quick operation. Note that any automatic procedure will stop if you make a change to the sys-tem while the procedure is running. Also note that you can start (or re-start) an automatic procedure at any time.
Note that this procedure can be accomplished automatically simply by pressing the green “Start/Wake” button on the control keypad.
�. Enter the UGALT menu system (push the “Level-up” button on the control keypad).2. Enter the Display menu and select Pressure.3. Back to the menu by pushing the “Level-up” button and then choose “CONTROL”.4. Select the “Roughing Pump” item in the menu.5. Turn on the Roughing Pump (RP) by selecting “ON”. (you will automatically be returned to the control menu).6.* Wait till the RP indicator becomes solid lit. (This means the RP pressure is below 5 Torr.); this usually occurs within two minutes. If the condition is not met after two minutes, the error LED is lit, an error message appears, and the system is turned off. This indicates a leak in the system. 7. Select the “Bypass Valve” item in menu.8. Open the Bypass Valve (BV). 9. Wait until BV indicator becomes solid lit.�0. Check the RP pressure (read from a Pirani gauge) is below 5 Torr by moving up to the display mode. Note if this con- dition is not achieved within 5 minutes, the error LED is lit, an error message appears, and the system is turned off. This indicates a leak in the system. ��. Back to the control menu and select the “Turbo Pump” item.
2.2.2.3 Automatic versus Manual
2.2.2.4 Manual Pump Down Procedure

Phone: (408)744-9040www.thinkSRS.com
UGALT Series Universal Gas Analyzers Lite
Guide to Operation 2 – �
2.2.2.5 Base Pressures
�2. Turn on the Tubormolecular Pump (TP) with the control keypad. The TP speed can be checked in the TP display. Push the up or down arrow button to see the TP information during the pressure display.�3. Watch the turbo pump speed on the TP display. Wait until the TP reaches full speed (8� kRPM). Note if this condition is not met after �0 minutes, the error LED is lit, an error message appears, and the system is turned off. This indicates a leak in the system. �4. Select the “Bypass Valve” item in the control menu.�5. Close the Bypass Valve (BV) with the control keypad.�6. Select the “RGA” item in the control menu.�7. Turn on the RGA with the control keypad.�8. Wait for 2 minutes to turn on the ion gauge (IG), if Option #� is installed. If not, move to the step #2�.�9. Select the “Ion Gauge” item in the control menu.20.** Turn on the ion gauge (IG) with the control keypad.2�. At this point it is safe to put the roughing pump in idle mode. This prolongs pump life. Select the “Roughing Pump” item in the control menu. 22. Change RP to the idle state with the control keypad.
* At the step 6, sometimes UGALT gives the error �02 (RP too high) when the system is turned on for the first time or turned on after a long turning off period. This happens usually in humid environ-ment. In this case, the longer RP pumping period at the start is re-quired. In the control menu, go to ‘Pressure Interlock’ menu. Make this off. And repeat the procedure up to the step 10 and wait till RP goes down to below � Torr or for a couple of hours. If this doesn’t happen in an hour, the error is real. Please check the leak.
** At the step 20, sometimes UGALT gives the error �05 (IG too high) when the system is turned on for the first time or turned on after a long turning off period. Do the same things written above. If this does not solve the problem, the error is real. Please check the leak or TP performance.
Once the system is pumped down, these approximate base pres-sures should be realized under the given conditions. Note that if lower base pressures are required, baking may be necessary.

Stanford Research Systems UGALT Series Universal Gas Analyzers Lite
Guide to Operation2 – 10
UGA Settings Case Pressure ranges
RP idleTP full speedIG on (if Option#� in)RGA on
General Ready state
PG : < �.5 TorrIG : < �.0 x �0-6 Torr
RP idleTP full speedIG on (if Option#� in)RGA onBV openSV open6’ �75 mm ID capillary attached
Atmospheric gas intake
PG : < �.5 TorrIG : 5.0 ~ 8.0 x �0-6 Torr
Note that this procedure can be accomplished automatically sim-ply by pushing the red “Stop” button on the control keypad. This procedure assumes the UGALT is currently sampling atmospheric pressures.
�. Select the “Sample Valve” (SV) item in the control menu.2. Close the SV with the control keypad.3. Select the “Bypass Valve” (BV) item in the control menu.4. Close the BV with the control keypad.5. Select the “RGA” item in the control menu.6. Turn off the RGA with the control keypad.7. Select the “Ion Gauge” (IG) item in the control menu, if Option #� is installed. If not, move to the step #9.8. Turn off the IG with the control keypad.9. Select the “Turbo Pump” (TP) item in the control menu.10. Turn off the TP with the control keypad.��. Wait for two minutes to allow the TP to spin down.�2. Select the “Roughing Pump” (RP) item on the Control menu.13. Turn off the RP with the control keypad.
If the vent valve option is installed, the vent valve will be open when the RP is off. If not, wait until the TP stops completely to open the chamber.
2.2.2.6 Manual Venting Procedure
Phone: (408)744-9040www.thinkSRS.com
UGALT Series Universal Gas Analyzers Lite
Guide to Operation 2 – 11
2.2.2.7 Manual Sleeping Procedure
2.2.3 Options Operation
2.2.3.1 Ion gauge
2.2.3.2 Vent Valve
Note that this procedure can be accomplished automatically simply by pushing the yellow “Sleep” button on the control keypad. This procedure assumes the UGALT is currently sampling atmospheric pressures.
�. Select the “Sample Valve” (SV) item in the control menu.2. Close the SV with the control keypad.3. Select the “Bypass Valve” (BV) item in the control menu.4. Close the BV with the control keypad.5. Select the “RGA” item in the control menu.6. Turn off the RGA with the control keypad. (If the stability of RGA is concerned, the user can let the filament of RGA on during idling. The user may skip these RGA steps.)7. Select the “Ion Gauge” (IG) item in the control menu, if Option #� is installed. If not, move to the step #9.8. Turn off the IG with the control keypad.9. Select the “Turbo Pump” (TP) item in the control menu.�0. Set idle for the TP with the control keypad.��. Wait till the TP spins down to 66 kRPM.�2. Select the “Roughing Pump” (RP) item in the control menu.�3. Set the RP idle with the control keypad.
In order to get the ready state from the idle state (WAKE), sim-ply turn on the TP as stated in the manual pump-down procedure above and turn on the RGA and the IG, if Option #� is installed.
When the ion gauge is installed, its operation is controlled by the main CPU of UGALT. The reading is shown on the display at the control pad.
In the control menu, select the “Roughing Pump” item. The last item is the vent valve. Select it and choose “Close” or “Open” as desired.

Stanford Research Systems UGALT Series Universal Gas Analyzers Lite
Guide to Operation2 – 12
When “Open” is selected, the UGALT will open the valve for � sec-ond, then closes the valve. After 40 seconds, the UGALT will open it again for a minute to vent the system. After the one minute peri-od, the valve closes again. By doing this, the TP will stop smoothly without a pressure shock.
The UGALT has several interlocks to protect the instrument. There are interlocks tied to pressure and temperature. For example, the TP cannot be turned on until the roughing line pressure is low enough. If the TP temperature reading is above 60 oC, the UGALT shuts down the turbo pump and other components to reach a safe state. The following table summaries the interlocks used.
As can be seen in the table, PG reading is critical for UGALT opera-tion. If this gauge is malfunctioning, the UGALT is not operable. If an interlock activates, an error message is produced. For a list of all UGALT error messages, please refer to the chapter 4.
InterlocksAction ConditionsBV close PG reading above �.5 Torr with
SV closedRP off PG reading above 5 Torr TP off PG reading above �.5 Torr, TP
temperature reading above 60 oCIG off IG reading above 2.�x�0-5 Torr SV close PG reading above 2.5 Torr with
SV on
There are several other operational restrictions for control of the components. For example, the RGA cannot be on when TP is not at full speed. When the status of a component is set to change, the UGALT checks the present conditions to determine whether the ac-tion would be allowed. If an action is disallowed, a warning mes-sage is generated and the warning LED will blink for 4 seconds.
2.2.4 Advanced Operation
2.2.4.1 Interlocks

Phone: (408)744-9040www.thinkSRS.com
UGALT Series Universal Gas Analyzers Lite
Guide to Operation 2 – 1�
2.2.4.2 User Interlock input
2.2.4.3 Diaphragm Pump Tuning
2.2.4.4 Auto Sample Valve
Detailed explanations of all the warnings are listed in the chapter 4 in this manual.
The pressure interlocks listed above are in place to maintain safe operation of the UGALT. Under certain conditions, users may desire to defeat the pressure interlocks. Enter the UGALT main menu system and navigate to “Controls”>“Pressure Interlock”. Se-lect “Off” and press the enter key. Only manual control is possible while the pressure interlocks are defeated. Running the UGALT with its interlocks defeated can damage the UGALT. Only experts should attempt to run with the interlocks defeated.
A BNC connector on the rear lower panel allows a user-defined interlock. It behaves as an emergency shut down switch when it receives a TTL low signal. In any state of the UGALT, it stops the system completely. By using this BNC connection with a user’s ex-ternal equipment, the UGALT can be safely shut down if an emer-gency occurs.
SRS has already set default values for the power consumed by the diaphragm pump. These levels are a good overall compromise be-tween conserving pump life and maintaining good vacuum. Ad-vanced users may wish to change the level of power consumed by the pump. To tune the power level used by the pump in idle, navi-gate to the pump tuning menu, select the level with the arrow keys and press the enter key. This function work whether the pump in on, idle, or off.
If the Auto sample valve option is set to be on, the sample valve state controls all the components of the sample line. When the user opens the sample valve, the system does everything necessary to reach a state in which the valve may be opened. This may require
Stanford Research Systems UGALT Series Universal Gas Analyzers Lite
Guide to Operation2 – 1�
boost up the roughing pump from the idle speed to the full speed, and opening the bypass valve before opening the sample valve. When the sample valve is closed, the system closes the sample valve, but also closes the bypass valve and change the roughing pump to the idle state. The default setup is on. One can change the setting using the Sample Valve menu. Select the Sample Valve item in the control menu. Then choose “Auto Sample Valve” item. The UGA control software also controls this option.
If the Auto vent valve option is set to be on, the TP vent valve will open whenever the RP stops. This happens automatically as part of the stopping procedure. Sometimes users do not want this auto-matic behavior and would like to handle the vent valve manually. In this case, the Auto vent valve option should be set to be off. The RP item in the Control menu has an access to the vent valve control. The default is on. The UGA control software also controls this op-tion.
The software controls the whole UGALT system and provides many data acquisition modes, which should fulfill the needs of most us-ers. This user manual discusses those aspects of the instrument that are relevant to controls of UGALT and data acquisition from the RGA.
A full featured software application included with the instrument provides an intuitive graphical user interface to the controls (See figure 2-3). All pumps and valves can be controlled within the soft-ware. Every operation that takes place (valve open or close, pumps turned on or off, etc.) is logged as a time stamped “event” by the software. The event log is stored as a file on the PC hard drive. This log can be very useful for troubleshooting: if a user finds the UGALT’s interlocks activated while he was away, the event log will show what gauge registered an overpressure and when. This al-lows the user to track exactly where a problem began instead of guessing what went wrong. This can save hours of time in debug-ging a vacuum process.
2.2.4.5 Auto Vent Valve
2.3 Remote Operation
2.3.1 Overview
Phone: (408)744-9040www.thinkSRS.com
UGALT Series Universal Gas Analyzers Lite
Guide to Operation 2 – 1�
2.3.2 Communications
In order to obtain RGA data, the UGALT needs to be connected to a PC. This means that even though the system can be operated from the front panel, RGA software will be used to analyze the gas sample. SRS provides UGA control software and RGA software to operate the system and also to handle the analysis. By install-ing these applications, a user can control the experiment remotely. Generally, the software mimics the front panel controls; there are auto control and individual control modes. It also displays system status. The UGA/RGA software is a Windows based application which runs on a PC running at least Windows 2000 as the OS with 256M bytes system memory. The UGA software supports both RS-232 and Ethernet remote interfaces.
The UGA control software also controls UGALT instrument.
In this section, software installation, communication and operation will be explained in detail. The RGA software will be discussed separately in the last section of this chapter. The programs are shipped on a CD. A user can also download the programs from the SRS website at www.thinksrs.com. (Make sure to install the software with administrator account privileges.)
Installation of UGA & RGA control software
�. Insert the provided CD into the CD driver. The setup program for UGA control software will be launched automatically. If not, explore the CD and double click the file ‘UGASetup.exe’.2. Follow the prompts to install UGA control software. The default directory for the installation is C:\Program files\ SRS\UGA. You may change the installation directory during this process, but SRS recommends using the default directory.3. At the end of the installation of UGA control software, the installer will ask to continue RGA software installation. Click ‘YES’ to continue. 4. Select or double click ‘UGAControlApp.exe’. You should see the screen below. (Fig. 2-3) If you would see the blank window, click ‘Main’ and select ‘New UGA’. (Refer to the Quick Start of this manual.)

Stanford Research Systems UGALT Series Universal Gas Analyzers Lite
Guide to Operation2 – 1�
In order to use this program, at least one UGALT must be con-nected to the PC. There are two ways to connect between UGALT and a PC; TCP/IP Ethernet or an RS232 serial connection. In this section, we provide step-by-step instructions for setting up com-munication.
In order to use this connection, a user should know the network en-vironment for the UGALT and the PC. The UGALT firmware and the UGA software both need proper TCP/IP parameters.
2.3.3 Connection to a PC
2.3.3.1 TCP/IP Ethernet Connection
Fig. 2-3 Screenshot of the initial window of UGA control software. The default open screen is for UGA series. This layout will be changed to UGALT layout when UGALT is connected.
Phone: (408)744-9040www.thinkSRS.com
UGALT Series Universal Gas Analyzers Lite
Guide to Operation 2 – 1�
�. First, determine the IP address, Subnet Mask, and Gateway for communication. The following are default values. Refer to your network administrator for appropriate values of your network.
IP address : 0.0.0.0 Subnet Mask : 255.255.255.0Gateway : 0.0.0.0
2. Once you obtain these parameters. enter them through the front panel with the following procedure. Alternatively, a user may type in these parameters through RS232 Serial communication. (Refer to the previous section)
Fromthefrontpanel;• Power up the UGALT, if not on.• Push “Level-up” button to enter MENU at the front panel.• Select “Communication” and hit the confirmation button.• Ethernet items are now shown on the display.• Choose “IP Address”. The display shows the default IP address. • Using the “Up” or “Down” button, change the value Then hit the confirmation button, .• The next number will be blinking. Repeat as above to set the proper value.• After keying in all four numbers, the display will move up to the Ethernet menu. Choose “Subnet Mask” and set the parameters.• Follow the same procedure for “Gateway” item.• Push the “Level-up” button several times to escape the menu tree and enter the display mode.
FromtheRS232connection;After UGA control software is connected through RS232 serial port, (see the next section) the TCP/IP parameters (IP address, Subnet mask, Gateway, User ID, and Password) can be typed in from the software using ‘Wizard’ menu in the UGA control software. The ‘Wizard’ menu can be used only when the serial port connection is activated.• Check the connection through the serial port.• In the ‘Main’ menu, select ‘Wizard’. The following screen will appear.

Stanford Research Systems UGALT Series Universal Gas Analyzers Lite
Guide to Operation2 – 1�
Fig. 2-4. Screenshot of the ‘Wizard’ dialog box in the ‘Main’ menu of UGA control software.
• Click the ‘Network’ tab to type in IP address, Subnet Mask, and Gateway.
Fig. 2-5. Screenshot of the ‘Network’ tab in the ‘Wizard’ dialog box.

Phone: (408)744-9040www.thinkSRS.com
UGALT Series Universal Gas Analyzers Lite
Guide to Operation 2 – 1�
• Click the ‘Security’ tab to type in User ID and Password.
Fig. 2-6. Screenshot of the ‘Security’ tab in the ‘Wizard’ dialog box.
• When finished, click ‘Done’ Button. • Check the TCP/IP parameters in the Communication menu of the front panel. The parameters should be saved in the UGALT.
3. Now UGALT is ready to connect through TCP/IP Ethernet connection.
• Launch UGA control program, if not launched.• Make sure Ethernet cable is connected to UGALT and a PC. If the connection is active, the yellow LED will be lit on the RJ45 connector.• In the Main menu, select ‘Connection Settings’. The ‘Connection Settings’ dialog box will pop up as shown in Fig. 2-7.• In the setting window, choose the ‘TCP/IP’ tab.

Stanford Research Systems UGALT Series Universal Gas Analyzers Lite
Guide to Operation2 – 20
Fig. 2-7. Screenshot of ‘TCP/IP’ selection in the Connection Settings dialog box. TCP/IP connection setting is established here.
• Click the ‘Add’ button. Then another dialog box (User Info) will appear.
Fig. 2-8. Screenshot of the ‘User Info’ box for TCP/IP connection.
Phone: (408)744-9040www.thinkSRS.com
UGALT Series Universal Gas Analyzers Lite
Guide to Operation 2 – 21
• Type in the proper IP Address, Port number, User ID, and password (the same ones typed in UGALT). Then click ‘Apply’. The ‘Connection Settings’ dialog box should have the information typed in before.
Fig 2-9. Screenshot of the ‘Connection Settings’ dialog box after the data typed in at the ‘User Info’ box.
• Make sure the TCP/IP connection is enabled. • Click the ‘OK’ button. This will close the Connection Settings dialog box.• In the ‘Main’ menu, select ‘Connect’. The following ‘ConnectorDialog’ window will be shown.
Fig. 2-�0. Screenshot of UGA control software after selecting ‘Connect’ in the Main menu. The available TCP/IP connector is shown
Stanford Research Systems UGALT Series Universal Gas Analyzers Lite
Guide to Operation2 – 22
• Choose the proper one by clicking on the connector. Then click ‘Connect’.• The icon of the connector will change to indicate a connected status.
Fig. 2-��. Screenshot of the ‘ConnectorDialog’ window after proper connection.
• Close the ‘ConnectorDialog’ window.• The UGA control program title shows the current status of connection. • The program shows the complete present state. Fig. 2-�2 shows that Ion gauge is installed in this Unit. The unit is stopped, which is the Off state, etc.
4. Now a user can explore the program by clicking each item on the graph. Refer to the next section (Menus and Displays) for detailed information.
5. For operation of UGALT, refer to the previous section, Front Panel Operation. As mentioned before, the program mimics the functions of the front panel.

Phone: (408)744-9040www.thinkSRS.com
UGALT Series Universal Gas Analyzers Lite
Guide to Operation 2 – 2�
2.3.3.2 RS232 Serial Connection
Fig. 2-�2. Screenshot of UGA control software after proper TCP/IP Ethernet connection. In the title bar, the connection is described.
The communication between UGALT and a PC through RS232 se-rial connection is possible with two different baud rates: 28800 and 38400. The baud rate of 38400 is for a general COM port communi-cation between UGALT and a PC. The 28800 baud rate is used for direct communication between the RGA and the PC. A user can select either baud rate from the front panel.

Stanford Research Systems UGALT Series Universal Gas Analyzers Lite
Guide to Operation2 – 2�
�. Connect between UGALT and a PC using the provided serial cable.
2. Power up the UGALT.
3. From the front panel choose the baud rate as follows. The default rate is 38400.
• Push the “Level-up” button to enter the UGALT menu.• Select “Communication” with the “Down” button and confirm it.• Choose “RS232 Baud Rate”.• Choose the desired baud rate at the menu.• Push the “Level-up” button several times to escape the menu.
4. Click the ‘Main’ menu of the UGA software, and select ‘Connection Settings’. The following screen will appear as shown in Fig. 2-�3.
Fig. 2-�3. Screenshot of ‘Serial’ selection in the ‘Connection Settings’ dialog box.
5. In the ‘Connection Settings’ dialog box, choose ‘Serial’ tab. Verify that the serial resource is enabled (as shown above). Match the baud rate with UGALT settings. Click ‘OK’.

Phone: (408)744-9040www.thinkSRS.com
UGALT Series Universal Gas Analyzers Lite
Guide to Operation 2 – 2�
6. Click on the ‘Main’ tab, and select ‘Connect’. The software will show the available resources. If the resources are not shown immediately, click ‘Update’ several times.
Fig. 2-�4. Screenshot of UGA control software after selecting ‘Connect’ in the ‘Main’ menu. The available serial connector is shown.
7. Select the appropriate COM port and click the ‘Connect’ button. In the example screenshot above, the UGALT is found on COM�. Note if you are using a USB to serial adapter, you must know what COM port the USB driver has allocated. Use the Windows device manager to find the USB to serial COM port.
8. After the proper port changes to the connection (the icon indicates connected status with green color), close the ‘ConnectorDialog’ window.
9. The following screen on the next page will appear at the UGA control program.
�0. A user can explore the program by clicking each item on the graph. Refer to the next section (Menus and Displays) for detailed information.
��. For operation of UGALT, refer to the section, “Front Panel Operation” (Section 2.2). This program mimics the functions of the front panel.

Stanford Research Systems UGALT Series Universal Gas Analyzers Lite
Guide to Operation2 – 2�
Fig. 2-�5. Screenshot of UGA control software after the proper serial connection of UGALT. On the title bar, the connection status is shown.
The UGA control program is a Windows based software written in the C# language using .NET framework. The main user interface window is composed of several areas - Title bar, Menu bar, Mes-sage sub-window, Log sub-window, etc as seen in Fig. 2-�5. In this section, the menus and displays of the program are described in detail.
2.3.4 Menus and Displays

Phone: (408)744-9040www.thinkSRS.com
UGALT Series Universal Gas Analyzers Lite
Guide to Operation 2 – 2�
Fig. 2-�6. Section indications of UGA control software window. The name for each numbered section is written below.
� : Main title bar2 : Menu bar3 : UGALT instrument number tap4 : Message board5 : Log board6 : RGA software launch button7 : State indicators for components and options 8 : Reading & Operation and Data graph displays sub-window9 : Auto control buttons�0 : Time information and current mode board�� : Functional indicator board
1
4
5
67
8
9
1011
32

Stanford Research Systems UGALT Series Universal Gas Analyzers Lite
Guide to Operation2 – 2�
�. Main title barThis bar has the same functions as a normal windows application, such as Title on the left, window control icons on the right. The title also indicates connection status.
2. Menu barThere are two menus on the bar; Main and Help. ‘Help’ menu ex-plains all the functions of the program and gives the current soft-ware version. In the ‘Main’ menu, there are seven submenus; Con-nect, Connection Settings, Instrument Settings, Wizard, New UGA, Close UGA, and Quit.
‘Connect’ submenu connects UGALT to a PC through an assigned connector - TCP/IP Ethernet or RS232 Serial.
‘Connection Settings’ provides the selection of the connector, the connector setting parameters, and the log file directory.
‘Instrument Settings’ provides all te setting parameters for the UGA, which will be described in detail below.
‘Wizard’ submenu provides tools to type in the TCP/IP parameters only when the UGALT is connected through RS232 serial port.
Fig. 2-�7 Screenshot of MultiUGA control panel.

Phone: (408)744-9040www.thinkSRS.com
UGALT Series Universal Gas Analyzers Lite
Guide to Operation 2 – 2�
‘NewUGA’ opens additional control panel for another UGA or UGALT series instrument. This control software can handle up to 5 instruments with one control software as shown in Fig. 2-�7 in the previous page.
‘Close UGA’ closes the opened control panel.
‘Quit’ submenu closes the program any time it is clicked.
‘Instrument Settings’ submenu will show the following pop up dia-log box (Fig. 2-18) called Settings. In this box, there are four sub-menus; Logging, Graph, Units, and Misc. After changing values in this window, click the ‘OK’ button to save the data.
Fig. 2-18. Screenshot of ‘Settings’ dialog box showing the ‘Logging’ tab
The ‘Logging’ tab contains all the logging conditions for UGALT control as shown above; enabling message log and data log, data log time interval. The Message log contains all the events of com-ponent controls with time stamp, which are shown in #5, the log board of Fig 2-�6. In the data log, there are all 3 data (2 pressures-roughing line and RGA chamber; � temperature - TP) with time stamp.
All these log data will be saved in the directory, defined in the con-nection settings. The factory default directory is set at Application Data\SRS\UGA\log directory in the user directory of C:\docu-
Stanford Research Systems UGALT Series Universal Gas Analyzers Lite
Guide to Operation2 – �0
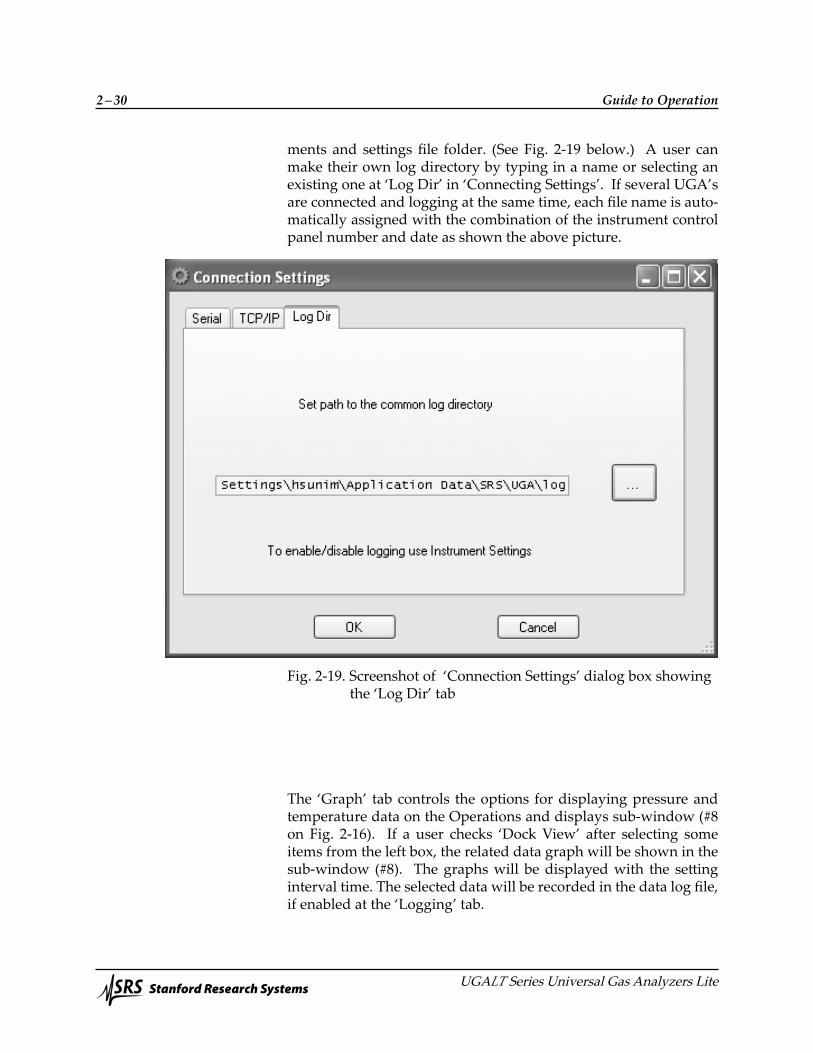
ments and settings file folder. (See Fig. 2-19 below.) A user can make their own log directory by typing in a name or selecting an existing one at ‘Log Dir’ in ‘Connecting Settings’. If several UGA’s are connected and logging at the same time, each file name is auto-matically assigned with the combination of the instrument control panel number and date as shown the above picture.
Fig. 2-19. Screenshot of ‘Connection Settings’ dialog box showing the ‘Log Dir’ tab
The ‘Graph’ tab controls the options for displaying pressure and temperature data on the Operations and displays sub-window (#8 on Fig. 2-�6). If a user checks ‘Dock View’ after selecting some items from the left box, the related data graph will be shown in the sub-window (#8). The graphs will be displayed with the setting interval time. The selected data will be recorded in the data log file, if enabled at the ‘Logging’ tab.

Phone: (408)744-9040www.thinkSRS.com
UGALT Series Universal Gas Analyzers Lite
Guide to Operation 2 – �1
Fig. 2-20. Screenshot of ‘Settings’ dialog box sowing the ‘Graph’ tab
Fig. 2-21. Screenshot of ‘Settings’ dialog box showing the ‘Unit’ tap for pressure unit A user can select the units (Torr, bar, mbar, Pascal, or atm) for the pressure in the reading section (one of the #8 sub-windows) or in the graph from the list box in the ‘Unit’ tab. The default setting is Torr.

Stanford Research Systems UGALT Series Universal Gas Analyzers Lite
Guide to Operation2 – �2
In the ‘Misc’ tab, several display items can be selected. ‘Elapsed Time’ shows the period of a UGALT state. When the state is changed, it starts a new period.
Fig. 2-22. Screenshot of ‘Settings’ dialog box showing the ‘Misc’ tab
3. UGA instrument number tapThe UGA control software can control up to 5 UGA’s or UGALT’s units at the same time. Each control panel is indexed by number eg. UGA�, UGA2, UGA3, UGA4, and UGA5.
4. Message boardIn the Message board, all error and warning messages are shown. If enabled, the messages will be recorded in the message log file.
5. Log boardIn the Log board, every event will be written with the time stamp. If enabled, the logs will be recorded in the message log file.

Phone: (408)744-9040www.thinkSRS.com
UGALT Series Universal Gas Analyzers Lite
Guide to Operation 2 – ��
6. RGA software launch buttonIf RGA software is installed, clicking this button will start the pro-gram. If the RGA is turned on, this process will automatically con-nect to the RGA. Once launched, the following screen appear.
Fig. 2-23. Screenshot of RGA software.
7. State indicators for components and optionsThe present states of all the components and options are indicated by LED graphics. If it is lit, the item is on or open. If off, the item is off or closed. If blinking, the item is in transition. The number be-side the ‘Ion Gauge’ text indicates which filament the ion gauge is using now. There are two filaments in the ion gauge. The filament can be selected from the front panel or from the operation window of UGA control software.

Stanford Research Systems UGALT Series Universal Gas Analyzers Lite
Guide to Operation2 – ��
8. Reading&Operation and Data graph display sub-windowThis area is for individual controls and data displays. Graphs of pressure and/or temperature data will be docked here, if selected. All windows are tabbed as shown below.
Fig. 2-24. Screenshot of UGA control software window for various window tabs and operations.
In the Reading and Operation tab, there is a component list. The components are listed under the Manual head. The status of present state is also written beside each component. The number list of IG indicates the current filament used. By clicking the com-ponent name, a control bar will appear as shown in the example above (‘Turbo Pump’ here). After selecting the desired state, the user should confirm it by clicking the ‘Apply’ button.
Phone: (408)744-9040www.thinkSRS.com
UGALT Series Universal Gas Analyzers Lite
Guide to Operation 2 – ��
2.3.5 Launching RGA Software
Using the similar procedure, two advanced operations can be set here: Auto Sample Valve and Auto Vent Valve. These items are shown in the Option menu tree.
9. Auto control buttonsThese buttons have the same functionality as the buttons on the front panel. Only the applicable mode buttons are activated, de-pending on the status of the UGALT. The others will be grayed out and will be disabled at that time.
�0. Time information and current mode indicator boardA user can turn on/off the information by selecting the items in the ‘Misc’ tab of ‘Settings’ dialog box.
��. Functional indicator boardThis panel indicates the errors, warnings, and the status of manual control.
After a user brings the UGALT to the Ready state, the unit is ready for using the RGA to analyze gas mixtures. In order to obtain RGA data, the UGALT needs to be connected to a PC running the RGA software. In this section, we describe launching the RGA software. For the detailed reference of the RGA software, please refer to the RGA manual or ‘Help’ of the RGA software.
A user can connect to the RGA in two ways - within UGA control software, or directly RGA control software.
A. Launching RGA software from within UGA control software
• Check that the connection is established• Check that the RGA is on. If not, turn it on by clicking the ‘RGA’ item in the operation window.

Stanford Research Systems UGALT Series Universal Gas Analyzers Lite
Guide to Operation2 – ��
Fig. 2-25. Check the RGA status in the UGA control software.
• Click ‘Launch RGA’, this will connect a PC to RGA automatically. • Now you can start gas analysis.
B. Launching RGA software as a stand-alone application from the Windows (Through RS232 serial connection or Ethernet connection)
Through Ethernet connection• Check the Ethernet setting parameters and connect cable between UGALT and PC.• Start ‘RGA.exe’.
Check here

Phone: (408)744-9040www.thinkSRS.com
UGALT Series Universal Gas Analyzers Lite
Guide to Operation 2 – ��
• Click the connection setting button ( ). • Select TCP/IP tab. The following dialog will appear.
Fig. 2-26 Screenshot of RGA connection setting dialog for Ethernet.
• Click ‘Add’ button then new data input dialog box will appear (Fig. 2-27).
Fig. 2-27. Screenshot of Ethernet data input dialog in RGA.exe
• Type in the same network settings as the settings in UGALT and click ‘OK’. • Click ‘OK’ again to finish the Ethernet setting.

Stanford Research Systems UGALT Series Universal Gas Analyzers Lite
Guide to Operation2 – ��
• Click the connection button ( ). The dialog box as seen in Fig. 2- 28 will show up with Ethernet port information.
Fig. 2-28. Screenshot of RGA connection dialog box for Ethernet.• Select the proper Ethernet port (Here �72.25.�28.�4).• Click the ‘Connect’ button and close the dialog box.• You can now start gas analysis.
Through RS232 Serial connection• On Front panel confirm Baud rate is set to 28800. If not, set it.• Check RGA status from the front panel. If RGA is not on, bring UGALT to ready state for RGA.• Establish RS232 serial connection between UGALT and the PC.• Start ‘RGA.exe’.• Click the connection button ( ) at the toolbar. The following dialog box will appear.
Fig. 2-29. Screenshot of RGA connection dialog box for Serial port.

Phone: (408)744-9040www.thinkSRS.com
UGALT Series Universal Gas Analyzers Lite
Guide to Operation 2 – ��
2.3.6 Option Operation
2.3.6.1 Ion Gauge
• Select the proper COM port. (Here, it is COM3.) • Click the ‘Connect’ button and close the dialog box.• You can now start gas analysis.
The UGA control software shows the status of the Ion Gauge and indicates its filament number. The ion gauge has two filaments, only one of which is used for the operation. If one is broken, the other can be used. A user can select a filament, by selecting the corresponding number. (See Fig. 2-30)
Fig. 2-30. Screenshot of Ion gauge control. The currently used filament number is displayed in the component state panel and also in the reading and operation sub-window.

Stanford Research Systems UGALT Series Universal Gas Analyzers Lite
Guide to Operation2 – �0
In the UGA control software, click the name of the vent valve (Fig. 2-3�). Choose the appropriate action menu item; ‘OFF’ or ‘ON’. When ‘ON’ is selected, initially the UGALT opens the valve for � second, then close the valve. After 40 seconds, the UGALT will open it again for a minute to vent the system. After the one minute period, the valve closes again. This sequence allows TP to stop smoothly without a pressure shock. It helps the system to stop safely (in several minutes) and to protect the RGA chamber from contamination.
Fig. 2-3�. Screenshot of the Vent valve control on the UGA control software.
2.3.6.2 Vent valve

3 – �
Chapter 3
Remote Programming
In This Chapter This chapter discusses remote programming of the UGALT.
3.� Introduction . . . . . . . . . . . . . . . . 3–2 Communication via RS232 . . . . . . 3–2 Communication via Ethernet . . . . . 3–2 Command format . . . . . . . . . . . 3–2 Command syntax. . . . . . . . . . . . 3–33.2 Commands . . . . . . . . . . . . . . . . . 3–4 Modesettingcommands . . . . . . . 3–4 Components control commands . . . 3–6 Status query commands . . . . . . . . 3–�� Query commands . . . . . . . . . . . 3–�2 Error query commands . . . . . . . . 3–�3 Parametersettingcommands . . . . . 3–�4

Stanford Research Systems UGALT Series Universal Gas Analyzers Lite
Remote Programming3 – �
3.1 Introduction
3.1.1 Communication via RS-�3�
3.1.� Communication via Ethernet
3.1.3 Command Format
The UGALT may be controlled via either Ethernet interface or RS-232 interface. See the chapter 2 of the manual for how to get con-nected.
The UGALT uses a DB9 connector for serial communications. The female DB9 connector on the UGALTisconfiguredasaDCE(trans-mit on pin 2, receive on pin 3) device and supports CTS/RTS hard-warehandshaking.TheRTSsignal(pins8)isanoutputindicatingthat the UGALTisready,whiletheCTSsignal(pin7)isaninputthat is used to control the UGALT’s data transmission. Ground is pin 5. The UGALT uses hardware handshaking, one stop bit, no parity,baudrateeither28800or38400.
You may connect the UGALT either directly to the host computer with a cross-over cable, or to a hub or switch with a straight-through CAT5 cable. To connect UGALT to internet, you will need a static IP(InternetProtocol)address,SubnetMask,andGatewayaddress.See your network administrator to obtain addresses appropriate for your network environment.
Communications with the UGALT uses ASCII characters. Because the UGALT is case insensitive, all commands may be in either UP-PER or lower case. A command starts from a character after a termi-nation character and ends with a termination character. The UGALT uses carriage return, <CR> as the termination character.
The UGALT has two separate sets of commands that are handled by separate microprocessors. One is the UGALT command set

Phone:(408)744-9040www.thinkSRS.com
UGALT Series Universal Gas Analyzers Lite
Remote Programming 3 – 3
which is processed by UGALT main controller, and the other is the RGA command set which is processed by RGA controller. A com-mand starting with a ‘Z’ is handled by the UGALT main controller, and a command starting with other characters is handled the RGA controller. A command in the UGALT command set consists of a four character command mnemonic, arguments if necessary, and a command terminator. The command, arguments and terminator may be separated by spaces. No command processing occurs until a <CR> terminator is received.
Commands may require one or more parameters. Multiple param-etersareseparatedbycommas(,).
The present value of a particular parameter may be determined by querying the UGALT for its value. A query is formed by append-ingaquestionmark ’?’ to thecommandmnemonicandomittingthe desired parameter from the command. Values returned by the UGALT are sent as a string of ASCII characters terminated by a car-riage return <CR>.
Thefourlettermnemonic(showninCAPS)ineachcommandse-quencespecifiesthecommand.Therestofthesequenceconsistsofparameters. Parameters shown in { } are not always required. Gen-erally, parameters in { } are required to set a value in the UGALT. Multiple parameters are separated by commas. The present value of a parameter may be determined by sending a query command.
• Commands that MAY be queried show a question mark in parentheses(?)afterthemnemonic.• Commands that are ONLY queries have a ’?’ after the mnemonic, with no parentheses.• Commands that MAY NOT be queried have no ’?’.
A query is formed by including the question mark ? after the com-mand mnemonic and omitting the queried parameter from thecommand. The query parameters shown in { } are NOT sent with a query. The query returns the value of these parameters. Values are returnedasastringofASCIIcharacters(unlessotherwisenoted).
3.1.4 Command Syntax
Stanford Research Systems UGALT Series Universal Gas Analyzers Lite
Remote Programming3 – 4
3.2 Commands
3.�.1 Mode setting commands
ZMST
DoNOTsend()or{}aspartofthecommand.Forexample,thecommandsequenceZPFL(?){i}isusedasfollows.
ZPFL2SettheIGfilamentto#2.
ZPFL?QuerythenumbersettingofIGfilamentfortheaboveex-ample to return 2 as an answer. Variablesaredefinedasfollows.i, p integersi.i.i.i DotteddecimalformatforIPaddress, Subnet Mask, and default Gateway address s text string for login name and password
Commandstosetvalueswhichmaybedifferentforeachchannelrequire the p parameter.
These values must be queried separately for each channel.Allnumericvariablesshouldbeexpressedininteger(i.e.,5),nei-therfloatingpoint(5.0)norexponentialformats(0.5E1).Stringsaresent as a sequence of ASCII characters.
Start The ZMST command initiates START mode. It turns on all the components according to the automated START sequence, and brings the instruments to the READY state.
ExampleZMST begins START mode.
Errors and warnings The command will be ignored if any of these conditions are true.ZMST may cause these errors.Warning 47 “LeakTestON”Warning 48 “SystemBakeON”Warning 51 “PressureCheckoff”
Phone:(408)744-9040www.thinkSRS.com
UGALT Series Universal Gas Analyzers Lite
Remote Programming 3 – �
Stop TheZMSPcommandinitiatesSTOPmode.Turnoffallthe components according to the automated STOP sequence.
ExampleZMSP begins STOP mode.
Errors and warnings ZMSP should work in any condition.
Sleep The ZMSL command initiates SLEEP mode. It puts the UGALT to IDLE state from READY state. If the turbo pumpisoff,theZMSLcommandwillfailwith the warning 42. ExampleZMSL begins SLEEP mode.
Errors and warnings The command is ignored if any of these conditions are true.Warning 42 “Turbonotready”Warning 47 “LeakTestON”Warning 48 “SystemBakeON”
System mode query The ZMOD? query returns the current UGALT mode described below.
Off (1) allcomponentsareOFF
START (3) AutomaticSTARTsequenceinprog- ressSTOP (4) AutomaticSTOPsequenceinprog- ress
READY (6) RGAisonSLEEP (7) AutomaticSLEEPsequenceinprog- ressIDLE (8) TPandRPareidle,allothercompo- nentsareoff.MANUAL (13) Manuallychangedofthestateofa componentfromapre-definedstate
ZMSP
ZMSL
ZMOD?

Stanford Research Systems UGALT Series Universal Gas Analyzers Lite
Remote Programming3 – �
3.�.� Components control commands ZCRP (?) {i}
ZCTP (?) {i}
Roughing pump Off/On/Idle TheZCRPicommandturnstheroughingpumpOff(i=0), On(i=1),orIdle(i=2).TheZCRP?queryreturnswhetherthe roughingpumpisOff(0),On(1),Idle(2),turningon(3or 4),turningoff(6or7),orturningidle(8or9).
ExampleZCRP � Turns the roughing pump On. ZCRP? Returns the state of the roughing pump.
Errors and warnings The command is ignored if any of these conditions are true.
ZCRP0:Warning 41 “Turbopumprunning”
ZCRP � :Warning 33 “BypassvalveOPEN”Warning 34 “SamplevalveOPEN”Error 102 “RPtoohigh”
ZCRP 2 :Warning 33 “BypassvalveOPEN”Warning 34 “SamplevalveOPEN”Warning 38 “RoughpressureHIGH”
Turbo pump Off/On/Idle TheZCTPicommandturnstheturbopumpOff(i=0), On(i=1),orIdle(i=2).TheZCTP?queryreturnswhetherthe turbopumpisOff(0),On(1),Idle(2),turningon(3,4or 5),turningoff(6or7),orturningidle(8,9or10),or inErrorstate(12).
ExampleZCTP � Turns the turbo pump On. ZCTP? Returns the state of the turbo pump.
Errors and warnings The command is ignored if any of these conditions are true.ZCTP0:Warning 43 “RGAON”Warning 46 “IGON”
Phone:(408)744-9040www.thinkSRS.com
UGALT Series Universal Gas Analyzers Lite
Remote Programming 3 – �
Warning 48 “SystemBakeON”Error 110 “TPstopfailed”
WithError110,theZCTP?queryreturnsErrorstate(12),untiltheturbopumpturnsoff.
ZCTP � : Warning 36 “RoughingpumpOFF”Error 104 “TPtoohigh”Error 111–120 Errorconditionsdetectedbythetur-bo pump controller. Once one of these errors occurs, the UGALT hastobeturnedoffandturnedonagaintocleartheerror.
ZCTP 2 :Warning 36 “RoughingpumpOFF”Warning 48 “SystemBakeON”Error 104 “TPtoohigh”Error 111–120 Errorconditionsdetectedbythetur-bo pump controller. Once one of these errors occurs, the UGALT hastobeturnedoffandturnedonagaintocleartheerror.
WithError104,theZCTP?queryreturnsErrorstate(12),untiltheturbopumpturnsoff. Bypass valve Off/On TheZCBVicommandturnsthebypassvalveClosed(i=0) orOpen(i=1).TheZCBV?queryreturnswhether thebypassvalveisClosed(0),Open(1),turningopen(3or 4),turningclosed(6or7).
ExampleZCBV � Opens the bypass valve. ZCBV? Returns the state of the bypass valve.
Errors and warnings The command is ignored if any of these conditions are true.
ZCBV0:Warning 34 “SamplevalveOPEN”
ZCBV � :Warning 48 “SystemBakeOn”Warning 30 “BypasspumpOFF”Error 99 “BVtoohigh”
ZCBV (?) {i}

Stanford Research Systems UGALT Series Universal Gas Analyzers Lite
Remote Programming3 – �
ZCSV (?) {i}
ZCRG (?) {i}
Sample valve Off/On TheSamplevalveoperatesdifferentlydependingonthe automaticsamplevalvestates(associatedwithZPAS command). (1)WiththeautomaticsamplevalveOff, The ZCSV i command turn only the sample valve Closed (i=0)orOpen(i=1).(2)WiththeautomaticsamplevalveOn, The sample valve, the bypass valve, and the bypass pump work as a unit. The ZCSV � command turns the bypass pump on, opens the bypass valve, and then opens samplevalve.TheZCSV0commandcloses the sample valve, closes the bypass valve, and turn offthebypasspump.
ExampleZCSV � Opens the sample valve. ZCSV? Returns the state of the sample valve.
Errors and warnings The command is ignored if any of these conditions are true.
ZCSV � :Warning 32 “BypassvalveCLOSED”,whenZPASisoffWarning 48 “SystemBakeOn”Error 100 “SVtoohigh”
RGA Off/On TheZCRGicommandturnstheRGAOff(i=0)orOn(i=1). TheZCRG?queryreturnswhethertheRGAisOff(0),On (1),intheleaktestmode(2),turningon(3or4),turningoff (6or7),orgoingintotheleaktestmode(8or9).
ExampleZCRG � Turns the RGA On. ZCRG? Returns the state of the RGA.
Errors and warnings The command is ignored if any of these conditions are true.
ZCRG0:Warning 47 “LeakTestOn”Error 80 “RGAofffailed”

Phone:(408)744-9040www.thinkSRS.com
UGALT Series Universal Gas Analyzers Lite
Remote Programming 3 – �
ZCRG � :Warning 42 “Turbonotready”Warning 47 “LeakTestOn”Warning 48 “SystemBakeOn”
Ion gauge Off/On/Degas TheZCIGicommandchangetheiongaugestatetoOff (i=0),On(i=1),orDegas(i=2).TheZCIG?queryreturns the current ion gauge state.
ExamplesThe ZCIG 2 Degasses the ion gauge for 3 minutes and returns the gaugestatetothepreviousstate,dependingonitwasonoroff.
Errors and WarningsThe command is ignored if any of these conditions are met.
Error 73 “NoIGdetected”
ZCIG0Error 78 “IGofffailed”
ZCIG �Warning 42 “Turbonotready”Error 74 “IGunexpectedoff”Error 76 “IGvoltage”Error 77 “IGemission”Error 105 “IGtoohigh”
ZCIG 2Warning 42 “Turbonotready”
Vent valve Off/On TheZCVVicommandturntheventvalveOff(i=0),orOn (i=1).TheZCVV?queryreturnsthecurrentvent valve state.
ZCVV � command opens the vent valve for � second, closes it for thenext40seconds,opensagainforthenext60seconds,andfinally
ZCIG (?) {i}
ZCVV (?) {i}

Stanford Research Systems UGALT Series Universal Gas Analyzers Lite
Remote Programming3 – 10
ZCPC (?) {i}
ZCVL (?) {i}
closes it. This command goes in the cycles not to vent the chamber too fast while the turbo pump is running in full speed. ZCVV?returns1throughthewholecycles.Andreturns0afterthefinalclosure.
Errors and WarningsThe command is ignored if any of these conditions are met.
ZCVV �Warning 37 “RoughingpumpON”Error 85 “NoVentvalve”
Pressure interlock Off/On TheZCPCicommandsetPressureInterlockstatetoOff (i=0),orOn(i=1).TheZCPC?queryreturnsthe current value of Pressure Interlock state.
If the state is �, UGALT keeps monitoring pressures from PG and IG (ifOption1installed)toprotectitselffromanypressurechanges.If0,itdisablesprotectionbasedonPGandIG(ifOption1installed)readings. It should be used only by very advanced users or for trouble shooting.
Errors and WarningsThe command is ignored if any of these conditions are met.
ZCPC �Warning 48 “SystemBakeON”Warning 49 “AUTOsequenceON”
Speaker volume TheZCVLicommandsetthespeakervolumetoOff(i=0), Low(i=1),Medium(i=2),orHigh(i=3).TheZCVL? query returns the current speaker volume.
ExampleZCVL � sets the speaker volume to Low.
Phone:(408)744-9040www.thinkSRS.com
UGALT Series Universal Gas Analyzers Lite
Remote Programming 3 – 11
Component states The ZBST? query returns the component current state bits. It returns an integer that contains the following bit information.
Bit Name Bit Number Bit set on STATE_BIT_ERROR BIT�5 Any error condition STATE_BIT_POWER BIT�4 Power up STATE_BIT_AUTO BIT�3 Automatic mode is entered Reserved BIT�2 Reserved Reserved BIT�� Reserved Reserved BIT10 Reserved STATE_BIT_VENT BIT9 The vent valve is open STATE_BIT_IG BIT8 IGactive STATE_BIT_RGABIT7 RGAactive STATE_BIT_SV BIT6 SV open STATE_BIT_BV BIT5 BV open STATE_BIT_TPIDLE BIT4 TP goes idle STATE_BIT_TP BIT3 TP is on STATE_BIT_RPIDLE BIT2 RP goes idle STATE_BIT_RP BIT� RP is on Reserved BIT0 reserved
Components changed The ZBCT? query returns the component change state bits. Thisreturnsonlythebits(definedaboveintheZBST command)thathavechangedeitherfromOfftoOnor fromOntoOff,sincetheZBCTquerywaslastissued.
Components in transition The ZBTT? query returns the component transition bits. If a bit is set, it indicates the corresponding component is in transitioneitherfromofftoon,orfromofftoon.Oncethe transition is over, the bit value returns to zero.
3.�.3 State Query commands
ZBST?
ZBCT?
ZBTT?
Stanford Research Systems UGALT Series Universal Gas Analyzers Lite
Remote Programming3 – 1�
3.�.4 Query commands
ZQID?
ZQFV?
ZQSN?
ZQMC?
ZQAD? i
Identification The ZQID? query returns UGALT ID string, the serial number,andthefirmwareversion.
ExampleZQID?ifthecommandreturns“SRS_UGALT,S/N:91000,V.1.000”,it means the unit is a UGALT,theserialnumberis91000,andthefirmwareversionis1.000.
Firmware version TheZQFV?queryreturnsthefirmwareversionoftheunit.
ExampleZQFV?returnsthefirmwareversion(e.g.,1.000).
Serial number The ZQSN? query returns the serial number of the unit.
ExampleZQSN?returnstheserialnumber(e.g.,91000).
MAC address The ZQMC? query returns the Ethernet media access control(MAC)addressoftheunit.Thenumbersare6 bytes in the hexadecimal format.
ExampleZQMC? return the MAC address
Pressures The ZQAD? i query returns a pressure reading corresponding to the following index.
Index0:PiranigaugereadinginuTorr Index �: N/A Index 2: N/A Index 3: IG reading in pTorr

Phone:(408)744-9040www.thinkSRS.com
UGALT Series Universal Gas Analyzers Lite
Remote Programming 3 – 13
If the corresponding gauge is not on, the reading is meaningless.
ExampleZQAD?0ifthecommandreturns100000,itmeansthethePiranigaugereadingis0.1Torr.
ZQAD?3ifthecommandreturns100000,itmeanstheiongaugereadingis1.0E-7Torr.
Turbo pump speed TheZQHZ?queryreturnsTPspeedinrevolutionsper second.
Turbo pump current The ZQCU? query returns TP current in mA.
Turbo pump temperature The ZQTT? query returns TP Temperature in degrees Celsius.
Error query The ZERR? queries Error code. Whenever ZBST? Bit �5 is set,use“ZERR?”toreaderrors.
LatestErrorsupto10willbestoredintotheerrorstack.Iftherearemorethan10errorsoccur,thelasterrorwillreplacedwithTOO_MANY_ERRORS (126). “ZERR?” returns the latest errorfirst.ToclearZBSTbit15,youmust issueZERR?untilyouget0.Forthecomplete error list, refer to Chapter 4 of this maual.
Error message The ZEDS? i queries the error message corresponding to anerrornumber(9to126)returnedwithZERR?.This query returns a verbose string corresponding to the given error code.
ZQHZ?
ZQCU?
ZQTT?
3.�.� Error query commands
ZERR?
ZEDS? i
Stanford Research Systems UGALT Series Universal Gas Analyzers Lite
Remote Programming3 – 14
3.�.� Parameter setting commands
ZPRO (?) {i}
ZPRI (?) {i}
ZPBA (?) {i}
ZPIP (?) {i.i.i.i}
Parameters changed with the following commands are saved in EEPROM,preservedevenafterpoweroff,andloadedintosystemwhen UGALT start again next time.
Roughing pump on power The ZPRO i command sets the roughing pump on-powertoavaluefrom30%(i=30)to100%(i=100). The ZPRO? query returns the current on-power settingfortheroughingpump.
Theparameterchange is immediatelyeffectiveall the time,eventhe roughing pump is running.
Roughing pump idle power The ZPRI i command sets the roughing pump idle-powertoavaluefrom30%(i=30)to100%(i=100). The ZPRI? query returns the current idle-power settingfortheroughingpump.
Theparameterchange is immediatelyeffectiveall the time,eventhe roughing pump is idle.
RS232 baud rate The ZPBA i command sets the RS232 baud rate to 28800(i=0),or38400(i=1).TheZPBA?query returnsthecurrentRS232baudratesetting.
IP address TheZPIPi.i.i.icommandsettheInternetProtocol(IP) address of the instrument. The ZPIP? query returns thecurrentIPaddresssetting.
ExampleZPIP192.168.1.12SetstheIPaddressto192.168.1.12.

Phone:(408)744-9040www.thinkSRS.com
UGALT Series Universal Gas Analyzers Lite
Remote Programming 3 – 1�
Errors and WarningsThe command is ignored if the following error is issued after the command input.
ZPIP i.i.i.i Warning 16 “Badparameter”
IP Subnet Mask TheZPSMi.i.i.icommandsettheInternetProtocol(IP) Subnet Mask of the instrument. The ZPSM? query returns thecurrentIPSubnetMasksetting.
ExampleZPSM255.255.255.0SetstheIPSubnetMaskto255.255.255.0.
Errors and WarningsThe command is ignored if the following error is issued after the command input.
ZPSM i.i.i.i Warning 16 “Badparameter”
IP default Gateway TheZPGWi.i.i.icommandsetstheInternetProtocol(IP) default Gateway of the instrument. The ZPGW? query returnsthecurrentIPdefaultGatewaysetting.
ExampleZPGW192.168.1.1SetstheIPdefaultgatewayto192.168.1.1.
Errors and WarningsThe command is ignored if the following error is issued after the command input.
ZPGW i.i.i.i Warning 16 “Badparameter”
ZPSM (?) {i.i.i.i}
ZPGW (?) {i.i.i.i}
Stanford Research Systems UGALT Series Universal Gas Analyzers Lite
Remote Programming3 – 1�
ZPNM (?) {@s}
ZPPW (?) {@s}
TCP/IP login name The ZPNM @ABC command set the login name of the instrument to ABC for the TCP/IP connection. The ZPNM? query returns the current login name.
The command accepts only alphanumeric characters, a-z, A-Z, and 0-9.Thedefaultis“SRSUGA”
ExamplesZPNM @SRSUGA sets the login name to SRSUGA
ZPNM @ clears the login name. With blank login name and password, a user can login to the instru-ment by typing carriage returns only.
Errors and WarningsThe command is ignored if the following error is issued after the command input.
ZPNM @s Warning 16 “Badparameter”
TCP/IP password The ZPPW @ABC command set the password of the instrument to ABC for the TCP/IP connection. The ZPPW? query returns the current password.
The command accepts only alphanumeric characters, a-z, A-Z, and 0-9.Thedefaultis“SRSUGA”
ExamplesZPPW @SRSUGA sets the password to SRSUGA
ZPPW @ clears the password. With blank login name and password, a user can log into the instru-ment by typing carriage returns only.
Errors and WarningsThe command is ignored if the following error is issued after the command input.
ZPPW @s Warning 16 “Badparameter”

Phone:(408)744-9040www.thinkSRS.com
UGALT Series Universal Gas Analyzers Lite
Remote Programming 3 – 1�
ZPDU (?) {i}
ZPSP (?) {i}
ZPTO (?) {i}
ZPFL (?) {i}
ZPPU (?) {i}
Ethernet Half Duplex/Full Duplex The ZPDU i command sets the Ethernet half duplex(i=0)orfullduplex(i=1).Thedefaultvalue is full duplex. The ZPDU? queries whether the Ethernet is full duplex, or half duplex.
Ethernet Speed Auto/10 Mbps/100 Mbps The ZPSP i command sets Ethernet speed Auto- negotiation(i=0),10Mbps(i=1),or100Mbps(i=2). Thedefaultvalueis100Mbps.
TCP/IP connection timeout The ZPTO i command sets the TCP/IP connection timeoutbetween3to1800seconds.TheZPTO? query returns the value. If TCP/IP communication is inactive for the timeout period, the connection will be closed. The default value is 2 minutes.
Ion gauge filament TheZPFLicommandselectseitherofthe filament1(i=0),orthefilament2(i=1),whichisused when the ions gauge turns on or degasses. TheZPFL?returnstheselectedfilament(0or1).
Pressure unit The ZPPU i command sets the pressure unit used forthefrontpaneldisplay:Torr(i=0),Pa(i=1), mbar(i=2),orbar(i=3).TheZPPU?queryreturns the current pressure unit for the display. This unit selectionhasNOeffectontheunitusedbythe ZQAD command.

Stanford Research Systems UGALT Series Universal Gas Analyzers Lite
Remote Programming3 – 1�
ZPAV (?) {i}
ZPAS (?) {i}
ZPDF
Automatic vent valve The ZPAV i command turns the automatic vent valveoptionOff(i=0)orOn(i=1).TheZPAV? query returns the current value of the option.
If this option is on, the vent valve will be opened at the end of the automatic STOP sequence. If not, the STOP sequence ends without opening the vent valve.
Automatic sample valve The ZPAS i command changes the the automatic sample valveoptiontoOff(i=0),orOn(i=1).TheZPAS?query returns the current value of the option.
If a user opens the sample valve with this option on, the UGALT turns on the bypass pump, and opens the bypass valve, before opens the sample valve automatically. If the user closes the sample valve with this option on, the UGALT closes the sample valve and bypass valvesequentially,andturnsoffthebypasspump.
Iftheoptionoff,theusercanopenthesamplevalveonlywhenthebypass valve is open, otherwise it will generate a warning.
Factory default TheZPDFcommandresetsalltheparametersaved in EEPROM to the factory default values.
It is useful to set the UGALT to the known initial state, when the user experiences problems due to corrupted parameters. After loading Factorydefaultvalues,theuserhastore-enterallthenetworkpa-rameters(IPaddress,SubnetMask,anddefaultGateway)toaccessto Ethernet interface again.
4 – �
Chapter 4
UGALT Error Messages
In This Chapter This chapter lists and explains all the error messag-es displayed on the UGALT.
4.� Introduction . . . . . . . . . . . . . . . . 4–24.2 Error messages . . . . . . . . . . . . . . . 4–3 Communication errors messages . . . 4–3 Warning error messages . . . . . . . . 4–5 Critical error messages. . . . . . . . . 4–7

Stanford Research Systems UGALT Series Universal Gas Analyzers Lite
UGALT Error Messages4 – �
4.1 IntroductionThe UGALT reports various errors as they are detected. When an error is detected, a message is shown on the front panel display and the error is logged for retrieval over the remote interface. Users must also check for RGA head errors. The RGA has its own micro-processor and its own error reporting commands. The RGA error status is monitored with the error query command, ER? For details, refer to RGA manual chapters 7 and 9.
UGALT error messages are divided into three groups: communica-tion errors, warning errors, and critical errors.
Communication errors are those related to miscommunication with a host computer. When a communication error is detected, UGALT flashes the warning LED once without changing display. It stores the error number corresponding to the error into the error stack. The error numbers for communication errors range from 9 to 29. Warnings are issued when UGALT is not able to carry out a com-mand sent over the remote interface or a menu selection chosen from the front panel. With a warning, the warning LED flashes for 4 seconds, a warning sound beeps, and the warning message is dis-played. After several seconds, the warning is no longer shown, and the display returns to the previously active display. The range of the warnings is from 30 to 60.
Critical errors are issued when the UGALT detects problems while monitoring various internal conditions, or trying to carry out a command or a menu selection.
The front panel displays the error message with error beeps, until a button on the front panel is pressed, or all the errors in the error stack are read up by sending “ZERR?” commands until it returns 0. The range of the critical errors is from 6� to �20.
ZERR? returns only an error code. To get a string describing the error code, use the ZEDS? [error number] query. For example, “ZEDS? 42” returns “Turbo not ready”.
Following is the list of errors that UGALT reports. The first column shows the error code, and the second column shows error messages showing on the display, followed by a description of each error.

Phone: (408)744-9040www.thinkSRS.com
UGALT Series Universal Gas Analyzers Lite
UGALT Error Messages 4 – �
� – 8 Reserved
9 “Invalid Command”, The command string does not start with a valid command name. �0 “Incomplete Command”, The command string ends without a ? or a parameter.
�� “Illegal Command”, Either a set only command was issued as a query or a query only command was issued as a set.
�2 Reserved
�3 “Missing Parameter”, A second parameter in a set command is missing. �4 “Extra Parameter”, Extra character(s) follow a valid command.
�5 “Out of range”, A parameter is out of range
�6 “Bad parameter”, A parameter is misformatted, such as an IP address, a Subnet Mask, a Gateway address, a login name, or a password.
�7 “Missing comma”, Command string does not have a comma after the first parameter.
�8–�9 Reserved
20 “Not a number”, A Parameter is not a number.
2� Reserved
4.2 Error Messages
4.�.1 Communication Error Messages

Stanford Research Systems UGALT Series Universal Gas Analyzers Lite
UGALT Error Messages4 – 4
22 “RGA on network”, When TCP/IP connection is open, the serial communication cannot talk to RGA.
23 “Command buffer full”, The UGALT received too many commands to process before time critical operations occur. Some of the commands are rejected.
24 “RGA buffer full”, The RGA received too many commands to process in time. Some of the commands are rejected.
25 “RGA unavailable”, RGA is not available to communicate when transitioning between power on and off, or transitioning into and out of leak test mode.
26 “String too long”, The login name and password should be �5 characters or less.
27 “Illegal character”, The login name and password changing commands, ZPNM and ZPPW accept alphanumeric characters 0-9, A-Z, a-z only.
28 “RGA OFF”, Communication to RGA is not allowed when the RGA is off.
29 Reserved

Phone: (408)744-9040www.thinkSRS.com
UGALT Series Universal Gas Analyzers Lite
UGALT Error Messages 4 – �
30 Reserved 3� Reserved
32 “Bypass valve CLOSED”, The sample vale is not allowed to open, when the roughing pump is not off, and the bypass valve is CLOSED.
33 Reserved
34 “Sample valve OPEN”, The bypass valve is not allowed to CLOSE, when the roughing pump is not off, and the sample valve is open. The roughing pump is not allowed to turn on or idle, when the sample valve is open.
35 Reserved
36 “Roughing pump OFF”, The turbo pump is not allowed to turn on or idle, when the roughing pump is not on, or idle.
37 “Roughing pump ON”, The vent valve is not allowed to turn on, when the roughing pump is on.
38 “Rough pressure HIGH”, The roughing pump is not allowed to turn idle, when the roughing pressure is higher than 2 Torr. 39 – 40 Reserved
4� “Turbo pump running”, The roughing pump is not allowed to turn off, when the turbo pump is not off.
42 “Turbo not ready”, The RGA and the ion gauge are not allowed to turn on, when the turbo pump is not on, or idle.
4.�.� Warning Error Messages

Stanford Research Systems UGALT Series Universal Gas Analyzers Lite
UGALT Error Messages4 – �
43 “RGA ON”, The turbo pump is not allowed to turn off, when the RGA is on.
44 Reserved
45 Reserved
46 “IG ON”, The turbo pump is not allowed to turn off, when the ion gauge is on.
47 Reserved
48 Reserved
49 “AUTO sequence ON”, Pressure Interlock Option is not allowed to change during one of the automatic sequences: start, sleep, and stop. 50 “Interlock triggered”, The user interlock on the back panel is triggered to stop the system.
51 “Pressure Interlock off”, START sequence is not allowed to initiate with Pressure Interlock off.
52 Reserved
53 “Fac. Default Loaded”, (�) With turning UGALT on with the STOP button pressed, Factory default setting is loaded instead of the saved parameter setting. It is used to reset the instrument to a known setting. (2) Factory default setting is loaded during the power up due to EEPROM setting corruption.
54 - 60 Reserved

Phone: (408)744-9040www.thinkSRS.com
UGALT Series Universal Gas Analyzers Lite
UGALT Error Messages 4 – �
6�– 72 Reserved
73 “No IG detected”, The ion gauge control board is not detected.
74 “IG unexpected off”, The ion gauge turned off without reporting an error to the UGALT.
75 Reserved
76 “IG voltage”, No power on the ion gauge controller board. The ion gauge failed to maintain the grid voltage. This condition turns off the ion gauge. 77 “IG emission”, The ion gauge failed to maintain the emission current. This condition turns off the ion gauge.
78 “IG off failed”, The ion gauge is not turned off in time, probably due to miscommunication between the main control board and the auxiliary control board.
79 Reserved 80 “RGA off failed”, The RGA is not turned off in time, probably due to miscommunication between the main control board and the auxiliary control board.
8� - 84 Reserved
85 “No Vent valve”, No vent valve was detected.
86 – 88 Reserved
4.�.� Critical Error messages

Stanford Research Systems UGALT Series Universal Gas Analyzers Lite
UGALT Error Messages4 – �
89 “AUX comm. error”, Communication between the main control board and the auxiliary control board did not work properly at least for a second.
90 “Main board reset”, When the main control board powers up, the auxiliary control board reports that the turbo pump is on. It indicates the main control board is reset, while the auxiliary control board is on.
9� Reserved
92 “No PG detected “, Pirani gauge is not detected.
93 “No PG filament”, The detected current through the Pirani gauge is too small; this probably means the PG filament is damaged.
94 “PG short-circuited”, Too much current flows through the Pirani gauge.
95 “PG malfunction”, The roughing line pressure reading of the Pirani Gauge is lower than �0 mTorr or higher than ��00 Torr for �0 seconds. This condition initiates the STOP sequence.
96 Reserved
97 Reserved
98 “BP too high”, The sample line pressure did not reach �.5 Torr in 2 minutes with the sample valve closed. Or the sample line pressure did not reach 5 Torr in 2 minutes with the sample valve open.
Phone: (408)744-9040www.thinkSRS.com
UGALT Series Universal Gas Analyzers Lite
UGALT Error Messages 4 – �
99 “BV too high”, The sample line pressure did not reach �.5 Torr in � minute. The bypass valve closes with this error.
�00 “SV too high”, The sample line pressure is over 5 Torr for 2 second, when the sample valve is open, and the roughing pump is not off. The sample valve closes with this error.
�0� Reserved
�02 “RP too high”, The chamber pressure did not reach 5 Torr in 2 minutes.
�03 Reserved
�04 “TP too high”, Turbo pump did not reach the full speed in �0 minutes.
�05 “IG too high”, The ion gauge reading is over 2.�E-5 Torr for 6 seconds.
�06 - �08 Reserved
�09 “No TP controller”, The turbo pump controller is not detected.
��0 “TP stop failed”, The turbo pump is not turned off in time, probably due to probably due to miscommunication between the main control board and the auxiliary control board.

Stanford Research Systems UGALT Series Universal Gas Analyzers Lite
UGALT Error Messages4 – 10
Error 111 – 120 These error conditions are detected by the turbo pump controller. Once one of these errors occurs, the UGA must be power cycled to clear the error.
��� “TP current”, Turbo pump controller output current exceeded �5 A.
��2 “No TP connected”, No turbo pump is connected to the controller.��3 “TP overload”, Turbo pump controller output current exceeded �.5 A longer than �5 seconds.
��4 “TP bearing hot”, Turbo pump bearing temperature is higher than 60 °C.
��5 “TP hot”, Turbo pump heat exchange temperature is higher than 60 °C.
��6 “TP start”, Turbo pump did not reach the full speed at run up time.
��7 “TP input voltage”, TP controller input voltage is lower than �6 V for 5 seconds.
��8 “TP op voltage”, TP controller operating voltage is lower than �0 V for 5 seconds.
��9 “TP low voltage”, TP controller Vp is 8V lower than nominal for 5 seconds.
�20 “TP soft start”, Soft start ramp has not ended within the expected time.
�2� - �25 Reserved
�26 “Too many Errors”, More than �0 errors have occurred since errors were read with the “ZERR?” command. The subsequent errors are discarded. This error will not be displayed on the front panel at all.
5 – �
Chapter 5
Calibration and Input Design
In This Chapter This chapter discusses procedures to help the user make accurate measurements with the UGALT. Several sections are devoted to calibration and cor-recting procedures. The last sections discuss spe-cific design for the pressure reduction.
5.� Mass Spectrometry Basics . . . . . . . . . . . . 5–2 How Mass Spectra are Interpreted . . . . . . . . 5–2 Partial Pressure Measurement . . . . . . . . . . 5–3 Partial Pressure Sensitivity Factors . . . . . . . . 5–6 Single Gas Measurement Example . . . . . . . . 5–8 Calibration. . . . . . . . . . . . . . . . . . . . . . 5–9 Effect of Total Pressure. . . . . . . . . . . . . . . 5–�0 Operating off the Design Pressure . . . . . . . . 5–�� Total Pressure and Composition . . . . . . . . . 5–�2
5.2 Calibration of Partial Pressure . . . . . . . . . 5–�3 Initial Calibration . . . . . . . . . . . . . . . . . . 5–�5 Basic Recalibration . . . . . . . . . . . . . . . . . 5–�6 Calibration for Multiple Operating Conditions 5–�7 Calibration with Fixed Reservoir . . . . . . . . . 5–�8 Corrections . . . . . . . . . . . . . . . . . . . . . 5–�8 Correcting for the chamber background . . . 5–�8 Correcting for multiple species . . . . . . . . 5–�9 Operation with Condensable Gases . . . . . . . 5–20
5.3 Pressure Reducing Inlet . . . . . . . . . . . . . 5–2� Flow Calculations. . . . . . . . . . . . . . . . . . 5–23 Diaphragm Pump . . . . . . . . . . . . . . . . . 5–26 Turbo Pump . . . . . . . . . . . . . . . . . . . . . 5–27 Capillary Design . . . . . . . . . . . . . . . . . . 5–28 Length & Bore. . . . . . . . . . . . . . . . . . . . 5–29 Materials and Fittings . . . . . . . . . . . . . . . 5–3� Extensions . . . . . . . . . . . . . . . . . . . . . . 5–32
5.4 References . . . . . . . . . . . . . . . . . . . . . . 5–33
Stanford Research Systems UGALT Series Universal Gas Analyzers Lite
Calibration and Input Design5 – �
5.1 Mass Spectrometry Basics
5.1.1 How Mass Spectra are Interpreted
The RGA can perform both qualitative and quantitative analysis of the gases in a vacuum system. Obtaining spectra with the RGA is very simple. Interpreting the spectra, that is, understanding what the spectra is trying to tell you about your vacuum system requires some work. The following sections will introduce some basic con-cepts of Spectral Analysis emphasizing the main aspects of Residual Gas Analysis. For additional information on the subject of Residual Gas Analysis refer to:
J. Drinkwine and D. Lichtman, Partial Pressure Analyzers and Analysis, AVS Monograph Series published by the Education Com-mittee of the American Vacuum Society
Basford et. al., J. Vac. Sci. Technol. A 11(3) (1993) A22-40 “Recom-mended Practice for the Calibration of Mass Spectrometers for Par-tial Pressure Analysis. Update to AVS Standard 2.3”.
For information on multiple linear regression analysis consult:
William H. Press, et. al., 1992, Numerical Recipes in C, The Art of Scientific Computing, Second Edition, Cambridge Univ. Press, sec-tion �5.4, page 67�.
Bevington, P.R., 1969, Data Reduction and Error Analysis for the Physical Sciences, New York, McGraw-Hill, Chapters 8-9.
A mass spectrum, taken in a real system, will almost always con-tain signals from a mixture of various gases. Careful and complete interpretation of the spectrum (i.e. a complete spectral analysis) should reveal the identity, as well as the concentrations, of the vari-ous components which have produced the spectrum.
The first step in the spectral analysis process is to correctly identify the mass-to-charge ratio of all the peaks in the mass spectrum. A well calibrated mass scale is essential to this task. See the RGA Tun-ing Chapter in the RGA manual for a detailed description of the mass scale calibration procedure.

Phone: (408)744-9040www.thinkSRS.com
UGALT Series Universal Gas Analyzers Lite
Calibration and Input Design 5 – �
Once all the peaks have been labeled, the next step is to identify the residual gases that have produced the spectrum. A knowledge of the recent history of your system may provide very valuable clues as to the possible gases that may be residuals in the vacuum chamber. A familiarity with the standard spectra of commonly expected gases will generally help to determine the major and minor components in the system. Any peak in the spectrum may consist of contribu-tions from molecular ions and/or fragment ions, or multiply ion-ized species. The qualitative spectral analysis is completed when all the peaks in the spectrum have been “uniquely assigned” to the components of a gas mixture, in complete agreement with the known fragmentation patterns of the components.
In cases where only the major components are of interest, some of the minor peaks of the spectrum will remain unassigned. If only a few species are being monitored, only the peaks corresponding to the substances of interest need to be assigned and monitored.
Notes on Fragmentation Patterns: The electron impact type of ion-izer used in modern RGAs almost always causes more than one kind of ion to be produced from a single type of gas molecule. Mul-tiple ionization, molecular fragmentation and changes in the isoto-pic composition of the molecule are responsible for the effect. All ions formed contribute to the mass spectrum of the molecule and define its fragmentation pattern. The identification and interpreta-tion of mass spectra must begin with a knowledge and understand-ing of the standard fragment patterns of atoms and molecules that may exist in the system. The standard fragment patterns of most molecules commonly encountered in residual gas analysis are well established and listed in the general RGA Literature. A very com-plete library can also be accessed through the Library Search Util-ity of the RGA Windows software. The Gas Library has a standard text file format, and can easily be read, extended or modified by the user to fit his individual needs.
Once the different components of a mixture have been identified it is possible to use the RGA to obtain quantitative values for the vari-ous partial pressures. This section describes the basic steps needed to perform quantitative measurements with the instrument. The
5.1.2 Partial Pressure Measurement

Stanford Research Systems UGALT Series Universal Gas Analyzers Lite
Calibration and Input Design5 – �
formalism presented assumes multiple gas analysis, but is equally valid for single gas measurements. Please consult the suggested references for details and examples of these procedures.
The entire mathematical formalism used to derive the partial pres-sures of a mixture based on a single mass spectrum is based on one assumption:
The total spectrum is a linear combination of the spectra of the different species that are present in the mixture. In other words, the total spectrum is equal to the sum of the individual peaks that would be observed if each constituent were alone in the system.In mathematical terms, the assumption stated above can be written as the following linear equation:
HM = ∑g hMg (1) where:g is an integer variable that represents the gases present (i.e. assign an integer to each gas starting with one)M is an integer variable that represents the mass numbers for the entire mass range of the spectrum.HM= total peak height (amps) of the spectrum at mass number M.hMg= peak height contribution (amps) from gas g at mass M.hMg is related to the fragmentation pattern, the RGA’s sensitivity and the partial pressure of gas g by the equation:
hMg = aMg Sg Pg (2)
where:aMg = Fragmentation factor of gas g at mass M: Ratio of ion signal at mass M to the ion signal at the principal mass peak for gas g.Sg = RGA’s partial pressure sensitivity factor for gas g, in amp/Torr (see Partial Pressure Sensitivity Factor below)Pg = Partial pressure of gas g in the system.
Equations (1) and (2) are combined to obtain the system of equa-tions:
HM = ∑g (Sg aMg ) Pg (3)
Phone: (408)744-9040www.thinkSRS.com
UGALT Series Universal Gas Analyzers Lite
Calibration and Input Design 5 – 5
Since all gases have more than one peak in their fragmentation pattern, the number of peaks (M) in a real spectrum is generally larger than the number of gases (g). As a result, the system of equa-tions (3) usually has more equations than unknowns. This situation is sometimes simplified eliminating some of the extra equations; however, the best results are obtained using all the equations and a multiple linear regression procedure to calculate the best possible fit to the data.
Obviously, accurate results can only be obtained if the constants aMg and Sg are well known for the RGA being used.
Note: The Analyze Utility of RGA Windows uses a multiple linear regression algorithm, as mentioned above, to automatically cal-culate the composition of a “typical residual gas environment” at the end of any 1-65 amu spectral scan. Please see the RGA On-Line Help files for details.
Standard fragmentation patterns (for example, the fragmentation patterns included in the RGA Library of RGA Windows) can be used as a source of aMg values in moderately quantitative deter-minations. However, when very precise numbers are desired, one should obtain the appropriate fragment patterns by introducing pure gas into the RGA being used. The fragment patterns must be obtained under the same conditions that will be used during regular spectral analysis since they depend on many instrumen-tal parameters, including: electron energy, emission current, ion-izer design, mass filter settings, detector type, multiplier gain, etc. The principal mass peak of a fragmentation pattern is simply the most intense peak of the spectrum, and the intensity of all the other peaks in the pattern are normalized to its height for the calculation of fragmentation factors. Note that by our definition the aMg value for the principal mass peak of any gas is equal to one. Principal mass peaks are used in the calculation of the sensitivity of the RGA to different gases as shown below.

Stanford Research Systems UGALT Series Universal Gas Analyzers Lite
Calibration and Input Design5 – �
5.1.3 Partial Pressure Sensitivity FactorsThe partial pressure sensitivity of the RGA to a gas g, Sg, is defined as the ratio of the change (H-H0) in principal mass peak height to the corresponding change (P-P0) in total pressure due to a change in partial pressure of the particular gas species. H0 and P0 are back-ground values.
Sg = (H-H0 ) / (P-P0 )
The units of Sg are of ion current per unit pressure (amp/Torr, for example).
The sensitivity of the RGA varies with different gases, changes with time due to aging of the head, and is a strong function of the op-erating conditions of the instrument. Careful quantitative analysis requires that the sensitivity factor, Sg , be determined for every gas which may be a component gas in the system being analyzed. The sensitivity factors must be obtained under the same operating con-ditions that will be used during general partial pressure analysis since they depend on many instrumental parameters, including: ionization energy, emission current, mass filter setting, type of de-tector, etc.
In order to separate the gain of the electron multiplier from the intrinsic sensitivity of the RGA head, the sensitivity factors of the RGA are defined for Faraday Cup detection. A separate Electron Multiplier Gain Factor, is used to correct the ion signals when the electron multiplier is turned on. See the Sensitivity and Electron Multiplier Tuning sections of the RGA Tuning Chapter for details.
The basic procedure for determining the sensitivity of a particular gas in the RGA is the following:
• Introduce the pure gas into the vacuum system, at a known or calculable pressure (typically around 10-6 Torr).• Measure the output signal from the RGA for the principal mass peak of that gas using the Faraday cup detector.• The ratio of this output signal to the pressure of the gas is the sensitivity factor, Sg .During these measurements it is very important to insure that the
Phone: (408)744-9040www.thinkSRS.com
UGALT Series Universal Gas Analyzers Lite
Calibration and Input Design 5 – �
partial pressures of all other gases in the system are small enough so that they may be neglected. The sensitivity factors calculated can only be applied to situations where the RGA is used with the same operating parameters. See the Sensitivity Tuning section in the RGA Tuning chapter of this manual for more details on this calibration procedure.
A total pressure sensitivity factor is also needed by the RGA to convert the ion currents obtained during total pressure measure-ments into total pressures. Total pressure sensitivity factors vary with different gases and share many of the properties of the partial pressure factors. They are determined by a procedure identical to the one described above, but with the partial pressure measure-ments replaced by total pressure measurements.
The underlying assumption when using sensitivity factors in quan-titative calculations is that there is a linear relation between the partial pressure and the corresponding RGA signals of the gases. Deviations from linearity are to be expected above 10-5 Torr due to space charge effects in the ionizer and ion-neutral scattering inter-actions in the filter. A more thorough check of the RGA’s sensitivity involves measuring the RGA signals over several orders of magni-tude of partial pressure to determine the range over which a linear relationship exists. The sensitivity factor for the gas is calculated as the slope of the “signal vs. partial pressure” response over the linear range.
RGA Windows uses two sensitivity factors stored in the non-vola-tile memory of the RGA Head. The sensitivity factors, one for total pressure and one for partial pressure, are used as conversion factors between the ion currents received form the head and the pressure units selected by the user. The sensitivity factors are measured with the Faraday Cup detector and can be updated or changed very eas-ily by using the Sensitivity Tuning command in the Head menu. A separate Electron Multiplier Gain Factor, stored in the non-volatile memory of the RGA Head, is used to correct the ion signals for the gain of the electron multiplier. The gain of the electron multiplier is highly mass dependent and defined relative to the correspond-ing FC signal. An automatic Electron Multiplier Gain Adjustment command, built into the program, can adjust the CDEM voltage for any gain between �0 and �06. Consult the RGA On-Line Help Files for details on the automated tuning procedures built into the RGA

Stanford Research Systems UGALT Series Universal Gas Analyzers Lite
Calibration and Input Design5 – �
5.1.4 Single gas measurement example
Windows program. Also see the Sensitivity and Electron Multiplier Tuning sections of the RGA Tuning Chapter for more general infor-mation.
The Table mode of RGA Windows offers scaling factors for all of its channels eliminating the limitations imposed by the single sensitiv-ity factor on multiple partial pressure calculations. For example, the scaling factors can be used to display correct partial pressure for all the species in a table if the ratios between the partial pres-sure sensitivities of the different components are known and only principal mass peaks are used to monitor them. The scaling factors can also be adjusted to correct against the mass discrimination of the electron multiplier’s gain.
Important: Following current industry standards, the partial pres-sure sensitivity factor stored at the factory corresponds to N2 mea-sured at 28 amu with ∆m�0%=1 amu, default ionizer settings and Faraday Cup Detection.
Monitoring the concentrations of one or few components in a sys-tem is easy in the absence of severe spectral interference.
Suppose a system where argon is measured at 40 amu (principal mass), in the absence of any other gases that contribute a signal at that mass value. The sensitivity to argon was previously measured at SAr=�0-4 amps/Torr, and the electron multiplier is biased and its gain at mass 40 was previously measured at gCDEM=�.02x�03 relative to the FC signal.
The partial pressure of argon, PAr, is easily calculated measuring the intensity (i.e. peak height) of the ion current at mass 40, I40.
PAr = I40 / (gCDEM•SAr), units of Torr (4)
The peak value, I40 , can be extracted from a spectral scan or mea-

Phone: (408)744-9040www.thinkSRS.com
UGALT Series Universal Gas Analyzers Lite
Calibration and Input Design 5 – �
sured directly using the single mass measurement mode of the RGA. For example, a �0-9 amp peak value corresponds to 9.8 × �0-9 Torr of Ar. Note that equation (4) is a particular case of equation (3), and that the fragmentation factor for the principal peak of Ar is one by definition.
The UGALT has been calibrated at the factory to measure the par-tial pressure of nitrogen correctly. For many purposes this will be suitable. Overtime the calibration can change or operating condi-tions may change. There are many factors involved in calibrating the UGALT and interpreting the mass spectra. To make accurate measurements, the following conditions need to be met:
• The total pressure needs to be known.• The main sensitivity factor needs to be calibrated. Sensitivity factors change as a factor of time due to aging and periodic recalibration is necessary.• For careful quantitative analysis, it is important that the sensitivity of the RGA be determined for every gas which may be a component of the system. Each gas component in the sample will fragment differently and will have slightly different sensitivities.• Correct calibration of the mass scale is essential during qualitative analysis for the correct assignment of mass numbers to the different peaks. The mass scale will affect the peak height if it is more than 0.3 amu out of calibration.• The mass resolution of the quadrupole mass filter, ∆m�0%, must be kept at or under � amu to avoid overlap between adjacent peaks. Changes in ∆m�0% during the measurements (caused by aging, severe contamination and large temperature changes) will cause variations in the sensitivity of the instrument and the shapes of the fragmentation patterns of the molecules, affecting all quan- titative measurements.• The gain of the electron multiplier is mass dependent and needs to be determined prior to performing measurements with the device. The gain characteristics of the multiplier change with time and periodic recalibrations are very im- portant.
The following sections of this chapter describe several procedures
5.1.5 Calibration

Stanford Research Systems UGALT Series Universal Gas Analyzers Lite
Calibration and Input Design5 – 10
5.1.6 Effect of Total Pressure
designed to assure that all the calibration conditions described above are satisfied prior to a set of partial pressure measurements. All tuning procedures can be executed from RGA Windows soft-ware. Users writing their own programs can implement the pro-cedures themselves, using the RGA Command Set and the instruc-tions in the RGA manual.
All the tuning procedures require the ability to introduce pure gas-es (or a mixture of gases of known composition) into the system and a reference pressure gauge. All pressures are absolute; it is possible to make measurements in gauge pressure.
Important: Tuning should only be attempted after the unit has been warmed up (with the filament on and under typical operating con-ditions) for at least one hour.
Increasing the total pressure at the inlet of the capillary will in-crease the flow through the capillary. The higher flowrate in turn will increase the pressure at the RGA. This effect is not linear and in applications where the inlet pressure varies, the user needs to understand the flow at the inlet. The flowrate or throughput of the capillary is characterized by
Q = C(Pin - Pout),
where Q is the throughput (a mass flowrate), C is the conductiv-ity of the capillary, and Pin & Pout are the pressures at the inlet and outlet of the capillary. The inlet pressure is much larger than the outlet pressure, which allows Pout to be approximated as zero. The conductivity is a function of the capillary dimensions, the viscosity of the gas, and the pressure drop across the capillary. This results in the throughput, Q, being proportional to the square of the inlet pressure. The diaphragm pump dictates the pressure at the outlet of the capillary according to
where SDP is the speed of the pump. The speed of the diaphragm
PQ
SoutDP
=

Phone: (408)744-9040www.thinkSRS.com
UGALT Series Universal Gas Analyzers Lite
Calibration and Input Design 5 – 11
pump varies with throughput according to its characteristic curve, referred to as a speed curve. The speed curve is not linear. Because the pump has an ultimate vacuum it can achieve, the intercept of the curve is not even zero. The aperture and turbo pump respond linearly to Pout. Although all these factors can be modeled, the over-all response of the UGALT to total pressure is best characterized experimentally. A short experiment with the specific gas of interest, equipment and operating conditions will yield a curve describing how the pressure at the RGA varies with Pin.
Each system is specified for one inlet pressure, the design point, which is atmospheric pressure for the standard capillary. The capil-lary accomplishes the first stage of the pressure reduction from the chosen design point to about � mbar. The aperture in the UGALT is fixed, and designed to reduce the pressure from 2 mbar to about 5×�0 -6 mbar at the RGA. Each capillary is designed for the specific inlet pressure; mainly by choosing length and bore diameter. The inlet pressure to the capillary can be applied up to �0 mbar. Be-cause the UGALT has a separated bypass pump, the inlet pressure can go as high as turbo pump could hold the proper pressure for the RGA (below 1x10⁻⁴ mbar). Operating the inlet at high pressures would cause two unacceptable effects: First, the turbo pump ex-haust pressure would be excessive and slow the pump. The high pressure would increase the work load and cause excessive heat-ing of the pump bearings. In the UGALT, these fault conditions are prevented. The turbo pump contains a thermocouple which monitors the bearing temperature and shuts down the pump be-fore it overheats. Also, the system microcontroller will shutoff the turbo pump and will give the error message. The second effect is excessive pressure at the RGA, which can degrade the filament if it occurs for long periods. This fault condition is also prevented by two means. The RGA will shut off the filament when it senses the pressure is high and the system microcontroller will close the sample valve. These operating limits restrict the dynamic range of the UGALT with respect to increasing the inlet pressure above the design point. The instrument has little “head-room” and the capil-lary should be designed for the maximum expected pressure.
Below the design point, the UGALT can tolerate large decreases in the inlet pressure. The ultimate vacuum of the diaphragm pump limits the lowest pressure at the outlet of the capillary, typically
5.1.7 Operating Off the Design Pressure

Stanford Research Systems UGALT Series Universal Gas Analyzers Lite
Calibration and Input Design5 – 1�
5.1.8 Total Pressure and Composition
to 0.5 mbar. This pressure is the only operating limit; below it gas would flow out of the RGA. With respect to measurements, operating the outlet of the capillary near the ultimate vacuum of the diaphragm pump is inadvisable. At the ultimate vacuum, the flow through the pump is effectively zero. Operating the UGALT with zero flow obliterates the fast response time of the instrument. While there are no physically harmful effects to operating below the design point, the ability to make measurements is lost at very low inlet pressures. Best performance of the system requires that the outlet of the capillary is between 1 to 3 mbar. The later section of this manual discusses in greater detail the design of capillaries.
The RGA measures partial pressure of the components in a gas stream. For ideal gases, the partial pressure is related to composi-tion by
where Pi is the partial pressure of the i-th component, xi is the mole fraction of the i-th component and PT is the total pressure. It is evi-dent from this equation that a measurement of Pi cannot determine both xi and PT. To determine the composition, xi, a value for PT must be known. In many applications total pressure is constant and therefore partial pressure is proportional to mole fraction. When total pressure is not constant, a method of determining its value must be employed to allow composition to be determined.
In theory, the sum of the partial pressures determines the total pres-sure, i.e.
In practice, this summation requires care. For example, when us-ing the P vs. t mode to acquire data, make sure to record all the major components of the gas being analyzed. Beware of overlap-ping peaks; these complicate the analysis. For example, consider a 50/50 mixture of nitrogen and carbon dioxide. The parent peaks for these gasses are at 44 and 28. Referring to the library in the
P x Pi iT=
P PTi
i
=∑

Phone: (408)744-9040www.thinkSRS.com
UGALT Series Universal Gas Analyzers Lite
Calibration and Input Design 5 – 1�
software shows that nitrogen produces a peak at masses 28 and 14 that are 93% and 6% of the partial pressure and that carbon dioxide produces peaks at masses 44 & 28 that are 78% & 9% of the par-tial pressure. For a �000 mbar total pressure, the spectrum would show peaks at 28 & 44 with heights of 510 and 390 mbar. An er-ror can be demonstrated by using these peak heights and revers-ing the calculation, while ignoring the interference. The carbon dioxide partial pressure would be correctly calculated as 500 mbar (=390/0.78), but the nitrogen would be erroneously calculated as 548 mbar (=510/0.93) mixture. The mixture appears to be present at a total pressure of 1048 mbar and a composition of 52/48. The correct calculation would first subtract the component of the peak at mass 28 which was caused by carbon dioxide, before calculating the nitrogen partial pressure. More discussion of the quantitative analysis of complex mixtures can be found in the texts listed in the Reference section.
All quantitative calculations performed with the RGA rely on the assumption that there is a linear relation between the partial pres-sure and the corresponding RGA signals of the gases. Each gas ion-izes differently, and its ions make it through the mass filter with different efficiencies. As a result the proportionality constant relat-ing the ion current of a gas to its partial pressure is dependent on the specific gas.
Two calibration factors are used in the UGALT system: the RGA sensitivity and the pressure reduction factor. The RGA sensitivity is the factor which converts the ion current that is measured by the electrometer to partial pressure at the ionizer. The pressure reduc-tion factor accounts for the large pressure reduction performed by the two stage inlet (capillary and aperture). Determination of these factors requires comparing the system with a known-accurate pres-sure gauge and calculating the factor that makes the UGALT agree with the standard. Calibration is not necessary on a frequent inter-val, but is required whenever operating conditions change.
The RGA intrinsically measures an ion current, which is propor-tional to the partial pressure at its ionizer. While the software can be set to report ion currents, most users will need to measure par-tial pressure at the inlet of the capillary. To convert between the
5.2 Calibration of Partial Pressure

Stanford Research Systems UGALT Series Universal Gas Analyzers Lite
Calibration and Input Design5 – 1�
two, the partial pressure reported by the software is calculated by the formula:
The pressure reduction factor is a function of the capillary dimen-sions, the performance curve of the pumps, and the dimensions of the aperture. The sensitivity factor is a function of the precise di-mensions of quadruple and ion optics, the state of the detector, the ionizer filament, and the four parameters which control the filter (electron energy, focus voltage, ionizer current, and ion energy). In the equation above, the two factors are unknown. During calibra-tion only the standard partial pressure and measured ion current are known. Therefore, both factors cannot be determined; only the overall factor can be determined. Both factors can be determined if a second reference pressure gauge is introduced into the RGA chamber. While this approach would yield another reference pres-sure and allow both factors to be accurately determined, it has no practical benefit.
Because only the ratio of the two factors is relevant, strictly speak-ing, one of the factors could be chosen to be any number. An obvi-ous choice is to make one of the factors equal to one and use only the other. Because the sensitivity factor is stored in the RGA, this choice causes practical problems. The RGA firmware limits the sensitivity factor to reasonable values. The sensitivity factor must be on the order of 10-4 to �0-5 A Torr-�, which are typical values. The pressure reduction factor is stored by the software in each .RGA file. With the two values stored in different locations, there are ben-efits for using each to account for various components of the overall calibration factor.
Both factors cannot be determined; therefore, each time the instru-ment is calibrated, one of the factors will be assumed to be correct, and the other will be adjusted to make the measured and reference values agree. The strategies for using each value are discussed in the following sections, starting with the basic technique that was performed at the factory.
P = ion current (A ) pressure reduction factor
sensitivity factor (A T orr )= ion current (A ) overall factor (T orr A )i -1
-1× ×

Phone: (408)744-9040www.thinkSRS.com
UGALT Series Universal Gas Analyzers Lite
Calibration and Input Design 5 – 15
Initially, a default value is stored in the RGA for its sensitivity factor. This factor is displayed by selecting the “Head|Get Head Info...” menu item in the software. This value was determined at the fac-tory using a reference ion pressure gauge. Users can resort to this default value when they wish to completely recalibrate the instru-ment. The pressure reduction factor is calibrated using the partial pressure of nitrogen present in air using the following steps:
1. Determine the barometric pressure, which is typically reported in “in Hg”. Example: on a typical clear day the pressure is 29.95 in Hg or 761 Torr (1 in Hg = 25.4 Torr).2. Nitrogen is naturally present at 78.1% of total pressure. Multiply by this factor to yield the partial pressure. Exam ple: on that day nitrogen is present at 594 Torr.3. Gases break into molecular fragments in the ionizer. For common gases, fragmentation factors exist that indicate what fraction of the molecules remain intact. For nitrogen 92.6% of the molecules will remain intact and will be mea- sured at mass 28. Multiply the partial pressure by this fraction to determine the reference value. Example: the reference value would be 550 Torr.4. With the pressure reduction factor disabled (or set to 1), measure the peak at mass 28. Example: the system indicates �.3 × �0-6 Torr at mass 28.5. The pressure reduction factor is the reference value divided by the measured value. Example: the factor is cal culated to be 4.2 × �08 for this instrument.6. Enter this number in the pressure reduction factor dialog box and check the enable box.
This completes the calibration. All modes of the software will now report partial pressure at the inlet to the capillary. Be sure to record these values as they can be used to diagnose system performance. The pressure reduction factor is saved in the .RGA file; make sure to select File|Save to record the new pressure reduction factor.
5.2.1 Initial Calibration

Stanford Research Systems UGALT Series Universal Gas Analyzers Lite
Calibration and Input Design5 – 1�
5.2.2 Basic RecalibrationSome situations will require recalibration of the instrument. For example:
• aging of the diaphragm pump and ionizer filament• small changes in the total pressure at the capillary inlet• small dimensional changes to capillary and aperture
For users of one capillary and one input stream, an easy method of making small changes to the calibration values is available with the Sensitivity Tuning feature of the software. Under this method, we assume that the pressure reduction factor is correct and change the RGA sensitivity factor.
Nitrogen is the most common recalibration gas, and in this exam-ple, we assume that the partial pressure of nitrogen in air is used as a reference. While air is convenient, the recalibration can be per-formed with any test gas as a reference. Follow these steps to reca-librate the UGALT:
1. Make sure that the pressure reduction factor is enabled and correct in the dialog box that appears under the “Utilities|Pressure Reduction...” menu item. 2. Setup the UGALT to sample the reference gas.3. Choose the “Head|Sensitivity Tuning...” menu item to make the Sensitivity Tuning dialog box appear. Make sure the Measure-ment Mode is set to Partial Pressure and that the Mass Selection is set to the parent peak of the reference gas.4. Enter a value in the Reference Pressure Reading edit box that is the expected value for the pressure at the capillary inlet. This value should be adjusted for the fragmentation factor as done above (92.6% for peak 28 from nitrogen). As in the example in the previous section, the reference reading is 550 Torr for nitrogen in air at a barometric pressure of 29.95 in Hg.5. Observe the value in the Sensitivity Factor text box and then press the Measure button. A new value will be displayed in the text box, which should be close to the old value.6. Press the Accept button to store the newly calculated value into the RGA or the Undo button to restore the previous button.
The instrument is now recalibrated. Note that the new sensitivity

Phone: (408)744-9040www.thinkSRS.com
UGALT Series Universal Gas Analyzers Lite
Calibration and Input Design 5 – 1�
factor is only correct when used with .RGA files that contain the matching pressure reduction factor. This procedure can be repeat-ed frequently to make minor adjustments to the overall sensitivity factor. Because the range of the RGA sensitivity factor is limited by firmware, this procedure cannot be used to account for large changes in the overall sensitivity factor.
The UGALT capable of being used over a variety of operating con-ditions, which in turn require different overall sensitivity factors. Examples are:
• one UGALT system used with multiple capillaries• measurements of gas streams at different total pressure, temperature, or composition• measurements at multiple ionizer conditions
The RGA sensitivity factor is not meant to be directly adjusted by the user. The software only allows this value to be changed via the Sensitivity Tuning dialog box using a reference gauge reading. Us-ers cannot type a new value into the Sensitivity Factor text box. In-stead, the Pressure Reduction Factor feature is provided to account for widely varying operating conditions.
The Pressure Reduction Factor is stored in the .RGA files. When using the UGALT with various operating conditions, one .RGA file can be made for each set of conditions. Each of these files will con-tain a different pressure reduction factor. The procedure to deter-mine the pressure reduction factor is the same as used in the Initial Calibration section above. Briefly: disable the pressure reduction factor, compare the measured value with a reference, and calculate a new pressure reduction factor. When determining the pressure reduction factor for each set of conditions, make sure that the RGA sensitivity factor has not been changed.
To use the UGALT at one of the multiple conditions, simply open the appropriate .RGA file and connect the window to the ECU (if the ECU is already connected to another window, disconnect from
5.2.3 Calibration for Multiple Operating Conditions

Stanford Research Systems UGALT Series Universal Gas Analyzers Lite
Calibration and Input Design5 – 1�
5.2.4 Calibration with Fixed Reservoir
5.2.5 Corrections
5.2.5.1 Correcting for the Chamber Background
that window first). The software will now be ready to make mea-surements.
It is worth restating that the pressure reduction factor is only ac-curate when used with the matching RGA sensitivity factor. The value in the RGA electronics can be changed by other users, so the RGA sensitivity factor should be recorded or locked using the secu-rity feature of the software.
Air is a convenient calibrant gas for the UGALT, but only provides nitrogen as a useful reference. The other major components, e.g. oxygen, water, and carbon dioxide, are not present at reliable con-centrations. For more precise calibrations a reservoir and pres-sure gauge can be used as a calibrant. When using this method, be aware that the UGALT continuously draws �-5 milliliter per minute of gas, depending on the capillary. The reservoir should be large or the total pressure will change quickly.
Even with the sample flow and bypass flow valves closed, their will be a noticeable background in the mass spectrum. This background in the analyzer chamber is caused by outgassing from the chamber surfaces and gas production from the ionizer of the RGA. These two processes account for the ever present background of hydro-gen, water, nitrogen, oxygen, and carbon dioxide seen in high vacu-um. The outgassing of water can be minimized by extensive pump-ing with both valves closed; typically the system can achieve water partial pressures around � × �0-8 mbar. The other process (ionizer) is fundamental and cannot be reduced. The ultimate vacuum of the turbo pump causes nitrogen to be present at no lower than 2 × �0-9 mbar and oxygen at 1/4 of that level. Carbon dioxide from the ion-izer will be present at levels from 10-9 to �0-7 mbar. The software contains a background subtraction feature that allows the chamber background to be removed from the mass spectrum.
The background spectrum is correctly measured with the sample
Phone: (408)744-9040www.thinkSRS.com
UGALT Series Universal Gas Analyzers Lite
Calibration and Input Design 5 – 1�
valve closed and the bypass valve closed. When the bypass valve is open, the background pressure at the chamber is rising due to the backstreaming through the bypass valve. However, the back-streaming components will be flushed out when the sample valve is open. Therefore, the background spectrum should be obtained with both valves closed. The software can only subtract two spec-tra when they cover the same mass range. Set the software to ac-quire the spectrum (either histogram of analog) at the speed, range, and schedule you require. To obtain a background subtracted spec-trum, follow these steps:
�. Measure one complete analog or histogram mode spectrum with the sample valve closed. If the software was set to scan on a continuous schedule, you can select “Stop at End” from the “Scan” menu to stop when the current scan in progress is complete. The data displayed must be a complete scan, and be measured with the same parameters as the scans to follow.
2. Under the Utilities menu, select “Background” and select “Scan Data - Background” from the dialog box. Check the box next to “Enable” and select “OK” to close the dialog box. This makes the current spectrum the background and all spectra displayed subse-quently will have this spectrum subtracted from it.
3. Open the sample flow valve and start the scan with the “GO” button. The newly acquired spectra are the background cor-rected result.
The ability to subtract background is limited by signal proportion-al noise, which is typically present at between 1-10% of the signal magnitude. Because this noise originates in the ionizer of the RGA, subtraction cannot remove much more than 90% of the background. This limits the ability to see small changes of less than 1% at the same mass as peaks present in the background.
As discussed above, the UGALT is calibrated at one mass num-ber. Because every gas behaves differently, analog scans can only show peak heights that are correct at the one mass number. It is not possible to correct the analog and histograms at every mass number. The RGA would have to know what species was caus-
5.2.5.2 Correcting for Multiple Species
Stanford Research Systems UGALT Series Universal Gas Analyzers Lite
Calibration and Input Design5 – �0
5.2.6 Operation with Condensable Gases
ing the ion current at each mass. As an example: is ion current at a m/z of 16 caused by a fragment of H2O (O+�), a fragment of O2 ( O2
+2, or O+�), or CH4+� . Many of the peaks in a mass spectrum have
multiple sources. To demonstrate this to yourself, use the library search on almost any single mass number. Except for a few values, the search will retrieve multiple species for almost all the low mass peaks. Without knowledge of what species is causing what peak, the correction cannot be made automatically. Practically, this is not a problem; the histogram and analog modes are intended to show qualitative composition.
The table modes (table, P vs. t, and annunciator) contain a calibra-tion factor for each species. These factors are provided to resolve the problem with the mass spectrum just discussed. The user can use these factors to tell the software how to correct for each peak. To determine the correct calibration factor to use, you must know (or assume) what species is causing each peak and choose masses that are not complicated by other species. Choosing the correct peaks is complicated and requires understanding of the mass spec-trum. For instance in a 50/50 mixture of nitrogen and carbon di-oxide, you cannot use mass 28 to measure the nitrogen. With this mixture, about 10% of the peak at 28 would be caused by a frag-ment. A better choice would be to use the peak at 14 to measure nitrogen. Once you have chosen a mass that is representative of each species of interest, you then refer to published fragmentation factors (see references) to determine how to correct back to the par-ent peak. Even if the instrument was calibrated for nitrogen, it was likely calibrated on the peak at 28. The peak at �4 will not be cor-rect; it will be about 7% of the correct value. Entering 14.2 (1/0.07) as a calibration value in the table parameters allows the software to correct the partial pressure reading. Similar calibration factors are entered for each species being measured. A calibration gas of known composition makes process of determining factors easy. First make a measurement of the standard with all the factors set to 1. From this measurement, a correction for each species can be calculated and entered into the tables. The references listed at the end of this manual contain discussions about how to interpret mass spectra from RGA’s.
The UGALT is designed to sample gases that are nominally at room temperature. Under these conditions, any species that is a gas in

Phone: (408)744-9040www.thinkSRS.com
UGALT Series Universal Gas Analyzers Lite
Calibration and Input Design 5 – �1
at inlet conditions can be expected to travel through the instrument without condensing. Without a heat input, a gas will cool as it expands through a capillary and pressure reduction aperture (ac-cording to its Joule-Thompson coefficient). In the UGALT system, the absolute pressure difference across the aperture is small and the flow rate is small; under these circumstances the interior metal surfaces can provide sufficient heat to the expanding gas to keep it from condensing. If problems due to condensation are suspected, the capillary with the heater can be used. The goal of heating the capillary is to increase the heat transfer rate to the sample gas.
When the gas being measured is significantly hotter than the UGALT system, condensation is likely and presents a problem. If the species at the inlet are gases only at temperatures above room temperature, they can condense when they reach the UGALT. The condensed material will continually build up in the UGALT and cover the valve seats and aperture. Two approaches can prevent this problem: control the location of condensation or prevent con-densation. The first approach can be very simple: place screens or metal plates before the inlet to provide sacrificial surfaces for con-densation. The sacrificial surfaces should have good thermal con-nections to the outer walls so that they stay at room temperature. These surfaces will act like a trap and prevent the unwanted mate-rials from passing into the UGALT. The second approach involves operating the entire UGALT inlet above the condensation tempera-ture of the condensable material. This may be feasible if the operat-ing temperature is below �00 °C. All the tubing components in the inlet can be heated to �00 °C or more. The electronics and pumps cannot operate at elevated temperatures. This approach (keeping the tubing hot and electronics cool) is a difficult task and therefore is not recommended.
The gas handling subsystem is designed to achieve several goals:
• reduce the pressure of the sample gas to the operating range of the mass spectrometer (<10-5 mbar)• provide a quick response time to changes of sample composition at the inlet• allow for easy connection to system being measured• use conventional materials
5.3 Pressure Reducing Inlet

Stanford Research Systems UGALT Series Universal Gas Analyzers Lite
Calibration and Input Design5 – ��
If only the first goal where important a single stage pressure reduc-tion would be suitable. For example, about 50 cm of 50 mm capillary would perform the re-quired pressure reduction. In a single stage design, all the gas that enters the capillary is delivered to the spectrometer chamber. For a 80 L s-� pump, the flowrate at the capillary inlet is 80 nL s-� ! The velocity of the gas near the capillary inlet is very small. To demon-strate, the figure at the right shows the end of a 1/16” OD capillary and a hemi-spherical boundary of the same diameter. The time it would take to drain the volume inside the boundary is a measure of the response. For the small volumetric flowrate in this example, it would take 30 seconds to drain the tiny volume. This low speed implies that the capillary relies on diffusion or forced convection to respond to concentration changes.
The effect of a low flowrate on leak detection is catastrophic. Imag-ine trying to locate a leak by moving the capillary tip around a fit-ting on a gas line. With the capillary in the example above, you could be 1/16 of an inch away from the leak source and not detect it for 30 seconds. To locate the leak, you would either have to move incredibly slow, or be exactly at the leak.
Low flowrates also severely restrict the inlet. At the left is shown a capillary with a syringe tip filter installed. The gap between the fil-ter element and the end of the capillary (about 1/16 inch in this ex-ample) creates a dead volume. If this volume is approximated to be well mixed, the time constant is over 5 seconds. The time constant relates to the rate at which a system responds to a step change and
is characterized by the familiar [ ]1− −exp t tc response. In this ex-ample, a sudden change outside the filter would not be completely detected for over 15 seconds.
To achieve fast response, the UGALT uses a bypass flow configura-tion, which draws 200-1000 times larger flowrate through the capil-lary. The same amount of sample is delivered to the spectrometer. As the name implies, most of flow is bypassed around the spec-trometer. Also the pressure drop across the capillary is now only a factor of 1000 (as opposed to 1 billion). This means the capillary can either have a larger bore or be shorter than in a single stage

Phone: (408)744-9040www.thinkSRS.com
UGALT Series Universal Gas Analyzers Lite
Calibration and Input Design 5 – ��
system. The lower pressure drop makes feasible many capillary materials commonly used in gas chromatography. The following sections discuss details of the flow of the sample gas within the instrument.
The pressure and flowrate of the sampled gas can be calculated with simple formulas. The calculations here assume that gases behave ideally, which is a reasonable approximation at the temperatures and pressures involved. Actual system performance compares well with these simple calculations.
The pressure drop across a length of tube is related to the flowrate and dimensions by:
(1)
where Q is the throughput, C is the conductivity, and ∆P is the pressure drop. Throughput is a measure of mass flowrate com-monly used in vacuum systems. Typical units for Q are mbar liter s-�, which unless stated otherwise, implies a standard temperature. At STP (273.15 K and 1013.25 mbar) 1 mbar liter s-� is equal to 1.013 cm3 s-� (sometimes abbreviated sccs). The conductivity of various geometries is calculated with the standard formulas available in texts discussing vacuum (see References).
The pressures and flow at every point in the system is determined by applying equation 1 to each section of tube. A simplified flow schematic of the UGALT is shown below.
5.3.1 Flow Calculations
( )Q C P P C Pin out= − = ∆

Stanford Research Systems UGALT Series Universal Gas Analyzers Lite
Calibration and Input Design5 – ��
Fig. 5-1. Schematic of key components of system.
For this example there are four points at which the pressure is un-known, Pa, Pb, Pc, and Pd. Applying equation 1 between each pair of points will yield a set of equations to solve. First all the sampled gas flows through the capillary:
( )Q C P P C Ptotal cap a b cap a= − ≅ (2)
Because Pa >> Pb , the approximation can be made. When the flow reaches the aperture it is split into two streams, bypass and sample. The sample flow is a small fraction of the total flow, so we can as-sume that the bypass flow is equal the total and write the equation from the tee to the diaphragm pump as:
bBPtotal PSQ ×= (3)
where SB is the speed of the Bypass diaphragm pump and has the same units as conductivity (liter s-� ). The flow through the aperture is:
( )Q C P P C Psample ap b c ap b= − ≅ (4)

Phone: (408)744-9040www.thinkSRS.com
UGALT Series Universal Gas Analyzers Lite
Calibration and Input Design 5 – �5
where again the large pressure drop allows the approximation to be used. Lastly, the turbo pump is an active component that is char-acterized by
P Q Sc sample= (5)
where S is the speed of the pump and has the same units as conduc-tivity (liter s-� ). For the pump in the UGALT, the speed is a constant at 80 liter s-� (except for He and H2).
The speed of the diaphragm pump is not a constant; it is a function of the inlet pressure. A typical speed curve is shown in the graph below.
inlet pressure (mbar)
spee
d (li
ter/
min
ute)
0
Fig. 5-2. Speed curve for a diaphragm pump.
The curve shows an important feature: the speed goes to zero at a finite pressure. This pressure is the ultimate pressure of the pump. At this pressure, gas travels backward through the pump at the same speed at which it is being pumped forward. Therefore, even though the pump is still operating, it effectively has no speed.
Equations 2 to 5 completely describe the system. Solution of the entire set would determine all the unknowns, except that there are

Stanford Research Systems UGALT Series Universal Gas Analyzers Lite
Calibration and Input Design5 – ��
5.3.2 Diaphragm Pump
more unknowns than equations. Typically, the inlet pressure is known and the desired pressure at the spectrometer is known leav-ing 5 unknowns. To simplify the calculations, Pb is chosen to be an acceptable value and the remaining values are solved for.
These equations demonstrate some important characteristics of the UGALT.• The pressure in the spectrometer chamber is directly pro-portional to the pressure at the exit of the capillary and largely con-trolled by the aperture. Choosing a different aperture has insignifi-cant effect on the remainder of the system.• The mass flowrate through the capillary is insensitive to changes in pressure at the exit of the capillary. This characteristic is very helpful to predicting the performance of different capillar-ies. If this where not true, the exit pressure of the capillary would be complexly related to the speed curve of the diaphragm pump. (This can happen when designing capillaries for low pressure).• The pressure at the exit of the capillary is dominated by the speed curve of the diaphragm pump and the mass flowrate through the capillary.
These last two characteristics greatly simplify the selection of alter-nate capillaries and is discussed later in this chapter.
Fig. 5-3. Measured pumping speed vs. the pressure at the pump inlet for the pump in the UGALT.

Phone: (408)744-9040www.thinkSRS.com
UGALT Series Universal Gas Analyzers Lite
Calibration and Input Design 5 – ��
A measured speed curve for the diaphragm pump is shown in the Figure 5-3. The speed is the volumetric flowrate at that pressure. Because mechanical pumps have much lower flowrates than turbo pumps, the speed is usually expressed in volume per minute. A pressure of 1.2 mbar is a typical operating point for the UGALT, which means the pump speed is �.5 liter min-� . The mass flowrate at the diaphragm pump and capillary inlet are the same. At the higher pressure of the capillary inlet, 1000 mbar, the corresponding volumetric flowrate is 1.8 milliliter min-�. The simple relation
P V P V1 1 2 2=
is a good approximation as long as temperature is constant. The speed is 2.6 liter min-� at 5 mbar, which corresponds to �3 milliliter min-� at �000 mbar. The turbo pump only operates with exhaust pressures up to approximately 5 mbar, which limits the useful range to that shown in Fig. 5-3. Thereby, capillaries are always cho-sen to draw volumetric flowrates of 1-10 ml min-�. The complete speed curve would keep increasing up to the pumps specification of 13 liter min-� at atmospheric pressure.
The ultimate pressure of the diaphragm pump can age, mainly by degradation of the valve seats. This aging will shift the zero inter-cept of the speed curve (Fig. 5-3) to higher pressures. For many operating pressures the effect is minimal, but pressures near the ul-timate pressure will show drastic speed changes. The implication is that operating the UGALT near the ultimate pressure of the dia-phragm pump requires careful monitoring and should be avoided when feasible.
The pump attached to the spectrometer chamber is hybrid turbo-molecular/drag pump. The hybrid design of this pump allows it to exhaust at high pressure (relative to conventional turbomolecular pumps). The pumping speed is constant at the nominal value of 80 L s-� over a large range of exhaust pressures. As the exhaust pressure approaches the maximum value, the speed begins to drop. Fig.5-4 shows a representative turbo pump speed curve, overlaid with the speed curve of the diaphragm pump. The two curves overlap for a small region of pressures, which determine the operating range of the system.
5.3.3 Turbo Pump
Stanford Research Systems UGALT Series Universal Gas Analyzers Lite
Calibration and Input Design5 – ��
5.3.4 Capillary Design
In the case the UGALT, the overlapping region is �-5 mbar. As the turbo pump exhaust pressure increases approaches 5 mbar, the work it performs will increase. The current monitor display on the front panel is a good indicator of the power consumed by the pump. Running the pump near its limit mainly causes the bearing temperature to increase. The turbo pump controller will detect if the bearings are overheating and avoid damage by shutting down the pump. Long term operation near the temperature limit mainly will age the bearings more quickly. The only advantage to operat-ing the turbo pump at higher exhaust pressures is an increase in the flow rate through the capillary. The higher flowrate can help response time, but given the cost of a turbo pump rebuild, response time is better addressed through capillary design.
The inlet uses a bypass configuration that results in a fast response time. A large flow is drawn through the capillary tube, which drops the pressure 3 decades. The typical capillary used at atmo-spheric pressure has a bore diameter of 0.175 mm and a length of 1.8 m. Any number of combinations of length and bore diameter can achieve the same flowrate and pressure drop. Capillaries are available in several materials. The factors affecting the choice of capillary are:
Fig. 5-4. Representative speed curves for two pumps. The speed values have been scaled to show both pumps on the same graph. The pressure is the ex-haust of turbo and the inlet of the diaphragm pump.

Phone: (408)744-9040www.thinkSRS.com
UGALT Series Universal Gas Analyzers Lite
Calibration and Input Design 5 – ��
• inlet pressure• required response time• distance to sample point• material restrictions• cost
The possibilities for capillary choice are numerous, and SRS offers only a few types. The standard capillary shipped with the UGALT is mainly provided to test the system and provide a reference. The following sections contain some guidelines to designing a capillary suited to the users application.
To choose the dimensions of the capillary, three parameters must be fixed: the inlet pressure, exit pressure, and flowrate. These three values allow the conductivity to be determined (equation 1). A typical design point is an exit pressure of 1-2 mbar and a corre-sponding flow rate of 1.5 to 3.5 milliliter min-� (see Fig. 5-3). The inlet pressure is determined by the users application. The capillary conductivity is a function of the geometry, pressure, temperature, and gas properties. A common formula for air flowing through a tube at 20 °C is
CdL
P P=
+135
2
41 2 (6)
where C is the conductivity in l s-� , d and L are in cm, and the pres-sures are in mbar. More general formulas including temperature and viscosity are contained in the texts listed in the references. This formula also assumes laminar flow.
There are many approximations used in equation 6 and users may be concerned about its accuracy. The formula shows that the con-ductivity is a strong function of diameter. As a practical conse-quence, this strong dependence means the standard manufactur-ing tolerances on bore diameters will cause more uncertainty than the formula itself. A typical 0.005 inch bore capillary might have
5.3.5 Length & Bore

Stanford Research Systems UGALT Series Universal Gas Analyzers Lite
Calibration and Input Design5 – �0
a ±�0% tolerance. While it is reasonable that the bore could vary from 0.0045 to 0.0055 inch, this uncertainty causes the conductivity to vary by about ±40%. Use the standard formulas as a guide, but cut the capillary long to begin with. Measure the actual perfor-mance and trim as necessary.
The chromatography industry uses a large variety of capillaries, from which we can select capillaries for the UGALT. The figure below shows the conductivity for several commonly available bore diameters.
Fig.5-5. Conductivity of five different capillaries as a function of length. The curves are labeled with the bore diameter in thou-sandths of an inch. Both axis are logarithmic.
As an example, consider a capillary for atmospheric pressure and an capillary exit pressure of 1 mbar. From the speed curve for the diaphragm pump, the throughput, Q, is 2.5 × �0-2 mbar liter s-� (Q = P S) and the required conductivity is 2.5 × 10⁻⁵ liter s-�. The hori-
Phone: (408)744-9040www.thinkSRS.com
UGALT Series Universal Gas Analyzers Lite
Calibration and Input Design 5 – �1
zontal dotted line in Fig. 5-5 shows that for each capillary diam-eter there is an appropriate length. The application dictates which bore diameter is appropriate. If the system being measured was far away from the UGALT, 1.5 meters of the 7/1000 capillary would be best. On the other hand, for something close 0.7 meters of 5/1000 would be less expensive. The gas velocity through the capillary quickly reaches the speed of sound. Thereby, until the capillary be-comes very long, it is not an important contributor to the response time of the UGALT.
Users will find vendors of gas chromatography supplies a good source for capillaries and fittings. Capillaries are available in many materials. No material is ideal for all applications. The following table list features of several materials
material min. bore diameter
advantages disadvantages
stainless steel 0.005 in • rugged• high temper-ature• durable con-nections
• difficult to cut without clogging the bore• marginal flexibility
PEEK 0.005 in • highly flex-ible• can be cut by user
• weaker con-nections
glass lined plastic
0.002 in • smallest bore
• cost• not flexible• low temper-ature
Three conventional methods are available for making connections to the capillaries: metal compression fittings, graphite seals, and o-ring seals. Metal compression fittings are suitable for stainless steel tube. The steel is capable of deforming to make the seal. The out-side diameter of plastic capillaries is not round enough to make a good seal to metal ferrule. Graphite ferrules in a metal fitting are a better choice. The graphite will conform to any irregularities in the
5.3.6 Materials and Fittings
Stanford Research Systems UGALT Series Universal Gas Analyzers Lite
Calibration and Input Design5 – ��
5.3.7 Extensions
surface of the capillary. In addition, the graphite ferrule does not permanently deform the capillary as a steel ferrule would. O-ring seals, e.g. Ultra-Torr, make good seals. They only lack in the ability to operate at high temperature.
As discussed in the previous section, the capillary can be designed to any length necessary by choosing an appropriate bore diameter. The cost of material might warrant the use of an extension of anoth-er material, e.g. common vinyl tubing. This can be accomplished as long as the extension is added to the vacuum side of the capillary:
Fig. 5-6. Good and bad methods of adding an extension of vinyl tubing to the capillary.
The incorrect approach above will destroy the response time of the instrument. At 1 ml per minute, it would take 33 minute for gas to travel from the inlet to the UGALT. The correct approach would take less than 2 seconds. The decrease in pressure causes the volu-metric flowrate to increase 1000 times as the gas travels through the capillary. The flow in the extension is viscous, which implies that only diffusion will cause mixing in the axial direction. Sud-den changes in composition at the inlet will be detected as sud-den changes at the UGALT. The response is simply delayed by the amount of time it takes to traverse the extension. Only very long extensions should show any mixing. For extensions, the general rule is to get the beginning of the capillary as close to the sampling point as possible.

Phone: (408)744-9040www.thinkSRS.com
UGALT Series Universal Gas Analyzers Lite
Calibration and Input Design 5 – ��
General RGA information
Dawson, “Quadrupole Mass Spectrometery and Its Applications”, AIP Press, NY, �995.Drinkwine and D. Lichtman, “Partial Pressure Analyzers and Anal-ysis”, AVS Monograph Series published by the Education Commit-tee of the American Vacuum SocietyBasford et. al., J. Vac. Sci. Technol., A 11(3) (1993) A22-40: “Recom-mended Practice for the Calibration of Mass Spectrometers for Par-tial Pressure Analysis. Update to AVS Standard 2.3”.Batey, Vacuum, 37 (1987) 659-668: “Quadrupole Gas Analyzers”Fu Ming Mao et. al., Vacuum, 37 (1987) 669-675: “The quadrupole mass spectrometer in practical operation”Dawson, Mass Spectrometry Reviews, 5 (1986) 1-37: “Quadrupole mass analyzers: Performance, design, and some recent applica-tions”
Vacuum Diagnosis
Studt, R&D Magazine, October 1991, p. 104: “Design Away Those Tough Vacuum System Riddles”Applications of RGAs to process controlO’Hanlon, J. Vac. Sci. Technol. A 12 (4), Jul/Aug 1994: “Ultrahigh vacuum in the semiconductor industry”Vic Comello, R&D Magazine, September 1993, p. 65: “Process Mon-itoring with “Smart” RGAs”Waits, et. al., Semiconductor International, May 1994, p. 79: “ Con-trolling your Vacumm Process: Effective Use of a QMA”Rosenberg, Semiconductor International, October 1995, p. 149: “The Advantages of Continuous On-line RGA Monitoring”.Lakeman, Semiconductor International. October 1995, p. 127: “In-crease overall Equipment Effectiveness with In Situ Mass Spec-trometery”.
Quantitative measurements
Bley, Vacuum, 38 (1988) 103-109: “Quantitative measurements with quadrupole mass spectrometers: important specifications for reli-able measurements”Cowen, et. al., J. Vac. Sci. Technol. A 12(1), Jan/Feb 1994: “ Non-linearities in sensitivity of quadrupole partial pressure analyzers operating at higher pressures”Multiple linear regression analysis algorithms
5.4 References

Stanford Research Systems UGALT Series Universal Gas Analyzers Lite
Calibration and Input Design5 – ��
William H. Press, et. al., 1992, Numerical Recipes in C, The Art of Scientific Computing, Second Edition, Cambridge Univ. Press, sec-tion �5.4, page 67�.Bevington, P.R., 1969, Data Reduction and Error Analysis for the Physical Sciences, New York, McGraw-Hill, Chapters 8-9.

Phone: (408)744-9040www.thinkSRS.com
UGALT Series Universal Gas Analyzers Lite
Appendix A – �
Appendix A
UGALT Menu Table(* The bold value is the factory default value.)
Top level 2nd level 3rd level 4th level 5th levelControls Sample Valve Close : Close the sample valve & go to the selected display
Open : Open the sample valve & go to the selected displayAuto Sample Valve Select a state (Off, On) & one level up
Bypass Valve Select a state (Close, Open) & go to the selected displayRoughing Pump Off : Turn off RP & go to the selected display
On : Turn on RP & go to the selected display
Idle : Set RP idle & go to the selected display
Tune On-Power Input data (60 %, 30 - 100) & one level up
Tune Idle-Power Input data (45 %, 30 - 100) & one level up
Vent Valve Close : Close the vent valve & go to the selected display
Open : Open the vent valve & go to the selected display
Auto Vent Valve Select a state (Off, On) & one level upTurbo Pump Select a state (Off, On, Idle) & go to the selected displayRGA Select a state (Off, On) & go to the selected displayIon Gauge Off : Turn off IG & go to the selected display
On : Turn on IG & go to the selected display
Degas : Start degassing IG & go to the selected display
IG Fil Select Select a parameter ( Fil 1, Fil 2) & one level upVent Valve Close : Close the vent valve & go to the selected display
Open : Open the vent valve & go to the selected display
Auto Vent Valve Select a state (Off, On) & one level upPressure Interlock Select a state (Off, On) & one level up
Communication RS232 Baud rate Select a parameter (28800, 38400) & one level upIP Address Input data (0.0.0.0) & one level upSubnet Mask Input data (255.255.255.0) & one level upGateway Input data (0.0.0.0) & one level upLogin Name Input data (SRSUGA) & one level upPassword Input data (SRSUGA) & one level up
Display Pressure Select a unit (Torr, Pascal, mbar, bar) & go to Pressure Display (default during the operation)
Turbo Pump : Go to Trubo Pump DisplayAbout UGA : Go to Introduction Display (default for the Off state)
Auto Start : Perform the Start sequence & go to the selected displaySleep : Perform the Sleep sequence & go to the selected displayStop : Perform the Stop sequence & go to the selected display

Stanford Research Systems UGALT Series Universal Gas Analyzers Lite
AppendixA – �
Appendix B
The state diagram is shown below. Each arrow means a state can be reached from the state which an arrow starts. For example, READY state (6) can be reached from OFF, IDLE, and INDIVIDUAL. And IDLE state can be reached only from READY or INDIVIDUAL, not from OFF state. The UGA can be stopped from any condition. The stop command is han-dled on an emergency basis.
3 : Starting (Preparing for Ready state) 4 : Stopping 7 : Sleeping Refer to Chapter 3 for the other state numbers.
UGALT State Diagram

Phone: (408)744-9040www.thinkSRS.com
UGALT Series Universal Gas Analyzers Lite
Appendix A – �
Appendix C
Calibration Log for UGALT
SRS serial number ___________
In the table below are the results of the calibration of the inlet and capillary. The factor is entered in the pressure reduction factor dialog box (under the Utilities menu) in the RGA software. Al-though the RGA software will store the value for you, a written record is recommended.
performed by capillary ID length P high side test gas factor

Stanford Research Systems UGALT Series Universal Gas Analyzers Lite
AppendixA – �
Copyright © 2022 FDOKUMEN