Towards an Unsupervised Spatiotemporal Representation of ...

Instructions for use
Title Spatiotemporal change in growth of two populations of Asianchum salmon in relation to intraspecific interaction
Author(s) Seo, Hyunju; Kudo, Hideaki; Kaeriyama, Masahide
Citation Fisheries Science, 75(4): 957-966
Issue Date 2009-07
Doc URL http://hdl.handle.net/2115/38840
Right The original publication is available at www.springerlink.com
Type article (author version)
AdditionalInformation
Hokkaido University Collection of Scholarly and Academic Papers : HUSCAP
Spatiotemporal change in growth of two populations of Asian chum salmon in relation to
intraspecific interaction
Hyunju SEO,1 Hideaki KUDO,2 AND Masahide KAERIYAMA2*
1Graduate School of Fisheries Sciences, and 2Faculty of Fisheries Sciences, Hokkaido University, 3-1-1
Minato-cho, Hakodate, Hokkaido 041-8611, Japan
*Corresponding author: Tel: 81-138-40-5605. Fax: 81-138-40-5605. Email: [email protected]
ABSTRACT: Spatiotemporal changes in growth patterns of chum salmon Oncorhynchus keta that
returned to the Ishikari (Japan) and Namdae (Korea) rivers in 1984-1998 were investigated using scale
analysis. Juvenile chum salmon from both populations left coastal marine areas after spring at a size of
over 8 cm fork length (FL). In summer, juvenile salmon from the Namdae River entered the Okhotsk Sea
at a larger FL than Ishikari River juveniles. There were no significant differences in annual growth
between populations of one-, two-, and four-year-old fish. For three-year-old fish, however, Namdae
River salmon had significantly higher synchronous and sympatric growth than Ishikari River salmon.
Mean FL of adults was also larger in Namdae River salmon than in Ishikari River salmon. ANCOVA
results showed (1) negative linear relations between FL and catch, (2) homogeneous slopes of those
relations at regional and species levels, and (3) non-homogeneous slopes at the population level,
indicating that density dependent effects on growth were most significant at this level. We concluded that
growth of chum salmon was concurrently influenced by stronger effects of intrapopulation competition
and weaker effects of inter- and intra-specific interactions in the Bering Sea.
KEY WORDS: “back-calculation”, “chum salmon”, “density-dependent effect”, “growth
variability”, “intraspecific interaction”, “scale analysis”
INTRODUCTION
Pacific salmon Oncorhynchus spp. play an important role as a keystone species in North Pacific
ecosystems [1]. The most abundant species caught is pink salmon O. gorbuscha, followed by chum O.
keta and sockeye O. nerka salmon. Total catch of chum salmon has increased since the late 1970s in the
North Pacific [2]. This increase has coincided with favorable oceanic conditions and successful artificial
enhancement programs [3-8].
Concurrently with the dramatic increase in biomass, reduction in body size and increase age at maturity
was observed in North Pacific chum salmon. Several hypotheses regarding the cause of these changes
have been proposed, e.g., population density-dependent effects [6, 9-14], variation in ocean environment
[15-17], and selection and cumulative genetic effects of fishing gear [18]. Density dependence is caused
by intraspecific competition. The effect of competition on any individual is greater, as the number of
competitors increases [19]. Chum salmon will return at smaller sizes and older ages when their ocean
growth is reduced because of food limitation [20].
Tadokoro et al. [21] reported interspecific interactions (feeding competition) among chum, pink, and
sockeye salmon for limited micronekton and crustacean prey resources in the subarctic North Pacific
Ocean. Few studies, however, have investigated the effects of intrapopulation competition on the somatic
growth of salmon in the ocean.
Chum salmon O. keta of Asian origin are distributed broadly through North Pacific Ocean [22]. There
is very little information about the ocean distribution and migration of Korean chum salmon in the North
Pacific Ocean [23]. In this study, we assumed that Korean chum salmon have a migration route similar to
that of chum salmon released from Japanese hatcheries [24, 25]. Juvenile chum salmon of Japanese origin
are distributed in the Okhotsk Sea from summer to late autumn, and overwinter in the western Subarctic
Gyre. Thereafter, immature and maturing chum salmon of Japanese origin migrate between their summer
feeding grounds in the Bering Sea and overwintering grounds in the Alaskan Gyre. After about four years,
chum salmon return to their natal rivers for spawning [26, 27].
Chum salmon that migrate broadly can rear in spatiotemporally different environments in the North
Pacific. Changes in the somatic growth of salmon affected by environmental change result in variation in
the growth patterns of their hard tissues, i.e., scales and otoliths [28, 29]. Therefore, to clarify the
relations between intraspecific interactions and growth patterns of North Pacific chum salmon, we
compared spatiotemporal changes in the growth patterns of two Asian (Japan and Korea) chum salmon
populations using scale analysis and back-calculation from body size. To carry out this analysis, we made
the reasonable assumption that after their first summer in the Okhotsk Sea most somatic growth of
Japanese and Korean chum salmon occurs in summer in the Bering Sea [22, 25, 30].
MATERIALS AND METHODS
Salmon catch and measurement of biological data
Different aging systems have been developed to describe the age of salmon [31]. We used the “year-
old” method, which refers to the year of life since egg deposition in the gravel. Because most age groups
of adult chum salmon were collected too irregularly throughout sampling period, we used samples only
from the most abundant age group, i.e., 4-year-old female salmon. We analyzed time-series of scale
growth and fork length (FL) data from adult chum salmon catches in two locations: (1) the Ishikari River
on the west coast of Hokkaido Island in Japan in 1984-1998, except 1985 [28]; and (2) the Namdae River
on the east coast of Korea in 1984-1998, except 1995 [23].
Length estimation
A total of 1,513 and 1,112 scales were obtained from 4-year-old adult chum salmon in the Namdae and
the Ishikari Rivers, respectively [23, 28]. The scales were measured from the focus to the check and to
each annual rings (i.e., rc, r1, r2, r3, R), and the data were used to estimate FL before (Lc) and after (Lo) the
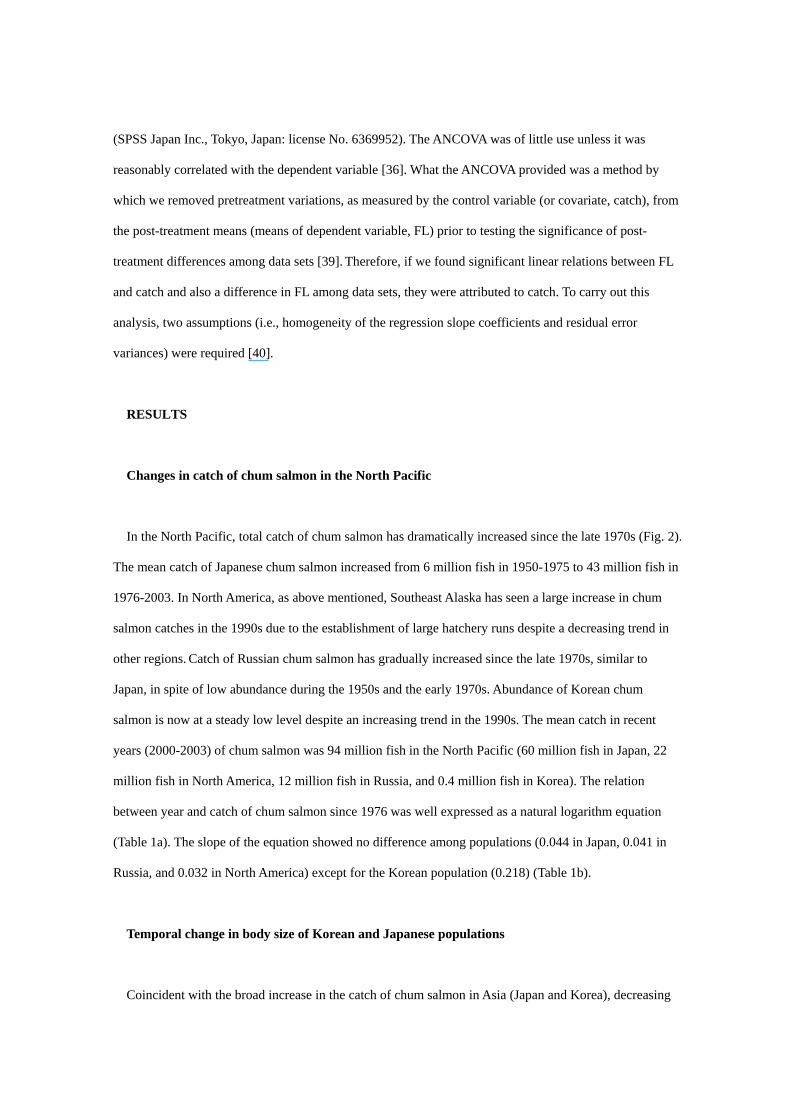
check and at the end of each year (i.e., L1, L2, L3, L4) according to the back-calculation method (Fig. 1). R
and ri indicate total scale radius and scale radius at age i, respectively, and rc indicates scale radius from
the focus to the check formed when fish entered the Okhotsk Sea.
Although there was little information about check (rc) formation, we assumed when the check formed
from two different evidences. First, field research has shown that juvenile chum salmon of Japanese
origin migrate offshore at approximately 8-12 cm FL [32, 33]. Especially, Mayama et al. [24, 33] reported

that Ishikari River chum salmon were 7.4-12.6 cm FL after they left the coastal area and before they
migrated to the Okhotsk Sea. Second, our back-calculated estimate of mean size of Ishikari River salmon
at check formation was 13.5 ± 1.8 cm FL, which is larger than the reported size of the Ishikari River
salmon before they migrated to the Okhotsk Sea [24, 33]. Therefore, we presumed that the check on the
scales of Ishikari River chum salmon was formed when fish entered the Okhotsk Sea. Later, we discuss
check formation on the scales of Korean chum salmon.
The FL at a specific age i (Li) was calculated using the following equation [34, 35]
Li = Lt - (R - ri) / (R - r0) × (Lt - L0),
where Li, Lt and Lc are the back-calculated fork length (FL, cm) at age i, FL of adult at capture, and FL at
the check (rc), respectively. L0 and r0 are FL and scale length at the time of scale formation (i.e.,
squamation). For chum salmon, L0 = 4.0 cm and r0 = 0.0114 cm [36].
Catch data collection
Data on catches of chum salmon in Asia (Japan, Russia, and Korea) and North America (U.S.A. and
Canada) in 1950-2003 were taken from Eggers et al. [8] and Lee et al. [37]. Data on Japanese and Korean
chum salmon consisted of coastal catches and escapements, while Russian data consisted of coastal
catches by Russian and Japanese fisheries within the Russian EEZ. North American data included coastal
catches. Total catch in the North Pacific included data on high-seas catches. The data on catches of
Hokkaido chum salmon were reported by Kaeriyama and Edpalina [38].
Statistical analysis
We divided North Pacific catches into three levels: (1) population (total return including coastal catch
and escapement in Hokkaido and Korea), (2) regional (total Asian catch), and (3) species (total North
Pacific catch). To evaluate the effect of catch on body size (FL), slope coefficients in FL-catch linear
relation among data sets (n = 6, FL of Ishikari River and Namdae River chum salmon at three catch
levels) were compared using analysis of covariance (ANCOVA). The relationship between catch (C) and
FL expressed as a natural logarithm equation (FL = aCb) was analyzed with ANCOVA using SPSS 17.0J
(SPSS Japan Inc., Tokyo, Japan: license No. 6369952). The ANCOVA was of little use unless it was
reasonably correlated with the dependent variable [36]. What the ANCOVA provided was a method by
which we removed pretreatment variations, as measured by the control variable (or covariate, catch), from
the post-treatment means (means of dependent variable, FL) prior to testing the significance of post-
treatment differences among data sets [39]. Therefore, if we found significant linear relations between FL
and catch and also a difference in FL among data sets, they were attributed to catch. To carry out this
analysis, two assumptions (i.e., homogeneity of the regression slope coefficients and residual error
variances) were required [40].
RESULTS
Changes in catch of chum salmon in the North Pacific
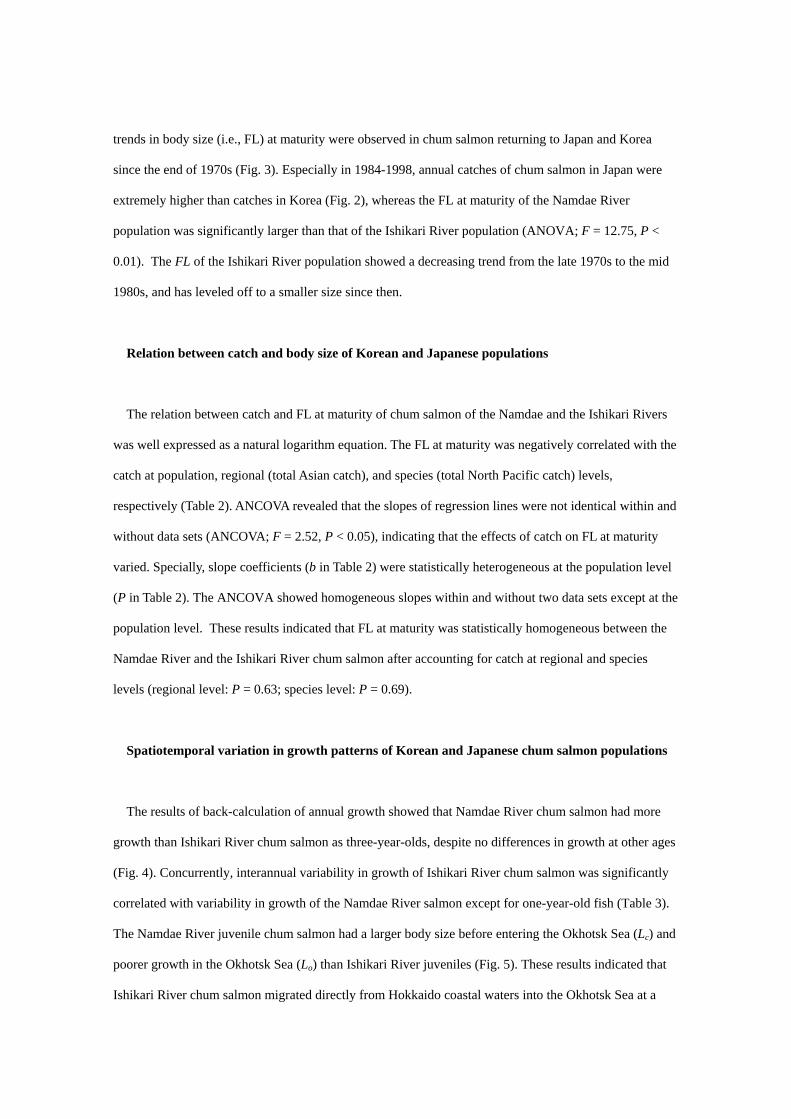
In the North Pacific, total catch of chum salmon has dramatically increased since the late 1970s (Fig. 2).
The mean catch of Japanese chum salmon increased from 6 million fish in 1950-1975 to 43 million fish in
1976-2003. In North America, as above mentioned, Southeast Alaska has seen a large increase in chum
salmon catches in the 1990s due to the establishment of large hatchery runs despite a decreasing trend in
other regions. Catch of Russian chum salmon has gradually increased since the late 1970s, similar to
Japan, in spite of low abundance during the 1950s and the early 1970s. Abundance of Korean chum
salmon is now at a steady low level despite an increasing trend in the 1990s. The mean catch in recent
years (2000-2003) of chum salmon was 94 million fish in the North Pacific (60 million fish in Japan, 22
million fish in North America, 12 million fish in Russia, and 0.4 million fish in Korea). The relation
between year and catch of chum salmon since 1976 was well expressed as a natural logarithm equation
(Table 1a). The slope of the equation showed no difference among populations (0.044 in Japan, 0.041 in
Russia, and 0.032 in North America) except for the Korean population (0.218) (Table 1b).
Temporal change in body size of Korean and Japanese populations
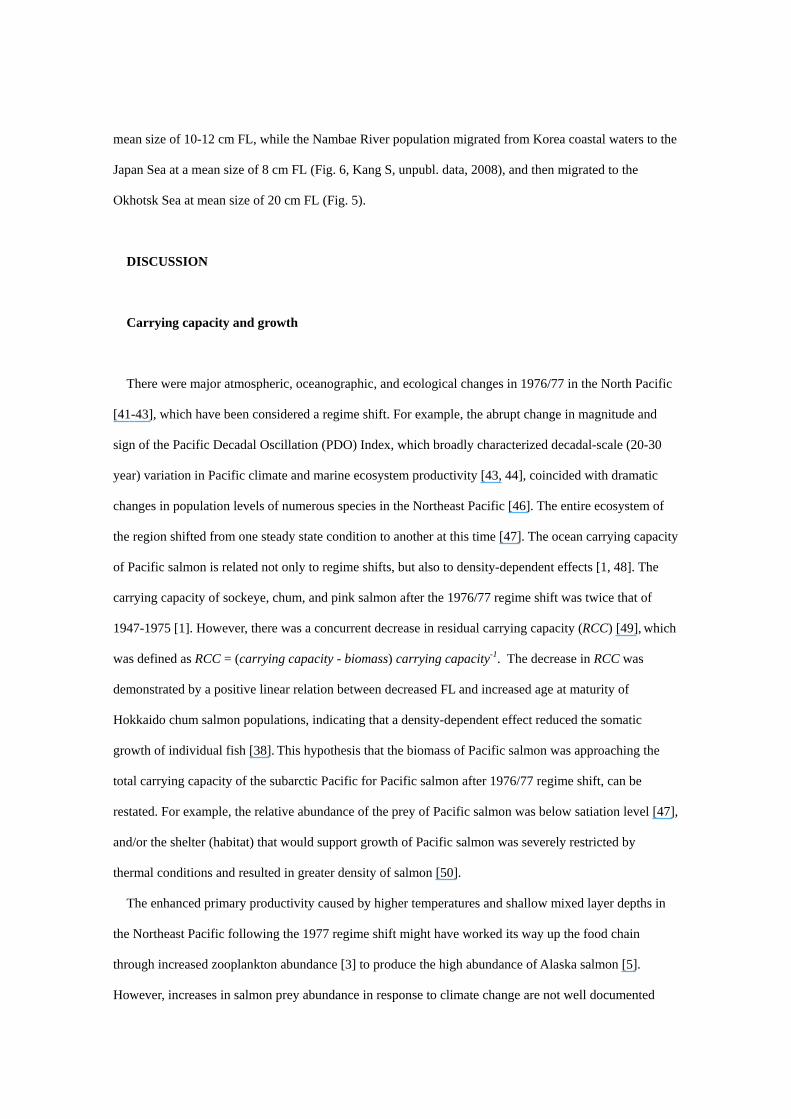
Coincident with the broad increase in the catch of chum salmon in Asia (Japan and Korea), decreasing
trends in body size (i.e., FL) at maturity were observed in chum salmon returning to Japan and Korea
since the end of 1970s (Fig. 3). Especially in 1984-1998, annual catches of chum salmon in Japan were
extremely higher than catches in Korea (Fig. 2), whereas the FL at maturity of the Namdae River
population was significantly larger than that of the Ishikari River population (ANOVA; F = 12.75, P <
0.01). The FL of the Ishikari River population showed a decreasing trend from the late 1970s to the mid
1980s, and has leveled off to a smaller size since then.
Relation between catch and body size of Korean and Japanese populations
The relation between catch and FL at maturity of chum salmon of the Namdae and the Ishikari Rivers
was well expressed as a natural logarithm equation. The FL at maturity was negatively correlated with the
catch at population, regional (total Asian catch), and species (total North Pacific catch) levels,
respectively (Table 2). ANCOVA revealed that the slopes of regression lines were not identical within and
without data sets (ANCOVA; F = 2.52, P < 0.05), indicating that the effects of catch on FL at maturity
varied. Specially, slope coefficients (b in Table 2) were statistically heterogeneous at the population level
(P in Table 2). The ANCOVA showed homogeneous slopes within and without two data sets except at the
population level. These results indicated that FL at maturity was statistically homogeneous between the
Namdae River and the Ishikari River chum salmon after accounting for catch at regional and species
levels (regional level: P = 0.63; species level: P = 0.69).
Spatiotemporal variation in growth patterns of Korean and Japanese chum salmon populations
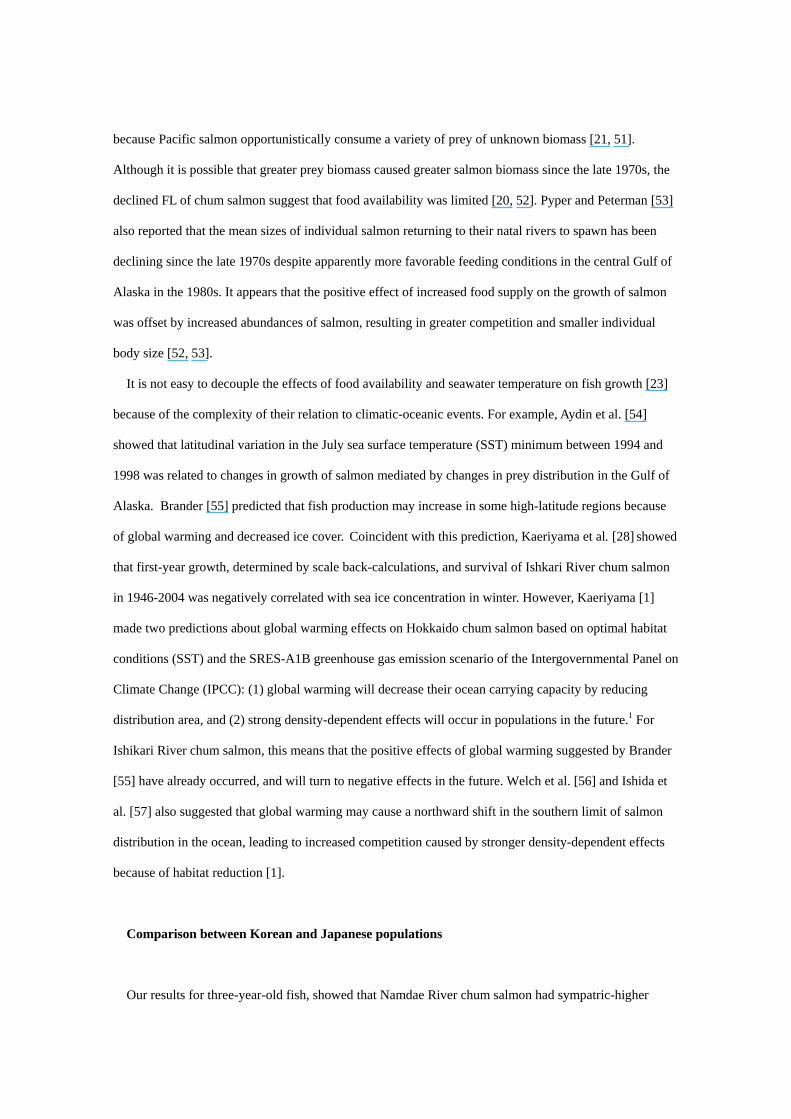
The results of back-calculation of annual growth showed that Namdae River chum salmon had more
growth than Ishikari River chum salmon as three-year-olds, despite no differences in growth at other ages
(Fig. 4). Concurrently, interannual variability in growth of Ishikari River chum salmon was significantly
correlated with variability in growth of the Namdae River salmon except for one-year-old fish (Table 3).
The Namdae River juvenile chum salmon had a larger body size before entering the Okhotsk Sea (Lc) and
poorer growth in the Okhotsk Sea (Lo) than Ishikari River juveniles (Fig. 5). These results indicated that
Ishikari River chum salmon migrated directly from Hokkaido coastal waters into the Okhotsk Sea at a
mean size of 10-12 cm FL, while the Nambae River population migrated from Korea coastal waters to the
Japan Sea at a mean size of 8 cm FL (Fig. 6, Kang S, unpubl. data, 2008), and then migrated to the
Okhotsk Sea at mean size of 20 cm FL (Fig. 5).
DISCUSSION
Carrying capacity and growth
There were major atmospheric, oceanographic, and ecological changes in 1976/77 in the North Pacific
[41-43], which have been considered a regime shift. For example, the abrupt change in magnitude and
sign of the Pacific Decadal Oscillation (PDO) Index, which broadly characterized decadal-scale (20-30
year) variation in Pacific climate and marine ecosystem productivity [43, 44], coincided with dramatic
changes in population levels of numerous species in the Northeast Pacific [46]. The entire ecosystem of
the region shifted from one steady state condition to another at this time [47]. The ocean carrying capacity
of Pacific salmon is related not only to regime shifts, but also to density-dependent effects [1, 48]. The
carrying capacity of sockeye, chum, and pink salmon after the 1976/77 regime shift was twice that of
1947-1975 [1]. However, there was a concurrent decrease in residual carrying capacity (RCC) [49], which
was defined as RCC = (carrying capacity - biomass) carrying capacity-1. The decrease in RCC was
demonstrated by a positive linear relation between decreased FL and increased age at maturity of
Hokkaido chum salmon populations, indicating that a density-dependent effect reduced the somatic
growth of individual fish [38]. This hypothesis that the biomass of Pacific salmon was approaching the
total carrying capacity of the subarctic Pacific for Pacific salmon after 1976/77 regime shift, can be
restated. For example, the relative abundance of the prey of Pacific salmon was below satiation level [47],
and/or the shelter (habitat) that would support growth of Pacific salmon was severely restricted by
thermal conditions and resulted in greater density of salmon [50].
The enhanced primary productivity caused by higher temperatures and shallow mixed layer depths in
the Northeast Pacific following the 1977 regime shift might have worked its way up the food chain
through increased zooplankton abundance [3] to produce the high abundance of Alaska salmon [5].
However, increases in salmon prey abundance in response to climate change are not well documented
because Pacific salmon opportunistically consume a variety of prey of unknown biomass [21, 51].
Although it is possible that greater prey biomass caused greater salmon biomass since the late 1970s, the
declined FL of chum salmon suggest that food availability was limited [20, 52]. Pyper and Peterman [53]
also reported that the mean sizes of individual salmon returning to their natal rivers to spawn has been
declining since the late 1970s despite apparently more favorable feeding conditions in the central Gulf of
Alaska in the 1980s. It appears that the positive effect of increased food supply on the growth of salmon
was offset by increased abundances of salmon, resulting in greater competition and smaller individual
body size [52, 53].
It is not easy to decouple the effects of food availability and seawater temperature on fish growth [23]
because of the complexity of their relation to climatic-oceanic events. For example, Aydin et al. [54]
showed that latitudinal variation in the July sea surface temperature (SST) minimum between 1994 and
1998 was related to changes in growth of salmon mediated by changes in prey distribution in the Gulf of
Alaska. Brander [55] predicted that fish production may increase in some high-latitude regions because
of global warming and decreased ice cover. Coincident with this prediction, Kaeriyama et al. [28] showed
that first-year growth, determined by scale back-calculations, and survival of Ishkari River chum salmon
in 1946-2004 was negatively correlated with sea ice concentration in winter. However, Kaeriyama [1]
made two predictions about global warming effects on Hokkaido chum salmon based on optimal habitat
conditions (SST) and the SRES-A1B greenhouse gas emission scenario of the Intergovernmental Panel on
Climate Change (IPCC): (1) global warming will decrease their ocean carrying capacity by reducing
distribution area, and (2) strong density-dependent effects will occur in populations in the future.1 For
Ishikari River chum salmon, this means that the positive effects of global warming suggested by Brander
[55] have already occurred, and will turn to negative effects in the future. Welch et al. [56] and Ishida et
al. [57] also suggested that global warming may cause a northward shift in the southern limit of salmon
distribution in the ocean, leading to increased competition caused by stronger density-dependent effects
because of habitat reduction [1].
Comparison between Korean and Japanese populations
Our results for three-year-old fish, showed that Namdae River chum salmon had sympatric-higher
growth than the Ishikari River salmon in the Bering Sea in 1984-1998. We suggest that this resulted from
a stronger density-dependent effect at the population level caused by larger population size. Trends in
catch since the late 1970s differed between Japanese and Korean chum salmon, which increased more
rapidly in the 1990s, despite the common increasing trend in catch of chum salmon in all major salmon-
producing nations of the North Pacific Rim. Between the mid 1980s and the late 1990s, the fluctuations in
body size (FL) at maturity also differed between the Namdae River and Ishikari River populations.
However, our results showed that long-term (1984-1998) spatiotemporal variation in growth patterns of
these two populations was significantly similar during their second, third, and forth years in the Bering
Sea. This indicated (1) Namdae River and Ishikari River chum salmon experience similar open-ocean
environments, e.g., physiological condition and prey community [52], though the migration route of
Korean chum salmon remains uncertain [23]. And, it indicated (2) differences between populations in
fluctuation in FL were caused by variation in growth of one-year-old fish. That is, juvenile chum salmon
from the Namdae River grew more than those from the Ishikari River before entering the Okhotsk Sea,
and vice versa after entering the Okhotsk Sea, where both populations spend their first summer and fall in
the ocean.
In 1984-1998, the abundance of adult chum salmon returns in Japan was extremely higher than returns
in Korea. On the other hand, the adult body size (FL) of the Namdae River population was larger than the
Ishikari River population, which showed a decreasing trend in FL from the late 1970s to the mid 1980s
and leveled off to a smaller size since then. The significant effect of catch on FL was more severe at the
population level than at the regional and species levels. The slope coefficient of the FL-catch relation of
the Ishikari River chum salmon at the population level was more than twice that of the Namdae River.
This result suggested that (1) the density-dependent effect was also more severe at population level, and
(2) smaller FL in the Ishikari River chum salmon was caused by larger population size. Because body size
(FL) at maturity comprises past growth at younger ages, our research detected when and where this more
severe density-dependent effect occurred in the Ishikari River chum salmon with more specificity than
was previously known.
The comparative results of spatiotemporal change in growth of two populations in 1984-1998 showed
that three-year old Namdae River chum salmon had sympatric-higher growth than three-year-old Ishikari
River chum salmon. There were no between-population differences for other age groups. The key point
presented here is that interannual variation (1984-1998) in growth of three-year-old Namdae River and
Ishikari River chum salmon was similar, despite the larger FL of Namdae River Chum salmon. These
results suggest that individuals in each population can grow to a different size because of intraspecific
interaction, including intrapopulation competition, even though it is a consequence of chum salmon
growth being inhibited by either common biotic (food) or abiotic (temperature) factors. Namely, there is
possibility that intraspecific interaction is inclusive not only of interpopulation but also intrapopulation
competition, which will result in sympatric-lower or -higher growth of chum salmon of each population
in the open ocean under circumstances such as decreased RCC (i.e., intensified competition for available
food supply and shelter).
According to the early life history model of Japanese juvenile chum salmon [32], large individuals (12
cm FL) leave the costal area during the optimum-temperature period (April-May) on a “foraging
migration”. Small individuals (8 cm FL) migrate offshore during the late period (June-July) on an “escape
migration” from the Pacific coast of the Tohoku Region. The Korean juvenile chum salmon grew up to 8
cm FL in the coastal area until early May (Fig. 6), and then migrated to the Japan Sea, where they grew
up to 20 cm FL (Lc in Fig. 4). When the check (rc in Fig. 1) was formed on the scale, the estimated mean
length using the back-calculation method was 20.3 ± 1.4 cm FL (Lc in Fig. 4). These two results (Lc in Fig.
4 and Fig. 6) support the possibility that the check on Korean chum salmon scales was formed at entrance
into the Okhotsk Sea. In addition, Korean chum salmon left the coastal area earlier than Japanese chum
salmon. Mayama and Ishida [58] reported that Japanese chum salmon avoid warm water (14 ºC) of the
Tusima current. On the coast of Hokkaido, young salmon were distributed at seawater temperatures
between 8 ºC -13 ºC, and disappeared at temperatures over 13ºC. In 2006, warm water (15 ºC) occurred in
the coastal area near the Namdae River (38° 41´ N) starting in mid May (Korean Oceanographic Data Ce
nter Web: http://kodc.nfrdi.re.kr/home/kor/satelite/main.php “Accessed 01 Nov 2008”.), which might hav
e caused early outmigration of juvenile chum salmon from the Korean coast.
Because of the lack of population-specific data, researchers frequently combine populations into
regional- or species-level aggregates [59]. The finding that density-dependency appears to have a non-
uniform effect on growth of chum salmon due to intrapopulation competition, demonstrates the
importance of considering these effects when attempting to manage salmon populations.
Comparisons of spatiotemporal variation in growth of chum salmon of two Asian populations in 1984-
1998 using scale analysis showed synchronous- and sympatric-lower or -higher growth between
populations of three-year-old chum salmon in the Bering Sea, despite showing no difference at other ages.
Density-dependent processes had a stronger effect at the population level than at regional and species
levels. The growth of chum salmon in the Bering Sea was controlled by inter- and intra-specific
interactions such as carrying capacity and population density.
ACKNOWLEDGMENTS
We thank Katherine W. Myers, University of Washington, for her comments and encouragement on
earlier draft of the paper, and Sukyung Kang and Kibeik Seong, Salmon Research Center of the National
Fisheries Research and Development Institute, for collecting scales and data of Korean chum salmon.
This study was supported by the Mitsui-bussan Environment Foundation.

REFERENCES
1. Kaeriyama M (2008) Ecosystem-based sustainable conservation and management of Pacific
salmon. In: Tsukamoto K., Kawamura T., Takeuchi T., Beard TD. Jr., Kaiser MJ. (Eds.) Fish. For
Global Welfare and Environment, 5th World Fish. Congress. 5: 371-380
2. Beamish RJ, Mahnken C, Neville CM (1997) Hatchery and wild production of Pacific salmon in
relation to large-scale, natural shifts in the productivity of the marine environment. ICES J.
Marine Sci. 54: 1200-1266
3. Brodeur RD, Ware DM (1992) Interdecadal variability in distribution and catches of epipelagic
nekton in the Northeast Pacific. In: Beamish RJ. (Ed.). Climate Changes and Northern Fish
Populations. Can. Spec. Pub. Fish. Aquat. Sci. 121
4. Pearcy WG (1992) Ocean ecology of North Pacific salmonids. Univ. Washington Press, Seattle
5. Beamish RJ, Bouillon DR (1993) Pacific salmon production trends in relation to climate. Can. J.
Fish. Aquat. Sci. 50: 1002-1016
6. Kaeriyama M (1996) Population dynamics and stock management of hatchery-reared salmons in
Japan. Bull. Natl. Res. Inst. Aquacult., Suppl. 2: 11-15
7. Morita K, Saito T, Miyakoshi Y, Fukuwaka M, Nagasawa T, Kaeriyama M (2006) A review of
Pacific salmon hatchery programs on Hakkaido Island, Japan. ICES J. Marine Sci. 63: 1353-1363
8. Eggers DM, Fukuwaka M, Irvone J, Karpenko V (2004) Pacific salmon. PICES Special Publ., 1,
pp 227-261
9. Kaeriyama M (1989) Aspects of salmon ranching in Japan. Physiol. Ecol. Jpn. Spec. 1: 625-638
10. Kaeriyama M (1998) Dynamics of chum salmon, Oncorhynchus keta, populations released from
Hokkaido, Japan. N. Pac. Anadr. Fish Comm. Bull. 1: 90-102
11. Ishida Y, Ito S, Kaeriyama M, Mckinnell S, Nagasawa K (1993) Recent changes in age and size
of chum salmon (Oncorhynchus keta) in the North Pacific Ocean and possible causes. Can. J.
Fish. Aquat. Sci. 50: 290-295
12. Helle JH, Hoffman MS (1998) Changes in size and age at maturity of juvenile chum salmon
(Oncorhynchus keta) before and after a major regime shift in the North Pacific Ocean. N. Pac.
Anadr. Fish Comm. Bull. 1: 81-89

13. Bigler BS, Welch DW, Helle JH (1996) A review of size trends among North Pacific salmon
(Oncorhynchus spp.). Can. J. Fish. Aquat. Sci. 53: 455-465
14. Volobuev VV (2000) Long-term changes in the biological parameters of chum salmon of the
Okhotsk Sea. N. Pac. Anadr. Fish Comm. Bull. 2: 175-180
15. Rogers DE, Ruggerone GT (1993) Factors affecting marine growth of Bristol Bay sockeye
salmon. Fish. Res. 18: 89-103
16. Ishida Y, Welch DW, Ogura M (1995) Potential influence of North Pacific sea-surface
temperatures on increased production of chum salmon (Oncorhynchus keta) from Japan. In:
Beamish RJ. (Ed.) Climate Changes and Northern Fish Populations. Can. Spec. Pub. Fish. Aquat.
Sci. 121
17. Morita SH, Morita K, Sakano H (2001) Growth of chum salmon (Oncorhynchus keta) correlated
with sea-surface salinity in the North Pacific. ICES J. Marine Sci. 58: 1335-1339
18. Ricker WE (1981) Changes in average size and average age of Pacific salmon. Can. J. Fish.
Aquat. Sci. 38: 1636-1656
19. Begon M, Mortimer M, Thompson DJ (1981) Population Ecology: A Unified Study of Animals
and Plants. Blackwell Science, Oxford
20. PICES (2004) Marine ecosystems of the North Pacific. PICES Special Publ., 1, 280 p
21. Tadokoro K, Ishida Y, Davis ND, Ueyanagi S, Sugimoto T (1996) Change in chum salmon
(Oncorhynchus keta) stomach contents associated with fluctuation of pink salmon (O. gorbuscha)
abundance in the central subarctic Pacific and Bering Sea. Fish. Oceanogra. 5: 89-99
22. Salo EO (1991) Life history of chum salmon (Oncorhynchus keta). In: Groot C, Margolis L (Eds)
Pacific Salmon Life Histories. UBC Press, Vancouver, pp 233-309
23. Seo H, Kim S, Seong K, Kang S (2006) Variability in scale growth rates of chum salmon
(Oncorhynchus keta) in relation to climate changes in the late 1980s. Prog. Oceanogr. 68: 205-
216
24. Mayama H, Ishida Y (2003) Japanese studies on the early ocean life of juvenile salmon. N. Pac.
Anadr. Fish Comm. Bull. 3: 41-67
25. Urawa S, Ueno Y, Ishida Y, Seeb LW, Crane PA, Abe S, Davis ND (2001) A migration model of
Japanese chum salmon during early ocean life. NPAFC Tech. Rep. 2: 45-46
26. Urawa S (2000) Migration of Japanese chum salmon and future studies. Natl. Salmon Resour.
Center News 5: 3-9 (in Japanese)
27. Azumaya T, Ishida Y (2000) Effects of ocean currents on juvenile chum salmon migration.
NPAFC Tech. Rep. 2: 17-18
28. Kaeriyama M, Yatsu A, Noto M, Saitoh S (2007) Spatial and temporal changes in the growth
patterns and survival of Hokkaido chum salmon populations in 1970-2001. N. Pac. Anadr. Fish
Comm. Bull. 4: 251-256
29. Saito T, Kaga T, Seki J, Otake T. (2007) Otolith microstructure of chum salmon Oncorhynchus
keta: formation of sea entry check and daily deposition of otolith increments in seawater
conditions. Fish. Sci. 73: 27-37
30. Ishida Y, Ito S, Ueno Y, Sakai J (1998) Seasonal growth patterns of Pacific salmon
(Oncorhynchus spp.) in offshore waters of the North Pacific Ocean. N. Pac. Anadr. Fish Comm.
Bull. 1: 66-80
31. Groot C, Margolis L (1991) Pacific Salmon Life Histories. UBC Press, Vancouver
32. Kaeriyama M (1986) Ecological study on early life of the chum salmon, Oncorhynchus keta
(Walbaum). Sci. Rep. Hokkaido Salmon Hatchery 40: 31-92 (in Japanese with English abstract)
33. Mayama H, Kato M, Seki J, Shimizu I (1982) Studies on the chum salmon released in the Ishikari
River System-I. On the seaward migration and inshore distributions of liberated fry in 1979. Sci.
Rep. Hokkaido Salmon Hatchery 36: 1-17 (in Japanese with English abstract)
34. Campana SW (1990) How reliable are growth back-calculations based on otoliths? Can. J. Fish.
Aquat. Sci. 47: 2219-2227
35. Morita K, Morita SH, Fukuwaka M, Matsuda H (2005) Rule of age and size at maturity of chum
salmon (Oncorhynchus keta): implications of recent trends among Oncorhynchus spp. Can. J.
Fish. Aquat. Sci. 62: 2752-2759
36. Fukuwaka M, Kaeriyama M (1994) A back-calculation method for estimating individual growth
of juvenile chum salmon by scale analysis. Sci. Rep. Hokkaido Salmon Hatchery 48: 1-9 (in
Japanese with English abstract)
37. Lee C, Seong K, Lee C (2007) History and status of the chum salmon enhancement program in
Korea. J. Korean Soci. Oceanogra. 12: 73-80 (in Korean with English abstract)

38. Kaeriyama M, Edpalina RR (1981) Evaluation of the biological interaction between wild and
hatchery population for sustainable fisheries management of Pacific salmon. In: Leber KM,
Kitada S, Blankenship HL, Svasand T (Eds.) Stock Enhancement and Sea Ranching, 2nd ed.
Blackwell Science, Oxford, pp 247-259
39. Williams F, Monge P (2001) Reasoning with Statistics: How to Read Quantitative Research.
Hatcourt College Publishers, Orlando
40. Misra RK, Uthe JF, Vyncke W (1990) A weighted procedure of analyzing for time trends in
contaminant levels in CMP data: application to cod and flounder data of the Belgian coast (1978-
1985). J. Cons. Int. Explor. Mer. 47: 65-75
41. McFarlane GA, King JR, Beamish RJ (2000) Have there been recent changes in climate? Ask the
fish. Prog. Oceanogr. 47: 149-169
42. Bond NA, Overland JE, Spillane M, Stabeno P (2003) Recent shifts in the state of the North
Pacific. Geophys. Res. Lett. doi: 10.1029/2003GL018597
43. Chavez FP, Ryan J, Lluch-Cota SE, Ñiquen CM (2003) From anchovies to sardines and back:
multidecadal change in the Pacific Ocean. Science doi: 10.1126/science.1075880
44. Overland JE, Bond N, Yand M (2004) Ocean and climate changes. PICES Special Publ., 1, pp 39-
58
45. Lehodey P, Alheit J, Barange M, Baumgartner T, Beaugrand G, Drinkwater K, Fromentin J, Hare
SR, Ottersen G, Perry RI, Roy C, van der Lingen CD, Werner F. (2006) Climate variability, fish,
and fisheries. J. Clim. 19: 5009-5030
46. Beamish RJ, Noakes DJ, McFarlane GA, Klyashtorin L, Ivanov VV, Kurashov V (1999) The
regime concept and natural trends in the production of Pacific salmon. Can. J. Fish. Aquat. Sci.
56: 516-526
47. Kawasaki T (1983) Why do some pelagic fishes have wide fluctuations in their numbers?
Biological basis of fluctuation form the viewpoint of evolutionary ecology. FAO Fish. Rep. 291
48. IGBP (1999) Global Ocean Ecosystem Dynamics (GLOBEC) implementation plan. IGBP Rep.
47 (GLOBEC Rep. 13). 207 p
49. Kaeriyama M (2003) Evaluation of carrying capacity of Pacific salmon in the North Pacific
Ocean for ecosystem-based sustainable conservation management. NPAFC Tech. Rep. 5: 1-4

50. Ishida Y, Azumaya T, Fukuwaka M, Davis ND (2002) Interannual variability in stock abundance
and body size of Pacific salmon in the central Bering Sea. Prog. Oceanogr. 55: 223-234
51. Kaeriyama M, Nakamura M, Edpalina R, Bower JR, Yamaguchi H, Walker RV, Myers KW
(2004) Change in feeding ecology and trophic dynamics of Pacific salmon (Oncorhynchus spp.)
in the central Gulf of Alaska in relation to climate events. Fish. Oceanogr. 13: 197-207
52. Ruggerone GT, Nielsen JL, Bumgarner J (2007) Linkages between Alaskan sockeye salmon
abundance, growth at sea, and climate, 1955-2002. Deep-Sea Res. II. 54: 2776-2793.
53. Pyper BJ, Peterman RM (1999) Relationship among adult body length, abundance and ocean
temperature for British Columbia and Alaska sockeye salmon (Oncorhynchus nerka), 1967-1997.
Can. J. Fish. Aquat. Sci. 56: 1716-1720
54. Aydin KY, Myers KW, Walker RV (2000) Variation in summer distribution of the prey of Pacific
salmon (Oncorhynchus spp.) in the offshore Gulf of Alaska in relation to oceanographic
conditions, 1994-98. N. Pac. Anadr. Fish Comm. Bull. 2: 43-54
55. Brander KM (2007) Global fish production and climate change. Proc. Natl. Acad. Sci. USA. 104:
19709-19714
56. Welch DW, Ishida Y, Nagasawa K (1998) Thermal limits and ocean migrations of sockeye
salmon (Oncorhynchus nerka): long-term consequences of global warming. Can. J. Fish. Aquat.
Sci. 55: 937-948
57. Ishida Y, Hariu T, Yamashiro J, Mckinnell S, Natsuda T, Kaneko H (2001) Archeological
evidence of Pacific salmon distribution in northern Japan and implications for future global
warming. Prog. Oceanogr. 49: 539-550
58. Mayama H, Ishida Y (2003) Japanese studies on the early life of juvenile salmon. N. Pac. Anadr.
Fish Comm. Bull. 3: 41-67
59. Hare SR, Mantua NJ (2000) Empirical indicators of climate variability and ecosystem response
since 1965. Prog. Oceanogr. 47: 103-145
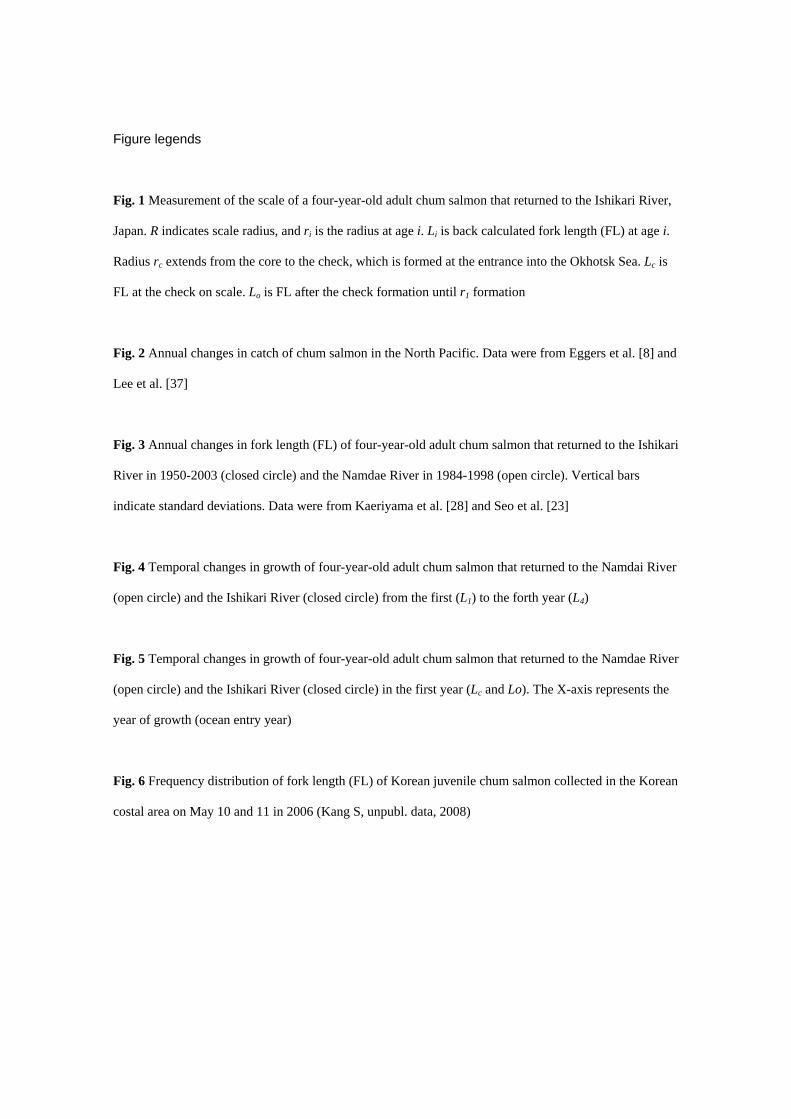
Figure legends
Fig. 1 Measurement of the scale of a four-year-old adult chum salmon that returned to the Ishikari River,
Japan. R indicates scale radius, and ri is the radius at age i. Li is back calculated fork length (FL) at age i.
Radius rc extends from the core to the check, which is formed at the entrance into the Okhotsk Sea. Lc is
FL at the check on scale. Lo is FL after the check formation until r1 formation
Fig. 2 Annual changes in catch of chum salmon in the North Pacific. Data were from Eggers et al. [8] and
Lee et al. [37]
Fig. 3 Annual changes in fork length (FL) of four-year-old adult chum salmon that returned to the Ishikari
River in 1950-2003 (closed circle) and the Namdae River in 1984-1998 (open circle). Vertical bars
indicate standard deviations. Data were from Kaeriyama et al. [28] and Seo et al. [23]
Fig. 4 Temporal changes in growth of four-year-old adult chum salmon that returned to the Namdai River
(open circle) and the Ishikari River (closed circle) from the first (L1) to the forth year (L4)
Fig. 5 Temporal changes in growth of four-year-old adult chum salmon that returned to the Namdae River
(open circle) and the Ishikari River (closed circle) in the first year (Lc and Lo). The X-axis represents the
year of growth (ocean entry year)
Fig. 6 Frequency distribution of fork length (FL) of Korean juvenile chum salmon collected in the Korean
costal area on May 10 and 11 in 2006 (Kang S, unpubl. data, 2008)
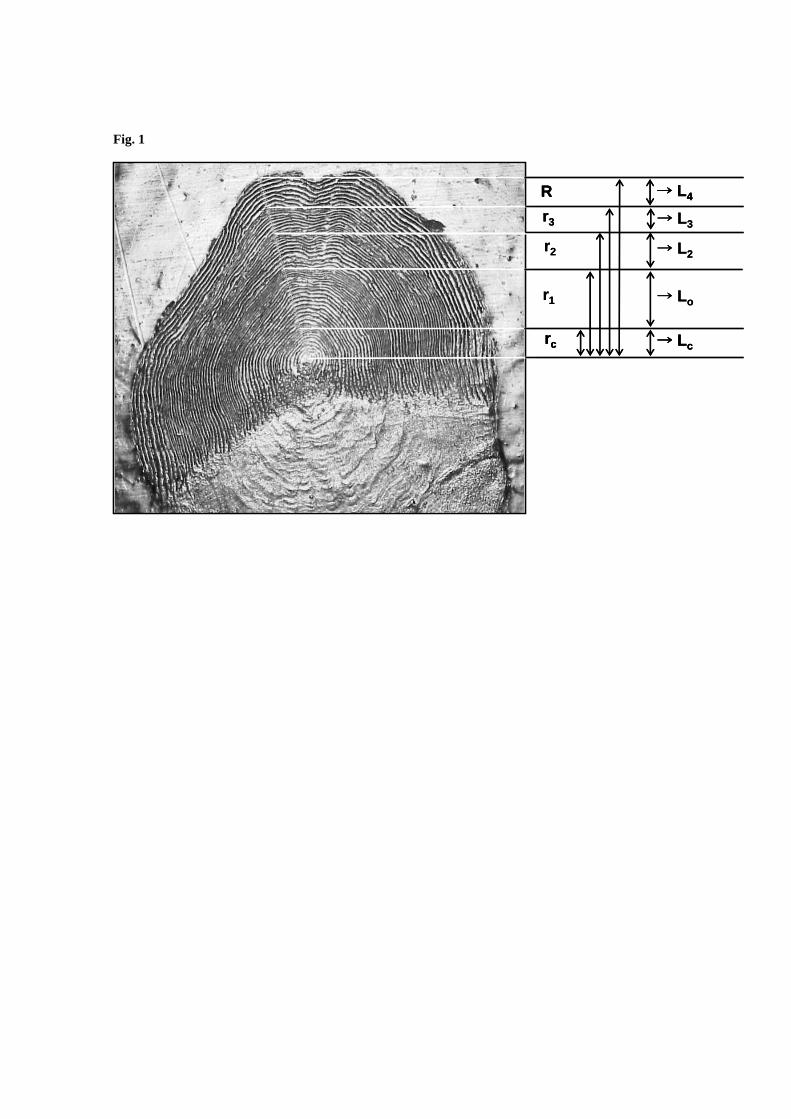
Fig. 1
r2 → L2
r3 → L3
r1 → Lo
rc → Lc
R → L4
r2 → L2
r3 → L3
r1 → Lo
rc → Lcrc → Lc
R → L4R → L4

Fig. 2
0.00001
0.0001
0.001
0.01
0.1
1
10
100
1950 1955 1960 1965 1970 1975 1980 1985 1990 1995 2000
Year
Lo
g-t
ran
sfo
rmed
cat
ch (
mil
lio
n i
nd
ivid
ua
ls)
North PacificJapanNorth AmericaRussiaKorea

Fig. 3
55
60
65
70
75
1950 1955 1960 1965 1970 1975 1980 1985 1990 1995 2000
Year
FL
(c
m)
Ishikari River
Namdae River
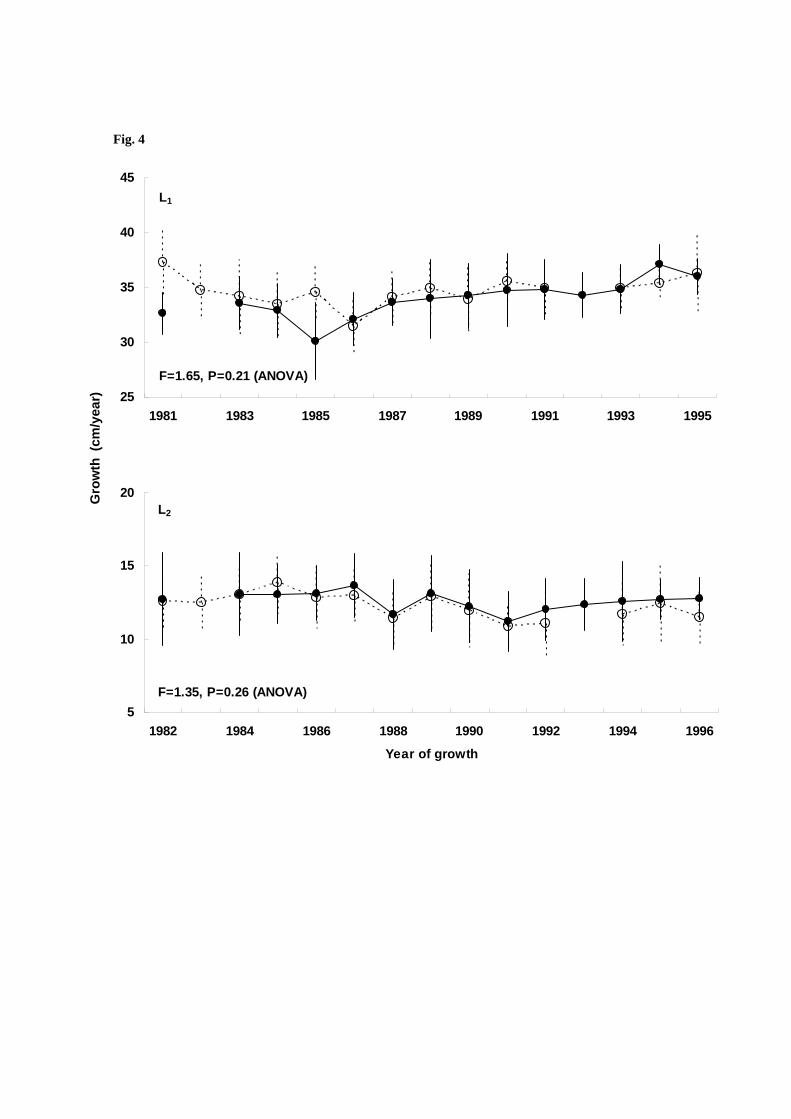
Fig. 4
25
30
35
40
45
1981 1983 1985 1987 1989 1991 1993 1995
F=1.65, P=0.21 (ANOVA)
L1
5
10
15
20
1982 1984 1986 1988 1990 1992 1994 1996
Year of growth
F=1.35, P=0.26 (ANOVA)
L2
Gro
wth
(cm
/yea
r)
Fig. 4 (continued)
5
10
15
1983 1985 1987 1989 1991 1993 1995 1997
F=12.5, P=0.001 (ANOVA)
L3
0
5
10
15
1984 1986 1988 1990 1992 1994 1996 1998
Year of growth
F=1.27, P=0.27 (ANOVA)
L4
Gro
wth
(cm
/yea
r)
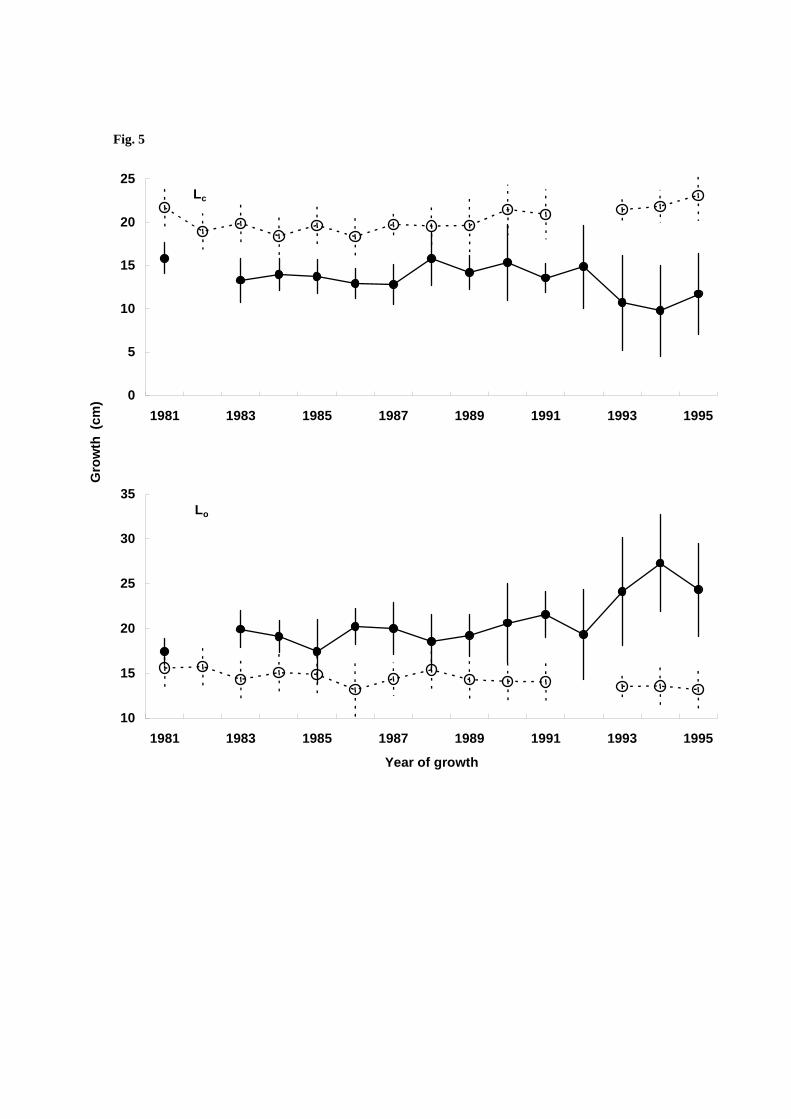
Fig. 5
0
5
10
15
20
25
1981 1983 1985 1987 1989 1991 1993 1995
Lc
10
15
20
25
30
35
1981 1983 1985 1987 1989 1991 1993 1995
Year of growth
Lo
Gro
wth
(cm
)

Fig. 6
3
15
11
8
0
5
10
15
20
6.0-6.9 7.0-7.9 8.0-8.9 9.0-9.9
FL (cm)
Nu
mb
er

Table 1 (a) Relation between year and catch of chum salmon in Asia (Japan, Russia, and Korea) and
North America, 1976 - 2003. The symbols are defined as follows: R2 is coefficient of determination; b is
slope coefficient; a is constant. (b) The difference in the slope (b) of the regression line (as shown in
Table 1a) between populations using ANCOVA. P-values and t-values associated with each correlation
are shown in the lower and upper triangle, respectively. Data on catches of chum salmon were taken from
Eggers et al. [8] and Lee et al. [37]
(a)
N=28 North Pacific North America Japan Russia Korea
R2 0.75 0.56 0.66 0.67 0.71
b 0.03 0.03 0.04 0.04 0.22
a -60.19 -59.90 -84.62 -79.96 -438.56
F 75.53 32.25 49.34 51.89 62.18
P <0.001 <0.001 <0.001 <0.001 <0.001
(b)
North Pacific North America Japan Russia Korea
North Pacific - 0.04 2.27 1.62 7.24
North America 0.97 - 1.99 1.36 7.15
Japan 0.03 0.05 - 0.76 6.44
Russia 0.11 0.18 0.45 - 6.75
Korea <0.001 <0.001 <0.001 <0.001 -
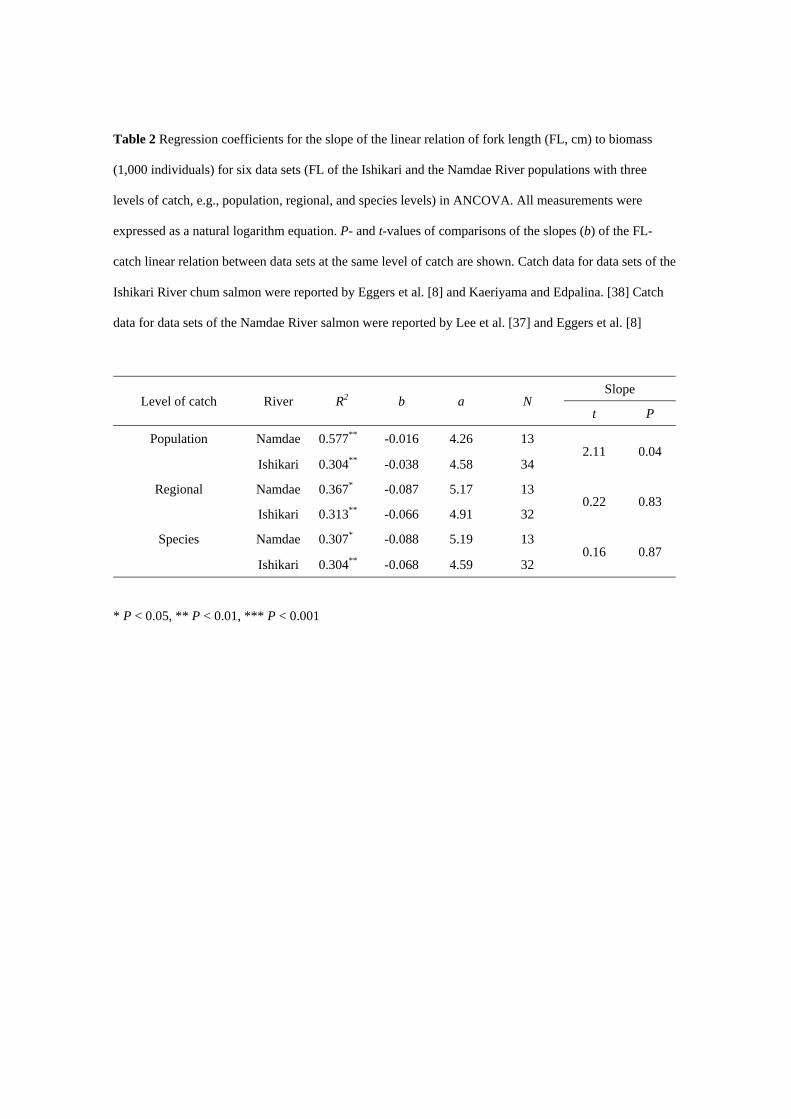
Table 2 Regression coefficients for the slope of the linear relation of fork length (FL, cm) to biomass
(1,000 individuals) for six data sets (FL of the Ishikari and the Namdae River populations with three
levels of catch, e.g., population, regional, and species levels) in ANCOVA. All measurements were
expressed as a natural logarithm equation. P- and t-values of comparisons of the slopes (b) of the FL-
catch linear relation between data sets at the same level of catch are shown. Catch data for data sets of the
Ishikari River chum salmon were reported by Eggers et al. [8] and Kaeriyama and Edpalina. [38] Catch
data for data sets of the Namdae River salmon were reported by Lee et al. [37] and Eggers et al. [8]
Level of catch River R2 b a N Slope
t P
Population Namdae 0.577** -0.016 4.26 13 2.11 0.04
Ishikari 0.304** -0.038 4.58 34
Regional Namdae 0.367* -0.087 5.17 13 0.22 0.83
Ishikari 0.313** -0.066 4.91 32
Species Namdae 0.307* -0.088 5.19 13 0.16 0.87
Ishikari 0.304** -0.068 4.59 32
* P < 0.05, ** P < 0.01, *** P < 0.001
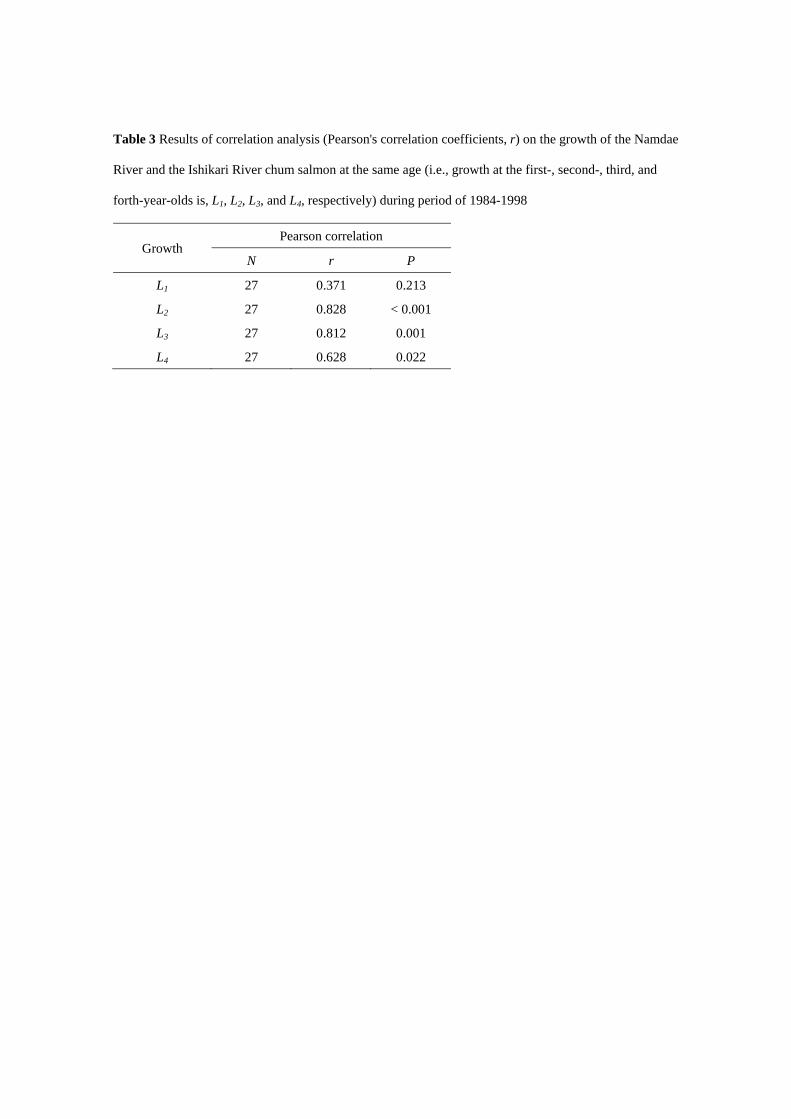
Table 3 Results of correlation analysis (Pearson's correlation coefficients, r) on the growth of the Namdae
River and the Ishikari River chum salmon at the same age (i.e., growth at the first-, second-, third, and
forth-year-olds is, L1, L2, L3, and L4, respectively) during period of 1984-1998
Growth Pearson correlation
N r P
L1 27 0.371 0.213
L2 27 0.828 < 0.001
L3 27 0.812 0.001
L4 27 0.628 0.022
アジア系シロザケ 2 個体群の種内相互作用と成長パターンの時空間変動
徐賢珠,工藤秀明,帰山雅秀(北大院水)
鱗分析と体サイズのバックカリキュレーション法に基づき,1984-1998 年に北海道石狩川
と韓国ナンダエ川へ回帰したシロザケの成長パターンの時空間変動を明らかにした。その
結果,石狩川系幼魚が沿岸から小型で直接オホーツク海へ移動するのに対して,ナンダエ
川幼魚は日本海を回遊後オホーツク海へ大型で移動することが明らかとなった。シロザケ
4 歳魚の体サイズはベーリング海で 3 歳時に種内あるいは個体群間より個体群内で強い密
度依存効果を受けることが示唆された。
Copyright © 2022 FDOKUMEN