Intraspecific comparison of diet of California sea lions ...
14
Intraspecific comparison of diet of California sea lions (Zalophus californianus) assessed using fecal and stable isotope analyses A.J. Orr, G.R. VanBlaricom, R.L. DeLong, V.H. Cruz-Escalona, and S.D. Newsome Abstract: The diet of juvenile and adult female California sea lions (Zalophus californianus (Lesson, 1828)) at San Mi- guel Island, California, was estimated and compared using fecal and stable isotope analyses to determine dietary differen- ces by age. Fecal samples were collected during 2002–2006 and prey remains were identified. Stable carbon (d 13 C) and stable nitrogen (d 15 N) isotope values were determined from plasma and fur obtained from yearlings, 2- to 3-year-old juve- niles, and adult females during 2005 and 2006. Juveniles ate more than 15 prey taxa, whereas adult females consumed more than 33 taxa. Relative importance of prey was determined using percent frequency of occurrence (%FO). Engraulis mordax Girard, 1854, Sardinops sagax (Jenyns, 1842), Merluccius productus (Ayres, 1855), genus Sebastes Cuvier, 1829, and Loligo opalescens Berry, 1911 were the most frequently occurring (%FO > 10%) prey in the feces of both juvenile and adult female sea lions, although their importance varied between age groups. Only yearlings had significantly different isotopic values than older conspecifics, indicating that older juveniles were feeding at a similar trophic level and in similar habitats as adult females. Whereas each method had biases, combining the two provided a better understanding of the diet of California sea lions and intraspecific differences. Re ´sume ´: Des analyses fe ´cales et des analyses d’isotopes stables nous ont permis d’estimer le re ´gime alimentaire de jeu- nes et de femelles adultes du lion de mer de Californie (Zalopus californianus (Lesson, 1828)) a ` l’ı ˆle San Miguel, Califor- nie, et de comparer les diffe ´rences alimentaires en fonction de l’a ˆge. Nous avons pre ´leve ´ des e ´chantillons de fe `ces en 2002–2006 et identifie ´ les restes de proies. Nous avons de ´termine ´ les valeurs des isotopes stables de carbone (d 13 C) et d’azote (d 15 N) dans le plasma et la fourrure provenant d’individus de l’anne ´e, d’individus de 2–3 ans et de femelles adultes en 2005 et 2006. Les jeunes consomment plus de 15 taxons de proies, alors que les femelles adultes en utilisent plus de 33. L’importance relative des proies est repre ´sente ´e par la fre ´quence d’occurrence en pourcentage (%FO). Engraulis mor- dax Girard, 1854, Sardinops sagax (Jenyns, 1842), Merluccius productus (Ayres, 1855), le genre Sebastes Cuvier, 1829 et Loligo opalescens Berry, 1911 sont les proies qui apparaissent le plus fre ´quemment (%FO > 10 %) dans les fe `ces des jeu- nes lions de mer et des femelles adultes, bien que leur importance varie selon les groupes d’a ˆge. Seuls les individus de l’anne ´e pre ´sentent des valeurs isotopiques diffe ´rentes de celles de leurs conge ´ne `res plus a ˆge ´s, ce qui indique que les jeunes plus a ˆge ´s se nourrissent au me ˆme niveau trophique et dans des habitats de me ˆme type que les femelles adultes. Bien que chaque me ´thode ait ses sources d’erreurs, la combinaison des deux permet une meilleure compre ´hension du re ´gime alimen- taire des lions de mer de Californie et de ses diffe ´rences intraspe ´cifiques. [Traduit par la Re ´daction] Introduction Energy is essential for all animals, and many actively search, pursue, and handle several types of prey to survive and reproduce. Although it has been assumed that individuals seek to maximize their rate of energy intake during feeding (Schoener 1971), there are constraints on the rate of energy intake that can affect optimal foraging by animals (Pyke et al. 1977). One such constraint occurs in the foraging behavior of aquatic mammals. Received 10 May 2010. Accepted 10 November 2010. Published on the NRC Research Press Web site at cjz.nrc.ca on 20 January 2011. A.J. Orr. 1 The National Marine Mammal Laboratory (NMML), Alaska Fisheries Science Center, National Oceanic and Atmospheric Administration (NOAA), 7600 Sand Point Way NE, Seattle, WA 98115, USA; Washington Cooperative Fish and Wildlife Research Unit, School of Aquatic and Fishery Sciences, University of Washington, Seattle, WA 98195, USA. G.R. VanBlaricom. Washington Cooperative Fish and Wildlife Research Unit, School of Aquatic and Fishery Sciences, University of Washington, Seattle, WA 98195, USA. R.L. DeLong. The National Marine Mammal Laboratory (NMML), Alaska Fisheries Science Center, National Oceanic and Atmospheric Administration (NOAA), 7600 Sand Point Way NE, Seattle, WA 98115, USA. V.H. Cruz-Escalona. Laboratorio de Dina ´mica y Manejo de Ecosistemas Acua ´tico, Centro Interdisciplinario de Ciencias Marinas, Instituto Polite ´cnico Nacional, Avenida IPN s/n Colonia Playa Palo de Santa Rita, La Paz, Baja California Sur 23096, Me ´xico. S.D. Newsome. Department of Zoology and Physiology, University of Wyoming, 1000 East University Avenue, Department 3166, Laramie, WY 82071, USA. 1 Corresponding author (e-mail: [email protected]). 109 Can. J. Zool. 89: 109–122 (2011) doi:10.1139/Z10-101 Published by NRC Research Press
-
Upload
khangminh22 -
Category
Documents
-
view
3 -
download
0
Transcript of Intraspecific comparison of diet of California sea lions ...

Intraspecific comparison of diet of California sealions (Zalophus californianus) assessed usingfecal and stable isotope analyses
A.J. Orr, G.R. VanBlaricom, R.L. DeLong, V.H. Cruz-Escalona, and S.D. Newsome
Abstract: The diet of juvenile and adult female California sea lions (Zalophus californianus (Lesson, 1828)) at San Mi-guel Island, California, was estimated and compared using fecal and stable isotope analyses to determine dietary differen-ces by age. Fecal samples were collected during 2002–2006 and prey remains were identified. Stable carbon (d13C) andstable nitrogen (d15N) isotope values were determined from plasma and fur obtained from yearlings, 2- to 3-year-old juve-niles, and adult females during 2005 and 2006. Juveniles ate more than 15 prey taxa, whereas adult females consumedmore than 33 taxa. Relative importance of prey was determined using percent frequency of occurrence (%FO). Engraulismordax Girard, 1854, Sardinops sagax (Jenyns, 1842), Merluccius productus (Ayres, 1855), genus Sebastes Cuvier, 1829,and Loligo opalescens Berry, 1911 were the most frequently occurring (%FO > 10%) prey in the feces of both juvenileand adult female sea lions, although their importance varied between age groups. Only yearlings had significantly differentisotopic values than older conspecifics, indicating that older juveniles were feeding at a similar trophic level and in similarhabitats as adult females. Whereas each method had biases, combining the two provided a better understanding of the dietof California sea lions and intraspecific differences.
Resume : Des analyses fecales et des analyses d’isotopes stables nous ont permis d’estimer le regime alimentaire de jeu-nes et de femelles adultes du lion de mer de Californie (Zalopus californianus (Lesson, 1828)) a l’ıle San Miguel, Califor-nie, et de comparer les differences alimentaires en fonction de l’age. Nous avons preleve des echantillons de feces en2002–2006 et identifie les restes de proies. Nous avons determine les valeurs des isotopes stables de carbone (d13C) etd’azote (d15N) dans le plasma et la fourrure provenant d’individus de l’annee, d’individus de 2–3 ans et de femelles adultesen 2005 et 2006. Les jeunes consomment plus de 15 taxons de proies, alors que les femelles adultes en utilisent plus de33. L’importance relative des proies est representee par la frequence d’occurrence en pourcentage (%FO). Engraulis mor-dax Girard, 1854, Sardinops sagax (Jenyns, 1842), Merluccius productus (Ayres, 1855), le genre Sebastes Cuvier, 1829 etLoligo opalescens Berry, 1911 sont les proies qui apparaissent le plus frequemment (%FO > 10 %) dans les feces des jeu-nes lions de mer et des femelles adultes, bien que leur importance varie selon les groupes d’age. Seuls les individus del’annee presentent des valeurs isotopiques differentes de celles de leurs congeneres plus ages, ce qui indique que les jeunesplus ages se nourrissent au meme niveau trophique et dans des habitats de meme type que les femelles adultes. Bien quechaque methode ait ses sources d’erreurs, la combinaison des deux permet une meilleure comprehension du regime alimen-taire des lions de mer de Californie et de ses differences intraspecifiques.
[Traduit par la Redaction]
Introduction
Energy is essential for all animals, and many activelysearch, pursue, and handle several types of prey to surviveand reproduce. Although it has been assumed that individuals
seek to maximize their rate of energy intake during feeding(Schoener 1971), there are constraints on the rate of energyintake that can affect optimal foraging by animals (Pyke etal. 1977). One such constraint occurs in the foragingbehavior of aquatic mammals.
Received 10 May 2010. Accepted 10 November 2010. Published on the NRC Research Press Web site at cjz.nrc.ca on 20 January 2011.
A.J. Orr.1 The National Marine Mammal Laboratory (NMML), Alaska Fisheries Science Center, National Oceanic and AtmosphericAdministration (NOAA), 7600 Sand Point Way NE, Seattle, WA 98115, USA; Washington Cooperative Fish and Wildlife Research Unit,School of Aquatic and Fishery Sciences, University of Washington, Seattle, WA 98195, USA.G.R. VanBlaricom. Washington Cooperative Fish and Wildlife Research Unit, School of Aquatic and Fishery Sciences, University ofWashington, Seattle, WA 98195, USA.R.L. DeLong. The National Marine Mammal Laboratory (NMML), Alaska Fisheries Science Center, National Oceanic and AtmosphericAdministration (NOAA), 7600 Sand Point Way NE, Seattle, WA 98115, USA.V.H. Cruz-Escalona. Laboratorio de Dinamica y Manejo de Ecosistemas Acuatico, Centro Interdisciplinario de Ciencias Marinas,Instituto Politecnico Nacional, Avenida IPN s/n Colonia Playa Palo de Santa Rita, La Paz, Baja California Sur 23096, Mexico.S.D. Newsome. Department of Zoology and Physiology, University of Wyoming, 1000 East University Avenue, Department 3166,Laramie, WY 82071, USA.
1Corresponding author (e-mail: [email protected]).
109
Can. J. Zool. 89: 109–122 (2011) doi:10.1139/Z10-101 Published by NRC Research Press

Because foraging by aquatic mammals occurs during abreath hold, feeding depth and time spent searching, pursu-ing, handling, and consuming prey are constrained by oxy-gen reserves acquired before submergence. Thephysiological constraints that limit dive duration are highlycorrelated with an animal’s size and age (Horning and Trill-mich 1997; Burns 1999). Oxygen stores increase with bodymass (Schmidt-Nielsen 1984; Kooyman 1989) and are de-pleted faster in smaller animals because of their highermass-specific metabolic rates (Kleiber 1975; Thorson andLe Boeuf 1994). Therefore, young individuals theoreticallyare more limited in the depths that they can dive (aerobi-cally) and the durations that they can stay underwater, re-sulting in differences in foraging behaviors compared witholder conspecifics.
Several authors have suggested that other factors relatedto prey (e.g., prey species, behavior, energy content, size,swimming speed, abundance, density, and distribution) andpredator species, age, sex, experience, social status, or con-spicuousness may be more important than physiological lim-its of a breath hold to the diving and foraging patterns ofaquatic mammals (e.g., Schoener 1971; Dunstone andO’Connor 1979; Costa 1991; Pierce and Boyle 1991). Suchfactors and constraints frequently are observed in the forag-ing behaviors of otariid pinnipeds. For example, lactating fe-males are central place foragers and constrained in durationby their pups’ fasting limitations to forage near rookeriesduring breeding season (Melin et al. 2000). Juveniles, whichmay be physiologically constrained to feeding in shallowerdepths, have less experience at acquiring prey or handlinglarge prey and might not exploit the same range of fooditems as faster and larger adults. These differences in pheno-type, physical capabilities, and biological requirementsamong conspecifics likely result in different patterns in diet,distribution, and habitat use related to feeding among ageclasses of otariids.
Various methods have been used to determine the diet ofotariids (e.g., collection of stomachs, regurgitations, enemas,and lavages); however, fecal (scat) samples primarily arecollected nowadays. Scats are useful because many can becollected quickly, inexpensively, and with little or no harmto animals (Harvey 1989). The distinctive morphology ofotoliths and other diagnostic bones of teleost fishes, variousstructures of cartilaginous fishes, and beaks of cephalopodscan be used to identify pinniped prey taxa.
Stable isotope analysis, among other biochemical meth-ods, has been used to augment the more conventional tech-niques in assessing the diet of pinnipeds. In particular, theabundance of naturally occurring stable isotope ratios of car-bon (13C/12C) and nitrogen (15N/14N) have been used to ex-amine trophic relations and identify sources of prey ornutrients of pinnipeds in several systems (see review byNewsome et al. 2010).
Stable isotope analysis is based on the idea that the stableisotope composition of a consumer’s diet is reflected in itstissues. Because of the preferential excretion of 14N in urine,d15N values increase by approximately 3%–5% per trophiclevel in marine food webs (DeNiro and Epstein 1978; Mina-gawa and Wada 1984; Owens 1987; Wada et al. 1991; Hob-son and Welch 1992; Kurle 2002). Therefore, the relativeamount of 15N in tissues reflects the trophic level at which
the consumer is feeding, with higher d15N values corre-sponding to higher trophic levels. The ratio of stable carbonisotopes varies little with trophic position (approximately0.5%–1.1% enrichment with increase of trophic level inmarine food webs; Fry and Sherr 1984; Wada et al. 1991;Kurle 2002). Instead, d13C reflects the isotopic compositionof primary producers at the base of the food web and hasbeen used to indicate consumer foraging locations (d13C en-richment: fresh water > marine, nearshore > offshore,benthic > pelagic, low latitude > high latitude; Rau et al.1982; Fry and Sherr 1984; Wada et al. 1991; France 1995;Burton and Koch 1999; Cherel and Hobson 2007).
In contrast to traditional methods, which reflect prey con-sumed by pinnipeds only during the most recent feedingevents (Orr and Harvey 2001; Sweeney 2008), the stableisotope approach reflects the diet assimilated over a longertime period, ranging from a few days to years because ofthe dissimilar isotopic turnover rates of various tissues(Kurle and Worthy 2002; Dalerum and Angerbjorn 2005;Hammill et al. 2005). Although stable isotope analysis doesnot provide detailed information on dietary composition andinterpreting isotopic data can be complicated, the use of sta-ble isotope analysis is advantageous in avoiding the biasesassociated with using scat samples alone (e.g., Jobling andBreiby 1986; Dellinger and Trillmich 1988; Arim and Naya2003; Sweeney 2008). Additionally, when using stable iso-tope analysis, ancillary information can be collected and in-traspecific comparisons (e.g., age) are possible.
The California sea lion (Zalophus californianus (Lesson,1828)) is the most abundant sea lion in the world, with anestimated population of 355 000 (Caretta et al. 2005;Aurioles and Trillmich 2008). Juveniles compose a signifi-cant proportion of this predator that occupies coastal watersand directly competes for food resources with humans, yetwe know little about their foraging behaviors. Studies havebeen conducted to determine the diet of California sea lionsthroughout their distribution (e.g., Antonelis et al. 1984;Roffe and Mate 1984; Lowry et al. 1991; Garcıa-Rodrıguezand Aurioles-Gamboa 2004), but the size distribution ofprey and differences in diet according to age of sea lions(specifically juveniles) were not assessed. Information aboutjuvenile diet is needed to provide insight into potential intra-specific competition, resource partitioning, and optimal for-aging by conspecifics at different stages of theirdevelopment. The objective of this study was to use fecaland stable isotope analyses to describe the diet of juvenileCalifornia sea lions and to compare them with those of adultfemales to examine age-related variation in diet betweenthese age classes. Adult males disperse from rookeries dur-ing the nonbreeding season and many fast during the breed-ing season, therefore their dietary information was notincluded in this study.
Materials and methods
Fecal analysisScat and enema samples from California sea lions were
collected at San Miguel Island (34.038N, 120.448W; Fig. 1)during July 2002; March, September, and October 2003;March 2004; March and April 2005; and February, March,and July 2006. Samples collected at Cardwell Point, Glass
110 Can. J. Zool. Vol. 89, 2011
Published by NRC Research Press

Float, and Crook Point beaches were from juveniles,whereas scats obtained on the west end of the island werefrom adult females (Fig. 1). Here, age class was based onthe animals’ morphological characteristics. Juveniles of bothsexes were non-pups, 1–3 years old, approximately 1–1.5 mlong, with coloration ranging from tan to brown. Adult fe-males were ‡4 years old, 1.5–2 m long, and light brown orcream colored (descriptions summarized from Aurioles1988; Aurioles and Zavala 1994). During the sampling peri-ods, Glass Float and Crook Point beaches were used by ju-venile sea lions and rarely used by other demographicgroups. When older animals were present, an effort wasmade to collect samples that we subjectively determined tobe excreted by a juvenile (e.g., relatively smaller in sizeand diameter). Only ‘‘fresh’’ scats (i.e., those with no ob-vious signs of desiccation) were collected to assure thatprey species were consumed at or near to the time of collec-tions. Each scat was collected into either a 124 mm meshbag (3.8 L, 85–95 fine-mesh nylon paint strainers; Reavesand Company,2 Durham, North Carolina, USA) or a plasticWhirl-Pak12 bag. Date, location, and suspected age class ofthe animal that expelled the sample were recorded on a cardand placed with each sample. Scats were frozen until futurecleaning and analyses.
Enemas were given to selected juvenile sea lions usingtechniques described by Staniland et al. (2003). Enema sam-ples were collected in an effort to obtain information aboutthe animal that excreted the sample so that dietary estimatesaccessed using two methods could be compared for each in-dividual. Enema samples were stored in plastic bags and fro-zen for future cleaning and analyses. Because of limitedsamples sizes, ancillary information for animals given ene-mas was disregarded and enema samples were pooled withscats for further processing and analyses. All frozen sampleswere thawed overnight and prey remains (e.g., otoliths,
bones, and lenses from teleost fishes; cartilage from cartila-ginous fishes; and beaks, pens, and statoliths from cephalo-pods) were separated from other organic waste material byrinsing samples with water through a series of three sieves(mesh sizes 2.0, 1.0, and 0.5 mm; Murie and Lavigne 1985)or by placing them in mesh bags and cleaning using a wash-ing machine (Orr et al. 2003). All prey hard parts were col-lected and stored in glass scintillation vials. Fish remainswere stored dry and cephalopod parts were stored in a 50%isopropanol solution. Vials containing prey remains for eachsample were labeled with a unique identification number,the area of collection, age class of predator, and the date.
Prey items were identified to the lowest taxon possible us-ing an extensive reference collection at The Alaska FisheriesScience Center’s National Marine Mammal Laboratory (Se-attle, Washington), voucher samples verified by PacificIdentifications (Victoria, British Columbia, Canada), andcomparative illustrations acquired from the literature. Un-known prey items were categorized as ‘‘unidentified’’ and‘‘unidentifiable’’ (Browne et al. 2002). Remains that werecategorized as ‘‘unidentifiable’’ were excluded from analy-ses. A subset of samples (approxmately 10%) was verifiedby a second identifier. Only fish otoliths and cephalopodbeaks were used to estimate size of prey. Otolith length (tothe nearest 0.05 mm) was measured parallel to the sulcusfrom the anterior tip of the rostrum to the posterior edge us-ing a dissecting microscope and either an ocular micrometeror hand-held calipers. Otoliths with broken edges were notmeasured. The upper and lower rostral lengths of cephalo-pod beaks were measured (to the nearest 0.05 mm) using adissecting microscope equipped with an ocular micrometer.
To account for degradation of otoliths during digestion,species-specific correction factors were applied to lengthsof otoliths in ‘‘fair’’ condition (Orr and Harvey 2001). Acorrection factor of 1.3 was used for prey that did not have
Fig. 1. Map of San Miguel Island, California, where fecal and stable isotope samples were collected from California sea lions (Zalophuscalifornianus). Fecal samples collected at Crook Point, Cardwell Point, and Glass Float Beach were from juveniles (1–3 years old), whereasthose collected from the west end of the island near Point Bennett were from adult females (‡4 years old).
2 References to trade names or companies do not imply endorsement by the National Marine Fisheries Service, NOAA, or the University ofWashington.
Orr et al. 111
Published by NRC Research Press

known correction factors (Harvey 1989; Orr and Harvey2001). Because cephalopod beak size is not reduced signifi-cantly during digestion, correction factors were not applied(J.T. Harvey, G.A. Antonelis, Jr., and C.J. Casson, unpub-lished data). The length of several prey were estimated (tothe nearest 0.1 cm) using species-specific linear regressionsof otolith length to fish standard length (supplementaryTable S13; Walker 1996; Harvey et al. 2000) and beak ros-tral length to dorsal mantle length for cephalopods(Table S23; Wolff 1982, 1984; Clarke 1986). Mass estimates(to the nearest 0.1 g) of several prey species were obtainedusing species-specific regressions of the estimated preylength (described above) and measured masses (Wolff 1982,1984; Harvey et al. 2000; S. Osborne, personal communica-tion, 1994; W. Walker, personal communication, 2009).Identifying species of rockfish (Sebastes spp.) was difficult,so the length and mass regression equations used for this ge-nus were from bocaccio (Sebastes paucispinis Ayres, 1854).Bocaccio was selected as the representative rockfish becauseit was the most abundant rockfish in areas near San MiguelIsland (Best and Oliphant 1965; Antonelis et al. 1984).Equations from clawed armhook squid (Gonatus onyxYoung, 1972) were used to estimate the length and mass ofall Gonatus species. Identified prey species obtained fromfecal samples were pooled using age class (i.e., juvenile andadult female) and year. Differences among estimated preylengths by age class were non-normally distributed, so aMann–Whitney U test was conducted to determine if therewere any significant differences in prey sizes consumed bydifferent-aged sea lions.
Adequacy of sample size to describe diet was determinedby creating mean cumulative prey diversity curves (±1 SD)based on the Shannon–Wiener (H’) index (Krebs 1999), fol-lowing an approach proposed by Ferry and Cailliet (1996)and Ferry et al. (1997) and modified by V.H. Cruz-Escalona(co-author) and C. Turren. Diversity curves were created byimplementing a Matlab routine that computes 500 randompermutations of the original data. If the prey diversity curvereached an asymptote, then we assumed that enough sampleswere analyzed to characterize the diet.
The relative importance of different prey taxa in the dietwas determined using percent frequency of occurrence(%FO), which was defined as
%FOi ¼
Xs
k¼1Oik
s� 100
where Oik is the absence (0) or presence (1) of taxon i insample k and s is the number of samples that containedidentifiable prey remains.
The presence of taxon i in sample k was determined byusing any structure of a particular prey taxon. %FO was cal-culated for each year and averaged for the study tenure (i.e.,2002–2006) for each age class. Relative frequency of preytaxa per year was used as a proportional metric rather thanrelative abundance because of the biases associated with rel-ative abundance estimates (Cottrell et al. 1996; Laake et al.2002). Prey composition was compared between age classesusing a percentage similarity index (PSI)
PSI ¼Xðminimum pij; pikÞ
where pij and pik were the proportions of prey item i of thetotal prey consumed by juveniles (j) and adult females (k),and the Morisita’s index (M)
M ¼ 2PðpijpikÞP
pij2 þPpik2
(Krebs 1999). Indices range from zero (no similarity) to 1.00(identical species composition). The level of significancewas set arbitrarily at 0.65 for both PSI and M.
Prey array indices were calculated to describe differencesin prey items consumed by juvenile and adult female sealions. Indices calculated included the following: speciesrichness (S; number of prey species); Simpson’s diversity in-dex (dominance; D = S pi
2); Levin’s measure of nichebreadth (B = 1/D); Shannon–Wiener diversity index (H’ =|S pi � ln pi |, where pi is the proportion of individuals usingprey i); prey evenness (J = H’/H’max, where H’max = ln S);and index of specialization (R = 1 – J) (Krebs 1999). Preyarray indices calculated for each year for both juvenile andadult female sea lions were non-normally distributed, so aMann–Whitney U test was conducted to determine if therewas any significant difference in mean prey array values be-tween age classes.
Stable isotope analysisDuring 2005 and 2006, blood plasma and fur samples
were collected from known-aged yearlings (1–2 years old)and juveniles (2–3 years old); both age classes were re-ferred to as ‘‘juveniles’’ in this study. These tissues alsowere collected from adult females. Plasma samples werecollected in Vacutainer12 tubes containing the anticlottingagent sodium heparin, which has been determined not toalter isotopic values (Kurle 2002). Plasma was separatedfrom blood cells after 10 min of centrifugation and approx-imately 1 mL was decanted into a 2 mL cryovial and fro-zen at –40 8C until further processing. Fur was collectedby cutting a patch approximately 2 cm � 2 cm on the dor-sal side of each individual at the pelvic girdle using scis-sors or electric clippers applied to the base of the shaftwithout removing the follicle. Fur samples were stored dryin paper envelopes until further processing. Once in thelaboratory, frozen plasma and fur samples were placed intoa lyophilizer for 24–48 h. Once dried, samples wereground into powder and homogenized using a glass rod(plasma) or a mortar and pestle (fur). They were weighedinto tin capsules (8 mm � 5 mm) to a target mass of1.0 ± 0.2 mg.
Nitrogen (d15N) and carbon (d13C) isotope values were de-termined using a continuous flow – isotope ratio mass spec-trometer (20-20 PDZ Europa) at the University of California(UC) at Davis Stable Isotope Facility (Davis, California,USA) or using a Carlo-Erba elemental analyzer (NC 2500)interfaced with a Finnegan Delta Plus XL mass spectrometerin the light stable isotope facility at Carnegie Institution ofWashington (Washington, D.C., USA). Correction factorsof +1.7 (for d15N) and +1.0 (for d13C) were applied to sam-ples sent to The UC Davis Stable Isotope Facility, owing to
3 Supplementary Tables S1–S3 and Figs. S1–S3 for this article are available on the journal Web site (http://cjz.nrc.ca).
112 Can. J. Zool. Vol. 89, 2011
Published by NRC Research Press

interlaboratory discrepancies between standards of knownisotopic composition sent to both facilities. Isotopicresults are expressed as d values, d13C or d15N = [(Rsample/Rstandard) – 1] � 1000, where Rsample and Rstandard are the13C/12C or 15N/14N ratios of the sample and standard, respec-tively. The standards are Vienna-Pee Dee Belemnite (V-PDB) limestone for carbon and atmospheric N2 for nitrogen.The units are expressed as parts per thousand or per mil (%)and are calibrated to international standards through re-peated measurements of a gelatin standard of known iso-topic composition. The within-run standard deviation ofacetanilide standards was £0.2% for both d13C and d15N val-ues. As a control for tissue quality, we measured carbon andnitrogen concentrations (presented as [C]/[N] ratios) of eachsample (Table S3).3 The d15N and d13C ratios among ageclasses were not normally distributed, so they were com-pared using individual Kruskal–Wallis tests. Significancewas set at a = 0.05. When significant differences were de-tected, pairwise multiple comparisons among age classeswere assessed using individual Mann–Whitney U tests. Stat-istical analyses were performed using SPSS version 13.0 forWindows (SPSS Inc., Chicago, Illinois, USA).
Results
Fecal analysisThe cumulative prey diversity curves for juveniles (except
during 2002 and 2005) and adult females reached an asymp-tote, indicating that we had sufficient fecal samples to de-scribe the diets of sea lions during the study period(Figs. S1, S2).3 A lower number of juvenile samples werecollected during 2002 and 2005, and curves did not reachan asymptote (Fig. S1).3 Therefore, results of diet composi-tion during those years should be viewed with caution. From2002 through 2006 during 12 days of collection, 178 sam-ples (166 scats, 12 enema samples) were collected in areaspredominantly occupied by juvenile sea lions (Table 1). Ad-ditionally, 296 scats were collected in areas used by adultfemales during 11 days of collection. Of the 474 samplescollected, only 3 (1 scat, 2 enema samples) contained noprey remains (i.e., blanks; Table 1). Adult female scats hada greater proportion of the different types of prey remains(e.g., fish otoliths and bones, cephalopod beaks) comparedwith juvenile scats (Table 1). Fish remains were found in77.1% and 98.0% of juvenile and adult female samples withidentifiable prey, respectively, and cephalopods in 34.9%and 43.2%, respectively. Only two scats (1 juvenile, 1 adultfemale) had remains of cartilaginous fish. Throughout thecollection period, a majority of prey hard parts (>63% forjuveniles, >76% for adult females) were identified to genus(Fig. S3),3 representing at least 15 species (13 fishes, 2cephalopods; Table 2) for juveniles and at least 33 species(25 fishes, 8 cephalopods; Table 2) for adult females.
The relative importance of each prey taxa was determinedusing %FO. The %FO for most prey taxa was greater whenall structures were used rather than just fish otoliths or ceph-alopod beaks only, which traditionally were the only preytypes used for analyses. Of the 376 prey occurrences in ju-venile feces, 76.9% were fishes and 23.1% were cephalo-pods. Of the 731 prey occurrences in adult female scats,78.9% were fishes and 21.1% were cephalopods. The rank-
ing of importance of the predominant prey species variedbetween years and between age classes (Tables 3, 4). Inter-annual differences should be viewed with caution because ofthe disparity in sampling among years. However, when sam-ples were pooled among years, northern anchovy (Engraulismordax; 54.3% and 40.2%) and Pacific sardine (Sardinopssagax; 48.0% and 54.7%) were the predominant fish speciesconsumed by juvenile and adult female sea lions, respec-tively; market squid (Loligo opalescens); 37.1% and 31.4%)was the predominant cephalopod eaten by juveniles andadult females, respectively. Other schooling fishes, such asPacific hake (Merluccius productus) and rockfish, were alsocommon prey in the diets of both juvenile and adult femalesea lions; each occurring in ‡12% of the samples. Juvenilesea lions consumed only one other cephalopod species, EastPacific red octopus (Octopus rubescens). In contrast, at leastseven additional cephalopod species were consumed byadult females, although infrequently (Table 4). Remains ofelasmobranchs, identified to be from a skate (family Raji-dae) and a spiny dogfish (Squalus acanthias), were recov-ered from one juvenile sample and one adult femalesample, respectively).
There were no differences in diet composition betweenage groups when all years were pooled (PSItotal = 0.84,Mtotal = 0.96) or averaged (mean PSI = 0.63, mean M =0.80). However, prey composition changed during 2002,2005, and 2006 when PSI was used (for all PSI < 0.65).Prey composition was not determined to be different be-tween age classes for any year when M was used (for allM > 0.65).
Fecal samples from juveniles contained 1–5 prey taxa (S;mean = 2.21, SE = 0.09), whereas those from adult femalescontained 1–10 prey taxa (mean = 2.83, SE = 0.11; Fig. 2).The majority of samples (84.7% juveniles, 73.8% adult fe-males) contained 1–3 prey taxa (Fig. 2). Although fewerprey species per fecal sample were found from juvenilescompared with from adult females, the difference was notsignificant. A higher diversity (H’) of prey taxa was con-sumed by adult females (mean = 1.96, SE = 0.20, H’max =2.62) compared with juveniles (mean = 1.45, SE = 0.18,H’max = 1.87; Fig. 3) during each year; however, the differ-ences in diversity were not significant. Both groups had rel-atively high H’ values in relation to their H’max values;consequently, they had low dominance values (D;meanjuvenile = 0.30, SE = 0.05; meanadult female = 0.20, SE =0.04; Fig. 3) and low specialization values (R; meanjuvenile =0.21, SE = 0.03; meanadult female = 0.25, SE = 0.02; Fig. 3).No significant differences in dominance or specializationwere detected between age classes. Niche breadth valueswere in the low to mid-ranges when compared with themaximum value of number of species for juveniles (mean =3.68, SE = 5.65, Bmax = 7.40; Fig. 3) and adult females(mean = 5.65, SE = 0.84, Bmax = 15.60; Fig. 3). There wasno significant difference in B between age classes. Both ageclasses had relatively high evenness values (J; meanjuvenile =0.79, SE = 0.03; meanadult female = 0.75, SE = 0.02; Fig. 3)and their values were not significantly different.
The estimated standard lengths (mean ± SE) and mass(mean ± SE) of fishes eaten by juvenile sea lions (that hadregression equations in common with adult females)throughout the sampling period were 12.2 ± 0.2 cm and
Orr et al. 113
Published by NRC Research Press

Table 1. Summary of the number of prey hard parts retrieved from fecal and enema samples collected from juvenile (JUV) andadult female (ADF) California sea lions (Zalophus californianus) at San Miguel Island, California, during 2002 through 2006;five enema samples (two blanks) were collected in 2003, six during 2005, and one during 2006 from juvenile sea lions.
2002 2003 2004 2005 2006 Total
JUV ADF JUV ADF JUV ADF JUV ADF JUV ADF JUV ADFNo. of samples collected 14 94 75 98 56 35 6 49 27 20 178 296
With remains 14 94 72 98 56 35 6 49 27 20 175 296With fish remains 4 89 47 98 56 34 4 49 24 20 135 290With otoliths 0 28 20 64 12 15 2 30 10 16 44 153With bones 4 86 47 98 56 34 2 49 24 19 133 286With beaks 10 54 31 50 15 10 0 5 5 9 61 128With cartilage 0 0 0 1 1 0 0 0 0 0 1 1
Table 2. Family, specific, and common names of prey found in fecal samples collected from juvenile (J) and adult female (A) Ca-lifornia sea lions (Zalophus californianus) at San Miguel Island, California, during 2002 through 2006. Juveniles were 1–3 years old.Age indicates the age class of the sea lion.
Family Species Common name Age
FishesBathylagidae Leuroglossus stilbius Gilbert, 1890 California smoothtongue J, ABatrachoididae Porichthys notatus Girard, 1854 Plainfin midshipmen J, ABothidae Citharichthys sordidus (Girard, 1854) Pacific sanddab ACarangidae Trachurus symmetricus (Ayres, 1855) Jack mackerel J, AClupeidae Clupea pallasii Valenciennes in Cuvier and Valenciennes, 1847 Pacific herring A
Sardinops sagax (Jenyns, 1842) Pacific sardine J, AClupeids Herrings J
Embiotocidae Cymatogaster aggregata Gibbons, 1854 Shiner perch AEngraulididae Engraulis mordax Girard, 1854 Northern anchovy J, AGadidae/Merlucciidae Merluccius productus (Ayres, 1855) Pacific hake J, AHexagrammidae Hexagrammids Greenling A
Oxylebius pictus Gill, 1862 Painted greenling AMyctophidae Myctophids Laternfish A
Stenobrachius leucopsarus (Eigenmann and Eigenmann, 1890) Northern lampfish J, ASymbolophorus californiensis (Eigenmann and Eigenmann, 1889) California laternfish ATarletonbeania crenularis (Jordan and Gilbert, 1880) Blue lanternfish J, A
Ophidiidae Chilara taylori (Girard, 1858) Spotted cusk-eel APleuronectidae Lyopsetta exilis (Jordan and Gilbert, 1880) Slender sole A
Pleuronectids Righteye flounders ARajidae Rajids Skates JSciaenidae Genyonemus lineatus (Ayres, 1855) White croaker A
Seriphus politus Ayres, 1860 Queenfish AScomberesocidae Cololabis saira (Brevoort, 1856) Pacific saury J, AScombridae Scomber japonicus Houttuyn, 1782 Pacific or chub mackerel J, AScorpaenidae Genus Sebastes Cuvier, 1829 Rockfish J, ASerranidae Serranids Seabass ASqualidae Squalus acanthias L., 1758 Spiny dogfish A
CephalopodsEnoploteuthidae Abraliopsis felis McGowan and Okutani, 1968 AGonatidae Genus Gonatus Gray, 1849 Armhook squids A
Gonatopsis Sasaki, 1920 AHistioteuthidae Histioteuthis hoylei (Goodrich, 1896) Flowervase jewell squid ALoliginidae Loligo opalescens Berry, 1911 Market squid J, AOctopodidae Octopus rubescens Berry, 1953 East Pacific red octopus J, AOmmasteuthidae Ommasteuthids AOnychoteuthidae Onychoteuthis borealijaponicus Okada, 1927 Boreal clubhook squid A
114 Can. J. Zool. Vol. 89, 2011
Published by NRC Research Press

21.3 ± 1.1 g, respectively. Fishes consumed by adult femaleswere 12.0 ± 0.1 cm long and weighed 20.0 ± 0.5 g. Therewere no significant differences in the overall lengths offishes consumed by juveniles and adult females; however,significant differences existed in mass of fishes (Mann–Whitney U test, P = 0.004). Estimated dorsal length(mean ± SE) and mass (mean ± SE) of cephalopods re-trieved from juvenile fecal samples were 9.8 ± 0.2 cm and21.0 ± 0.4 g, respectively. Cephalopods eaten by adult fe-males were 10.5 ± 0.1 cm long and weighed 21.8 ± 0.2 g.There were no significant differences in the pooled mass ofcephalopods consumed by juvenile and adult female sealions; however, there were significant differences in thelengths of cephalopods (Mann–Whitney U test, P = 0.02).
Several prey consumed by juvenile and adult female sealions were of different sizes. The estimated mean standardor mantle lengths and mass of northern anchovy, Californiasmoothtongue (Leuroglossus stilbius), Pacific hake, rockfish,and East Pacific red octopus taken by juvenile sea lionswere greater than those eaten by adult females (Figs. 4, 5;note that mass could not be determined for rockfish). Therewere significant differences in the sizes of Pacific hake(Mann–Whitney U test, Plength and mass < 0.001) and rockfish(Mann–Whitney U test, Plength = 0.002) consumed by bothage groups. Estimated mean standard or mantle lengths andmass of market squid and Pacific sardine consumed by adultfemales were larger than those eaten by juvenile sea lions(Figs. 4, 5); however, none of these differences were signifi-cant. Adult females ate larger (length and mass) individualsof each prey species with the largest standard length andmass (Figs. 4, 5).
Stable isotope analysisA total of 36 plasma (8 yearling, 14 juvenile, 14 adult fe-
male) and 49 fur (10 yearling, 18 juvenile, 21 adult female)samples were collected from California sea lions. We wereable to separate yearlings from other juveniles because their
ages were known. Plasma d13C values rangedfrom –15.0% ± 0.1% (mean ± SE) for yearlings and juve-niles to –14.9% ± 0.1% for adult females (Fig. 6) and didnot differ significantly among age classes. There were sig-nificant differences in plasma d15N values among age classes(Kruskal–Wallace test, P = 0.005). Yearlings (18.0% ±0.1%) and juveniles (17.8% ± 0.1%) had significantlyhigher plasma d15N values compared with adult females(17.6% ± 0.2%; Mann–Whitney U test, P < 0.01 for bothcomparisons; Fig. 6). Fur d13C values ranged from–13.8% ± 0.2% (mean ± SE) for yearlings to –13.3% ±0.1% for adult females (Fig. 6) and did not differ signifi-cantly among age classes. On average, yearlings were en-riched 1.3% in mean fur d15N values compared withjuveniles and adult females (Fig. 6). There were significantdifferences in fur d15N values between yearlings and older ageclasses (Mann–Whitney U test, for all comparisons P < 0.01).
Discussion
Fecal analysisTo examine if the diet composition of animals in the wild
is accurately reflected using fecal sample reconstruction,empirical and direct observations are required. This is logis-tically difficult for most aquatic consumers. Hammill et al.(2005) noted that a more feasible approach could be to com-pare diet composition estimates using alternative techniquesapplied to the same animals.
Dietary studies using fecal samples of California sea lionshave been conducted at many areas throughout their geo-graphical range, including San Miguel Island (e.g., Antone-lis et al. 1984; DeLong et al. 1991; Melin 2002). Althoughlittle information has been reported on the diet of juvenileCalifornia sea lions, this study was in concordance with pre-vious studies in determining that California sea lions (re-gardless of age class) are adept at feeding on a variety ofprey species.
Table 3. Percent frequency of occurrence (%FO) and mean rank of prey taxa retrieved from fecal samples col-lected from juvenile California sea lions (Zalophus californianus) at San Miguel Island, California, during 2002through 2006 (N = 175).
Prey 2002 2003 2004 2005 2006 Total Mean rankEngraulis mordax 21.4 44.4 60.7 66.7 81.5 54.3 2.0Sardinops sagax 0.0 59.7 66.1 0.0 14.8 48.0 3.6Loligo opalescens (cephalopod) 64.3 44.4 28.6 0.0 29.6 37.1 3.0Merluccius productus 14.3 2.8 35.7 16.7 37.0 20.0 4.8Sebastes spp. 0.0 25.0 3.6 0.0 3.7 12.0 6.4Octopus rubescens (cephalopod) 50.0 8.3 5.4 0.0 0.0 9.1 6.0Trachurus symmetricus 0.0 12.5 5.4 0.0 3.7 7.4 6.4Scomber japonicus 0.0 0.0 1.8 0.0 7.4 1.7 8.6Cololabis saira 0.0 4.2 0.0 0.0 0.0 1.7 8.4Clupea pallasi 0.0 0.0 0.0 16.7 0.0 0.6 9.4Rajids 0.0 0.0 1.8 0.0 0.0 0.6 9.4Leuroglossus stilbius 0.0 1.4 0.0 0.0 0.0 0.6 9.0Porichthys notatus 0.0 1.4 0.0 0.0 0.0 0.6 9.0Stenobrachius leucopsarus 0.0 1.4 0.0 0.0 0.0 0.6 9.0Tarletonbeania crenularis 0.0 1.4 0.0 0.0 0.0 0.6 9.0
Number of samples 14 72 56 6 27 175 ..
Note: Prey taxa not indicated as being a cephalopod are fishes. Juveniles were 1–3 years old.
Orr et al. 115
Published by NRC Research Press
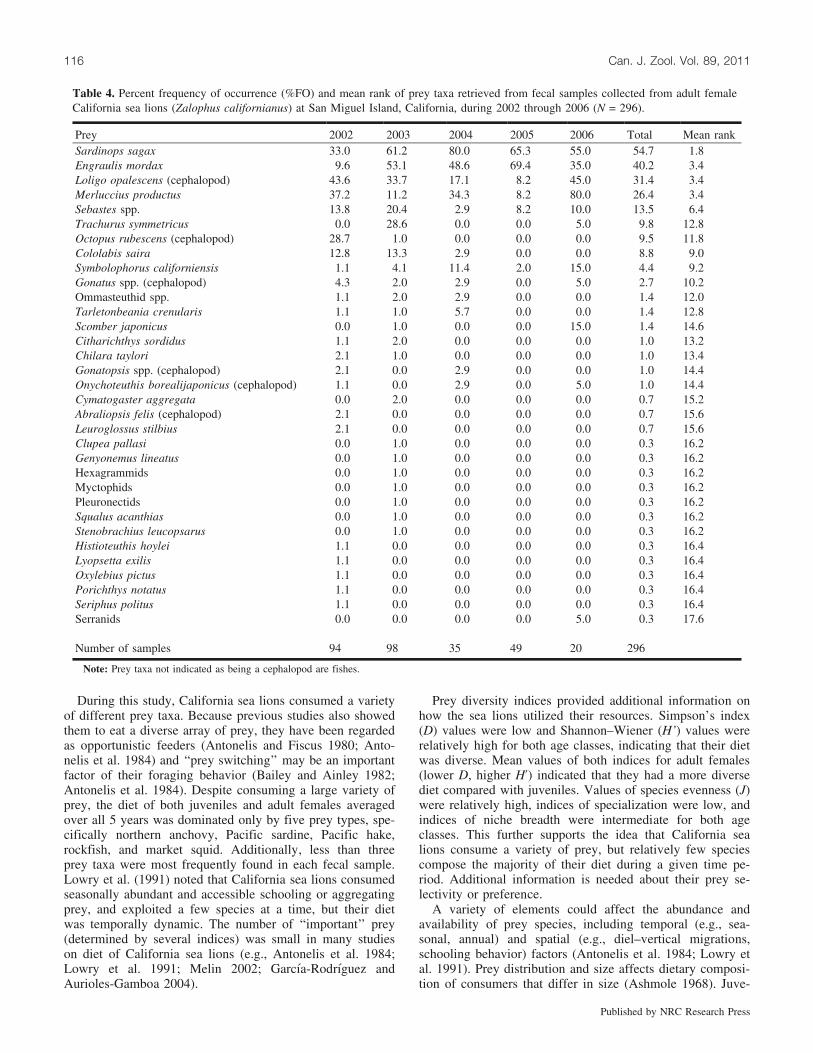
During this study, California sea lions consumed a varietyof different prey taxa. Because previous studies also showedthem to eat a diverse array of prey, they have been regardedas opportunistic feeders (Antonelis and Fiscus 1980; Anto-nelis et al. 1984) and ‘‘prey switching’’ may be an importantfactor of their foraging behavior (Bailey and Ainley 1982;Antonelis et al. 1984). Despite consuming a large variety ofprey, the diet of both juveniles and adult females averagedover all 5 years was dominated only by five prey types, spe-cifically northern anchovy, Pacific sardine, Pacific hake,rockfish, and market squid. Additionally, less than threeprey taxa were most frequently found in each fecal sample.Lowry et al. (1991) noted that California sea lions consumedseasonally abundant and accessible schooling or aggregatingprey, and exploited a few species at a time, but their dietwas temporally dynamic. The number of ‘‘important’’ prey(determined by several indices) was small in many studieson diet of California sea lions (e.g., Antonelis et al. 1984;Lowry et al. 1991; Melin 2002; Garcıa-Rodrıguez andAurioles-Gamboa 2004).
Prey diversity indices provided additional information onhow the sea lions utilized their resources. Simpson’s index(D) values were low and Shannon–Wiener (H’) values wererelatively high for both age classes, indicating that their dietwas diverse. Mean values of both indices for adult females(lower D, higher H’) indicated that they had a more diversediet compared with juveniles. Values of species evenness (J)were relatively high, indices of specialization were low, andindices of niche breadth were intermediate for both ageclasses. This further supports the idea that California sealions consume a variety of prey, but relatively few speciescompose the majority of their diet during a given time pe-riod. Additional information is needed about their prey se-lectivity or preference.
A variety of elements could affect the abundance andavailability of prey species, including temporal (e.g., sea-sonal, annual) and spatial (e.g., diel–vertical migrations,schooling behavior) factors (Antonelis et al. 1984; Lowry etal. 1991). Prey distribution and size affects dietary composi-tion of consumers that differ in size (Ashmole 1968). Juve-
Table 4. Percent frequency of occurrence (%FO) and mean rank of prey taxa retrieved from fecal samples collected from adult femaleCalifornia sea lions (Zalophus californianus) at San Miguel Island, California, during 2002 through 2006 (N = 296).
Prey 2002 2003 2004 2005 2006 Total Mean rankSardinops sagax 33.0 61.2 80.0 65.3 55.0 54.7 1.8Engraulis mordax 9.6 53.1 48.6 69.4 35.0 40.2 3.4Loligo opalescens (cephalopod) 43.6 33.7 17.1 8.2 45.0 31.4 3.4Merluccius productus 37.2 11.2 34.3 8.2 80.0 26.4 3.4Sebastes spp. 13.8 20.4 2.9 8.2 10.0 13.5 6.4Trachurus symmetricus 0.0 28.6 0.0 0.0 5.0 9.8 12.8Octopus rubescens (cephalopod) 28.7 1.0 0.0 0.0 0.0 9.5 11.8Cololabis saira 12.8 13.3 2.9 0.0 0.0 8.8 9.0Symbolophorus californiensis 1.1 4.1 11.4 2.0 15.0 4.4 9.2Gonatus spp. (cephalopod) 4.3 2.0 2.9 0.0 5.0 2.7 10.2Ommasteuthid spp. 1.1 2.0 2.9 0.0 0.0 1.4 12.0Tarletonbeania crenularis 1.1 1.0 5.7 0.0 0.0 1.4 12.8Scomber japonicus 0.0 1.0 0.0 0.0 15.0 1.4 14.6Citharichthys sordidus 1.1 2.0 0.0 0.0 0.0 1.0 13.2Chilara taylori 2.1 1.0 0.0 0.0 0.0 1.0 13.4Gonatopsis spp. (cephalopod) 2.1 0.0 2.9 0.0 0.0 1.0 14.4Onychoteuthis borealijaponicus (cephalopod) 1.1 0.0 2.9 0.0 5.0 1.0 14.4Cymatogaster aggregata 0.0 2.0 0.0 0.0 0.0 0.7 15.2Abraliopsis felis (cephalopod) 2.1 0.0 0.0 0.0 0.0 0.7 15.6Leuroglossus stilbius 2.1 0.0 0.0 0.0 0.0 0.7 15.6Clupea pallasi 0.0 1.0 0.0 0.0 0.0 0.3 16.2Genyonemus lineatus 0.0 1.0 0.0 0.0 0.0 0.3 16.2Hexagrammids 0.0 1.0 0.0 0.0 0.0 0.3 16.2Myctophids 0.0 1.0 0.0 0.0 0.0 0.3 16.2Pleuronectids 0.0 1.0 0.0 0.0 0.0 0.3 16.2Squalus acanthias 0.0 1.0 0.0 0.0 0.0 0.3 16.2Stenobrachius leucopsarus 0.0 1.0 0.0 0.0 0.0 0.3 16.2Histioteuthis hoylei 1.1 0.0 0.0 0.0 0.0 0.3 16.4Lyopsetta exilis 1.1 0.0 0.0 0.0 0.0 0.3 16.4Oxylebius pictus 1.1 0.0 0.0 0.0 0.0 0.3 16.4Porichthys notatus 1.1 0.0 0.0 0.0 0.0 0.3 16.4Seriphus politus 1.1 0.0 0.0 0.0 0.0 0.3 16.4Serranids 0.0 0.0 0.0 0.0 5.0 0.3 17.6
Number of samples 94 98 35 49 20 296 .
Note: Prey taxa not indicated as being a cephalopod are fishes.
116 Can. J. Zool. Vol. 89, 2011
Published by NRC Research Press

nile sea lions fed on at least 15 different prey taxa, but adultfemales ate more than twice this number. Additionally,mean species richness (S) of adult females was twice that oftheir younger counterparts. Although adult females are cen-tral place foragers when providing nutrition for their de-pendent pups, they may be adept at capturing andconsuming a greater array of food items in a greater varietyof habitats compared with less experienced and more phys-iologically constrained juveniles. Additionally, because lac-tating females are nonmigratory and limited in the time(thus distance) that they can be away from the rookery,they may be more susceptible to the seasonal, annual, andmultiannual fluctuations in the productivity of the systemcompared with individuals that are not obligated to returnto the rookery (e.g., juveniles). Therefore, their foraging be-haviors may be highly variable as they try to acquire energystores for lactation, self-maintenance, and to sustain a preg-nancy. Page et al. (2005) noted that according to centralplace foraging models, a lactating female might maximizeher fitness by increasing milk delivery rates to her depend-ent offspring rather than foraging in the most productivehabitats. Once weaned, juvenile sea lions are not obligatedto return to the rookery until they are sexually mature. Theyonly need to acquire energy for self-maintenance andgrowth. Although they are required to alter their behaviorsin response to prey movements, they can afford to be moreselective in prey choice or follow migrating prey for greaterdistances. However, because of their high energetic require-ments for growth, they may need to exploit several preyitems, but their selection may be limited because of theirunderdeveloped foraging abilities.
Despite adult females having a more diverse and species-rich diet compared with juveniles, PSI and M indices indi-cated that their diets were generally similar. This may be at-tributed to the fact that the prey which they had in commonwere dominant in their diet. In addition to several prey spe-cies, sizes of prey consumed by these groups of sea lionswere similar. The range in mean length estimates of fre-
quently occurring prey (4–33 cm) was not indicative of agreat diversity in prey size. Antonelis et al. (1984) noted asimilar finding and stated that this may reflect a prey sizepreference by sea lions feeding in waters off San Miguel Is-land. Rockfish, Pacific sardine, East Pacific red octopus, andPacific hake attain larger sizes as adults (Eschmeyer et al.1983; Wood 2009), therefore sea lions were feeding on ju-venile individuals of these prey species. Length estimates ofmarket squid and northern anchovy were within the sizerange of juveniles and adults (Eschmeyer et al. 1983; Wood2009). There were significant differences only in the sizes ofrockfish and Pacific hake consumed by both age classes. Be-cause it is unlikely that different-aged sea lions are selectinga prey of a particular size in the midst of various sizes, itcan be assumed that they are pursuing and capturing prey atdifferent locations. The five dominant prey for both juve-niles and adults throughout the study period (i.e., northernanchovy, Pacific sardine, Pacific hake, rockfish, and marketsquid) form large, dense schools, and are epi- or meso-pelagic. Juvenile sea lions likely have attained the physio-logical capabilities to exploit these prey types in shallowhabitats similar to adult females.
Results from fecal analysis indicated that there was anoverlap in the type and size of prey consumed by sea lionsof both age classes, but adult females exploited more resour-ces. Interpretations were confounded because of the tempo-ral scale that scats represent. Several studies have indicatedthat most prey remains pass through the alimentary tract ofCalifornia sea lions within 48 h (Orr and Harvey 2001;Sweeney 2008). Therefore, scats primarily represent what
Fig. 2. Frequency of number of prey taxa per fecal samples col-lected from juvenile (JUV) and adult female (ADF) California sealions (Zalophus californianus) at San Miguel Island, California,during 2002 through 2006. Juveniles were all immature animalsthat were not pups (1–3 years old).
Fig. 3. Mean total variation of prey array indices calculated fromscat and enema samples from juvenile (n = 178) and adult female(n = 296) California sea lions (Zalophus californianus) at San Mi-guel Island, California, during 2002 through 2006. Juveniles were1–3 years old. Error bars indicate SD. Indices include species rich-ness (S), Simpson’s diversity index (D), Levin’s measure of nichebreadth (B), Shannon–Wiener diversity index (H’), prey evenness(J), and specialization (R).
Orr et al. 117
Published by NRC Research Press
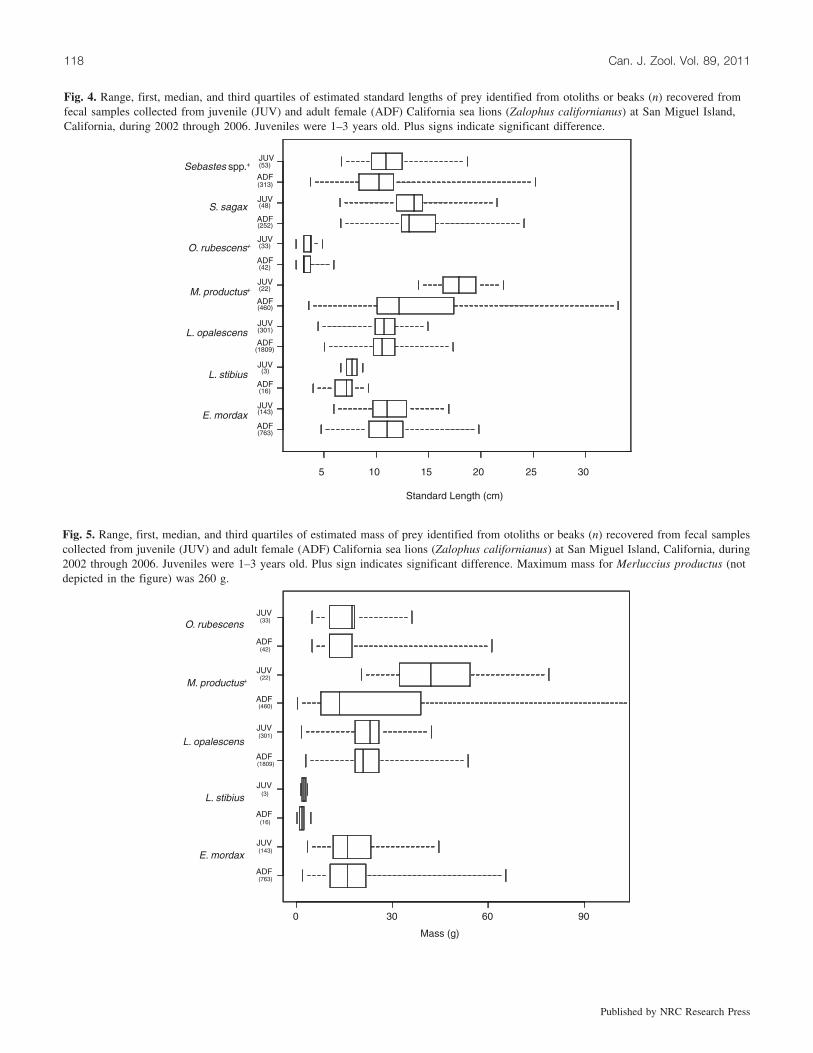
Fig. 4. Range, first, median, and third quartiles of estimated standard lengths of prey identified from otoliths or beaks (n) recovered fromfecal samples collected from juvenile (JUV) and adult female (ADF) California sea lions (Zalophus californianus) at San Miguel Island,California, during 2002 through 2006. Juveniles were 1–3 years old. Plus signs indicate significant difference.
Fig. 5. Range, first, median, and third quartiles of estimated mass of prey identified from otoliths or beaks (n) recovered from fecal samplescollected from juvenile (JUV) and adult female (ADF) California sea lions (Zalophus californianus) at San Miguel Island, California, during2002 through 2006. Juveniles were 1–3 years old. Plus sign indicates significant difference. Maximum mass for Merluccius productus (notdepicted in the figure) was 260 g.
118 Can. J. Zool. Vol. 89, 2011
Published by NRC Research Press

was consumed during the most recent foraging trip or preyconsumed near the island. This may explain the similarityin diet of individuals within these age classes.
Stable isotope analysisSimilar to fecal analysis, interpretations of stable isotope
analysis were complex. To reconstruct consumers’ diets us-ing the isotopic composition of their tissues, prey of interestmust be isotopically distinct (Gannes et al. 1998). Using fe-cal analysis, it was determined that California sea lions con-sumed several prey taxa. Isotopic models have beendeveloped to calculate the relative contribution of particularfood items to a predator’s diet, even when the number ofprey sources is large (e.g., IsoSource (Phillips and Gregg2003); SOURCE and STEP (Lubetkin and Simenstad 2004);MixSIR (Semmens and Moore 2009)), as was the case inthis study. However, sources should be accounted for whenusing these models. There was a lack of isotopic informationfor many of the prey consumed by sea lions during thisstudy and it was beyond the scope of this study to collectsuch data, therefore we were unable to quantify the diet ofsea lions using stable isotope analysis. However, other use-ful dietary data were ascertained, including more detailed in-formation on different-aged ‘‘juveniles’’.
Stable isotope ratios assessed from consumer tissues withhigh turnover rates (e.g., blood plasma) reflect recent dietaryinputs. Isotopic incorporation rates of mammals primarilyhave been determined from small species, and these rates in-crease with body mass and growth rate of the individual
(e.g., MacAvoy et al. 2005; Martınez del Rio et al. 2009).Based on studies of other large carnivores, plasma reflectedthe assimilated diet of sea lions on the order of weeks to acouple of months (Hilderbrand et al. 1996; Kurle 2002;Zhao et al. 2004). Foraging behaviors during the relativelyshort temporal scale that plasma isotopic data reflect andthe diet discerned from scats were in general agreement.Yearlings, 2- to 3-year-old juveniles, and adult females hadsimilar plasma d15N values, indicating that they were feed-ing at approximately the same trophic level. Individualswithin these age classes also had similar plasma d13C values,indicating that they were feeding in similar areas or that thespatial distance between foraging areas was not far enoughapart to result in significantly different d13C values amongage classes. Up to four other pinniped species, includingnorthern fur seals (Callorhinus ursinus (L., 1758)), Pacificharbor seals (Phoca vitulina L., 1758), northern elephantseals (Mirounga angustirostris (Gill, 1866)), and Guadalupefur seals (Arctocephalus townsendi Merriam, 1897), inhabitor feed near San Miguel Island. Perhaps interspecific com-petition affects the level of intraspecific variation of diet, re-sulting in similar foraging by conspecifics.
Metabolically inert tissues (e.g., fur) record diet assimi-lated during the period of tissue formation (i.e., up to a yearfor sea lions, which molt annually). Unlike plasma, dietaryinformation obtained from fur isotopic data indicated signif-icant differences in foraging behaviors among age classes.Yearlings were enriched in d15N compared with older juve-niles and adult females. This enrichment, indicating thatyearlings were feeding at a higher trophic level, may reflectthat some of these individuals were still suckling during theperiod of tissue formation. The enriched d15N values may bedue to suckling individuals consuming milk, which is de-rived from remobilized body tissues of lactating females;suckling offspring are essentially consuming their mother’stissues during lactation (Hobson and Sease 1998; Newsomeet al. 2006; Newsome et al. 2009). These individuals mayhave been supplementing their diet acquired at sea withmilk from their mothers. A prolonged lactation period hasbeen observed in other otariids, including Galapagos sealions (Zalophus wollebaeki Sivertsen, 1953), Steller sea lions(Eumetopias jubatus (Schreber, 1776)), Australian sea lions(Neophoca cinerea (Peron, 1816)), Galapagos fur seals (Arc-tocephalus galapagoensis Heller, 1904), and South Ameri-can fur seals (Arctocephalus australis (Zimmermann, 1783))(Boness and Bowen 1996; Schulz and Bowen 2004).
The lower mean fur d13C values of yearlings comparedwith older juveniles and adult females also might have beena reflection of a mixed diet of milk and solid food (e.g., fishand cephalopods). If some yearlings were suckling, thentheir lower d13C values were likely a result of the high lipidcontent in milk because lipids are 13C depleted comparedwith protein (Polischuk et al. 2001; Kurle 2002; Newsomeet al. 2006). The fur d13C values of 2- to 3-year-old juve-niles indicated that young, nonmigrating males and nullipar-ous females were completely weaned and fed in similarforaging habitats as adult females.
The results from stable isotope analysis indicated thatthere were differences in the foraging behaviors of ‘‘juve-niles’’, reflecting their continual development and transitionfrom relying on their mothers for sustenance to foraging in
Fig. 6. The relationship between stable carbon (d13C) and stable ni-trogen (d15N) isotope ratios of plasma and fur collected from Cali-fornia sea lions (Zalophus californianus) of various age classes(Yrl, yearlings; Juv, juvenlies; ADF, adult females) at San MiguelIsland, California, during 2005 through 2006. Ages of individualswere known because they were marked as pups. Yearlings were1 year old, whereas juveniles were 2–3 years old. Error bars indi-cate SE.
Orr et al. 119
Published by NRC Research Press

the marine environment. The similarities in isotopic valuesof multiple tissues of older juvenile and adult female sealions suggest that these animals were exploiting similar preyin similar areas. Adult females consumed twice the numberof prey taxa as younger conspecifics; differences in develop-ment, energy requirements, or preferences are plausible ex-planations for this discrepancy and warrant furtherinvestigation.
In conclusion, data presented in this study provide themost comprehensive and recent information available on thediet of juvenile California sea lions. Dietary information forjuvenile sea lions is needed to better our understanding ofthe foraging ecology of this species, which has several man-agement implications. There has been a greater focus on anecosystem-based approach to fisheries management (Co-chrane et al. 2004; Scandol et al. 2005; Field and Francis2006). A vital constituent of this approach is informationabout both temporal and spatial prey consumption by marineapex predators (Furness 2002; Reid et al. 2004), includingmembers of all age classes not just adults. For future stud-ies, it would be beneficial to collect ancillary informationfor fecal samples (as can be ascertained using enemas) sothat information collected from these samples and other diet-ary metrics can be used simultaneously to describe the dietof an individual. Additionally, baseline isotopic patterns ofthe environment, as well as isotopic data of prey, are neededso that stable isotope analysis can be used more effectivelyin discerning the foraging ecology of California sea lions orother marine mammals.
AcknowledgementsGratitude is extended to S. Melin, A. Gemmer-Pecharich,
J. Scordino, H. Ziel, R. Jenkinson, G. Orr, T. Goldstein, F.Gulland, J. Jenniges, M. Tennis, E. Hamblen, and C. Kuhnwho helped collect scat samples, obtain enemas, and (or)procure tissue samples for stable isotope analyses. Specialthanks go to E. Siek and W. Walker for their help in identi-fying prey remains. W. Walker also provided data for re-gression equations for several prey taxa for this study.Appreciation is extended to the Channel Islands NationalPark Service and Channel Islands Aviation for logisticalsupport. Special thanks go to I. Williams (Channel IslandNational Park Service) for his logistical and field support.This manuscript was improved by helpful comments fromB. Fadely and M. Gosho, as well as from two anonymousreviewers. This study was conducted in accordance with Na-tional Marine Fisheries Service Permit #782-1812-00.
ReferencesAntonelis, G.A., and Fiscus, H.C. 1980. The pinnipeds of the Cali-
fornia current. Calif. Coop. Oceanic Fish. Invest. Rep. 21: 68–78.
Antonelis, G.A., Fiscus, C.H., and DeLong, R.L. 1984. Spring andsummer prey of California sea lions, Zalophus californianus, atSan Miguel Island, California, 1978–79. Fish. Bull. (Wash.,D.C.), 82: 67–76.
Arim, M., and Naya, D.E. 2003. Pinniped diets inferred from scats:analysis of biases in prey occurrence. Can. J. Zool. 81(1): 67–73. doi:10.1139/z02-221.
Ashmole, N.P. 1968. Body size, prey size and ecological segrega-
tion in 5 sympatric tropical terns (Aves: Laridae). Syst. Zool.17(3): 292–304. doi:10.2307/2412008.
Aurioles, D. 1988. Behavioral ecology of California sea lions in theGulf of California. Ph.D. thesis, The University of California atSanta Cruz, Santa Cruz.
Aurioles, D., and Trillmich, F. 2008. Zalophus californianus. InIUCN Red List of Threatened Species. Version 2010.3. Avail-able from http://www.iucnredlist.org [accessed on 14 September2010].
Aurioles, D., and Zavala, A. 1994. Ecological factors that deter-mine distribution and abundance of the California sea lion Zalo-phus californianus in the Gulf of California. Cienc. Mar. 20:535–553.
Bailey, K.M., and Ainley, D.G. 1982. The dynamics of Californiasea lion predation on Pacific whiting. Fish. Res. (Amst.), 1:163–176.
Best, E.A., and Oliphant, M.S. 1965. Evaluation of the fish re-sources of the Pt. Arguello area. Marine resources of Pt. Ar-guello area. Part II. Bureau of Commercial Fisheries Contract14-17-001-995, part of agreement AT(49-7)-2428 for the Divi-sion of Biology and Medicine, U.S. Atomic Energy Commis-sion, Washington, D.C.
Boness, D.J., and Bowen, W.D. 1996. The evolution of maternalcare in pinnipeds. Bioscience, 46(9): 645–654. doi:10.2307/1312894.
Browne, P., Laake, J.L., and DeLong, R.L. 2002. Improving pin-niped diet analyses through identification of multiple skeletalstructures in fecal samples. Fish. Bull. (Wash., D.C.), 100: 423–433.
Burns, J.M. 1999. The development of diving behavior in juvenileWeddell seals: pushing physiological limits in order to survive.Can. J. Zool. 77(5): 737–747. doi:10.1139/cjz-77-5-737.
Burton, R.K., and Koch, P.L. 1999. Isotopic tracking of foragingand long-distance migration in northeastern Pacific pinnipeds.Oecologia (Berl.), 119(4): 578–585. doi:10.1007/s004420050822.
Caretta, J.V., K.A. Forney, M.M. Muto, J. Barlow, J. Baker, B.Hanson, and M.S. Lowry. 2005. U.S. Pacific marine mammalstock assessments: 2004. NOAA Tech. Mem. NMFS No. 375.
Cherel, Y., and Hobson, K. 2007. Geographical variation in carbonstable isotope signatures of marine predators: a tool to investi-gate their foraging areas in the Southern Ocean. Mar. Ecol.Prog. Ser. 329: 281–287. doi:10.3354/meps329281.
Clarke, M.R. (Editor). 1986. A handbook for the identification ofcephalopod beaks. Clarendon Press, Oxford.
Cochrane, K.L., Augustyn, C.J., Cockcroft, A.C., David, J.H.M., Grif-fiths, M.H., Groeneveld, J.C., Lipinski, M.R., Smale, M.J., Smith,C.D., and Tarr, R.J.Q. 2004. An ecosystem approach to fisheries inthe southern Benguela context. Afr. J. Mar. Sci. 26: 9–35.
Costa, D.P. 1991. Reproductive and foraging energetic of pinni-peds: implications for life history patterns. In Behavior of pinni-peds. Edited by D. Renouf. Chapman and Hall, London.pp. 300–344.
Cottrell, P.E., Miller, E.H., and Trites, A.W. 1996. Assessing theuse of hard parts in faeces to identify harbour seal prey: resultsof captive-feeding trials. Can. J. Zool. 74(5): 875–880. doi:10.1139/z96-101.
Dalerum, F., and Angerbjorn, A. 2005. Resolving temporal varia-tion in vertebrate diets using naturally occurring stable isotopes.Oecologia (Berl.), 144(4): 647–658. doi:10.1007/s00442-005-0118-0.
Dellinger, T., and Trillmich, F. 1988. Estimating diet compositionfrom scat analysis in otariid seals (Otariidae): is it reliable?Can. J. Zool. 66(8): 1865–1870. doi:10.1139/z88-269.
DeLong, R.L., Antonelis, G.A., Oliver, C.W., Stewart, B.S., Lowry,
120 Can. J. Zool. Vol. 89, 2011
Published by NRC Research Press

M.C., and Yochem, P.K. 1991. Effects of the 1982–83 El Ninoon several population parameters and diet of California sea lionson the California Channel Islands. In Pinnipeds and El Nino: re-sponses to environmental stress. Edited by F. Trillmich and K.A.Ono. Springer-Verlag, New York. pp. 156–165.
DeNiro, M.J., and Epstein, S. 1978. Influence of diet on the distri-bution of carbon isotopes in animals. Geochim. Cosmochim.Acta, 42(5): 495–506. doi:10.1016/0016-7037(78)90199-0.
Dunstone, N., and O’Connor, R. 1979. Optimal foraging in an am-phibious mammal. I. The aqualung effect. Anim. Behav. 27:1182–1194. doi:10.1016/0003-3472(79)90065-4.
Eschmeyer, W.N., Herald, E.S., and Hammann, H. 1983. A fieldguide to Pacific coast fishes of North America from the Gulf ofAlaska to Baja California. Houghton Mifflin Company, Boston.
Ferry, L.A., and Cailliet, G.M. 1996. Sample size and data analy-sis: are we characterizing and comparing diet properly? In Feed-ing Ecology and Nutrition in Fish: Proceedings of theSymposium on the Feeding Ecology and Nutrition in Fish, SanFrancisco, Calif., 14–18 July 1996. Edited by D. MacKinlayand K. Shearer. International Congress on the Biology of Fishes,American Fisheries Society, Bethesda, Md. pp. 71–80.
Ferry, L.A., Clark, S.L., and Cailliet, G.M. 1997. Food habits ofspotted sand bass (Paralabrax maculatofasciatus, Serranidae)from Bahia De Los Angeles, Baja California. Bull. South. Calif.Acad. Sci. 96(1): 1–21.
Field, J.C., and Francis, R.C. 2006. Considering ecosystem-basedfisheries management in the California current. Mar. Policy,30(5): 552–569. doi:10.1016/j.marpol.2005.07.004.
France, R.L. 1995. Carbon-13 enrichment in benthic compared toplanktonic algae: foodweb implications. Mar. Ecol. Prog. Ser.124: 307–312. doi:10.3354/meps124307.
Fry, B., and Sherr, E.B. 1984. d13C measurements as indicators ofcarbon flow in marine and freshwater ecosystems. Contrib. Mar.Sci. 27: 13–47.
Furness, R.W. 2002. Management implications of interactions be-tween fisheries and sandeel-dependent seabirds and seals in theNorth Sea. ICES J. Mar. Sci. 59(2): 261–269. doi:10.1006/jmsc.2001.1155.
Gannes, L.Z., Martınez del Rio, C., and Koch, P. 1998. Naturalabundance variations in stable isotopes and their potential usesin animal physiological ecology. Comp. Biochem. Physiol. PartA Mol. Integr. Physiol. 119(3): 725–737. doi:10.1016/S1095-6433(98)01016-2.
Garcıa-Rodrıguez, F.J., and Aurioles-Gamboa, D. 2004. Spatial andtemporal variation in the diet of the California sea lion (Zalo-phus californianus) in the Gulf of California, Mexico. Fish.Bull. (Wash., D.C.), 102: 47–62.
Hammill, M.O., Lesage, V., and Carter, P. 2005. What do harpseals eat? Comparing diet composition from different compart-ments of the digestive tract with diets estimated from stable-isotope ratios. Can. J. Zool. 83(10): 1365–1372. doi:10.1139/z05-123.
Harvey, J.T. 1989. Assessment of errors associated with harbor seal(Phoca vitulina) faecal sampling. J. Zool. (Lond.), 219(1): 101–111. doi:10.1111/j.1469-7998.1989.tb02569.x.
Harvey, J.T., Loughlin, T.R., Perez, M.A., and Oxman, D.S. 2000.Relationship between fish size and otoliths length for 63 speciesof fishes from the eastern North Pacific Ocean. NOAA Tech.Rep. NMFS 150.
Hilderbrand, G.V., Farley, S.D., Robbins, C.T., Hanley, T.A., Titus,K., and Servheen, C. 1996. Use of stable isotopes to determinediets of living and extinct bears. Can. J. Zool. 74(11): 2080–2088. doi:10.1139/z96-236.
Hobson, K.A., and Sease, J.L. 1998. Stable isotope analyses of
tooth annuli reveal temporal dietary records: an example usingSteller sea lions. Mar. Mamm. Sci. 14(1): 116–129. doi:10.1111/j.1748-7692.1998.tb00694.x.
Hobson, K.A., and Welch, H.E. 1992. Determination of trophic re-lationships within a high Arctic marine food web using d13C andd15N analysis. Mar. Ecol. Prog. Ser. 84: 9–18. doi:10.3354/meps084009.
Horning, M., and Trillmich, F. 1997. Development of hemoglobin,hematocrit, and erthyrocyte values in Galapagos fur seals. Mar.Mamm. Sci. 13(1): 100–113. doi:10.1111/j.1748-7692.1997.tb00614.x.
Jobling, M., and Breiby, A. 1986. The use and abuse of fish oto-liths in studies of feeding habits of marine piscivores. Sarsia,71: 265–274.
Kleiber, M. 1975. The fire of life. Robert Krieger, New York.Kooyman, G.L. 1989. Diverse divers: physiology and behavior.
Springer-Verlag, New York.Krebs, C.J. 1999. Ecological methodology. 2nd ed. Addison-
Welsey Educational Publishers, Inc., Menlo Park, Calif.Kurle, C.M. 2002. Stable-isotope ratios of blood components from
captive northern fur seals (Callorhinus ursinus) and their diet:applications for studying the foraging ecology of wild otariids.Can. J. Zool. 80(5): 902–909. doi:10.1139/z02-069.
Kurle, C.M., and Worthy, G.A.J. 2002. Stable nitrogen and carbonisotope ratios in multiple tissues of the northern fur seal Callorhi-nus ursinus: implications for dietary and migratory reconstructions.Mar. Ecol. Prog. Ser. 236: 289–300. doi:10.3354/meps236289.
Laake, J.L., Browne, P., DeLong, R.L., and Huber, H.R. 2002. Pin-niped diet composition: a comparison of estimation models.Fish. Bull. (Wash., D.C.), 100: 434–447.
Lowry, M.S., Stewart, B.S., Heath, C.B., Yochem, P.K., and Fran-cis, J.M. 1991. Seasonal and annual variability in the diet of Ca-lifornia sea lions Zalophus californianus at San Nicolas Island,California, 1981–86. Fish. Bull. (Wash., D.C.), 89: 331–336.
Lubetkin, S.C., and Simenstad, C.A. 2004. Multi-source mixingmodels to quantify food web sources and pathways. J. Appl.Ecol. 41(5): 996–1008. doi:10.1111/j.0021-8901.2004.00957.x.
MacAvoy, S.E., Macko, S.A., and Arneson, L.S. 2005. Growth ver-sus metabolic tissue replacement in mouse tissues determined bystable carbon and nitrogen isotope analysis. Can. J. Zool. 83(5):631–641. doi:10.1139/z05-038.
Martınez del Rio, C., Wolf, N., Carleton, S.A., and Gannes, L.Z.2009. Isotopic ecology ten years after a call for more laboratoryexperiments. Biol. Rev. Camb. Philos. Soc. 84(1): 91–111.doi:10.1111/j.1469-185X.2008.00064.x. PMID:19046398.
Melin, S.R. 2002. The foraging ecology and reproduction of theCalifornia sea lion (Zalophus californianus californianus). Ph.D.thesis, University of Minnesota, Minneapolis.
Melin, S.R., DeLong, R.L., Thomason, J.R., and VanBlaricom,G.R. 2000. Attendance patterns of California sea lion (Zalophuscalifornianus) females and pups during the non-breeding seasonat San Miguel Island. Mar. Mamm. Sci. 16(1): 169–185. doi:10.1111/j.1748-7692.2000.tb00911.x.
Minagawa, M., and Wada, E. 1984. Stepwise enrichment of 15Nalong food chains: further evidence and the relation betweend15N and animal age. Geochim. Cosmochim. Acta, 48(5): 1135–1140. doi:10.1016/0016-7037(84)90204-7.
Murie, D.J., and Lavigne, D.M. 1985. A technique for the recoveryof otoliths from stomach contents of piscivorous pinnipeds. J.Wildl. Manage. 49(4): 910–912. doi:10.2307/3801368.
Newsome, S.D., Koch, P.L., Etnier, M.A., and Aurioles-Gamboa,D. 2006. Using carbon and nitrogen isotope values to investigatematernal strategies in northeast Pacific otariids. Mar. Mamm.Sci. 22(3): 556–572. doi:10.1111/j.1748-7692.2006.00043.x.
Orr et al. 121
Published by NRC Research Press
Newsome, S.D., Etnier, M.A., Monson, D.H., and Fogel, M.L.2009. Retrospective characterization of ontogenetic shifts inkiller whale diets via d13C and d15N analysis of teeth. Mar.Ecol. Prog. Ser. 374: 229–242. doi:10.3354/meps07747.
Newsome, S.D., Clementz, M.T., and Koch, P.L. 2010. Usingstable isotope biogeochemistry to study marine mammal ecol-ogy. Mar. Mamm. Sci. 26: 509–572.
Orr, A.J., and Harvey, J.T. 2001. Quantifying errors associated withusing fecal samples to determine the diet of the California sealion (Zalophus californianus). Can. J. Zool. 79(6): 1080–1087.doi:10.1139/cjz-79-6-1080.
Orr, A.J., Laake, J.L., Dhruv, M.I., Banks, A.S., DeLong, R.L., andHuber, H.R. 2003. Comparison of processing pinniped scat sam-ples using a washing machine and nested sieves. Wildl. Soc.Bull. 31: 253–257.
Owens, N.J.P. 1987. Natural variations in 15N in the marine envir-onment. Adv. Mar. Biol. 24: 389–451. doi:10.1016/S0065-2881(08)60077-2.
Page, B., McKenzie, J., and Goldsworthy, S.D. 2005. Dietary re-source partitioning among sympatric New Zealand and Austra-lian fur seals. Mar. Ecol. Prog. Ser. 293: 283–302. doi:10.3354/meps293283.
Phillips, D.L., and Gregg, J.W. 2003. Source partitioning usingstable isotopes: coping with too many sources. Oecologia(Berl.), 136(2): 261–269. doi:10.1007/s00442-003-1218-3.
Pierce, G.J., and Boyle, P.R. 1991. Review of methods for diet ana-lysis in piscivorous marine mammals. Oceanogr. Mar. Biol.Annu. Rev. 29: 409–486.
Polischuk, S.C., Hobson, K.A., and Ramsay, M.A. 2001. Use ofstable-carbon and -nitrogen isotopes to assess weaning and fast-ing in female polar bears and their cubs. Can. J. Zool. 79(3):499–511. doi:10.1139/cjz-79-3-499.
Pyke, G.H., Pulliam, H.R., and Charnov, E.L. 1977. Optimal fora-ging: a selective review of theory and tests. Q. Rev. Biol. 52(2):137–154. doi:10.1086/409852.
Rau, G.H., Sweeney, R.E., and Kaplan, I.R. 1982. Plankton 13C:12Cratio changes with latitude: differences between northern andsouthern oceans. Deep-Sea Res. 29(8): 1035–1039. doi:10.1016/0198-0149(82)90026-7.
Reid, K., Sims, M., White, R.W., and Gillon, K.W. 2004. Spatialdistribution of predator/prey interactions in the Scotia Sea: im-plications for measuring predator/fisheries overlap. Deep SeaRes. Part II Top. Stud. Oceanogr. 51: 1383–1396. doi:10.1016/j.dsr2.2004.06.007.
Roffe, T.J., and Mate, B.R. 1984. Abundance and feeding habits ofpinnipeds in the Rogue River, Oregon. J. Wildl. Manage. 48(4):1262–1274. doi:10.2307/3801787.
Scandol, J.P., Holloway, M.G., Gibbs, P.J., and Astles, K.L. 2005.Ecosystem-based fisheries management: an Australian perspec-tive. Aquat. Living Resour. 18(3): 261–273. doi:10.1051/alr:2005031.
Schmidt-Nielsen, K. 1984. Scaling: why is body size so important?Cambridge University Press, Cambridge.
Schoener, T.W. 1971. Theory of feeding strategies. Annu. Rev.Ecol. Syst. 2(1): 369–404. doi:10.1146/annurev.es.02.110171.002101.
Schulz, T.M., and Bowen, W.D. 2004. Pinniped lactation strategies:evaluation of data on maternal and offspring life history traits.Mar. Mamm. Sci. 20(1): 86–114. doi:10.1111/j.1748-7692.2004.tb01142.x.
Semmens, B.X., and Moore, J.W. 2009. MixSIR: a Bayesian stableisotope mixing model. Available from http://www.ecologybox.org [assessed 5 March 2010].
Staniland, I.J., Taylor, R.I., and Boyd, I.L. 2003. An enema methodfor obtaining fecal material from known individual seals onland. Mar. Mamm. Sci. 19(2): 363–370. doi:10.1111/j.1748-7692.2003.tb01114.x.
Sweeney, J.M. 2008. Variables affecting hard part recovery fromscats and spew of California sea lions (Zalophus californianus).M.Sc. thesis, California State University, San Francisco.
Thorson, P.H., and Le Boeuf, B.J. 1994. Developmental aspects ofdiving in northern elephant seal pups. In Elephant seals: popula-tion ecology, behavior, and physiology. Edited by B.J. Le Boeufand R.M. Laws. University of California Press, Berkeley.pp. 271–289
Wada, E., Mizutani, H., and Minagawa, M. 1991. The use of stableisotopes for food web analysis. Crit. Rev. Food Sci. Nutr. 30(4):361–371. doi:10.1080/10408399109527547. PMID:1910519.
Walker, W.A. 1996. Summer feeding habits of Dall’s porpoise,Phocoenoides dalli, in the southern Sea of Okhotsk. Mar.Mamm. Sci. 12(2): 167–181. doi:10.1111/j.1748-7692.1996.tb00569.x.
Wolff, G.A. 1982. A beak key for eight eastern tropical Pacific ce-phalopod species with relationships between beak dimensionsand size. Fish. Bull. (Wash., D.C.), 80: 357–370.
Wolff, G.A. 1984. Identification and estimation of size from thebeaks of 18 species of cephalopods from the Pacific Ocean.NOAA Tech. Rep. NMFS 17.
Wood, J.B. 2009. The cephalopod page. Available from http://thecephalopodpage.org/ [accessed 14 June 2009].
Zhao, L., Castellini, M.A., Mau, T.L., and Trumble, S.J. 2004.Trophic interactions of Antarctic seals as determined by stableisotope signatures. Polar Biol. 27(6): 368–373. doi:10.1007/s00300-004-0598-0.
122 Can. J. Zool. Vol. 89, 2011
Published by NRC Research Press