![Stefano Medas, Due relitti con carichi lapidei rinvenuti al Bacàn (Bocca di porto di Lido, Laguna di Venezia) [Two shipwrecks with a stone slabs freight from Lido inlet, Venice lagoon]_2012](https://static.fdokumen.com/doc/165x107/633282958d2c463a5800e861/stefano-medas-due-relitti-con-carichi-lapidei-rinvenuti-al-bacan-bocca-di-porto.jpg)
Spatial variability of epifaunal communities from artificial habitat: Shipwrecks in the Southern...
18
Spatial variability of epifaunal communities from artificial habitat: Shipwrecks in the Southern Bight of the North Sea Vincent Zintzen a,b, * , Alain Norro c , Claude Massin a , Je ´ro ˆme Mallefet b a Royal Belgian Institute of Natural Sciences, Rue Vautier 29, B-1000 Brussels, Belgium b University of Louvain, Biology Laboratory, Kellner Building, place Croix du Sud 3, B-1348 Louvain-la-Neuve, Belgium c Royal Belgian Institute of Natural Sciences, Management Unit of the North Sea Mathematical Models, 100 Gulledelle, 1200 Brussels, Belgium Received 23 April 2007; accepted 11 July 2007 Available online 4 September 2007 Abstract We investigated the cover, community structure and abiotic environment of nine shipwrecks lying at increasing distance from the Belgian coast. Results indicated that all shipwrecks were strongly dominated by cnidarians in terms of biomass and by amphipods in terms of abun- dances. Based on their epifaunal composition, three groups of shipwrecks could be determined. Metridium senile dominated a species poor com- munity of the coastal sites. On the same sites, a Tubularia larynx community with a more species-rich assemblage was also developing. The T. larynx community had a lower biomass value (102 g AFDW m 2 ) and significantly lower species richness compared to the other sites. The coastal sites were characterized by periodic salinity decreases, large seasonal temperature fluctuation, high total suspended matter load and reduced current velocity. Channel water masses influence the offshore sites causing a more stable temperature and salinity environment, less turbid waters and high current speed. Tubularia indivisa dominated this community, with an average biomass of 229 g AFDW m 2 . Inter- mediate sites were also dominated by T. indivisa , but a higher biomass (424 g AFDW m 2 ) was observed. They showed intermediate results for the abiotic parameters and fast current velocities. Hypotheses for the observed variation in community structures are discussed in the light of the abiotic characterization of the shipwrecks. Ó 2007 Elsevier Ltd. All rights reserved. Keywords: artificial substrata; epizoites; population density; biomass; Tubularia; Metridium senile; North Sea 1. Introduction Artificial hard substrata have increasingly occurred at sea since man started using the sea and its resources (Connell and Glasby, 1999). Certainly, the most profound and visible effect of this action are coastal constructions that dramatically changed the nature and extent of hard substrata both in shallow-water and intertidal areas (Glasby and Connell, 1999; Bacchiocchi and Airoldi, 2003). At sea, a large number of arti- ficial reefs have been created for several purposes like fishery enhancement, coastal protection, recreational activities (mostly diving and fishing), and also scientific research. Other man made marine structures like offshore platforms were originally not in- tended as artificial reefs, but they are increasingly seen as a tool for fishery improvement or protection (Scarborough Bull and Kendall, 1994; Relini et al., 1998; Stanley and Wilson, 2000; Fabi et al., 2004; Love, 2005 and see references in Jensen et al. (2000) and Jensen (2002)). Lost cargos or shipwrecks form a less conspicuous range of artificial hard substrata that lie on the seabed as results of unintentional processes (Bulloch, 1965; Hiscock, 1980; Leewis et al., 2000; Steimle and Zetlin, 2000; Massin et al., 2002). A range of pioneer organisms colonize these wrecks soon after sinking (Forteath et al., 1982) and an epibenthic fauna and/or flora develops that may mature into a sta- ble community (Forteath et al., 1982; Picken, 1986). Indications exist that the resulting communities are distinct from those matur- ing on natural grounds surrounding them (Carr and Hixon, 1997; Glasby, 2001; Badalamenti et al., 2002; Smith and Rule, 2002; * Corresponding author. Royal Belgian Institute of natural Sciences, Rue Vautier, 29, 1000 Brussels, Belgium. E-mail address: [email protected] (V. Zintzen). 0272-7714/$ - see front matter Ó 2007 Elsevier Ltd. All rights reserved. doi:10.1016/j.ecss.2007.07.012 Available online at www.sciencedirect.com Estuarine, Coastal and Shelf Science 76 (2008) 327e344 www.elsevier.com/locate/ecss
-
Upload
naturalsciences-be -
Category
Documents
-
view
0 -
download
0
Transcript of Spatial variability of epifaunal communities from artificial habitat: Shipwrecks in the Southern...
Available online at www.sciencedirect.com
Estuarine, Coastal and Shelf Science 76 (2008) 327e344www.elsevier.com/locate/ecss
Spatial variability of epifaunal communities from artificial habitat:Shipwrecks in the Southern Bight of the North Sea
Vincent Zintzen a,b,*, Alain Norro c, Claude Massin a, Jerome Mallefet b
a Royal Belgian Institute of Natural Sciences, Rue Vautier 29, B-1000 Brussels, Belgiumb University of Louvain, Biology Laboratory, Kellner Building, place Croix du Sud 3, B-1348 Louvain-la-Neuve, Belgium
c Royal Belgian Institute of Natural Sciences, Management Unit of the North Sea Mathematical Models, 100 Gulledelle, 1200 Brussels, Belgium
Received 23 April 2007; accepted 11 July 2007
Available online 4 September 2007
Abstract
We investigated the cover, community structure and abiotic environment of nine shipwrecks lying at increasing distance from the Belgiancoast. Results indicated that all shipwrecks were strongly dominated by cnidarians in terms of biomass and by amphipods in terms of abun-dances. Based on their epifaunal composition, three groups of shipwrecks could be determined. Metridium senile dominated a species poor com-munity of the coastal sites. On the same sites, a Tubularia larynx community with a more species-rich assemblage was also developing. TheT. larynx community had a lower biomass value (102 g AFDW m�2) and significantly lower species richness compared to the other sites.The coastal sites were characterized by periodic salinity decreases, large seasonal temperature fluctuation, high total suspended matter loadand reduced current velocity. Channel water masses influence the offshore sites causing a more stable temperature and salinity environment,less turbid waters and high current speed. Tubularia indivisa dominated this community, with an average biomass of 229 g AFDW m�2. Inter-mediate sites were also dominated by T. indivisa, but a higher biomass (424 g AFDW m�2) was observed. They showed intermediate results forthe abiotic parameters and fast current velocities. Hypotheses for the observed variation in community structures are discussed in the light of theabiotic characterization of the shipwrecks.� 2007 Elsevier Ltd. All rights reserved.
Keywords: artificial substrata; epizoites; population density; biomass; Tubularia; Metridium senile; North Sea
1. Introduction
Artificial hard substrata have increasingly occurred at seasince man started using the sea and its resources (Connell andGlasby, 1999). Certainly, the most profound and visible effectof this action are coastal constructions that dramaticallychanged the nature and extent of hard substrata both inshallow-water and intertidal areas (Glasby and Connell, 1999;Bacchiocchi and Airoldi, 2003). At sea, a large number of arti-ficial reefs have been created for several purposes like fisheryenhancement, coastal protection, recreational activities (mostlydiving and fishing), and also scientific research. Other man made
* Corresponding author. Royal Belgian Institute of natural Sciences, Rue
Vautier, 29, 1000 Brussels, Belgium.
E-mail address: [email protected] (V. Zintzen).
0272-7714/$ - see front matter � 2007 Elsevier Ltd. All rights reserved.
doi:10.1016/j.ecss.2007.07.012
marine structures like offshore platforms were originally not in-tended as artificial reefs, but they are increasingly seen as a toolfor fishery improvement or protection (Scarborough Bull andKendall, 1994; Relini et al., 1998; Stanley and Wilson, 2000;Fabi et al., 2004; Love, 2005 and see references in Jensenet al. (2000) and Jensen (2002)). Lost cargos or shipwrecksform a less conspicuous range of artificial hard substrata thatlie on the seabed as results of unintentional processes (Bulloch,1965; Hiscock, 1980; Leewis et al., 2000; Steimle and Zetlin,2000; Massin et al., 2002). A range of pioneer organisms colonizethese wrecks soon after sinking (Forteath et al., 1982) and anepibenthic fauna and/or flora develops that may mature into a sta-ble community (Forteath et al., 1982; Picken, 1986). Indicationsexist that the resulting communities are distinct from those matur-ing on natural grounds surrounding them (Carr and Hixon, 1997;Glasby, 2001; Badalamenti et al., 2002; Smith and Rule, 2002;
328 V. Zintzen et al. / Estuarine, Coastal and Shelf Science 76 (2008) 327e344
Knott et al., 2004). Not only new hard substratum may be addedto the sea but novel habitats are created, distinct from thosenaturally occurring in the area (Connell, 2000; Connell, 2001;Holloway and Connell, 2002).
In areas dominated by soft sediments, shipwrecks forma patchy network of hard substrata (Zintzen et al., 2006) whoseinterconnections are unknown (Bacchiocchi and Airoldi, 2003).Transfer must occur between the local populations of shipwrecksbut the rate and frequency at which it happens have not yet beenstudied. Identifying spatial patterns and species associations isa first step towards understanding the relationships that existwithin these networks of disconnected marine habitats. In thispaper, we investigate the spatial variation of the epifaunalcommunity structure of nine shipwrecks located at short dis-tances from each others (<50 km) and in a coastal macrotidal en-vironment. This work will also help to better predict how the hardsubstrata that will be likely added by energy generation devicesin the area (wind and wave power generation) may be colonized.
2. Materials and methods
2.1. General description of the study sites
Studied shipwrecks are located in Belgian coastal waters inthe Southern Bight of the North Sea. In the region, maximumdepth is about 40 m and tides highly influence the distributionof sediments (Larsonneur et al., 1982) and their benthic com-munities. Mean spring tide amplitudes are around 4 m. East ofthe Dover Strait, current velocities decrease as a result of theincreasing opening between continental Europe and UK, al-lowing for the sedimentation of finer particles. Soft sedimentsdominate the seabed of the Belgian part of the North Sea(BPNS) where the presence of several subtidal sandbankshas caused a high geomorphological and sedimentological di-versity (Degraer et al., 1999). Natural hard substrata like peb-bles are rare and only occur locally in the swales betweensandbanks (Lanckneus et al., 2001).
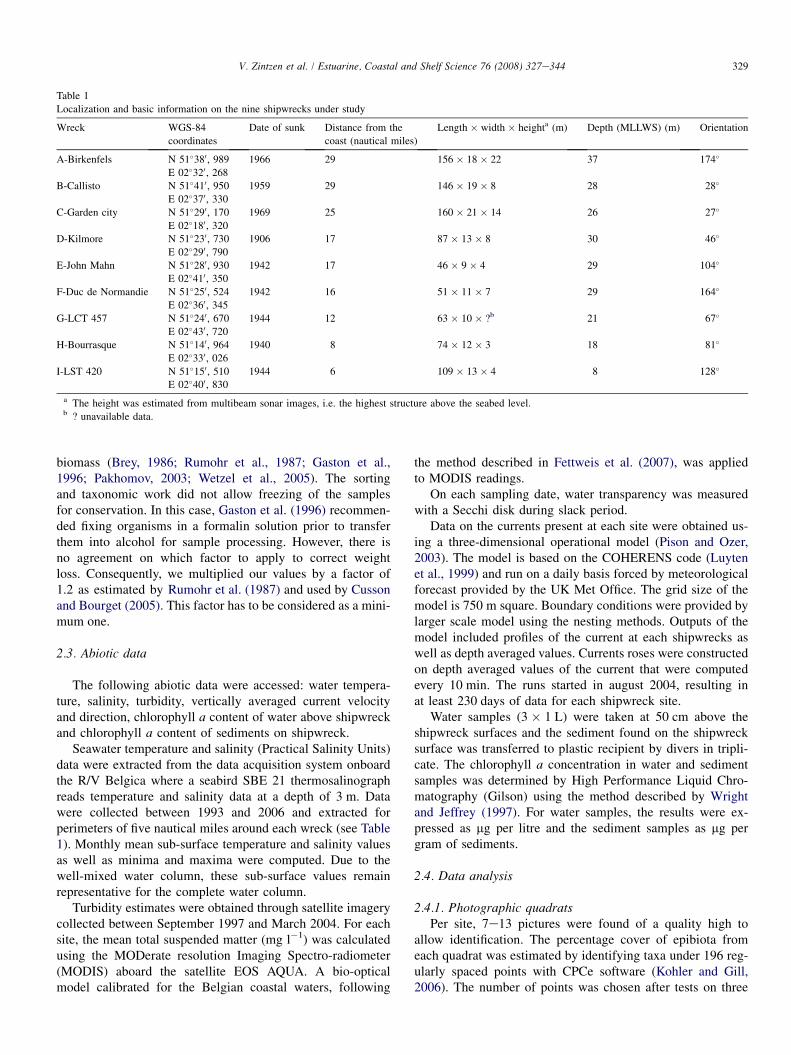
On the 3640 km2 of the BPNS, 231 obstructions were re-corded, most of them being shipwrecks. A detailed map of theseobstructions can be found in Zintzen et al. (2006). For this study,nine shipwrecks (Table 1) have been selected on basis of four cri-teria: (1) the vessels should have sunk at least 40 years ago, al-lowing for a mature state of the epifauna; (2) they are in a goodcondition and large enough for easy localisation; (3) they are sit-uated outside navigation roads for safety reasons; and (4) they aremaximally distributed on the BPNS. The selected shipwrecks ofTable 1 sank between 1940 and 1969, measure between 46 and156 m in length and have structures emerging from 3 to 22 mabove the seabed. Their location in the BPNS (distance fromthe coast: 8e29 nautical miles) is positively correlated to theirdepth (8e37 m e MLLWS e Mean Lower Low Water Springslevels). Their orientation on the seabed is variable.
2.2. Sampling strategy and sample processing
The nine sites were sampled during a two months period(May and June 2005) avoiding seasonal variation in community
structure. Preliminary studies showed that both photographicdocumentation and collection of organisms were needed to pro-vide useful information on the epifauna communities of subtidalartificial hard substrata.
Sampling was achieved during day time. Photographictechniques were used to assess general features of the differentcommunities at the scale of the individual shipwreck. A 30 mtape was deployed by divers on the upper structures of eachshipwreck and digital pictures of 0.5 � 0.5 m quadrats weretaken every 5 m with a digital camera recorder (Sony PC330, 3.2 Mpix) in a Mako housing and lighting (Light &Motion). After completion of the first set of pictures, thetape was deployed in the opposite direction of the first transectand the process started again. Due to the very poor visibilityconditions, it was often impossible for the divers to locatethemselves precisely on the shipwrecks.
The changing and often poor visibility conditions on sitesprevented detailed analysis of pictures. The independent col-lection by SCUBA of a selected faunal assemblage allowedfor detailed species identification and enumeration in the lab-oratory. Since it was not practically feasible to manually sam-ple all the communities on shipwrecks, the samples wererandomly taken on an a priori defined faunal assemblage dom-inated by the hydrozoan Tubularia indivisa and/or Tubularialarynx on each shipwreck site. This assemblage is known toharbour a diverse faunal association (Zintzen et al., 2006)and was present on all investigated sites. All organisms withinquadrats of 0.25 � 0.25 m were scraped off of vertical sur-faces in triplicate. All organisms were carefully collected ina plastic bag. The loss of vagile material by currents waskept low because most of the species were in close contactto the tubulariids and tended to protect themselves by stayingclose to their substrate. On board, the organisms were anaes-thetised in a 3.5% MgCl2 solution for one hour and then trans-ferred to buffered formalin solution (final concentration 4%,pH 8.2e8.4). After 5e7 days, specimens were transferred to70% buffered alcohol for permanent storage. The sampleswere sorted under a binocular microscope and macro-species(>1 mm) were identified to the lowest possible taxonomiclevel and counted. Colonial species were noted as present orabsent.
Ash free dry weights (AFDW) were calculated for eachspecies in each sample. First, wet weight (in alcohol) perspecies was determined to the nearest mg. Prior to weighting,specimens were blotted on absorbent paper to remove excessalcohol. Specimens weighting less than 1 mg were given theassigned value of 1 mg. For the taxa represented by low bio-mass values, ash free dry weights were calculated by usingconversion factors found in the literature (Rumohr et al.,1987; Ricciardi and Bourget, 1998; Galeron et al., 2000).For the more important taxa in terms of biomass, we calcu-lated our own wet weights to ash free dry weights conversionfactors. Therefore, taxa were weighted wet, dried (48 h at70 �C), re-weighted (dry weight) and then burned at 500 �Cfor 12 h. Ash free dry weight is the difference between dryweight and the weight after the burning process. Specimenswere kept in preservatives which have a known effect on their
329V. Zintzen et al. / Estuarine, Coastal and Shelf Science 76 (2008) 327e344
Table 1
Localization and basic information on the nine shipwrecks under study
Wreck WGS-84
coordinates
Date of sunk Distance from the
coast (nautical miles)
Length � width � heighta (m) Depth (MLLWS) (m) Orientation
A-Birkenfels N 51�380, 989 1966 29 156 � 18 � 22 37 174�
E 02�320, 268
B-Callisto N 51�410, 950 1959 29 146 � 19 � 8 28 28�
E 02�370, 330
C-Garden city N 51�290, 170 1969 25 160 � 21 � 14 26 27�
E 02�180, 320
D-Kilmore N 51�230, 730 1906 17 87 � 13 � 8 30 46�
E 02�290, 790
E-John Mahn N 51�280, 930 1942 17 46 � 9 � 4 29 104�
E 02�410, 350
F-Duc de Normandie N 51�250, 524 1942 16 51 � 11 � 7 29 164�
E 02�360, 345
G-LCT 457 N 51�240, 670 1944 12 63 � 10 � ?b 21 67�
E 02�430, 720
H-Bourrasque N 51�140, 964 1940 8 74 � 12 � 3 18 81�
E 02�330, 026
I-LST 420 N 51�150, 510 1944 6 109 � 13 � 4 8 128�
E 02�400, 830
a The height was estimated from multibeam sonar images, i.e. the highest structure above the seabed level.b ? unavailable data.
biomass (Brey, 1986; Rumohr et al., 1987; Gaston et al.,1996; Pakhomov, 2003; Wetzel et al., 2005). The sortingand taxonomic work did not allow freezing of the samplesfor conservation. In this case, Gaston et al. (1996) recommen-ded fixing organisms in a formalin solution prior to transferthem into alcohol for sample processing. However, there isno agreement on which factor to apply to correct weightloss. Consequently, we multiplied our values by a factor of1.2 as estimated by Rumohr et al. (1987) and used by Cussonand Bourget (2005). This factor has to be considered as a mini-mum one.
2.3. Abiotic data
The following abiotic data were accessed: water tempera-ture, salinity, turbidity, vertically averaged current velocityand direction, chlorophyll a content of water above shipwreckand chlorophyll a content of sediments on shipwreck.
Seawater temperature and salinity (Practical Salinity Units)data were extracted from the data acquisition system onboardthe R/V Belgica where a seabird SBE 21 thermosalinographreads temperature and salinity data at a depth of 3 m. Datawere collected between 1993 and 2006 and extracted forperimeters of five nautical miles around each wreck (see Table1). Monthly mean sub-surface temperature and salinity valuesas well as minima and maxima were computed. Due to thewell-mixed water column, these sub-surface values remainrepresentative for the complete water column.
Turbidity estimates were obtained through satellite imagerycollected between September 1997 and March 2004. For eachsite, the mean total suspended matter (mg l�1) was calculatedusing the MODerate resolution Imaging Spectro-radiometer(MODIS) aboard the satellite EOS AQUA. A bio-opticalmodel calibrated for the Belgian coastal waters, following
the method described in Fettweis et al. (2007), was appliedto MODIS readings.
On each sampling date, water transparency was measuredwith a Secchi disk during slack period.
Data on the currents present at each site were obtained us-ing a three-dimensional operational model (Pison and Ozer,2003). The model is based on the COHERENS code (Luytenet al., 1999) and run on a daily basis forced by meteorologicalforecast provided by the UK Met Office. The grid size of themodel is 750 m square. Boundary conditions were provided bylarger scale model using the nesting methods. Outputs of themodel included profiles of the current at each shipwrecks aswell as depth averaged values. Currents roses were constructedon depth averaged values of the current that were computedevery 10 min. The runs started in august 2004, resulting inat least 230 days of data for each shipwreck site.
Water samples (3 � 1 L) were taken at 50 cm above theshipwreck surfaces and the sediment found on the shipwrecksurface was transferred to plastic recipient by divers in tripli-cate. The chlorophyll a concentration in water and sedimentsamples was determined by High Performance Liquid Chro-matography (Gilson) using the method described by Wrightand Jeffrey (1997). For water samples, the results were ex-pressed as mg per litre and the sediment samples as mg pergram of sediments.
2.4. Data analysis
2.4.1. Photographic quadratsPer site, 7e13 pictures were found of a quality high to
allow identification. The percentage cover of epibiota fromeach quadrat was estimated by identifying taxa under 196 reg-ularly spaced points with CPCe software (Kohler and Gill,2006). The number of points was chosen after tests on three

330 V. Zintzen et al. / Estuarine, Coastal and Shelf Science 76 (2008) 327e344
representative quadrats and varying grid size (100, 144, 169,196, 225 and 256 points per quadrat). The 196 point gridwas needed to identify all the recognizable features of the pic-tures and more points did not add any more information. Be-sides epifauna, bare surface (metal, sand or mud) and fishinglines/nets could be recognized. The amount of unidentifiablefeatures or empty spaces was kept low.
The data were fourth-root transformed because the data setwas strongly dominated by some of the variables. It was thensubmitted to a Principal Component Analysis on covariancematrix. Similarity between sites was estimated also by theBray-Curtis index calculated from fourth-root transformeddata and tested by an ANOSIM procedure (Clarke andWarwick, 2001b). A SIMPER breakdown was performed todetermine the epibenthic categories that contribute most tothe average similarity within sites (Clarke and Warwick,2001b).
2.4.2. Tubularia associationSpecies richness (S), the Simpson index (D, based on bio-
mass values to take into account the colonial organisms) (asrecommended by Magurran, 2004), the average taxonomicdistinctness (Dþ) and the variation in taxonomic distinctness(Lþ) (Clarke and Warwick, 1998; Clarke and Warwick,2001a) were used as univariate summary variables to charac-terize the biological diversity of each site. The taxonomic dis-tances were evaluated through a taxonomic tree built onstandard Linnean classification. We used the taxonomy pro-posed by Costello et al. (2001) from which we extracted a sim-plified tree: the retained taxonomic levels were species, genus,family, order, class and phylum. The default weights betweenstep length of the Linnean’s tree were set to constant (i.e.weights were 16.7 for species in the same genus, 33.3 for spe-cies in different genus but the same family, 50 for species indifferent family but the same order, 66.7 for species in differ-ent orders but the same class, 83.3 for species in different classbut the same phylum and 100 for species in different phyla).All indices were calculated using the DIVERSE procedureof the PRIMER statistical software package and comparedacross sites using the post-hoc Student-NewmaneKeuls testfor comparisons of means (Keuls, 1952). Normality of thedata was tested with ShapiroeWilk W-test prior to analysis(Shapiro and Wilk, 1965).
Multivariate exploratory analysis of the scraped samplesfrom the Tubularia association was conducted on biomassdata. Because of the low number of replicates by site (N ¼ 3),the data were pooled by site (shipwreck) and square-root trans-formed to give more weight in the analysis to the less abundantspecies. Similarity between each pair of samples was thencalculated with the Bray-Curtis similarity coefficient (Brayand Curtis, 1957). The resulting matrix was then used to explorethe pattern of community structure among samples by means ofordination with non-metric multidimensional scaling (nMDS)and clustering by group-averaging (Clarke, 1999). The good-ness-of-fit of the resulting two dimensional nMDS plot wasmeasured using Kruskal’s stress formula I (Kruskal and Wish,1978). The groups a posteriori defined by the cluster and
ordination analysis were tested by a one-way ANOSIM whichis a multivariate test based on the corresponding rank similari-ties between samples in the underlying triangular similaritymatrix (Clarke and Warwick, 2001b). Non-parametric multi-variate analysis of variance was used to test for differencebetween sites using PERMANOVA (Anderson, 2001). Thematching of biotic to environmental data was done with theBIO-ENV procedure. We retained the following abiotic para-meters for multivariate analysis: (1) mean temperature andsalinity for February (T1, S1), June (T2, S2) and October (T3,S3); (2) minimal and maximal temperature (Tmin, Tmax) andsalinity (Smin, Smax); (3) annual monthly mean minimal andmaximal salinity (SMmin, SMmax); (4) mean total suspendedmatter for JanuaryeFebruary (TSM-1), MayeJune (TSM-2)and AugusteSeptember (TSM-3); (5) Secchi depth (Sec); (6)depth; (7) chlorophyll a content in water (W-pig) and sediments(S-pig); (8) proportion of current velocities (>1, 1e0.75, 0.75e0.50, 0.50e0.25, 0.20e0.10, <0.10 m s�1) (C100, C100-75,C75-50, C50-25, C25-10, C10); and (9) angular differencebetween heading of the shipwreck and dominant current direc-tion (Head-Dir). Draftsman plot of environmental data wasdone to estimate skewness of data and transformation appliedif necessary. Environmental data with strong colinearity(Spearman rank correlation >0.90) were grouped prior toanalysis. Analyses were performed with the Primer 6.0 softwarepackage.
The groups of sites resulting from the multivariate analysiswere characterized by their indicator species. We used the in-dicator value (IndVal) coefficient developed by Dufrene andLegendre (1997). A species is indicator of a group if it occurson most of the samples from this group (specificity) and if it ispoorly represented on the other groups (fidelity). The IndValcoefficient combines both the species relative abundancewith its relative frequency of occurrence in the defined groupsof sites. The statistical significance of the species indicatorvalues was evaluated using a randomization procedure (999randomizations). A species is considered indicator of a groupif the results of two tests are significant at a level of 0.05: at-test computing the weighted distance between randomizedvalues and the observed value, and the rank of the observedvalue among the decreasing ordered randomized value distri-bution. The calculations were made using the IndVal program.
3. Results
3.1. Abiotic data
Depth and orientation of the shipwrecks are presented onTable 1. Obviously, offshore shipwrecks are located in deeperwaters while coastal sites are shallower.
Temperature varied between 0.4 and 22.1 �C (Fig. 1). Watertemperature showed a lower seasonal fluctuation at offshoresites than inshore. Temperatures were colder in winter and hot-ter in summer for the coastal sites than further offshore. Thethree offshore sites (Garden City, Birkenfels and Callisto)which are under the influence of Channel water differedstrongly from the other sites by having higher minimum

331V. Zintzen et al. / Estuarine, Coastal and Shelf Science 76 (2008) 327e344
temperatures and lower maximum temperatures. The minimaland maximal water temperature differences were 14.7 �C foran offshore site (Garden City) and 21.5 �C for a coastal site(LST 420).
Salinity ranged from 28.1 to 35.4 (Fig. 2). In February, thecoastal sites showed a decreased salinity of approximately twounits compared to the intermediate and offshore sites(Fig. 2A). Salinity values recorded in October showed less var-iation amongst the nine sites. Three groups differentiated fromthe minimal and maximal salinities (Fig. 2B). Lowest salinitieswere recorded on the LST420, Bourrasque and LCT457 asthey received periodically an input of freshwater from conti-nental rivers. The difference between minima and maximarecorded salinities was lowest for the offshore sites (GardenCity, Birkenfels and Callisto). The remaining sites had anintermediate salinity regime.
The current velocities and directions of the nine sites wereoriented along a coastal-offshore gradient. Fig. 3 presentstypical examples of coastal (LST 420), intermediate (Duc deNormandie) and offshore (Birkenfels) current roses. Currentellipses showed preferential directions: NE (22.5e67.5�) and
Fig. 1. Water temperature on the nine shipwrecks. The mean monthly values
(þSD) for February, June and October are presented together with minimal
and maximal observed temperature. Period covered: 1993e2006.
SW (202.5e247.5�). The prevailing direction was orientedto 22.5e40� and 202.5� for Birkenfels, Callisto and GardenCity, to 45� and 225� for the Kilmore, Duc de Normandie,LCT457 and John Mahn, to 45e67.5� and 225� for the Bour-rasque and to 45e67.5� and 202.5e225� for LST420. This lastsite, together with the Bourrasque had sparsely current above0.8 m s�1, compared to the other and further offshore sites.Only the Garden City, Kilmore and Duc de Normandie hadsparsely current velocities above 1 m s�1. For all sites, the fre-quency of low current velocity (<0.2 m s�1) was comprisedbetween 9.0 and 15.1% and the period of very low currentvelocity (calms, <0.1 m s�1) was always under 1.1% in fre-quency. The most frequently occurring current velocity wascomprised between 0.6 and 1.0 m s�1, except for theLST420 and Bourrasque where current velocity in the range0.4e0.8 m s�1 was the most frequent.
Total suspended matter (TSM) decreased in MayeJune andreached highest values during AugusteSeptember. This pat-tern was more pronounced for the coastal sites and tended tobe attenuated further offshore with less fluctuating concentra-tion over time. There was a clear spatial trend of decreasingTSM with distance from the coast. During late summer,TSM values for the coastal wrecks, LST420 and Bourrasquewere 20.9 mg l�1 and 15.3 mg l�1, respectively, while reach-ing 9.7 mg l�1 at LCT457. Values for the Kilmore, Duc deNormandie and John Mahn fell between 7.3 and 7.8 mg l�1.At the Garden City, Birkenfels and Callisto, late summerTSM values of 6.1e6.2 mg l�1 were found. Secchi readingsconfirmed TSM measurements (Fig. 4). The lowest transpar-ency was measured on the LST420 (6.0 m) while the highestwas found on the Garden City and Duc de Normandie (10.5 m).
Chlorophyll a concentrations of water samples taken closeto the shipwrecks ranged between 1.0 and 4.2 mg l�1 (Fig. 5).The sediments contained chlorophyll a in concentration rang-ing from 0.9 to 6.1 mg g�1. Data for sediment samples aremissing for the Bourrasque. The further offshore sites (GardenCity, Birkenfels and Callisto) and especially the John Mahnwere characterized by a high ratio of chlorophyll in water tochlorophyll in sediments. The other sites had comparableand lower ratios.
Fig. 2. Water salinity on the nine shipwrecks. (A) Mean monthly values (þSD) for February, June and October. (B) Mean (�SD) monthly minima and maxima.
Period covered: 1993e2006.

332 V. Zintzen et al. / Estuarine, Coastal and Shelf Science 76 (2008) 327e344
Fig. 3. Current roses and % of occurrence of currents for an offshore (Birkenfels, A), intermediate (Duc de Normandie, B) and coastal sites (LST 420, C). The
currents were computed from a 3D hydrodynamic model forced by UK Met Office meteorological forecast (August 2004eJuly 2005, time step: 10 min).
3.2. General characteristics of shipwrecks cover ephotographic transect
Generally, the percentage of surface not covered by epi-fauna for the 9 sites was 30%. Epifaunal cover was generallyhigh for the sites at an intermediate distance from the coast,medium to high for offshore sites and low for coastal sites(Fig. 6). The Birkenfels showed the lowest epifaunal growthwith 70% uncovered, bare surface. Due to poor visibility con-ditions, a limited set of features was recognizable from the un-derwater photography. The main taxa that were identifiable
were: Tubularia spp. (a mixture of Tubularia indivisa andTubularia larynx) always associated with a tube buildingamphipod (Jassa herdmani), Sagartia sp., Asterias rubens,Metridium senile and Diadumene cincta (Fig. 6). Less commontaxa identified were: Actinothoe sphyrodeta, Cancer pagurus,Dendronotus frondosus, Diplosoma sp., unidentified Porifera,Haliclona sp., Jassa tubes, Nassarius sp., Necora puber,Nemertesia antennina, Ophiothrix fragilis, Pagurus sp., Poma-toceros triqueter, Sycon sp. and Urticina felina. No macroal-gae were recorded. Coastal shipwrecks had 52% of theirsurface covered by Metridium senile and 29% covered by

333V. Zintzen et al. / Estuarine, Coastal and Shelf Science 76 (2008) 327e344
a mixture of T. indivisa e T. larynx e J. herdmani (if exclud-ing bare surface). The other sites were on average covered at81% by T. indivisa e J. herdmani.
A multivariate analysis of the data on coverage is presentedin Fig. 7. The two first axis of the Principal Component Anal-ysis explained 64% of the total variance of the cover matrix.The third one explained 8%. The first axis was strongly corre-lated with the abundance/coverage of Tubularia spp. (contri-bution of 50%) and Metridium senile (43%). The secondaxis was mainly a function of the recorded density/coverageof M. senile (30%), Asterias rubens (26%), Sagartia sp.(15%), Tubularia spp. (15%) and Diadumene cincta (12%).The third axis was correlated with the abundance/coverageof D. cincta (46%), Sagartia sp. (20%) and Tubularia spp.(15%). The Callisto, Garden city, Duc de Normandie, JohnMahn and Kilmore were characterized by a dominance ofTubularia spp., which was generally associated with D. cincta.
Fig. 4. Mean total suspended matter by period of the year and by site estimated
from Modis satellite imagery (period covered: July 2002eOctober 2005) and
Secchi depth taken on the sampling dates.
Fig. 5. Chlorophyll a concentration (N ¼ 3, �SD) of water and sediment sam-
ples from the shipwreck sites.
The Birkenfels was closely associated with this last group ofshipwrecks even if some of the quadrats showed a very lowcover of Tubularia spp. On the offshore sites (Garden City,Birkenfels, Callisto), Sagartia sp. together with D. cinctawere well represented. The LST 420, LCT 457 and Bourras-que were less dominated by Tubularia spp. while M. senilewas the dominant taxa on Bourrasque and LST 420. Metridiumsenile was also well represented on Duc de Normandie andLCT 457 but were here not the dominant feature. TheLCT457 was particular in having equal proportions of Tubu-laria spp. and M. senile. These findings were confirmed bythe ANOSIM and SIMPER tests.
Fig. 6. Mean percentage cover of epifauna on the shipwrecks estimated from
photographic quadrats. Others: Actinothoe sphyrodeta, Cancer pagurus, Den-dronotus frondosus, Diplosoma sp., Porifera, Haliclona sp., Jassa tubes, Nas-
sarius sp., Necora puber, Nemertesia antennina, Ophiotrix fragilis, Paguridae,
Pomatoceros triqueter, Sycon ciliatum, Urticina felina, fishing lines/net and
unidentified feature.
Fig. 7. Principal Composant Analysis biplot of the epifauna cover data (on
covariance matrix, fourth-root-transformed data). Only the main variables and
the sites with S Cos2 �0.40 are represented. Sites symbolism: - Bourrasque,
, LST 420, C John Mahn, B Duc de Normandie, A Birkenfels, > Kilmore,
: Callisto, 6 LCT 457, � Garden City.
334 V. Zintzen et al. / Estuarine, Coastal and Shelf Science 76 (2008) 327e344
After colinearity inspection, five factors were dropped be-cause of their strong correlation (spearman rank correlation>0.90) with other variables: mean temperature for February,mean salinity for June, monthly mean minimal salinity andmean total suspended matter for JanuaryeFebruary. The otherfactors were retained for the BIO-ENV analysis. Table 2presents the results of the BIO-ENV analysis. Depth was thebest single correlated factor (r ¼ 0.393). However, other fac-tors could explain the observed variation in the biotic datasetwith almost the same accuracy (total suspended matter forJanuaryeFebruary, salinity for January, current velocity pro-portion between 1 and 0.75 m s�1 and current velocity propor-tion between 0.50 and 0.25 m s�1). The addition of otherfactors only slightly improved the correlation.
3.3. The Tubularia community from SCUBA sampling
3.3.1. Diversity and abundance of epifaunaA total of 90 species were recorded. Species richness
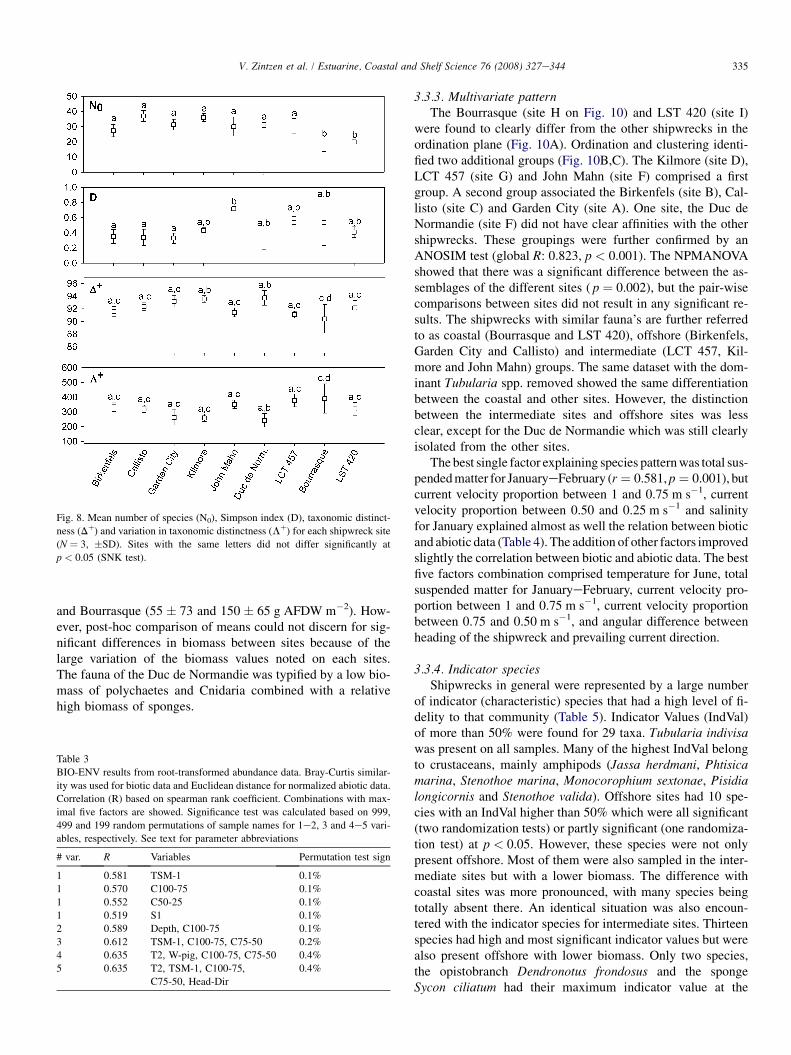
ranged from 13 to 40 species per site with a mean value of29 species. The species number (N0) was significantly lowerat the Bourrasque and LST 420 shipwrecks (SNK, p < 0.05and Fig. 8). The John Mahn had a significant higher Simpsonindex (D) than the Birkenfels, Callisto, Duc de Normandie andGarden City (SNK, p < 0.05 and Fig. 8). The average taxo-nomic distinctness (Dþ) and the variation in taxonomic dis-tinctness (Lþ) showed little variations between sites. Thefollowing significant differences were found ( p < 0.05): Kil-more versus Bourrasque for Dþ, Duc de Normandie versusBourrasque for Dþ and for Lþ.
A total of 47% of the species were present in only one (23species) or two sites (19 species). 32% of the species were
present on 7e9 sites. Species found on an intermediatenumber of sites (3e5) were the least common (21%).
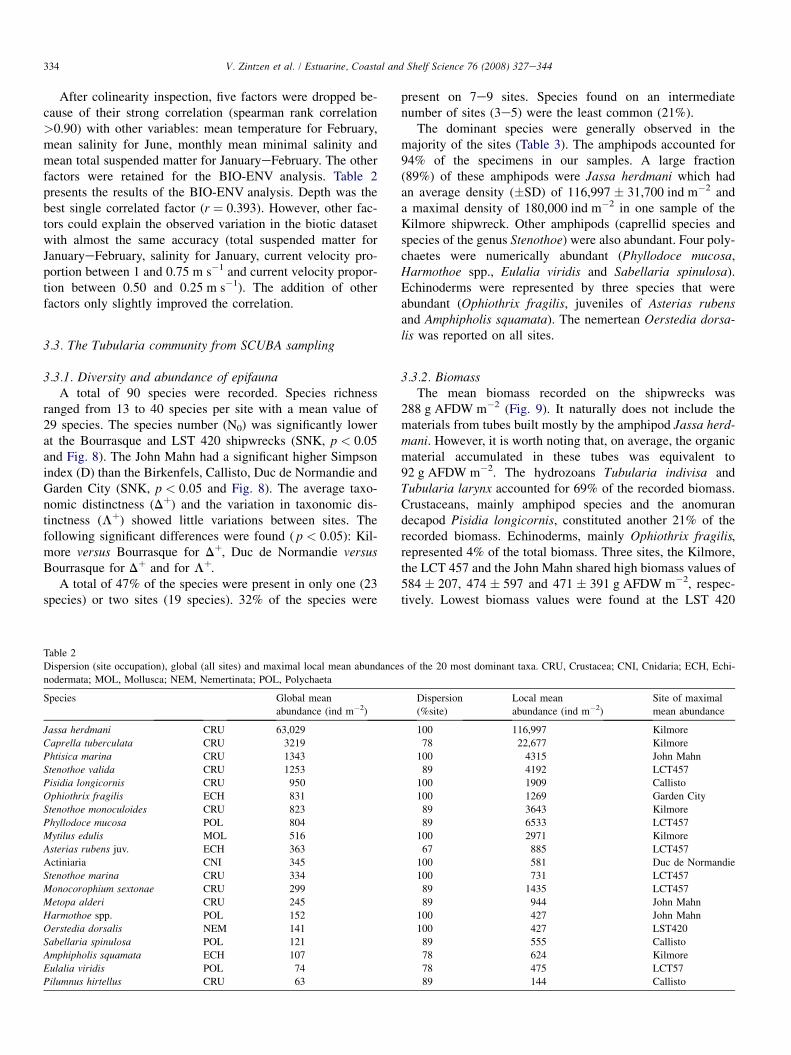
The dominant species were generally observed in themajority of the sites (Table 3). The amphipods accounted for94% of the specimens in our samples. A large fraction(89%) of these amphipods were Jassa herdmani which hadan average density (�SD) of 116,997 � 31,700 ind m�2 anda maximal density of 180,000 ind m�2 in one sample of theKilmore shipwreck. Other amphipods (caprellid species andspecies of the genus Stenothoe) were also abundant. Four poly-chaetes were numerically abundant (Phyllodoce mucosa,Harmothoe spp., Eulalia viridis and Sabellaria spinulosa).Echinoderms were represented by three species that wereabundant (Ophiothrix fragilis, juveniles of Asterias rubensand Amphipholis squamata). The nemertean Oerstedia dorsa-lis was reported on all sites.
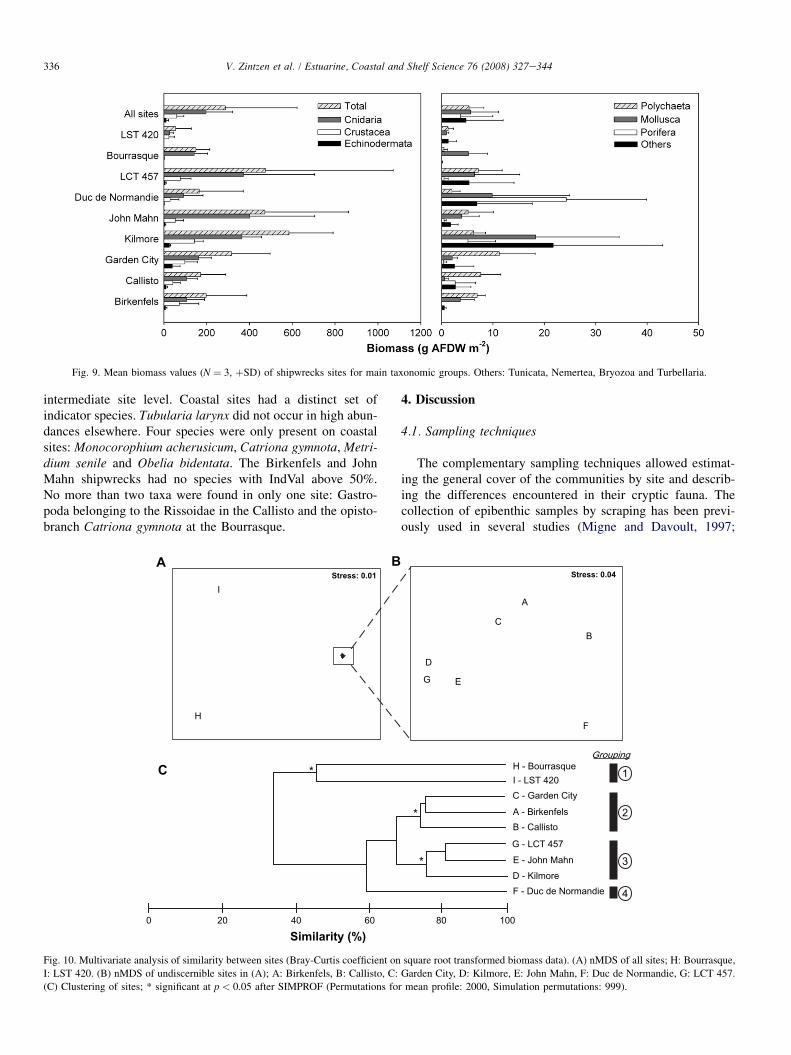
3.3.2. BiomassThe mean biomass recorded on the shipwrecks was
288 g AFDW m�2 (Fig. 9). It naturally does not include thematerials from tubes built mostly by the amphipod Jassa herd-mani. However, it is worth noting that, on average, the organicmaterial accumulated in these tubes was equivalent to92 g AFDW m�2. The hydrozoans Tubularia indivisa andTubularia larynx accounted for 69% of the recorded biomass.Crustaceans, mainly amphipod species and the anomurandecapod Pisidia longicornis, constituted another 21% of therecorded biomass. Echinoderms, mainly Ophiothrix fragilis,represented 4% of the total biomass. Three sites, the Kilmore,the LCT 457 and the John Mahn shared high biomass values of584 � 207, 474 � 597 and 471 � 391 g AFDW m�2, respec-tively. Lowest biomass values were found at the LST 420
Table 2
Dispersion (site occupation), global (all sites) and maximal local mean abundances of the 20 most dominant taxa. CRU, Crustacea; CNI, Cnidaria; ECH, Echi-
nodermata; MOL, Mollusca; NEM, Nemertinata; POL, Polychaeta
Species Global mean
abundance (ind m�2)
Dispersion
(%site)
Local mean
abundance (ind m�2)
Site of maximal
mean abundance
Jassa herdmani CRU 63,029 100 116,997 Kilmore
Caprella tuberculata CRU 3219 78 22,677 Kilmore
Phtisica marina CRU 1343 100 4315 John Mahn
Stenothoe valida CRU 1253 89 4192 LCT457
Pisidia longicornis CRU 950 100 1909 Callisto
Ophiothrix fragilis ECH 831 100 1269 Garden City
Stenothoe monoculoides CRU 823 89 3643 Kilmore
Phyllodoce mucosa POL 804 89 6533 LCT457
Mytilus edulis MOL 516 100 2971 Kilmore
Asterias rubens juv. ECH 363 67 885 LCT457
Actiniaria CNI 345 100 581 Duc de Normandie
Stenothoe marina CRU 334 100 731 LCT457
Monocorophium sextonae CRU 299 89 1435 LCT457
Metopa alderi CRU 245 89 944 John Mahn
Harmothoe spp. POL 152 100 427 John Mahn
Oerstedia dorsalis NEM 141 100 427 LST420
Sabellaria spinulosa POL 121 89 555 Callisto
Amphipholis squamata ECH 107 78 624 Kilmore
Eulalia viridis POL 74 78 475 LCT57
Pilumnus hirtellus CRU 63 89 144 Callisto
335V. Zintzen et al. / Estuarine, Coastal and Shelf Science 76 (2008) 327e344
and Bourrasque (55 � 73 and 150 � 65 g AFDW m�2). How-ever, post-hoc comparison of means could not discern for sig-nificant differences in biomass between sites because of thelarge variation of the biomass values noted on each sites.The fauna of the Duc de Normandie was typified by a low bio-mass of polychaetes and Cnidaria combined with a relativehigh biomass of sponges.
Table 3
BIO-ENV results from root-transformed abundance data. Bray-Curtis similar-
ity was used for biotic data and Euclidean distance for normalized abiotic data.
Correlation (R) based on spearman rank coefficient. Combinations with max-
imal five factors are showed. Significance test was calculated based on 999,
499 and 199 random permutations of sample names for 1e2, 3 and 4e5 vari-
ables, respectively. See text for parameter abbreviations
# var. R Variables Permutation test sign
1 0.581 TSM-1 0.1%
1 0.570 C100-75 0.1%
1 0.552 C50-25 0.1%
1 0.519 S1 0.1%
2 0.589 Depth, C100-75 0.1%
3 0.612 TSM-1, C100-75, C75-50 0.2%
4 0.635 T2, W-pig, C100-75, C75-50 0.4%
5 0.635 T2, TSM-1, C100-75, 0.4%
C75-50, Head-Dir
Fig. 8. Mean number of species (N0), Simpson index (D), taxonomic distinct-
ness (Dþ) and variation in taxonomic distinctness (Lþ) for each shipwreck site
(N ¼ 3, �SD). Sites with the same letters did not differ significantly at
p < 0.05 (SNK test).
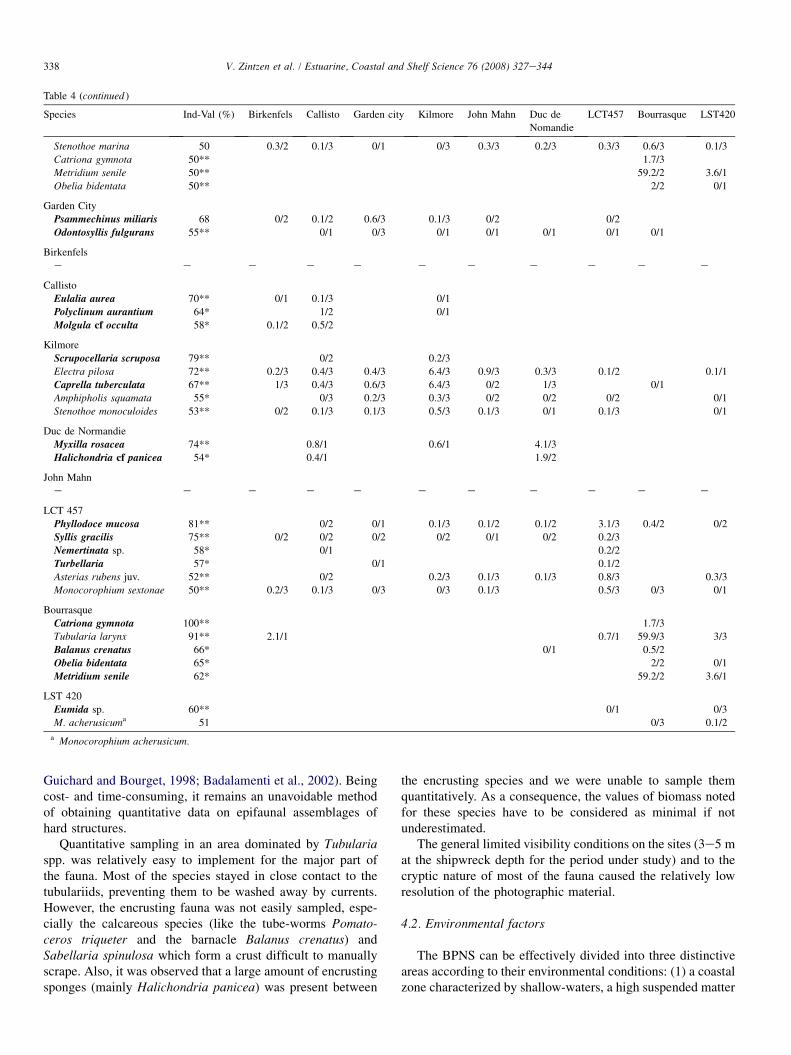
3.3.3. Multivariate patternThe Bourrasque (site H on Fig. 10) and LST 420 (site I)
were found to clearly differ from the other shipwrecks in theordination plane (Fig. 10A). Ordination and clustering identi-fied two additional groups (Fig. 10B,C). The Kilmore (site D),LCT 457 (site G) and John Mahn (site F) comprised a firstgroup. A second group associated the Birkenfels (site B), Cal-listo (site C) and Garden City (site A). One site, the Duc deNormandie (site F) did not have clear affinities with the othershipwrecks. These groupings were further confirmed by anANOSIM test (global R: 0.823, p < 0.001). The NPMANOVAshowed that there was a significant difference between the as-semblages of the different sites ( p ¼ 0.002), but the pair-wisecomparisons between sites did not result in any significant re-sults. The shipwrecks with similar fauna’s are further referredto as coastal (Bourrasque and LST 420), offshore (Birkenfels,Garden City and Callisto) and intermediate (LCT 457, Kil-more and John Mahn) groups. The same dataset with the dom-inant Tubularia spp. removed showed the same differentiationbetween the coastal and other sites. However, the distinctionbetween the intermediate sites and offshore sites was lessclear, except for the Duc de Normandie which was still clearlyisolated from the other sites.
The best single factor explaining species pattern was total sus-pended matter for JanuaryeFebruary (r ¼ 0.581, p ¼ 0.001), butcurrent velocity proportion between 1 and 0.75 m s�1, currentvelocity proportion between 0.50 and 0.25 m s�1 and salinityfor January explained almost as well the relation between bioticand abiotic data (Table 4). The addition of other factors improvedslightly the correlation between biotic and abiotic data. The bestfive factors combination comprised temperature for June, totalsuspended matter for JanuaryeFebruary, current velocity pro-portion between 1 and 0.75 m s�1, current velocity proportionbetween 0.75 and 0.50 m s�1, and angular difference betweenheading of the shipwreck and prevailing current direction.
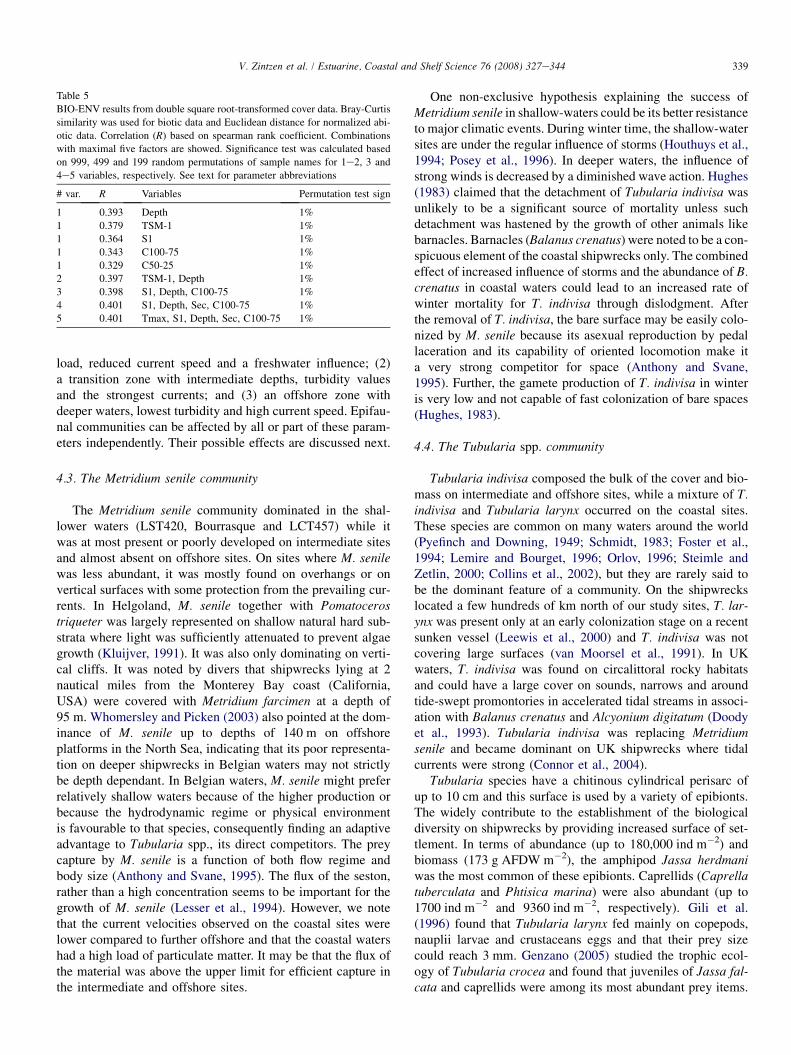
3.3.4. Indicator speciesShipwrecks in general were represented by a large number
of indicator (characteristic) species that had a high level of fi-delity to that community (Table 5). Indicator Values (IndVal)of more than 50% were found for 29 taxa. Tubularia indivisawas present on all samples. Many of the highest IndVal belongto crustaceans, mainly amphipods (Jassa herdmani, Phtisicamarina, Stenothoe marina, Monocorophium sextonae, Pisidialongicornis and Stenothoe valida). Offshore sites had 10 spe-cies with an IndVal higher than 50% which were all significant(two randomization tests) or partly significant (one randomiza-tion test) at p < 0.05. However, these species were not onlypresent offshore. Most of them were also sampled in the inter-mediate sites but with a lower biomass. The difference withcoastal sites was more pronounced, with many species beingtotally absent there. An identical situation was also encoun-tered with the indicator species for intermediate sites. Thirteenspecies had high and most significant indicator values but werealso present offshore with lower biomass. Only two species,the opistobranch Dendronotus frondosus and the spongeSycon ciliatum had their maximum indicator value at the
336 V. Zintzen et al. / Estuarine, Coastal and Shelf Science 76 (2008) 327e344
Fig. 9. Mean biomass values (N ¼ 3, þSD) of shipwrecks sites for main taxonomic groups. Others: Tunicata, Nemertea, Bryozoa and Turbellaria.
intermediate site level. Coastal sites had a distinct set ofindicator species. Tubularia larynx did not occur in high abun-dances elsewhere. Four species were only present on coastalsites: Monocorophium acherusicum, Catriona gymnota, Metri-dium senile and Obelia bidentata. The Birkenfels and JohnMahn shipwrecks had no species with IndVal above 50%.No more than two taxa were found in only one site: Gastro-poda belonging to the Rissoidae in the Callisto and the opisto-branch Catriona gymnota at the Bourrasque.
4. Discussion
4.1. Sampling techniques
The complementary sampling techniques allowed estimat-ing the general cover of the communities by site and describ-ing the differences encountered in their cryptic fauna. Thecollection of epibenthic samples by scraping has been previ-ously used in several studies (Migne and Davoult, 1997;
A B
D
G E
F
C
A
B
Stress: 0.04
I
H
Stress: 0.01
H - BourrasqueI - LST 420
D - Kilmore
G - LCT 457
E - John Mahn
F - Duc de Normandie
C - Garden City
A - BirkenfelsB - Callisto
0 20 40 60 80 100
Similarity (%)
Grouping
1*
*
*
C
2
3
4
Fig. 10. Multivariate analysis of similarity between sites (Bray-Curtis coefficient on square root transformed biomass data). (A) nMDS of all sites; H: Bourrasque,
I: LST 420. (B) nMDS of undiscernible sites in (A); A: Birkenfels, B: Callisto, C: Garden City, D: Kilmore, E: John Mahn, F: Duc de Normandie, G: LCT 457.
(C) Clustering of sites; * significant at p < 0.05 after SIMPROF (Permutations for mean profile: 2000, Simulation permutations: 999).

337V. Zintzen et al. / Estuarine, Coastal and Shelf Science 76 (2008) 327e344
Table 4
Indicator species values (IndVal), mean biomass (g AFDW m�2) and presence of species at different clustering levels. Only species with IndVal >50% are con-
sidered. The first figure is the mean biomass for the three samples of the site; if the mean biomass is lower than 0.1 g AFDW m�2, it is rounded to 0. The second
figure is the number of samples where the species is present for the site under consideration. Species in bold have reached their maximum indicator value.
** Significant at p < 0.05 level for the two randomization tests. *Significant at p < 0.05 level for only one of the two randomization test
Species Ind-Val (%) Birkenfels Callisto Garden city Kilmore John Mahn Duc de
Nomandie
LCT457 Bourrasque LST420
All sites
Tubularia indivisa 100 100.7/3 92.5/3 153.4/3 361.6/3 399.6/3 86.4/3 366.1/3 20.3/3 20/3
Jassa herdmani 96 65.6/3 29.5/2 86/3 123.3/3 41.2/3 26.2/3 67.8/3 1.1/3 23.6/3
Phtisica marina 96 0.1/3 0.3/3 0.6/3 1.3/3 1.7/3 0.2/3 0.6/3 0.1/2 0/3
Actiniaria 92 3.9/3 13.5/3 9.3/3 2.6/3 1.9/3 4.8/3 5.2/3 0.2/2 0.7/2
Harmothoe spp. 92 0.6/3 0.8/3 2.2/3 3.2/3 4.1/3 0.4/3 2.5/3 0/1 0.7/3
Ophiothrix fragilis 92 7.7/3 10.5/3 38.9/3 24.9/3 5/3 1.7/3 5.5/3 0/2 0.1/2
Mytilus edulis 88 1.7/3 0/2 0.4/3 1.9/3 0.1/3 0.1/3 0.4/3 0/2 0.1/2
Stenothoe marina 88 0.3/2 0.1/3 0/1 0/3 0.3/3 0.2/3 0.3/3 0.6/3 0.1/3
Monocorophium sextonae 81 0.2/3 0.1/3 0/3 0/3 0.1/3 0.5/3 0/3 0/1
Oerstedia dorsalis 81 0.3/2 0.3/2 0.2/2 1.3/3 0.5/2 0.8/3 0.4/3 0.1/2 1.2/3
Pisidia longicornis 81 4.3/2 9.3/3 9.6/3 9.5/3 7/3 1.3/3 3.5/3 0/1 0/1
Stenothoe valida 81 0.4/3 0.5/3 0.3/3 0.8/3 1.9/3 0.2/3 3.7/3 0/1
Electra pilosa 77 0.2/3 0.4/3 0.4/3 6.4/3 0.9/3 0.3/3 0.1/2 0.1/1
Pilumnus hirtellus 77 0.3/3 1.1/2 0.7/3 1.2/3 0.7/3 0.1/3 0.5/3 0/1
Lanice conchilega 74 0/1 0/1 0.2/3 0.1/3 0.1/3 0.4/3 0.1/3 0.5/3
Lepidonotus squamatus 74 0.5/3 0/2 0.2/2 1.1/3 0.2/3 0.2/3 0.4/2 0/2
Stenothoe monoculoides 70 0/2 0.1/3 0.1/3 0.5/3 0.1/3 0/1 0.1/3 0/1
Caprella tuberculata 66 1/3 0.4/3 0.6/3 6.4/3 0/2 1/3 0/1
Metopa alderi 66 0/2 0.5/3 0.1/2 0.6/3 0.4/3 0.1/3 0/1 0/1
Asterias rubens juv. 62 0/2 0.2/3 0.1/3 0.1/3 0.8/3 0.3/3
Phyllodoce mucosa 62 0/2 0/1 0.1/3 0.1/2 0.1/2 3.1/3 0.4/2 0/2
Amphipholis squamata 59 0/3 0.2/3 0.3/3 0/2 0/2 0/2 0/1
Pomatoceros triqueter 59 2.8/2 2.6/3 6.7/3 1.4/2 0.5/2 0.3/2 0.4/2
Dendronotus frondosus 55 0.7/3 15.9/3 3.8/2 9.7/3 5.7/2 0/1 0.1/1
Cuthona sp. 51 0.2/3 0/1 0.1/3 0/2 0/2 0/1 0.4/2
Eulalia viridis 51 0/2 0.1/1 0.1/1 0.1/3 0/3 0/1 0.2/3
Psammechinus miliaris 51 0/2 0.1/2 0.6/3 0.1/3 0/2 0/2
Sabellaria spinulosa 51 0.8/2 3.6/2 0.2/2 0.2/2 0/1 0.5/3 0.1/1 0/1
Syllis gracilis 51 0/2 0/2 0/2 0/2 0/1 0/2 0.2/3
Offshore sites
Aequipecten opercularis 91** 0.3/3 0.3/3 0.5/3 0.1/2 0/1 0/1
Pomatoceros triqueter 76** 2.8/2 2.6/3 6.7/3 1.4/2 0.5/2 0.3/2 0.4/2
Actiniaria 68** 3.9/3 13.5/3 9.3/3 2.6/3 1.9/3 4.8/3 5.2/3 0.2/2 0.7/2
Ophiothrix fragilis 67** 7.7/3 10.5/3 38.9/3 24.9/3 5/3 1.7/3 5.5/3 0/2 0.1/2
Psammechinus miliaris 67* 0/2 0.1/2 0.6/3 0.1/3 0/2 0/2
Sabellaria spinulosa 58* 0.8/2 3.6/2 0.2/2 0.2/2 0/1 0.5/3 0.1/1 0/1
Heteranomia squamula 55** 0/2 0.1/2 0.3/2 0/3 0/1 0.1/2
Musculus sp. 54** 0/2 0/1 0/2 0/1
Nereis pelagica 53** 2.2/2 0.2/2 1.4/1 0/1 0.2/1
Pisidia longicornis 52* 4.3/2 9.3/3 9.6/3 9.5/3 7/3 1.3/3 3.5/3 0/1 0/1
Intermediate sites
Dendronotus frondosus 80** 0.7/3 15.9/3 3.8/2 9.7/3 5.7/2 0/1 0.1/1
Stenothoe valida 80** 0.4/3 0.5/3 0.3/3 0.8/3 1.9/3 0.2/3 3.7/3 0/1
Electra pilosa 76** 0.2/3 0.4/3 0.4/3 6.4/3 0.9/3 0.3/3 0.1/2 0.1/1
Phtisica marina 71** 0.1/3 0.3/3 0.6/3 1.3/3 1.7/3 0.2/3 0.6/3 0.1/2 0/3
Tubularia indivisa 69** 100.7/3 92.5/3 153.4/3 361.6/3 399.6/3 86.4/3 366.1/3 20.3/3 20/3
Phyllodoce mucosa 65* 0/2 0/1 0.1/3 0.1/2 0.1/2 3.1/3 0.4/2 0/2
Harmothoe spp. 62** 0.6/3 0.8/3 2.2/3 3.2/3 4.1/3 0.4/3 2.5/3 0/1 0.7/3
Asterias rubens juv. 62** 0/2 0.2/3 0.1/3 0.1/3 0.8/3 0.3/3
Stenothoe monoculoides 58* 0/2 0.1/3 0.1/3 0.5/3 0.1/3 0/1 0.1/3 0/1
Sycon ciliatum 57** 0.1/1 4.5/3 0.1/1 6.3/2 0.4/1
Lepidonotus squamatus 57* 0.5/3 0/2 0.2/2 1.1/3 0.2/3 0.2/3 0.4/2 0/2
Syllis gracilis 57** 0/2 0/2 0/2 0/2 0/1 0/2 0.2/3
Metopa alderi 53 0/2 0.5/3 0.1/2 0.6/3 0.4/3 0.1/3 0/1 0/1
Coastal sites
Tubularia larynx 97** 2.1/1 0.7/1 59.9/3 3/3
M. acherusicuma 83** 0/3 0.1/2
(continued on next page)
338 V. Zintzen et al. / Estuarine, Coastal and Shelf Science 76 (2008) 327e344
Table 4 (continued )
Species Ind-Val (%) Birkenfels Callisto Garden city Kilmore John Mahn Duc de
Nomandie
LCT457 Bourrasque LST420
Stenothoe marina 50 0.3/2 0.1/3 0/1 0/3 0.3/3 0.2/3 0.3/3 0.6/3 0.1/3
Catriona gymnota 50** 1.7/3
Metridium senile 50** 59.2/2 3.6/1
Obelia bidentata 50** 2/2 0/1
Garden City
Psammechinus miliaris 68 0/2 0.1/2 0.6/3 0.1/3 0/2 0/2
Odontosyllis fulgurans 55** 0/1 0/3 0/1 0/1 0/1 0/1 0/1
Birkenfels
e e e e e e e e e e e
Callisto
Eulalia aurea 70** 0/1 0.1/3 0/1
Polyclinum aurantium 64* 1/2 0/1
Molgula cf occulta 58* 0.1/2 0.5/2
Kilmore
Scrupocellaria scruposa 79** 0/2 0.2/3
Electra pilosa 72** 0.2/3 0.4/3 0.4/3 6.4/3 0.9/3 0.3/3 0.1/2 0.1/1
Caprella tuberculata 67** 1/3 0.4/3 0.6/3 6.4/3 0/2 1/3 0/1
Amphipholis squamata 55* 0/3 0.2/3 0.3/3 0/2 0/2 0/2 0/1
Stenothoe monoculoides 53** 0/2 0.1/3 0.1/3 0.5/3 0.1/3 0/1 0.1/3 0/1
Duc de Normandie
Myxilla rosacea 74** 0.8/1 0.6/1 4.1/3
Halichondria cf panicea 54* 0.4/1 1.9/2
John Mahn
e e e e e e e e e e e
LCT 457
Phyllodoce mucosa 81** 0/2 0/1 0.1/3 0.1/2 0.1/2 3.1/3 0.4/2 0/2
Syllis gracilis 75** 0/2 0/2 0/2 0/2 0/1 0/2 0.2/3
Nemertinata sp. 58* 0/1 0.2/2
Turbellaria 57* 0/1 0.1/2
Asterias rubens juv. 52** 0/2 0.2/3 0.1/3 0.1/3 0.8/3 0.3/3
Monocorophium sextonae 50** 0.2/3 0.1/3 0/3 0/3 0.1/3 0.5/3 0/3 0/1
Bourrasque
Catriona gymnota 100** 1.7/3
Tubularia larynx 91** 2.1/1 0.7/1 59.9/3 3/3
Balanus crenatus 66* 0/1 0.5/2
Obelia bidentata 65* 2/2 0/1
Metridium senile 62* 59.2/2 3.6/1
LST 420
Eumida sp. 60** 0/1 0/3
M. acherusicuma 51 0/3 0.1/2
a Monocorophium acherusicum.
Guichard and Bourget, 1998; Badalamenti et al., 2002). Beingcost- and time-consuming, it remains an unavoidable methodof obtaining quantitative data on epifaunal assemblages ofhard structures.
Quantitative sampling in an area dominated by Tubulariaspp. was relatively easy to implement for the major part ofthe fauna. Most of the species stayed in close contact to thetubulariids, preventing them to be washed away by currents.However, the encrusting fauna was not easily sampled, espe-cially the calcareous species (like the tube-worms Pomato-ceros triqueter and the barnacle Balanus crenatus) andSabellaria spinulosa which form a crust difficult to manuallyscrape. Also, it was observed that a large amount of encrustingsponges (mainly Halichondria panicea) was present between
the encrusting species and we were unable to sample themquantitatively. As a consequence, the values of biomass notedfor these species have to be considered as minimal if notunderestimated.
The general limited visibility conditions on the sites (3e5 mat the shipwreck depth for the period under study) and to thecryptic nature of most of the fauna caused the relatively lowresolution of the photographic material.
4.2. Environmental factors
The BPNS can be effectively divided into three distinctiveareas according to their environmental conditions: (1) a coastalzone characterized by shallow-waters, a high suspended matter
339V. Zintzen et al. / Estuarine, Coastal and Shelf Science 76 (2008) 327e344
load, reduced current speed and a freshwater influence; (2)a transition zone with intermediate depths, turbidity valuesand the strongest currents; and (3) an offshore zone withdeeper waters, lowest turbidity and high current speed. Epifau-nal communities can be affected by all or part of these param-eters independently. Their possible effects are discussed next.
4.3. The Metridium senile community
The Metridium senile community dominated in the shal-lower waters (LST420, Bourrasque and LCT457) while itwas at most present or poorly developed on intermediate sitesand almost absent on offshore sites. On sites where M. senilewas less abundant, it was mostly found on overhangs or onvertical surfaces with some protection from the prevailing cur-rents. In Helgoland, M. senile together with Pomatocerostriqueter was largely represented on shallow natural hard sub-strata where light was sufficiently attenuated to prevent algaegrowth (Kluijver, 1991). It was also only dominating on verti-cal cliffs. It was noted by divers that shipwrecks lying at 2nautical miles from the Monterey Bay coast (California,USA) were covered with Metridium farcimen at a depth of95 m. Whomersley and Picken (2003) also pointed at the dom-inance of M. senile up to depths of 140 m on offshoreplatforms in the North Sea, indicating that its poor representa-tion on deeper shipwrecks in Belgian waters may not strictlybe depth dependant. In Belgian waters, M. senile might preferrelatively shallow waters because of the higher production orbecause the hydrodynamic regime or physical environmentis favourable to that species, consequently finding an adaptiveadvantage to Tubularia spp., its direct competitors. The preycapture by M. senile is a function of both flow regime andbody size (Anthony and Svane, 1995). The flux of the seston,rather than a high concentration seems to be important for thegrowth of M. senile (Lesser et al., 1994). However, we notethat the current velocities observed on the coastal sites werelower compared to further offshore and that the coastal watershad a high load of particulate matter. It may be that the flux ofthe material was above the upper limit for efficient capture inthe intermediate and offshore sites.
Table 5
BIO-ENV results from double square root-transformed cover data. Bray-Curtis
similarity was used for biotic data and Euclidean distance for normalized abi-
otic data. Correlation (R) based on spearman rank coefficient. Combinations
with maximal five factors are showed. Significance test was calculated based
on 999, 499 and 199 random permutations of sample names for 1e2, 3 and
4e5 variables, respectively. See text for parameter abbreviations
# var. R Variables Permutation test sign
1 0.393 Depth 1%
1 0.379 TSM-1 1%
1 0.364 S1 1%
1 0.343 C100-75 1%
1 0.329 C50-25 1%
2 0.397 TSM-1, Depth 1%
3 0.398 S1, Depth, C100-75 1%
4 0.401 S1, Depth, Sec, C100-75 1%
5 0.401 Tmax, S1, Depth, Sec, C100-75 1%
One non-exclusive hypothesis explaining the success ofMetridium senile in shallow-waters could be its better resistanceto major climatic events. During winter time, the shallow-watersites are under the regular influence of storms (Houthuys et al.,1994; Posey et al., 1996). In deeper waters, the influence ofstrong winds is decreased by a diminished wave action. Hughes(1983) claimed that the detachment of Tubularia indivisa wasunlikely to be a significant source of mortality unless suchdetachment was hastened by the growth of other animals likebarnacles. Barnacles (Balanus crenatus) were noted to be a con-spicuous element of the coastal shipwrecks only. The combinedeffect of increased influence of storms and the abundance of B.crenatus in coastal waters could lead to an increased rate ofwinter mortality for T. indivisa through dislodgment. Afterthe removal of T. indivisa, the bare surface may be easily colo-nized by M. senile because its asexual reproduction by pedallaceration and its capability of oriented locomotion make ita very strong competitor for space (Anthony and Svane,1995). Further, the gamete production of T. indivisa in winteris very low and not capable of fast colonization of bare spaces(Hughes, 1983).
4.4. The Tubularia spp. community
Tubularia indivisa composed the bulk of the cover and bio-mass on intermediate and offshore sites, while a mixture of T.indivisa and Tubularia larynx occurred on the coastal sites.These species are common on many waters around the world(Pyefinch and Downing, 1949; Schmidt, 1983; Foster et al.,1994; Lemire and Bourget, 1996; Orlov, 1996; Steimle andZetlin, 2000; Collins et al., 2002), but they are rarely said tobe the dominant feature of a community. On the shipwreckslocated a few hundreds of km north of our study sites, T. lar-ynx was present only at an early colonization stage on a recentsunken vessel (Leewis et al., 2000) and T. indivisa was notcovering large surfaces (van Moorsel et al., 1991). In UKwaters, T. indivisa was found on circalittoral rocky habitatsand could have a large cover on sounds, narrows and aroundtide-swept promontories in accelerated tidal streams in associ-ation with Balanus crenatus and Alcyonium digitatum (Doodyet al., 1993). Tubularia indivisa was replacing Metridiumsenile and became dominant on UK shipwrecks where tidalcurrents were strong (Connor et al., 2004).
Tubularia species have a chitinous cylindrical perisarc ofup to 10 cm and this surface is used by a variety of epibionts.The widely contribute to the establishment of the biologicaldiversity on shipwrecks by providing increased surface of set-tlement. In terms of abundance (up to 180,000 ind m�2) andbiomass (173 g AFDW m�2), the amphipod Jassa herdmaniwas the most common of these epibionts. Caprellids (Caprellatuberculata and Phtisica marina) were also abundant (up to1700 ind m�2 and 9360 ind m�2, respectively). Gili et al.(1996) found that Tubularia larynx fed mainly on copepods,nauplii larvae and crustaceans eggs and that their prey sizecould reach 3 mm. Genzano (2005) studied the trophic ecol-ogy of Tubularia crocea and found that juveniles of Jassa fal-cata and caprellids were among its most abundant prey items.
340 V. Zintzen et al. / Estuarine, Coastal and Shelf Science 76 (2008) 327e344
He noted that these two species were known to live in closeassociation to the perisarc of the hydroid. The Tubularia spe-cies could well benefit of the large abundance of the amphi-pods in its diet while in turn, the amphipods see theirsurface of attachment largely increased by the presence ofTubularia spp. However, Ostman et al. (1995) performedprey-capturing experiments on T. larynx revealing that crusta-ceans like Monocorophium sp. and caprellids were not takenby the polypes while Artemia nauplii and small planktoniccrustaceans were fed upon.
4.5. Biomass on shipwrecks
The mean epifauna biomass of the nine Belgian shipwreckswas estimated at 288 g AFDW m�2. On shipwrecks in theDutch sector of the North Sea, Leewis et al. (2000) founda mean biomass value of 642 g AFDW m�2. Many of theirsamples were taken in a Metridium senile assemblage whichwas only one of the discerned assemblages in their study. InLeewis’ study, the average biomass of that community was1072 g AFDW m�2 and it was the highest observed on Dutchshipwrecks. That value is comparable to the mean biomassvalue of 1243 g AFDW m�2 (N ¼ 14, unpublished data) werecorded for the M. senile assemblages of the coastal sites.
In the Oosterschelde, a marine bay with reduced tidal influ-ence, mean epifauna biomass on a rocky seabed was estimatedto be 286 g AFDW m�2 (Leewis et al., 1994). On pebbles inthe Dover Strait, Migne and Davoult (1997) estimated a meanvalue of 281 g AFDW m�2.
Our biomass values are among the highest recorded valuesfor epibenthic communities in temperate waters. Kuhne andRachor (1996) recorded 30e180 g AFDW m�2 for the macro-fauna of a stony sand area in the German Bight of the NorthSea. The dry weight of the macrofauna of hard substrata inthe Bristol Channel was found to be 24.5 g m�2 (dry weight)(George and Warwick, 1985). Steimle (1985) also reporteda lower (wet weight) value of 238 g m�2 for the macrofaunain the New York Bight. In comparison, the literature valuesfor the macrofauna of soft sediments in the southern NorthSea were around 10 g AFDW m�2 (Duineveld et al., 1991;Heip et al., 1992) and around 30e50 g AFDW m�2 for theAbra alba community (Prygiel et al., 1988). Consequently,we can conclude that even if the surface covered by ship-wrecks is a very small percentage of the BPNS, they mayconcentrate locally a significant part of the biomass.
4.6. Spatial variability
Coastal sites showed a clear pattern of decreased speciesrichness compared to the sites located further from the coast.However, species richness was not significantly different be-tween the intermediate and offshore sites and the evennessand taxonomic components of diversity within the shipwreckfauna did not show any clear pattern with distance from thecoast. The average taxonomic distinctness and variation in tax-onomic distinctness were not able to discriminate betweensites with varying environmental conditions. This failure was
already observed in other studies (Somerfield et al., 1997;Mouillot et al., 2005) and it seems that these indices couldbe more related to long-term structural changes in ecosystemprocesses than to small-scale variations (Ramos Mirandaet al., 2005). Multivariate analysis refined the clustering ofthe sites by separating the coastal, intermediate and offshoresites. The primary difference on coastal and other sites wasdue to the dominance of Tubularia larynx which replacedTubularia indivisa. The biomass of T. indivisa was lower onthe offshore sites than on intermediate sites. An explanationcould be the lower productivity of the offshore waters linkedto a decrease in suspended sediments (our results and Fettweisand Van den Eynde, 2003). The fauna of the Duc de Norman-die was distinctive from intermediate sites because of a lowerbiomass of T. indivisa. The other constituents of its epifaunawere, however, not different. Another source of variability inlocal epibenthic communities could find its origin in the natureof the water masses. Channel water is under the influence ofthe Atlantic waters and penetrates into the southern NorthSea through the English Channel. The physical, chemicaland biological composition of these water masses are differentfrom those of coastal systems (Otto et al., 1990). M’harzi et al.(1998) showed that the zooplankton composition from theBelgian offshore waters differed significantly from the coastalwaters, suggesting that the larvae supply could differ betweenthe two areas.
One of the most ecologically important gradients is thecross-shore gradient on the coastal area where environmentalfactors can drastically change at the scale of a few km withstrong repercussions on community structure. On the BPNS,Govaere et al. (1980) distinguished three macrobenthic zones:a coastal zone with a set of species and abundance poor com-munities, a species and abundance rich transition zone anda species rich e abundance poor open sea zone. This patternwas not confirmed by the more recent and larger study ofVan Hoey et al. (2004, 2005) who discerned an associationof species rich and poor assemblages on the coastal zoneand species poor offshore. The coastal sites in our resultsare characterized by the dominance of species poor commu-nity, while intermediate and offshore sites are richer. For theepifauna, the high productivity and high turbidity of thecoastal zone do not allow for the development of speciesrich community, maybe because the disturbance introducedby the turbidity variable is very high and only permit the de-velopment of a limited set of species (i.e. Metridium senile).
The analysis of indicator species revealed that a large num-ber of species were typical of shipwrecks in general. It showedup that no taxa were exclusively indicative of some of thegroupings, but that some taxa were more common or hada higher biomass at some locations in the BPNS. Among thesecommon taxa, many were carnivorous polychaetes (Harmo-thoe spp., Lepidonotus squamatus, Phyllodoce mucosa, Eulaliaviridis and Syllis gracilis) certainly feeding on the largeamount of available amphipods (Wolff, 1973; Fauchaldand Jumars, 1979). Some filter feeding crustaceans werevery common on shipwrecks: Jassa herdmani, Monocoro-phium sextonae, Stenothoe marina, Stenothoe monoculoides,

341V. Zintzen et al. / Estuarine, Coastal and Shelf Science 76 (2008) 327e344
Metopa alderi, Phtisica marina, Caprella tuberculata andPisidia longicornis. The latter species, an anomouran, wasfound in large densities on pebbles in the Dover Strait (Car-pentier et al., 2005) and could initially have colonized theshipwrecks on the BPNS. However, all the amphipod popula-tions observed under the binocular contained carrying eggsfemales, suggesting that the shipwreck populations are prob-ably self sustaining or at least linked to each other throughdispersal of larvae or juveniles.
The most indicative species of the offshore sites were Ae-quipecten opercularis and Pomatoceros triqueter. van Moorselet al. (1991) also reported P. triqueter to be typical for off-shore Dutch shipwrecks. Aequipecten opercularis was presentas juveniles (shell of less than 15 mm) at rather high densities(mean value: 120 ind m�2). They use the perisarc of Tubulariaspp. as an attachment site before leaving that hard substratumto start their benthic life. Actinarians (mainly represented byDiadumene cincta) and Ophiothrix fragilis were also moreabundant on offshore sites. The mean density of the ophiuroidwas 900 ind m�2 with a maximum value of 3650 ind m�2 forone sample. Similar to the Mediterranean Sea (Turon et al.,2000), we observed a massive recruitment of juvenile O. fra-gilis on sponges. The young recruits (less than 1 mm in discdiameter) are intimately packed on the sponges. This behav-iour is seen as a trophic association since O. fragilis takesadvantage of the inhalant currents created by the sponges(Turon et al., 2000). Ophiothrix fragilis is abundantly repre-sented on the pebble areas of the deeper waters in the EnglishChannel (Ellis and Rogers, 2000) where suitable hydrody-namic conditions are met for the formation of large beds (tidalcurrents 10e25 cm s�1 and low sedimentation rates) (Davoult,1990; Ellis and Rogers, 2000). It adopts a gregarious behav-iour (Broom, 1975). Exchange with the dense population ofthe Dover Strait might occur as supported by simulation of lar-vae dispersal (Lefebvre et al., 2003). Populations of O. fragilison Belgian shipwrecks may form an extension of the DoverStrait populations since the shipwrecks provide a recruitmentsurface for the juveniles, an anchorage area in the Tubulariaspp. and favourable hydrodynamic conditions on the elevatedground.
On intermediate sites, only two species (Dendronotus fron-dosus and Sycon ciliatum) were typical. Dendronotus frondo-sus is a predator of Tubularia indivisa (Thompson andBrown, 1976; Hughes, 1983). Except for Tubularia larynx,the coastal sites shared a single characteristic species: thetube building amphipod Monocorophium acherusicum. Atthe individual site level, it was a set of species with a superiorlevel of biomass which identified the community and few spe-cies were entirely indicative of a particular location. An excep-tion was the nudibranch Catriona gymnota which wasobserved on all samples of a single site (Bourrasque). It feedson the stems of T. indivisa.
The spatial distribution pattern of some species is difficultto explain. For example, the amphipod Caprella tuberculatawas absent from coastal sites but occurred in large numberson the intermediate and offshore sites (average density:3219 ind m�2). However, on one site (John Mahn), it was
found in only very low abundance (21 ind m�2) and it was ab-sent from the LCT457. Both sites were only 16 km on the Eastof the Kilmore where the average density of C. tuberculatareached 22,677 ind m�2. One cannot exclude that the sampleswere taken on these intermediate sites on locations that did notfavour the development of the caprellid species. The orienta-tion of the shipwrecks versus the dominant direction of thewater current could also account for the observed pattern. An-other possible reason could be small scale changes in environ-mental parameters that do not allow for its recruitment.Caprellid species are known to be susceptible to tributyltin(TBT) exposures (Ohji et al., 2003a,b, 2004). The embryo sur-vival rate of caprellids can decline in concentration of TBT aslow as what is known for the water column of the Scheldt Es-tuary (1e20 ng l�1, Monteyne, pers. com.). The LCT457 andJohn Mahn are located on the East of the anchorage areawhere ships wait for pilots. The residual currents run to theeast of this anchorage area and the LCT 457 and John Mahncould receive increased concentrations of TBT. However, ifTBT was the reason for the low density of C. tuberculata onthese two sites, it is surprising that the Duc de Normandie,which is located in the anchorage zone, would not havebeen affected. Further analysis of TBT in individuals and wa-ter column would be needed to evaluate this effect. The lowdensity of C. tuberculata could also originate from a low larvalsupply for the LCT 457 and John Mahn. However, it is highlyunlikely that specific current patterns may prevent its dispersalto these sites since the distribution of a greater number ofspecies would then need to be affected.
Sites located very close to each other showed nonethelessdifferences in their epifaunal communities. The Birkenfelsand Callisto are less than three nautical miles apart whilethe densities of many shared taxa differed and 43% of thetaxa were present in only one of the two sites. Neither wreckage, substrate type nor distinct abiotic factors can explain theobserved variation in densities. Possibly, samples could havebeen collected on surfaces that favoured or excluded the oc-currence of some species. Maybe the number of sampleswas insufficient for correctly estimating the alpha diversity.The most plausible explanation lies in the orientation and/orconfiguration of the shipwrecks towards the dominant currentdirection. The Birkenfels orientation was almost perpendicularto the dominant currents while the orientation of the Callistodiffers by 35� with the Birkenfels. It may alter the settlement,recruitment and dispersion of some species as well as the sed-imentation rate and seston flux (Baynes and Szmant, 1989).
Finally, from the work achieved on UK shipwrecks (Connoret al., 2004), the EUropean Nature Information System (EU-NIS) classifies this habitat as the ‘‘Alcyonium digitatum andMetridium senile on moderately wave-exposed circalittoral steelwrecks’’ (Habitat code: A4.721, http://eunis.eea.europa.eu/habitats-factsheet.jsp?tab¼0&idHabitat¼5539). Around UKwaters, wrecks that are subject to moderately strong to weaktidal streams are dominated by M. senile, A. digitatum and Acti-nothoe sphyrodeta while those located where tidal streamstrength is elevated may be densely covered by Tubularia indi-visa. We also observe a dominance of T. indivisa where the
342 V. Zintzen et al. / Estuarine, Coastal and Shelf Science 76 (2008) 327e344
current is the strongest and a dominance of M. senile on ship-wrecks exposed to less strong tidal streams. However, A. digita-tum and A. sphyrodeta were mostly observed on the offshoresites (strong current), not especially associated with M. senile.The vagile epibenthos of the UK classification share severalspecies like the decapods Cancer pagurus and Necora puber.To our knowledge, the information concerning shipwreck faunain the North Sea is limited to the work of Hiscock (1980) in UKwaters and the paper of Leewis et al. (2000) in The Netherlands.The comparison of their faunal list with our results indicatesa clear dominance of the cnidarians, mostly Tubularia spp.and M. senile, with many other epifaunal species in commonlike barnacles and amphipods (caprellid species and tube-building amphipods). Nonetheless, many accompanyingspecies are typical of the local/regional species spool and arenot shared between sites.
Acknowledgements
The authors wish to thank the crews of the R.V. Zeeleeuwand R.V. Belgica for their help during the sampling campaignsand to Celine Delforge for the great help during the sortingprocess. It’s also our pleasure to thank all the people whohelped collecting the samples: Drs Y. Laitat, A. Simon, D.Delbare, E. Vanden Bergh, T. Schils, Ms C. Delforge and R.Gyssens and Mrs P.B. Demoulin, G. Rooms, D. Marsham, F.Cray, M. Van Espen, Y. Verkemping, M. Backx, J.P. DeBlauwe, J. Haelters, F. Hernandez, F. Darchambeau, G. VanHoydonck, A. Vanhaelen, R. Knuts & P. Van de Steen. UGent(G. de Smet and M. Steyaert) helped for the pigment analysis.We thank also Dr A. Cattrijsse for his careful reading of anearly version of the manuscript. This study has been finan-cially supported by a ‘plan Action II’ grant (contract N�
WI/36/C04) from the Belgian Science Policy. The second au-thor is grateful to MUMM BMDC for data, REMSEM groupfor the availability of satellite data and Model groups formodel results availability. His participation to this study hasbeen funded by BEWREMABI project (Belgian Science Pol-icy). J.M. is a research associate of the FRNS. Finally, wethank two anonymous reviewers for their constructive remarkson the manuscript.
References
Anderson, M.J., 2001. A new method for non-parametric multivariate analysis
of variance. Austral Ecology 26, 32e46.
Anthony, K.R.N., Svane, I., 1995. Effects of substratum instability on locomo-
tion and pedal laceration in Metridium senile (Anthozoa: Actiniaria).
Marine Ecology-Progress Series 124, 171e180.
Bacchiocchi, F., Airoldi, L., 2003. Distribution and dynamics of epibiota on
hard structures for coastal protection. Estuarine, Coastal and Shelf Science
56, 1157e1166.
Badalamenti, F., Chemello, R., D’Anna, G., Ramos, P.H., Riggio, S., 2002.
Are artificial reefs comparable to neighbouring natural rocky areas? A
mollusc case study in the Gulf of Castellammare (NW Sicily). ICES Jour-
nal of Marine Science 59, S127eS131.
Baynes, T.W., Szmant, A.M., 1989. Effects of current on the sessile benthic
community structure of an artificial reef. Bulletin of Marine Science 44,
545e566.
Bray, J.R., Curtis, J.T., 1957. An ordination of the upland forest communities
of Southern Wisconsin. Ecological Monographs 27, 325e349.
Brey, T., 1986. Formalin and formaldehyde-depot chemicals: effects on dry
weight and ash free dry weight of two marine bivalve species. Meeresfor-
schung 31, 52e57.
Broom, D.M., 1975. Aggregation behaviour of the brittle-star Ophiothrix
fragilis. Journal of the Marine Biological Association of the UK 55,
191e197.
Bulloch, D.K., 1965. The development of the wreck Pinta as a marine hab-
itat. Underwater Naturalist Bulletin of the American Littoral Society 31,
17e32.
Carpentier, A., Vaz, S., Martin, C.S., Coppin, F., Dauvin, J.-C., Desroy, N.,
Dewarumez, J.M., Eastwood, P.D., Ernande, B., Harrop, S., Kemp, Z.,
Koubbi, P., Leader-Williams, N., Lefebvre, A., Lemoine, N., Loots, C.,
Meaden, G.J., Ryan, N., Walkey, M., 2005. Eastern Channel Habitat Atlas
for Marine Resource Management (CHARM). European Program Interreg
IIIA, 225 pp. Available from http://charm.canterbury.ac.uk/.
Carr, M.H., Hixon, M.A., 1997. Artificial reefs: the importance of comparisons
with natural reefs. Fisheries 22, 28e33.
Clarke, K.R., 1999. Nonmetric multivariate analysis in community-level
ecotoxicology. Environmental Toxicology and Chemistry 18, 118e127.
Clarke, K.R., Warwick, R.M., 1998. A taxonomic distinctness index and its
statistical properties. Journal of Applied Ecology 35, 523e531.
Clarke, K.R., Warwick, R.M., 2001a. A further biodiversity index applicable
to species lists: variation in taxonomic distinctness. Marine Ecology-
Progress Series 216, 265e278.
Clarke, K.R., Warwick, R.M., 2001b. Change in Marine Communities: An Ap-
proach to Statistical Analysis and Interpretation, second ed. PRIMER-E,
Plymouth, UK, 172 pp.
Collins, K.J., Jensen, A.C., Mallinson, J.J., Roenelle, V., Smith, I.P., 2002.
Environmental impact assessment of a scrap tyre artificial reef. ICES
Journal of Marine Science 59, S243eS249.
Connell, S.D., 2000. Floating pontoons create novel habitats for subtidal epi-
biota. Journal of Experimental Marine Biology and Ecology 247, 183e194.
Connell, S.D., 2001. Urban structures as marine habitats: an experimental
comparison of the composition and abundance of subtidal epibiota among
pilings, pontoons and rocky reefs. Marine Environmental Research 52,
115e125.
Connell, S.D., Glasby, T.M., 1999. Do urban structures influence local abundance
and diversity of subtidal epibiota? A case study from Sydney Harbour,
Australia. Marine Environmental Research 47, 373e388.
Connor, D.W., Allen, J.H., Golding, N., Howell, K.L., Lieberknecht, L.M.,
Northen, K.O., Reker, J.B., 2004. The Marine Habitat Classification for
Britain and Ireland, Version 04.05. Joint Nature Conservation Committee,
Peterborough, UK, ISBN 1 861 07561 8. http://www.jncc.gov.uk/Marine
HabitatClassification (internet version).
Costello, M.J., Emblow, C.S., White, R., 2001. European Register of Marine
Species. A check-list of the marine species in Europe and a bibliography
of guides to their identification. Patrimoines Naturels 50, 1e463.
Cusson, M., Bourget, E., 2005. Global pattern of macroinvertebrate production
in marine benthic habitat. Marine Ecology-Progress Series 297, 1e14.
Davoult, D., 1990. Biofacies et structure trophique du peuplement des caillou-
tis du Pas-de-Calais (France). Oceanologica Acta 13, 335e348.
Degraer, S., Vincx, M., Meire, P., Offringa, H., 1999. The macrozoobenthos of
an important wintering area of the common scoter (Melanitta nigra).
Journal of the Marine Biological Association of the UK 79, 243e251.
Doody, J.P., Johnston, C., Smith, B., 1993. Directory of the North Sea Coastal
Margin. Joint Nature Conservation Committee, Peterborough, UK, 262 pp.
Dufrene, M., Legendre, P., 1997. Species assemblages and indicator species:
the need for a flexible asymmetrical approach. Ecological Monographs
67, 345e366.
Duineveld, G., Kunitzer, A., Niermann, U., Dewilde, P.A.W.J., Gray, J.S.,
1991. The macrobenthos of the North Sea. Netherlands Journal of Sea
Research 28, 53e65.
Ellis, J.R., Rogers, S.I., 2000. The distribution, relative abundance and diver-
sity of echinoderms in the eastern English Channel, Bristol Channel, and
Irish Sea. Journal of the Marine Biological Association of the UK 80,
127e138.

343V. Zintzen et al. / Estuarine, Coastal and Shelf Science 76 (2008) 327e344
Fabi, G., Grati, F., Puletti, M., Scarcella, G., 2004. Effects on fish community
induced by installation of two gas platforms in the Adriatic Sea. Marine
Ecology-Progress Series 273, 187e197.
Fauchald, K., Jumars, P.A., 1979. The diet of worms: a study of polychaete
feeding guilds. Oceanography and Marine Biology e An Annual Review
17, 193e284.
Fettweis, M., Van den Eynde, D., 2003. The mud deposits and the high turbid-
ity in the Belgian-Dutch coastal zone, southern bight of the North Sea.
Continental Shelf Research 23, 669e691.
Fettweis, M., Nechad, B., Van den Eynde, D., 2007. An estimate of the sus-
pended particulate matter (SPM) transport in the southern North Sea using
SeaWiFS images, in situ measurements and numerical model results.
Continental Shelf Research 27, 1568e1583.
Forteath, G.N.R., Picken, G.B., Ralph, R., Williams, J., 1982. Marine growth
studies on the North Sea oil platform Montrose Alpha. Marine Ecology-
Progress Series 8, 61e68.
Foster, K.L., Steimle, F.W., Muir, W.C., Kropp, R.K., Conlin, B.E., 1994. Mit-
igation potential of habitat replacement e concrete artificial reef in Dela-
ware Bay e preliminary results. Bulletin of Marine Science 55, 783e795.
Galeron, J., Sibuet, M., Mahaut, M.-L., Dinet, A., 2000. Variation in structure
and biomass of the benthic communities at three contrasting sites in the
tropical Northeast Atlantic. Marine Ecology-Progress Series 197, 121e137.
Gaston, G.R., Bartlett, J.H.W., McAllister, A.P., Heard, R.W., 1996. Biomass
variations of estuarine macrobenthos preserved in ethanol and formalin.
Estuaries 19, 674e679.
Genzano, G.N., 2005. Trophic ecology of a benthic intertidal hydroid, Tubu-
laria crocea, at Mar del Plata, Argentina. Journal of the Marine Biological
Association of the UK 85, 307e312.
George, C.L., Warwick, R.M., 1985. Annual macrofauna production in a hard-
bottom reef community. Journal of the Marine Biological Association of
the UK 65, 713e735.
Gili, J.M., Hughes, R.G., Alva, V., 1996. A quantitative study of feeding by the
hydroid Tubularia larynx Ellis and Solander, 1786. Scientia Marina 60,
43e54.
Glasby, T.M., 2001. Development of sessile marine assemblages on fixed
versus moving substrata. Marine Ecology-Progress Series 215, 37e47.
Glasby, T.M., Connell, S.D., 1999. Urban structures as marine habitats. Ambio
28, 595e598.
Govaere, J.C.R., Van Damme, D., Heip, C., De Coninck, L.A.P., 1980. Benthic
communities in the Southern Bight of the North Sea and their use in eco-
logical monitoring. Helgolander Wissenschaftliche Meeresuntersuchungen
33, 507e521.
Guichard, F., Bourget, E., 1998. Topographic heterogeneity, hydrodynamics,
and benthic community structure: a scale-dependent cascade. Marine Ecol-
ogy-Progress Series 171, 59e70.
Heip, C., Basford, D., Craeymeersch, J.A., Dewarumez, J.M., Dorjes, J.,
Dewilde, P., Duineveld, G., Eleftheriou, A., Herman, P.M.J., Niermann, U.,
Kingston, P., Kunitzer, A., Rachor, E., Rumohr, H., Soetaert, K.,
Soltwedel, T., 1992. Trends in biomass, density and diversity of North Sea
macrofauna. ICES Journal of Marine Research 49, 13e22.
Hiscock, K., 1980. Marine life on the wreck of the M.V. ‘Robert’. Report of
the Lundy Field Society 32, 40e44.
Holloway, M.G., Connell, S.D., 2002. Why do floating structures create
novel habitats for subtidal epibiota? Marine Ecology-Progress Series
235, 43e52.
Houthuys, R., Trentesaux, A., De Wolf, P., 1994. Storm influences on a tidal
sandbank’s surface (Middelkerke Bank, southern North Sea). Marine
Geology 121, 23e41.
Hughes, R.G., 1983. The life-history of Tubularia indivisa (Hydrozoa: Tubu-
lariidae) with observations on the status of T. ceratogyne. Journal of the
Marine Biological Association of the UK 63, 467e479.
Jensen, A.C., 2002. Proceedings of the Seventh International Conference on
Artificial Reefs and Related Habitats. ICES Journal of Marine Research
S59, 1e362.
Jensen, A.C., Collins, K.J., Lockwood, A.P.M., 2000. Artificial Reefs in Euro-
pean Seas. Kluwer Academic Publishers, Dordrecht, 508 pp.
Keuls, M., 1952. The use of the studentized range in connection with an anal-
ysis of variance. Euphytica 1, 112e122.
Kluijver, M., 1991. Sublittoral hard substrate communities off Helgoland.
Helgolander Meeresuntersuchungen 45, 317e344.
Knott, N.A., Underwood, A.J., Chapman, M.G., Glasby, T.M., 2004. Epibiota
on vertical and on horizontal surfaces on natural reefs and on artificial
structures. Journal of the Marine Biological Association of the UK 84,
1117e1130.
Kohler, N.E., Gill, S.M., 2006. Coral Point Count with Excel extensions
(CPCe): a Visual Basic program for the determination of coral and sub-
strate coverage using random point count methodology. Computers and
Geosciences 32, 1259e1269.
Kruskal, J.B., Wish, M., 1978. Multidimensional Scaling. In: Sage University
Paper series on Quantitative Applications in the Social Sciences n�11.
Sage Publications, Beverly Hills and London, 86 pp.
Kuhne, S., Rachor, E., 1996. The macrofauna of a stony sand area in the Ger-
man Bight (North Sea). Helgolander Meeresuntersuchungen 50, 433e452.
Lanckneus, J., van Lancker, V., Moerkerke, G., Van den Eynde, D., Fettweis,
M., de Batist, M., Jacobs, P., 2001. Investigation of the Natural Sand
Transport on the Belgian Continental Shelf (BUDGET). Final report. Fed-
eral Office for Scientific, Technical and Cultural Affairs (OSTC), 104 p.
Available from http://www.belspo.be/.
Larsonneur, C., Bouysse, P., Auffret, J.-P., 1982. The superficial sediments of the
English Channel and its Western Approaches. Sedimentology 29, 851e864.
Leewis, R.J., Waardenburg, H.W., Vandertol, M.W.M., 1994. Biomass and
standing stock on sublittoral hard substrates in the Oosterschelde estuary
(SW Netherlands). Hydrobiologia 283, 397e412.
Leewis, R.J., van Moorsel, G.W.N.M., Waardenburg, H.W., 2000. Shipwrecks
on the Dutch Continental Shelf as artificial reefs. In: Jensen, A.C.,
Collins, K.J., Lockwood, A.P.M. (Eds.), Artificial Reefs in European
Seas. Kluwer Academic Publishers, Dordrecht, pp. 419e434.
Lefebvre, A., Ellien, C., Davoult, D., Thie, E., Salomon, J.C., 2003. Pelagic
dispersal of the brittle-star Ophiothrix fragilis larvae in a megatidal area
(English Channel, France) examined using an advection/diffusion model.
Estuarine, Coastal and Shelf Science 57, 421e433.
Lemire, M., Bourget, E., 1996. Substratum heterogeneity and complexity in-
fluence micro-habitat selection of Balanus sp and Tubularia crocea larvae.
Marine Ecology-Progress Series 135, 77e87.
Lesser, M.P., Witman, J.D., Sebens, K.P., 1994. Effects of flow and seston
availability on scope for growth of benthic suspension-feeding inverte-
brates from the Gulf of Maine. Biological Bulletin 187, 319e335.
Love, M.S., 2005. More Fun Than Working for a Living e Tales of 10 years of
Research on the Fishes of California Oil Platforms. Proceedings of Eighth
International Conference on Artificial Reefs and Artificial Habitats, Biloxi,
USA, p. 3.
Luyten, P.J., Jones, J.E., Proctor, R., Tabor, A., Tette, P., Wild-Allen, K., 1999.
COHERENS e A Coupled Hydrodynamic-Ecological Model for Regional
and Shelf Seas. Users Documentation. Report, Management Unit of the
Mathematical Models of the North Sea, Brussels, 914 p. Available from
http://www.mumm.ac.be.
M’harzi, A., Tackx, M., Daro, M.H., Kesaulia, I., Caturao, R., Podoor, N.,
1998. Winter distribution of phytoplankton and zooplankton around
some sandbanks of the Belgian coastal zone. Journal of Plankton Research
20, 2031e2052.
Magurran, A.E., 2004. Measuring Biological Diversity. Blackwell Science
Ltd, Oxford, UK, 256 pp.
Massin, Cl., Norro, A., Mallefet, J., 2002. Biodiversity of a wreck from the
Belgian Continental Shelf: monitoring using scientific diving. Preliminay
results. Bulletin de l’Institut Royal des Sciences Naturelles de Belgique
72, 67e72.
Migne, A., Davoult, D., 1997. Quantitative distribution of benthic macrofauna
of the Dover Strait pebble community (Eastern English channel, France).
Oceanologica Acta 20, 453e460.
Mouillot, D., Gaillard, S., Aliaume, C., Verlaque, M., Belsher, T.,
Troussellier, M., Do Chi, T., 2005. Ability of taxonomic diversity indices
to discriminate coastal lagoon environments based on macrophyte commu-
nities. Ecological Indicators 5, 1e17.
van Moorsel, G.W.N.M., Waardenburg, H.W., van der Horst, J., 1991. Het leven
op en rond scheepswrakken en andere harde substraten in de Noordzee
(1986 T/M 1990) e een synthese. In: Rapport 91.19. Bureau Waardenburg
344 V. Zintzen et al. / Estuarine, Coastal and Shelf Science 76 (2008) 327e344
bv, Culemborg, AJ Culemborg, The Netherlands, Available from: Bureau
Waardenburg bv, Postbus 365, 4100, 49 pp.
Ohji, M., Arai, T., Miyazaki, N., 2003a. Biological effects of tributyltin expo-
sure on the caprellid amphipod, Caprella danilevskii. Journal of the Marine
Biological Association of the UK 83, 111e117.
Ohji, M., Arai, T., Miyazaki, N., 2003b. Timing of sex disturbance caused by
tributyltin exposure during the embryonic stage in the caprellid amphipod,
Caprella danilevskii. Journal of the Marine Biological Association of the
UK 83, 943e944.
Ohji, M., Aral, T., Miyazaki, N., 2004. Effects of tributyltin on the survival in
the caprellid amphipod Caprella danilevskii. Journal of the Marine Biolog-
ical Association of the UK 84, 345e349.
Orlov, 1996. Biology of the White Sea hydrozoan Tubularia indivisa
(Hydrozoa, Athecata). Zoologichesky Zhurnal 75, 1294e1303.
Ostman, C., Myrdal, M., Nyvall, P., Lindstrom, J., Bjorklund, M., Aguirre, A.,
1995. Nematocysts in Tubularia larynx (Cnidaria, Hydrozoa) from Scandi-
navia and the Northern Coast of Spain. Scientia Marina 59, 165e179.
Otto, L., Zimmermann, J.T.F., Furnes, G.H., Mork, M., Saetre, R., Beccker, G.,
1990. Review of the physical oceanography of the North Sea. Netherlands
Journal of Sea Research 26, 161e238.
Pakhomov, E.A., 2003. Correction of zooplankton and benthos biomass under-
estimations from formaldehyde-preserved samples. Archive of Fishery and
Marine Research 50, 141e148.
Picken, G., 1986. Moray Firth fouling communities. Proceedings of the Royal
Society of Edinburgh B 91, 213e220.
Pison, V., Ozer, J., 2003. Operational products and services for the Belgian
coastal waters. In: Dalhin, H., Flemings, N.C., Nittis, K., Petersson, S.E.
(Eds.), Building the European Capacity in Operational Oceanography. Pro-
ceedings of the Third International Conference on EuroGOOS, Elsevier
Oceanography, series 69, pp. 503e509.
Posey, M., Lindberg, W., Alphin, T., Vose, F., 1996. Influence of storm distur-
bance on an offshore benthic community. Bulletin of Marine Science 59,
523e529.
Prygiel, J., Davoult, D., Dewarumez, J.M., Glacon, R., Richard, A., 1988. De-
scription et richesse des peuplements benthiques de la partie francaise de la
Mer du Nord. Comptes Rendus de l’Academie des Sciences, Serie III 306,
5e10.
Pyefinch, K.A., Downing, F.S., 1949. Notes on the general biology of Tubu-laria larynx Ellis & Solander. Journal of the Marine Biological Association
of the UK 28, 21e44.
Ramos Miranda, J., Mouillot, D., Flores Hernandez, D., Sosa Lopez, A., Do
Chi, T., Ayala Perez, L., 2005. Changes in four complementary facets of
fish diversity in a tropical coastal lagoon after 18 years: a functional inter-
pretation. Marine Ecology-Progress Series 304, 1e13.
Relini, G., Tixi, F., Relini, M., Torchia, G., 1998. The macrofouling on
offshore platforms at Ravenna. International Biodeterioration and Biodeg-
radation 41, 41e55.
Ricciardi, A., Bourget, E., 1998. Weight-to-weight conversion factors for
marine benthic macroinvertebrates. Marine Ecology-Progress Series 163,
245e251.
Rumohr, H., Brey, T., Ankar, S., 1987. A compilation of biometric conversion
factor for benthic invertebrates of Baltic Sea. Baltic Marine Biology
Publications 9, 1e56.
Scarborough Bull, A., Kendall, J., 1994. An indication of the process eoffshore platforms as artificial reefs in the Gulf of Mexico. Bulletin of
Marine Science 55, 1086e1098.
Schmidt, G.H., 1983. The hydroid Tubularia larynx causing ‘bloom’ of the as-
cidians Ciona intestinalis and Ascidiella aspersa. Marine Ecology-Progress
Series 12, 103e105.
Shapiro, S.S., Wilk, M.B., 1965. An analysis of variance test for normality
(complete samples). Biometrika 52, 591e611.
Smith, S.D.A., Rule, M.J., 2002. Artificial substrata in a shallow sublittoral
habitat: do they adequately represent natural habitats or the local spe-
cies pool? Journal of Experimental Marine Biology and Ecology 277,
25e41.
Somerfield, P.J., Olsgard, F., Carr, M.R., 1997. A further examination of two
new taxonomic distinctness measures. Marine Ecology-Progress Series
154, 303e306.
Stanley, D.R., Wilson, C.A., 2000. Variation in the density and species com-
position of fishes associated with three petroleum platforms using dual
beam hydroacoustics. Fisheries Research 47, 161e172.
Steimle, F., 1985. Biomass and estimated productivity of the benthic macro-
fauna in the New York Bight. Estuarine, Coastal and Shelf Science 21,
539e554.
Steimle, F.W., Zetlin, C., 2000. Reef habitats in the middle Atlantic Bight:
abundance, distribution, associated biological communities, and fishery re-
source use. Marine Fisheries Review 62, 24e42.
Thompson, T.E., Brown, G.H., 1976. British Opistobranch Molluscs. The Lin-
nean Society of London. In: Synopses of the British Fauna, No 8. Aca-
demic Press, London, 203 pp.
Turon, X., Codina, M., Tarjuelo, I., Uriz, M.J., 2000. Mass recruitment of
Ophiothrix fragilis (Ophiuroidea) on sponges: settlement patterns and
post-settlement dynamics. Marine Ecology-Progress Series 2000, 201e212.
Van Hoey, G., Degraer, S., Vincx, M., 2004. Macrobenthic community struc-
ture of soft-bottom sediments at the Belgian Continental Shelf. Estuarine,
Coastal and Shelf Science 59, 599e613.
Van Hoey, G., Vincx, M., Degraer, S., 2005. Small- to large-scale geographical
patterns within the macrobenthic Abra alba community. Estuarine, Coastal
and Shelf Science 64, 751e763.
Wetzel, M.A., Leuchs, H., Koop, J.H.E., 2005. Preservation effects on wet
weight, dry weight, and ash-free dry weight biomass estimates of four
common estuarine macro-invertebrates: no difference between ethanol
and formalin. Helgolander Meeresuntersuchungen 59, 206e213.
Whomersley, P., Picken, G.B., 2003. Long-term dynamics of fouling commu-
nities found on offshore installations in the North Sea. Journal of the
Marine Biological Association of the UK 83, 897e901.
Wolff, W.J., 1973. The estuary as a habitat, an analysis of data on the soft bot-
tom macrofauna of the estuarine area of the rivers Rhine, Meuse. Scheldt.
Zoologische Verhandelingen 126, 1e242.
Wright, S.W., Jeffrey, S.W., 1997. High-resolution HPLC system for
chlorophylls and caretenoids of marine phytoplankton. In: Jeffrey, W.,
Mantoura, R.F.C., Wright, S.W. (Eds.), Phytoplankton Pigments in Ocean-
ography: Guidelines to Modern Methods. UNESCO, Paris, pp. 327e341.
Zintzen, V., Massin, Cl, Norro, A., Mallefet, J., 2006. Epifaunal inventory of
two shipwrecks from the Belgian Continental Shelf. Hydrobiologia 555,
207e219.