Temporal and spatial variability in fall storm induced sediment resuspension on the Mid-Atlantic...
14
Research papers Temporal and spatial variability in fall storm induced sediment resuspension on the Mid-Atlantic Bight Travis Miles n , Scott M. Glenn, Oscar Schofield Coastal Ocean Observation Laboratory, Institute of Marine and Coastal Sciences, School of Environmental and Biological Sciences, Rutgers University, New Brunswick, NJ 08901, USA article info Article history: Received 15 February 2011 Received in revised form 20 July 2012 Accepted 3 August 2012 Available online 25 August 2012 Keywords: Sediment resuspension Coastal oceanography Turbulence Autonomous underwater vehicles Sediment transport Ocean observing systems abstract Storm-driven sediment resuspension is an episodic process that is an important constraint on sediment transport on continental shelves; unfortunately, the spatial variability of the resuspension and transport processes are poorly quantified using traditional sampling techniques. Using two autono- mous underwater gliders, long-range high frequency radar and buoy data, we quantified spatial variability of sediment resuspension and transport in a large fall storm in November of 2009. Wave, wind and current data in conjunction with glider profiles showed that waves and winds mixed the water column, waves initially mobilized the sediment and shear induced turbulence advected sediment throughout the water column. The separation of over 50 km between the two gliders (RU05 and RU21) is used to highlight the spatial variability of sediment resuspension. Both gliders were operating along the 40 m isobath with RU21 located 50 km north of RU05. Sediment resuspension on the New Jersey (NJ) shelf responded to synoptically forced turbulent motions. Currents transported this sediment toward the southwest in the along-shelf axis and onshore on the cross-shelf axis during the peak resuspension on November 13th through November 14th, with resuspension and transport on the southern NJ shelf measured by RU05 approximately twice that of RU21 on the northern MAB. Variability in resuspension profiles between the two gliders was largely a product of smaller mean grain sizes on the southern portion of the NJ shelf. These smaller grain sediment particles had a reduced fall velocity and were more easily retained throughout the water column by turbulent motions. Published by Elsevier Ltd. 1. Introduction Coastal storm-driven mixing events are episodic processes (Wiggert et al., 2000; Chang et al., 2001; Zedler et al., 2002) that are important for sediment transport. Despite numerous focused field campaigns on storm induced sediment resuspension (Traykovski et al., 1999; Styles and Glenn, 2002; Traykovski, 2007), the processes dominating the spatial variability of the storm response remains unresolved. The Mid-Atlantic Bight (MAB) is a region impacted by numerous physical forcing pro- cesses such as freshwater input from a complex network of rivers and estuaries, wave tidal and inertial fluctuations, variable topo- graphic features such as the Hudson Shelf Valley and the ridge and swale topography (Beardsley and Boicourt, 1981; McBride and Moslow, 1991), the shelf-break jet (Chen and He, 2010) and Gulf Stream eddies near the shelf-break, seasonal wind variability (Gong et al., 2010), the summer cold pool (Lentz, 2008) and powerful winter storms (Beardsley and Boicourt, 1981). Strong solar insolation drives the formation of the summer cold pool that results in large seasonal variations in the water column stratification between winter and summer seasons (Houghton et al., 1982; Lentz, 2003). This stratification is broken down by extra-tropical cyclones, commonly referred to as fall transition storms (Bigelow 1933, Beardsley and Boicourt, 1981). These storms result in a well-mixed water column in the winter until early spring (Lentz, 2003). The erosion of the stratification is important for the MAB ecosystem as it replenishes nutrients to the surface layer, which stimulates phytoplankton blooms (Xu et al., 2011). The winter phytoplankton bloom is the largest and most predictable biological event on the MAB (Xu et al., 2011). Resuspension of sandy sediments, which are dominant on the middle to outer-shelf of the MAB (Swift and Field, 1981; Amato, 1994; Reid et al., 2005; Goff et al., 2008), is commonly driven by fall transition storms through a combination of waves and currents (Glenn et al., 2008). For example, Styles and Glenn (2005) identified 25 sediment transport events over a 2-year period, with 63% of these events occurring in fall and winter on the MAB. A combination of waves and currents are responsible for the resuspension and transport of sediment on the continental shelf. Contents lists available at SciVerse ScienceDirect journal homepage: www.elsevier.com/locate/csr Continental Shelf Research 0278-4343/$ - see front matter Published by Elsevier Ltd. http://dx.doi.org/10.1016/j.csr.2012.08.006 n Corresponding author. Tel.: þ1 919 332 2705. E-mail address: [email protected] (T. Miles). Continental Shelf Research 63 (2013) S36–S49
-
Upload
independent -
Category
Documents
-
view
1 -
download
0
Transcript of Temporal and spatial variability in fall storm induced sediment resuspension on the Mid-Atlantic...

Continental Shelf Research 63 (2013) S36–S49
Contents lists available at SciVerse ScienceDirect
Continental Shelf Research
0278-43
http://d
n Corr
E-m
journal homepage: www.elsevier.com/locate/csr
Research papers
Temporal and spatial variability in fall storm induced sedimentresuspension on the Mid-Atlantic Bight
Travis Miles n, Scott M. Glenn, Oscar Schofield
Coastal Ocean Observation Laboratory, Institute of Marine and Coastal Sciences, School of Environmental and Biological Sciences, Rutgers University, New
Brunswick, NJ 08901, USA
a r t i c l e i n f o
Article history:
Received 15 February 2011
Received in revised form
20 July 2012
Accepted 3 August 2012Available online 25 August 2012
Keywords:
Sediment resuspension
Coastal oceanography
Turbulence
Autonomous underwater vehicles
Sediment transport
Ocean observing systems
43/$ - see front matter Published by Elsevier
x.doi.org/10.1016/j.csr.2012.08.006
esponding author. Tel.: þ1 919 332 2705.
ail address: [email protected] (T. M
a b s t r a c t
Storm-driven sediment resuspension is an episodic process that is an important constraint on sediment
transport on continental shelves; unfortunately, the spatial variability of the resuspension and
transport processes are poorly quantified using traditional sampling techniques. Using two autono-
mous underwater gliders, long-range high frequency radar and buoy data, we quantified spatial
variability of sediment resuspension and transport in a large fall storm in November of 2009. Wave,
wind and current data in conjunction with glider profiles showed that waves and winds mixed the
water column, waves initially mobilized the sediment and shear induced turbulence advected sediment
throughout the water column. The separation of over 50 km between the two gliders (RU05 and RU21)
is used to highlight the spatial variability of sediment resuspension. Both gliders were operating along
the 40 m isobath with RU21 located 50 km north of RU05. Sediment resuspension on the New Jersey
(NJ) shelf responded to synoptically forced turbulent motions. Currents transported this sediment
toward the southwest in the along-shelf axis and onshore on the cross-shelf axis during the peak
resuspension on November 13th through November 14th, with resuspension and transport on the
southern NJ shelf measured by RU05 approximately twice that of RU21 on the northern MAB.
Variability in resuspension profiles between the two gliders was largely a product of smaller mean
grain sizes on the southern portion of the NJ shelf. These smaller grain sediment particles had a reduced
fall velocity and were more easily retained throughout the water column by turbulent motions.
Published by Elsevier Ltd.
1. Introduction
Coastal storm-driven mixing events are episodic processes(Wiggert et al., 2000; Chang et al., 2001; Zedler et al., 2002) thatare important for sediment transport. Despite numerous focusedfield campaigns on storm induced sediment resuspension(Traykovski et al., 1999; Styles and Glenn, 2002; Traykovski,2007), the processes dominating the spatial variability of thestorm response remains unresolved. The Mid-Atlantic Bight(MAB) is a region impacted by numerous physical forcing pro-cesses such as freshwater input from a complex network of riversand estuaries, wave tidal and inertial fluctuations, variable topo-graphic features such as the Hudson Shelf Valley and the ridgeand swale topography (Beardsley and Boicourt, 1981; McBrideand Moslow, 1991), the shelf-break jet (Chen and He, 2010) andGulf Stream eddies near the shelf-break, seasonal wind variability(Gong et al., 2010), the summer cold pool (Lentz, 2008) andpowerful winter storms (Beardsley and Boicourt, 1981).
Ltd.
iles).
Strong solar insolation drives the formation of the summercold pool that results in large seasonal variations in the watercolumn stratification between winter and summer seasons(Houghton et al., 1982; Lentz, 2003). This stratification is brokendown by extra-tropical cyclones, commonly referred to as falltransition storms (Bigelow 1933, Beardsley and Boicourt, 1981).These storms result in a well-mixed water column in the winteruntil early spring (Lentz, 2003). The erosion of the stratification isimportant for the MAB ecosystem as it replenishes nutrients tothe surface layer, which stimulates phytoplankton blooms(Xu et al., 2011). The winter phytoplankton bloom is the largestand most predictable biological event on the MAB (Xu et al.,2011). Resuspension of sandy sediments, which are dominant onthe middle to outer-shelf of the MAB (Swift and Field, 1981;Amato, 1994; Reid et al., 2005; Goff et al., 2008), is commonlydriven by fall transition storms through a combination of wavesand currents (Glenn et al., 2008). For example, Styles and Glenn(2005) identified 25 sediment transport events over a 2-yearperiod, with 63% of these events occurring in fall and winter onthe MAB.
A combination of waves and currents are responsible for theresuspension and transport of sediment on the continental shelf.

Fig. 1. The study location and 2 km resolution mean grain size map in mm with
glider tracks from RU05(red), RU21 (blue), CODAR locations within the study
region (black triangles) and Buoys 44009 and 44025 (black squares). Only CODAR
stations in the immediate vicinity are shown, though others contributed to the
data. The deployment site for both gliders is off Tuckerton, NJ. RU21 was recovered
near the deployment site while RU05 was recovered in the south off of Delaware
Bay, near buoy 44009. Details of sediment compilation from the usSEABED
program are covered in Goff et al. (2008).
Fig. 2. RU21 depth averaged currents and offshore glider track from 10/31 to 11/05
(Top Panel) and onshore glider track from 11/10 to 11/18 (Bottom Panel). The green
line indicates the portion of the transect from 11/15 to 11/18.
T. Miles et al. / Continental Shelf Research 63 (2013) S36–S49 S37
Though non-linear interactions between waves and currentsdominate sediment resuspension, seminal work by Grant andMadsen (1979; 1896) provides a qualitative explanation of theindependent role each process plays. Wave bottom boundaryshear stress can be an order of magnitude larger than currentbottom boundary shear stress. From linear-wave theory wave-induced bottom orbital velocities have a similar magnitude tolow-frequency currents but operate over a much smaller bottomboundary layer and thus result in an observed order of magnitudelarger shear stress. Despite the high shear stress, wave velocitiesare orbital and therefore result in little net horizontal transportto first order. When sediment is suspended in the water columneven relatively minor low-frequency currents are capable ofhorizontal sediment transport.
Keen and Glenn (1995) and Styles and Glenn (2005) showstorm-induced sediment transport is generally aligned along-shelf toward the southwest through modeled and observedbottom currents during Nor’easter storms. Modeled cross-shelfsediment transport was offshore (Keen and Glenn, 1995); how-ever the observed cross-shelf component of the transport waspredominantly onshore in Styles and Glenn (2005). These obser-vations are surprising as it might be expected that Nor’eastersproduce downwelling circulation with offshore bottom transportthat is reinforced by the tides; therefore a more complex combi-nation of processes must be important.
Several processes have been hypothesized to account for theonshore transport. Potential factors include topographic interac-tions that operate over the relatively small (a few kilometers)scale of the ubiquitous ridge and swale topography of the MABinner shelf (McBride and Moslow, 1991), or over the larger (a fewtens of kilometers) scale of the topographic highs associated withancient river deltas (Glenn et al., 2004). Additionally, Gargett et al.(2004) identified full water column Langmuir cells as a significantdriver of sediment resuspension events on the Mid-Atlantic Bight.Keen and Glenn (1995) also identified tides as critical to resus-pension and transport modulation, as tidal currents can alter-nately enhance or reduce the more slowly varying storm drivencurrents. In their work, the tidal phase was important in deter-mining onshore or offshore veering of the predominant along-shore bottom current. Styles and Glenn (2005) did not observecurrent veering with tidal phase and saw onshore transport nearbottom, though their observations were limited to the 10 m waterdepth. Given this, the cross-shelf magnitude and direction ofsediment transport are still unresolved.
Shipboard observations are likely biased to fair weather con-ditions as these sampling techniques are limited by the extremeconditions experienced in storms. Benthic tripods are ideallysuited to resolve temporal variability effectively during extremeconditions but are expensive to deploy and are not designed tosample horizontal spatial variability. Recent work by Glenn et al.(2008) has demonstrated the potential of using autonomousSlocum gliders for sampling sediment transport events on thecontinental shelves. This work demonstrated that it is possible toaverage optical backscatter profiles of a single sensor and obtainresults that are consistent with the theoretical understanding ofcoastal storm induced sediment resuspension. This manuscriptbuilds on these results, using two simultaneously deployedgliders to examine the spatial and temporal variability during afall transition storm on the MAB.
Hurricane Ida, was a low pressure system that developed intoa category two hurricane over the Gulf of Mexico. Ida transitionedinto an extratropical cyclone over the southeastern United Stateson November 10th, 2009. This system, commonly referred to asNor’Ida, tracked northeastward along the eastern United Statescoast and into Canada causing extensive damage and coastalflooding. We present data from multiple gliders during Nor’Ida
over large along- and cross-shelf spatial scales and incorporateshelf-wide HF radar surface currents (Roarty et al., 2010) mea-sured with 6 km resolution for the duration of a fall transitionstorm. Both gliders started from the same location off Tuckerton,New Jersey (Fig. 1) and performed cross-shelf transects offshore.As in Glenn et al. (2008), deviation from flight paths and increasesin glider depth-averaged currents indicate storm passage. Glidertracks and depth averaged currents for RU05 and RU21 can beseen in Figs. 2 and 3. RU05 took a brief northeastward turnfollowed by a long southwestward along-isobath track, whichwas enhanced by southwestward storm induced currents. RU21finished its offshore cross-shelf transect and returned to completean onshore cross-shelf transect, with deviations as a result ofsouthwestward storm induced currents.

T. Miles et al. / Continental Shelf Research 63 (2013) S36–S49S38
2. Materials and methods
This project relied on infrastructure operated by the Mid-Atlantic Regional Association Coastal Ocean Observing System(MARACOOS) that is part of the United States Integrated OceanObserving System (U.S. IOOS) (Roarty et al., 2010; Schofield et al.,2010a). MARACOOS provides a suite of data collected by satellites,a high frequency CODAR network, and a fleet of Webb Slocumgliders (Glenn and Schofield, 2009). All of the above remotesensing techniques are coupled to a super ensemble of dataassimilative numerical ocean models (see below).
Fig. 3. RU05 glider track and depth-averaged currents between 11/10 and 11/18.
The green line indicates the onshore glider track on 11/16 to 11/18.
Fig. 4. Buoy 44009 (solid line) and 44025 (dashed line) (A) sea-level-pressure, (B) 5 m
orbital velocities for 11/10 to 11/18. Wave induced bottom orbital velocities were calc
2.1. Ocean observation dataset
A network of CODAR Ocean Sensors SeaSonde HF Radarsystems measures surface currents on the MAB. The CODARnetwork consisted of 13 5-MHz HF Radar systems located alongthe northeast of the United States (Fig. 1). The HF Radar uses theDoppler Shift of a radio signal backscattered off the ocean surfaceto measure the component of the flow in the direction of theantenna (Barrick, 1971a, 1971b; Teague, 1971). Descriptions ofthe CODAR data and its shelf-wide applications are outlined inDzwonkowski et al. (2009b) and Gong et al. (2010). The networkprovides surface current observations at the estimated equivalentdepth of 2.4 m (Stewart and Joy, 1974). To minimize the geo-metric uncertainty in the radials we used the recommendedthreshold for the Geometric Dilution of Precision (GDOP)(Chapman and Graber, 1997) value of 1.5 or less to identify thevectors with acceptable GDOP (Dzwonkowski et al., 2009a). Thisvalue is chosen based on current comparison studies usingCODAR and ship-mounted Acoustic Doppler Current Profilers(Kohut et al., 2006) and drifters (Ohlmann et al., 2007). Thespatial resolution of the final total vector current maps is 6 kmwith a typical cross-shelf range of 150 km.
Sediment mean grain size is determined by taking a regionalsubsample of a 2 km resolution interpolated sediment mapdeveloped by Goff et al. (2008) from data compiled as part ofthe usSEABED project (http://walrus.wr.usgs.gov/usseabed/). Weconvert phi units into mm grain size as the sandy sediment onlyvaries over two phi units (Fig. 1).
Oceanographic data from NOAA NDBC buoys 44009 and 44025were used in this effort (Fig. 1). The moorings provided data onatmospheric pressure, wind speed/direction, wave-height, periodand direction (Fig. 4).
wind speed, (C) wind direction (D) wave height (E) wave period and (F) bottom
ulated from linear wave theory as in Glenn et al. (2008).

T. Miles et al. / Continental Shelf Research 63 (2013) S36–S49 S39
Slocum gliders are an autonomous underwater scientific plat-form (Davis et al. 2003; Schofield et al., 2007) manufactured bythe Teledyne Webb Research Corporation. They are 1.8-m long,torpedo-shaped, buoyancy-driven vehicles with wings thatenable them to maneuver through the ocean at a forward speedof 20–30 cm s�1 in a sawtooth-shaped gliding trajectory. A fulldescription of our scientific operation of the Slocum gliders can befound in Schofield et al. (2007). Each Slocum glider has a payloadbay that houses a SeaBird conductivity–temperature–depth sen-sor and includes space for a range of additional sensors. The glideracquires its global positioning system (GPS) location every time itsurfaces, a programmable interval that was set to 3 h for thepurposes of this study. By dead reckoning along a compassbearing while flying underwater, estimates of depth averagedcurrent can be calculated based on the difference between theglider’s expected surfacing location and the actual new GPSposition. Depth averaged current measurements obtained in thismanner have been validated against stationary Acoustic DopplerCurrent Profiler data (Davis et al. 2003). These physical measure-ments are complemented with several bio-optical sensors (Glennand Schofield, 2009).
Two Webb Slocum gliders were deployed prior to November 1,2009 and operated for two weeks. During that period the gliderstraversed 1673 km underwater collecting 23,332 vertical profiles(Fig. 1). The gliders were outfitted with WetLabs Inc. EcoPucks,which provide measurements of optical backscatter, chlorophyllfluorescence and colored dissolved organic fluorescence. The
Fig. 5. RU21 Pre-storm cross sections of temperature, sa
EcoPucks measure optical backscatter at 440 (bb470) and 660(bb660) nm. Optical backscatter, to first order, is used to measurethe relative concentration of particulate matter (Roesler and Boss,2008). A growing body of work indicates that optical backscatteris not only a function of particle concentration but also sedimentcharacteristics such as refractive index, size, shape and particlecomposition (Twardowski et al., 2001; Boss et al., 2004). While wedo not characterize sediment in great detail during the measuredresuspension events, we use changes in backscatter ratios toindicate a change in character of suspended particles.
2.2. Adaptive sampling
To coordinate the numerous observed and forecast model datastreams, we were able to utilize a novel cyberinfrastructure (CI)tool set being developed as part of the Ocean Observing Initiative(OOI). The software was used to coordinate sampling using multi-model forecasts to optimize glider missions (Schofield et al.,2010b). In brief, numerical model ocean forecasts allowed thesimulation of future in situ glider trajectories. This guidance couldbe used by the team to optimize sampling based on the scienceneeds. This provided scientists with a guide to determine whetherdesired target areas could be reached by Webb Slocum gliders in apredicted current field. Thus the CI software could deliver thecommunity science needs back to the in situ observation networkin a timely manner. Field operations were coordinated through a
linity, density, bb470 and the ratio of bb470/bb660.

T. Miles et al. / Continental Shelf Research 63 (2013) S36–S49S40
web portal (http://ourocean.jpl.nasa.gov/CI) that provided anaccess point for real-time observational data and model forecasts.
3. Results
3.1. Pre-storm hydrography
Pre-storm conditions were typical for fall on the MAB withpredominantly vertical isotherms and a cross-shelf temperaturegradient. RU21, on its offshore transect (Fig. 2) between October31st and November 5th, showed a near-shore water mass thatwas approximately 1 kg m�3 lighter than offshore waters (Fig. 5).This lower density coastal water was largely due to the variabilityin salinity. Additionally, there was a warm core of water centeredat 15 m depth, on the 35 m isobath, which contributed to theregional vertical and horizontal density gradients. This gliderdata shows that New Jersey shelf waters were generally colder,saltier and denser in the offshore direction. Bb470 was low(o0.005 m�1) for the majority of the offshore pre-storm transect.There is a small region of elevated backscatter near-shore locatedbelow the pycnocline. RU21 was not programmed to dive below20 m until after it reached the 25 m isobath so the opticalbackscatter at the bottom in the near-shore region was notcompletely sampled. Pre-storm water column bb470 to bb660ratios were high (�3) relative to storm signatures (see below).There was a short period of elevated currents toward the north-east in the coastal region (Fig. 2). Prior to the storm both thegliders and CODAR (Figs. 2, 3, 6) showed variable currentsbetween 5 and 40 cm s�1 along the coast of New Jersey, withdaily averaged currents immediately prior to the storm eventsomewhat higher than the climatological mean of 5 cm s�1
(Beardsley and Boicourt, 1981).
3.2. Storm data
Buoy 44009, off of Delaware Bay, and 44025, off Long Islandare separated by approximately 230 km with 44009 encounteringNor’Ida first (Fig. 4). As the storm entered the MAB region fromthe southwest, pressure fell from above 1020 mbar at both buoysto a minimum of 1002 mbar on November 13th at 2000 Green-wich Mean Time (GMT) at 44009 and a minimum of 1007 mbaron November 13th at 2350 GMT at 44025 (Fig. 4A). Winds at bothlocations began to increase at 0000 GMT on November 11th,but peak winds at 44025 lagged 44009 by 28 h with slightlylower magnitude until they reached a maximum of 20.5 ms�1 at23:50 GMT on November 13th (Fig. 4B). Prior to November 11th
Fig. 6. Daily averaged CODAR surface currents for the New Jersey shelf for November
meters.
wind direction was variable. Between November 11th and late onthe 15th,wind direction at both buoys was from the northeast(Fig. 4C). Wave-heights began to build after a few hours of risingwinds at both locations (Fig. 4D). Wave heights reached over 8 mat 0050 GMT on November 13th at 44009 and over 6 m at0350 GMT on the 14th at 44025. Wave spectral periods werebetween 7 and 9 s for the duration of the storm at both locationsand continued to increase after storm passage, eventually peakingat �10 s on the morning of November 16th (Fig. 4E). Maximumwave bottom orbital velocities were calculated from buoy datausing linear wave theory as described by Glenn et al. (2008).Wave bottom orbital velocity estimates peaked at 2.4 m s�1 and1.8 m s�1 at buoy 44009 and 44025 respectively (Fig. 4F), sig-nificantly higher than glider depth-averaged and CODAR surfacecurrents (Figs. 2, 5, 8).
CODAR daily averaged currents (Fig. 6) were toward the south-west on November 11th and reached 30 cm s�1 on the central andsouthern MAB with values offshore nearing 50 cm s�1. CODARdaily averaged surface currents peaked in excess of 50 cm s�1
shelf-wide on the central and southern MAB on the 13th.There was a low velocity region on the northwestern MAB nearthe Hudson River outflow. Over the two days following peakvalues, shelf-wide currents decreased back to near pre-stormvalues, below �15 cm s�1.
3.3. RU21 northern glider storm variability
As Nor’Ida approached the New Jersey shelf, RU21 turnedonshore and attempted to retrace the path of its offshore transect(Fig. 2). Initially it flew southwestward along the 40 m isobathuntil it turned onshore on the 15th. Cross-sections of glidermeasurements (Fig. 7) show that during its southwestwardtransect RU21 initially measured vertically uniform temperaturesof 15 1C, salinity of 33 PSU, density near 1024.6 kg m�1, opticalbackscatter at bb470 nm was near 0 m�1 and the ratio of bb470 tobb660 was �3. Downcast vertical glider velocities were uniformat �0.3 m s�1. Vertical glider velocities were calculated by thechange in measured pressure over time and we used them toserve as a proxy for vertical water velocities. In uniform watermasses with no external turbulent forcing and the glider on a newconstant glide slope, vertical velocities should have also remainedapproximately constant except when the glider was inflectingnear-bottom or near-surface.
As winds, waves and currents increased beginning on the 11th,there was a distinct water column response. First, glider verticalvelocities began to undergo high-frequency variability of �0.1 to
11th 13th and the 15th. Black contours represent bottom topography in units of

Fig. 7. RU21 during and post-storm cross-sections of temperature, salinity, density, bb470, bb470/bb660 and downcast glider vertical velocities.
T. Miles et al. / Continental Shelf Research 63 (2013) S36–S49 S41
0.2 m s�1 through the entire water column. These vertical velo-city variations persisted through the 14th until they wererestricted to a bottom layer and eventually relaxed after the16th. As the magnitude of vertical velocities increased, tempera-tures cooled to 14 1C, salinity was elevated above 33 PSU and1025 kg m�1 density water was raised to the surface. Values ofbb470 of �0.05 m�1 were evident throughout the water columnon the 13th. The enhanced particle load remained suspendeduntil the afternoon of the 14th. Optical backscatter spectral ratioschanged from 3 to 1 as Nor’Ida impacted the region, reflecting aflattening of the backscatter spectra consistent with changes ineither particle type and/or particle size in the water-column (Bosset al., 2004).
Previous studies have clearly defined the Rouse profile abovethe wave boundary layer (Glenn et al., 2008; Styles and Glenn,2000; Glenn and Grant, 1987) as
C zð Þ ¼ C zrð Þz
zr
� � �gwf =kun½ �
ð1Þ
where C zð Þ is the concentration profile varying with depth z, C zrð Þ
is the concentration at the reference height zr, g is a constant ratioof eddy diffusivities between momentum and mass, k is vonKarman’s constant and un is friction velocity. Assuming constant g(Glenn and Grant, 1987), the slope of ln C zð Þ=C zrð Þ
� �to ln z=zr
� �is
proportional to the ratio of the fall velocity, the tendency ofsediment to fall out of the water column, to the friction velocityrepresenting the turbulent shear that acts to keep sedimentsuspended in the water column, or wf =un. In order to identifythis ratio, we use optical backscatter as a proxy for sedimentconcentration similar to Glenn et al. (2008). Optical backscatterprofiles were interpolated every 1 m in a reference frame mea-sured from the bottom and averaged over three-hours. Thesethree-hour profiles were then normalized using the backscatterobserved at a 3.5 m reference height and plotted as the lnðz=zrÞ
versus lnðbb zð Þ=bb zrð ÞÞ. The 3.5 m reference height ensures allprofiles in each three-hour segment have data at this height andabove. Normalized backscatter profiles from RU21 (Fig. 8) demon-strated Rouse-like character from the 14th at 04:24 GMT until the

Fig. 8. RU21 log-normalized profiles of optical backscatter at bb470 (red) and bb660 (black). Y-axis is the natural logarithm of depth divided by zr, a reference depth of
3.5 m. The X-axis is the natural logarithm of optical backscatter, bb, divided by the optical backscatter at the reference depth br or ln(b/bzr). Titles are timestamps of
November dd HH:MM.
T. Miles et al. / Continental Shelf Research 63 (2013) S36–S49S42
14th at 21:23 GMT. High near-surface values in rough seas arelikely due to bubbles being entrained by breaking waves. Terrillet al. (2001) has observed optical backscatter values of over0.016 m�1 inside bubble clouds.
On November 15th, at approximately 06:00 GMT, RU21 turnedonshore and left the 40 m isobath, indicated by the green sectionof Fig. 2b. As the glider entered the shallow coastal region,temperature, salinity and density remained well-mixed in thevertical while there were horizontal gradients of �1 1C, �1.5 PSUand �1.5 kg m�3 respectively (Fig. 7). On the 15th to the 18tha layer of high bb470, over 0.1 m�1, was apparent, elevated to10–15 m off the bottom (Fig. 7). Profiles (Fig. 8) show a layerrestricted below ln z=zr
� �¼ 1:5, roughly equivalent to 15 m. The
lower layer persists through the remainder of the deployment.Though winds and currents were reduced, wave-heights, wave-periods and bottom orbital velocities remained significantlyelevated (Fig. 4). Glider measured vertical velocity variabilityremained elevated in the near-bottom layer through the 16th(Fig. 7).
3.4. RU05 southern glider storm variability
Between the 10th and 16th of November, RU05 was on asouthwestward track along the 40 m isobath (Fig. 3). RU05 turnedonshore toward the mouth of the Delaware River on the 16ththrough the 18th. RU05 cross-sections (Fig. 9) show that onNovember 10th the water column was initially stratified withrelatively cool (�14 1C) and salty (�33.5 PSU) bottom water,likely a remnant of the summer cold pool. Cross-sections showthat dense bottom water was advected through the lower half ofthe water column late on the 10th into the 11th. There wereperiodic bulges of weakly stratified water (0.6–0.2 kg m�3),which grew progressively weaker until the water column wasvertically well mixed on the 16th. Similar to RU21, bb470 was lowinitially and spectral ratios of bb470 to bb660 were �3. Verticalvelocities were initially constant at �0.3 m s�1 and variations of0.1–0.2 m s�1 were apparent during elevated wind, waves andcurrents. A consistent background bb470 value of 0.05 m�1 isapparent throughout the water column, and near-bottom values
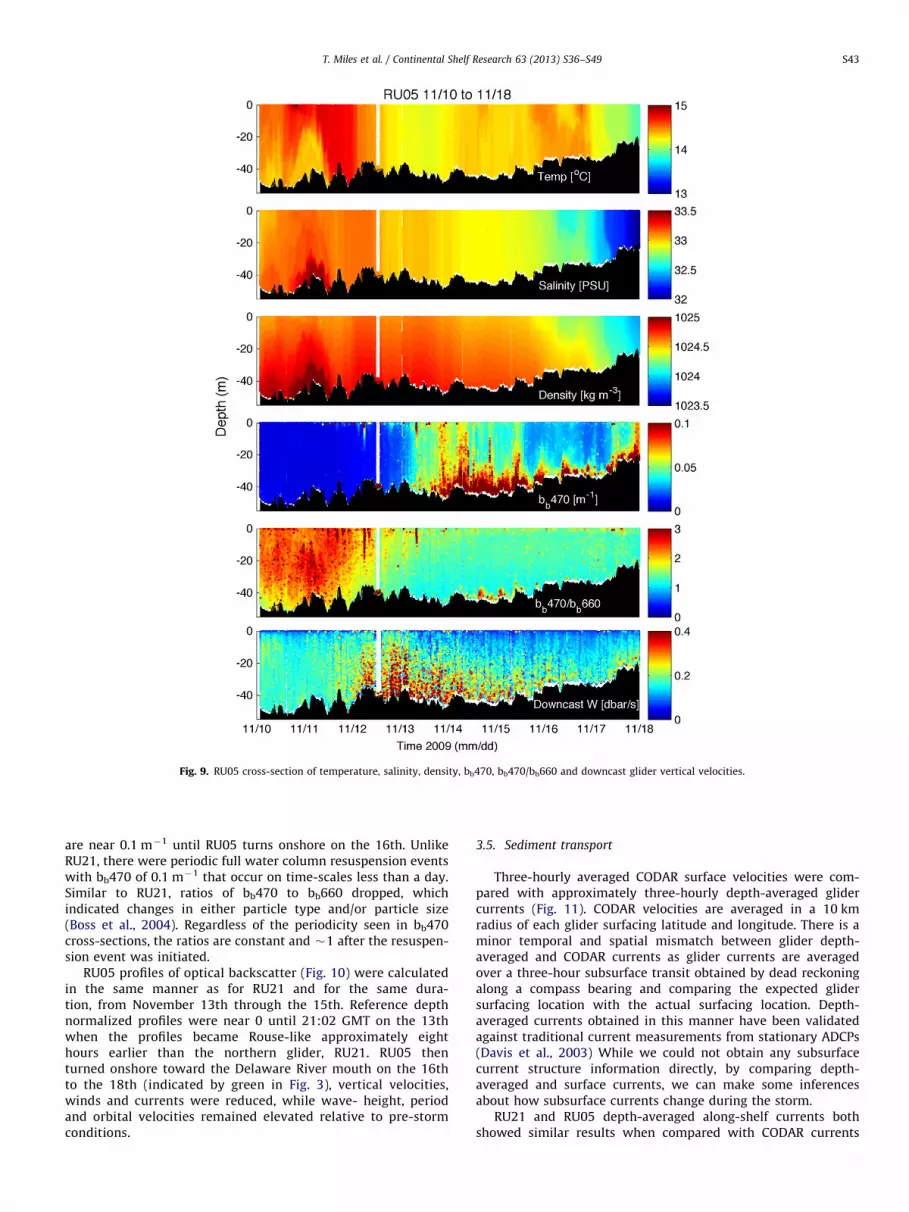
Fig. 9. RU05 cross-section of temperature, salinity, density, bb470, bb470/bb660 and downcast glider vertical velocities.
T. Miles et al. / Continental Shelf Research 63 (2013) S36–S49 S43
are near 0.1 m�1 until RU05 turns onshore on the 16th. UnlikeRU21, there were periodic full water column resuspension eventswith bb470 of 0.1 m�1 that occur on time-scales less than a day.Similar to RU21, ratios of bb470 to bb660 dropped, whichindicated changes in either particle type and/or particle size(Boss et al., 2004). Regardless of the periodicity seen in bb470cross-sections, the ratios are constant and �1 after the resuspen-sion event was initiated.
RU05 profiles of optical backscatter (Fig. 10) were calculatedin the same manner as for RU21 and for the same dura-tion, from November 13th through the 15th. Reference depthnormalized profiles were near 0 until 21:02 GMT on the 13thwhen the profiles became Rouse-like approximately eighthours earlier than the northern glider, RU21. RU05 thenturned onshore toward the Delaware River mouth on the 16thto the 18th (indicated by green in Fig. 3), vertical velocities,winds and currents were reduced, while wave- height, periodand orbital velocities remained elevated relative to pre-stormconditions.
3.5. Sediment transport
Three-hourly averaged CODAR surface velocities were com-pared with approximately three-hourly depth-averaged glidercurrents (Fig. 11). CODAR velocities are averaged in a 10 kmradius of each glider surfacing latitude and longitude. There is aminor temporal and spatial mismatch between glider depth-averaged and CODAR currents as glider currents are averagedover a three-hour subsurface transit obtained by dead reckoningalong a compass bearing and comparing the expected glidersurfacing location with the actual surfacing location. Depth-averaged currents obtained in this manner have been validatedagainst traditional current measurements from stationary ADCPs(Davis et al., 2003) While we could not obtain any subsurfacecurrent structure information directly, by comparing depth-averaged and surface currents, we can make some inferencesabout how subsurface currents change during the storm.
RU21 and RU05 depth-averaged along-shelf currents bothshowed similar results when compared with CODAR currents

Fig. 10. RU05 log-normalized profiles of bb470 (red) and bb660 (black). Y-axis is the natural logarithm of depth divided by zr, a reference depth of 3.5 m. The X-axis is the
natural logarithm of optical backscatter, bb, divided by the optical backscatter at the reference depth br or ln(b/bzr). Titles are timestamps of November dd HH:MM.
T. Miles et al. / Continental Shelf Research 63 (2013) S36–S49S44
for the duration of each glider deployment. The storm event iseasily identifiable in both gliders, which were approximatelyalong the 40 m isobath, between the 10th and 15th, with onshorecurrents up to 40 cm s�1 and alongshore currents toward thesouthwest of up to 80 cm s�1. Correlation coefficients calculatedbetween glider and CODAR currents for the entire deploymentshowed a weak correlation in cross-shelf currents of 0.30 forRU05 and 0.33 for RU21. Correlation coefficients in the along-shelf direction were much greater, with values of 0.81 for RU05and 0.77 for RU21. Correlation coefficients of CODAR and glidercomparisons limited to during and after the storm, from the 10thto the 18th, showed that the cross-shelf components increased to0.44 for RU05 and 0.5 for RU21 and the along-shelf componentsremained essentially the same at 0.81 for RU05 and 0.84 for RU21.The weak cross-shelf correlation coefficients suggest that deepercurrents were initially weaker and not necessarily in the samedirection as surface currents. Increased correlation during andafter the storm suggest that subsurface currents in the cross-shelfdirection either increased in magnitude or aligned more closelywith surface currents.
In order to estimate sediment transport magnitude and direction,a time-series of integrated bb470 was calculated by integratingover depth and segment bb470 during the RU05 and RU21deployments and then (Fig. 12). These depth and time integratedplots show elevated values of backscatter that initiated on the13th and remained elevated through the duration of the stormuntil the 16th with the southern glider, RU05, showing muchlarger values during the storm. The northern glider, RU21, had asecond peak after the storm, which was approximately double thesize of the storm-induced values. Estimated transport was calcu-lated by multiplying the integrated backscatter by the along- andcross-shelf depth-averaged currents reported by the gliders(Fig. 12). Prior to the storm, low sediment concentrations andlow currents result in transport near 0 s�1. During the resuspen-sion event, sediment was transported toward the southwest inthe along-shelf (Fig. 12) direction for both RU05 and RU21. RU05showed approximately twice the along-shelf sediment transportas RU21 during the storm. RU05 and RU21 cross-shelf transportwas approximately half of the along-shelf transport and in theonshore direction during the storm. Following the storm RU05

Fig. 11. Along-shelf currents for RU21 and RU05 (Top two panels) and cross-shelf currents for RU21 and RU05 (Bottom two panels) depth averaged glider currents( x’s) and
along-track 3-hourly averaged CODAR surface currents (o’s) rotated clockwise 30 degrees to be in the cross- and along-shelf directions with positive along-shelf currents to
the northeast and positive cross-shelf currents to the southeast. Correlation coefficients for the full time-period are displayed as r.
Fig. 12. Time-series of the (blue) RU21 and (red) RU05 (top) three-hour integrated bb470 (m�1) and estimated transport in the (middle) along- and (bottom) cross- shelf
directions. Positive values indicate northeastward transport for along-shelf and southeastward transport for cross-shelf transport. Estimated transport is calculated by
multiplying depth-averaged glider currents by integrated optical backscatter at bb470.
T. Miles et al. / Continental Shelf Research 63 (2013) S36–S49 S45
transport was reduced to near 0 s�1 when currents and inte-grated backscatter were both reduced (Fig. 12). RU21 transportshifted to the offshore direction as high bb470 still remained inthe water column (Fig. 12) and current velocities were reduced(Fig. 11) as it approached the coast.
4. Discussion
While many studies have focused on sediment resuspensionat a single point on the MAB shelf (Traykovski et al., 1999;Agrawal and Pottsmith, 2000; Harris et al., 2003; Agrawal,

Fig. 13. Time-series of the (blue) RU21 and (red) RU05 (top) three-hour segment standard deviation of vertical velocity (cm s�1) and (bottom) mean bed grain-size from
Fig. 1 interpolated to the along-track glider positions.
T. Miles et al. / Continental Shelf Research 63 (2013) S36–S49S46
2005; Traykovski, 2007; Cacchione et al., 2008) few observationalstudies have focused on the shelf-wide spatial variability of theseprocesses. We were fortunate to have several gliders deployed toassess the spatial variability of sediment resuspension on theMAB during the Nor’Ida fall transition storm (Schofield et al.,2010b). The two gliders equipped with optical sensors, separatedby �50 km at the onset of storm conditions, documented theinitiation of sediment resuspension through the increases inoptical backscatter. Just like the two gliders, buoys 44009 and44025 (separated by 230 km) showed similar characteristics,with a 1-day lag in peak values, through the initiation of elevatedstorm winds and waves. Despite the separation distances, along-shelf transport toward the southwest was a ubiquitous feature ofboth glider deployments with a lag in resuspension of approxi-mately eight hours. With a separation distance of �50 km this lagis on the same order as the lag seen in peak storm conditions atbuoys 44025 and 44009. Peak sediment transport was associatedwith a combination of a maximum in suspended sedimentconcentration and high relative along-shelf southwestward cur-rents. The nearly coincident maximum in sediment transportsuggests that along-shelf transport is a common feature of theentire NJ shelf and MAB and is consistent with previous modelingstudies (e.g. Keen and Glenn, 1995). The event duration is longerthan the temporal lag between the southern and northern glidersso the large-scale storm effectively forces the shelf as a whole andthere is little spatial variability in the timing of resuspension andtransport as a result of storm passage.
While resuspension and transport occurred with an approxi-mately eight hour lag, the strength of resuspension and transportvaried by as much as a factor of two in the along-shelf direction,with higher transport associated with RU05 located on thesouthern NJ shelf. The major difference in sediment resuspension,and consequent transport, was related to the numerous discreteresuspension events that resulted in high sediment concentra-tions up into the water-column during the storm. The differencein the scale and frequency of resuspension events over spatialscales much smaller than the storm event points out the impor-tance of local processes, which affect the magnitude of sedimentresuspension and transport. Previous work by Styles and Glenn(2005); Keen and Glenn (1995); Gargett et al. (2004) have high-lighted tidal forcing, topographic variations and Langmuir cells aspotential processes affecting sediment resuspension and trans-port on time-periods shorter than a day. For both gliders, verticalvelocity variability appeared random rather than spatially banded(Figs. 7 and 9), indicating that Langmuir cells were not likely thecause of the suspended sediment spatial heterogeneity. RU21and RU05 were both flying approximately southwestward alongthe 40 m isobath during elevated winds, currents and waves
therefore topography was essentially constant during the resus-pension event (Figs. 7 and 9). RU21 did not experience fluctua-tions of sediment resuspension or transport on time-scalesshorter than a day after the resuspension event was initiated,thus tidal forcing was not likely a dominant modulation processas in Keen and Glenn (1995). The scale of tidal forcing on the shelfis also much larger than the separation distance between thegliders; therefore variability seen in RU05 on shorter time-scalesis likely not related to tidal fluctuations.
Glenn et al. (2008) suggested that in the absence of stratifica-tion, turbulence in the combined wind-driven surface layer andwave-enhanced bottom boundary layer is responsible for sedi-ment resuspension upward through the water column, butobservations were sparse. During the Nor’Ida storm there was adistinct change in vertical glider velocities, which serves asevidence of turbulence in the water column. The standard devia-tion of each three-hour glider segment for RU21 and RU05vertical velocities show a distinct increase in vertical velocityvariability beginning on the morning of the 12th and persistingthrough the 16th (Fig. 12). These fluctuations in the glider’svertical velocity serve as an estimate of the turbulent motionsdue to high storm-induced current-shear, similar to neutrallybuoyant lagrangian floats used in Harcourt and D’Asaro (2010).Vertical velocity standard deviation values were approximatelythe same for RU05 and RU21. Uniform vertical velocity standarddeviations suggest that the vertical component of turbulence wassimilar between the northern and southern portions of the NJshelf, which is consistent with the scale of the storm and theuniform winds, waves and currents.
With little variability in turbulent vertical velocities betweengliders, the differences in bed grain size likely play a major role inmodulating the magnitude of resuspension by storm-inducedturbulence. In order to assess the importance of local variabilityin grain size we interpolate mapped values (Goff et al., 2008; Reidet al., 2005) plotted in Fig. 1 to glider latitude and longitude. Theresulting time-series (Fig. 13) shows mean grain size below thegliders throughout the deployment. The time-series shows meangrain sizes ranged from �0.3 to �1.4 mm with largest grain sizesseen by RU05 after storm passage, when it turned into the mouthof the Delaware. RU21 passed over a region of over 1 mm grainsizes between the 11th and 13th, after storm initiation but priorto peak conditions. The map in Fig. 1 shows a patch of coarsesediment along the northern portion of the NJ shelf where RU21was flying and relatively smaller grain sizes in the along-shelfregion where RU05 sampled, prior to turning in toward DelawareBay. During the resuspension events on the 13th through the15th, RU05 was located over a patch of sand with a mean grainsize of 0.3 mm–0.4 mm (Fig. 13) before flying through a region

Fig. 14. Time-series of (top) estimated fall velocities for (blue) RU21 and (red) RU05, (middle) magnitude of depth-averaged currents for (blue) RU21 and (red) RU05, and
(bottom) the ratio of (black) RU21 to RU05 fall velocities and (magenta) depth-averaged currents, all during the resuspension event.
T. Miles et al. / Continental Shelf Research 63 (2013) S36–S49 S47
with mean grain size of over 0.8 mm on the 15th. Conversely,RU21 was in a region with mean grain sizes from 0.4 mm to0.6 mm on the 13th through 14th. On the 15th RU21 entered aregion of reduced mean grain size of �0.3 m�1.
A study by Agrawal and Pottsmith (2000) as part of the LEO-15project, which took place within a few kilometers of the deploy-ment location of RU05 and RU21, developed a local model for thefall velocity: wf ,n ¼ 0:45� 10�3a1:2
n where an is the radius inmicrons and wf is the settling velocity in cm s�1. As mentionedpreviously fall velocity is essentially the tendency of sediment tofall out of concentration and u* is the tendency for particles toremain in suspension. Following the above equation we calculatefall velocities for the sediment grain sizes mapped below theglider during the resuspension event on the 13th through 15th(Fig. 14). Fall velocities are initially greater for RU21 at the peak ofthe storm, and initiation of the resuspension event at midnight onNovember 13th. As the gliders progress fall velocities are approxi-mately equal for RU21 and RU05 until the 14th when RU21 fallvelocities increase and RU05 fall velocities decrease. While we usethe standard deviation of glider vertical velocities as a relativeapproximation of the timing of turbulent motions, these valuesare not sufficient to directly substitute for values of u*. Lentz et al.(1999) uses depth-averaged velocities to estimate bottom stresstb. If we follow this model and subsequently calculate a depth-averaged representative friction velocity then we would see u*
values proportional to glider velocities. A time-series of depth-averaged velocities during the storm event are shown in Fig. 14.RU05 depth-averaged velocities are �5–10 cm/s greater thanRU21 through the 13th and are approximately equal on the14th. As our depth-averaged velocities are only proportional tofriction velocity we cannot calculate a direct ratio of wf =un.
For comparison, we calculated the ratio of RU21 to RU05estimated fall velocities between the two gliders as well as theratio of RU21 to RU05 depth-averaged glider velocities, whichshould be approximately equal to the ratio of friction velocities(Fig. 14). Fall velocity ratios were initially high, similar to RU21fall velocities and grain-size. From 4:00 to 22:00 GMT on the 13thfall velocity ratios are near one. On the 14th the RU21 to RU05 fallvelocity ratio increased by over a factor of two, until they dropagain late on the 14th as the gliders began to turn onshore.The ratio of RU21 to RU05 depth-averaged glider velocities wasjust below one for the duration of the resuspension event onNovember 13th through the 14th. Calculated standard deviations
of RU21 to RU05 fall velocities and depth-averaged glider velo-cities are 0.62 and 0.08 respectively. The much larger standarddeviation in the estimated fall velocity ratio shows that differ-ences in grain size and subsequently fall velocity plays a largerrole than current variability in the resuspension and transportdynamics during this storm event. Comparison of our fall velocityratio to slopes of optical backscatter profiles in Figs. 8 and 9 forRU21 and RU05 respectively, show that profiles were Rouse-likethroughout the water column for the 13th and 14th for RU05.These profiles are indicative of full water column resuspension ofrelatively smaller particles, which remained in suspension for theduration of the event. Optical backscatter profiles from RU21were much more vertical than RU05 until mid-day on the 14thwhen resuspension peaked throughout the water column. Lateron the 14th and into the 15th profiles of RU21 optical backscatterdemonstrated a near bottom layer, which along with fall velo-cities indicates that larger particles were falling out of suspensionor unable to make it into the upper portion of the water column.The differences in grain size and resuspension characteristicsfrom the northern glider, RU21 and southern glider RU05 showthat even during the largest storms local variability in bedcharacteristics can play a major role in modulating sedimentresuspension and subsequently transport on the continental shelf.Our study demonstrates that during storms on the continentalshelf, variability in bottom character also drives local variabilityin the magnitude and direction of sediment transport. Throughglider spatial surveys of sediment transport and resuspension, wehave shown that detailed spatial surveys and continually updatedspatial maps similar to those produced by Goff et al. (2008) maybe necessary to fully understand water-column sediment trans-port. These spatial surveys will not only support further under-standing of observational data over shelf-wide spatial scales, butcan also be used to quantitatively enhance realistic regionalsediment resuspension and transport models.
5. Conclusion
Here we have demonstrated the importance of utilizing novelocean observation technology, such as gliders and CODAR toresolve shelf-scale resuspension and transport during storms.A fleet of autonomous gliders not only provided information onsediment transport and resuspension over large spatial areas, but

T. Miles et al. / Continental Shelf Research 63 (2013) S36–S49S48
also emphasized the importance of local variability in grain-sizeon estimates of shelf-wide sediment resuspension and transport,even in the largest storms. With little observed influence fromtides, Langmuir cells or topography, the simple balance betweenturbulent shear stress and fall velocity, which varies with grain-size, played a major role in observed differences in sedimentresuspension and transport along the mid-shelf. Future inclusionof glider fleets and CODAR networks along with traditional tripodand buoy instrumentation will allow for a more holistic view ofsediment transport and resuspension along continental shelves,during storm events in particular, when shipboard measurementsare not possible. These data will also aid in developing morerobust regional models by feeding real data into predictivemodels as storms occur. In order to further understand thedynamics of sediment resuspension and transport on shelf-widescales, the inclusion of acoustic and holographic sensors inaddition to optical sensors on glider platforms will be necessary.This will help to accurately identify the nature of suspendedparticles when sediment bed information is lacking and will alsoprovide more in situ information regarding the magnitude anddirection of current profiles and transport during storm events.
Acknowledgments
Data used in this study was acquired by the Rutgers UniversityCoastal Ocean Observation Lab (R.U.COOL) and NOAA. R.U.COOL issupported by ONR, NOAA, IOOS, NSF, DHS, DoD, NASA, NOPP andthe State of New Jersey. Glider data for this study came from adeployment for the NSF Ocean Observing Initiative as part of aCyber Infrastructure Implementing Organization testbeddingactivity. We would also like to thank Teledyne-Webb Researchfor graduate student support and continued technical support.The Mid-Atlantic Bight High Frequency Radar network isfunded by IOOS. This work was supported by ONR MURI grantnumber N000140610739, NOAA MARCOOS grant numbersNA07NOS4730221 and NA01NOS4730014 and NSF OOI NSF OCE10307201 1/1.
References
Agrawal, Y.C., 2005. The optical volume scattering function: temporal and verticalvariability in the water column off the New Jersey coast. Limnology andOceanography 50, 1787–1794.
Agrawal, Y.C., Pottsmith, H.C., 2000. Instruments for particle size and settlingvelocity observations in sediment transport. Marine Geology 168, 89–114.
Amato, 1994. Sand and Gravel Maps of the Atlantic Continental Shelf. In: Service,M.M. (Ed.). OCS Monograph MMS, p. 35.
Barrick, D.E., 1971a. Theory of HF and VHF propagation across the rough sea, 1, theeffective surface impedance for a slightly rough highly conducting medium atgrazing incidence. Radio Science 6, 517–526.
Barrick, D.E., 1971b. Theory of HF and VHF propagation across the rough sea, 2,application to HF and VHF propagation above the sea. Radio Science 6,527–533.
Beardsley, R.C., Boicourt, W.C., 1981. On estuarine and continental-shelf circula-tion in the middle Atlantic Bight. In: Warren, B.A., Wunsch, C. (Eds.), Evolutionof Physical Oceanography. MIT Press, Cambridge, MA, pp. 198–241.
Bigelow, H.B., 1933. Studies of the waters on the continental shelf, Cape Cod toChesapeake Bay. I. The cycle of temperature. Papers in Physical Oceanographyand Meteorology 2, 1–135.
Boss, E., Pegau, W.S., Lee, M., Twardowski, M., Shybanov, E., Korotaev, G.,Baratange, F., 2004. Particulate backscattering ratio at LEO 15 and its use tostudy particle composition and distribution. Journal of Geophysical Research109, C01014.
Cacchione, D.A., Thorne, P.D., Agrawal, Y., Nidzieko, N.J, 2008. Time-averaged near-bed suspended sediment concentrations under waves and currents: compar-ison of measured and model estimates. Continental Shelf Research 28,470–484.
Chang, G.C., Dickey, T.D., Williams III, A.J., 2001. Sediment resuspension over acontinental shelf during Hurricanes Edouard and Hortense. Journal of Geo-physical Research 106, 9517–9531.
Chapman, R.D., Graber, H.C., 1997. Validation of HF radar measurements. Oceano-graphy 10, 76–79.
Chen, K., He, R., 2010. Numerical investigation of the Middle Atlantic Bightshelfbreak frontal circulation using a high-resolution ocean hindcast model.Journal of Physical Oceanography 40, 949–964.
Davis, R.E., Eriksen, C.E., Jones, C.P., 2003. Autonomous buoyancy driven under-water gliders. In: Griffiths, G. (Ed.), Technology and applications of autono-mous underwater vehicles. Taylor & Francis, New York, pp. 37–58.
Dzwonkowski, B., Kohut, J.T., Yan, X.-H., 2009a. Seasonal differences in wind-driven across-shelf forcing and response relationships in the shelf surfacelayer of the central Mid-Atlantic Bight. Journal of Geophysical Research 114,C08018.
Dzwonkowski, B., Kohut, J.T., Yan, X.-H., 2009b. Sub-inertial characteristics of thesurface flow field over the shelf of the central Mid-Atlantic Bight. ContinentalShelf Research 29, 1873–1886.
Gargett, A., Wells, J., Tejada-Martinez, A.E., Grosch, C.E., 2004. Langmuir supercells:a mechanism for sediment resuspension and transport in shallow seas. Science306, 1925–1928.
Glenn, S., Arnone, R., Bergmann, T., Bissett, W.P., Crowley, M., Cullen, J., Gryzmski,J., Haidvogel, D., Kohut, J., Moline, M., Oliver, M., Orrico, C., Sherrell, R., Song, T.,Weidemann, A., Chant, R., Schofield, O., 2004. Biogeochemical impact ofsummertime coastal upwelling on the New Jersey shelf. Journal of GeophysicalResearch 109, C12S02.
Glenn, S., Clayton, J., Twardowski, M., Bowers, L., Kerfoot, J., Kohut, J., Webb, D.,Schofield, O., 2008. Glider observations of sediment resuspension in a MiddleAtlantic Bight Fall transition storm. Limnology and Oceanography 53,2180–2196.
Glenn, S., Schofield, O., 2009. Growing a distributed ocean observatory: Our viewfrom the COOLroom. Oceanography 22, 112–129.
Glenn, S.M., Grant, W.D., 1987. A suspended sediment stratification correction forcombined wave and current flows. Journal of Geophysical Research 92,8244–8264.
Goff, J.A., Jenkins, C.J., Jeffress Williams, S., 2008. Seabed mapping and character-ization of sediment variability using the usSEABED data base. ContinentalShelf Research 28, 614–633.
Gong, D., Kohut, J.T., Glenn, S.M., 2010. Seasonal climatology of wind-drivencirculation on the New Jersey shelf. Journal of Geophysical Research 115,C04006.
Grant, W.D., Madsen, O.S., 1979. Combined wave and current interaction with arough bottom. Journal of Geophysical Research 84, 1797–1808.
Grant, W.D., Madsen, O.S., 1986. The continental-shelf bottom boundary layer.Annual Review of Fluid Mechanics 18, 265–305.
Harcourt, R.R., D’Asaro, E.A., 2010. measurement of vertical kinetic energy and verticalvelocity skewness in oceanic boundary layers by imperfectly Lagrangian floats.Journal of Atmospheric Oceanic Technology 27, 1918–1935 /http://dx.doi.org/proxy.libraries.rutgers.edu/10.1175/2010JTECHO731.1S.
Harris, C.K., Butman, B., Traykovski, P., 2003. Winter-time circulation and sedi-ment transport in the Hudson Shelf Valley. Continental Shelf Research 23,801–820.
Houghton, R.W., Schlitz, R., Beardsley, R.C., Butman, B., Chamberlin, J.L., 1982. TheMiddle Atlantic Bight cold pool: evolution of the temperature structure duringsummer 1979. Journal of Physical Oceanography 12, 1019–1029.
Keen, T.R., Glenn, S.M., 1995. A coupled hydrodynamic-bottom boundary layermodel of storm and tidal flow in the Middle Atlantic Bight of North America.Journal of Physical Oceanography 25, 391–406.
Kohut, J.T., Roarty, H.J., Glenn, S.M., 2006. Characterizing observed environmentalvariability With HF Doppler Radar Surface Current Mappers and AcousticDoppler Current Profilers: environmental variability in the coastal ocean. IEEEJournal of Oceanic Engineering 31, 876–884.
Lentz, S., Guza, R.T., Elgar, S., Feddersen, F., Herbers, T.H.C., 1999. Momentumbalances on the North Carolina inner shelf. Journal of Geophysical Research104, 18205–18226.
Lentz, S.J., 2003. A climatology of salty intrusions over the continental shelf fromGeorges Bank to Cape Hatteras. Journal of Geophysical Research 108, 3326.
Lentz, S.J., 2008. Seasonal variations in the circulation over the Middle AtlanticBight continental shelf. Journal of Physical Oceanography 38, 1486–1500.
McBride, R.A., Moslow, T.F., 1991. Origin, evolution, and distribution of shorefacesand ridges, Atlantic inner shelf, U.S.A. Marine Geology 97, 57–85.
Ohlmann, C., White, P., Washburn, L., Terrill, E., Emery, B., Otero, M., 2007.Interpretation of coastal HF Radar-derived surface currents with high-resolution drifter data. Journal of Atmospheric & Oceanic Technology 24,666–680.
Reid, J.M., Reid, J.A., Jenkins, C.J., Hastings, M.E., Williams, S.J., Poppe, L.J., 2005.usSEABED: Atlantic coast offshore surficial sediment data release. U.S. Geolo-gical Survey Data Series, 1st ed.
Roarty, H., Glenn, S., Kohut, J., 2010. Operation and application of a regional high-frequency radar network in the Mid-Atlantic Bight. Marine Technology SocietyJournal 44, 133–145.
Roesler, C.S., Boss, E., 2008. In situ measurement of the inherent optical properties(IOPs) and potential for harmful algal bloom (HAB) detection and coastalecosystem observations, Chapter 5. In: Babin, M., Roesler, C.S., Cullen, J. (Eds.),Real-Time Coastal Observing Systems for Marine Ecosystem Dynamics andHarmful Algal Blooms: Theory, Instrumentation and Modeling; UNESCO,pp. 153–206.
Schofield, O., Glenn, S., Orcutt, J., Arrott, M., Meisinger, M., Gangopadhyay, A., Brown,W., Signell, R., Moline, M., Chao, Y., Chien, S., Thompson, D., Balasuriya, A.,Lermusiaux, P., Oliver, M., 2010a. Automated sensor network to advance oceanscience. Eos Transactions, American Geophysical Union 91 (39), 345–356.

T. Miles et al. / Continental Shelf Research 63 (2013) S36–S49 S49
Schofield, O., Kohut, J., Aragon, D., Creed, L., Graver, J., Haldeman, C., Kerfoot, J.,Roarty, H., Jones, C., Webb, D., Glenn, S., 2007. Slocum gliders: robust andready. Journal of Field Robotics 24, 473–485.
Schofield, O., Kohut, J., Glenn, S., Morell, J., Capella, J., Corredor, J., Orcutt, J., Arrott,M., Krueger, I., Meisinger, M., Peach, C., Vernon, F., Chave, A., Chao, Y., Chien, S.,Thompson, D., Brown, W., Oliver, M., Boicourt, W., 2010b. A regional slocumglider network in the Mid-Atlantic Bight leverages broad community engage-ment. Marine Technology Society Journal 44, 185–195.
Stewart, R.H., Joy, J.W., 1974. HF radio measurements of surface currents. Deep SeaResearch and Oceanographic Abstracts 21, 1039–1049.
Styles, R., Glenn, S.M., 2000. Modeling stratified wave-current bottom boundarylayers for the continental shelf. Journal of Geophysical Research 105,24119–24139.
Styles, R., Glenn, S.M., 2002. Modeling bottom roughness in the presence of wave-generated ripples. Journal of Geophysical Research 107, 3110.
Styles, R., Glenn, S.M., 2005. Long-term sediment mobilization at a sandy innershelf site, LEO-15. Journal of Geophysical Research 110, C04S90.
Swift, D.J.P., Field, M.E., 1981. Evolution of a classic sand ridge field: Marylandsector, North American inner shelf. Sedimentology 28, 461–482.
Teague, C.C., 1971. High Frequency Resonant Scattering Techniques for theObservation of Directional Ocean-Wave Spectra, Calif. Stanford University,Palo Alto.
Terrill, E.J., Melville, W.K., Stramski, D., 2001. Bubble entrainment by breakingwaves and their influence on optical scattering in the upper ocean. Journal ofGeophysical Research 106, 16815–16823.
Traykovski, P., 2007. Observations of wave orbital scale ripples and a none-quilibrium time-dependent model. Journal of Geophysical Research 112,C06026.
Traykovski, P., Hay, A.E., Irish, J.D., Lynch, J.F., 1999. Geometry, migration, andevolution of wave orbital ripples at LEO-15. Journal of Geophysical Research104, 1505–1524.
Twardowski, M.S., Boss, E., Macdonald, J.B., Pegau, W.S., Barnard, A.H., Zaneveld,J.R.V., 2001. A model for estimating bulk refractive index from the opticalbackscattering ratio and the implications for understanding particle composi-tion in case I and case II waters. Journal of Geophysical Research 106,14129–14142.
Wiggert, J.D., Jones, B.H., Dickey, T.D., Brink, K.H., Weller, R.A., Marra, J., Codispoti,L.A., 2000. The Northeast monsoon’s impact on mixing, phytoplanktonbiomass and nutrient cycling in the Arabian Sea. Deep Sea Research Part II:Topical Studies in Oceanography 47, 1353–1385.
Xu, Y., Chant, R., Gong, D., Castelao, R., Glenn, S., Schofield, O., 2011. Seasonalvariability of chlorophyll a in the Mid-Atlantic Bight. Continental ShelfResearch 31, 1640–1650.
Zedler, S.E., Dickey, T.D., Doney, S.C., Price, J.F., Yu, X., Mellor, G.L., 2002. Analysesand simulations of the upper ocean’s response to Hurricane Felix at theBermuda Testbed Mooring site 13–23 August 1995. Journal of GeophysicalResearch 107, 3232.