
Storm-Substorm Relationships During the 4 October, 2000 Storm. IMAGE Global ENA Imaging Results
13
Submitted to The Storm-substorm relationship, AGU Geophysical Monograph, 2001-11-30 Storm-Substorm Relationships During the 4 October, 2000 Storm. IMAGE Global ENA Imaging Results Pontus C:son Brandt, Donald G. Mitchell, Robert Demajistre, Edmond C. Roelof, Shin Ohtani, Jorg-Micha Jahn, Craig Pollock, Geoff Reeves Abstract. Global ion distributions in the 1-200 keV energy range from the main phase of the geomagnetic storm on 4 October 2000 are presented and analyzed. Proton distributions have been obtained by inverting energetic neutral atom (ENA) images from the high energy neutral atom (HENA) instrument on board the IMAGE satellite using a constrained linear inversion technique. The storm is characterized by a 24 hour long main phase where the IMF B steadily decreases followed by a 2 day recovery. Several substorms occured during the mainphase as can be seen from in-situ measurements from geosynchronous satellites (LANL, GOES). Substorm injections during the early main phase, when the dawn to dusk electric field was weak, ocurred on closed trajectories. A strong asymmetric ring current developed as the IMF B decreased gradually to about -10 nT. A substorm ocurred at about 17:30 UT which injected plasma onto open trajectories with no clear change in the morphology of the partial ring current. As the IMF B increased towards zero, substorms were observed to inject ions onto closed trajectories. The peak of the ring current moved from L=5 to L=3 during the entire main phase. A preliminary inspection of 80-160 keV oxygen ENA fluxes reveal a one order of magnitude increase during the entire mainphase, implying that O contributed significantly to this storm. In order to quantify the variations in the ring current energy content, the equivalent magnetic disturbance is calculated for the L 6 proton distributions using the Dessler-Parker-Sckopke relation. Our calculated suggests that substorm proton injections did not increase the ring current energy content over the main phase. Together with the fact that the proton ring current was mostly partial, this shows that the dominant ring current energy increase must have been due to increased convection. However, the long-term increase in oxygen ENA fluxes suggest that substorms extracted ionospheric O that was fed into the magnetospheric circulation. In that respect, the O increased the energy content over the main phase. We also discuss implications of strong electric fields in the inner region L 4. 1. INTRODUCTION Historically it was believed that a geomagnetic storm was the effect of many substorms Akasofu [1968]. It was later recognized by Gonzalez and Tsurutani [1987] that the re- Applied Physics Laboratory, Laurel, Maryland Southwest Research Institute, San Antonio, Texas Los Alamos National Laboratories, Los Alamos, New Mexico quirement for a geomagnetic storm to occurr was an IMF B -10 nT for at least 3 h. More recent studies have shown that convection is the dominant driver in geomagnetic storms and that the main phase ring current is mostly partial where ions drift on open trajectories out through the dayside mag- netopause [Liemohn et al., 2001]. However, there still re- mains a question of how much the substorm injections dur- ing a storm main phase contribute to the overall storm time 1
-
Upload
independent -
Category
Documents
-
view
1 -
download
0
Transcript of Storm-Substorm Relationships During the 4 October, 2000 Storm. IMAGE Global ENA Imaging Results
Submitted to The Storm-substorm relationship, AGU Geophysical Monograph, 2001-11-30
Storm-Substorm Relationships During the 4 October, 2000Storm. IMAGE Global ENA Imaging Results
Pontus C:son Brandt,�
Donald G. Mitchell,�
Robert Demajistre,�
Edmond C.Roelof,
�Shin Ohtani,
�Jorg-Micha Jahn,
�Craig Pollock,
�Geoff Reeves
�Abstract. Global ion distributions in the 1-200 keV energy range from the mainphase of the geomagnetic storm on 4 October 2000 are presented and analyzed.Proton distributions have been obtained by inverting energetic neutral atom (ENA)images from the high energy neutral atom (HENA) instrument on board theIMAGE satellite using a constrained linear inversion technique. The storm ischaracterized by a 24 hour long main phase where the IMF B � steadily decreasesfollowed by a 2 day recovery. Several substorms occured during the mainphaseas can be seen from in-situ measurements from geosynchronous satellites (LANL,GOES). Substorm injections during the early main phase, when the dawn to duskelectric field was weak, ocurred on closed trajectories. A strong asymmetricring current developed as the IMF B � decreased gradually to about -10 nT. Asubstorm ocurred at about 17:30 UT which injected plasma onto open trajectorieswith no clear change in the morphology of the partial ring current. As the IMFB � increased towards zero, substorms were observed to inject ions onto closedtrajectories. The peak of the ring current moved from L=5 to L=3 during the entiremain phase. A preliminary inspection of � 80-160 keV oxygen ENA fluxes reveala one order of magnitude increase during the entire mainphase, implying that O
�contributed significantly to this storm. In order to quantify the variations in the ringcurrent energy content, the equivalent magnetic disturbance
�����is calculated
for the L 6 proton distributions using the Dessler-Parker-Sckopke relation. Ourcalculated
�����suggests that substorm proton injections did not increase the ring
current energy content over the main phase. Together with the fact that the protonring current was mostly partial, this shows that the dominant ring current energyincrease must have been due to increased convection. However, the long-termincrease in oxygen ENA fluxes suggest that substorms extracted ionospheric O
�that was fed into the magnetospheric circulation. In that respect, the O
�increased
the energy content over the main phase. We also discuss implications of strongelectric fields in the inner region L � 4.
1. INTRODUCTION
Historically it was believed that a geomagnetic storm wasthe effect of many substorms Akasofu [1968]. It was laterrecognized by Gonzalez and Tsurutani [1987] that the re-�
Applied Physics Laboratory, Laurel, Maryland�Southwest Research Institute, San Antonio, Texas�Los Alamos National Laboratories, Los Alamos, New Mexico
quirement for a geomagnetic storm to occurr was an IMFB ��� -10 nT for at least 3 h. More recent studies have shownthat convection is the dominant driver in geomagnetic stormsand that the main phase ring current is mostly partial whereions drift on open trajectories out through the dayside mag-netopause [Liemohn et al., 2001]. However, there still re-mains a question of how much the substorm injections dur-ing a storm main phase contribute to the overall storm time
1
2 C:SON BRANDT ET AL.
energy content of the ring current.
The problem we investigate in this paper can be summa-rized as follows. The storm intensity has been characterizedby the ����� , and more recently, by the SYM-H and ASY-Hindices. These are indices directly calculated from the mag-netic disturbance measured at the equatorial surface. Themagnetic disturbance can be related to the total energy con-tent of the ions that flow around the Earth, via the Dessler-Parker-Sckopke (DPS) relation [Dessler and Parker, 1959;Sckopke, 1966]. Now the problem is how much of the growthof the energy content during a geomagnetic storm can be at-tributed to substorms and how much can be attributed to anincrease in the overall convection strength. Once plasma isinjected during a substorm onto open trajectories it will notcontribute further to the overall growth of the energy. This isbecause the injected particles will be lost through the magne-topause. So, the only way accumulated substorm injectionscan contribute to the overall growth is if the injections areonto closed drift trajectories.
On the other hand, the energy content of plasma beingtransported by the ����� drift set up by the IMF-generatedcross tail electric field, can increase if the cross tail elec-tric field increases. The reason for this is that the strongerelectric field will decrease the Alfven boundary (boundarybetween open and closed trajectories for particles with givenmagnetic moment) so that the plasma can access lower alti-tudes. This will in turn lead to adiabatic energization sincethe plasma is now transported into a region with higher mag-netic field strength.
Plasma cannot be trapped by a slowly varying convection.If the IMF B � changes from southward to northward on timescales less than the drift period of an ion of given energy, theelectric field pattern changes such that ions that were previ-ously on open trajectories find themselves on trapped trajec-tories. Then, during periods where the IMF B � is decreasingreasonably steadily, the trapped population could only comefrom substorm injections. We will examine the global iondistribution during such periods and investigate how muchof the growth of the total energy is due to substorms injec-tions or increased convection.
In this paper we will present ENA images from the mainphase of the storm. The ENA images have been inverted toobtain an equatorial ion distribution, using a constrained lin-ear inversion technique. In order to quantify how much thesubstorm injections contribute to the overall storm growthwe compute the equivalent magnetic disturbance �! #"%$ forthe global proton distributions during the main phase. Theproton distribution at a given energy will tell us if the tra-jectories are open or closed, and its contribution to �! &"%$relative to other energies will tell us how much it contributes
to the over all growth of the total energy. In addition to thiswe will show how the oxygen ENA flux increased over themain phase and discuss its implications. We also discussbriefly the spectral features of the main phase indicating thatthere was a deep potential minimum on L � 3 implying a sig-nificant electric fields. We compare our results to a modelderived electric field by Ridley and Liemohn [2001]. Thepurpose of this study is to investigate what restrictions canbe put on different energy sources to the ring current ener-gization by analyzing the global ion distributions we haveobtained.
2. INVERSION TECHNIQUE
We use a constrained linear inversion technique that closelyfollows the method described by Twomey [1977] and alsosimilar to Perez et al. [2001]. Previous studies [Hendersonet al., 1997; C:son Brandt et al., 2001a] have used a for-ward modeling technique based on a parametrized model ofthe ion distribution developed by Roelof and Skinner [2000].The inversion technique was described in C:son Brandt et al.[2001b] and we only outline its main components here. Theidea is to expand the line of sight (LOS) integral that de-scribes the production of ENAs into sums of linear quadra-ture and then equating them with the observed image andin that way determine the quadrature coefficients. In thepresent formulation the pitch angle distribution (PAD) is de-scribed by one isotropic component and one linear compo-nent representing the field aligned and perpendicular shapeof the PAD. In this paper we focus only on the isotropic com-ponent. The ion distributions were clamped down to zero atL=2 and L=16. We use here the day-midnight asymmet-ric exosphere based on the DE-1 measurements reported byRairden et al. [1986] and also used by [C:son Brandt et al.,2001b]. The absolute fluxes obtained by our algorithm ap-pear to be somewhat overestimated. The calculated �! #"%$calculated below should therefore not be taken as absolute,but rather as a relative indicator on the total energy contentof the ring current. Fluxes should be correct in a relativesense.
3. CALCULATING MAGNETICDISTURBANCE
We use the retrieved ion distributions to calculate themagnetic disturbance at the equator on the surface of theEarth. We do this by using the Dessler-Parker-Sckopke rela-tion [Dessler and Parker, 1959; Sckopke, 1966], which statesthat the horisontal magnetic perturbation ')( at the equatorcan be written ')(�*,+ -. / �102�/43 (45�6 (1)
STORM-SUBSTORM RELATIONSHIPS OF 4 OCT STORM 3
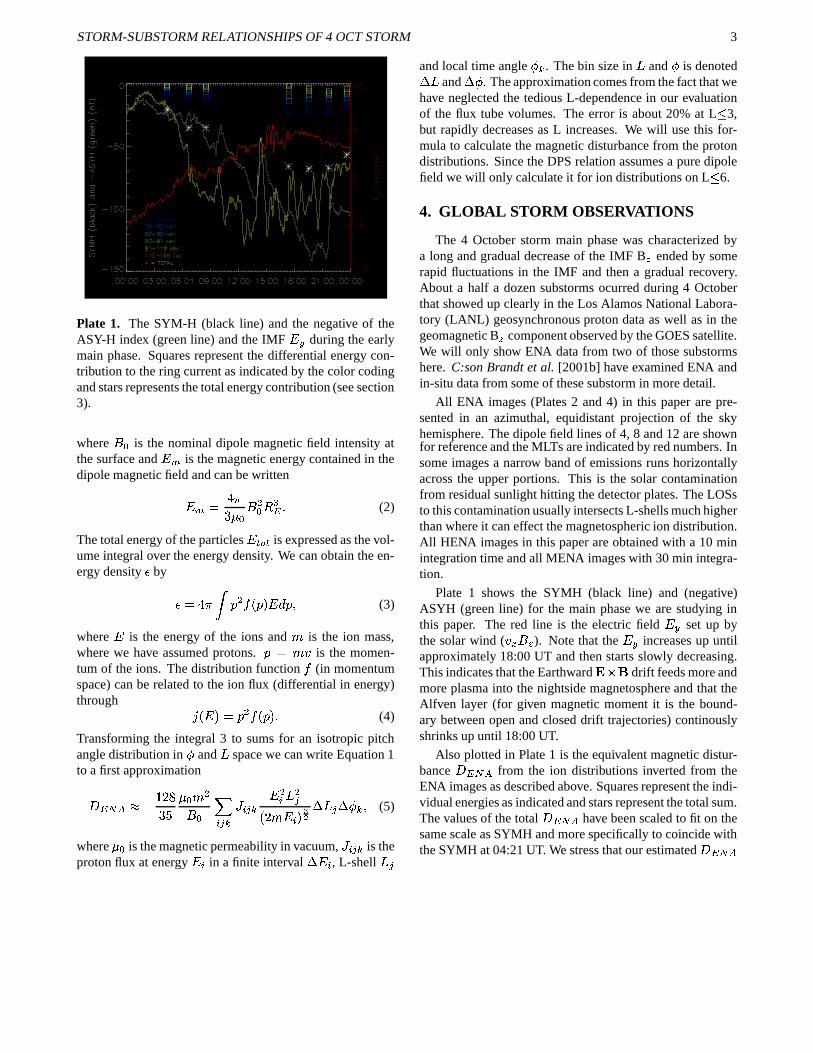
Plate 1. The SYM-H (black line) and the negative of theASY-H index (green line) and the IMF
/�7during the early
main phase. Squares represent the differential energy con-tribution to the ring current as indicated by the color codingand stars represents the total energy contribution (see section3).
where (�5 is the nominal dipole magnetic field intensity atthe surface and
/ 3is the magnetic energy contained in the
dipole magnetic field and can be written/83 * 9;:.;< 5 (>=5;?A@ 8B (2)
The total energy of the particles/ �102� is expressed as the vol-
ume integral over the energy density. We can obtain the en-ergy density C by
CD* 9�:>EGF =IHKJ FMLN/POQF 6 (3)
where/
is the energy of the ions and R is the ion mass,where we have assumed protons.
F *SRUT is the momen-tum of the ions. The distribution function H (in momentumspace) can be related to the ion flux (differential in energy)through V J />L * F =QHKJ FWL B (4)
Transforming the integral 3 to sums for an isotropic pitchangle distribution in X and Y space we can write Equation 1to a first approximation
�Z #"%$\[G+�] -;^.`_ < 5QR =(45ba cedgf)h cedgf/ =c Y =dJ - R / c L;ij ')Y d 'ZX f 6 (5)
where< 5 is the magnetic permeability in vacuum, h cedgf is the
proton flux at energy/ c in a finite interval ' / c , L-shell Y d
and local time angle X f . The bin size in Y and X is denoted'kY and 'ZX . The approximation comes from the fact that wehave neglected the tedious L-dependence in our evaluationof the flux tube volumes. The error is about 20% at L � 3,but rapidly decreases as L increases. We will use this for-mula to calculate the magnetic disturbance from the protondistributions. Since the DPS relation assumes a pure dipolefield we will only calculate it for ion distributions on L � 6.
4. GLOBAL STORM OBSERVATIONS
The 4 October storm main phase was characterized bya long and gradual decrease of the IMF B � ended by somerapid fluctuations in the IMF and then a gradual recovery.About a half a dozen substorms ocurred during 4 Octoberthat showed up clearly in the Los Alamos National Labora-tory (LANL) geosynchronous proton data as well as in thegeomagnetic B � component observed by the GOES satellite.We will only show ENA data from two of those substormshere. C:son Brandt et al. [2001b] have examined ENA andin-situ data from some of these substorm in more detail.
All ENA images (Plates 2 and 4) in this paper are pre-sented in an azimuthal, equidistant projection of the skyhemisphere. The dipole field lines of 4, 8 and 12 are shownfor reference and the MLTs are indicated by red numbers. Insome images a narrow band of emissions runs horizontallyacross the upper portions. This is the solar contaminationfrom residual sunlight hitting the detector plates. The LOSsto this contamination usually intersects L-shells much higherthan where it can effect the magnetospheric ion distribution.All HENA images in this paper are obtained with a 10 minintegration time and all MENA images with 30 min integra-tion.
Plate 1 shows the SYMH (black line) and (negative)ASYH (green line) for the main phase we are studying inthis paper. The red line is the electric field
/�7set up by
the solar wind ( T;l;( � ). Note that the/87
increases up untilapproximately 18:00 UT and then starts slowly decreasing.This indicates that the Earthward �\��� drift feeds more andmore plasma into the nightside magnetosphere and that theAlfven layer (for given magnetic moment it is the bound-ary between open and closed drift trajectories) continouslyshrinks up until 18:00 UT.
Also plotted in Plate 1 is the equivalent magnetic distur-bance �Z &"%$ from the ion distributions inverted from theENA images as described above. Squares represent the indi-vidual energies as indicated and stars represent the total sum.The values of the total �� #"%$ have been scaled to fit on thesame scale as SYMH and more specifically to coincide withthe SYMH at 04:21 UT. We stress that our estimated � #"%$
4 C:SON BRANDT ET AL.
should not be taken as absolute but as a measure of the en-ergy content of ions inside L=6. We discuss the implicationsin the Discussion section.
During the early main phase (when the/ 7
was still weak)the substorms appeared to inject plasma onto closed trajec-tories at 06:10 (Plate 3) and 09:24 UT (not shown). Laterin the main phase as
/ 7had increased to about 5 mV/m the
ENA images indicated substorm injections onto open drifttrajectories such as for the 12:10, 14:00 UT substorms (PO-LAR/IPS measurements, not shown) and the 17:30 UT sub-storm (Plate 5). As the
/47decreased slowly, the injections
at 20:00 and 21:30 UT (not shown) appeared to build up thesymmetric component of the ring current gradually (Plate 1).
4.1. Early Main Phase
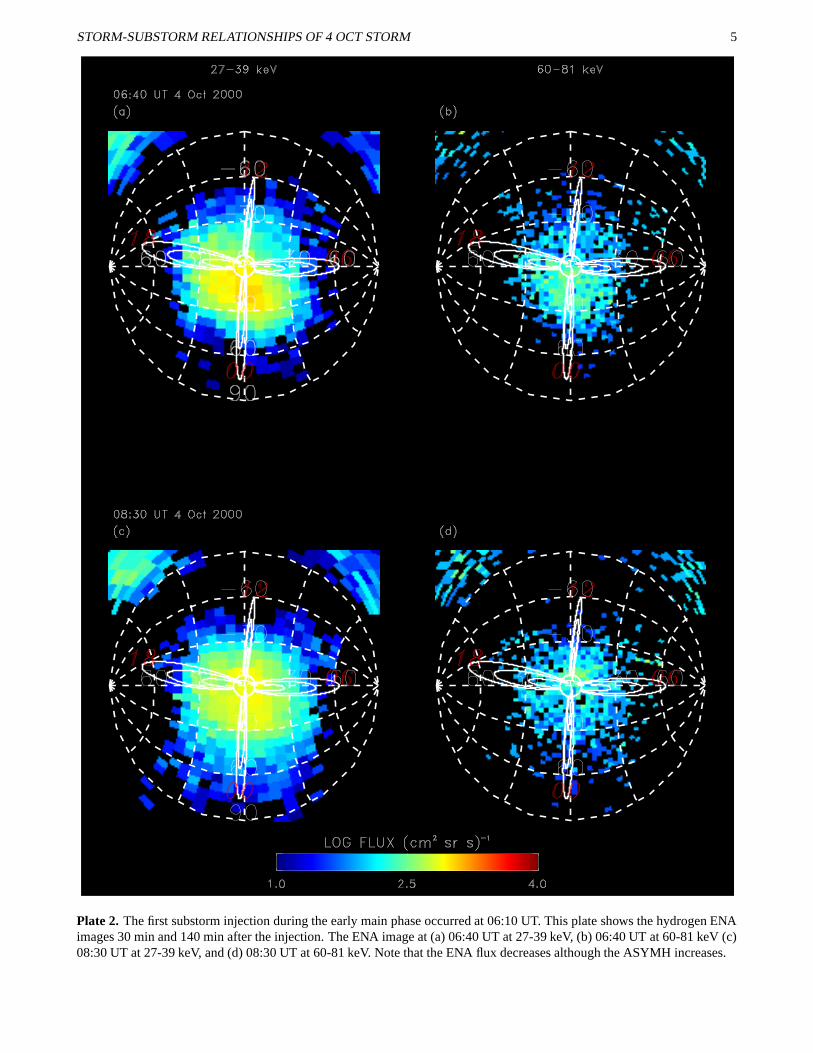
Plate 2 shows the observations at 06:40 and 08:30 UT on4 October in the 27-39 and 60-81 keV energy range. Plate3 shows the corresponding ion distributions obtained by theinversion method described above. We see that the injectionelevated the nightside ion fluxes at L=4, but fluxes remainedlow on the dayside. Later in Plates 3c and 3d, the nightsidefluxes has decreased while the ring current appears to havebecome slightly more enhanced and symmetric on L=4. Ac-cording to the calculated total �� &"%$ the ring current energycontent during this time did not increased as can be seen inPlate 1. This directly implies that cross tail current may havecontributed significantly to the SYMH and ASYH. However,we will discuss below in the Discussion section (Figure 1)the O m abundance for this period.
There were two substorms at 06:10 and 09:22 UT, whichboth were preceded by elevated plasma sheet fluxes beyond8 ? . Their behavior have been reported by C:son Brandtet al. [2001b]. In Plate 3a plasma sheet fluxes are low,but note that in Plate 3c plasma sheet fluxes have increasedwhich is consistent with the overall convection continuouslyfeeding the plasma sheet with fresh plasma.
4.2. Late Main Phase
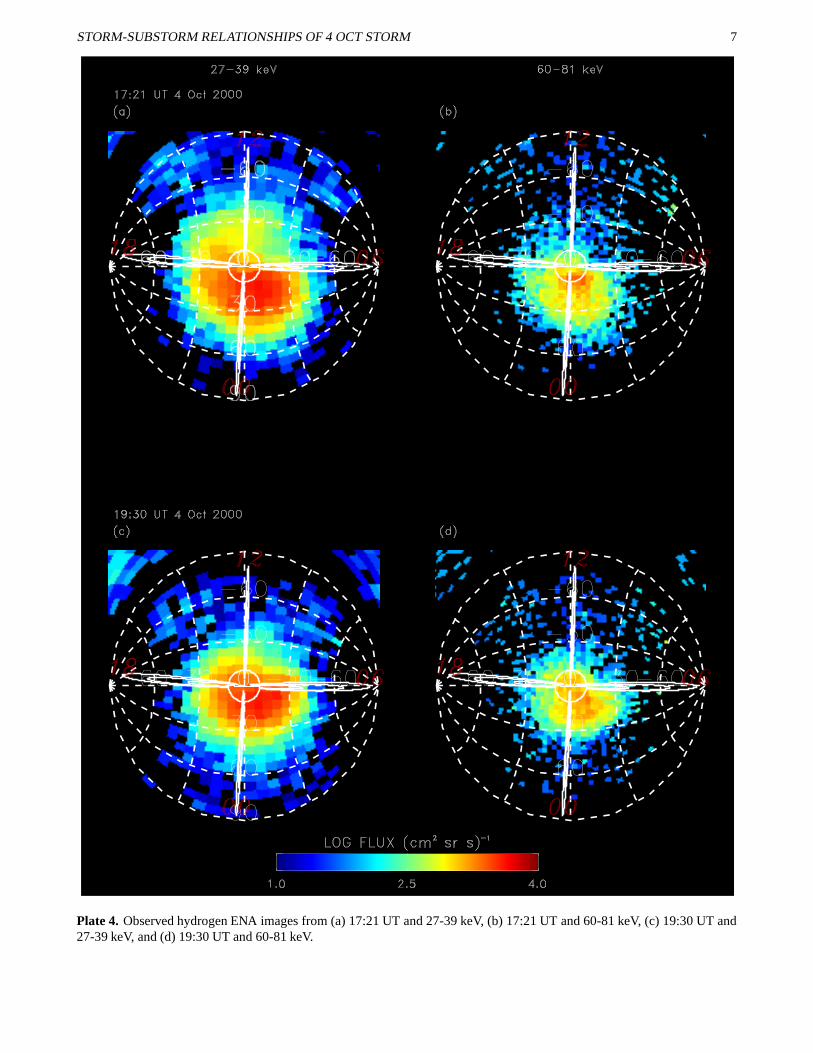
Plate 4 shows the observed ENA images in the 27-39 and60-81 keV range for 17:21 UT and 19:30 UT. Plate 5 showsthe equatorial ion distributions inverted from the ENA im-ages in Plate 4. According to auroral FUV images obtainedby the FUV camera on board IMAGE, a substorm onset oc-curred at approximately 17:20 UT. At 17:30 UT an ion in-jection was observed around midnight at geosynchronous al-titudes. We can see that there is not much change in ion fluxfrom 17:21 UT to 19:30 UT in either energy range.
If one considers that the curvature-gradient drift periodof 70 keV protons is approximately 3 h, it is reasonableto expect that the dayside ions present at 19:30 UT are
the ions from the injection at 17:30 UT. For all energiesin Plate 5 there are ion fluxes extending past dusk to noonand weak signatures of ion fluxes extending out to L=8around noon. This implies that the ions at these energiescurvature-gradient drifted around to noon where they werelost through the dayside magnetopause and picked up bythe magnetosheath flow. The magnetopause during this timewas around 11 R on the dusk flank and was estimated tobe inside L=8 at the subsolar point using the fits by Roelofand Sibeck [1993]. It is clear that there are almost no ionfluxes in the pre noon sector for 60-81 keV which impliesthat the drift trajectories were open at this energy. We alsonote that the MLT region spanned by the partial ring cur-rent leaves only a narrow sector in MLT with significantlylower ion fluxes. Thus a finite number of in-situ measure-ments at geosynchronous orbit could run a high risk of miss-ing this minimum, making it look like the ring current wasstill closed during this time.
19:30 UT is also the time of the deepest minimum ofSYMH in Plate 1, but this does not seem to be reflected inthe proton distributions and � &"D$ . Again the cause for thiscould be the tail current contribution and O m as will be dis-cussed in the Discussion section.
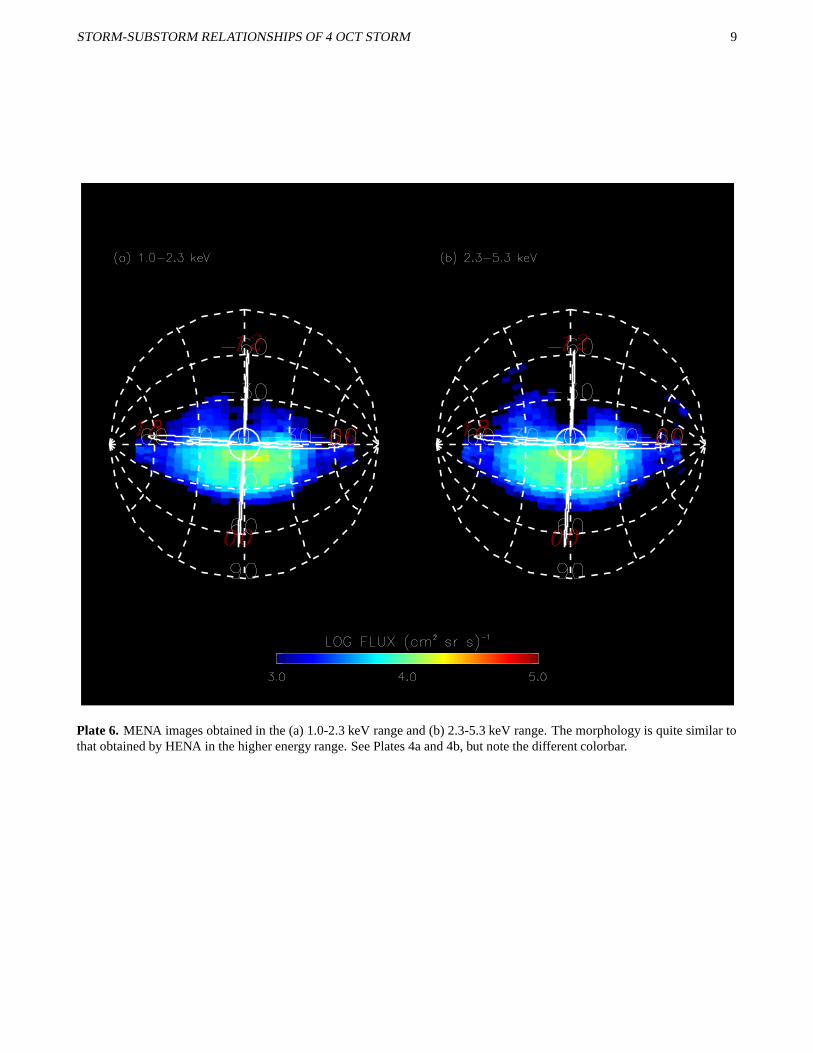
Plate 6 shows the ENA images from the MENA imagerin the 1.0-5.3 keV energy range. We immediately note thesimilarity between these and the ones observed by HENA at27-39 keV (Plate 4a). We have unfortunately not inverted theMENA images, so the comparison has to be qualitative. Theobservations at MENA energies are essential since the ionsare dominated by the electric drifts at these lower energies.From Plate 6 we see that there is perhaps a weak maximumin the post-midnight sector, and that the ENA fluxes decreaserapidly once beyond dusk. In Plates 4a and 4b we see thatthe ENA fluxes continue beyond dusk. This is reasonablesince at higher energies the curvature-gradient drift shouldbe more pronounced. However, the change of the morphol-ogy over the entire energy range is not drastic, and we willdiscuss below how this can imply significant electric fieldmagnitudes deep in the inner magnetosphere.
5. Discussion
In order to answer the original question about how muchsubstorms contribute to the growth of the geomagnetic storm,consider Plates 3 and 5. The proton distributions are clearlyasymmetric in MLT. This means that the substorms did notinduce electric fields sufficiently strong to inject protonsonto stably trapped orbits. Also, ENA images (not presentedhere) from POLAR/IPS at 11:30-14:30 UT show the devel-opment of another two substorms, supporting the above con-clusion. The first substorm ocurred at approximately 12:10
STORM-SUBSTORM RELATIONSHIPS OF 4 OCT STORM 5
Plate 2. The first substorm injection during the early main phase occurred at 06:10 UT. This plate shows the hydrogen ENAimages 30 min and 140 min after the injection. The ENA image at (a) 06:40 UT at 27-39 keV, (b) 06:40 UT at 60-81 keV (c)08:30 UT at 27-39 keV, and (d) 08:30 UT at 60-81 keV. Note that the ENA flux decreases although the ASYMH increases.
6 C:SON BRANDT ET AL.
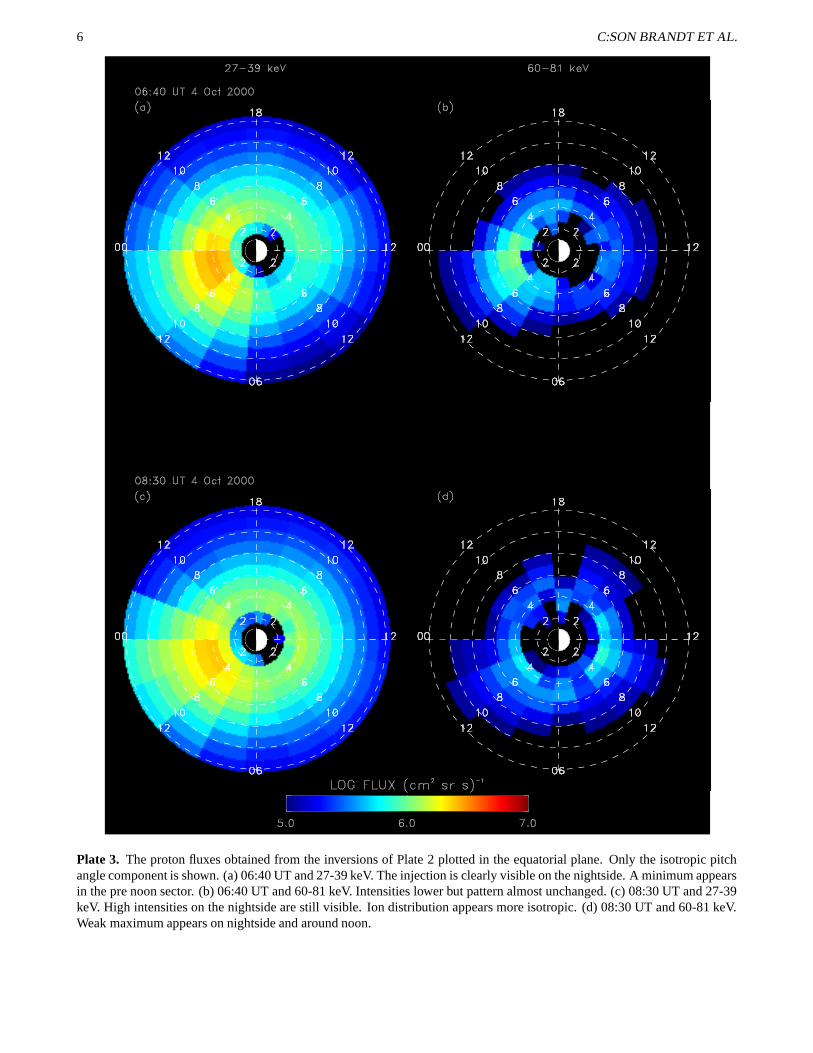
Plate 3. The proton fluxes obtained from the inversions of Plate 2 plotted in the equatorial plane. Only the isotropic pitchangle component is shown. (a) 06:40 UT and 27-39 keV. The injection is clearly visible on the nightside. A minimum appearsin the pre noon sector. (b) 06:40 UT and 60-81 keV. Intensities lower but pattern almost unchanged. (c) 08:30 UT and 27-39keV. High intensities on the nightside are still visible. Ion distribution appears more isotropic. (d) 08:30 UT and 60-81 keV.Weak maximum appears on nightside and around noon.
STORM-SUBSTORM RELATIONSHIPS OF 4 OCT STORM 7
Plate 4. Observed hydrogen ENA images from (a) 17:21 UT and 27-39 keV, (b) 17:21 UT and 60-81 keV, (c) 19:30 UT and27-39 keV, and (d) 19:30 UT and 60-81 keV.

8 C:SON BRANDT ET AL.
Plate 5. Equatorial ion distributions inverted from the ENA images in Plate 4.
STORM-SUBSTORM RELATIONSHIPS OF 4 OCT STORM 9
Plate 6. MENA images obtained in the (a) 1.0-2.3 keV range and (b) 2.3-5.3 keV range. The morphology is quite similar tothat obtained by HENA in the higher energy range. See Plates 4a and 4b, but note the different colorbar.

10 C:SON BRANDT ET AL.
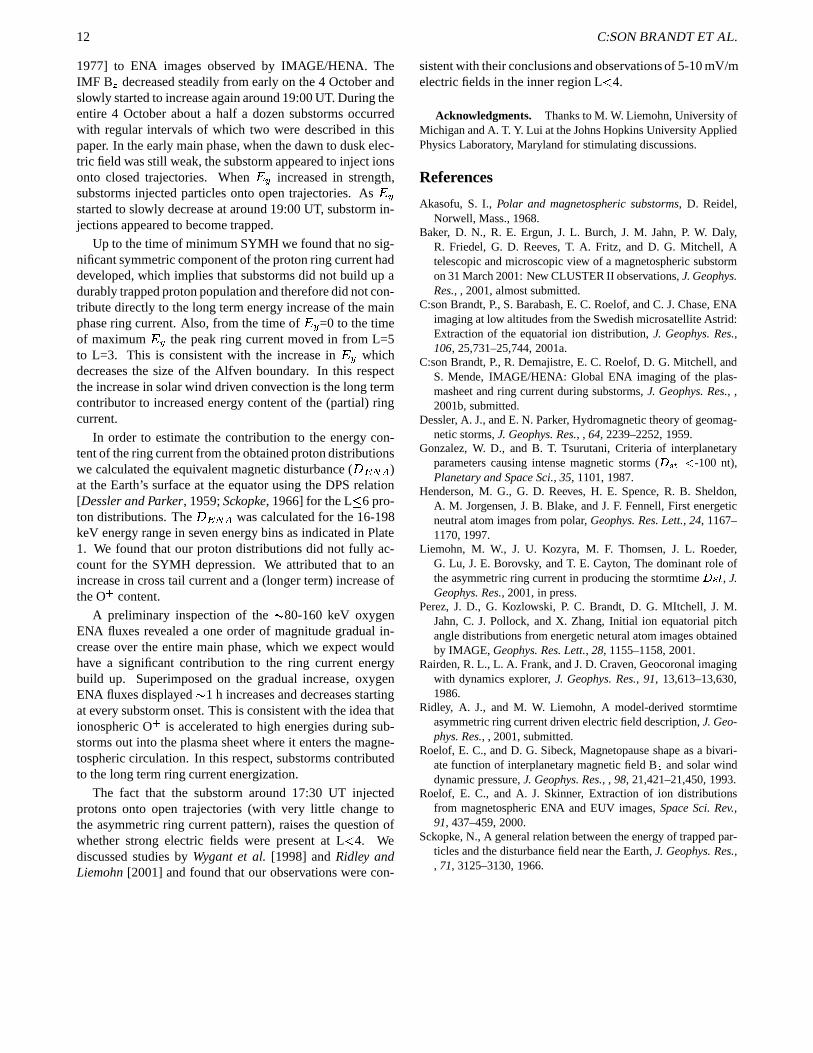
Figure 2. The integrated oxygen ENA flux in the n 80-160keV range over the second half of the main phase.
Figure 1. The integrated oxygen ENA flux in the n 80-160keV range over the first half of the main phase.
UT and the second around 14:00 UT. Neither of these in-jections showed any indications of being on closed trajec-tories. This further supports the conclusion that convectionwas dominating this main phase.
It is also clear from Plate 1 that the substorm injections at17:30, 20:00, and 21:30 UT did not increase the proton ringcurrent energy. We will discuss the O m content next.
However, if we consider our calculated � #"%$ in Plate 1we can see that it does not decrease as much as the SYMH.Apart from a contribution from the tail current there is alsoa contribution from O m . At teh time of these observationsthe mass resolving capability of HENA had not been opti-mized. However, we know that the o 10 keV/nucleon hydro-gen channel is dominated by n 80-160 keV oxygen, whichhas the same velocity as o 10 keV hydrogen. The reason forthis is that the energy of a o 10 keV/nucleon hydrogen atomis too low to penetrate the front foil of HENA.
Figures 1 and 2 show the image integrated ENA flux inthe lowest energy per nucleon channel over the entire mainphase. We see that the total oxygen ENA flux increasesabout one order of magnitude over the entire main phase.This shows that the ring current energy increased signifi-cantly in the O m population. Superposed on this long termincrease there are intensifications at every substorm onsetthat decay away during an hour. This is consistent with sub-storms extracting ionospheric O m which adds to the magne-tospheric circulation [Baker et al., 2001]. Consequently themore substorms, the more O m is added and the higher theenergy of the ring current becomes. If we take the oxygenENA fluxes at face value, the ring current energy decreasedshortly after the 17:30 UT injection until 19:30 UT and thenincreased again, with fluctuations, up until 22:30 UT. This isinconsistent with the SYMH, but remember that O m is prob-ably not directly injected into the near Earth ring current onthe time scales of hours, but rather injected into the higheraltitude plasma sheet, and therefore does not create a strongmagnetic disturbance at Earth. At this stage we can only saythat we would expect a significant long term contribution ofthe O m ions because of the one order of magnitude increasein oxygen ENA flux. So, in this sense substorms appear toplay an important role in the long term increase of the O mcontent in the magnetosphere. ENA image inversion at theseenergies is difficult to interpret in detail due to a larger an-gular scattering (up to 20 p ) in the front foil.
A natural question arising is why the injections at 12:10,
STORM-SUBSTORM RELATIONSHIPS OF 4 OCT STORM 11
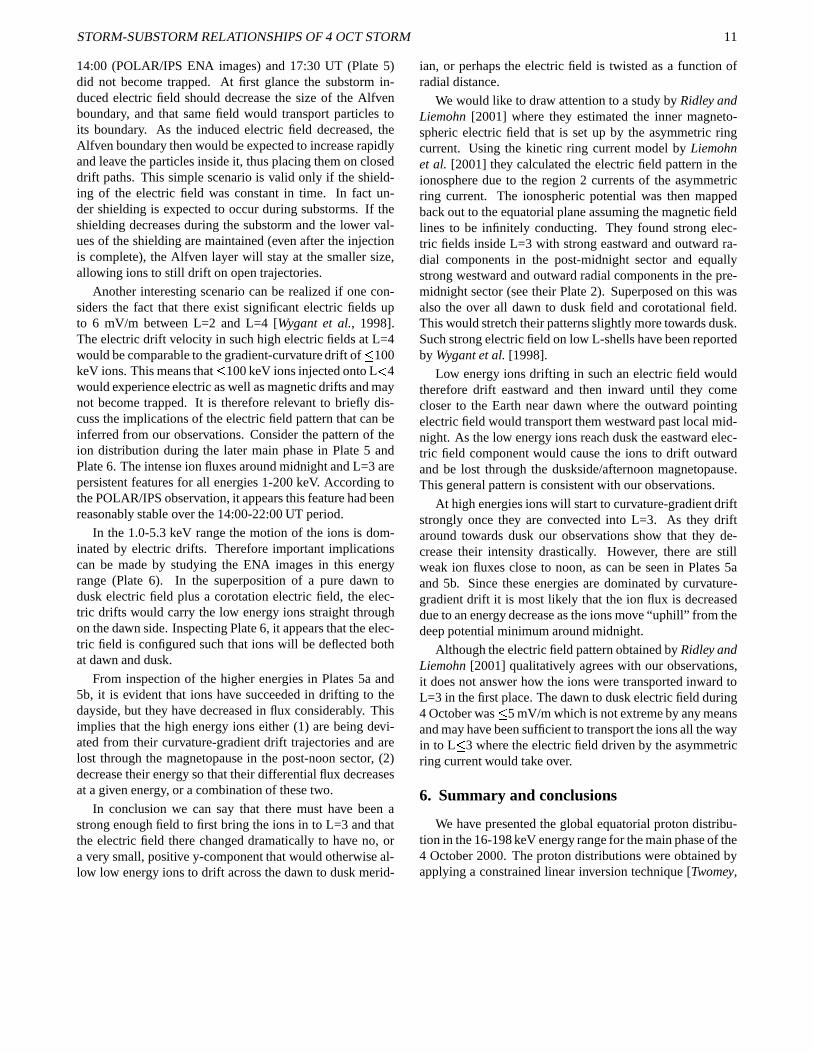
14:00 (POLAR/IPS ENA images) and 17:30 UT (Plate 5)did not become trapped. At first glance the substorm in-duced electric field should decrease the size of the Alfvenboundary, and that same field would transport particles toits boundary. As the induced electric field decreased, theAlfven boundary then would be expected to increase rapidlyand leave the particles inside it, thus placing them on closeddrift paths. This simple scenario is valid only if the shield-ing of the electric field was constant in time. In fact un-der shielding is expected to occur during substorms. If theshielding decreases during the substorm and the lower val-ues of the shielding are maintained (even after the injectionis complete), the Alfven layer will stay at the smaller size,allowing ions to still drift on open trajectories.
Another interesting scenario can be realized if one con-siders the fact that there exist significant electric fields upto 6 mV/m between L=2 and L=4 [Wygant et al., 1998].The electric drift velocity in such high electric fields at L=4would be comparable to the gradient-curvature drift of � 100keV ions. This means that � 100 keV ions injected onto L o 4would experience electric as well as magnetic drifts and maynot become trapped. It is therefore relevant to briefly dis-cuss the implications of the electric field pattern that can beinferred from our observations. Consider the pattern of theion distribution during the later main phase in Plate 5 andPlate 6. The intense ion fluxes around midnight and L=3 arepersistent features for all energies 1-200 keV. According tothe POLAR/IPS observation, it appears this feature had beenreasonably stable over the 14:00-22:00 UT period.
In the 1.0-5.3 keV range the motion of the ions is dom-inated by electric drifts. Therefore important implicationscan be made by studying the ENA images in this energyrange (Plate 6). In the superposition of a pure dawn todusk electric field plus a corotation electric field, the elec-tric drifts would carry the low energy ions straight throughon the dawn side. Inspecting Plate 6, it appears that the elec-tric field is configured such that ions will be deflected bothat dawn and dusk.
From inspection of the higher energies in Plates 5a and5b, it is evident that ions have succeeded in drifting to thedayside, but they have decreased in flux considerably. Thisimplies that the high energy ions either (1) are being devi-ated from their curvature-gradient drift trajectories and arelost through the magnetopause in the post-noon sector, (2)decrease their energy so that their differential flux decreasesat a given energy, or a combination of these two.
In conclusion we can say that there must have been astrong enough field to first bring the ions in to L=3 and thatthe electric field there changed dramatically to have no, ora very small, positive y-component that would otherwise al-low low energy ions to drift across the dawn to dusk merid-
ian, or perhaps the electric field is twisted as a function ofradial distance.
We would like to draw attention to a study by Ridley andLiemohn [2001] where they estimated the inner magneto-spheric electric field that is set up by the asymmetric ringcurrent. Using the kinetic ring current model by Liemohnet al. [2001] they calculated the electric field pattern in theionosphere due to the region 2 currents of the asymmetricring current. The ionospheric potential was then mappedback out to the equatorial plane assuming the magnetic fieldlines to be infinitely conducting. They found strong elec-tric fields inside L=3 with strong eastward and outward ra-dial components in the post-midnight sector and equallystrong westward and outward radial components in the pre-midnight sector (see their Plate 2). Superposed on this wasalso the over all dawn to dusk field and corotational field.This would stretch their patterns slightly more towards dusk.Such strong electric field on low L-shells have been reportedby Wygant et al. [1998].
Low energy ions drifting in such an electric field wouldtherefore drift eastward and then inward until they comecloser to the Earth near dawn where the outward pointingelectric field would transport them westward past local mid-night. As the low energy ions reach dusk the eastward elec-tric field component would cause the ions to drift outwardand be lost through the duskside/afternoon magnetopause.This general pattern is consistent with our observations.
At high energies ions will start to curvature-gradient driftstrongly once they are convected into L=3. As they driftaround towards dusk our observations show that they de-crease their intensity drastically. However, there are stillweak ion fluxes close to noon, as can be seen in Plates 5aand 5b. Since these energies are dominated by curvature-gradient drift it is most likely that the ion flux is decreaseddue to an energy decrease as the ions move “uphill” from thedeep potential minimum around midnight.
Although the electric field pattern obtained by Ridley andLiemohn [2001] qualitatively agrees with our observations,it does not answer how the ions were transported inward toL=3 in the first place. The dawn to dusk electric field during4 October was � 5 mV/m which is not extreme by any meansand may have been sufficient to transport the ions all the wayin to L � 3 where the electric field driven by the asymmetricring current would take over.
6. Summary and conclusions
We have presented the global equatorial proton distribu-tion in the 16-198 keV energy range for the main phase of the4 October 2000. The proton distributions were obtained byapplying a constrained linear inversion technique [Twomey,
12 C:SON BRANDT ET AL.
1977] to ENA images observed by IMAGE/HENA. TheIMF B � decreased steadily from early on the 4 October andslowly started to increase again around 19:00 UT. During theentire 4 October about a half a dozen substorms occurredwith regular intervals of which two were described in thispaper. In the early main phase, when the dawn to dusk elec-tric field was still weak, the substorm appeared to inject ionsonto closed trajectories. When
/ 7increased in strength,
substorms injected particles onto open trajectories. As/ 7
started to slowly decrease at around 19:00 UT, substorm in-jections appeared to become trapped.
Up to the time of minimum SYMH we found that no sig-nificant symmetric component of the proton ring current haddeveloped, which implies that substorms did not build up adurably trapped proton population and therefore did not con-tribute directly to the long term energy increase of the mainphase ring current. Also, from the time of
/ 7=0 to the time
of maximum/ 7
the peak ring current moved in from L=5to L=3. This is consistent with the increase in
/ 7which
decreases the size of the Alfven boundary. In this respectthe increase in solar wind driven convection is the long termcontributor to increased energy content of the (partial) ringcurrent.
In order to estimate the contribution to the energy con-tent of the ring current from the obtained proton distributionswe calculated the equivalent magnetic disturbance ( � #"%$ )at the Earth’s surface at the equator using the DPS relation[Dessler and Parker, 1959; Sckopke, 1966] for the L � 6 pro-ton distributions. The � &"D$ was calculated for the 16-198keV energy range in seven energy bins as indicated in Plate1. We found that our proton distributions did not fully ac-count for the SYMH depression. We attributed that to anincrease in cross tail current and a (longer term) increase ofthe O m content.
A preliminary inspection of the n 80-160 keV oxygenENA fluxes revealed a one order of magnitude gradual in-crease over the entire main phase, which we expect wouldhave a significant contribution to the ring current energybuild up. Superimposed on the gradual increase, oxygenENA fluxes displayed n 1 h increases and decreases startingat every substorm onset. This is consistent with the idea thationospheric O m is accelerated to high energies during sub-storms out into the plasma sheet where it enters the magne-tospheric circulation. In this respect, substorms contributedto the long term ring current energization.
The fact that the substorm around 17:30 UT injectedprotons onto open trajectories (with very little change tothe asymmetric ring current pattern), raises the question ofwhether strong electric fields were present at L o 4. Wediscussed studies by Wygant et al. [1998] and Ridley andLiemohn [2001] and found that our observations were con-
sistent with their conclusions and observations of 5-10 mV/melectric fields in the inner region L o 4.
Acknowledgments. Thanks to M. W. Liemohn, University ofMichigan and A. T. Y. Lui at the Johns Hopkins University AppliedPhysics Laboratory, Maryland for stimulating discussions.
References
Akasofu, S. I., Polar and magnetospheric substorms, D. Reidel,Norwell, Mass., 1968.
Baker, D. N., R. E. Ergun, J. L. Burch, J. M. Jahn, P. W. Daly,R. Friedel, G. D. Reeves, T. A. Fritz, and D. G. Mitchell, Atelescopic and microscopic view of a magnetospheric substormon 31 March 2001: New CLUSTER II observations, J. Geophys.Res., , 2001, almost submitted.
C:son Brandt, P., S. Barabash, E. C. Roelof, and C. J. Chase, ENAimaging at low altitudes from the Swedish microsatellite Astrid:Extraction of the equatorial ion distribution, J. Geophys. Res.,106, 25,731–25,744, 2001a.
C:son Brandt, P., R. Demajistre, E. C. Roelof, D. G. Mitchell, andS. Mende, IMAGE/HENA: Global ENA imaging of the plas-masheet and ring current during substorms, J. Geophys. Res., ,2001b, submitted.
Dessler, A. J., and E. N. Parker, Hydromagnetic theory of geomag-netic storms, J. Geophys. Res., , 64, 2239–2252, 1959.
Gonzalez, W. D., and B. T. Tsurutani, Criteria of interplanetaryparameters causing intense magnetic storms ( qArtsUu -100 nt),Planetary and Space Sci., 35, 1101, 1987.
Henderson, M. G., G. D. Reeves, H. E. Spence, R. B. Sheldon,A. M. Jorgensen, J. B. Blake, and J. F. Fennell, First energeticneutral atom images from polar, Geophys. Res. Lett., 24, 1167–1170, 1997.
Liemohn, M. W., J. U. Kozyra, M. F. Thomsen, J. L. Roeder,G. Lu, J. E. Borovsky, and T. E. Cayton, The dominant role ofthe asymmetric ring current in producing the stormtime qPvgw , J.Geophys. Res., 2001, in press.
Perez, J. D., G. Kozlowski, P. C. Brandt, D. G. MItchell, J. M.Jahn, C. J. Pollock, and X. Zhang, Initial ion equatorial pitchangle distributions from energetic netural atom images obtainedby IMAGE, Geophys. Res. Lett., 28, 1155–1158, 2001.
Rairden, R. L., L. A. Frank, and J. D. Craven, Geocoronal imagingwith dynamics explorer, J. Geophys. Res., 91, 13,613–13,630,1986.
Ridley, A. J., and M. W. Liemohn, A model-derived stormtimeasymmetric ring current driven electric field description, J. Geo-phys. Res., , 2001, submitted.
Roelof, E. C., and D. G. Sibeck, Magnetopause shape as a bivari-ate function of interplanetary magnetic field B x and solar winddynamic pressure, J. Geophys. Res., , 98, 21,421–21,450, 1993.
Roelof, E. C., and A. J. Skinner, Extraction of ion distributionsfrom magnetospheric ENA and EUV images, Space Sci. Rev.,91, 437–459, 2000.
Sckopke, N., A general relation between the energy of trapped par-ticles and the disturbance field near the Earth, J. Geophys. Res.,, 71, 3125–3130, 1966.

STORM-SUBSTORM RELATIONSHIPS OF 4 OCT STORM 13
Twomey, S., Introduction to the mathematics in remote sensing andindirect measurements, Developments in geomathematics 3, 1sted., Elsevier scientific publishing company, 1977.
Wygant, J., D. Rowland, H. J. Singer, M. Temerin, F. Mozer, andM. K. Hudson, Experimental evidence on the role of the largespatial scale electric field in creating the ring current, J. Geo-phys. Res., , 103, 29,527–29,544, 1998.
P. C:son Brandt, D. G. Mitchell, E. C. Roelof, R. De-majistre, The Johns Hopkins Applied Physics Laboratory,11100 Johns Hopkins Road, Laurel, MD 20723-6099
This preprint was prepared with AGU’s LATEX macros v4, with the ex-tension package ‘AGU yzy ’ by P. W. Daly, version 1.5f from 1998/07/16.