Response of tidal freshwater macrobenthos to sediment disturbance
Upload
independentCategory
view
8download
0


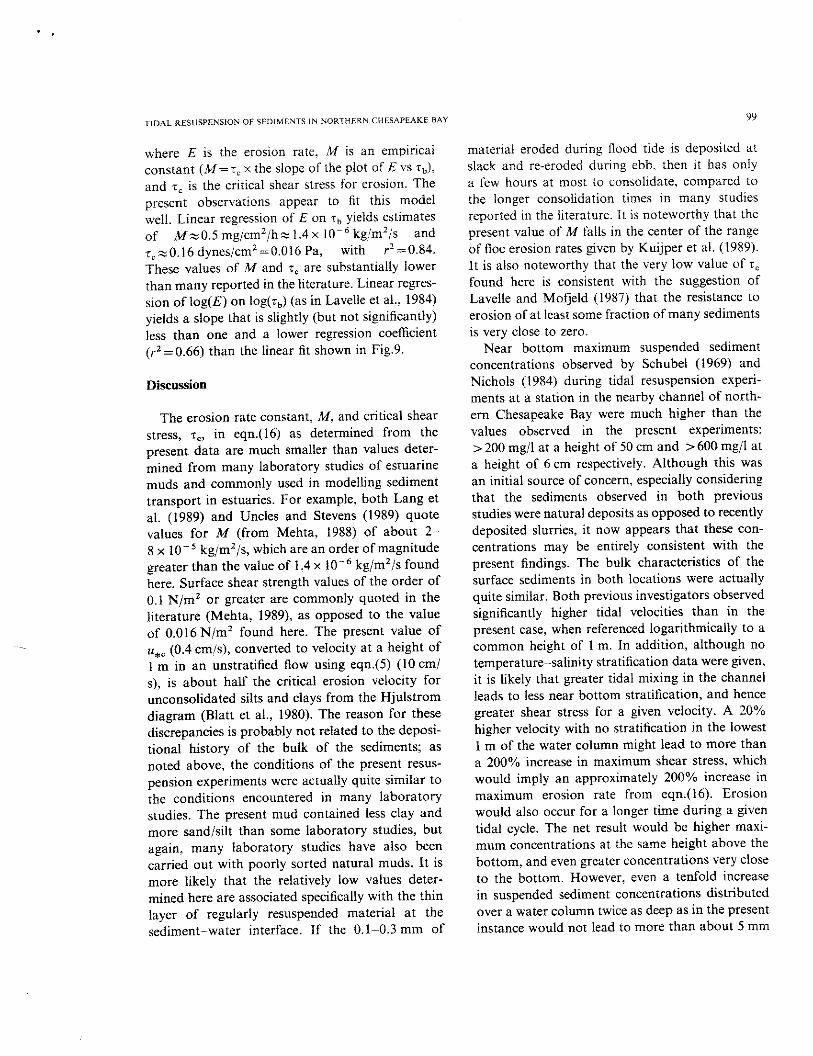
L P SANFORD EI h i
Distance Cross-shelf (km)
0 .I28 .256 .384 .512 .640
Fig.2. 5 kHz echosounder iniage collected on 12129'88 running from west of disposal area D east through the study site to the center of the dredged navigation channel. The study site was located at km 0.256; lighter lens of newiy deposited sediment is visible over darker pre-disposal bottom.
from the sediment surface to the pre-disposal horizon in the cores as compared to 300 kHz acoustic profiles. The effect of core shortening was removed by adding back a volume of water suffi- cient to lengthen each core to agree with an independent acoustic measure of core thickness. This correction is only approximate and may slightly overestimate the water content of the near surface sediments, hut it probably provides a better estimate of in situ bulk properties. Both uncor- rected and corrected bulk properties are presented here.
Grain size analyses were performed on disaggre- gated sediment samples. Samples were wet sieved through a 4 4 mesh sieve to separate out the sand fraction. The silt and clay fractions were separated using a settling tube containing a solution of sodium hexametaphosphate. The various size fractions were then dried and weighed, and percent sand, silt and clay were used to classify the sediment according to the nomenclature of Shepard (1954).
Prior to each resuspension experiment. an Endeco SSM current meter was moored about 150 m from the site at a height of about 1 m above the bottom, k0.1 m due to gradual sinking of the anchor. The current meter was set to sample conductivity, temperature and vector averaged velocity at 5 min intervals for the duration of the resuspension experiment. These measurements were to serve as checks on the accuracy of ship- hoard current profiles, and to provide information about high frequency variability in current and salinity that could not be ohtained from the profil-
ing measurements. The moored Endeco SSM is referred to below as the reference current meter.
During the resuspension experiments, hourly depth profiles of current, conductivity, temperature and turbidity were measured from the R.V. Discov- ery, which was triple point anchored to ensure minimum contamination of the data from platform motion. Winds and waves were benign throughout both experiments. such that vessel motion was virtually non-existent. Current velocity, conductiv- ity, temperature and depth (pressure) were mea- sured using an Interocean S4 current meter suspended from a davit on the starboard side of the vessel. Turbidity was measured with a Sea Tech 5 cm pathlength transmissometer suspended from a metered davit on the port side of the vessel. Five minute averages were ohtained sequentially at four to six depths below the surface, and the sequence was repeated once each hour for 12 h, for a total of thirteen profiles.
Turbidity measurements were converted to sedi- ment concentration using a laboratory derived calibration based on suspensions of sediment from the disposal site. Salinity (in psu) was calculated from conductivity and temperature using a stan- dard algorithm, and density (as 0,) was similarly calculated from salinity and temperature. Depth below the surface was converted to height above the bottom by subtraction from the total water depth, as measured from the vessel's depth tinder (corrected for transducer depth below the water line). The total possible error in height above the bottom so measured was estimated to be less than


Copyright © 2022 FDOKUMEN