Thermal History of the Chesapeake Bay Impact Crater
41
Thermal History of the Chesapeake Bay Impact Crater S.V. Harvey Thesis submitted to the Faculty of the Virginia Polytechnic Institute and State University in partial fulfillment of the requirements for the degree of Master of Science in Geosciences T.J. Burbey, Chairman M.E. Schreiber J.F. Read May 13, 2004 Blacksburg, Virginia Keywords: Impact Crater, Brine, Phase-separation, Thermal Maturity, Vitrinite Reflectance
-
Upload
khangminh22 -
Category
Documents
-
view
1 -
download
0
Transcript of Thermal History of the Chesapeake Bay Impact Crater

Thermal History of the Chesapeake Bay Impact Crater
S.V. Harvey
Thesis submitted to the Faculty of the Virginia Polytechnic Institute and State University
in partial fulfillment of the requirements for the degree of
Master of Science
in
Geosciences
T.J. Burbey, Chairman
M.E. Schreiber
J.F. Read
May 13, 2004
Blacksburg, Virginia
Keywords: Impact Crater, Brine, Phase-separation, Thermal Maturity, Vitrinite Reflectance

Thermal History of the Chesapeake Bay Impact Crater
S.V. Harvey
(Abstract)
Anomalously high groundwater salinities exist within the syn-impact sediment of the Chesapeake Bay impact crater, including an unexplained brine. This brine may be the result of phase-separation of seawater that occurred within the syn-impact sediments as underlying deformed and possibly melted basement rock cooled following impact. The 85 km wide crater has been described as a complex peak-ring crater; created 35.8 million years ago in the then submerged unconsolidated sediments of the Atlantic Coastal Plain and now completely buried by post-impact sediments. An annular trough with relatively undisturbed basement surrounds a ~38 km diameter inner basin with a peak ring and central uplift. The basement surface within the inner basin was modified by the impact and is projected to be approximately 1.6 km below sea level.
Geothermometry and advective and conductive heat flow modeling was performed to characterize a possible post-impact hydrothermal system. Thermal maturity and radiogenic techniques were used to estimate the temperature history of the crater sediments. Core samples from one borehole just outside the crater, two within the annular trough, and one shallow borehole within the inner basin were examined. Numerical heat and fluid flow models were developed using a range of likely sediment parameters and basal heat flow values to determine if phase-separation temperatures were likely to have occurred, and to evaluate what affect, if any, lithostatic overpressures may have had on post-impact cooling.
Geothermometry results indicate that no detectable thermal anomaly exists within the syn or post-impact sediments at these boreholes; however, no data are available within the deep inner basin where temperatures were likely to have been higher. Samples from existing boreholes suggest that sediment are organically immature and likely were never heated above ~40°C for a geologically significant period of time. These results support apatite He (U/Th) and previously published apatite fission track radiogenic ages indicating no Cenozoic resetting. Heat flow simulations indicate that a high temperature (>400°C) hydrothermal system could have existed within the inner basin and not caused any measurable effect on thermal maturity in the annular trough and shallow portion of the inner basin. Results also indicate that phase-separation could have occurred in the syn-impact sediments using reasonable estimates of basal heat flow, permeability, thermal conductivity, and porosity values, and that overpressures resulting from rapid deposition of syn-impact sediments dissipate within a few thousand years and are not an important heat transport mechanism.

Acknowledgements
I would like to thank the following individuals for there gracious assistance and
guidance:
Dr. Tom Burbey Virginia Tech
Dr. Madeline Schreiber Virginia Tech
Dr. Fred Read Virginia Tech
Dr. James Spotila Virginia Tech
Dr. Robert Bodnar Virginia Tech
Dr. Peter Reiners Yale University
I am grateful for the assistance of the U.S. Geological Survey; with out the samples,
equipment and materials it provided this project would not have been possible. Most
importantly, the expertise and encouragement of the following individuals is appreciated:
Lucy Edwards
Greg Gohn
Paul Hackley
Randy McFarland
David Powars
Peter Warwick
Special thanks to Colleen Mccarten of the U.S. Geological Survey for the long hours she
spent with me preparing samples. I would also like to thank my wife Rachel for her
support and understanding while we have been apart these past two years.
iii

This thesis is dedicated to the men whose names are inscribed on War Memorial Chapel.
iv

Table of Contents
Introduction...................................................................................................................1
High Salinity Groundwater…...........................................................................3
Objectives………………………………………………...........................…..4
Methods and Procedures..............................................................................................5
Thermal Maturity..............................................................................................5
Sampling................................................................................................5
Concentration of Organic Matter and Sample Preparation....................6
Maturity Measurement Techniques.......................................................7
(U-Th)/He Thermochronometry........................................................................8
Numerical Modeling.........................................................................................9
Heat Conduction Simulations...............................................................9
Conductive/Convective Simulations...................................................11
Governing Equations..............................................................11
Model Domain.......................................................................12
Boundary and Initial Conditions............................................14
Layer Parameters...................................................................14
Measured Parameters..................................................15
Calculated Parameters.................................................16
Overpressure Simulation Parameters..........................18
Results and Discussion................................................................................................20
Thermal Maturity Analysis.............................................................................. 20
Apatite Radiogenic Ages..................................................................................21
Thermal Maturity Modeling.............................................................................23
Overpressure Simulations.................................................................................23
Phase-Separation Simulations..........................................................................25
Conclusions..................................................................................................................29
References Cited..........................................................................................................31
Vita................................................................................................................................35
v

List of Tables and Figures
Figure 1 - Location of crater features and boreholes cited in text………………….….1
Figure 2 - Generalized cross-section through western half of crater…………………..2
Figure 3 - P-T-x diagram for NaCl 3.2 weight % water……………………………….4
Figure 4 - Relationship of vitrinite reflectance and maximum temperature…………...6
Table 1 - Thermal Alteration Index equivalents over the range of results…….…….....8
Table 2 - Parameters used for conductive modeling………………………………….10
Figure 5 - Heat flow into base of sediment layer for 1-D conductive simulations…...11
Figure 6 - Basin model cross-section............................................................................13
Figure 7 - Heat capacity as a function of temperature……………………………..…15
Table 3 - Results of decompaction of syn-impact sediments………….……………...17
Table 4 - Summary of layer parameters used for basin modeling…….……………....20
Table 5 - Thermal maturity data…………………….…………………………….......22
Figure 8 - Simulated overpressure at the center of the inner basin ……….……...…..24
Figure 9 – Temperature profiles at the center of the inner basin for simulations
that had a lithostatic and hydrostatic initial pressures condition..................................24
Table 6 – Modeling parameters used for a porosity of 42 and 43%............................ 26
Figure 10 – Specific discharge and ground water flow directions for measured
parameter set and calculated parameter set simulations...............................................27
Figure 11 - Temperatures for measured parameter set and calculated parameter set
simulations ...................................................................................................................28
vi

Introduction
An area of anomalously high salinity within the deep ground water system of the
Virginia coastal plain sediments was discovered while searching for water resources
during World War II (Cederstrom, 1943). This “salt-water wedge” is now recognized as a
likely result of comet or asteroid that struck the Atlantic continental shelf 35.8 Ma
(Powers and Bruce, 1999). The target was comprised of ~300m of seawater, 0.5-1.5 km
of Cretaceous - Eocene semi-consolidated sediments, and a granite basement (Poag et al.,
2004). The result is the ~85 km wide Chesapeake Bay impact crater, presently buried by
200 – 500 m of post-impact deposits. The crater has been characterized by seismic and
gravity surveys, geophysical well logging, and several boreholes (Powars and Bruce,
1999; Powars, 2000; Poag et al., 2004). The structure is divided into an annular trough,
peak ring, inner basin and central peak (Figures 1 and 2).
Figure 1) Location of crater features and boreholes cited in text.
1

Figure 2) Generalized cross-section from A-A’ (Figure 1) through western half of crater
with major structural features and relative locations of boreholes sampled for geothermometry.
The lowermost syn-impact unit is the Exmore Megablock beds, which have been
detected in the annular trough in seismic sections, and sampled at three boreholes. This
unit is approximately 200m thick within the western annular trough, has a highly
irregular upper surface and consists of slumped and rotated blocks of pre-impact
sediment (Poag et al., 2004). These mega-block beds thin toward the peak ring and are
not detectable on seismic sections within the inner basin. Approximately 200 to 300m of
polymictic, alternately clast- and matrix-supported Exmore breccia overlies the mega-
block beds in the annular trough (Poag et al., 2004). The breccia is estimated to have a
present day thickness of 1.2 km within the inner basin. However, no borehole extends
into the granite basement to confirm this. The Chickahominy clay formation overlies the
syn-impact sediments and deposition began immediately following the impact and
2

continued for at least 2.1 m.y. This formation is bounded by an Eocene-Oligocene
unconformity and is preserved almost exclusively within the crater (Poag et al., 2004).
High Salinity Groundwater
The Coastal Plain aquifer system consists of a thickening wedge of alternating
aquifers and confining units, the thickest and most important of these aquifers predate the
impact. Within the annular trough, pre-impact aquifers were disrupted and replaced with
low permeability syn-impact sediments that currently contain brackish water of
increasing salinity toward the inner basin. North and south of the crater fresh ground
water extends further seaward and is found at greater depths than inside the crater.
Elevated salinity in the annular trough is attributed to incomplete flushing of seawater in
the relatively low permeability syn-impact sediments (McFarland and Bruce, 2004).
Inside the inner basin at Kiptopeke, VA (Figure 2), chloride concentrations within
the syn-impact sediments are ~ 25,700 mg/L, indicating a brine with a salinity 1.3 times
that of seawater (Richardson, 1992). Possible explanations for this salinity include the
presence of evaporate beds in the target sediments (Poag, 1997), the migration of brines
from Jurassic salt beds located outside the crater (Meisler, 1989) and flash evaporation of
a large volume of seawater during the impact explosion (Poag, 2004). Sanford (2004)
modeled an ephemeral hydrothermal system in the syn-impact sediments that would
cause sub-critical two-phase separation of pore fluid. Simple analytical models indicate
that a brine created shortly after the impact could be conserved despite molecular
diffusion and freshwater flushing during the subsequent 36 m.y. (Sanford, 2003), and
isotopic ratios indicate that within the western annular trough, through which fresh water
recharge would enter the inner basin, pore fluid is at least 2 m.y. old (McFarland and
Bruce, 2004). The approximate pressure-temperature-phase diagram for seawater is
shown in Figure 3 for the pressure range likely found within the crater sediments. If pore
fluid entered into the two-phase region following the impact, it would separate into a high
density, high salinity conjugate as well as a low density, fresh phase. The dense brine
would be preferentially retained by syn-impact sediments and the more buoyant fresh
phase would flow upward. This process has been observed at sea-floor hydrothermal
3
vents (Von Damm, 1997). Apatite fission track analyses indicates that basement rock
within the annular trough at the Bayside and Langley boreholes were not heated above
~110°C following the impact, and therefore could not have created phase-separation in
the overlying sediments (Horton et al., 2002). However, within the inner basin, based on
scaling relationships and numerical modeling, a melt sheet or a region of high
temperature deformed basement rock may have existed that could have provided the heat
necessary for this hydrothermal system. (Crawford ,2002; Collins and Melosh, 2004).
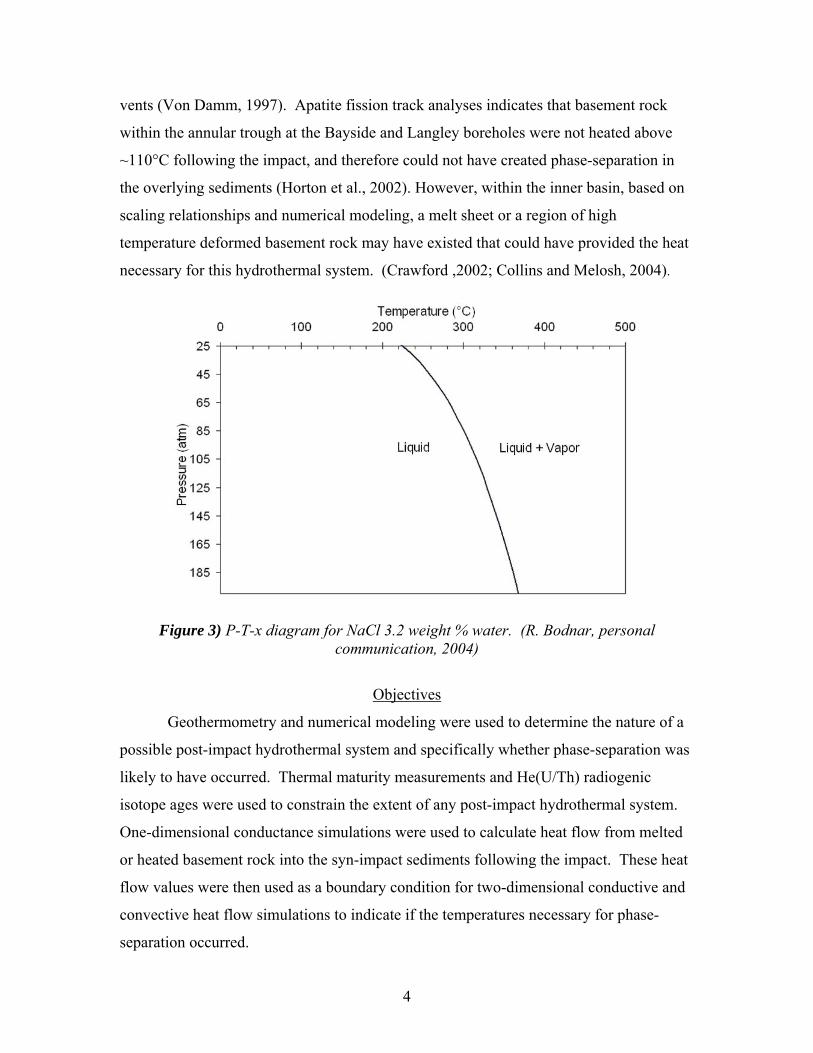
Figure 3) P-T-x diagram for NaCl 3.2 weight % water. (R. Bodnar, personal
communication, 2004)
Objectives
Geothermometry and numerical modeling were used to determine the nature of a
possible post-impact hydrothermal system and specifically whether phase-separation was
likely to have occurred. Thermal maturity measurements and He(U/Th) radiogenic
isotope ages were used to constrain the extent of any post-impact hydrothermal system.
One-dimensional conductance simulations were used to calculate heat flow from melted
or heated basement rock into the syn-impact sediments following the impact. These heat
flow values were then used as a boundary condition for two-dimensional conductive and
convective heat flow simulations to indicate if the temperatures necessary for phase-
separation occurred.
4

Methods and Procedures
Thermal Maturity
The thermal maturation of organic matter can be measured and used to determine
the maximum past temperatures of sediments within a range of ~ 40-200 °C. Most
sediments contain minor amount of organic matter such as pollen, spores and plant debris
and as they are heated the organic matter undergoes a series of chemical changes termed
maturation (Brooks, 1981). Two measures of thermal maturity were used: vitrinite
reflectance and the thermal alteration index technique. Vitrinite is derived from the cell
walls of woody plant debris, and increases in reflectivity from 0.2% - 4.0% as it matures
(Brooks, 1981) The vitrinite reflectance technique measures the percent reflectance in oil
(%Ro) of polished vitrinite particles. Figure 4 shows the maximum temperature and %Ro
relationship given by Barker and Pawlewicz (1994) for %Ro between 0.2-2.0. Spores and
pollen deposited in sediments change color from pale yellow to orange to brown to black
as they mature (Traverse, 1988). These colors have been indexed to %Ro, and can be
used to compliment vitrinite reflectance measurements. This approach is termed the
Thermal Alteration Index (TAI) technique and uses subjective ranking by color of spores
and pollen in transmitted light.
Sampling
Thermal maturity of the syn-impact and post-impact deposits was measured to determine
the temperature history at four boreholes; Kiptopeke, Bayside, Langley, and Jamestown.
These sites are within the inner basin, inner annular trough, outer annular trough and
outside the crater (Figures 1 and 2). All boreholes were cored into basement rock with
the exception of Kiptopeke, which extends only 134m into the syn-impact sediments.
Samples were taken from pre-,syn-, and post-impact formations. Samples from the
Chickahominy formation may have been affected by a post-impact hydrothermal system
if it lasted tens or hundreds of thousands of years; however, post-Eocene sediments
would not have been affected and were used to insure the reliability of measurements.
Based on their current burial depth, sediments in these boreholes should have %Ro <0.3,
indicating maximum temperatures < 40°C. Any maturity >0.3 %Ro in syn-impact
sediments is anomalous and can be ascribed to the effect of the impact.
5

Figure 4) Relationship of vitrinite reflectance and maximum temperature (Barker and
Pawlewicz, 1994). Shaded region is expected value for Coastal Plain sediment < 700m deep.
Concentration of Organic Matter and Sample Preparation
The concentration of organic matter from core samples for maturity measurement
was performed at the U.S. Geological Survey’s Stratagraphic Palynology Lab from 2001-
2004 using standard palynological techniques (Edwards and Powars, 2003). Core
samples of 45-65 grams were digested in hydrochloric and then hydrofluoric acid. The
residual was suspended in a soap solution and centrifuged for 5 minutes. The suspended
clay was discarded and this was repeated until most of the clay fraction had been poured
off. The remaining sample was covered with a 2.0 g/mL density zinc-chloride solution.
A pipette was used to remove the floating organic material that was then washed in water
and sieved.
Some of the organic matter used for vitrinite reflectance had been previously
prepared for palynological study, and processing varied from the standard procedure
described above. After the zinc chloride floatation, these samples were digested for five
minutes in 35% nitric acid, oxidized for five minutes in 5% ammonia solution and stained
with bismarck brown dye. Oxidation may increase vitrinite reflectance (Stach et al.,
6

1982) or suppress it (Heroux et al., 1979), and the staining could have an unknown effect.
This potential problem is overcome through polishing of the sample, which exposes a
fresh unaffected surface inside of the individual vitrinite particle.
TAI samples were obtained from all boreholes except Bayside, which had not
been drilled at the time. TAI samples were mounted in glycerin jelly on glass slides with
coverslips for analysis. As many as four slides were made for each sample, depending on
the volume of the sample. For vitrinite reflectance measurement, non-fluorescing, cold
drying epoxy was cast into one-inch in diameter pellets. The sample material was dried at
< 30 °C and placed on the pellets with a small amount of fresh epoxy. Pellets were
polished for petrographic analysis following procedure of Pontolillo and Stanton (1994).
Maturity Measurement Techniques
Forty-four slides from 25 core samples were examined to determine TAI maturity
using a Nikon optiphot microscope at various magnifications. A diagram composed of
11 color swatches from Traverse (1988) was used as a standard for comparison with
collected samples. A value of 1 represents light yellow at one end of the spectrum, while
to a value of 11 represents black. The identity of slides was concealed from the
microscope operator, and each slide was examined three separate times to ensure
reproducibility. Final values were reasonably consistent (averaging ±1) for slides from
identical samples and between each of three separate examinations. This standard was
somewhat arbitrary because of the difficulty of comparing the colors of translucent
palynomorphs and opaque printed paper. For this reason, these values were interpreted to
be relative and not absolute and are considered pseudo-TAI. Nine slides spanning the
range of pseudo-TAI values were sent to Humble Geochemical Services Inc. for analysis.
Using the relationship between these 9 TAI values and previously determined pseudo–
TAI values, the remaining slides were converted to the Humble TAI scale (Table 1). The
correlation of TAI to vitrinite reflectance (% Ro) equivalent was determined by Humble
Inc. TAI results are reported in equivalent %Ro.
7

Humble TAI Palynomorph Color Pseudo TAI Equivalent %Ro
1 Green - Light Yellow 1 - 3 .200
1.5 Yellow 3 - 4.2 .250
2 Yellow - Orange 4.2 - 7.5 .270
2.5 Orange - Brown 7.5 - 8 .500
Table 1) Thermal Alteration Index equivalents over the range of results.
Vitrinite reflectance was measured on twenty-eight core samples at the U.S.
Geological Survey’s Eastern Region Coal Lab. Measurements of random reflectance of
vitrinite in immersion oil were performed following ASTM D2798 on a Leitz Orthoplan
microscope outfitted with a photomultiplier tube at a total magnification of 500x (ASTM,
2002). Nine core samples did not have sufficient identifiable vitrinite for measurement.
Between 20-100 measurements were recorded for each pellet, and %Ro is reported as the
mean of these measurements. Oxidation rims of higher reflectance and particle edges
with brown stain were observed in some of the oxidized and stained samples. Only the
centers of these samples were measured. Vitrinite was identified by relief, morphology
and relative brightness, and all unstructured vitrinite was measured. The relative
reflectance of particles identified as liptinite (waxy and resinous plant debris), inertinite
(fossilized charcoal) and vitrinite compared favorably to those described by Sotirov et al.
(2002), indicating that vitrinite was properly identified. Only primary vitrinite is
reported; that is the vitrinite population with the lowest reflectance value distribution.
Primary vitrinite represents the true thermal maturity of the sediments where recycled
vitrinite from older more mature sediments does not (Dow and Connor, 1982). The 20-
100 reflectance measurements for each sample have generally Gaussian distributions.
(U-Th)/He Thermochronometry
The apatite (U–Th)/He radiogenic technique (AHE) uses the ratio of parent-
daughter products to calculate the time that a crystal has been below a closure
temperature of ~75 °C (Wolf et al. 1996). 4He nuclei are produced by the series decay of 238U, 235 U, and 232Th and retained in apatite below this closure temperature. Two
8

sediment samples from the Bayside borehole were amalgamated from depths of 321 and
350 m for AHE analysis. Clear, euhedral, and inclusion free grains were hand selected
and measured for U, Th and He following the procedure of Ehlers and Farley (2003).
Ages were corrected for alpha particle ejection as described in Farley et al. (1996).
Numerical Modeling
Numerical models were constructed to determine the reasonableness of the phase-
separation hypothesis. Simple 1-D heat conduction simulations are used to determine
heat flow from the basement into the syn-impact sediments. The results of these
simulations were used as a boundary condition for more comprehensive 2-D conduction
and convection simulations.
Heat Conduction Simulations
One-dimensional finite-element heat conduction simulations were constructed
using the HEAT code (Wohltz, 1991). This program uses an explicit finite differencing
scheme to solve the governing equation for diffusive heat flow, which is expressed as:
2
2
zTk
zT
zk
tT
zz
∂∂
+∂∂
∂∂
=∂∂ (1.1)
where T is temperature, t is time and k is the thermal diffusivity and is related to thermal
conductivity (K), density (ρ) and specific heat capacity (Cp) by:
CpKkρ
= . (1.2)
This model is conceptualized as a two-layer system, with the lower layer
representing 14.6 km of basement rock, and the upper layer representing 1.4 km of
sediment within the inner basin. A spatial grid size of 100m is used resulting in 160
cells. Thermal boundary conditions include a temperature of 10°C at the top and 378°C
at the bottom. These boundary temperatures are based on approximate temperature at a
depth of 300m below sea level and the current geothermal gradient. Layer parameters
dictate the thermal diffusivity and are presented in table 2. Thermal conductivities and
heat capacities used for the syn-impact layer and basement layer correspond to ranges
determined for sandstone and granite, respectively (Lide, 1997; Cardarelli, 2000).
9

Bulk Density Thermal Conductivity Heat Capacity
g / cm2 cal / cm sec °C cal / g °C
Syn-impact 2.35 0.0038 .22
Basement 2.7 0.0050 .19 Table 2) parameters used for conductive modeling.
Five thermal scenarios were executed on the basis of the range of residual
temperatures from the hydrocode impact models of Crawford (2002) and Collins and
Melosh (2004). These scenarios represent the range in thickness of a melt sheet or near
melt temperature basement rock that may have occurred within the inner basin and are
300, 600, 1000, 1500 and 2500m. The initial temperature at these top thicknesses of
granite basement is 1000°C for each of these five scenarios, respectively. Above and
below the 1000°C region, a thermal gradient of 21°C/km was used in the granite layer
and 37 °C/km in the sediment layer, which approximates the current value (Costain and
Speer, 1988). A 20-year time step was used for a duration of 1 m.y. The temperature
gradient at the lowest element of the sediment layer was recorded at intervals as the
simulation progressed and as the basement rock cooled. These values were used to
calculate heat flow into the syn-impact sediments. Figure 5 shows heat flow evolution
with time for each of the five scenarios. Maximum heat flow occurs after ~ 500 years,
and is the result of heat capacity limiting the rate of heat transfer from the granite
basement layer into the overlying sediment layer. The heat flow values from these five
scenarios are used in the two-dimensional hydrologic basin modeling, and are referred to
by their initial thickness of 1000°C basement rock.
10

Figure 5) Heat flow into base of sediment layer for 1-D conductive simulations.
Conductive/Convective Simulations
Two types of basin modeling were performed: Phase-separation simulations and
overpressure simulations. Sediment compressibility was ignored in the phase-separation
simulations, which focused on determining if phase-separation of pore fluid occurred.
These simulations use two end member syn-impact parameter sets, described below.
Phase-separation simulations were performed with each of these parameter sets using the
five heat flow scenarios shown in Figure 5 as a boundary condition. Temperature and
pressure results from these 10 simulations were compared to the P-T-x curve for seawater
(Figure 3) to determine if phase-separation conditions were achieved. Sediment
compressibility was accounted for in the overpressure simulations to reproduce the
pressure conditions expected to have occurred following the rapid deposition of syn-
impact sediments.
Goverening Equations
Two-dimisional conductive and convective modeling was performed using the
Basin2 code (Bethke et al., 1999). Basin2 uses a curvilinear coordinate system and a
11

time-weighed differential equation scheme. Darcy’s law governs fluid flow in the z
(vertical) and x (horizontal) directions:
⎟⎠⎞
⎜⎝⎛ −∂∂−
=− gzPkq z
z ρµ (2.1) ⎟
⎠⎞
⎜⎝⎛
∂∂
−∂∂−
=−xzg
xPkq x
x ρµ (2.2)
where q is specific discharge, k is permeability, µ is fluid viscosity, and ρ is fluid density.
Equations 2.1 and 2.2 account for flow caused by thermal pressuring, and buoyant flow
caused by density gradients. Heat transfer in the z and x directions is governed by the
relation:
wxzxzH hqtTxzKq ),()(),( , ρ+⎟⎠⎞
⎜⎝⎛∂∂
−=− (2.3)
where qH is heat flux and hw is fluid enthalpy. The first term on the right-hand-side
accounts for conductive heat transport and follows Fourier’s law while the second term
accounts for convective transport.
A post-impact hydrothermal system may have had a relatively short duration and
resulted in rapid heating and cooling rates and, therefore, a simple maximum temperature
model like that of Barker and Pawlewicz, (1994) would not accurately calculate vitrinite
reflectance. For these simulations, vitrinite reflectance is calculated at each node
according to the chemical kinetics model of Sweeney and Burnham (1990). This kinetic
model is valid with heating rates at least as high as 50 °C / year, and is accurate within
the range of 0.3 - 4.5 %Ro. Computed %Ro at the projected location of thermal maturity
samples were compared to the measured data to determine if they were in agreement.
Fluid viscosity, density and heat capacity vary according to data compiled from
Phillips et al. (1981). Viscosity and heat capacity are functions of temperature, while
density is a function of both pressure and temperature.
Model Domain
The model domain is represented as a 44 km wide region extending from the
outer rim to the central peak of the crater as shown in Figure 6. As a result of the
12

curvilinear coordinate system, element thicknesses (∆z) vary across the domain according
to the total thickness sediment in each column. Elements were initially set to be 500 m
wide (∆x) and have a maximum thickness of 20 m. Simulation results were found to be
insensitive to a doubling of element thickness, and some simulations used a ∆z of 35m.
Sensitivity of simulation results to ∆x depended on the sediment parameter set used. In
order to speed calculations while ensuring numerical accuracy, ∆x in some simulations
was increased to1,000m wide and in others was decreased to 250m. Water salinity is set
at a constant concentration of 0.5 molal NaCl as a proxy for seawater. The bottom of the
model represents the basement-sediment contact. To reduce numerical error, the slope of
this basement surface is subdued somewhat at the transition into the inner basin from
what had been interpreted on seismic profiles (Poag et al., 2004). Two parameter layers
are used and represent the syn-impact sediments and the Chickahominy formation,
respectively. All syn-impact sediments are assumed to exist at the start of the
simulations, and have a thickness of 400-1400m (Figure 6). During the simulations,
110m of Chickahominy formation sediments are added to the top of the model at a rate of
50m / m.y., which is based on Poag et al. (2004). The time range of the simulations was
2.1 m.y., which represents the time from just after the impact until the end of preserved
Eocene sediments.
Figure 6) Basin model cross-section at 2.1 m.y. with relative locations of three boreholes used in thermal maturity study. Numbers indicate pressure (P) and temperature (T) boundary conditions: 1) constant P and T, 2) hydrostatic P and no-conduction 3) no-flow, no-conduction 4) no-flow and constant heat flux 5) no-flow, variable heat flux 6) no-flow, variable heat flux. Coordinate axis in km.
13

Boundary and Initial Conditions
The locations of boundary conditions are labeled by number in Figure 6. The
uppermost boundary (1) represents a constant temperature and pressure boundary of 10°C
and 30 atm to reflect conditions 300m below sea level, the estimated depth of the
sediment surface during the Eocene (Poag, 2004). The left-hand side boundary (2)
represents a hydrostatic pressure distribution and no-conduction boundary. The right
hand side (3) is a symmetry plain represented by a no-flow and no-conduction boundary.
The latter boundary condition can be assumed because maximum temperatures would
have occurred at the center of the crater, creating divergent flow along the symmetry
plain. The bottom of the model represents a no-fluid flow and variable heat-flux
boundary. A regional heat flow value of 1.4 heat flow units (cal/cm2 sec*10-6) is used in
the annular trough (4) based on the average of six boreholes in and around the crater
(Costain and Speer, 1988). Heat flow in the inner basin and central peak (5) varies
according to which of the five heat flow scenarios shown in Figure 5 are applied. Heat
flow is assumed to decrease linearly from the heat-flow scenario value within the inner
basin to the regional value of 1.4 HFU at the peak ring (6).
For the overpressure simulations, syn-impact sediments were initially assigned a
lithostatic (200 atm/km) or hydrostatic (100 atm/km) fluid pressure and a homogenous
temperature of 25°C. For phase separation simulations, initial conditions of temperature
and pressure were those from the steady state solution for a uniform heat flow of 1.4
HFU.
Layer Parameters
Three sets of porosity, permeability and thermal conductivity values were used for
the syn-impact layer, one measured, one calculated, and one for the overpressure
simulations. The measured parameter set was derived from the averages of laboratory
measurement on cores, and approximates the present day conditions of syn-impact
sediments. The calculated parameter set was based on the assumption a higher Eocene
porosity and involves the use of empirical relationships found in other basins to estimate
the permeability and thermal conductivity for the syn-impact sediments at this higher
14

porosity. These two parameter sets were used in the phase separation simulations, where
compressibility of sediments was ignored. Therefore, porosity, permeability, and thermal
conductivity values were constant. For the overpressure simulations, a set of parameters
was used that allow for porosity, permeability and thermal conductivity to vary as the
syn-impact layer compact over time. Properties of the Chickahominy layer were the
same for all simulations, as well as grain density for both layers. Layer properties for
each parameter set are presented in Table 4.
Mineral grain heat capacity varies with temperature. Syn-impact sediments were
assigned the default heat capacity function for sandstone and the Chickahominy
formation was assigned the default heat capacity for shale found in the Basin2 code
(Bethke et al., 1999). These functions were used in all simulations and are shown in
Figure 7.
Figure 7) Heat capacity as a function of temperature using equations of Bethke et al.
(1999).
Measured Parameters
Laboratory measurements of cores from the Bayside, Langley and Watkins Mill
boreholes (Figure 1) were used to determine the current permeability, porosity, and grain
density of syn-impact and Chickahominy sediments (E.R. McFarland, personal
communication, 2003). Permeameter tests on fourteen samples from the syn-impact
sediments demonstrated highly variable permeabilities of -2 to -5 log darcy. Unlike a
shale or sandstone, the syn-impact sediments are not expected to be systematically
15

anisotropic at a laboratory scale, because they were deposited violently and do not have
fine sedimentary structures with horizontal orientation. The harmonic (-3.9 log darcy)
and geometric (-3.4 log darcy) means of these results were used as the vertical and
horizontal permeability for this parameter set. This reflects the bulk heterogeneity of the
syn-impact sediments. Syn-impact sediments are highly deformed and lack horizontal
bedding (Poag et al., 2004) indicating that the use of a geometric mean for Kx is more
appropriate than an arithmetic mean. The harmonic mean was used for Kz to account for
the generally fining-upward nature of the Exmore breccia. Porosity measured from these
samples varies between 22-36%, with a mean of 33%, which is used for this parameter
set. Three samples from the Chickahominy formation have a mean porosity of 48% and a
Kz of -2.9 log darcy. Horizontal permeability was set at -1.9 log darcy to reflect a 1/10
anisotropy ratio. Grain density for the Chickahominy and syn-impact layer were set at
their average measured values of 2.70 and 2.74 g/cm3, respectively. Costain and Speer
(1988) present measured thermal conductivity data for Atlantic Coastal Plain sediments,
and Powars and Bruce (1999) interpreted formation contacts in the boreholes they used.
From this data, a mean K of 0.0032 and 0.0044 cal/cm sec°C was found for the
Chickahominy formation and syn-impact sediments, respectively.
Calculated Parameters
The porosity of the syn-impact sediments was greater during the Eocene and this
has important ramifications for modeling because porosity affects both permeability and
thermal conductivity. Compaction induced subsidence of syn-impact sediments has
caused a thickening and sagging of the post-impact deposits into the crater (Poag et al.
2004) resulting in a record of subsidence that was used to determine the approximate
porosity that existed at the end of the Eocene. The preserved Chickahominy formation
represents deposition starting immediately following the impact and continuing for 2.1
m.y. The elevation of the top of the Chickahominy deepens significantly, or “sags”, up to
200m within the crater. This sag is proportional to the thickness of the underlying syn-
impact sediments. Preliminary benthic foraminiferal suites at the Kiptopeke and Langley
wells indicate similar paleo-depths (~300 m); however, the Chickahominy sags 148 m
between these two well locations (Poag et al., 2004) and this indicates that this sagging
16

occurred as a result of subsidence, which was used to determine the Eocene porosity of
the syn-impact sediments using a simple decompaction equation.
Formation contacts from the Langley, Bayside, North, Exmore, and Kiptopeke
boreholes (Figure 1) are used to estimate pre-subsidence thickness of the syn-impact
sediments. The Newport News borehole is outside of the crater but has a thin layer of
Chickahominy formation overlying 10m of syn-impact sediment. The elevation of the
top of the Chickahominy at Newport News is currently 93m below sea level. This
elevation was used as a datum to estimate the sag at the five boreholes within the crater.
Assuming incompressibility of mineral grains and fluid, and no basement subsidence, all
compaction is then the result of sediment compressibility. The porosity of syn-impact
sediments (θ), can be estimated using a current average porosity of 33%, the measured
sag of the Chickahominy (sc), and the present syn-impact sediment thickness (hp) at each
well by the relation:
)()( 33.0
cp
cp
shsh
++
=θ . (3.1)
Table 3 lists the reconstructed porosity values calculated from the sag for each of
the five wells within the crater. An average Eocene porosity of 45% is needed to account
for the measured sag of the Chickahominy formation. This porosity value is represents
an approximation because the present day porosity of 33% is not constrained within the
inner basin, and the sag may be partially attributed to incomplete filling of the crater with
syn-impact sediments. Furthermore, the decompaction method used is simplified and
assumes a constant porosity with depth. This estimated value of 45% is considered a
maximum end-member for Eocene porosity, and was used to calculate a second set of kz,
kx, and K parameter values for the syn-impact layer.
Borehole Syn-impact Thickness Chickahominy Sag Calculated Porosity Newport News 8.4m 0m NA
North 369m* 58m 42% Langley 390m 87m 45% Bayside 429m 120m 47% Exmore 980m* 242m 46%
Kiptopeke 1205m* 235m 44% Table 3) Results of decompaction of syn-impact sediments. Contact elevations were from
Poag et al., (2004). * estimated from seismic data.
17

The log of permeability (k) is empirically linked with porosity for a specific unit
of interest with coefficient A and scalar B according to the equation:
BALogk += θ (3.2)
found in (Bethke et al., 1999). Published porosity and permeability data and modeling
parameters indicate that values of coefficient A for sandstones and unconsolidated
sediments lie between 15–30 (Buschbach and Bond, 1974; Loucks et al., 1984; Flemings
et al., 2001; Bloch, 2001; Sanford and Konikow, 1989; Chomisky, 2002) and 8-9 for
shale (Bethke et al., 1999; Neuzil, 1994). The mean value of A=15 is used to calculate
the permeability of syn-impact sediments at a porosity of 45% using equation 3.2. The
scalar B is adjusted using the measured parameter values for porosity (33%) and
permeability, kz (-3.9 log darcy), and kx (-3.5log darcy). The result is a calculated value
for kz and kx of -2.1 and -1.6 log darcy, respectively.
Increased porosity results in decreased thermal conductivity because water is
much less conductive then mineral grains. Thermal conductivity (K) and porosity are
empirically linked according to the following equation.
baK += θ (3.3) (Bethke et al. 1999)
The coefficient a was estimated for shale and chalk by Sclater and Christie (1980) to be
-4.4x10⁻³ cal/cm sec°C. Scalar b was adjusted so that at 33% porosity, thermal
conductivity was at its measured value of 4.39x10⁻³ cal/cm sec°C. For a porosity of 45%,
a K of 3.7x10⁻³cal/cm sec°C is calculated.
Overpressure Simulation Parameters
Syn-impact sediments were emplaced in a matter of hours and had near lithostatic
pressures immediately following the impact (Sanford, 2004). This overpressure would
result in temporarily higher porosity and permeability, and lower thermal conductance.
Vertical fluid flow would be rapid as fluid pressures dissipated and the sediment
compacted. Simulations were developed to examine whether the effects of lithostatic
overpressure had a significant affect on a possible post-impact hydrothermal system. In
order to simulate lithostatic overpressures, the syn-impact layer must account for
18

sediment compressibility and allow for variable porosity. Basin2 calculates porosity
according to the relation:
( ) 10 exp Φ+−Φ= Eβσθ (4.1)
of Bethke et al., (1999) ,where β is compressibility of the sediment, σE is effective stress,
and Φ1 and Φ0 are empirical coefficients. In normally pressured basins, σE is a function
of depth and β, and Φ1, and Φ0 can be calculated from porosity-depth profiles (Bethke,
1999). In boreholes where porosity data are available for the syn-impact sediments,
shallow burial depths and hydraulic pressures do not allow for the variables in equation
4.1 to be determined directly. An approximation of Φ0 and β was calculated using
porosity data obtained from the surface to a depth of 2 km at an exploratory borehole in
offshore New Jersey (Steckler et al., 1988). This borehole contains no syn-impact
deposits, but was used as an analog for semi-consolidated coastal plain sediments that are
considered to be at hydrostatic pressure. Based on the shape of the porosity-depth
profile, β and θ0 were calculated to be .0036 atm-1 and .56, respectively. The parameter
θ1 was adjusted to -0.11 so that surface porosity was 45% and average porosity in the syn-
impact layer was 33%, it’s present day measured value. Sclater and Christie (1980) use a
different compaction equation; however, the resulting porosity profile using these
parameters was approximately equivalent to their compaction relation for a shaley
sandstone and sandstone, assuming a surface porosity of 45%. The parameters used are
at the lower end of the reasonable effective stress – porosity relationship and would result
in relatively slow release of overpressures. In reality, porosities may have been higher at
the surface and would therefore have been more sensitive to overpressures.
Because porosity is variable in the overpressure simulations, permeability and
thermal conductance are also variable. Permeability varies according to equation 3.2. An
average value of A=15 was used to determine permeability for the calculated parameter
set; however a more conservative coefficient of A = 9 was used for the overpressure
simulations. This latter value constrains permeabilities to lower values, which effectively
retains overpressures for a longer period of time. Scalar B in equation 3.2 was adjusted so
that measured porosity and permeabilities matched, as was done for the calculated
19

parameter set. Thermal conductivity was allowed to vary with porosity according to
equation 3.3. The same coefficients of a and b that were used to calculate K at a 45%
porosity were used for these simulations.
In the overpressure simulations, bulk density was assumed to be a constant value
of 2.0 gm/cm3. Heat flow from the granite basement was varied according to the 2500m
heat flow scenario. Initial pressure conditions were lithostatic (~200 atm/km). A control
simulation using a hydrostatic initial condition was also developed.
Table 4) Summary of layer parameters used. A and a are coefficients used in equation 3.2 and 3.3.* these values were used to calculate kz,kx, and K and not actually used with
the modeling code.
θ K Grain ρ kx kz A a - cal/cm sec°C g/cm3 log darcy - cal/cm sec°C
Chickahominy 48% 0.0032 2.74 -1.9 -2.9 - - Syn-impact Measured 33% 0.0044 2.70 -3.4 -3.9 - -
Syn-impact Calculated 45% 0.0039 2.70 -1.6 -2 *15 *4.4x10-3
Syn-impact Overpressure equation 4.1 equation 3.3 Bulk ρ = 2.00
equation 3.2 9 4.4x10⁻³
Results and Discussion
Thermal Maturity Analysis
Nineteen samples were analyzed for vitrinite reflectance, 22 samples for thermal
alteration index, and one sample for AHE. Results indicate that no detectable thermal
anomaly occurred within the syn- or post- impact sediments within the western annular
trough or shallow inner basin.
Vitrinite reflectance results are consistent with the expected value of 0.2 - 0.3%
Ro for all samples. Results ranged from 0.154 - 0.266 %Ro with a mean of 0.219 (Table
5). The mean of the seven samples made with standard preparation and the 12 stained
and oxidized samples are equal (0.218). %Ro of two core samples prepared by both
methods differs by only 0.003 and 0.027, respectively. Therefore, the oxidized and
stained samples are considered representative of the true maturity of the sediments. The
20

results from 17 unique samples have a normal distribution and no correlation exists
between %Ro and depth or borehole. Yvon Heroux et al. (1979) indicates that an
imprecision in %Ro occurs for ranks below 0.3%. Therefore, some random variation in
%Ro between samples is expected considering experimental error and natural variation of
vitrinite.
Thermal alteration index results ranged from 1 - 2.5 on the Humble scale, and are
reported as an equivalent %Ro of .2 to .5 (Table 5). TAI values of 1 – 2 have an
equivalent %Ro range of 0.200- 0.270, indicating maximum sustained temperatures of <
40 º C (Barker and Pawlewicz 1994). TAI values of 1.5 and 2 are found in post impact
sediments in the annular trough (Langley) and outside of the crater (Jamestown). These
sediments would not have matured during a hypothetical post-impact hydrothermal
system and most likely, these values are the result of the imprecision of the TAI method.
Three samples within the syn-impact sediments at the Langley borehole have a TAI of
2.5, which deviate significantly from %Ro measurements at the same locations. Edwards
and Powars (2003) observe that some dinocysts in this interval are partially melted and
attribute this to the direct effects of the impact blast and air fall. These higher TAI values
may be the result of measuring pollen and spores that were similarly affected, and are
therefore not representative of the true maturity of the sediments. Similar higher rank
vitrinite populations may also exist, but would have been rejected as recycled vitrinite or
inertinite. The one syn-impact sediment sample analyzed within the inner basin had a
TAI value of 1.5, indicating a %Ro of 2.70. This sample is 134m below the top of the
syn-impact sediments and does not indicate that sediment in the lower ~1100m of the
inner basin is not thermal matured.
Apatite Radiogenic Ages
Alpha ejection corrected AHE ages of 121.8, 127.7 and 147.7 Ma were calculated
from three runs of five apatite grains each, indicating that isotope ratios were not
thermally reset by the impact. The apatite closure temperature of ~75 °C is not
necessarily meaningful for the expected high rates of heating and cooling and short
duration of a post-impact hydrothermal system. Farley and Kass (1997) present a
21

numerical code to calculate the AHE age for an arbitrary time - temperature history.
Using this numerical code and assuming a 20,000 year heating and cooling cycle, a
closure temperature of 130°C or greater is required to unambiguously reset the age. This
suggests that syn-impact sediments at Bayside were never above ~ 130°C, and supports
thermal maturity data.
Jamestown Bayside Depth (m) Formation Equivalent %Ro Depth (m) Formation Equivalent %Ro
10.9 Post-Eocene 0.200 101.0 Post-Eocene 0.234 13.2 Post-Eocene 0.250 183.5 Post-Eocene 0.234 25.4 Post-Eocene 0.200 246.3 Chickahominy 0.234 49.0 Pre-impact 0.200 248.6 Chickahominy 0.234 61.7 Pre-impact 0.250 321-350 Syn-impact <0.440** 62.5 Pre-impact 0.208 350.1 Syn-impact 0.250 62.5 Pre-impact 0.270 373.0 Syn-impact 0.201
399.6 Syn-impact 0.212 Langley 653.6 Syn-impact 0.218
Depth (m) Formation Equivalent %Ro 709.1 Basement <0.700* 102.1 Post-Eocene 0.270 155.8 Post-Eocene 0.270 Kiptopeake 235.1 Chickahominy 0.217 Depth (m) Formation Equivalent %Ro
235.1 Chickahominy 0.220 145.1 Post-Eocene 0.200 235.1 Chickahominy 0.270 324.1 Post-Eocene 0.154 235.8 Chickahominy 0.270 324.1 Post-Eocene 0.200 236.0 Syn-impact 0.270 345.6 Chickahominy 0.177 239.1 Syn-impact 0.270 345.6 Chickahominy 0.200 240.3 Syn-impact 0.241 383.1 Chickahominy 0.200 257.4 Syn-impact 0.246 529.1 Syn-impact 0.270 260.6 Syn-impact 0.270 354.9 Syn-impact 0.270 359.6 Syn-impact 0.234 359.6 Syn-impact 0.207 359.6 Syn-impact 0.500 392.3 Syn-impact 0.500 425.5 Syn-impact 0.250 426.8 Syn-impact 0.500 446.4 Syn-impact 0.266 626.3 Basement <0.700*
Table 5) Thermal maturity data, italicized %Ro values were stained and oxidized during preparation, bold %Ro values are from TAI data converted to equivalent %Ro. * AFTA measurements from Horton et al. (2002), equivalent max %Ro in Cenozoic. ** He(U/Th) data equivalent max %Ro in Cenozoic.
22

Data from all the above described analyses indicate that syn-impact sediments in
the annular trough were not heated to >40°C for a geologically significant period of time
by any post-impact geothermal system. Basement rock from the Bayside and Langley
boreholes show no evidence of impact related heating (Horton et al., 2002). Results of
these analyses spatially constrain any potential hydrothermal system to the inner basin,
where currently no deep (> 530 m) cores exists.
Thermal Maturity Modeling
Simulation results indicate that depending on the heat flow scenario used a
maximum thermal maturity of between 1.5 and 4.5 %Ro was achieved after just 5000
years within the deep inner basin. Results from all simulations indicate that the sediment
outside of the inner basin and within the upper 150m of the inner basin did not mature to
a value >0.3 %Ro. This is consistent with the results of the thermal maturity study and
radiogenic isotope ages. Measured geothermometry data does not reveal any thermal
anomaly associated with the impact cooling. However, no data is available within the
inner basin except at the top of the syn-impact layer and in post-impact sediments.
These simulations indicate that the measured thermal maturity data does not preclude the
possible existence of high temperatures, and therefore high maturity sediments, within
the inner basin following the impact.
Overpressure Simulations
Simulation results indicate that lithostatic overpressures quickly fall to near
hydrostatic in only 5000 years (Figure 8). Early in the simulation, effective stress is low
because of high fluid pressure. This causes relatively high porosity and permeability and
results in rapid vertical fluid flow out of the sediments and across the top constant
pressure boundary. As fluid pressure declines so does porosity resulting in a nearly
steady state hydrostatic profile after ~5000 years. In the control simulation,
overpressures were inhibited in order to determine what affect, if any, the overpressures
had on temperature distribution. Temperature profiles from both the overpressured and
the control simulation were very similar (Figure 9). A great volume of low temperature
initial pore-fluid was expelled vertically from the sediments during compaction; however,
23
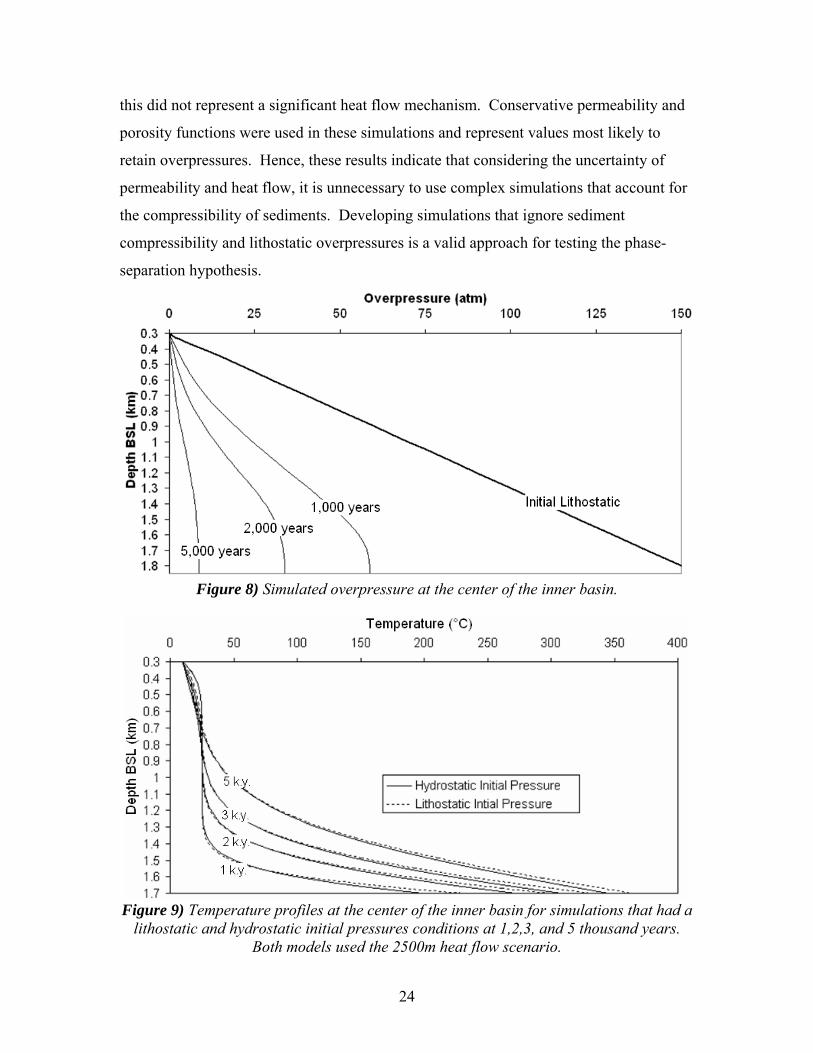
this did not represent a significant heat flow mechanism. Conservative permeability and
porosity functions were used in these simulations and represent values most likely to
retain overpressures. Hence, these results indicate that considering the uncertainty of
permeability and heat flow, it is unnecessary to use complex simulations that account for
the compressibility of sediments. Developing simulations that ignore sediment
compressibility and lithostatic overpressures is a valid approach for testing the phase-
separation hypothesis.
Figure 8) Simulated overpressure at the center of the inner basin.
Figure 9) Temperature profiles at the center of the inner basin for simulations that had a
lithostatic and hydrostatic initial pressures conditions at 1,2,3, and 5 thousand years. Both models used the 2500m heat flow scenario.
24

Phase-Separation Simulations
Calculated temperatures in the phase-separation simulations were very sensitive
to which of the two syn-impact parameter sets was used. Heat transport was dominated
by conduction in the measured parameter simulations and by convection in the calculated
parameter simulations. These different styles of cooling reflect the greater vertical
permeability and porosity in the calculated parameter set. Increased permeability allows
for greater specific discharge, and increased porosity allows for a greater fluid flux for
any given specific discharge. Figures 10 and 11 present the fluid flow and temperature
distributions at 3,000 years for simulations using the two parameter sets and the 2500m
heat flow scenario. In the measured parameter set simulation (Figures 10A and 11A)
vertical specific discharge is <3.5 cm/yr, causing slow convective heat transport. The
rate of heat transfer by conduction is limited by heat capacity; this causes heat to build up
proximal to the heat flow boundary, resulting in higher temperatures. Rapid convection
cells in the calculated parameter set simulation (Figures 10B and 11B) effectively
transports heat from the base of the sediment upward. The upward flowing component of
the convection cells discharge fluid across the top constant pressure boundary, whereas
the downward flowing components cause recharge to occur across this boundary. In
physical terms, warm pore fluid is expelled from the sediments into the ocean, and cold
seawater flows back in to replace it. This efficient system of removing heat from the
sediments results in computed temperatures that were to low to cause phase-separation in
any of the calculated parameter set simulations. This fluid exchange across the seafloor
may also explain a dead zone at the base of the Chickahominy formation. This layer is
19 cm thick at the Kiptopeke borehole, lacks indigenous biota, and represents <1,000-
10,000 years of deposition beginning immediately after impact (Poag, 2002). An upward
flux of warm pore fluid through this zone from migrating convection plumes may have
caused unusual bottom conditions unfavorable to microbiota.
Results from measured parameter set simulations did create phase-separation
temperatures. This result indicates that phase-separation of pore fluid is a possible
explanation for the brine found within the inner basin. Using the measured set of
parameters, phase-separation conditions are met when a heat flow scenario of 1000m or
25

greater is applied. Maximum temperatures were simulated to be as high as 475°C at the
deepest section of the inner basin. Phase-separation was simulated to begin after a few
thousands years within the inner basin and at the central peak. These simulations do not
account for phase-dependent fluid density, only temperature dependent density. After
phase-separation temperatures are reached, the simulations no longer accurately represent
advective heat flow. Therefore, only the onset of two-phase conditions, not the duration
and extent of these conditions, can be interpreted from these simulations.
Simulation results suggest that phase separation would have occurred if syn-
impact sediments were at a porosity of 33% or less and would not have occurred at a
porosity of 45% or greater. In order to constrain the range of porosity that would be
likely to have created phase-separation, intermediate values between 33 and 45% were
used to create new parameter sets in the same way that the calculated set was computed.
Permeability and thermal conductance were adjusted according to equations 3.2 and 3.3
using the values of the coefficients A, and a from Table 4. These intermediate parameter
sets were applied in simulations using the 1000, 1500, and 2500m heat flow scenarios.
Parameter computed using porosities of 42% or less was found to build up enough heat to
cause phase-separation using all three heat flow scenarios. At 43% porosity or greater no
heat flow scenario created phase-separation temperatures. Permeability and thermal
conductivity for these two parameter sets is shown in table 6. Phase-separation
simulations assumed a constant porosity; however, overpressure simulation results
indicated that at the base of the syn-impact layer, where phase-separation is most likely to
have occurred, rapidly compaction results in relatively lower porosity. This makes
phase-separation likely even if the average porosity in the syn-impact layer was 45%, as
indicated by decompaction. It is concluded that over most, but not all, of the range of
reasonable syn-impact parameters, phase-separation could have occurred; assuming that
at least 1000m of basement rock was near melting temperature following the impact.
Kx Kz K log darcy cal/cm sec°C
42% -2.1 -2.6 4.00x10⁻³
43% -1.9 -2.4 3.96x10⁻³
Table 6) Parameters used for a porosity of 42 and 43%.
26

Figure 10) Vertical specimeasured parameter set ain km. Note different velo
A
B
fic discharge and ground water flow directions (arrows) for a) nd b) calculated parameter set at 3,000 years. Coordinate axis
city scales.
27

Figure 11) Temperatures for A) measured parameter set and B) calculated parameter set
at 3,000 years. The coordinate axis is in km and contour interval is 100 °C.
28

Conclusions
An anomalous brine that is 1.3 times the salinity of seawater is found to reside
within the inner basin of the 36 m.y. old Chesapeake Bay impact crater. Based on the
results of this study, phase separation of pore fluid within the inner basin caused by
hydrothermal cooling of underlying granite basement rock is a reasonable explanation for
the creation of this brine.
If a high temperature post-impact hydrothermal system was created, it was limited
to the inner basin. Thermal maturity measurements of organic matter sampled from
boreholes indicate that syn-impact sediments within the annular trough and shallow inner
basin were never heated above ~40°C for a geologically significant period of time.
Numerical heat and fluid flow modeling suggests that even if a very large melt sheet (>2
km) existed within the inner basin, this would not create a measurable thermal maturity
anomaly within the annular trough or shallow inner basin.
Immediately following the impact, sediment rapidly filled the newly formed
crater, resulting lithostatic overpressures. Two-dimensional heat and fluid flow
simulations were developed to simulate the compaction of these sediments, accounting
for changes in porosity, permeability, and thermal conductance as fluid overpressures
dissipated. Simulation results suggest that these overpressures dissipated quickly (~5,000
years) and were not an important mechanism in post-impact cooling.
Phase-separation within the syn-impact sediments was possible for most
reasonable heat flow values originating from the granite basement rock, and estimated
sediment parameters of porosity, permeability, and thermal conductance. Heat flow
simulation results indicate that using measured present day values of porosity,
permeability and thermal conductivity, phase-separation can occur so long as a body of
melt or near melt temperature basement rock was at least 1,000m thick within the inner
basin.
29

A simple decompaction method was used to estimate a maximum Eocene porosity
of ~45%. Permeability and thermal conductivity were adjusted using empirical equations
based on this 45% porosity. Simulation results indicated phase separation would not
occur at this porosity because high convection rates transport heat away from the
basement contact and out of the sediments across the sea floor boundary, suppressing
maximum temperatures in the deep inner basin. Simulations were developed that used
intermediate porosities between the present day value of 33% and the assumed maximum
value of 45%. The results of these simulations indicate that if Eocene porosities were
43% or greater, phase-separation would not occur.
30

References Cited ASTM, 2002, Annual book of ASTM standards: petroleum products, lubricants, and fossil fuels; gaseous fuels; coal and coke. section 5, v. 5.06: ASTM International, West Conshohocken, PA, 650 p. Barker, C.E. and Pawlewicz, M.J.,1994, Calculation of vitrinite reflectance from thermal histories and peak temperatures, a comparison of methods, in Mukhopadhyay, P.K. et al., eds., Vitrinite reflectance as a maturity parameter: applications and limitations: ACS Symposium Series 570, p. 216-229. Bethke, C.M., Lee, M.K., and Park, J., 1999, Basin modeling with Basin2, release 4, a guide to using the Basin2 software package: University of Illinois, 205 p. Bloch, S., 2001, Predrill assessment of P&P in frontier and mature areas, American Association of Petroleum Geologists Distinguished Lecture Program Lecture Slide Library, (http://www.aapg.org/education/dist_lect/slides/2001_02/index.html) Brooks, J., 1981, Organic maturation of sedimentary organic matter and petroleum exploration: a review, in Brooks J. ed., Organic maturation studies and fossil fuel exploration: New York, Academic Press, 441 p. Buschbach, T.C., and Bond, D.C., 1974, Underground storage of natural gas in Illinois – 1973, Illinois State Geological Survey, Illinois Petroleum, 101 Cardareelli, F., 2000, Material handbook: a concise desktop reference: London Springer-Verlag London Limited, 595 p. Cederstrom, D.J.,1943, Chloride in ground water in the Coastal Plain of Virginia, Virginia Geological Survey Bulletin 58, 384 p. Collins, G.S., and Melosh, H.J., 2004, Hydrocode simulations of the Chesapeake Bay impact, in Edwards, L.E. et al., eds., IDCP-USGS Workshop on Deep Drilling in the Central Crater of the Chesapeake Bay Impact Structure, Virginia, USA, U.S. Geological Survey Open-File Report 2004-1016, CD ROM Comisky, J. ,2002, Petrophysical analysis and geologic model for the Bullwinkle J sands with implications for time-lapse reservoir monitoring, Green Canyon Block 65, offshore Louisiana [MS Thesis]: College Station, The Pennsylvania State University, 134 p. Costain, J.K., and Speer, J.A., 1988, Heat flow and geothermal resource potential of the Atlantic coastal plain, in Grow, J.A. et al., eds., The Atlantic Continental Margin, v. I-2: Bolder, CO, Geological Society of America, p. 521-528
31
Crawford, D.A., 2002, A computational model of the Chesapeake Bay impact crater, Geological Society of America Abstracts with Programs, v. 34, no. 6, p. 466 Dow, W.G., and Connor, D.I., 1982, Kerogen maturity and type by reflected light microscopy applied to petroleum exploration, in How to assess maturation and paleotemperatures: SEPM Short Course Number 7, p. 133 -158 Edwards, L.E., and Powars, D.S., 2003, Impact damage to dinocysts from the late Eocene Chesapeake Bay event, Palaios, 18, p. 275-285 Ehlers, T.A., and Farley, K.A., 2003, Apatite (U-Th)/He Thermochronometry: methods and applications to problems in tectonics and surface processes, EPSL-Frontiers, 206, p. 1-14. Farley, K.A., Wolf, R.A., and Silver, L.T., 1996, The effects of long alpha-stopping distances on (U-Th)/He ages, Geochimica et Cosmochimica Acta, 60, p. 4223-4229 Flemings, P.B., Comisky J., Liu X., and Lupa J.A., 2001, Stress-controlled porosity in overpressured sands at Bullwinkle (GC65), deepwater Gulf of Mexico, in Proceedings of the Offshore Technology Conference 2001: OTC Paper #13103 Heroux, Y., Chagnon, A., and Bertrand, R., 1979, Compilation and correlation of major thermal maturation indicators, The American Association of Petroleum Geologists Bulletin v. 63, no.12, p. 2128-2144 Horton, J.W., Kunk, M.J., Naeser, C.W., Naeser, N.D., and Aleinikoff, J.N., 2002, Petrography, Geochronology, and Significance of Crystalline Basement Rocks and Impact-Derived Clasts in the Chesapeake Bay Impact Structure, Southeastern Virginia, Geological Society of America Abstracts with Programs, v. 34, no. 6, p. 466 Lide, D.R., ed., 1997, Handbook of chemistry and physics, 78th edition: New York, CRC press Loucks, R.G., Dodge, M.M., Galloway, W.E., 1984, Regional controls on digenesis and reservoir quality in the lower Tertiary sandstones along the Texas Gulf Coast, in McDonald, D.A., et al., eds., Clastic Diagenesis: American Association of Petroleum Geologists, 434 p. McFarland, E.R., and Bruce, T.S., 2004, Distribution, origin, and resource-management implications of ground-water salinity along the western margin of the Chesapeake Bay impact structure, in Edwards et al., eds., IDCP-USGS Workshop on Deep Drilling in the Central Crater of the Chesapeake Bay Impact Structure, Virginia, USA, U.S. Geological Survey Open-File Report 2004-1016, CD ROM Meisler, H., 1989, The occurrence and geochemistry of salty ground water in the Northern Atlantic Coastal Plain, U.S. Geological Survey Professional Paper 1404-D, p. 1-51
32

Neuzil, C.E., 1994, How permeable are clays and shales?, Water Resources Research, v. 30, no. 2, p. 145-150 Phillips, S.L.,1981, A technical databook for geothermal energy utilization: Berkeley, Lawrence Berkeley Laboratory Report LBL-12810, 71 p. Pontolillo, J., and Stanton, R.W. ,1994, Coal petrographic laboratory procedures and safety manual II, U.S. Geological Survey Open-File Report 94-361, 69 p. Powars, D.S., and Bruce, T.S., 1999, The effects of the Chesapeake Bay impact crater on the geological framework and correlation of hydrogeologic units of the Lower York-James Peninsula, Virginia, U.S. Geological Survey Professional Paper 1612, 82 p. Powars, D.S., 2000, The effects of the Chesapeake Bay impact crater on the geologic framework and the correlation of hydrogeologic units of Southeastern Virginia, south of the James River, U.S. Geological Survey Professional Paper 1622, 53 p. Poag, W.C., Wolf, U.R., and Koeberl, C., 2004, The Chesapeake Bay Crater - Geology and Geophysics of a Late Eocene Submarine Impact Structure: Berlin, Springer-Verlag Berlin Heidelberg, p. 522 Poag, W.C., 1997, The Chesapeake Bay bolide impact: a convulsive event in the Atlantic Coastal Plain evolution, in, Segall, M.P. et al., eds, Evolution of the Atlantic Coastal Plain - Sedimentology, stratigraphy, and hydrogeology, Sedimentary Geology, 108, p. 45-95 Poag, W.C., 2002, Synimpact-postimpact transition inside Chesapeake Bay crater, Geology, v. 30, no. 11, p. 995-998 Richardson, D.L., 1992, Hydrogeology and analysis of the ground-water flow system of the eastern shore, Virginia, U.S. Geological Survey Open-File Report 91-490, p. 108 Sclater, J.P., and Christie, P.A.F.,1980, Continental stretching: an explanation of the post Mid-Cretaceous subsidence of the Central North Sea Basin, Journal of Geophysical Research 85, p. 3711-3739 Sotirov, A., Rainer, T., and Kortenski, J., 2002, Relationship between the reflectance of the maceral groups from coal with different rank., Annual of the University of Mining and Geology St. Ivan Rilski, v. 45, no.1, p. 97-100 Stach, E., Mackoshy, M., Teichmuller, M., Taylor, G., Chandra, D., and Teichmuller, R., 1982, Stach’s textbook of coal petrology: Berlin, Gebruder Borntraeger Berlin Stuttgart, 535 p.
33

Steckler, M.S., Watts, A.B., and Throne, J.A., 1988, Subsidence and basin modeling at the U.S. Atlantic passive margin, in Grow, J.A. et al., eds., The Atlantic Continental Margin, v. I-2: Bolder, CO, Geological Society of America, p. 521-528 Sweeney, J.J., and Burnham, A.K., 1990, Evaluation of a simple model of vitrinite reflectance based on chemical kinetics, The American Association of Petroleum Geologists Bulletin v. 74, no. 10, p.1559-1570 Sanford, W.E., 2004, Hydrothermal response to the Chesapeake Bay bolide impact, in Edwards et al., eds., IDCP-USGS Workshop on Deep Drilling in the Central Crater of the Chesapeake Bay Impact Structure, Virginia, USA, U.S. Geological Survey Open-File Report 2004-1016, CD ROM Sanford, W.E., 2003, Heat flow and brine generation following the Chesapeake Bay bolide impact, Journal of Geochemical Exploration, 78–79, p. 243-247 Sanford, W.E. and Konikow, L.F., 1989, Simulation of calcite dissolution and porosity changes in saltwater mixing zones in coastal aquifers, Water Resources Research, v. 25, no. 4, p. 655-667 Traverse, A., 1988, Paleopalynology: Winchester, MA, Allen and Unwin, 600 p. Von Damm, K.L., Buttermore, L.G., Oosting, S.E., Bry, A.M., Formari, D.J., Lilley, M.D., and Shanks, W.C., 1997, Direct observation of the evolution of a seafloor “black smoker” from vapor to brine, Earth and Planetary Science Letters, v. 149, no. 1-4, p. 101-111 Wohletz, K., and Heiken, G., 1991, Volcanology and Geothermal Energy: Berkeley, University of California Press, 432 p. Wolf, R.A., Farley, K.A., and Kass, D.M.,1998, Modeling of the temperature sensitivity of the apatite (U-Th)/He thermochronometer, Chemical Geology, 148, p. 105-114 Zhao, K., Lerche, I. and Liu, J., 1992 Burial and thermal history of the Baltimore Canyon Trough region, Mid-Atlantic outer continental shelf: application of thermal indicator tomography, Modern Geology, v. 16, no 3, p. 337-362
34

Vita S.V. Harvey
Education
Virginia Polytechnic Institute and State University, Blacksburg, VA
M.S., Geosciences, 2004
Thesis: Thermal History of the Chesapeake Bay Impact Crater
Concord College, Athens, WV
B.S., Cum Laude, Interdisciplinary Studies, 2000
Experience
Academic
Department of Energy Undergraduate Research Fellowship, Berkeley, CA (1998, 1999)
U.S. Geological Survey Hydrogeology Internship, Richmond, VA (2000)
Virginia Tech Graduate Congressional Fellowship, Washington, DC (2002)
Industry
ChevronTexaco Geoscientist Internship, New Orleans, LA (2002)
ChevronTexaco Geoscientist, New Orleans, LA (present)
Military
Staff Sergeant, Combat Engineer, U.S. Army Reserve (1995-present)
Squad Leader and Senior Boat Operator, Iraq War (2003)
35