Yield and Protein Response of Wheat Cultivars to Polymer-Coated Urea and Urea
469Q 2002 Estuarine Research Federation
Estuaries Vol. 25, No. 3, p. 469–482 June 2002
Temporal and Spatial Dynamics of Urea Uptake and Regeneration
Rates and Concentrations in Chesapeake Bay
MICHAEL W. LOMAS1,*, T. MARK TRICE1,†, PATRICIA M. GLIBERT1, DEBORAH A. BRONK2, AND
JAMES J. MCCARTHY3
1 University of Maryland Center for Environmental Science, Horn Point Laboratory, P.O. Box 775,Cambridge, Maryland 21613
2 College of William and Mary/Virginia Institute of Marine Science, Department of PhysicalSciences, Gloucester Point, Virginia 23062
3 Museum of Comparative Zoology, Harvard University, Cambridge, Massachusetts 02138
ABSTRACT: We examined the temporal and spatial variability of urea concentrations and urea uptake and regenerationrates collected on cruises along the longitudinal axis of the Chesapeake Bay between 1972 and 1998. Interannually, meanBay-wide surface urea concentrations ranged between 0.49 and 0.91 mg-at N l21 with a nearly 50% decrease in surfaceconcentrations observed between 1988 and 1998. Concentrations of urea from samples collected within ;1 m of thebottom were generally higher and much more variable than surface samples. Seasonally, two different patterns wereobserved in mean Bay-wide surface urea concentrations. Urea concentrations from near surface waters exhibited a clearsummer peak for 1988 through 1994, while for 1973 and 1996 to 1998 a distinct winter-spring peak in concentration wasobserved. Urea concentrations from deeper waters showed a similar seasonal trend each year with peak concentrationsmeasured in spring. Spatially, urea concentrations in the surface waters decreased in a conservative-type pattern from0.91 mg-at N l21 at the freshwater end member to 0.46 mg-at N l21 at the ocean end member. Mean Bay-wide surfaceurea uptake rates displayed a seasonal pattern throughout the data set with maximum uptake rates (up to 0.33 mg-at Nl21 h21) consistently observed during summer. Mean Bay-wide surface regeneration rates were highest but most variableduring fall (1.63 6 0.82 mg-at N l21 h21). Mean urea uptake and regeneration rates displayed opposing spatial trendsalong the axis of the Bay with uptake rates being lowest in the North Bay where regeneration rates were highest. Theaverage temporal and spatial patterns of urea concentration in Chesapeake Bay appear to reflect a balance betweenexternal inputs and internal biological recycling.
Introduction
Estuaries are characterized by the dynamics ofchemical and biological constituents within the wa-ter column, variations of which are related to phys-ical parameters such as riverine flow, tidal mixing,point and non-point source nutrient inputs, andinternal biological cycling processes. Although sub-tle changes in the relative importance of these pa-rameters can lead to short-term temporal and spa-tial variability, similar mean patterns can be ob-served from year to year within estuarine systems.A well-studied example is the spring diatom bloomthat follows the spring freshet in a number of es-tuaries (e.g., Malone 1977; Sharp et al. 1982;Cloern et al. 1983; Pennock 1985). As a conse-quence of these multiple scales of variability, it isoften difficult to differentiate annual trends from
* Corresponding author; Current address: Bermuda Biologi-cal Station for Research, Inc., 17 Biological Lane Ferry Reach,St George’s GE01, Bermuda; tele: 441/297-1880 ext. 303; fax:441/297-8143; e-mail: [email protected].
† Current address: Maryland Department of Natural Resourc-es, 580 Taylor Avenue, D-2, Annapolis, Maryland 21401.
those associated with eutrophication (D’Elia 1982).Decadal or longer records of nutrient concentra-tions can provide a framework within which theseissues might be addressed.
The Chesapeake Bay is the largest and most pro-ductive estuary in the U.S. and has been studiedfor decades. Much of this research has revolvedaround the questions of eutrophication (specifi-cally increased nitrogen and phosphorus loading;Jaworski 1981; USEPA 1983). Analyses of decadalrecords of nitrogen concentrations in ChesapeakeBay, with rare exception ( Jordan et al. 1991), haveonly addressed inorganic nitrogen forms, namelyNO3
2 and NH41. These studies generally agree that
there have been increases in the concentration ofinorganic nitrogen in at least some sections of theChesapeake Bay over the past several decades (e.g.,Correll 1981; D’Elia 1982; Jordan et al. 1991; Boyn-ton et al. 1995). These changes in nitrogen con-centrations in Chesapeake Bay are believed to havea number of impacts at the ecosystem level. Theincreased water column nitrogen concentrationshave been linked to an increase in phytoplanktonbiomass, which in turn may have led to the wide-
470 M. W. Lomas et al.
TABLE 1. Summary of the number of data points for urea con-centrations and urea uptake and regeneration rates used in thisanalysis.
ParameterSampleDepth
Years ofCollection n
Urea concentration(mg-at N l21)
Surface
Deep
1972–19731988–19941996–19981989–19941996–1998
4936912472
116
Urea uptake rate(mg-at N l21 h21)
Surface
Deep
1972–19731988–19941996–19971989–1994
59904570
Urea regeneration rate(mg-at N l21 h21)
Surface 19881996–1998
329
spread decline in submerged aquatic vegetation(Kemp et al. 1983). The productivity and settlingof this increased pelagic phytoplankton biomass isalso believed to be linked to the extent of bottomwater hypoxia in the mesohaline regions of the Bay(Officer et al. 1984).
The importance of NO32 and NH4
1 to phyto-plankton growth is without question, but these in-organic forms of nitrogen are not the only usablenitrogen forms present in the water column. Theability of phytoplankton to use and grow on spe-cific dissolved organic nitrogen (DON) com-pounds (mostly amino acids and urea) has longbeen known (e.g., North and Stephens 1967, 1972;North 1975; Wheeler et al. 1977). Uncertainty inthe chemical nature of natural DON has limitedstudies on its use by phytoplankton as a nitrogenresource. Commonly, DON can be an importantcomponent of the total dissolved nitrogen pool inestuaries (Sharp 1983), but the chemical fractionsof DON that phytoplankton are known to use aregenerally small (Keil and Kirchman 1991; Bronk etal. 1994). These small component pools of DONcan cycle rapidly and may contribute dispropor-tionately to phytoplankton nitrogen utilization(e.g., McCarthy et al. 1977). Given the potentialimportance of DON as a nutritional source for spe-cific phytoplankton (reviewed by Antia et al. 1991),it is clear that long-term dynamics of DON shouldbe considered when addressing questions of eutro-phication.
This paper presents an analysis of an 11-yr dataset of one component of the DON pool, urea. It isnot the purpose of this paper to evaluate the im-portance of urea to phytoplankton (or bacterial)nitrogen nutrition within Chesapeake Bay, as thistype of analysis has already been done for phyto-plankton (McCarthy et al. 1977; Glibert et al.1995). Although encompassing many years, thisdata set is insufficient to yield insight into inter-decadal trends. The goals of this paper are to ex-amine the mean temporal and spatial variability ofurea concentrations and the rates of urea uptakeand regeneration in Chesapeake Bay, and to pro-vide evidence of the importance of external load-ing of urea and the internal biological cycling ofurea in driving these mean temporal and spatialpatterns in urea concentration.
Materials and Methods
DATA COLLECTION
The data compiled in this study were collectedfrom hydrographic stations along the longitudinalaxis of the Chesapeake Bay from 1972 to 1973,1988 to 1994, and 1996 to 1998 on a total of 52individual research cruises. In total, 730 measure-
ments of urea concentration, 264 measurements ofurea uptake, and 32 measurements of urea regen-eration are presented on waters collected from sur-face and near bottom during this time period (Ta-ble 1). Measurements were collected in conjunc-tion with 3 different research programs withinwhich both the temporal and spatial frequency ofsampling varied depending upon the specific ob-jectives of each program. Sample collection andanalysis protocols were largely consistent and pro-vide a unique data set for the Chesapeake Bay.Data from 1972 to 1973 were collected every othermonth from December 1972 to December 1973 at8 to 9 stations along the axis of the Bay as part ofthe PROCON (Productivity Control) study of theChesapeake Bay Institute, Johns Hopkins Univer-sity. For the purposes of this analysis, the data fromDecember 1972 are combined with the data fromDecember 1973 and presented in the annualgraphs as 1973. Data from 1988 to 1991 were col-lected about every month, with the exception ofwinter months, at 3 core stations in the North,Mid, and South Bay, as well as 10 mapping stationsof finer resolution along the axis of the Bay as partof the LMER-PROTEUS (Land Margin EcosystemResearch—Processes and Organic Transformationsfrom Estuaries to Upland Systems) study of theUniversity of Maryland Center for EnvironmentalScience (UMCES). Also part of the LMER-PRO-TEUS project, seasonal data, usually in April, July,and October, were collected from 1992 to 1994 atthe North, Mid and South Bay core stations. Thedata collected from 1996 to 1998 were collected inconjunction with the LMER-TIES (Trophic Inter-actions in Estuarine Systems) study of UMCES.During this period, 14 to 16 stations (at ;0.58 lon-gitudinal increments along the axis of the Bay)were sampled in April, July, and October of eachyear. To facilitate data analysis, the longitudinalaxis of Chesapeake Bay was divided into 6 regions
Urea Cycling in Chesapeake Bay 471
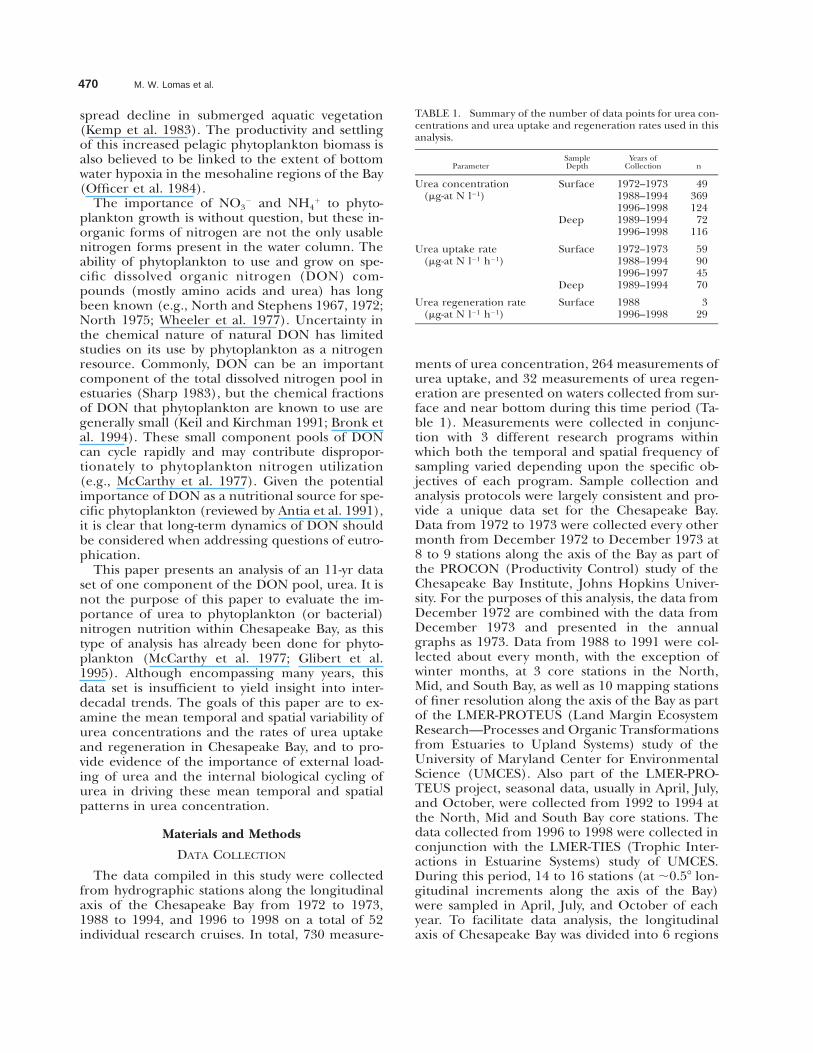
Fig. 1. Map of the Chesapeake Bay estuary displaying the 6geographical regions into which the Bay was divided for thisanalysis. Bay regions are denoted by the numerals 1 through 6with region 1 being the oceanic end member and region 6 be-ing the freshwater end member.
following the example of Harding (1994; Fig. 1),and all stations within a region were averaged forparticular analyses or trend evaluations.
NUTRIENT ANALYSIS AND ADDITIONAL DATA
All urea analyses within this data set were con-ducted using the same analytical methods, al-though the analysts varied. Samples for urea anal-ysis were collected in cleaned 10-liter Niskin (orsimilar) bottles from within the upper 2 m of thewater column (referred to as surface) and ;1 mfrom the bottom (referred to as deep). Sampleswere filtered through combusted (4508C, 1 h) Gel-man A/E filters (1972 to 1973) or Whatman GF/F filters (1988 to 1998) and stored frozen in acid-cleaned high-density polyethylene bottles untilanalysis (within several weeks) using the urease
method of McCarthy (1970). Concentrations ofurea were calculated using blank corrections aspreviously described (McCarthy 1970).
Daily water flow data at the Conowingo Dam onthe Susquehanna River were obtained from theU.S. Geological Survey gauging station (http://md.water.usgs.gov/historical.html) from 1968 to1998 and summed into monthly values.
Benthic chlorophyll samples were collected at se-lected stations along the longitudinal axis of theChesapeake Bay from 1993 to 1998. For these anal-yses, chlorophyll concentrations were determinedfluorometrically (Parsons et al. 1984) with the ad-dition of acid to correct for phaeopigments. Thisvalue is total chlorophyll and represents both theresident microphytobenthos component as well asany sedimented, but not yet degraded chlorophyllfrom the water column (Boynton and Hagy un-published data).
RATES OF UREA UPTAKE AND REGENERATION
Urea uptake rates were determined on selectedstations using standard nitrogen isotopic tech-niques. Surface and deep samples were collectedand screened through a 35-mm screen (1972 to1973) or 200-mm screen (1988 to 1998) to removelarger metazoan grazers and within 1 h the incu-bations were initiated by the addition of 15N-urea(98% enriched). In 1972 and 1973, ambient ureaconcentrations were measured on station, and 15N-urea added accordingly to yield near 10% atomenrichment. From 1988 to 1998, ambient urea con-centrations were not determined at the time of theincubation, so 15N-urea additions were made basedon historical urea concentrations and generallyranged from 10% to 40% enrichment of the am-bient urea pool at the time of incubation. The ad-dition of 15N-urea did occasionally result in a 100%enrichment of the measured urea pool, but thisonly occurred in ,5% of the samples and was notbiased to any particular year, season, or region ofthe Bay.
Incubations in 1972 and 1973 were conductedin situ at depths corresponding to 50% and 75%of surface irradiance for 2 to 4 h. Samples collect-ed between 1988 and 1998 were incubated in anincubator cooled by surface water at 60% incidentirradiance for ;1 h. All incubations were termi-nated by filtration onto Gelman A/E (1972 to1973) or Whatman GF/F filters (1988 to 1998) atlow vacuum (,100 mT) and stored frozen(2208C) until returning to the laboratory for fur-ther processing. Samples were dried at 508C over-night and stored in a desiccator until being ana-lyzed for isotopic content. Samples for isotopicanalysis from 1972 to 1973 were analyzed on a AEIMS-10 mass spectrometer, while the latter samples
472 M. W. Lomas et al.
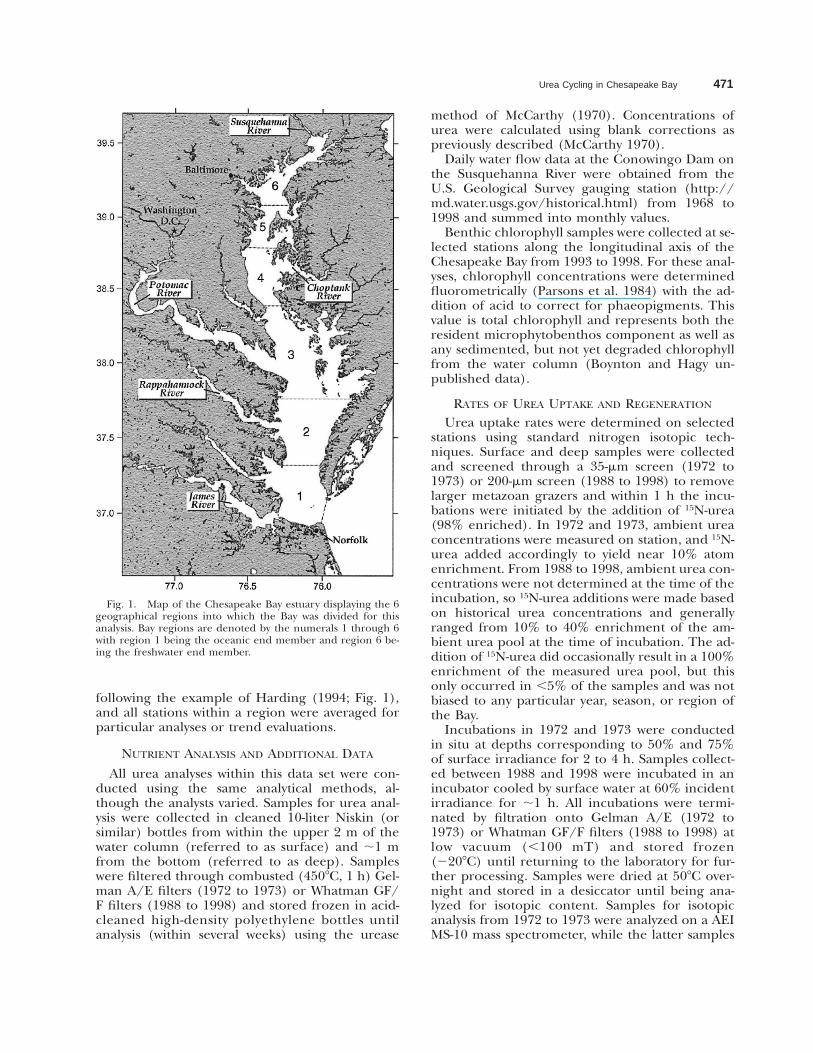
Fig. 2. Trends in surface (A) and deep (B) urea concentra-tions in Chesapeake Bay. Data represent annual Bay-wide meanurea concentrations for surface and deep samples from 1973 to1998. The solid line in the surface data represents the best-fitlinear regression to the data from 1988 to 1998. Error bars rep-resent 6 1 SE of the mean.
were analyzed on a Nuclide 30608 mass spectrom-eter. These instruments have been intercalibrated(Glibert et al. 1991).
Urea regeneration rates were determined using2 methods. During 1988, urea regeneration rateswere determined using a 14CO2 liberation tech-nique (Hansell and Goering 1989; Glibert and Ca-pone 1993) following the addition of urea (14C-labeled) at trace levels. From 1996 to 1998, theisotope dilution technique of Slawyk et al. (1990)was used to determine urea regeneration rates withthe following specific modifications. Samples forurea regeneration analysis were obtained from thefiltrates of the 15N-urea uptake incubations andwere retained and stored frozen (2208C) untilanalysis. A 200-ml filtrate sample was placed in aboiling/vacuum distillation flask, and 1 ml of MgOsolution (1.5 mg/100 ml H2O) was added to raisethe pH above 9.3. Ambient NH4
1 was first removedusing the boiling/vacuum distillation protocol de-scribed in Glibert et al. (1982) and captured in anacid trap (0.0012 N HCl) to a final volume of ;70ml. This initial distillation volume contained theambient NH4
1 and was discarded. Methodologicalchecks showed that .95% of ambient NH4
1 wasremoved using this protocol without a significantloss of urea (, 3%) due to either the elevated pHor heat-activated hydrolysis. The pH of the reten-tate (;130 ml) was then lowered to ;8.4 (Priceand Harrison 1988) using 10% HCl, and 0.7 ml ofa concentrated urease solution (0.25 g lyophilizedurease/45 ml 34 mM EDTA, 5 ml of 1.3 mM DTT,50 ml glycerol) was added to the sample and in-cubated at 508C for 20 min. Following the incu-bation with urease, MgO solution was again addedto the sample and the sample redistilled to capturethe NH4
1 derived from the hydrolyzed urea. Meth-odological checks showed that .95% of the ureapresent prior to the second distillation was recov-ered as urea-derived NH4
1 in the second distillate.This second distillate was then retained for isotopiccomposition analysis as described in Glibert et al.(1982).
No comparison of the two different methodsused to determine urea regeneration rates hasbeen done in conjunction with this study. The dis-tribution of samples over time (3 in 1988 and 29in 1996–1998) coupled with the 7-yr lapse in sam-pling prevents any long-term analysis of urea re-generation rates, and therefore no statements tothis effect are made. The data are simply too fewto compare the absolute values derived by each ofthese methods and therefore, the data from 1988are provided to help define the potential range ofurea regeneration rates that might be expected inestuarine systems. Data from 1996 to 1998 (using
a consistent method) are discussed in terms of theseasonal and spatial patterns.
ResultsThe analysis and discussion of this data set are
presented in a mean sense and in terms of twoscales of variability: temporal and spatial. Unlessotherwise presented, figures and statements re-garding temporal variability will be based on alldata within the data set for a given annual or sea-sonal time frame, and figures and statements onspatial variability will be based on all data withinthe data set within a given region or depth of theBay.
TEMPORAL VARIABILITY
Urea ConcentrationsMean Bay-wide annual surface urea concentra-
tions showed a marginally significant (Student’s t-test, p 5 0.06) decrease between 1988 and 1998from 0.49 to 0.91 mg-at N l21 (Fig. 2a). Mean an-
Urea Cycling in Chesapeake Bay 473
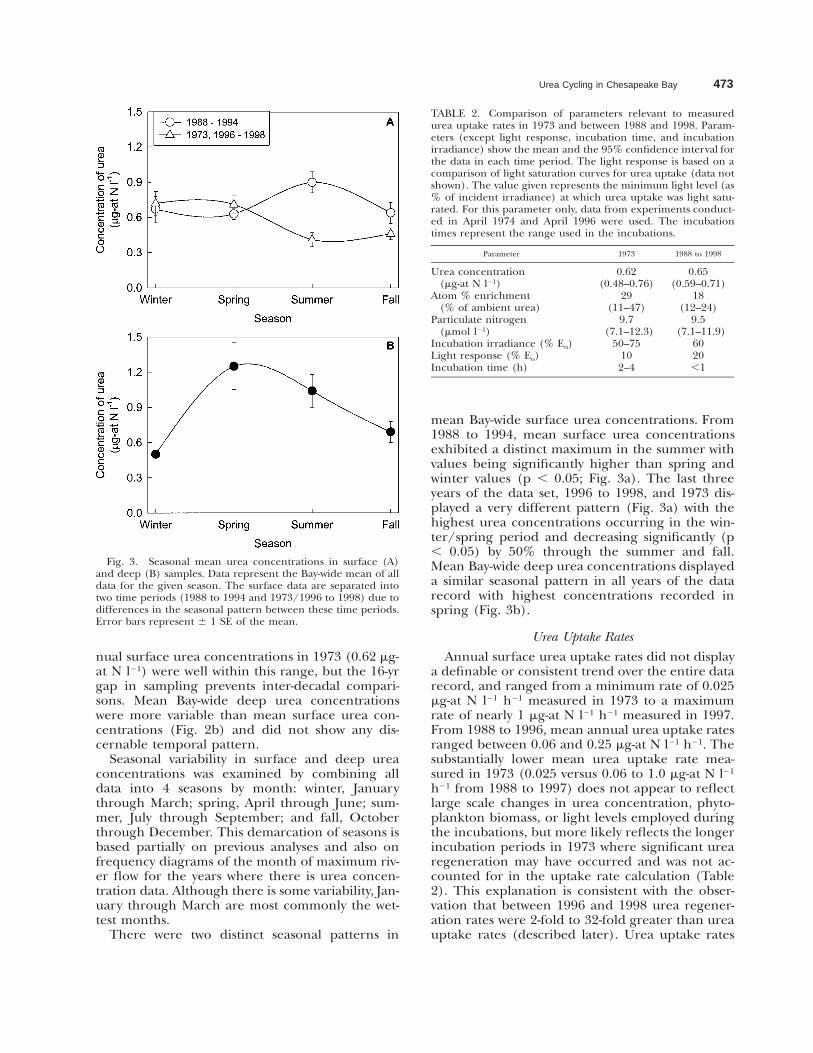
Fig. 3. Seasonal mean urea concentrations in surface (A)and deep (B) samples. Data represent the Bay-wide mean of alldata for the given season. The surface data are separated intotwo time periods (1988 to 1994 and 1973/1996 to 1998) due todifferences in the seasonal pattern between these time periods.Error bars represent 6 1 SE of the mean.
TABLE 2. Comparison of parameters relevant to measuredurea uptake rates in 1973 and between 1988 and 1998. Param-eters (except light response, incubation time, and incubationirradiance) show the mean and the 95% confidence interval forthe data in each time period. The light response is based on acomparison of light saturation curves for urea uptake (data notshown). The value given represents the minimum light level (as% of incident irradiance) at which urea uptake was light satu-rated. For this parameter only, data from experiments conduct-ed in April 1974 and April 1996 were used. The incubationtimes represent the range used in the incubations.
Parameter 1973 1988 to 1998
Urea concentration(mg-at N l21)
Atom % enrichment(% of ambient urea)
0.62(0.48–0.76)
29(11–47)
0.65(0.59–0.71)
18(12–24)
Particulate nitrogen(mmol l21)
9.7(7.1–12.3)
9.5(7.1–11.9)
Incubation irradiance (% Eo)Light response (% Eo)Incubation time (h)
50–75102–4
6020,1
nual surface urea concentrations in 1973 (0.62 mg-at N l21) were well within this range, but the 16-yrgap in sampling prevents inter-decadal compari-sons. Mean Bay-wide deep urea concentrationswere more variable than mean surface urea con-centrations (Fig. 2b) and did not show any dis-cernable temporal pattern.
Seasonal variability in surface and deep ureaconcentrations was examined by combining alldata into 4 seasons by month: winter, Januarythrough March; spring, April through June; sum-mer, July through September; and fall, Octoberthrough December. This demarcation of seasons isbased partially on previous analyses and also onfrequency diagrams of the month of maximum riv-er flow for the years where there is urea concen-tration data. Although there is some variability, Jan-uary through March are most commonly the wet-test months.
There were two distinct seasonal patterns in
mean Bay-wide surface urea concentrations. From1988 to 1994, mean surface urea concentrationsexhibited a distinct maximum in the summer withvalues being significantly higher than spring andwinter values (p , 0.05; Fig. 3a). The last threeyears of the data set, 1996 to 1998, and 1973 dis-played a very different pattern (Fig. 3a) with thehighest urea concentrations occurring in the win-ter/spring period and decreasing significantly (p, 0.05) by 50% through the summer and fall.Mean Bay-wide deep urea concentrations displayeda similar seasonal pattern in all years of the datarecord with highest concentrations recorded inspring (Fig. 3b).
Urea Uptake Rates
Annual surface urea uptake rates did not displaya definable or consistent trend over the entire datarecord, and ranged from a minimum rate of 0.025mg-at N l21 h21 measured in 1973 to a maximumrate of nearly 1 mg-at N l21 h21 measured in 1997.From 1988 to 1996, mean annual urea uptake ratesranged between 0.06 and 0.25 mg-at N l21 h21. Thesubstantially lower mean urea uptake rate mea-sured in 1973 (0.025 versus 0.06 to 1.0 mg-at N l21
h21 from 1988 to 1997) does not appear to reflectlarge scale changes in urea concentration, phyto-plankton biomass, or light levels employed duringthe incubations, but more likely reflects the longerincubation periods in 1973 where significant urearegeneration may have occurred and was not ac-counted for in the uptake rate calculation (Table2). This explanation is consistent with the obser-vation that between 1996 and 1998 urea regener-ation rates were 2-fold to 32-fold greater than ureauptake rates (described later). Urea uptake rates
474 M. W. Lomas et al.
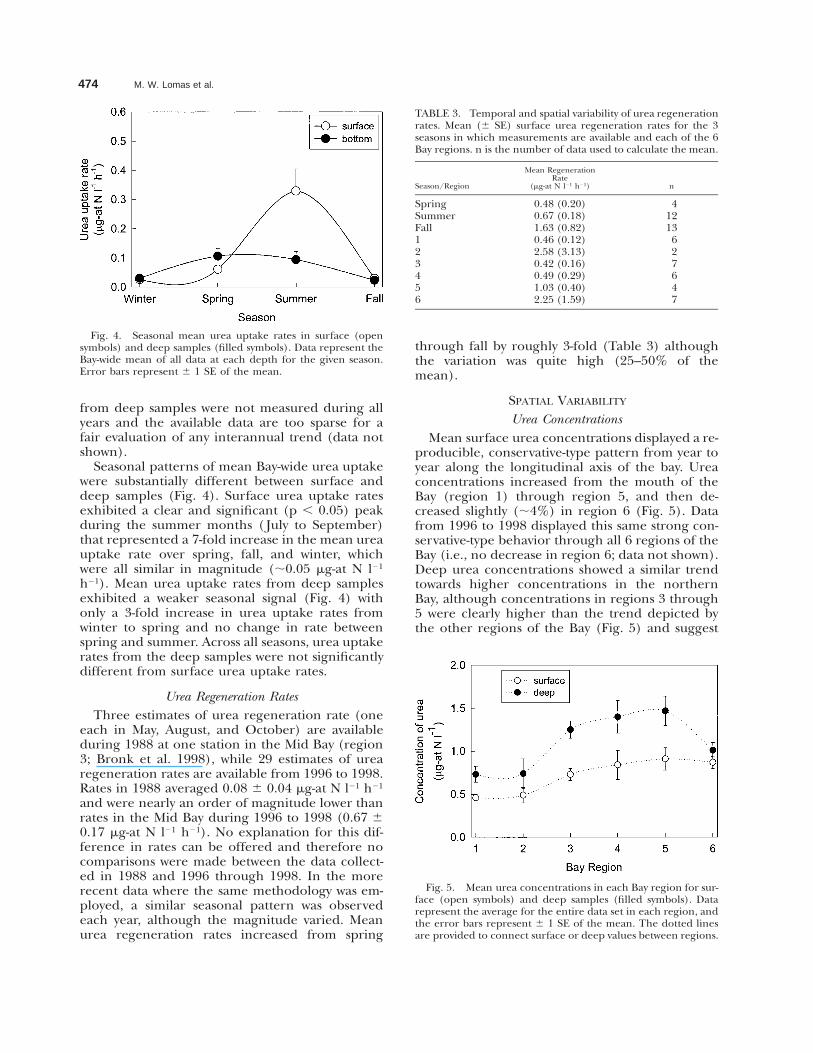
Fig. 4. Seasonal mean urea uptake rates in surface (opensymbols) and deep samples (filled symbols). Data represent theBay-wide mean of all data at each depth for the given season.Error bars represent 6 1 SE of the mean.
TABLE 3. Temporal and spatial variability of urea regenerationrates. Mean (6 SE) surface urea regeneration rates for the 3seasons in which measurements are available and each of the 6Bay regions. n is the number of data used to calculate the mean.
Season/Region
Mean RegenerationRate
(mg-at N l21 h21) n
SpringSummerFall123456
0.48 (0.20)0.67 (0.18)1.63 (0.82)0.46 (0.12)2.58 (3.13)0.42 (0.16)0.49 (0.29)1.03 (0.40)2.25 (1.59)
41213627647
Fig. 5. Mean urea concentrations in each Bay region for sur-face (open symbols) and deep samples (filled symbols). Datarepresent the average for the entire data set in each region, andthe error bars represent 6 1 SE of the mean. The dotted linesare provided to connect surface or deep values between regions.
from deep samples were not measured during allyears and the available data are too sparse for afair evaluation of any interannual trend (data notshown).
Seasonal patterns of mean Bay-wide urea uptakewere substantially different between surface anddeep samples (Fig. 4). Surface urea uptake ratesexhibited a clear and significant (p , 0.05) peakduring the summer months ( July to September)that represented a 7-fold increase in the mean ureauptake rate over spring, fall, and winter, whichwere all similar in magnitude (;0.05 mg-at N l21
h21). Mean urea uptake rates from deep samplesexhibited a weaker seasonal signal (Fig. 4) withonly a 3-fold increase in urea uptake rates fromwinter to spring and no change in rate betweenspring and summer. Across all seasons, urea uptakerates from the deep samples were not significantlydifferent from surface urea uptake rates.
Urea Regeneration RatesThree estimates of urea regeneration rate (one
each in May, August, and October) are availableduring 1988 at one station in the Mid Bay (region3; Bronk et al. 1998), while 29 estimates of urearegeneration rates are available from 1996 to 1998.Rates in 1988 averaged 0.08 6 0.04 mg-at N l21 h21
and were nearly an order of magnitude lower thanrates in the Mid Bay during 1996 to 1998 (0.67 60.17 mg-at N l21 h21). No explanation for this dif-ference in rates can be offered and therefore nocomparisons were made between the data collect-ed in 1988 and 1996 through 1998. In the morerecent data where the same methodology was em-ployed, a similar seasonal pattern was observedeach year, although the magnitude varied. Meanurea regeneration rates increased from spring
through fall by roughly 3-fold (Table 3) althoughthe variation was quite high (25–50% of themean).
SPATIAL VARIABILITY
Urea ConcentrationsMean surface urea concentrations displayed a re-
producible, conservative-type pattern from year toyear along the longitudinal axis of the bay. Ureaconcentrations increased from the mouth of theBay (region 1) through region 5, and then de-creased slightly (;4%) in region 6 (Fig. 5). Datafrom 1996 to 1998 displayed this same strong con-servative-type behavior through all 6 regions of theBay (i.e., no decrease in region 6; data not shown).Deep urea concentrations showed a similar trendtowards higher concentrations in the northernBay, although concentrations in regions 3 through5 were clearly higher than the trend depicted bythe other regions of the Bay (Fig. 5) and suggest
Urea Cycling in Chesapeake Bay 475
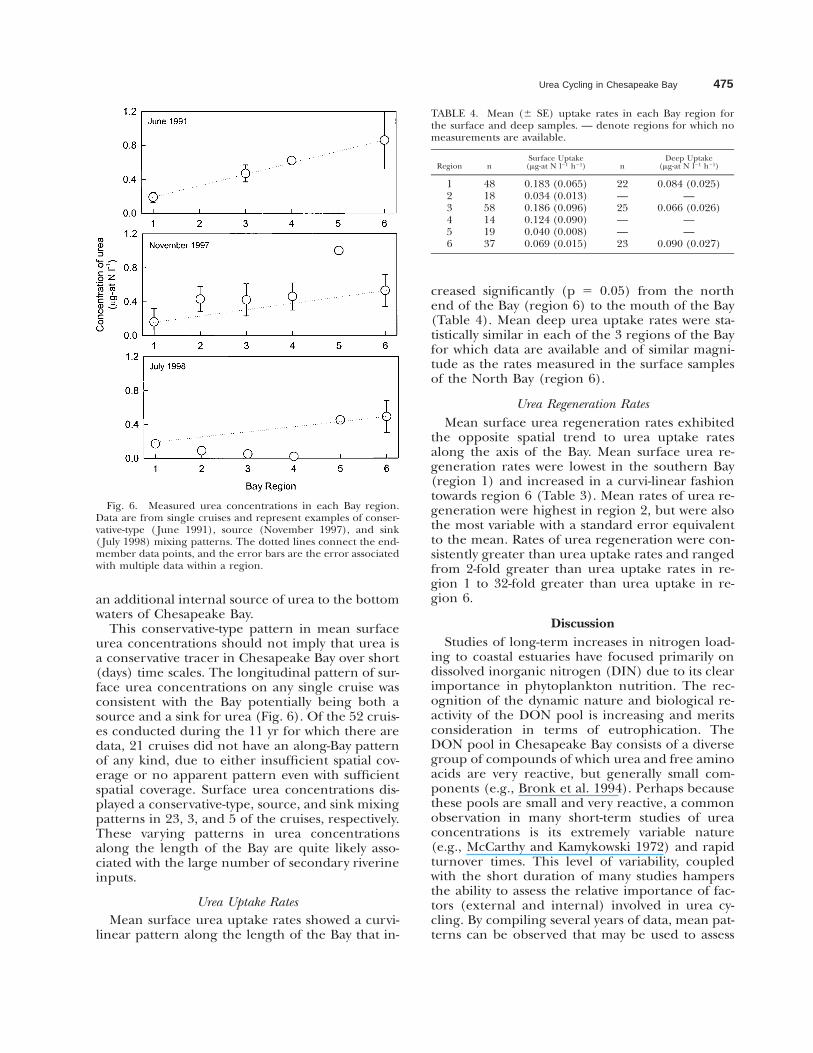
Fig. 6. Measured urea concentrations in each Bay region.Data are from single cruises and represent examples of conser-vative-type ( June 1991), source (November 1997), and sink( July 1998) mixing patterns. The dotted lines connect the end-member data points, and the error bars are the error associatedwith multiple data within a region.
TABLE 4. Mean (6 SE) uptake rates in each Bay region forthe surface and deep samples. — denote regions for which nomeasurements are available.
Region nSurface Uptake
(mg-at N l21 h21) nDeep Uptake
(mg-at N l21 h21)
123456
481858141937
0.183 (0.065)0.034 (0.013)0.186 (0.096)0.124 (0.090)0.040 (0.008)0.069 (0.015)
22—25——23
0.084 (0.025)—
0.066 (0.026)——
0.090 (0.027)
an additional internal source of urea to the bottomwaters of Chesapeake Bay.
This conservative-type pattern in mean surfaceurea concentrations should not imply that urea isa conservative tracer in Chesapeake Bay over short(days) time scales. The longitudinal pattern of sur-face urea concentrations on any single cruise wasconsistent with the Bay potentially being both asource and a sink for urea (Fig. 6). Of the 52 cruis-es conducted during the 11 yr for which there aredata, 21 cruises did not have an along-Bay patternof any kind, due to either insufficient spatial cov-erage or no apparent pattern even with sufficientspatial coverage. Surface urea concentrations dis-played a conservative-type, source, and sink mixingpatterns in 23, 3, and 5 of the cruises, respectively.These varying patterns in urea concentrationsalong the length of the Bay are quite likely asso-ciated with the large number of secondary riverineinputs.
Urea Uptake RatesMean surface urea uptake rates showed a curvi-
linear pattern along the length of the Bay that in-
creased significantly (p 5 0.05) from the northend of the Bay (region 6) to the mouth of the Bay(Table 4). Mean deep urea uptake rates were sta-tistically similar in each of the 3 regions of the Bayfor which data are available and of similar magni-tude as the rates measured in the surface samplesof the North Bay (region 6).
Urea Regeneration RatesMean surface urea regeneration rates exhibited
the opposite spatial trend to urea uptake ratesalong the axis of the Bay. Mean surface urea re-generation rates were lowest in the southern Bay(region 1) and increased in a curvi-linear fashiontowards region 6 (Table 3). Mean rates of urea re-generation were highest in region 2, but were alsothe most variable with a standard error equivalentto the mean. Rates of urea regeneration were con-sistently greater than urea uptake rates and rangedfrom 2-fold greater than urea uptake rates in re-gion 1 to 32-fold greater than urea uptake in re-gion 6.
DiscussionStudies of long-term increases in nitrogen load-
ing to coastal estuaries have focused primarily ondissolved inorganic nitrogen (DIN) due to its clearimportance in phytoplankton nutrition. The rec-ognition of the dynamic nature and biological re-activity of the DON pool is increasing and meritsconsideration in terms of eutrophication. TheDON pool in Chesapeake Bay consists of a diversegroup of compounds of which urea and free aminoacids are very reactive, but generally small com-ponents (e.g., Bronk et al. 1994). Perhaps becausethese pools are small and very reactive, a commonobservation in many short-term studies of ureaconcentrations is its extremely variable nature(e.g., McCarthy and Kamykowski 1972) and rapidturnover times. This level of variability, coupledwith the short duration of many studies hampersthe ability to assess the relative importance of fac-tors (external and internal) involved in urea cy-cling. By compiling several years of data, mean pat-terns can be observed that may be used to assess
476 M. W. Lomas et al.
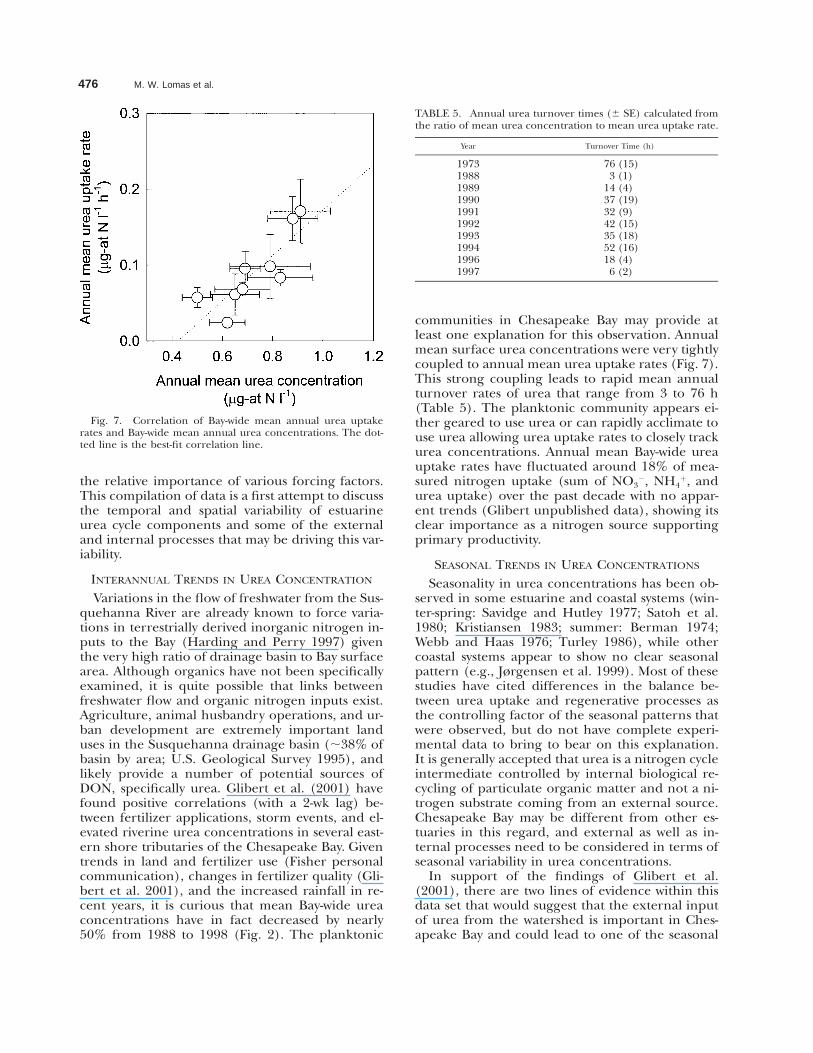
Fig. 7. Correlation of Bay-wide mean annual urea uptakerates and Bay-wide mean annual urea concentrations. The dot-ted line is the best-fit correlation line.
TABLE 5. Annual urea turnover times (6 SE) calculated fromthe ratio of mean urea concentration to mean urea uptake rate.
Year Turnover Time (h)
1973198819891990199119921993199419961997
76 (15)3 (1)
14 (4)37 (19)32 (9)42 (15)35 (18)52 (16)18 (4)6 (2)
the relative importance of various forcing factors.This compilation of data is a first attempt to discussthe temporal and spatial variability of estuarineurea cycle components and some of the externaland internal processes that may be driving this var-iability.
INTERANNUAL TRENDS IN UREA CONCENTRATION
Variations in the flow of freshwater from the Sus-quehanna River are already known to force varia-tions in terrestrially derived inorganic nitrogen in-puts to the Bay (Harding and Perry 1997) giventhe very high ratio of drainage basin to Bay surfacearea. Although organics have not been specificallyexamined, it is quite possible that links betweenfreshwater flow and organic nitrogen inputs exist.Agriculture, animal husbandry operations, and ur-ban development are extremely important landuses in the Susquehanna drainage basin (;38% ofbasin by area; U.S. Geological Survey 1995), andlikely provide a number of potential sources ofDON, specifically urea. Glibert et al. (2001) havefound positive correlations (with a 2-wk lag) be-tween fertilizer applications, storm events, and el-evated riverine urea concentrations in several east-ern shore tributaries of the Chesapeake Bay. Giventrends in land and fertilizer use (Fisher personalcommunication), changes in fertilizer quality (Gli-bert et al. 2001), and the increased rainfall in re-cent years, it is curious that mean Bay-wide ureaconcentrations have in fact decreased by nearly50% from 1988 to 1998 (Fig. 2). The planktonic
communities in Chesapeake Bay may provide atleast one explanation for this observation. Annualmean surface urea concentrations were very tightlycoupled to annual mean urea uptake rates (Fig. 7).This strong coupling leads to rapid mean annualturnover rates of urea that range from 3 to 76 h(Table 5). The planktonic community appears ei-ther geared to use urea or can rapidly acclimate touse urea allowing urea uptake rates to closely trackurea concentrations. Annual mean Bay-wide ureauptake rates have fluctuated around 18% of mea-sured nitrogen uptake (sum of NO3
2, NH41, and
urea uptake) over the past decade with no appar-ent trends (Glibert unpublished data), showing itsclear importance as a nitrogen source supportingprimary productivity.
SEASONAL TRENDS IN UREA CONCENTRATIONS
Seasonality in urea concentrations has been ob-served in some estuarine and coastal systems (win-ter-spring: Savidge and Hutley 1977; Satoh et al.1980; Kristiansen 1983; summer: Berman 1974;Webb and Haas 1976; Turley 1986), while othercoastal systems appear to show no clear seasonalpattern (e.g., Jørgensen et al. 1999). Most of thesestudies have cited differences in the balance be-tween urea uptake and regenerative processes asthe controlling factor of the seasonal patterns thatwere observed, but do not have complete experi-mental data to bring to bear on this explanation.It is generally accepted that urea is a nitrogen cycleintermediate controlled by internal biological re-cycling of particulate organic matter and not a ni-trogen substrate coming from an external source.Chesapeake Bay may be different from other es-tuaries in this regard, and external as well as in-ternal processes need to be considered in terms ofseasonal variability in urea concentrations.
In support of the findings of Glibert et al.(2001), there are two lines of evidence within thisdata set that would suggest that the external inputof urea from the watershed is important in Ches-apeake Bay and could lead to one of the seasonal
Urea Cycling in Chesapeake Bay 477
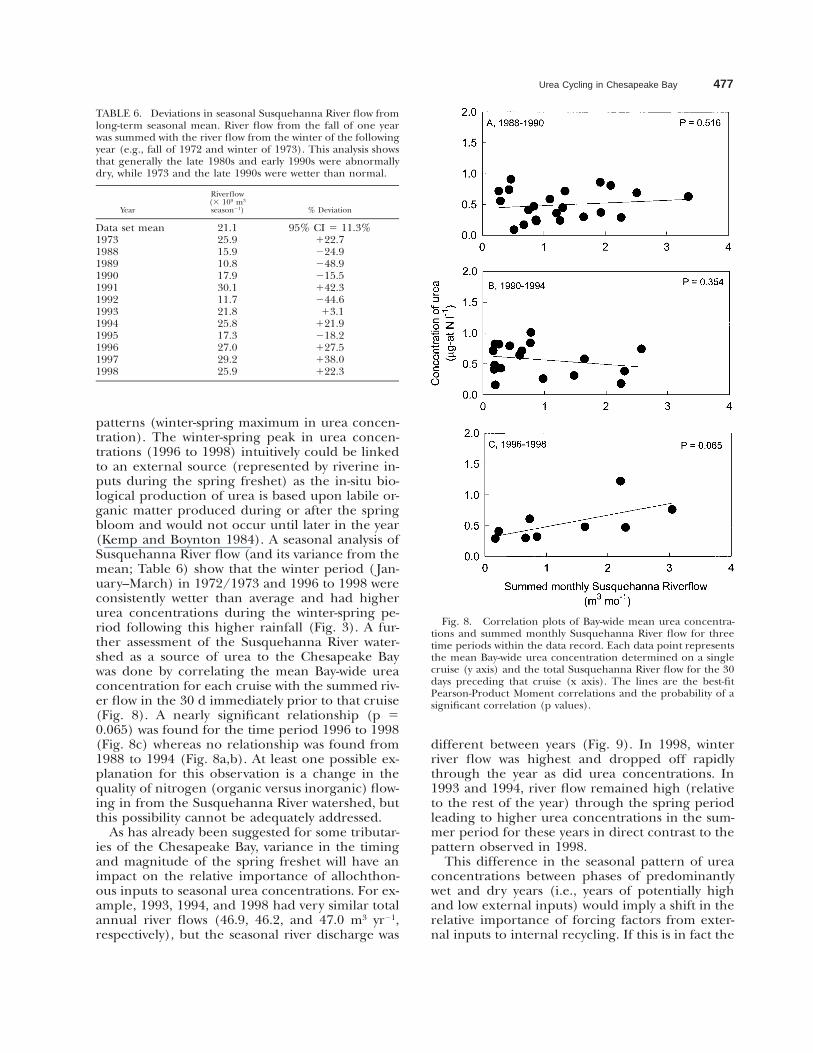
TABLE 6. Deviations in seasonal Susquehanna River flow fromlong-term seasonal mean. River flow from the fall of one yearwas summed with the river flow from the winter of the followingyear (e.g., fall of 1972 and winter of 1973). This analysis showsthat generally the late 1980s and early 1990s were abnormallydry, while 1973 and the late 1990s were wetter than normal.
Year
Riverflow(3 109 m3
season21) % Deviation
Data set mean197319881989199019911992199319941995199619971998
21.125.915.910.817.930.111.721.825.817.327.029.225.9
95% CI 5 11.3%122.7224.9248.9215.5142.3244.613.1
121.9218.2127.5138.0122.3
Fig. 8. Correlation plots of Bay-wide mean urea concentra-tions and summed monthly Susquehanna River flow for threetime periods within the data record. Each data point representsthe mean Bay-wide urea concentration determined on a singlecruise (y axis) and the total Susquehanna River flow for the 30days preceding that cruise (x axis). The lines are the best-fitPearson-Product Moment correlations and the probability of asignificant correlation (p values).
patterns (winter-spring maximum in urea concen-tration). The winter-spring peak in urea concen-trations (1996 to 1998) intuitively could be linkedto an external source (represented by riverine in-puts during the spring freshet) as the in-situ bio-logical production of urea is based upon labile or-ganic matter produced during or after the springbloom and would not occur until later in the year(Kemp and Boynton 1984). A seasonal analysis ofSusquehanna River flow (and its variance from themean; Table 6) show that the winter period ( Jan-uary–March) in 1972/1973 and 1996 to 1998 wereconsistently wetter than average and had higherurea concentrations during the winter-spring pe-riod following this higher rainfall (Fig. 3). A fur-ther assessment of the Susquehanna River water-shed as a source of urea to the Chesapeake Baywas done by correlating the mean Bay-wide ureaconcentration for each cruise with the summed riv-er flow in the 30 d immediately prior to that cruise(Fig. 8). A nearly significant relationship (p 50.065) was found for the time period 1996 to 1998(Fig. 8c) whereas no relationship was found from1988 to 1994 (Fig. 8a,b). At least one possible ex-planation for this observation is a change in thequality of nitrogen (organic versus inorganic) flow-ing in from the Susquehanna River watershed, butthis possibility cannot be adequately addressed.
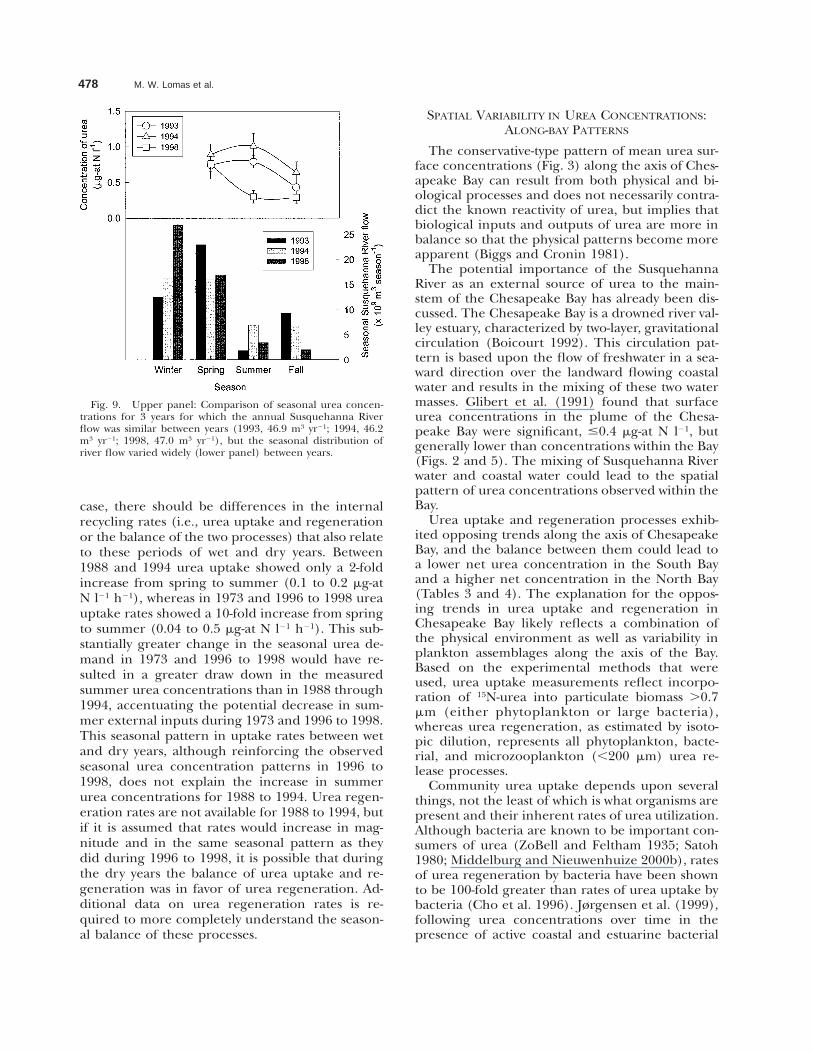
As has already been suggested for some tributar-ies of the Chesapeake Bay, variance in the timingand magnitude of the spring freshet will have animpact on the relative importance of allochthon-ous inputs to seasonal urea concentrations. For ex-ample, 1993, 1994, and 1998 had very similar totalannual river flows (46.9, 46.2, and 47.0 m3 yr21,respectively), but the seasonal river discharge was
different between years (Fig. 9). In 1998, winterriver flow was highest and dropped off rapidlythrough the year as did urea concentrations. In1993 and 1994, river flow remained high (relativeto the rest of the year) through the spring periodleading to higher urea concentrations in the sum-mer period for these years in direct contrast to thepattern observed in 1998.
This difference in the seasonal pattern of ureaconcentrations between phases of predominantlywet and dry years (i.e., years of potentially highand low external inputs) would imply a shift in therelative importance of forcing factors from exter-nal inputs to internal recycling. If this is in fact the
478 M. W. Lomas et al.
Fig. 9. Upper panel: Comparison of seasonal urea concen-trations for 3 years for which the annual Susquehanna Riverflow was similar between years (1993, 46.9 m3 yr21; 1994, 46.2m3 yr21; 1998, 47.0 m3 yr21), but the seasonal distribution ofriver flow varied widely (lower panel) between years.
case, there should be differences in the internalrecycling rates (i.e., urea uptake and regenerationor the balance of the two processes) that also relateto these periods of wet and dry years. Between1988 and 1994 urea uptake showed only a 2-foldincrease from spring to summer (0.1 to 0.2 mg-atN l21 h21), whereas in 1973 and 1996 to 1998 ureauptake rates showed a 10-fold increase from springto summer (0.04 to 0.5 mg-at N l21 h21). This sub-stantially greater change in the seasonal urea de-mand in 1973 and 1996 to 1998 would have re-sulted in a greater draw down in the measuredsummer urea concentrations than in 1988 through1994, accentuating the potential decrease in sum-mer external inputs during 1973 and 1996 to 1998.This seasonal pattern in uptake rates between wetand dry years, although reinforcing the observedseasonal urea concentration patterns in 1996 to1998, does not explain the increase in summerurea concentrations for 1988 to 1994. Urea regen-eration rates are not available for 1988 to 1994, butif it is assumed that rates would increase in mag-nitude and in the same seasonal pattern as theydid during 1996 to 1998, it is possible that duringthe dry years the balance of urea uptake and re-generation was in favor of urea regeneration. Ad-ditional data on urea regeneration rates is re-quired to more completely understand the season-al balance of these processes.
SPATIAL VARIABILITY IN UREA CONCENTRATIONS:ALONG-BAY PATTERNS
The conservative-type pattern of mean urea sur-face concentrations (Fig. 3) along the axis of Ches-apeake Bay can result from both physical and bi-ological processes and does not necessarily contra-dict the known reactivity of urea, but implies thatbiological inputs and outputs of urea are more inbalance so that the physical patterns become moreapparent (Biggs and Cronin 1981).
The potential importance of the SusquehannaRiver as an external source of urea to the main-stem of the Chesapeake Bay has already been dis-cussed. The Chesapeake Bay is a drowned river val-ley estuary, characterized by two-layer, gravitationalcirculation (Boicourt 1992). This circulation pat-tern is based upon the flow of freshwater in a sea-ward direction over the landward flowing coastalwater and results in the mixing of these two watermasses. Glibert et al. (1991) found that surfaceurea concentrations in the plume of the Chesa-peake Bay were significant, #0.4 mg-at N l21, butgenerally lower than concentrations within the Bay(Figs. 2 and 5). The mixing of Susquehanna Riverwater and coastal water could lead to the spatialpattern of urea concentrations observed within theBay.
Urea uptake and regeneration processes exhib-ited opposing trends along the axis of ChesapeakeBay, and the balance between them could lead toa lower net urea concentration in the South Bayand a higher net concentration in the North Bay(Tables 3 and 4). The explanation for the oppos-ing trends in urea uptake and regeneration inChesapeake Bay likely reflects a combination ofthe physical environment as well as variability inplankton assemblages along the axis of the Bay.Based on the experimental methods that wereused, urea uptake measurements reflect incorpo-ration of 15N-urea into particulate biomass .0.7mm (either phytoplankton or large bacteria),whereas urea regeneration, as estimated by isoto-pic dilution, represents all phytoplankton, bacte-rial, and microzooplankton (,200 mm) urea re-lease processes.
Community urea uptake depends upon severalthings, not the least of which is what organisms arepresent and their inherent rates of urea utilization.Although bacteria are known to be important con-sumers of urea (ZoBell and Feltham 1935; Satoh1980; Middelburg and Nieuwenhuize 2000b), ratesof urea regeneration by bacteria have been shownto be 100-fold greater than rates of urea uptake bybacteria (Cho et al. 1996). Jørgensen et al. (1999),following urea concentrations over time in thepresence of active coastal and estuarine bacterial
Urea Cycling in Chesapeake Bay 479
populations, have shown that generally bacteria arenet remineralizers of urea. Many size-fractionationexperiments conducted to separate predominantlybacterial from phytoplanktonic utilization of ureahave also shown that phytoplankton are muchmore important to urea uptake than bacteria(Remsen et al. 1972; Savidge and Hutley 1977; Sav-idge and Johnston 1987; Cho and Azam 1995; Choet al. 1996; Tamminen and Irmisch 1996) in otherestuarine and coastal systems. A recent study byMiddelburg and Nieuwenhuize (2000b) observedjust the opposite, that bacteria were responsible formost of the urea uptake in the Thames River, al-though urea accounted for ,1% of the measurednitrogen uptake. The bacterial urea uptake ratesgiven by Middelburg and Nieuwenhuize (2000b)are at most ;30% of the urea uptake rates mea-sured in the Chesapeake Bay, supporting earlierstudies on the importance of phytoplankton tourea uptake. There is insufficient data to directlycompare and contrast bacterial communities andactivities between Chesapeake Bay and the ThamesRiver, and this cannot be ruled out. The ThamesRiver is significantly more turbid than the Chesa-peake Bay (cf., Middelburg and Nieuwenhuize2000a and Harding et al. 1986), which may haverestricted phytoplankton utilization of urea (dis-cussed below) in that system. The reason for thedifferences between the Thames River and theChesapeake Bay are not clear, but in the Chesa-peake Bay it is possible that phytoplankton ratherthan bacteria dominate urea uptake. Studies needto be conducted to assess the relative importanceof bacteria and phytoplankton as consumers ofurea.
There are several potential explanations for thedecrease in phytoplankton urea uptake rates in theNorth Bay (region 6). The incorporation of ureahydrolysis products is light dependent. It is gen-erally accepted that the northern Chesapeake Bayis proximately light limited for phytoplankton pri-mary production (e.g., Fisher et al. 1988; Glibertet al. 1995), and this light limited condition mayalso limit the use of urea. The dominance of fresh-water flow into the Chesapeake Bay by the Susque-hanna River leads to extremely high concentra-tions of total dissolved nitrogen in the North Bay,sometimes exceeding 100 mg-at N l21 (Glibert et al.1995). In culture, the efficiency with which phy-toplankton assimilate urea is inversely related tothe nutrient condition of the cell. Under non-lim-iting NO3
2 growth conditions, only 15% of theurea-N is assimilated into phytoplankton biomasseven though urea hydrolysis rates (via urease) re-main high. To the contrary, under nitrogen-starvedconditions, nearly 100% of the urea-nitrogen is as-similated into particulate biomass (Price and Har-
rison 1988). Many phytoplankton taxa possess theenzyme urease that is inhibited by the presence ofNH4
1 (Rees and Syrett 1979; Horrigan and Mc-Carthy 1982). The contribution of NH4
1 to the to-tal dissolved nitrogen pool can be quite high oftenexceeding 5 mg-at N l21 (Glibert et al. 1995). Anyor all of these conditions would lead to a decreasedphytoplankton uptake of urea in the North Bay.
Microzooplankton are probably important con-tributors to the urea regeneration rates that weremeasured (e.g., Johannes 1965; Caron and Gold-man 1990). Population distributions of zooplank-ton (dominated by the species Acartia tonsa) showthe highest concentrations in the North Bay (in-cluding copepodites) and decrease in concentra-tion in the lower regions of the Bay (Rilling andHoude 1999). Recent studies have also shown thatin addition to NH4
1, urea and amino acids are veryimportant nitrogen excretion products for A. tonsain Chesapeake Bay in mesocosm experiments(Miller and Glibert 1998). Based on values provid-ed by these two studies, zooplankton excretioncould produce up to 0.23 mg-at urea-N l21 h21, or;50% of the measured urea regeneration rates insome cases. This calculation is most assuredly anunderestimate because only those zooplankton ,200 mm were actually included in the incubation.Work is needed to determine the relative contri-butions of bacteria, microzooplankton, and macro-zooplankton to urea regeneration in the NorthBay.
SPATIAL VARIABILITY IN UREA CONCENTRATIONS:SURFACE VERSUS DEEP CONCENTRATIONS
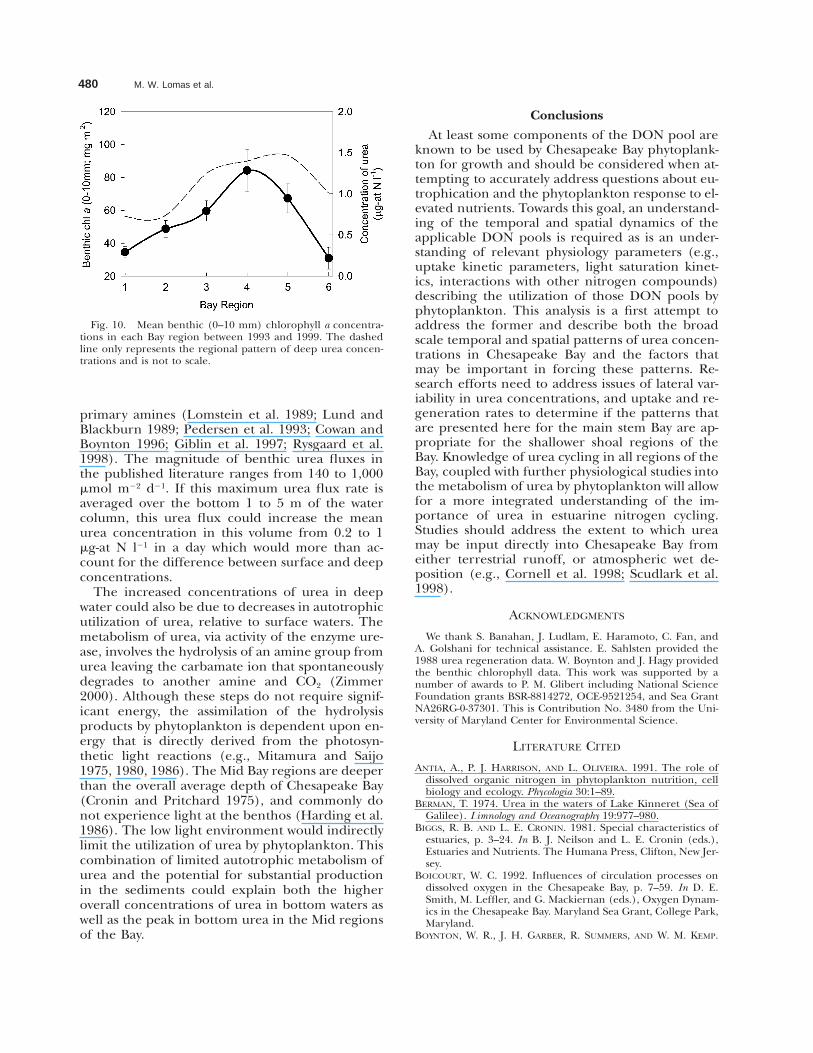
The consistently elevated urea concentrations inthe deep waters (Fig. 5) of Chesapeake Bay suggesta very active benthic processing of urea that is inexcess of urea uptake and physical dispersion inthis deep layer. The peak in deep urea concentra-tions, in the Middle reaches of Chesapeake Bay,suggests a region of even higher activity. Given thaturea is a very simple and labile organic compound,one likely source of urea in deep waters would bethrough the decomposition of recently settled par-ticulate organic matter. The regions of highestdeep urea concentrations correspond to the re-gions of the Bay where benthic chlorophyll valueswere also found to be highest (Fig. 10) and likelyrepresents a combination of resident microphyto-benthos and water column phytoplankton that isknown to settle in this region following blooms inthe water column (e.g., Boynton and Kemp 1985).Other studies have shown that pulses of fresh or-ganic matter settling from a water column bloomstimulate fluxes of several nitrogen substrates fromthe sediment (e.g., Therkildsen and Lomstein1994; Grenz et al. 2000) and in particular urea and
480 M. W. Lomas et al.
Fig. 10. Mean benthic (0–10 mm) chlorophyll a concentra-tions in each Bay region between 1993 and 1999. The dashedline only represents the regional pattern of deep urea concen-trations and is not to scale.
primary amines (Lomstein et al. 1989; Lund andBlackburn 1989; Pedersen et al. 1993; Cowan andBoynton 1996; Giblin et al. 1997; Rysgaard et al.1998). The magnitude of benthic urea fluxes inthe published literature ranges from 140 to 1,000mmol m22 d21. If this maximum urea flux rate isaveraged over the bottom 1 to 5 m of the watercolumn, this urea flux could increase the meanurea concentration in this volume from 0.2 to 1mg-at N l21 in a day which would more than ac-count for the difference between surface and deepconcentrations.
The increased concentrations of urea in deepwater could also be due to decreases in autotrophicutilization of urea, relative to surface waters. Themetabolism of urea, via activity of the enzyme ure-ase, involves the hydrolysis of an amine group fromurea leaving the carbamate ion that spontaneouslydegrades to another amine and CO2 (Zimmer2000). Although these steps do not require signif-icant energy, the assimilation of the hydrolysisproducts by phytoplankton is dependent upon en-ergy that is directly derived from the photosyn-thetic light reactions (e.g., Mitamura and Saijo1975, 1980, 1986). The Mid Bay regions are deeperthan the overall average depth of Chesapeake Bay(Cronin and Pritchard 1975), and commonly donot experience light at the benthos (Harding et al.1986). The low light environment would indirectlylimit the utilization of urea by phytoplankton. Thiscombination of limited autotrophic metabolism ofurea and the potential for substantial productionin the sediments could explain both the higheroverall concentrations of urea in bottom waters aswell as the peak in bottom urea in the Mid regionsof the Bay.
Conclusions
At least some components of the DON pool areknown to be used by Chesapeake Bay phytoplank-ton for growth and should be considered when at-tempting to accurately address questions about eu-trophication and the phytoplankton response to el-evated nutrients. Towards this goal, an understand-ing of the temporal and spatial dynamics of theapplicable DON pools is required as is an under-standing of relevant physiology parameters (e.g.,uptake kinetic parameters, light saturation kinet-ics, interactions with other nitrogen compounds)describing the utilization of those DON pools byphytoplankton. This analysis is a first attempt toaddress the former and describe both the broadscale temporal and spatial patterns of urea concen-trations in Chesapeake Bay and the factors thatmay be important in forcing these patterns. Re-search efforts need to address issues of lateral var-iability in urea concentrations, and uptake and re-generation rates to determine if the patterns thatare presented here for the main stem Bay are ap-propriate for the shallower shoal regions of theBay. Knowledge of urea cycling in all regions of theBay, coupled with further physiological studies intothe metabolism of urea by phytoplankton will allowfor a more integrated understanding of the im-portance of urea in estuarine nitrogen cycling.Studies should address the extent to which ureamay be input directly into Chesapeake Bay fromeither terrestrial runoff, or atmospheric wet de-position (e.g., Cornell et al. 1998; Scudlark et al.1998).
ACKNOWLEDGMENTS
We thank S. Banahan, J. Ludlam, E. Haramoto, C. Fan, andA. Golshani for technical assistance. E. Sahlsten provided the1988 urea regeneration data. W. Boynton and J. Hagy providedthe benthic chlorophyll data. This work was supported by anumber of awards to P. M. Glibert including National ScienceFoundation grants BSR-8814272, OCE-9521254, and Sea GrantNA26RG-0-37301. This is Contribution No. 3480 from the Uni-versity of Maryland Center for Environmental Science.
LITERATURE CITED
ANTIA, A., P. J. HARRISON, AND L. OLIVEIRA. 1991. The role ofdissolved organic nitrogen in phytoplankton nutrition, cellbiology and ecology. Phycologia 30:1–89.
BERMAN, T. 1974. Urea in the waters of Lake Kinneret (Sea ofGalilee). Limnology and Oceanography 19:977–980.
BIGGS, R. B. AND L. E. CRONIN. 1981. Special characteristics ofestuaries, p. 3–24. In B. J. Neilson and L. E. Cronin (eds.),Estuaries and Nutrients. The Humana Press, Clifton, New Jer-sey.
BOICOURT, W. C. 1992. Influences of circulation processes ondissolved oxygen in the Chesapeake Bay, p. 7–59. In D. E.Smith, M. Leffler, and G. Mackiernan (eds.), Oxygen Dynam-ics in the Chesapeake Bay. Maryland Sea Grant, College Park,Maryland.
BOYNTON, W. R., J. H. GARBER, R. SUMMERS, AND W. M. KEMP.
Urea Cycling in Chesapeake Bay 481
1995. Inputs, transformations, and transport of nitrogen andphosphorus in Chesapeake Bay and selected tributaries. Es-tuaries 18:285–314.
BOYNTON, W. R. AND W. M. KEMP. 1985. Nutrient regenerationand oxygen consumption by sediments along an estuarine sa-linity gradient. Marine Ecology Progress Series 23:45–55.
BRONK, D. A., P. M. GLIBERT, T. C. MALONE, S. BANAHAN, AND E.SAHLSTEN. 1998. Inorganic and organic nitrogen cycling inChesapeake Bay: Autotrophic versus heterotrophic processesand relationships to carbon flux. Aquatic Microbial Ecology 15:177–189.
BRONK, D. A., P. M. GLIBERT, AND B. B. WARD. 1994. Nitrogenuptake, dissolved organic nitrogen release, and new produc-tion. Science 265:1843–1846.
CARON, D. A. AND J. C. GOLDMAN. 1990. Protozoan nutrient re-generation, p. 283–306. In G. M. Capriulo (ed.), Ecology ofMarine Protozoa. Oxford University Press, New York.
CHO, B. C. AND F. AZAM. 1995. Urea decomposition by bacteriain the Southern California Bight and its implications for themesopelagic nitrogen cycle. Marine Ecology Progress Series 122:21–26.
CHO, B. C., M. G. PARK, J. H. SHIM, AND F. AZAM. 1996. Signifi-cance of bacteria in urea dynamics in coastal surface waters.Marine Ecology Progress Series 142:19–26.
CLOERN, J. E., A. E. ALPINE, B. E. COLE, R. L. J. WONG, J. F.ARTHUR, AND M. D. BALL. 1983. River discharge controls phy-toplankton dynamics in the northern San Francisco Bay es-tuary. Estuarine, Coastal and Shelf Science 16:415–429.
CORNELL, S. E., T. D. JICKELLS, AND C. A. THORNTON. 1998. Ureain rainwater and atmospheric aerosol. Atmospheric Environment32:1903–1910.
CORRELL, D. L. 1981. Eutrophication trends in the water qualityof the Rhode River (1971–1978), p. 425–435. In B. J. Neilsonand L. E. Cronin (eds.), Estuaries and Nutrients. The Hu-mana Press, Clifton, New Jersey.
COWAN, J. L. W. AND W. R. BOYNTON. 1996. Sediment-water ox-ygen and nutrient exchanges along the longitudinal axis ofChesapeake Bay: Seasonal patterns, controlling factors andecological significance. Estuaries 19:562–580.
CRONIN, W. B. AND D. W. PRITCHARD. 1975. Additional statisticson the dimensions of the Chesapeake Bay and its tributaries:Cross-section widths and segment volumes per meter depth.Special Report 42. Chesapeake Bay Institute, The John Hop-kins University, Baltimore, Maryland.
D’ELIA, C. F. 1982. Nutrient enrichment of concentrations: Anhistorical perspective, p. 45–102. In E. G. Macalaster, D. A.Barker, and M. Kasper (eds.), Chesapeake Bay Program Tech-nical Studies: A Synthesis. U.S. Environmental ProtectionAgency, Washington, D.C.
FISHER, T. R., L. W. HARDING, JR., D. W. STANLEY, AND L. G.WARD. 1988. Phytoplankton, nutrients and turbidity in theChesapeake, Delaware and Hudson estuaries. Estuarine, Coast-al and Shelf Science 27:61–93.
GIBLIN, A. E., C. S. HOPKINSON, AND J. TUCKER. 1997. Benthicmetabolism and nutrient cycling in Boston Harbor, Massachu-setts. Estuaries 20:346–364.
GLIBERT, P. M. AND D. G. CAPONE. 1993. Mineralization and as-similation in aquatic, sediment, and wetland systems, p. 243–272. In R. Knowles and T. H. Blackburn (eds.), Nitrogen Iso-tope Techniques. Academic Press, New York.
GLIBERT, P. M., D. J. CONLEY, T. R. FISHER, L. W. HARDING, AND
T. C. MALONE. 1995. Dynamics of the 1990 winter/springbloom in Chesapeake Bay. Marine Ecology Progress Series 122:27–43.
GLIBERT, P. M., C. GARSIDE, J. A. FUHRMAN, AND M. R. ROMAN.1991. Time-dependent coupling of inorganic and organic ni-trogen uptake and regeneration in the plume of the Chesa-peake Bay estuary and its regulation by large heterotrophs.Limnology and Oceanography 36:895–909.
GLIBERT, P. M., F. LIPSHULTZ, J. J. MCCARTHY, AND M. A. ALTABET.1982. Isotope dilution models of uptake and remineralizationof ammonium by marine plankton. Limnology and Oceanogra-phy 27:639–650.
GLIBERT, P. M., R. MAGNIEN, M. W. LOMAS, J. ALEXANDER, C. FAN,E. HARAMOTO, M. TRICE, AND T. M. KANA. 2001. Harmful algalblooms in the Chesapeake and coastal bays of Maryland, USA:Comparison of 1997, 1998 and 1999 events. Estuaries 24:875–883.
GRENZ, C., J. E. CLOERN, S. W. HAGER, AND B. E. COLE. 2000.Dynamics of nutrient cycling and related benthic nutrientand oxygen fluxes during a spring phytoplankton bloom insouth San Francisco Bay (USA). Marine Ecology Progress Series197:67–80.
HANSELL, D. A. AND J. J. GOERING. 1989. A method for estimatinguptake and production rates of urea in seawater using [14C]urea and [15N] urea. Canadian Journal of Fisheries and AquaticScience 46:198–202.
HARDING, JR., L. W. 1994. Long-term trends in the distributionof phytoplankton in Chesapeake Bay: Roles of light, nutrientsand streamflow. Marine Ecology Progress Series 104:267–291.
HARDING, JR., L. W., B. W. MEESON, AND T. R. FISHER, JR. 1986.Phytoplankton production in two east coast estuaries: Photo-synthesis-light functions and patterns of carbon assimilationin Chesapeake and Delaware Bays. Estuarine, Coastal and ShelfScience 23:773–806.
HARDING, JR., L. W. AND E. S. PERRY. 1997. Long-term increaseof phytoplankton biomass in Chesapeake Bay, 1950–1994. Ma-rine Ecology Progress Series 157:39–52.
HORRIGAN, S. G. AND J. J. MCCARTHY. 1982. Phytoplankton up-take of ammonium and urea during growth on oxidizedforms of nitrogen. Journal of Plankton Research 4:379–389.
JAWORSKI, N. A. 1981. Sources of nutrients and the scale of eu-trophication problems in estuaries, p. 83–110. In B. J. Neilsonand L. E. Cronin (eds.), Estuaries and Nutrients. The Hu-mana Press, Clifton, New Jersey.
JOHANNES, R. E. 1965. Influence of marine protozoa on nutrientregeneration. Limnology and Oceanography 10:433–442.
JORDAN, T. E., D. L. CORRELL, J. MIKLAS, AND D. E. WELLER. 1991.Long-term trends in estuarine nutrients and chlorophyll, andshort-term effects of variation in watershed discharge. MarineEcology Progress Series 75:121–132.
JøRGENSEN, N. O. G., N. KROER, R. B. COFFIN, AND M. P. HOCH.1999. Relations between bacterial nitrogen metabolism andgrowth efficiency in an estuarine and an open water ecosys-tem. Aquatic Microbial Ecology 18:247–261.
KEIL, R. G. AND D. L. KIRCHMAN. 1991. Dissolved combined ami-no acids in marine waters as determined by a vapor-phasehydrolysis method. Marine Chemistry 33:243–259.
KEMP, W. M. AND W. R. BOYNTON. 1984. Spatial and temporalcoupling of nutrient inputs to estuarine primary production:The role of particulate transport and decomposition. Bulletinof Marine Science 35:522–535.
KEMP, W. M., W. R. BOYNTON, R. R. TWILLEY, J. C. STEVENSON,AND J. C. MEANS. 1983. The decline of submerged vascularplants in the upper Chesapeake Bay: Summary of results con-cerning possible causes. Journal of the Marine Technological So-ciety 17:78–89.
KRISTIANSEN, S. 1983. Urea as a nitrogen source for the phyto-plankton in the Oslofjord. Marine Biology 74:17–24.
LOMSTEIN, B. A., T. H. BLACKBURN, AND K. HENRIKSEN. 1989.Aspects of nitrogen and carbon cycling in the Northern Be-ring shelf sediment. I. The significance of urea turnover inthe mineralization of NH4
1. Marine Ecology Progress Series 57:237–247.
LUND, B. A. AND T. H. BLACKBURN. 1989. Urea turnover in acoastal marine sediment measured by a 14C-urea short-termincubation. Journal of Microbiological Methods 9:297–308.
MALONE, T. C. 1977. Environmental regulation of phytoplank-

482 M. W. Lomas et al.
ton productivity in the lower Hudson estuary. Estuarine, Coast-al and Shelf Science 5:157–171.
MCCARTHY, J. J. 1970. A urease method for urea in seawater.Limnology and Oceanography 15:309–313.
MCCARTHY, J. J. AND D. KAMYKOWSKI. 1972. Urea and other ni-trogenous nutrients in La Jolla Bay during February, March,and April 1970. Fishery Bulletin 70:1261–1273.
MCCARTHY, J. J., W. R. TAYLOR, AND J. TAFT. 1977. Nitrogenousnutrition of the plankton in the Chesapeake Bay. I. Nutrientavailability and phytoplankton preferences. Limnology andOceanography 22:996–1011.
MIDDELBURG, J. J. AND J. NIEUWENHUIZE. 2000a. Uptake of dis-solved inorganic nitrogen in turbid, tidal estuaries. MarineEcology Progress Series 192:79–88.
MIDDELBURG, J. J. AND J. NIEUWENHUIZE. 2000b. Nitrogen uptakeby heterotrophic bacteria and phytoplankton in the nitrate-rich Thames estuary. Marine Ecology Progress Series 203:13–21.
MILLER, C. A. AND P. M. GLIBERT. 1998. Nitrogen excretion bythe calanoid copepod Acartia tonsa: Results of mesocosm ex-periments. Journal of Plankton Research 20:1767–1780.
MITAMURA, O. AND Y. SAIJO. 1975. Decomposition of urea asso-ciated with photosynthesis of phytoplankton in coastal waters.Marine Biology 30:67–72.
MITAMURA, O. AND Y. SAIJO. 1980. In situ measurement of theurea decomposition rate and its turnover rate in the PacificOcean. Marine Biology 58:147–152.
MITAMURA, O. AND Y. SAIJO. 1986. Urea metabolism and its sig-nificance in the nitrogen cycle in the euphotic layer of LakeBiwa I. In situ measurement of nitrogen assimilation and ureadecomposition. Archives of Hydrobiology 107:23–51.
NORTH, B. B. 1975. Primary amines in California coastal waters:Utilization by phytoplankton. Limnology and Oceanography 20:20–27.
NORTH, B. B. AND G. C. STEPHENS. 1967. Uptake and assimilationof amino acids by Platymonas. Biological Bulletin 133:391–400.
NORTH, B. B. AND G. C. STEPHENS. 1972. Amino acid transportin Nitzschia ovalis Arnott. Journal of Phycology 8:54–68.
OFFICER, C. G., R. B. BIGGS, J. L. TAFT, L. E. CRONIN, M. A.TYLER, AND W. R. BOYNTON. 1984. Chesapeake Bay anoxia:Origin, development, and significance. Science 223:22–27.
PARSONS, T. R., Y. MAITA, AND C. M. LALLI. 1984. A Manual ofChemical and Biological Methods for Seawater Analysis. Per-gamon Press, New York.
PEDERSEN, H., B. A. LOMSTEIN, AND T. H. BLACKBURN. 1993. Ev-idence for bacterial urea production in marine sediments.FEMS Microbiological Ecology 12:51–59.
PENNOCK, J. R. 1985. Chlorophyll distributions in the Delawareestuary: Regulation by light limitation. Estuarine, Coastal andShelf Science 21:711–725.
PRICE, N. M. AND P. J. HARRISON. 1988. Uptake of urea C andurea N by the coastal marine diatom Thalassiosira pseudonana.Limnology and Oceanography 33:528–537.
REES, T. A. V. AND P. J. SYRETT. 1979. The uptake of urea by thediatom Phaeodactylum. New Phytologist 82:169–178.
REMSEN, C. C., E. J. CARPENTER, AND B. W. SCHROEDER. 1972.Competition for urea among estuarine microorganisms. Ecol-ogy 53:921–926.
RILLING, G. C. AND E. D. HOUDE. 1999. Regional and temporalvariability in growth and mortality of bay anchovy, Anchoamitchilli, larvae in Chesapeake Bay. Fishery Bulletin, U.S. 97:555–569.
RYSGAARD, S., B. THAMDRUP, N. RISGAARD-PETERSEN, H. FOSSING,P. BERG, P. B. CHRISTENSEN, AND T. DALSGAARD. 1998. Seasonalcarbon and nutrient mineralization in a high-Arctic coastalmarine sediment, Young Sound, Northeast Greenland. MarineEcology Progress Series 175:261–276.
SATOH, Y. 1980. Distribution of urea decomposing bacteria inwaters of Lake Suwa. Hydrobiology 71:233–237.
SATOH, Y., T. OKINO, AND K. AOYAMA. 1980. Correlation betweenurea and other chemical and biological parameters in watersof Lake Suwa, Japan. Internationale Revue Der Gesamten Hydro-biologie 65:445–454.
SAVIDGE, G. AND H. T. HUTLEY. 1977. Rates of remineralizationand assimilation of urea by fractionated plankton communi-ties in coastal waters. Journal of Experimental Marine Biology andEcology 28:1–16.
SAVIDGE, G. AND J. P. JOHNSTON. 1987. Urea degradation ratesby size-fractionated plankton populations in a temperate es-tuary. Estuarine, Coastal and Shelf Science 24:433–447.
SCUDLARK, J. R., K. M. RUSSELL, J. N. GALLOWAY, T. M. CHURCH,AND W. C. KEENE. 1998. Organic nitrogen in precipitation atthe mid-Atlantic U.S. coast—Methods evaluation and prelim-inary measurements. Atmospheric Environment 32:1719–1728.
SHARP, J. H. 1983. The distributions of inorganic nitrogen anddissolved and particulate organic nitrogen in the sea, p. 1–35. In E. J. Carpenter and D. G. Capone (eds.), Nitrogen inthe Marine Environment. Academic Press, New York.
SHARP, J. H., C. H. CULBERTSON, AND T. M. CHURCH. 1982. Thechemistry of the Delaware estuary general considerations.Limnology and Oceanography 27:1015–1028.
SLAWYK, G., P. RAIMBAULT, AND S. L’HELGUEN. 1990. Recovery ofurea nitrogen from seawater for measurement of 15N abun-dance in urea regeneration studies using the isotope-dilutionapproach. Marine Chemistry 30:343–362.
TAMMINEN, T. AND A. IRMISCH. 1996. Urea uptake kinetics of amidsummer planktonic community on the SW coast of Fin-land. Marine Ecology Progress Series 130:201–211.
THERKILDSEN, M. S. AND B. A. LOMSTEIN. 1994. Seasonal varia-tion in sediment urea turnover in a shallow estuary. MarineEcology Progress Series 109:77–82.
TURLEY, C. M. 1986. Urea uptake by phytoplankton at differentfronts and associated stratified and mixed waters on the Eu-ropean shelf. British Phycological Journal 21:225–238.
USEPA. 1983. Chesapeake Bay: A profile of environmentalchange. U.S. Environmental Protection Agency, Washington,D.C.
U.S. GEOLOGICAL SURVEY. 1995. Synthesis of nutrient and sedi-ment data for watersheds within the Chesapeake Bay drainagebasin. U.S. Geological Survey Water-Resources InvestigationsReport 95-4233. Washington, D.C.
WEBB, K. L. AND L. W. HAAS. 1976. The significance of urea forphytoplankton nutrition in the York River, Virginia, p. 90–102. In M. Wiley (ed.), Estuarine Processes. Volume I. Uses,Stresses, and Adaptations to the Estuary. Academic Press, NewYork.
WHEELER, P. A., B. NORTH, M. LITTLER, AND G. STEPHENS. 1977.Uptake of glycine by natural phytoplankton communities.Limnology and Oceanography 22:900–910.
ZIMMER, M. 2000. Molecular mechanics evaluation of the pro-posed mechanisms for the degradation of urea by urease. Jour-nal of Biomolecular Structure and Dynamics 17:787–797.
ZOBELL, C. E. AND C. B. FELTHAM. 1935. The occurrence andactivity of urea-splitting bacteria in the sea. Science 81:234–236.
SOURCES OF UNPUBLISHED MATERIALS
BOYNTON, W. unpublished data. Chesapeake Biological Labo-ratory, P.O. Box 38, 1 Williams Street, Solomons, Maryland20688.
HAGY, J. unpublished data. National Health and EnvironmentalEffects Research Laboratory, Gulf Ecology Division, 1 SabineIsland Drive, Gulf Breeze, Florida 32561.
FISHER, T. personal communication. Horn Point Laboratory,P.O. Box 775, 2020 Horns Point Road, Cambridge, Maryland21613.
Received for consideration, December 1, 2000Accepted for publication, January 6, 2002
Copyright © 2022 FDOKUMEN