in Crater Lake, OR - Oregon State University
317
'.. ,. ii, D Th[ 'i:i Ii jThci tk iNi VL T 'V' ji Studies of Hydrothermal Processes in Crater Lake, OR H. Phinney, D. Mclntire, G. Larson, M. Buktenica R. Bacon, C. H. Nelson, J. H. Barber, Jr. Karl J. Lupton M. Watwood, C. Dahm A. Soutar, R. Weiss C. G. Wheat Robert W. Collier, Jack Dymond and James McManus College of Oceanography Oregon State University Corvallis, OR 97331 In Collaboration With: Submitted to: The National Park Service, PNW Region Seattle, WA May 31, 1991 Cooperative Agreement No. CA 9000-3-0003 Subagreement No. 7 CPSU. College of Forestry, OSU PATTULLO STUDY COLLEGE OF OCEANIC AND ATMOSPHERIC SCIENCES OSU College of Oceanography Repott # 90 - 7 Oregon State University U.S.G.S., Menlo Park U. Hawaii U.C. Santa Barbara U. of New Mexico U. C. San Diego U. of Hawaii
-
Upload
khangminh22 -
Category
Documents
-
view
1 -
download
0
Transcript of in Crater Lake, OR - Oregon State University
'.. ,. ii,D Th[
'i:i
Ii jThci tk iNi VL
T 'V'
ji
Studies of Hydrothermal Processesin Crater Lake, OR
H. Phinney, D. Mclntire, G. Larson, M. BuktenicaR. Bacon, C. H. Nelson, J. H. Barber, Jr.Karl
J. LuptonM. Watwood, C. DahmA. Soutar, R. WeissC. G. Wheat
Robert W. Collier, Jack Dymond and James McManusCollege of OceanographyOregon State UniversityCorvallis, OR 97331
In Collaboration With:
Submitted to:
The National Park Service, PNW RegionSeattle, WA
May 31, 1991
Cooperative Agreement No. CA 9000-3-0003Subagreement No. 7
CPSU. College of Forestry, OSUPATTULLO STUDY
COLLEGE OFOCEANIC AND ATMOSPHERIC SCIENCES
OSU College of Oceanography Repott # 90 - 7
Oregon State UniversityU.S.G.S., Menlo ParkU. HawaiiU.C. Santa BarbaraU. of New MexicoU. C. San DiegoU. of Hawaii
Studies of Hydrothermal Processesin Crater Lake, OR
Robert W. Collier, Jack Dymond and James McManusCollege of OceanographyOregon State University
Corvallis, OR 97331
In Collaboration With:
H. Phinney, D. Mclntire, G. Larson, M. BuktenicaR. Bacon, C. H. Nelson, J. H. Barber, Jr.Karl
J. LuptonM. Watwood, C. DahmA. Soutar, R. WeissC. G. Wheat
Submitted to:
The National Park Service, PNW RegionSeattle, WA
May 31, 1991
Cooperative Agreement No. CA 9000-3-0003Subagreement No. 7
CPSU, College of Forestry, OSU
OSU College of Oceanography Report #90 - 7
Oregon State UniversityU.S.G.S., Menlo ParkU. HawaiiU.C. Santa BarbaraU. of New MexicoU. C. San DiegoU. of Hawaii
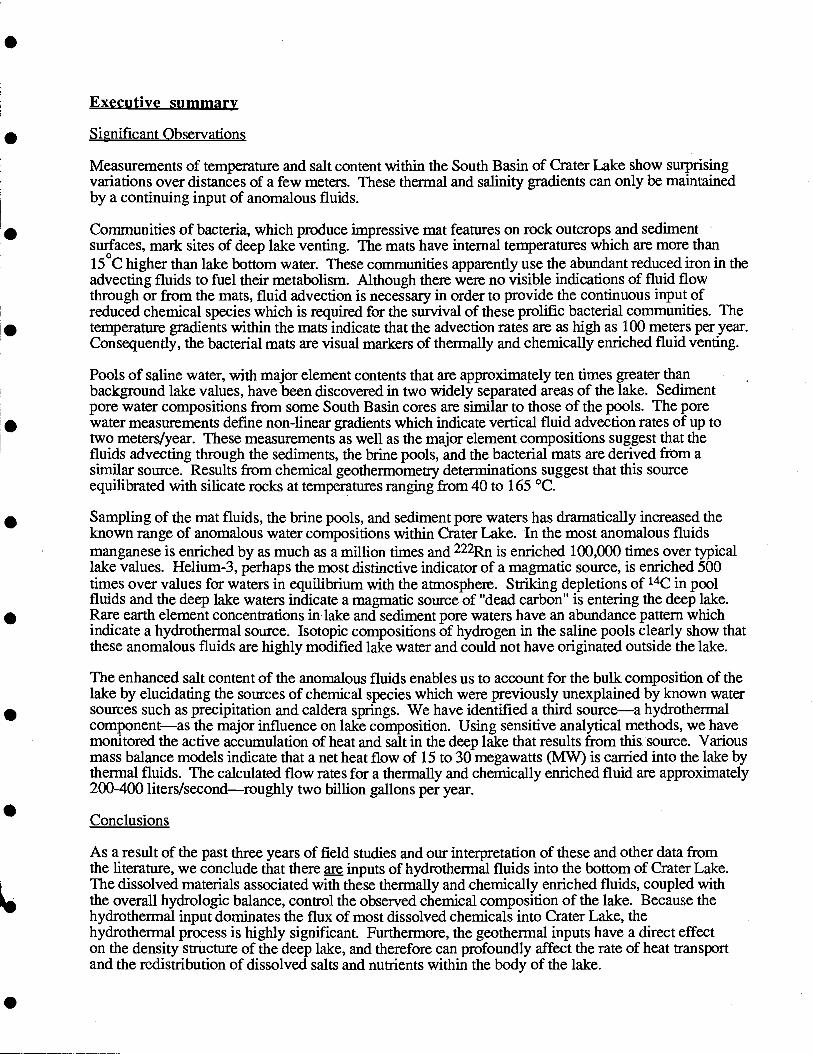
Executive summary
Significant Observations
Measurements of temperature and salt content within the South Basin of Crater Lake show surprisingvariations over distances of a few meters. These thermal and salinity gradients can only be maintainedby a continuing input of anomalous fluids.
Communities of bacteria, which produce impressive mat features on rock outcrops and sedimentsurfaces, mark sites of deep lake venting. The mats have internal temperatures which are more than15 C higher than lake bottom water. These communities apparently use the abundant reduced iron in theadvecting fluids to fuel their metabolism. Although there were no visible indications of fluid flowthrough or from the mats, fluid advection is necessary in order to provide the continuous input ofreduced chemical species which is required for the survival of these prolific bacterial communities. Thetemperature gradients within the mats indicate that the advection rates are as high as 100 meters per year.Consequently, the bacterial mats are visual markers of thermally and chemically enriched fluid venting.
Pools of saline water, with major element contents that are approximately ten times greater thanbackground lake values, have been discovered in two widely separated areas of the lake. Sedimentpore water compositions from some South Basin cores are similar to those of the pools. The porewater measurements defme non-linear gradients which indicate vertical fluid advection rates of up totwo meters/year. These measurements as well as the major element compositions suggest that thefluids advecting through the sediments, the brine pools, and the bacterial mats are derived from asimilar source. Results from chemical geothermometry determinations suggest that this sourceequilibrated with silicate rocks at temperatures ranging from 40 to 165 °C.
Sampling of the mat fluids, the brine pools, and sediment pore waters has dramatically increased theknown range of anomalous water compositions within Crater Lake. In the most anomalous fluidsmanganese is enriched by as much as a million times and 222p is enriched 100,000 times over typicallake values. Helium-3, perhaps the most distinctive indicator of a magmatic source, is enriched 500times over values for waters in equilibrium with the atmosphere. Striking depletions of 14C in pooifluids and the deep lake waters indicate a magmatic source of "dead carbon" is entering the deep lake.Rare earth element concentrations in lake and sediment pore waters have an abundance pattern whichindicate a hydrothermal source. Isotopic compositions of hydrogen in the saline pools clearly show thatthese anomalous fluids are highly modified lake water and could not have originated outside the lake.
The enhanced salt Content of the anomalous fluids enables us to account for the bulk composition of thelake by elucidating the sources of chemical species which were previously unexplained by known watersources such as precipitation and caldera springs. We have identified a third sourcea hydrothermalcomponentas the major influence on lake composition. Using sensitive analytical methods, we havemonitored the active accumulation of heat and salt in the deep lake that results from this source. Variousmass balance models indicate that a net heat flow of 15 to 30 megawatts (MW) is carried into the lake bythermal fluids. The calculated flow rates for a thermally and chemically enriched fluid are approximately200-400 liters/secondroughly two billion gallons per year.
Conclusions
As a result of the past three years of field studies and our interpretation of these and other data fromthe literature, we conclude that there inputs of hydrothermal fluids into the bottom of Crater Lake.The dissolved materials associated with these thermally and chemically enriched fluids, coupled withthe overall hydrologic balance, control the observed chemical composition of the lake. Because thehydrothermal input dominates the flux of most dissolved chemicals into Crater Lake, thehydrothermal process is highly significant. Furthermore, the geothermal inputs have a direct effecton the density structure of the deep lake, and therefore can profoundly affect the rate of heat transportand the redistribution of dissolved salts and nutrients within the body of the lake.
Table of Contents
Introduction 1
Methods 3
11.1 General 3
11.2 Bathymetry 511.3 Remotely Operated Vehicle (ROV) 511.4 Manned-Submersible Operations 7
Navigation 7Video and Photographic Recording 8Sampling of Rocks, Crusts, and Sediments 11
Temperature Probe 11
Benthic Barrel 13
Recording Sediment Temperature Probe 13
Interstitial Pore Water Samples - "Peepers" 13
11.5 Water Temperature, Conductivity, and Light Transmission 14CTD Instrumentation 14Thermistor Chain Mooring 16
11.6 Current Measurements 1611.7 Water Samples 17
11.8 Chemical Analyses of Water Samples 1711.9 Sediment, Crust, and Mat Analyses 2011.10 Additional Chemical Analyses 21
Results21
111.1 Major Features Observed With the Submersible 21hon-rich Crusts 24Bacterial Mats 24Pools 24Spires 40
111.2 Distribution of Temperature, Salt, and Physical Properties 41General 41Temperature and Density Structure 41Deep Lake Distributions 43Near-Bottom Measurements of Physical Properties 46Near-Bottom Current Measurements 51
ffl.3 Chemistry of Crater Lake Waters 51Introduction 51Distributions of Dissolved Ions With Depth 54Distribution of CO2 in the Water Column 58
ffl.4 Ion-Ion Systematics 58111.5 Helium Concentrations and Isotopic Ratios 64
Water Column Samples 64Submersible Samples 69Summary - Helium Systematics 69
ffl.6 Dissolved Oxygen 73Water Column Oxygen and Mixing 73Oxygen Budget and Influence of Hydrothermal Activity 75Small-scale Variations in Bottom Water 02 Distribution 78
111.7 Radon-222 81Estimates of Radon-222 Inventory 83Radon and Radium in Submersible Samples 86
Radon-222 Constraints on Pool Formation and Exchange Rates 87Radium-226 Measurements 89
ffl.8 Lakefloor Temperature Data 89Submersible Temperature Probe 89Sediment Temperature Profiles 96
111.9 Bacterial Mats 991988 Observations 99Microscopic Evaluations 102Environmental Settings of the Bacterial Features 104Chemical Composition of Bacterial Samples 109Biological and Biochemical Studies 109
111.10 Solid-Phase Geochemistry 111General 111Crusts and Mats 112Spires 118Pool Sediments 122Sediment Core Analyses 122
IV. Discussion 125
P1.1 Geological Setting of Features in the Detailed Study Area 125Regional Setting 125General Bathymetry 126Chaski Slide 127Implication of the Palisades Point Thermal Chemical Features 128
IV.2 Geochemistry of Fluids 129Composition of Sampled "End-Member" Fluids 129Geotherinometry 133Stable Isotope Measurements 136Rare Earth Elements 142The Distribution of Dissolved Carbon- 14 147
P1.3 Fluxes of Materials Through the Lake System 154Mixing Rates of Lakewater 154Mass Balance of Materials 157Fluid Flows Through Sediments 168
IV.4 Fluxes of Heat 173Direct Observations of the Accumulation of Heat 173Helium-Based Estimates of Heat Flux 174Ion-Based Estimates of Heat Flux 174
IV.5 Significance of Fluxes on Other Lake Processes 177Relationship to Other Lake Processes 177
IV.6 Evaluation of Hypotheses 179Early Fumarolic Input Hypothesis 179Evaporation Hypothesis 180The Ash Alteration Hypothesis 181Volatile Transport Hypothesis 181The Conductive Heat Hypothesis 183The Cold Spring Hypothesis 183The Hydrothermal Hypothesis 185Summary of Hypothesis Testing 187
V. Summary and Conclusions 189V.1 Significant Observations 189V.11 Conclusions 190
VI. References 191
VII. Appendices
A The Physical Limnology of Crater Lake, On Mechanisms for theredistribution of heat and salt in the water column A. 1
James McManus, Robert Collier, and Jack Dynwnd
B National Geographic Dive Report B. 1H. Phinney, D. Mclntire, G. Larson, and M. Buktenica
C Geological Observations and Sampling C. 1Charles R. Bacon
D Geological Observations and Sampling D. 1C. Hans Nelson and John H. Barber, Jr.
E Bacterial Studies of Materials Collected at Crater Lake Vent Locations E. 1David Karl
F Hydrothermal Circulation Through the Sediments and Basementof Crater Lake, Oregon F. 1
C. Geoffrey Wheat
G Deep water renewal rates in Crater Lake deduced from the distributionof anthropogenic chiorofluoromethanes (freons) G. 1
H Submersible Locations and Dive Summaries H. 1
I Data for Water and Solid Samples 1.1
List of Figures
Figure 1 Bathymetry for Crater Lake 4Figure 2 Bathymetric Chart for the detailed study area 6Figure 3 Box core locations in the detailed study area 12Figure 4 "Peeper" location in the detailed study area 15Figure 5 1989 hydrocast locations in the detailed study area 18Figure 6 1989 submersible water sample locations 19Figure 7 Detailed bathymetry as defined by nearbottom CIV data 22Figure 8 Detailed bathymetry from Fig. 7 in a 3-dimensional perspective 23Figure 9 Topographic Cross Sections 39Figure 10 CTD data from a water column profile in the South Basin 42Figure 11 Expanded plots of the CTD data from Figure 10 44Figure 12 Contour piots of total water column heat and salt "anomaly" 45Figure 13 CTD Conductivity and temperature measurements from CD187 47Figure 14 Cli) Conductivity and temperature measurements from CD 182 48Figure 15 Contour map of near-bottom temperatures 49Figure 16 Contour map of near-bottom salinities 50Figure 17 Relationship between Temperature and Salinity 52Figure 18 Progressive vector diagram from current meter at 475m depth 53Figure 19 Pie diagram of major cations and anions 55Figure 20 Concentration of various ions vs. depth in the South Basin 56Figure 21 Components of the CO2 system and pH vs. depth 59Figure 22 Concentration of Cl vs Na in the Crater Lake system 60Figure 23 Mg vs. Na in Crater Lake and associated waters 62Figure 24 Ca vs. Na in Crater Lake and associated waters 63Figure 25 He-3 concentration vs. depth in Crater lake water 65Figure 26 Relationship between the concentration of He-3 and He-4 67Figure 27 Concentration of He-3 vs. temperature and dissolved ions 68Figure 28 He-3 vs. He-4 from submersible samples in 1989 70Figure 29 He-3 vs. Na and Ca in mat and pool samples 71Figure 30 Total CO2 vs. He-3 in deep lake samples 72Figure 31 Dissolved oxygen vs. depth for samples taken in 1988 74Figure 32 Nitrate vs. depth for samples collected in August 1989 74Figure 33 Oxygen utilization vs. temperature and sodium 77Figure 34 Oxygen utilization vs. sodium for all samples 80Figure 35 Rn-222 vs. depth for 1989 hydrocast samples 82Figure 36 Rn-222 vs. Na for 1989 hydrocast samples 82Figure 37 Rn-222 vs. depth for two profiles in the detailed study area 84Figure 38 Integrated Rn-222 in the detailed study area 85Figure 39 Rn-222 vs. Na for submersible samples 90Figure 40 Ra-226 vs. Ba for mat and pool samples 90Figure 41 Submersible temperature probe measurements in bacterial mats 93Figure 42 Submersible temperature probe measurements in sediments 94Figure 43 Submersible temperature probe measurements in pools 95Figure 44 Intercalibration accuracy of thermistors in the SeaCat lTi' 97Figure 45 Seven day time-series record of 1TF 98Figure 46 Schematic drawing of the bacterial mats from CD 179 (1988) 103Figure 47 Bacterial mat locations in the detailed study area from 1989 105
.List of Figures (continued)
Figure 48 Schematic drawing of Llao's Bath and brain mat complex 107Figure 49 Schematic drawing of Palisades Point mat and pool complex 108Figure 50 Fe vs. Al, Ba in sediment core and trap samples 115Figure 51 Fe vs. Si/Al ratio from various thermo-chemical features 116Figure 52 Fe vs. As for various types of solid samples in Crater Lake 116Figure 53 Quantitative .tprobe scan across a spire from below Skell Head 119Figure 54 X-ray diffraction scans of spire and Fe-rich crust 121Figure 55 Downcore variation in Fe, Mn, As conc. in boxcores 123Figure 56 Pore water iron concentrations as function of depth 124Figure 57 General locations of thermal-chemical features ... 127Figure 58 Stable isotopic composition of Crater Lake waters 137Figure 59 Oxygen isotope exchange in equilibrium with plagioclase 141Figure 60 REE abundances in water 143Figure 61 Fe vs. La in various solid-phase sample types 145Figure 62 Fe vs. La/Eu ratio in Crater Lake solid phase samples 145Figure 63 Al vs. La/Eu ratio in Crater Lake solid phase samples 146Figure 64 As vs. La/Eu ratio in Crater Lake solid phase samples 146Figure 65 Ion-ion relationships pertaining to the sources of CO2 151Figure 66 Box model for dissolved ions in Crater Lake 161Figure 67 Results from box model applied to Cl and Li 163Figure 68 Salinity vs. depth. Time series showing increase in N. Basin 166Figure 69 Pore water Na vs. depth in two cores from the S. Basin 169Figure 70 Ca/Al ratios in various Crater Lake solid phases 170Figure 71 Benthic barrel accumulation of Nat, Lit, Mn2 and 02 172Figure 72 Time series temperature data from Cli) and thermistor chains 174
List of Plates
Plate 1 Deep Rover being towed to dive site 9Plate 2 Deep Rover just after launch 9Plate 3 Pavement of metal-rich crusts observed on CD 179 25Plate 4 Exposed sedimentary layers within the detailed study area 25Plate 5 Bacterial mat from CD207 27Plate 6 Bacterial mat on flat-lying sediments 27Plate 7 Bacterial mat on steep surface 29Plate 8 Elongated bacterial mat from the Palisades Point area 29Plate 9 View of the northern end of Llao's Bath 31Plate 10 Close up of the rocky outcrop at the edge of Llao's Bath 31Plate 11 "Brain mat" bacterial growth just of the west of Llao's Bath 33Plate 12 Closeup of the brain mat 33Plate 13 Pool from the Palisades Point area (CD228) 35Plate 14 Another large pool from the Palisades Point area (CD228) 35Plate 15 Stream-like feature within the Palisades Point area (CD227) 37Plate 16 Siliceous spires below Skell Head 37Plate 17 Low-power scanning electron micrograph of bacterial mat 101Plate 18 High-power scanning electron micrograph of bacterial mat 101Plate 19 Iron rich crusts with a light dusting of sediments 113Plate 20 A short, spire-like feature discovered S of Llao's Bath (CD223) 113
List of Tables
Table 1 Dissolved oxygen at 550 meters 75Table 2 List of Redox Reactions 76Table 3 Dissolved oxygen and sodium concentrations in submersible samples 79Table 4 Submersible temperature data and estimated advection rates 92Table 5 Bacterial mat temperatures and descriptions, 1988 100Table 6 Bacterial mat compositions 110Table 7 Crater Lake crust and spire compostions 117Table 8 Chemical compostion of bacterial mat water sampled in 1988 130Table 9 Chemical compostion of representative "End-member" fluids 132Table 10 Summary of Geothermometry 135Table 11 Stable Isotopic Measurements of Crater Lake Waters 138Table 12 The REE Contents of Crater Lake Fluids 142Table 13 14C Results 148Table 14 Physiographic and Hydrologic Parameters of Crater Lake 159Table 15 Crater Lake Box Model -- (chloride example) 162Table 16 Steady State Mass Flux Calculations 165Table 17 Cation-based heat flux estimates 176Table 18 Summary of Heat and Salt Flux Estimates for Crater Lake 177Table 19 Hypothesis Testing 188
List of Figures (Appendices)
Figure 1 Bathymetric/topographic map of Crater Lake, OR A.4Figure 2 Depth vs. salinity A.5Figure 3 Depth vs. temperature in time series A.5Figure 4 Temperature vs. day from the bottom thermistor chain A.9Figure 5 Temperature vs. time for the upper water column thermistors A. 11Figure 6 Depth vs. temperature for the upper water column thermistors A. 12Figure 7 One day time series of depth versus temperature A. 13Figure 8 April-May expanded scale thermistor chain data A. 15Figure 9 Depth vs dissolved oxygen for September, 1988 and April, 1989 A.16Figure 10 Depth vs temperature for January, 1990 and July, 1990 A.17Figure 11 Depth vs Temperature for three days in February A.20Figure 12 Hydrographic data taken 19 September 1988 A.25Figure 13 Depth vs dissolved and particulate Fe from north basin A.26Figure 14 Examples of convective cells A.29Figure 15 T-S diagram of the South Basin of Crater Lake A.30Figure 16 T-S diagram of the hypolimnion of Crater Lake A.32Figure 17 Conceptual model A.34
Figure 1 Dive tracks for biology dives (219, 221, 224, 225, 227) B.2
Figure 1 1989 dive tracks for USGS dives (208, 210, 212, 213, 214) C.4
List of Figures (Appendices) - continued
Figure 1 Map of gravity core locations F.2Figure 2 Location of box cores, peepers, and TTT F.4Figure 3 Intercalibration of thermistors in the SeaCat iTT temperature probe F. 14Figure 4 Modeled flow rates based on the distribution of Na downcore in
box cores and gravity cores F. 15Figure 5 Modeled flow rates based on the distribution of Si downcore in
box cores and gravity cores P.16Figure 6 Modeled flow rates based on the distribution of Na downcore in
gravity cores F. 18Figure 7 Ca/Al values for various Crater Lake solid materials F.21Figure 8 Concentrations of Cl and dissolved Si vs. Na P.22Figure 9 Contour plots of reduced x2 as a function of the sediment
diffusion coefficient and upwelling speed F.25Figure 10 Representative profiles of temperature plotted with modeled
profiles P.27Figure 11 Seven day times series record of the 1TF temperature probe F. 28
Figure 1 F-il, F-12 and the F-i 1/F-12 ratio in the atmosphere vs time G.2Figure 2 CFC-i 1, CFC-12 vs depth in Crater Lake G.2
List of Tables (Appendices).
.
Heat Flux, Salt Flux, and Fluid Flow A.7Calculation of Heat Flux based on CTD data and model A.23AT and Layer Thicknesses based on Observed Fluxes A.23
Chemical composition of pore waters from box cores F.6Chemical composition of pore waters from peepers F.9Chemical composition of pore waters from gravity cores P.10Chemical fluxes from sediments to overlying water column F.20Vertical fluid velocities estimated from the chemical data F.20Average TTT measurements for each day of deployment F.20
1987 ROY and 1988, 1989 Crater Lake Submersible Dive Summary H. 1
Table A.1Table A.2
Q Table A.3
Table F. 1Table F.2Table P.3Table F.4Table F.5Table P.6
Table H. 1
I Introduction
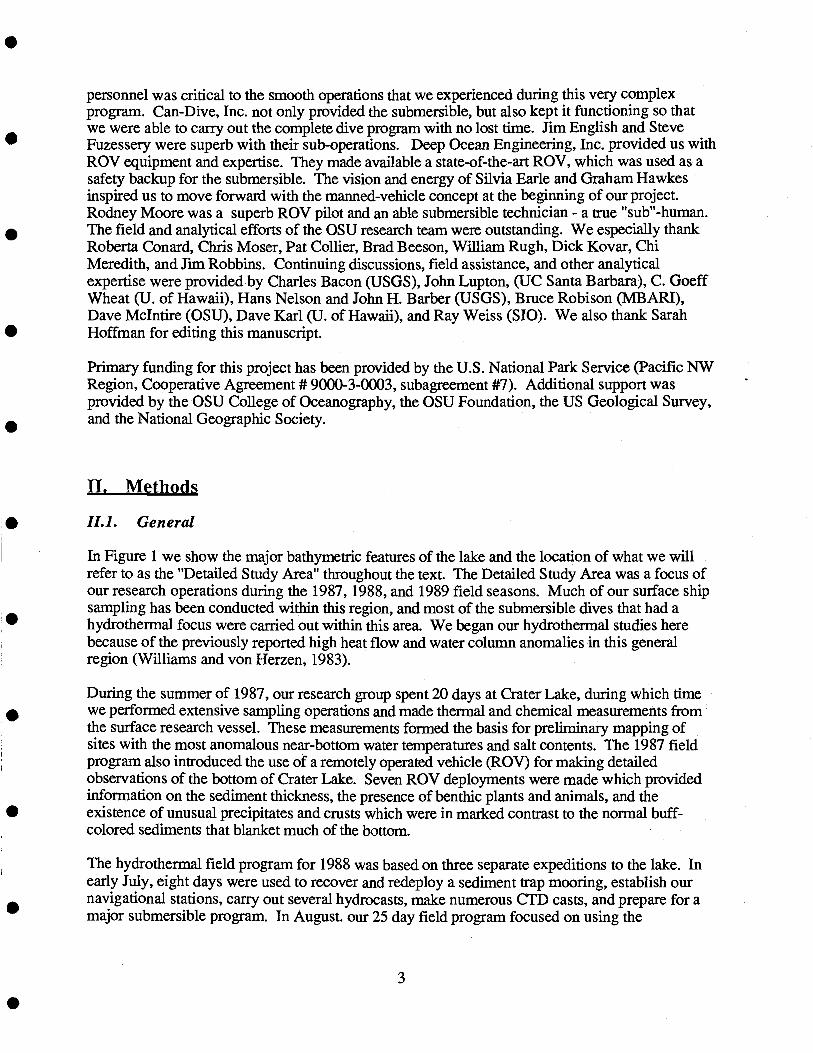
Crater Lake sits within the caldera of Mt. Mazama, a center of volcanism in the Oregon Cascadesfor more than 400,000 years (Bacon and Lanphere, 1990). The morphology of the lake is largelya consequence of a climactic eruption that occurred 6845±50 years ago; however, intercalderavolcanism took place as recently as 4000 years ago (Bacon and Lanphere, 1990). The volcanicmorphology provides a basin for what is now the deepest lake in the United States (approximately590 meters). The volcanic terrain strongly limits the nutrient fluxes into the lake, mostly becausethe lake covers 78% of the total drainage area. Consequently, the lake is highly oligotrophic andone of the clearest lakes in the world.
Our studies of Crater Lake began as an attempt to understand the important physical and chemicalcharacteristics of the lake and the processes which produced some unusual sediment compositions.As we have reported in the past (Collier and Dymond, 1988a Coffier and Dymond, 1989; Dymondet al., 1989; Dymond and Coffier, 1990; Collier et al., 1990), a number of these features areconsistent with hydrothermal inputs to the lake. Given the location of the lake directly above arelatively recent and major magmatic source (Bacon and Druitt, 1988), thermal spring input to thelake would not be surprising. Such a source was first suggested by Van Denburgh (1968), whonoted the relatively high sulfate and chloride content of Crater Lake as compared to nearby DavisLake, and suggested that these two constituents u may have been contributed to the lake bythermal springs or fumaroles, probably located below the present lake level. Such springs andfumaroles are a common expression of hydrothermal activity at a site of volcanic eruptions." VanDenburgh did not state whether he thought hydrothermal input was active today. Simpson(1970a) showed that the deep lake had strong gradients in both 14C and the stable carbon isotopes,l2( and 13C. These gradients were consistent with a source of carbon having an isotopiccomposition similar to magmatic sources. Simpson also constructed a mass balance model whichindicated that only a fraction of the ionic content of Crater Lake could be accounted for by knowninputs. He suggested the missing source was the result of "fumarole or hot spring activity near thebottom," and he estimated fluxes from this proposed source.
More recently Williams and Von Herzen (1983) measured high conductive heat flow in certainareas of the lake's sedimented bottom. In one of these areas of high heat flow, they alsodocumented anomalous near-bottom temperatures. This study reinforced earlier work describingthe deep temperature structure of the lake as hyperadiabatic (Neal et al., 1971; 1972). On the basisof the heatfiow pattern and the water column measurements, Williams and Von Herzen (1983)suggested that there is thermal spring input to the deep lake.
Studies of Crater Lake water composition have provided further support for hydrothermalhypotheses. Thompson et al. (1990) pointed out that Crater Lake has high boron and lithiumcontents compared to local meteoric water, these elements are typically enriched in thermal watersof volcanic origin In addition, they showed that Cl/Li ratios in Crater Lake waters are vezy similarto those observed in hot springs from volcanic sources but that these ratios are outside the range ofvalues observed in Mt. Mazarna cold springs. Nathenson (l990a) demonstrated that a hydrologicmodel which incorporated precipitation, cold springs, evaporation, and seepage could not accountfor the major element content of Crater Lake. He suggested thermal springs provide the missinginput and, based on geochemical mass balance models, he constrained the input of thermal watersto range between 80 and 1900 liters/second. Nathenson points out that this inflow can easilyprovide the convective heat flux estimated by Williams and Von Herzen (1983). Nathenson's
1
lower estimate of hydrothermal flux overlaps that of Sorey (1985) who suggested a thermal-springdischarge into the lake of 30- 150 liters/second.
Evidence of hydrothermal sources to the lake have not gone unchallenged. La Fleur (1987; 1990)argues against any hydrothennal inputs to the lake and suggests that underestimated evaporationrates, fumarolic inputs, and weathering of Mazama ash could account for the anomalouscomposition of the lake. He suggests that conductive heating rather than convective inputsaccounts for the temperature anomalies. La Fleur (1990) proposes that deep springs from calderawall aquifers can account for the anomalous fluids observed during our 1989 field program.
The question of whether there are hydrothermal sources to Crater Lake has important implicationsfor understanding the lake ecology. For example, the relatively rapid mixing that has beensuggested for Crater Lake (Simpson, 1970b; Voichok et al., 1970) may be a consequence ofhydrothermal inputs to the bottom of the lake. If this is true, temporal variability in this sourcecould impact the nutrient cycling and the plant productivity of the lake. In 1987, in response to therequirement of Public Law 99-591 for identification of significant thermal features in nationalparks, the Park Service initiated a three-year program to evaluate possible hydrothermal sources toCrater Lake. The research, which is part of a 10-year Limnological Study of Crater Lake, isdesigned to: (1) define the thermal and chemical variability in the deep lake, (2) examine the datafor evidence of a hydrothermal source, (3) design and cany out a program that would findpossible venting sites and sample any associated fluids, and (4) evaluate alternative mechanisms toexplain the observed thermal and chemical variability.
This report summarizes the field programs and laboratory analyses which have been carried Outfrom 1987 to the present. The results for the 1987 and 1988 field programs also have beenreported in Collier and Dymond (1988a); Collier and Dymond (1988b); Collier and Dymond 1989;Dymond et al., 1989; Dymond and Collier, 1990; and Coffier et al., (1990). During the summer of1989, our research group spent approximately 35 days at the lake in an expanded program thatincluded the use of the research submersible, Deep Rover. In order to provide a comprehensivereport, results from the previous publications and reports are included here; however, we placegreater emphasis on the 1989 field program in this report because those results have not beenreported until now.
A draft of this report was completed on October 26, 1990 and submitted to a peer reviewcommittee chaired by Dr. Charles Goldman. We have considered the evaluations andrecommendations of the review committee in this final report of the research. In addition we haveresponded to reviews of the draft report by the U.S. Bureau of Land Management and theCalifornia Energy Company.
Acknowledgements
We take this opportunity to acknowledge and thank the many people who have helped to make thisresearch effort possible. Gary Larson, our co-PI for the project, provides the important link to theU.S. Park Service and has collaborated on our research efforts for many years. Particular thanksgoes to James Milestone and Mark Buktenica, Park personnel who worked for many months priorto the submersible operations to provide the necessary logistical support for the research. Theiroutstanding efforts and selfless commitment during the field programs are also greatly appreciated.The assistance of Robert Benton, Superintendent of Crater Lake National Park, and other Park
2
personnel was critical to the smooth operations that we experienced during this very complexprogram. Can-Dive, Inc. not only provided the submersible, but also kept it functioning so thatwe were able to carry out the complete dive program with no lost time. Jim English and SteveFuzessery were superb with their sub-operations. Deep Ocean Engineering, Inc. provided us withROY equipment and expertise. They made available a state-of-the-art ROY, which was used as asafety backup for the submersible. The vision and energy of Silvia Earle and Graham Hawkesinspired us to move forward with the manned-vehicle concept at the beginning of our project.Rodney Moore was a superb ROY pilot and an able submersible technician - a true "sub"-human.The field and analytical efforts of the OSU research team were outstanding. We especially thankRoberta Conard, Chris Moser, Pat Collier, Brad Beeson, William Rugh, Dick Kovar, ChiMeredith, and Jim Robbins. Continuing discussions, field assistance, and other analyticalexpertise were provided by Charles Bacon (USGS), John Lupton, (UC Santa Barbara), C. GoeffWheat (U. of Hawaii), Hans Nelson and John H. Barber (USGS), Bruce Robison (MBARI),Dave Mclntire (OSU), Dave Karl (U. of Hawaii), and Ray Weiss (Sb). We also thank SarahHoffman for editing this manuscript.
Primary funding for this project has been provided by the U.S. National Park Service (Pacific NWRegion, Cooperative Agreement # 9000-3-0003, subagreement #7). Additional support wasprovided by the OSU College of Oceanography, the OSU Foundation, the US Geological Survey,and the National Geographic Society.
IT. Methods
11.1. General
In Figure 1 we show the major bathymetric features of the lake and the location of what we willrefer to as the "Detailed Study Area" throughout the text. The Detailed Study Area was a focus ofour research operations during the 1987, 1988, and 1989 field seasons. Much of our surface shipsampling has been conducted within this region, and most of the submersible dives that had ahydrothermal focus were carried out within this area. We began our hydrothermal studies herebecause of the previously reported high heat flow and water column anomalies in this generalregion (Williams and von Herzen, 1983).
During the summer of 1987, our research group spent 20 days at Crater Lake, during which timewe performed extensive sampling operations and made thermal and chemical measurements fromthe surface research vessel. These measurements formed the basis for preliminary mapping ofsites with the most anomalous near-bottom water temperatures and salt contents. The 1987 fieldprogram also introduced the use of a remotely operated vehicle (ROY) for making detailedobservations of the bottom of Crater Lake. Seven ROV deployments were made which providedinformation on the sediment thickness, the presence of benthic plants and animals, and theexistence of unusual precipitates and crusts which were in marked contrast to the normal buff-colored sediments that blanket much of the bottom.
The hydrothermal field program for 1988 was based on three separate expeditions to the lake. Inearly July, eight days were used to recover and redeploy a sediment trap mooring, establish ournavigational stations, carry out several hydrocasts, make numerous CTD casts, and prepare for amajor submersible program. In August. our 25 day field program focused on using the
3
-- - - -
'rrI
submersible, Deep-Rover, to locate, observe, and sample geological, geochemical, and biologicalfeatures in the deep lake that had been hitherto inaccessible. Although much of our efforts weredirected toward the submersible operations, we also carried out bathymetric surveying, conductedhydrocasts, made CTD (conductivity, temperature, and depth) measurements, and collected coresduring this period. In September we returned to the lake to recover and redeploy the sediment trapmooring and carry out additional CTD measurements and hydrocasts.
The 1989 field programs involved frequent sampling and surface ship measurements throughoutthe season of normal lake access (June-September) as part of the Ph.D. research of JamesMcManus. Deep-Rover was again used throughout the month of August for expanded surveywork, detailed sampling, and the deployment of a number of instruments which would betterdefine the spatial and temporal variations in the anomalous fluids that were discovered during the1988 field program. In addition to this major effort, we introduced an extensive coring programwhich was the basis for compositional studies of sediment pore fluids in different parts of the lake.
11.2. Bathymetry
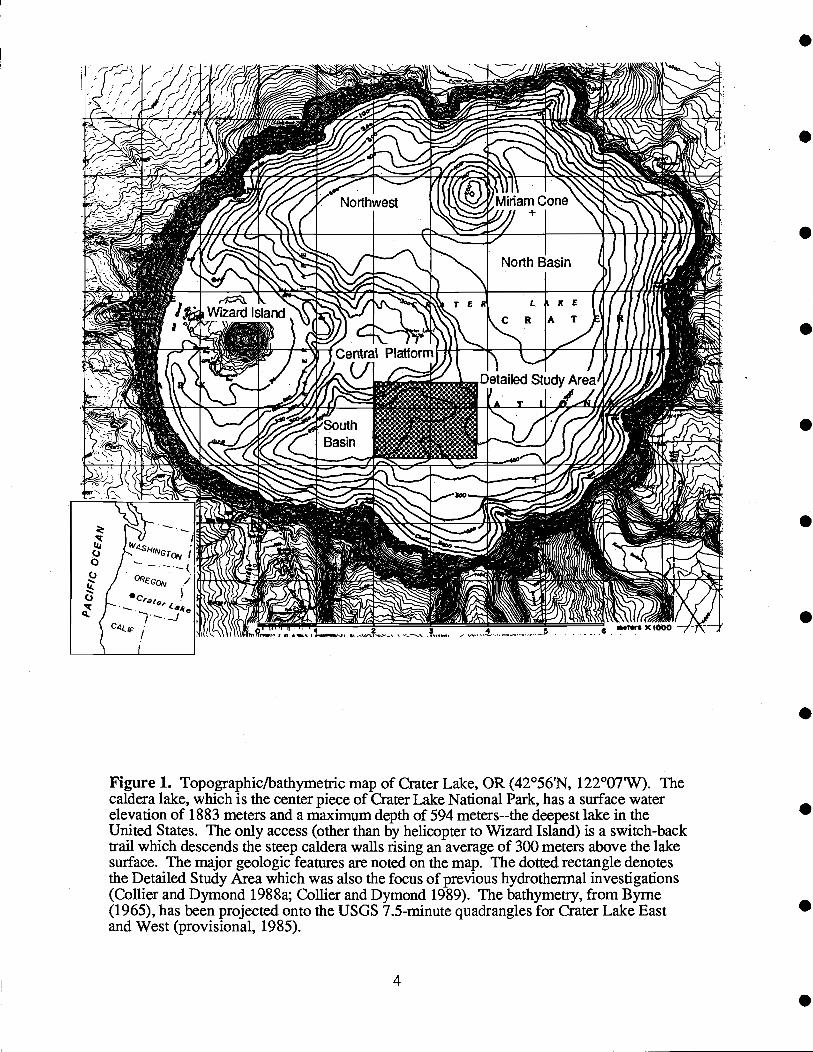
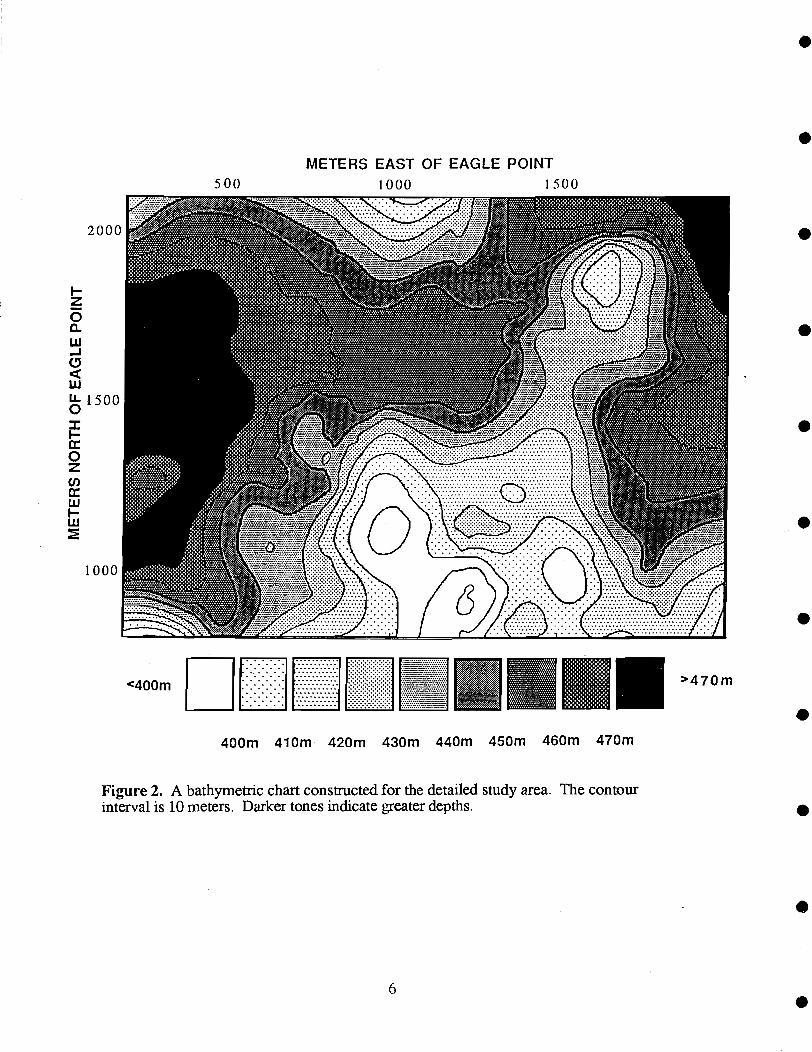
It was necessary to construct a more detailed bathymetric map for the Detailed Study Area than theone for the entire lake bottom published by Byrne, 1962. Twenty navigated transects of the areawere used to construct the new map (Figure 2). A 50 kllz echo sounder, which incorporated a 22°transducer, was used to determine the depths. Since the CT!) (see below) produced a visible traceon our fathometer record when attached to the research wire during water sampling, the depthmeasurements could be calibrated against the pressure recorded by the CTD. Depths shown on thenew map were also verified with the CT!) pressure record collected during the submersible dives.However, the wide cone of the transducer signal tends to obscure sharp changes in slope.Therefore, the true depths of areas where there are steep slopes are probably deeper than themeasured depth because the first reflection received may be from adjacent, shallower lake floor.Navigation for the transects was obtained with a microwave ranging system (Motorola Mini-Ranger ifi) that used shore stations on Eagle Point and Phantom Ship. The precision of thenavigation, based on repeated ranges to the same location, is ±5 meters.
11.3. Remotely Operated Vehicle (ROV)
A remotely operated vehicle built by Deep Ocean Engineering, Inc., San Leandro, CA, was used toobtain the first video images of the bottom of Crater Lake during the 1987 field program. Thevehicle, known as Watchdog, was engineered for tethered operation at depths of 500 feet.Because of the voltage losses due to the exceptionally long cable (1700 feet), a special transformerwas required to drive the instrument. With this small modification the ROY operated normally andwith only slight loss of power at depths of approximately 1600 feet. The live" video imagequality was very good; however, because of intermittent electronic noise some of the recordedvideos were of very poor quality. Seven separate deployments of the ROY provided 12 hours ofimagery which covered more than three kilometers of lake bottom. The general locations of thesedeployments are listed in Appendix H. Deep Ocean Engineering, Inc. also provided an ROY forthe 1988 and 1989 field seasons. This vehicle, a Phantom IV, was a backup rescue vehicle andwas not used for bottom surveying or sampling.
METERS EAST OF EAGLE POINT1000 1500
400m 410m 420m 430m 440m 450m 460m 470m
Figure 2. A bathymetric chart constructed for the detailed study area. The contourinterval is 10 meters. Darker tones indicate greater depths.
11.4. Manned-Submersible Operations
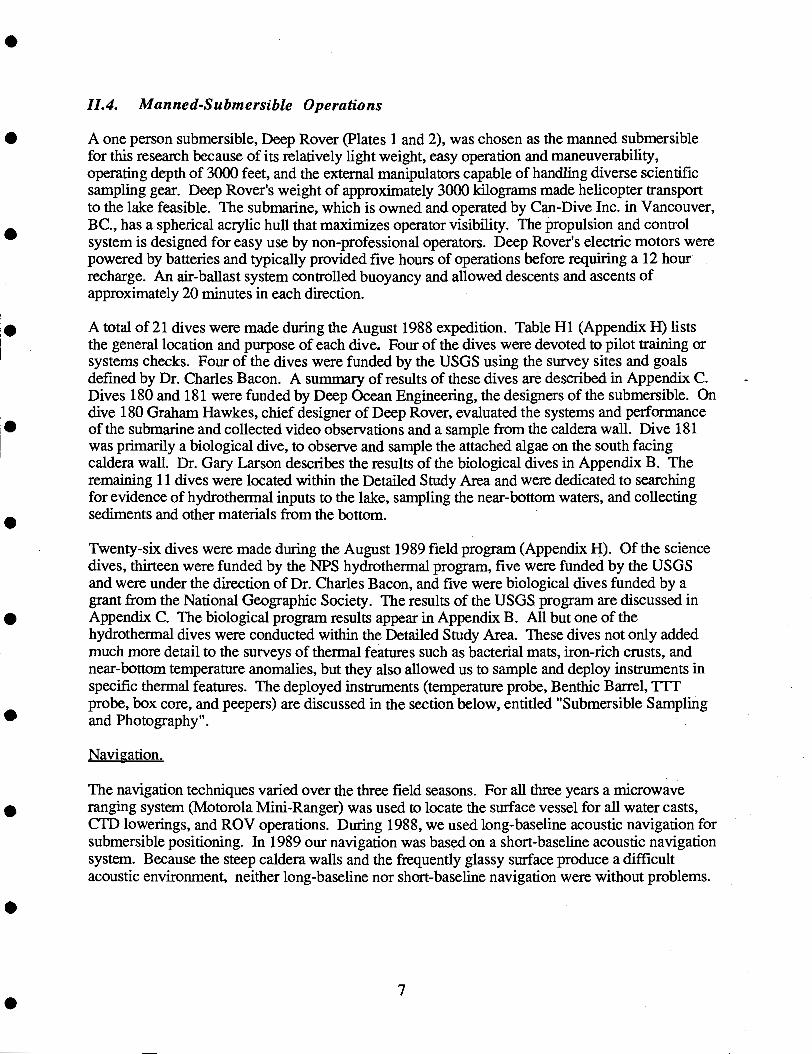
A one person submersible, Deep Rover (Plates 1 and 2), was chosen as the manned submersiblefor this research because of its relatively light weight, easy operation and maneuverability,operating depth of 3000 feet, and the external manipulators capable of handling diverse scientificsampling gear. Deep Rover's weight of approximately 3000 kilograms made helicopter transportto the lake feasible. The submarine, which is owned and operated by Can-Dive Inc. in Vancouver,BC., has a spherical acrylic hull that maximizes operator visibility. The propulsion and controlsystem is designed for easy use by non-professional operators. Deep Rover's electric motors werepowered by batteries and typically provided five hours of operations before requiring a 12 hourrecharge. An air-ballast system controlled buoyancy and allowed descents and ascents ofapproximately 20 minutes in each direction.
A total of 21 dives were made during the August 1988 expedition. Table Hi (Appendix H) liststhe general location and purpose of each dive. Four of the dives were devoted to pilot training orsystems checks. Four of the dives were funded by the USGS using the survey sites and goalsdefined by Dr. Charles Bacon. A summary of results of these dives are described in Appendix C.Dives 180 and 181 were funded by Deep Ocean Engineering, the designers of the submersible. Ondive 180 Graham Hawkes, chief designer of Deep Rover, evaluated the systems and performanceof the submarine and collected video observations and a sample from the caldera wall. Dive 181was primarily a biological dive, to observe and sample the attached algae on the south facingcaldera wall. Dr. Gary Larson describes the results of the biological dives in Appendix B. Theremaining 11 dives were located within the Detailed Study Area and were dedicated to searchingfor evidence of hydrothermal inputs to the lake, sampling the near-bottom waters, and collectingst'Aiments and other materials from the bottom.
Twenty-six dives were made during the August 1989 field program (Appendix H). Of the sciencedives, thirteen were funded by the NPS hydrothermal program, five were funded by the USGSand were under the direction of Dr. Charles Bacon, and five were biological dives funded by agrant from the National Geographic Society. The results of the USGS program are discussed inAppendix C. The biological program results appear in Appendix B. All but one of thehydrothermal dives were conducted within the Detailed Study Area. These dives not only addedmuch more detail to the surveys of thermal features such as bacterial mats, iron-rich crusts, andnear-bottom temperature anomalies, but they also allowed us to sample and deploy instruments inspecific thermal features. The deployed instruments (temperature probe, Benthic Barrel, TTTprobe, box core, and peepers) are discussed in the section below, entitled "Submersible Samplingand Photography".
Navigation.
The navigation techniques varied over the three field seasons. For all three years a microwaveranging system (Motorola Mini-Ranger) was used to locate the surface vessel for all water casts,CTD lowerings, and ROV operations. During 1988, we used long-baseline acoustic navigation forsubmersible positioning. In 1989 our navigation was based on a short-baseline acoustic navigationsystem. Because the steep caldera walls and the frequently glassy surface produce a difficultacoustic environment, neither long-baseline nor short-baseline navigation were without problems.
S
7
The microwave ranging system has a precision of ±5 meters for the surface vessel location. Thelocation of the bottom sampler, instrument, or ROY is less certain because of the angle introducedin the wire by drift or movement of the surface vessel.
A long-baseline acoustic navigation system was used in 1988 to position both the boat and thesubmersible. Unfortunately, problems with the navigation system, contracted from OceanoInstruments, greatly reduced the accuracy and reliability of the submersible navigation. Duringseveral dives, the acoustic system failed to locate the submersible for periods of an hour or more.Large, inconsistent errors in positioning frustrated efforts to survey the study area and maderelocating important features tedious and time-consuming. A greater reliance on the microwaveranging system and on dead-reckoning partially compensated for these difficulties in the field. Wehave refined this dead-reckoning navigation with the support of dive logs and bathymetty toproduce track lines for most of the dives within the Detailed Study Area.
The track lines for nine dives in the Detailed Study Area are shown in Collier and Dymond (1989).The errors in these lines cannot be estimated directly and will vary depending on the quality ofsurface-to-submersible communications and the complexity of the track line. In general, the earlyand late portions of the dives may have navigation errors on the order of ±10 meters but mid-diveperiods, far removed from any geodetic reference points, may have errors ranging from 50-100meters.
Prior to the 1989 field season we enlisted the help of the USGS to refine the geodetic position ofour microwave ranging stations. Navigation for the 1989 submersible program was significantlyimproved, but not without problems. We chose a Trackpoint II system (Land and Sea Surveys)which was integrated with microwave positioning and gyro compass data for the surface vessel.The short-baseline system differs from long-baseline approaches in that no bottom-mooredtransponders are used for reference. Consequently, line-of-site problems that are inherent in long-baseline navigation are much diminished. In general, this system provided good tracking of thesubmersible during transects; however, there were periods when the position fixes were noisyRe-occupation of positions sometimes resulted in discrepancies of 10 to 50 meters.
Video and Photographic Recording.
Lighting for the deep lake operations was provided by several 250 and 500 watt incandescent lightsand a 1500 Watt-sec strobe. These lights, although adequate for close-in sampling andobservations, did not allow us to take full advantage of the exceptional clarity of the lake.Typically, only a swath 5 to 10 meters across our path was adequately lighted to allow detailedobservations.
By making some assumptions about submersible speed and this 5-10 m visual swath, we haveestimated the percentage of the bottom covered by our observations with Deep Rover. The 39science dives had an average bottom time of 4 hours, and typical speeds were 0.5 knots. Thisresults in 144 kilometers of track. For a 10 m swath we observed 1.4 x 10⁶ m2 of lake bottom.Because of track crossing and sampling stops, we estimate that the observations are only 50%efficient. Consequently, we have covered approximately 7 x iO m of the bottom. Of this, 63%was spent in the Detailed Study Area and 37% was divided between biology and USGS dives.The total lake area is 53 km2. Consequently, we covered approximately 1.4% of the lake floorwith Deep Rover. Within the South Basin, the site of the thermal anomalies within the watercolumn, our dive tracks covered less than 25% of the bottom.
8
.
S
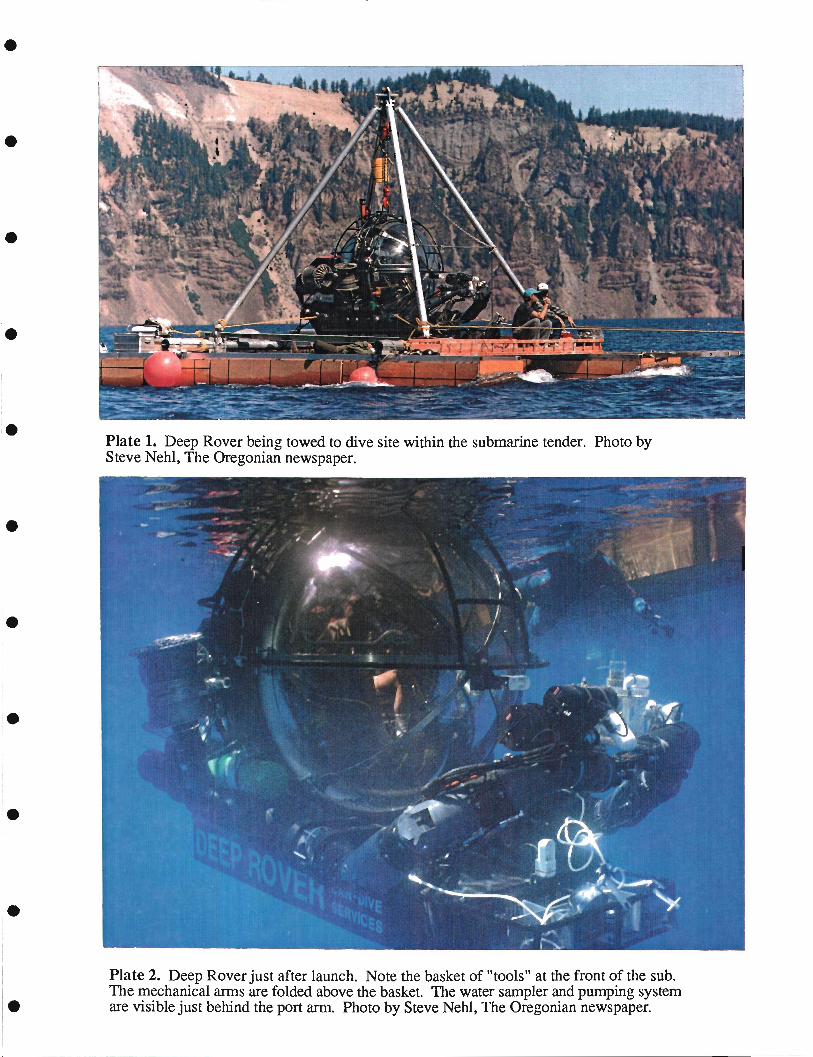
Plate 1. Deep Rover being towed to dive site within the submarine tender. Photo bySteve Nehi, The Oregonian newspaper.
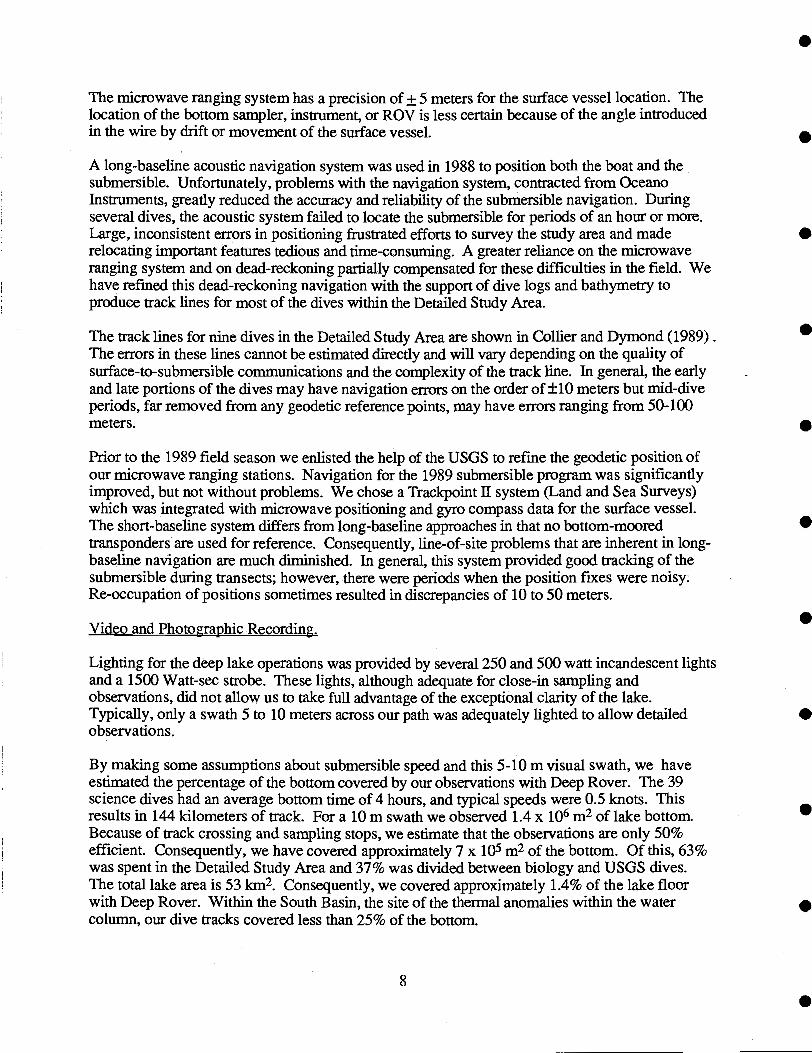
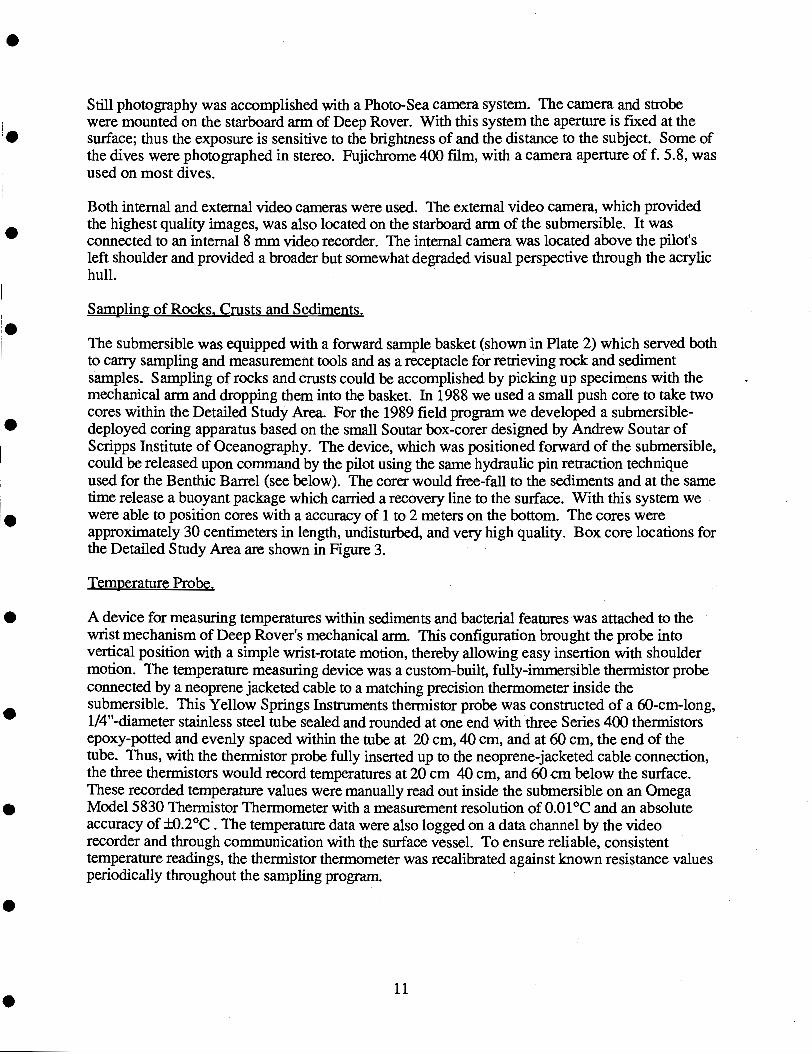
Plate 2. Deep Rover just after launch. Note the basket of "tools't at the front of the sub.The mechanical arms are folded above the basket. The water sampler and pumping systemare visible just behind the port arm. Photo by Steve Nehi, The Oregonian newspaper.
Still photography was accomplished with a Photo-Sea camera system. The camera and strobewere mounted on the starboard arm of Deep Rover. With this system the aperture is fixed at thesurface; thus the exposure is sensitive to the brightness of and the distance to the subject. Some ofthe dives were photographed in stereo. Fujichrome 400 film, with a camera aperture of f. 5.8, wasused on most dives.
Both internal and external video cameras were used. The external video camera, which providedthe highest quality images, was also located on the starboard arm of the submersible. It wasconnected to an internal 8 mm video recorder. The internal camera was located above the pilot'sleft shoulder and provided a broader but somewhat degraded visual perspective through the acrylichull.
Sampling of Rocks. Crusts and Sediments.
The submersible was equipped with a forward sample basket (shown in Plate 2) which served bothto carry sampling and measurement tools and as a receptacle for retrieving rock and sedimentsamples. Sampling of rocks and crusts could be accomplished by picking up specimens with themechanical arm and dropping them into the basket. In 1988 we used a small push core to take twocores within the Detailed Study Area. For the 1989 field program we developed a submersible-deployed coring apparatus based on the small Soutar box-corer designed by Andrew Soutar ofScripps Institute of Oceanography. The device, which was positioned forward of the submersible,could be released upon command by the pilot using the same hydraulic pin retraction techniqueused for the Benthic Barrel (see below). The corer would free-fall to the sediments and at the sametime release a buoyant package which carried a recovery line to the surface. With this system wewere able to position cores with a accuracy of 1 to 2 meters on the bottom. The cores wereapproximately 30 centimeters in length, undisturbed, and very high quality. Box core locations forthe Detailed Study Area are shown in Figure 3.
Temperature Probe.
A device for measuring temperatures within sediments and bacterial features was attached to thewrist mechanism of Deep Rover's mechanical arm. This configuration brought the probe intovertical position with a simple wrist-rotate motion, thereby allowing easy insertion with shouldermotion. The temperature measuring device was a custom-built, fully-immersible thermistor probeconnected by a neoprene jacketed cable to a matching precision thermometer inside thesubmersible. This Yellow Springs Instruments thermistor probe was constructed of a 60-cm-long,1/4"-diameter stainless steel tube sealed and rounded at one end with three Series 400 thermistorsepoxy-potted and evenly spaced within the tube at 20 cm, 40 cm, and at 60 cm, the end of thetube. Thus, with the thermistor probe fully inserted up to the neoprene-jacketed cable connection,the three thermistors would record temperatures at 20 cm 40 cm, and 60 cm below the surface.These recorded temperature values were manually read Out inside the submersible on an OmegaModel 5830 Thermistor Thermometer with a measurement resolution of 0.0 1°C and an absoluteaccuracy of ±0.2°C . The temperature data were also logged on a data channel by the videorecorder and through communication with the surface vessel. To ensure reliable, consistenttemperature readings, the thermistor thermometer was recalibrated against known resistance valuesperiodically throughout the sampling program.
11

1000
1989 Locations of Box Cores, Benthic Barrel and TTT
490-470 470-450 450-430 430-410 410-390meters
400 600 800 1000 1200 1400
Meters E of Eagle Point
Figure 3. Box core locations in the Detailed Study Area. Bathymetry determined bynear-bottom CU) measurements.
1600 1800
1800
4-'
1600
Z
a)
1400
1200
Benthic Barrel.
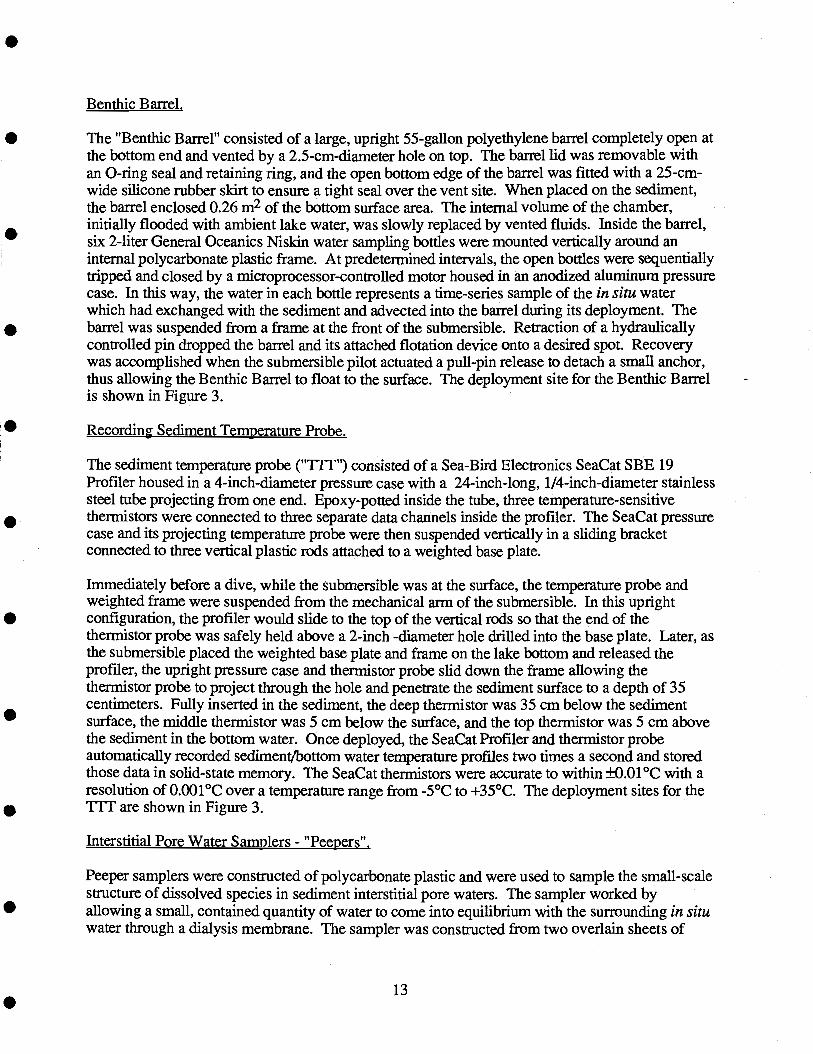
The "Benthic Barrel" consisted of a large, upright 55-gallon polyethylene barrel completely open atthe bottom end and vented by a 2.5-cm-diameter hole on top. The barrel lid was removable withan 0-ring seal and retaining ring, and the open bottom edge of the barrel was fitted with a 25-cm-wide silicone rubber skirt to ensure a tight seal over the vent site. When placed on the sediment,the barrel enclosed 0.26 m2 of the bottom surface area. The internal volume of the chamber,initially flooded with ambient lake water, was slowly replaced by vented fluids. Inside the barrel,six 2-liter General Oceanics Niskin water sampling bottles were mounted vertically around aninternal polycarbonate plastic frame. At predetermined intervals, the open bottles were sequentiallytripped and closed by a microprocessor-controlled motor housed in an anodized aluminum pressurecase. In this way, the water in each bottle represents a time-series sample of the in situ waterwhich had exchanged with the sediment and advected into the barrel during its deployment. Thebarrel was suspended from a frame at the front of the submersible. Retraction of a hydraulicallycontrolled pin dropped the barrel and its attached flotation device onto a desired spot. Recoverywas accomplished when the submersible pilot actuated a pull-pin release to detach a sm'll anchor,thus allowing the Benthic Barrel to float to the surface. The deployment site for the Benthic Barrelis shown in Figure 3.
Recording Sediment Temperature Probe.
The sediment temperature probe ('Tl'T") consisted of a Sea-Bird Electronics SeaCat SBE 19Profiler housed in a 4-inch-diameter pressure case with a 24-inch-long, 1/4-inch-diameter stainlesssteel tube projecting from one end. Epoxy-potted inside the tube, three temperature-sensitivethermistors were connected to three separate data channels inside the profiler. The SeaCat pressurecase and its projecting temperature probe were then suspended vertically in a sliding bracketconnected to three vertical plastic rods attached to a weighted base plate.
Immediately before a dive, while the submersible was at the surface, the temperature probe andweighted frame were suspended from the mechanical arm of the submersible. In this uprightconfiguration, the profiler would slide to the top of the vertical rods so that the end of thethermistor probe was safely held above a 2-inch -diameter hole drilled into the base plate. Later, asthe submersible placed the weighted base plate and frame on the lake bottom and released theproffler, the upright pressure case and thermistor probe slid down the frame allowing thethermistor probe to project through the hole and penetrate the sediment surface to a depth of 35centimeters. Fully inserted in the sediment, the deep thermistor was 35 cm below the sedimentsurface, the middle thermistor was 5 cm below the surface, and the top thermistor was 5 cm abovethe sediment in the bottom water. Once deployed, the SeaCat Profiler and thermistor probeautomatically recorded sediment/bottom water temperature profiles two times a second and storedthose data in solid-state memory. The SeaCat thermistors were accurate to within ±0.01°C with aresolution of 0.001°C over a temperature range from -5°C to +35°C. The deployment sites for the'[TI are shown in Figure 3.
Interstitial Pore Water Samplers - "Peepers".
Peeper samplers were constructed of polycarbonate plastic and were used to sample the small-scalestructure of dissolved species in sediment interstitial pore waters. The sampler worked byallowing a small, contained quantity of water to come into equilibrium with the surrounding in situwater through a dialysis membrane. The sampler was constructed from two overlain sheets of
13
five-inch-wide polycarbonate plastic assembled with nylon machine screws to avoid any metalliccontamination. Side-by-side oval compartments (1 cm high x 4.5 cm wide) were milled throughthe thin cover sheet and into the half-inch-thick backing plate at two centimeter intervals down thelength of the samplers. A plastic T-handlle was added to the top of the peeper, and the bottom edgewas bevelled to allow the sampler to slice into the sediment while causing only a minimaldisturbance of the interstitial pore waters.
A peeper sampler was prepared by filling the compartments with degassed distilled water andcarefully laying a piece of dialysis membrane over the full compartments so as to exclude any airbubbles. The thinner cover sheet was then laid over the membrane, holes were poked for thenylon screws, and the cover sheet was screwed down tight. The entire sampler was then allowedto equilibrate in a closed bath of distilled water under a nitrogen atmosphere where the sampler lostmost of its dissolved gases by equilibration. Immediately before the submersible left the surface atthe start of a dive, the peepers were transferred to a similar sheath of degassed water in thesubmersible's basket. As soon as the submersible arrived on the bottom, the peeper was deployedusing the sub's articulated arm. The peepers were left in the sediments to equilibrate forapproximately one week before recovery. The locations of peeper deployments within the DetailedStudy Area are shown in Figure 4.
11.5. Water Temperature, Conductivity, and Light Transmission
CTD Instrumentation.
A profiling instrument package was deployed on a hydrographic wire and was also carried on thesubmersible in order to measure the conductivity, temperature, and light iransmissivity as afunction of depth in the water column. This instrument package, which we will refer to as a
was a SEACAT model SBE19 (Sea-Bird Electronics, Inc.) coupled to a 25-cm path-length beam transmissometer (Sea Tech, Inc.). The CTD records all data internally (2 scans persecond of all sensors for up to 4 hours) and was also monitored in real-time through a specialconducting hydrographic cable attached to the computer on the research boat or onboard thesubmersible. This instrument was specifically modified by the manufacturer to optimizeconductivity measurements in the fresh water system of Crater Lake. The CTD has a temperatureresolution of better than 0.001°C; the conductivity resolution is 4 x i0- SiemenImeter(0.4 .tmhos/cm); and the pressure resolution is 0.5 decibars.
In this report the conductivity data is presented in the accepted SI unit of conductivity:Siemens/meter. This unit can be converted to the common linmologic units of pmho/cm by thefollowing relationship: 1 siemen/meter = 10,000 prnhos/cm. However, it should also be notedthat the CTD records conductivity at in situ temperatures - not at 25°C, as is conventional forreporting the conductivity of discrete samples. Therefore, our data cannot be directly compared togeneral tabulations of lake conductivities (e.g., data in Thompson et. al., 1987). There is a majortemperature effect on conductivity; for example 15°C surface water and 3.6°C deep water haveconductivities of 0.0 10 and 0.007 siemens/meter, respectively. Using rigorous physical chemicalmodels, this temperature effect can only be corrected to 25°C for a few simple electrolytes such asKC1 (Harned and Owen, 1958). Tabulations of single-ion specific conductances and functionsdescribing their change in conductance with increasing concentration exist, but the temperatureeffects on these functions have not been determined for each ion and cannot be predicted fromufirst principles" (Conway, 1952; Robinson and Stokes, 1959). The most accurate alternative,
14

c00
1800
1600
0)uJ'4-0Z 1400
a)a)
1200
1000
Peeper Locations
490-470 470-450 450-430 430-410 410-390meters
400 600 800 1000 1200 1400 1600 1800
Meters E of Eagle Point
Figure 4. "Peeper" deployments in the Detailed Study Area.

which we have chosen for our work, is a complete temperature calibration of the instrument usingthe actual ionic composition of Crater Lake water. We believe that the precision and accuracynecessary for computations of density in the deep lake justify this effort.
The Cii) was recalibrated for temperature and conductivity at the OSU calibration facility inJanuary 1988 and May 1989. Conversion of pressure (decibars) to depth (meters) is carried out bythe integration of water densities down through the water column. The depths are effectively equalto 1.02 times the pressure. All the physical properties derived from the measurement oftemperature, conductivity, and pressure were calculated using an equation of state for wateradapted for application to lakes (Chen and Millero, 1986). The temperatures of specific watersamples collected from the hydrographic wire were estimated from the CTD record for the samehydrocast. Similar estimates for submersible-collected samples were attempted using the on-boardCTD record. The separation of the CTD sensor from the water sampler on the sub, coupled with alack of control between the time base of the dive-logs and CuD-logs, made accurate determinationof these water sample temperatures difficult.
Thermistor Chain Mooring.
Three recording thermistor chains were deployed on a single mooring within the North Basin areafrom 2 September 1989 until 10 July 1990 to monitor details of the water column temperatureprofile. Each thermistor chain was 100 meters long with 11 thermistors spaced every ten metersalong its length. Two of the three thermistor chains were placed end-to-end to monitor watertemperatures within the bottom 200 meters of the water column. The third chain sampled the upperwater column thermal stratigraphy between 50 and 150 meters depth. Each thermistor chain wasconnected to an Aanderra TR-2 Temperature Profile Recorder which logged data on a 1/4-inch reel-to-reel magnetic tape at one hour intervals. Each hourly measurement cycle consisted of 12 datachannels in sequence, a fixed reference reading in channel 1 to monitor the performance of theinstrument and 11 channels of temperatures. The instruments were also calibrated beforedeployment and again after recovery in a high-precision, temperature-controlled water bath toensure reliable and reproducible data during their ten month deployment. The results from thisthermistor mooring deployment are presented in Appendix A.
11.6. Current measurements
For 16 days, from 22 August 1989 until 7 September 1989, an InterOcean S4 current meter wasdeployed within the Detailed Study Area (X=585m; Y=1478m, relative to Eagle Point) at 468meters depth on a mooring in 475 meters of water. The S4 current meter sampled current velocity,current direction, pressure, and temperature data every 30 minutes during its deployment. Unlikeother current meters, the spherical S4 instrument contains no moving parts except for the sensingelement in its flux-gate magnetometer. Its velocity sensor consisted of a toroidal coil, twoorthogonal sets of electrodes, and associated electronic circuitry. The coil produced a high-frequency modulated magnetic field in the region surrounding the current meter. The movement ofwater through this field induced a potential difference in the associated electrical field that wassensed by the orthogonal electrodes. The velocity information, compass output and other sensordata were then processed by an internal computer and stored in solid-state memory.
16
11.7. Water Samples
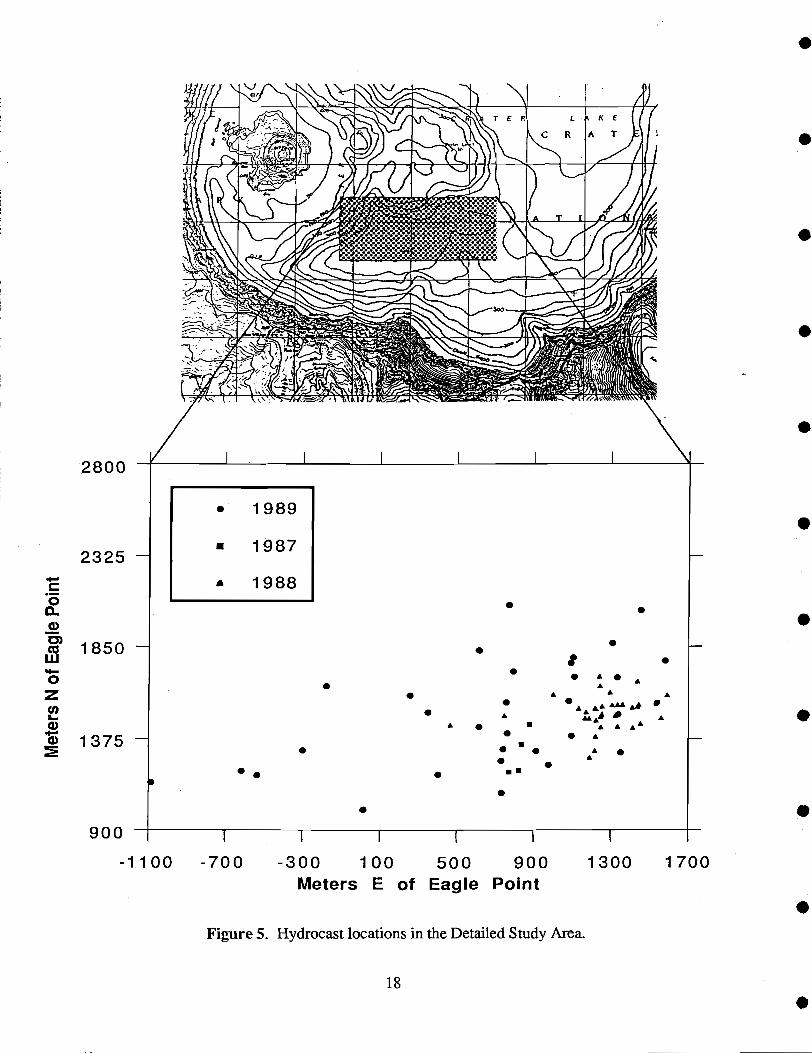
Water samples from throughout the water column were collected from the NPS research boat usingthe standard 1/8" stainless steel hydrographic wire. Various oceanographic water samplers weremounted on the wire, depending on the sample requirements for individual chemical analyses.Typically, 5-liter or 30-liter Niskin®type samplers (General Oceanics) were used. Some of thesampling for trace-metal analyses used teflon-coated 5- and 20- liter GoFlo®type (GeneralOceanics) samplers. In order to avoid contamination and preserve the integrity of each sample,great care was taken in each step of collection, preservation and analysis (Bruland et al., 1979).These hydrocast locations are shown in Figure 5.
Water sampling on the submersible was accomplished with Niskin-type samplers designed andowned by Dr. Bruce Robison, Monterey Bay Research Institution. These all-plastic samplers heldfive liters of water. They were tripped with solenoids operated by the submersible pilot. Early inthe dive program, paired water samplers were carried in the sample basket and were lifted out andinto place with the mechanical arm prior to tripping. This allowed the sampler to be placedrelatively accurately in relation to specific features (such as the bacterial mats that are discussedbelow). The basket placement, however, subjected the samples to jostling and possible leakageduring submersible recovery. Consequently, for most of the later dives, the water bottles weremounted on the port side of the submersible, just forward of the acrylic hull. The locations ofsubmersible-collected water samples are shown in Figure 6.
A pumping system was developed to collect water from certain thermal-chemical features with aminimum of lake water admixture. Bruce Robison's large volume filtration pump was attached tothe downstream end of a five-liter Go-Flo bottle. A plastic tube and nozzle which could be directedinto these features was attached to the upstream end of the water bottle. A sample was obtained bypumping fluid into the bottle for approximately one minute to flush out the ambient water, then theopening and closing valves were tripped.
11.8. Chemical Analyses of Water Samples
All water samples for ionic analyses were filtered through an acid-cleaned, 0.4prn polycarbonatefilter (Nuclepore®) under a clean atmosphere. Samples for major and trace cation analyses wereacidified to pH2 with sub-boiled redistilled HC1. All samples were subsequently stored in the darkat 4°C until analysis.
The cations, Na, K, Ca, Mg and Li, were analyzed directly by flame atomic absorptionspectrophotometry using a Perkin Elmer model-5000 spectrophotometer. All samples andstandards were matrix adjusted with CsC1 to suppress ionization interferences. Calcium analysesincluded LaCl3 as a releasing agent to suppress interferences from dissolved silicon. Theinstrumental setup involved for each element generally followed Perkin Elmer (1982) or EPA(1979) methods. Each individual sample was analyzed two to four times, where each "analysis" isthe average of three separate three-second instrument readings. The instrument is recalibrated("resloped") between each sample.
Standard additions methods were applied to some samples to verify the absence of matrixinterferences between samples and standards. Replicate analyses of approximately 10% of the totalnumber of samples were performed during each analysis sequence to check the overall precision.
17
18
A
C R
PZ.iVi:) :.
: /JII\\-1' .A'
-!:_ -
C00
2800
2325
1850
1375
p
A
S
A
...
U
A
S
A
A
AA
A
S
aA
5
A
Ak
S
AS
A
a
1989
1987
1988
900 i ( I
-1100 -700 -300 100 500 900 1300 1 700Meters E of Eagle Point
Figure 5. Hydrocast locations in the Detailed Study Area.
1800
C
1000
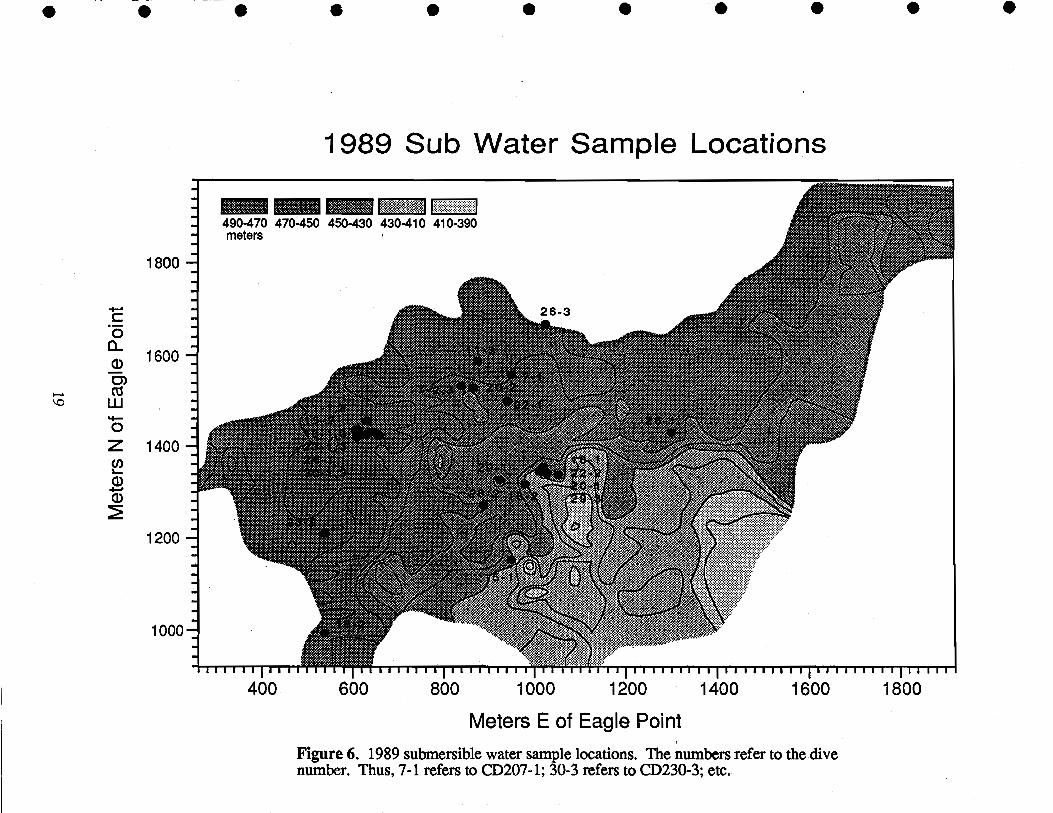
1989 Sub Water Sample Locations
490-470 470-450 450-430 430-410 410-390meters
400 600 800 1000 1200 1400
Meters E of Eagle Point
Figure 6. 1989 submersible water sample locations. The numbers refer to the divenumber. Thus, 7-1 refers to CD207-1; 30-3 refers to CD230-3; etc.
1600 1800
1600
Z
a)a)
1400
1200
These repetitive analyses are critical to achieving the maximum precision which is necessary forinterpreting the small changes in concentrations present in Crater Lake. Based on replicatemeasurements, the precision of the major cation analyses is better than ±0.5% (0.2% for Mg,0.3% for Ca, 0.4% for Na and K). For quality control, preserved samples from earlier data sets(e.g. 1987) are rerun along with new samples (e.g. 1988). The accuracy of the analyses can betraced to certified single-element standards and our results are consistent with other published andunpublished analyses (Thompson et al., 1987; Larson, 1987). Manganese was determined with aprecision of approximately 5% by Zeeman-corrected atomic absorption specirophotometry withgraphite furnace atomization.
Silicate concentrations were determined as silicic acid by a colorimetric molybdenum blue methodusing an Alpkem rapid flow analyzer with a precision of 0.3%. pH values were measured on gas-tight samples in a therinostatted system at 25.0°C using low-ionic strength electrodes and buffers.Allcalinities were determined in the same system by full Gran titrations using a microburet. Due tothe low ionic strength of lake water (i.e. as compared to seawater), the precision of the alkalinitydetermination is only about 3-4%. Sulfate and chloride analyses were determined by ionchromatography and have a precision of 2% and 1% respectively. Overall charge balancecalculations for a typical sample agree to within 4% (i.e. cations = 1.08 meq and anions =1.11 meq) and are probably constrained by the accuracy of the bicarbonate determination(pH, Alk.).
Radon-222 (222Rn) and radium-226 (226Ra) were measured using the procedures developed inMathieu (1977). Water from the sampler was transferred to evacuated 20-liter glass bottles.Radon was stripped by bubbling helium through the sample and collected on an activated charcoalcolumn at dry ice temperature. The colunm was heated and the radon transferred to an evacuatedZnS-coated scintillation cell. This cell was placed in a photomultiplier-tube counting systemcalibrated with 2Ra standards. 226Ra is measured in a similar fashion except that the watersample is kept sealed in the 20-liter bottles for two weeks to allow 2Rn to achieve radioactiveequilibrium with dissolved 226Ra. Counting errors for both analyses are always less than 10%.
Several samples of lake water, brines and porewaters were analyzed at MiT using a VGInductively-Coupled Plasma Mass Spectrometer. This state-of-the-art instrument allowed us tocany Out a sensitive, semi-quantitative elemental analysis covering the majority of the periodictable, thus confirming that we have characterized most of the major chemical components in thesesamples. We also completed a high-precision isotope-dilution analysis for REE, Ba, Sr, Rb, U,and Cs.
11.9. Sediment, Crust, and Mat Analyses
Samples were prepared for analysis by freeze-drying the wet solids and then pulverizing the driedmaterial with an agate mortar and pestle. Atomic absorption spectrophotomeiry (AAS) was used todetermine concentrations of Li, Na, Mg, Al, Si, K, Ca, Ti, Mn, Fe, Ni, Cu, Zn, and Ba in thesediments, crusts, and bacterial mats using the dissolution and analytical procedures outhned inDymond et al. (1984). The same techniques were used to analyze samples of USGS standardrocks. A comparison of our results with the standard values demonstrates that there are nosystematic errors in our methods.
20

In most cases, splits of the samples were analyzed for a suite of elements (Cr, Fe, As, Sb, Ba,REE's, Hf, Th and U) by instrumental neutron activation analysis. For elements measured byboth techniques, the data agree to within 10%. Samples were also analyzed for C, N, and S usingan automated Carlo Erba CNS analyzer. In cases where sufficient material was available,phosphorus was measured colorimeirically.
For the "spire" sample (see the Solid Phase Geochemistry section) a quantitative microprobetransect was made to define the small-scale spatial variability in this unusual material. The samplewas vacuum-impregnated with epoxy, polished, carbon coated, and quantitatively analyzed with aCameca electron microprobe calibrated with rock and alloy standards. Porosity variations andimperfect surfaces result in lower precision for these samples than is typical for microprobeanalyses. Precision of the major elements is estimated to be 5% and for minor elements 10% to20%.
11.10. Additional Chemical Analyses
In addition to the water and sediment analyses that have been carried out at Oregon StateUniversity, we have distributed samples for analysis to the following people: Dr. Charles Bacon,US Geological Survey (rock samples); Dr. David Karl, University of Hawaii (microbiologicalinvestigations); Dr. Gary Klinkhammer, Oregon State University (rare earth measurements in lakefluids); Dr. John Lupton, University of Santa Barbara (helium isotope and tritium analyses); Drs.Clifford Dahm and Maribeth Watwood of the University of New Mexico (microbiologicalinvestigations); Dr. Marvin Lilley, University of Washington (methane analysis); Dr. DalePillsbury, Oregon State University (moored thermistors and current meters); Dr. Peter Schlosser,Columbia University (14C analyses); Dr. Ray Weiss, University of California, San Diego(Chiorofluorocarbon measurements); Dr. Goeff Wheat, University of Hawaii (pore water studies).
III Results
111.1. Major Features Observed with the Submersible
The use of the remotely operated vehicle (ROY) and the manned submersible, Deep Rover (Plates1 and 2), enabled us not only to make detailed measurements and obtain high-quality samples, butthey also gave us unparalleled observational opportunities. Features normally isolated by morethan 500 meters of water and engulfed in darkness could be studied and photographed with relativeease. This technology has revealed geological features and biological communities that werepreviously unknown. In effect the work has brought to light the subaqueous portions of CraterLake National Park.
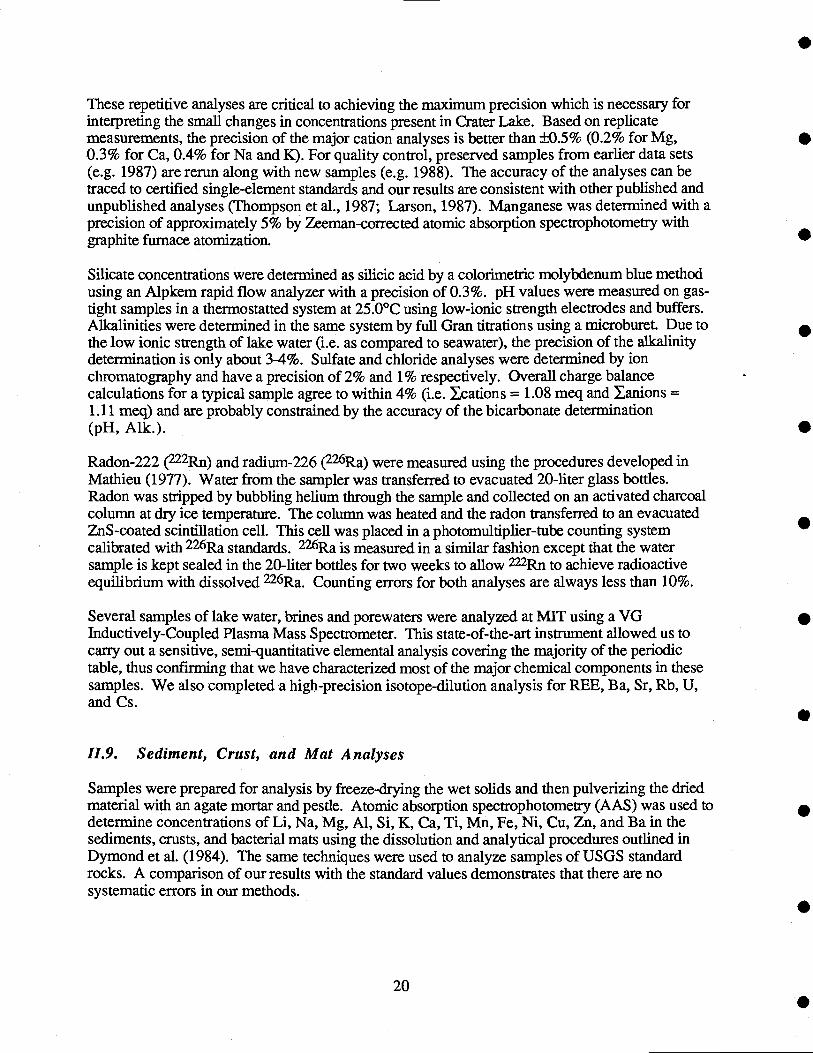
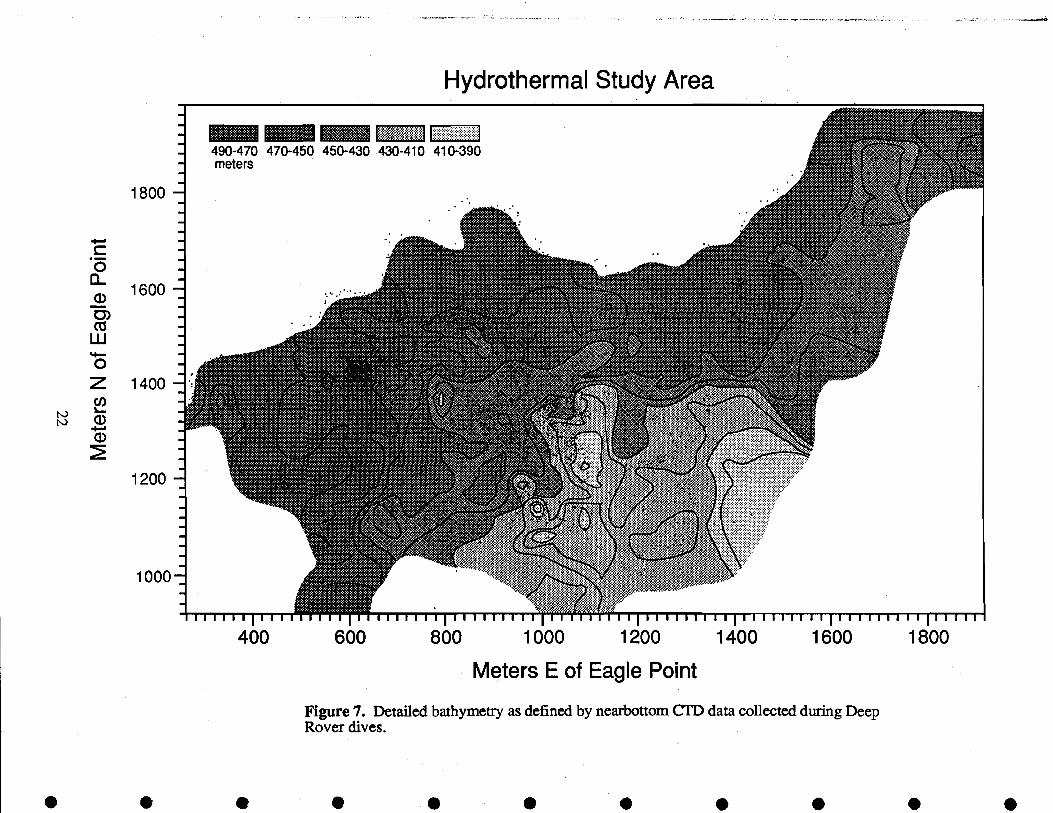
We have used pressure measurements obtained from the CTD carried by Deep Rover to develop adetailed bathymeiry for the Detailed Study Area (Figure 7). Although the spatial coverage of theDetailed Study Area is not so systematic as those provided by the echo sounding transects whichproduced Figure 2, these data provide much more detailed depth information than that of therelatively broad-beamed echo sounder. A few of the most important thermal-chemical featuresobserved within the Detailed Study Area are shown on a three dimensional perspective version ofthis bathymetric map (Figure 8).
21
1000
Hydrothermal Study Area
490-470 470-450 450-430 430-410 410-390meters
400 600 800 1000 1200 1400 1600 1800
Meters E of Eagle Point
Figure 7. Detailed bathymetry as defined by nearbottom CTD data collected during DeepRover dives.
S S S . S S S S
1800
1600
Z 1400(1)
ci)
1200
.,.' High TemperatureMat Area
pyicg:a0
F--F
AtIii:-a-NM-a-NM i1*,t4z'
W
ii .aara.
a'1674
23
*679
S1607 ¶743 ¶579 14*6 1252 1069 924 760 597 432 209
x
Figure 8. Detailed bathymetry from Figure 7 shown in a three dimensional perspective"mesh" map. Locations for "high temperature bacterial mats", "north wall bacterial mats",and the "Llaots Bath/brain mat complex" are shown. This view is looking south.
.
27Depth.437
.448 (m)
.459
.469
.490
.49
*036
1142
1561 Llao's Bath
North Wall Mats
I.
S
*247
1351
1456
Iron-Rich Crusts.
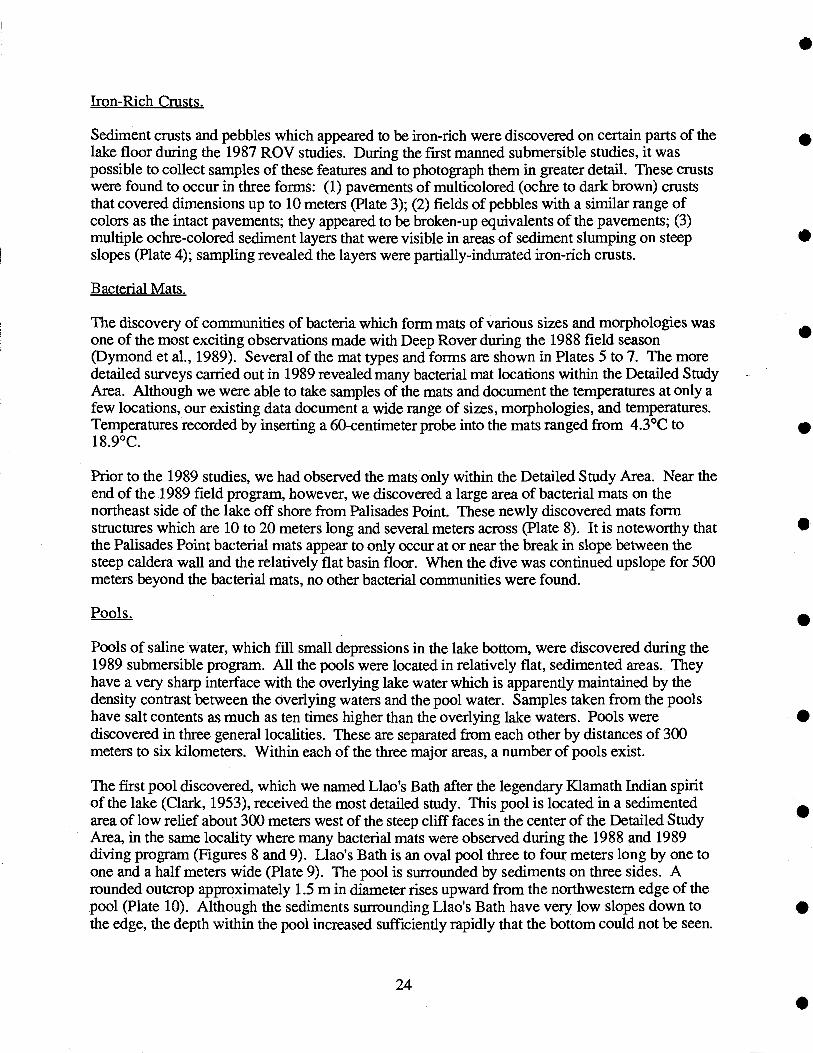
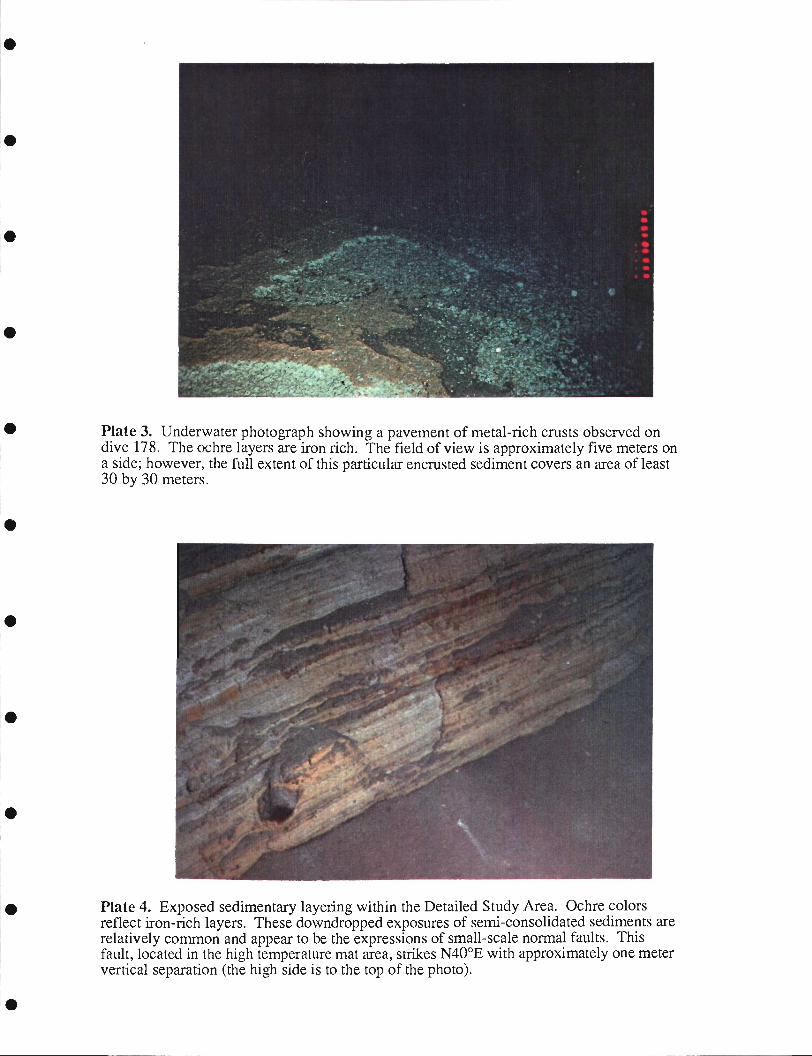
Sediment crusts and pebbles which appeared to be iron-rich were discovered on certain parts of thelake floor during the 1987 ROY studies. During the first manned submersible studies, it waspossible to collect samples of these features and to photograph them in greater detail. These crustswere found to occur in three forms: (1) pavements of multicolored (ochre to dark brown) cruststhat covered dimensions up to 10 meters (Plate 3); (2) fields of pebbles with a similar range ofcolors as the intact pavements; they appeared to be broken-up equivalents of the pavements; (3)multiple ochre-colored sediment layers that were visible in areas of sediment slumping on steepslopes (Plate 4); sampling revealed the layers were partially-indurated iron-rich crusts.
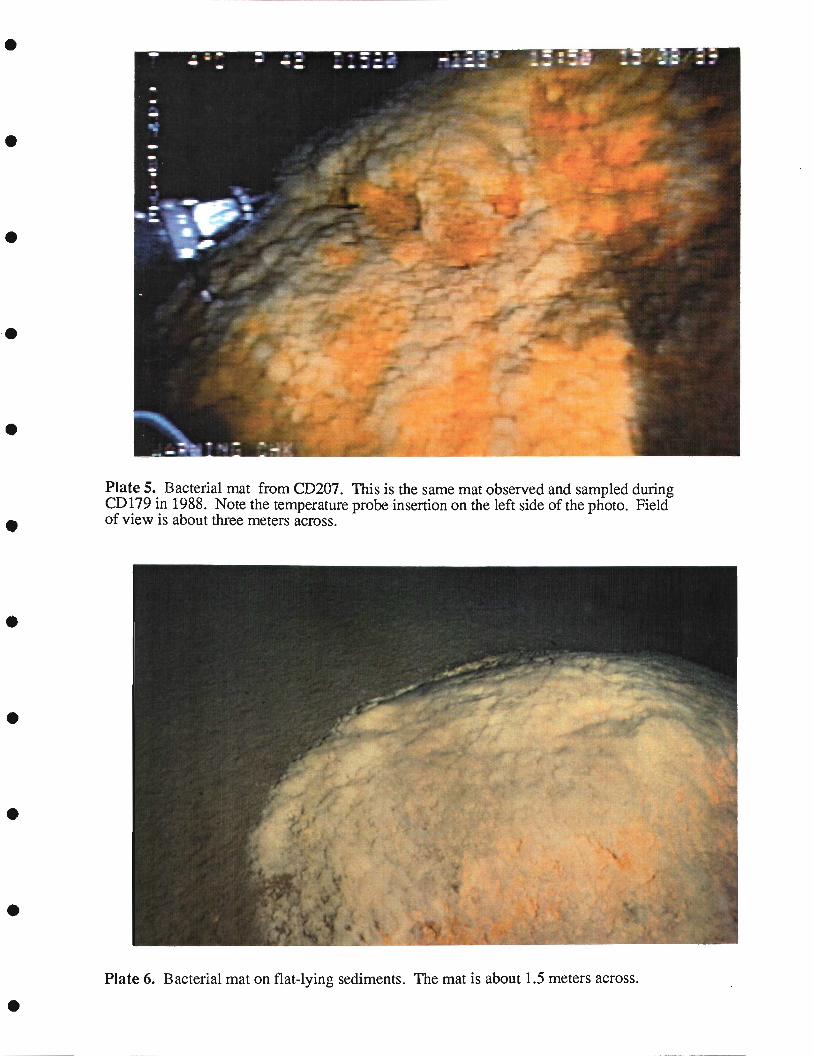
Bacterial Mats.
The discovery of communities of bacteria which form mats of various sizes and morphologies wasone of the most exciting observations made with Deep Rover during the 1988 field season(Dymond et al., 1989). Several of the mat types and forms are shown in Plates 5 to 7. The moredetailed surveys carried out in 1989 revealed many bacterial mat locations within the Detailed StudyArea. Although we were able to take samples of the mats and document the temperatures at oniy afew locations, our existing data document a wide range of sizes, morphologies, and temperatures.Temperatures recorded by inserting a 60-centimeter probe into the mats ranged from 4.3°C to18.9°C.
Prior to the 1989 studies, we had observed the mats only within the Detailed Study Area. Near theend of the 1989 field program, however, we discovered a large area of bacterial mats on thenortheast side of the lake off shore from Palisades Point. These newly discovered mats formstructures which are 10 to 20 meters long and several meters across (Plate 8). It is noteworthy thatthe Palisades Point bacterial mats appear to only occur at or near the break in slope between thesteep caldera wall and the relatively flat basin floor. When the dive was continued upslope for 500meters beyond the bacterial mats, no other bacterial communities were found.
Pools.
Pools of saline water, which fill small depressions in the lake bottom, were discovered during the1989 submersible program. All the pools were located in relatively flat, sedimented areas. Theyhave a very sharp interface with the overlying lake water which is apparently maintained by thedensity contrast between the overlying waters and the pool water. Samples taken from the poolshave salt contents as much as ten times higher than the overlying lake waters. Pools werediscovered in three general localities. These are separated from each other by distances of 300meters to six kilometers. Within each of the three major areas, a number of pools exist.
The first pool discovered, which we named Llao's Bath after the legendary Kiamath Indian spiritof the lake (Clark, 1953), received the most detailed study. This pool is located in a sedimentedarea of low relief about 300 meters west of the steep cliff faces in the center of the Detailed StudyArea, in the same locality where many bacterial mats were observed during the 1988 and 1989diving program (Figures 8 and 9). Llao's Bath is an oval pool three to four meters long by one toone and a half meters wide (Plate 9). The pool is surrounded by sediments on three sides. Arounded outcrop approximately 1.5 m in diameter rises upward from the northwestern edge of thepool (Plate 10). Although the sediments surrounding Llao's Bath have very low slopes down tothe edge, the depth within the pool increased sufficiently rapidly that the bottom could not be seen.
24
.i
.
Plate 4. Exposed sedimentary layering within the Detailed Study Area. Ochre colorsreflect iron-rich layers. These downdropped exposures of semi-consolidated sediments arerelatively conm-ion and appear to be the expressions of small-scale normal faults. Thisfault, located in the high temperature mat area, strikes N40°E with approximately one metervertical separation (the high side is to the top of the photo).
Plate 3. Underwater photograph showing a pavement of metal-rich crusts observed ondive 178. The ochre layers are iron rich. The field of view is approximately five meters ona side; however, the full extent of this particular encrusted sediment covers an area of least30 by 30 meters.
S
.
Plate 5. Bacterial mat from CD207. This is the same mat observed and sampled duringCD 179 in 1988. Note the temperature probe insertion on the left side of the photo. Fieldof view is about three meters across.
Plate 6. Bacterial mat on flat-lying sediments. The mat is about 1.5 meters across.
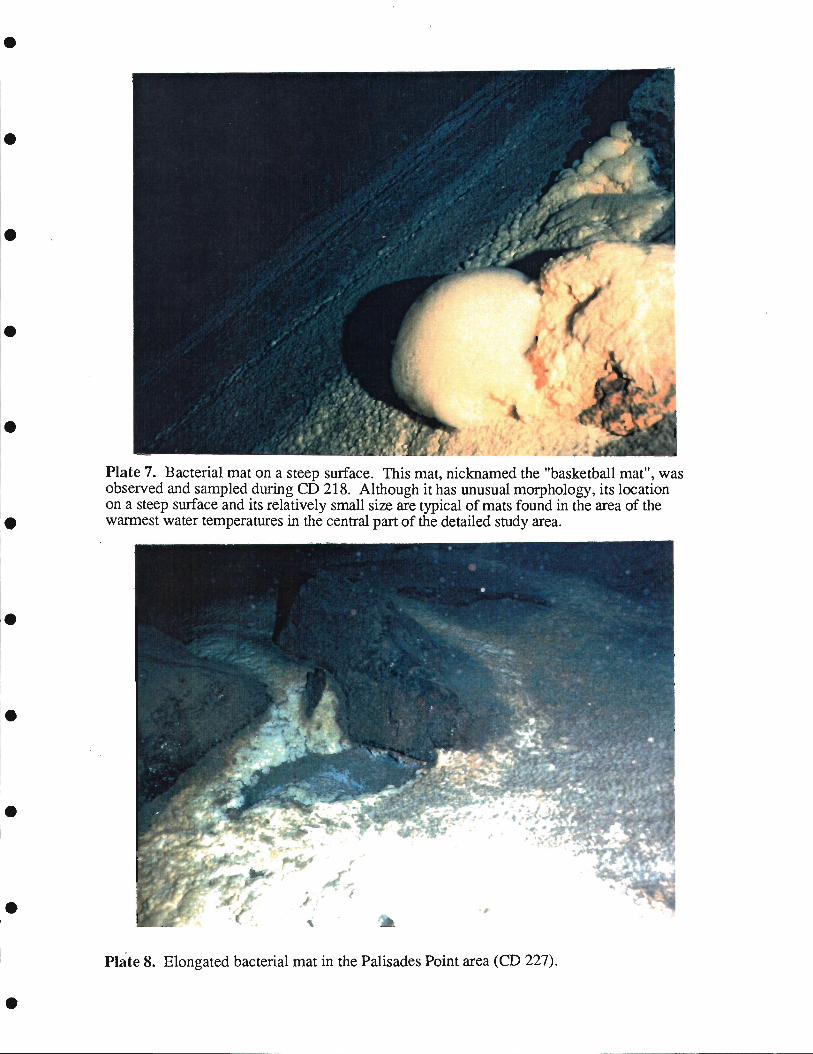
Plate 7. Bacterial mat on a steep surface. This mat, nicknamed the "basketball mat", wasobserved and sampled during CD 218. Although it has unusual morphology, its locationon a steep surface and its relatively small size are typical of mats found in the area of thewarmest water temperatures in the central part of the detailed study area.
.
.Plate 8. Elongated bacterial mat in the Palisades Point area (CD 227).
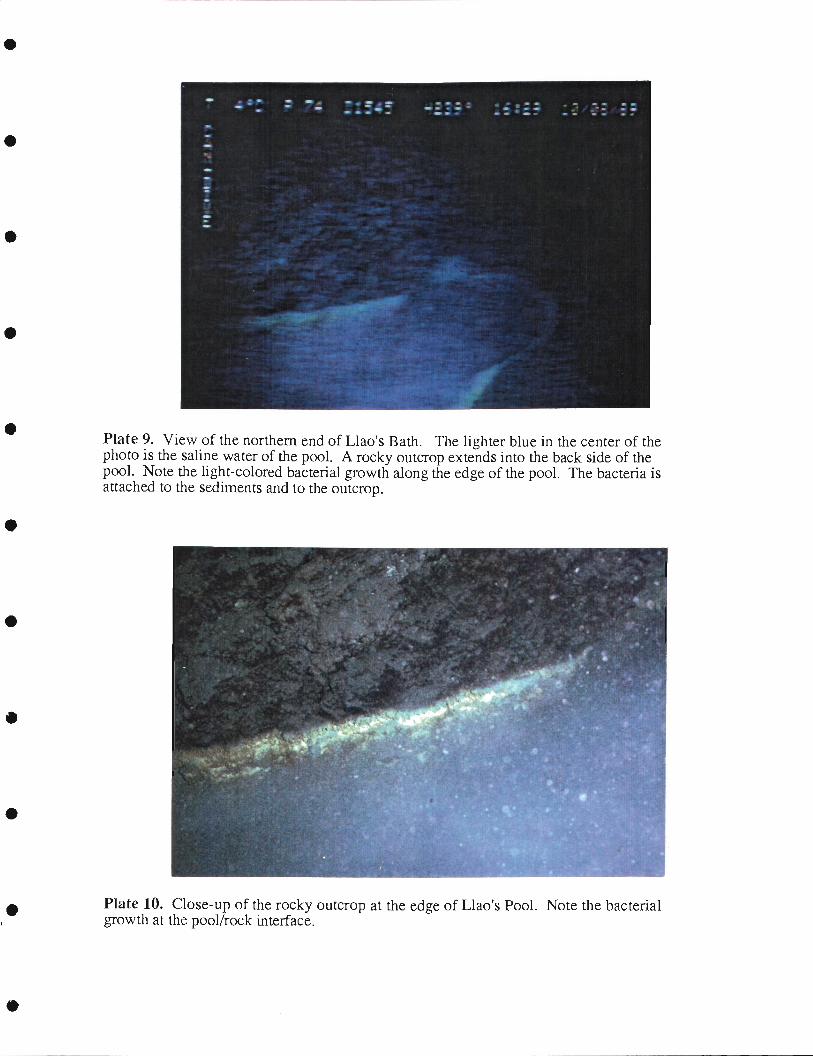
flate 9. View of the northern end of Llao's Bath. The lighter blue in the center of thephoto is the saline water of the pool. A rocky outcrop extends into the back side of thepool. Note the light-colored bacterial growth along the edge of the pool. The bacteria isattached to the sediments and to the outcrop.
Plate 10. Close-up of the rocky outcrop at the edge of Llao's Pool. Note the bacterialgrowth at the pool/rock interface.
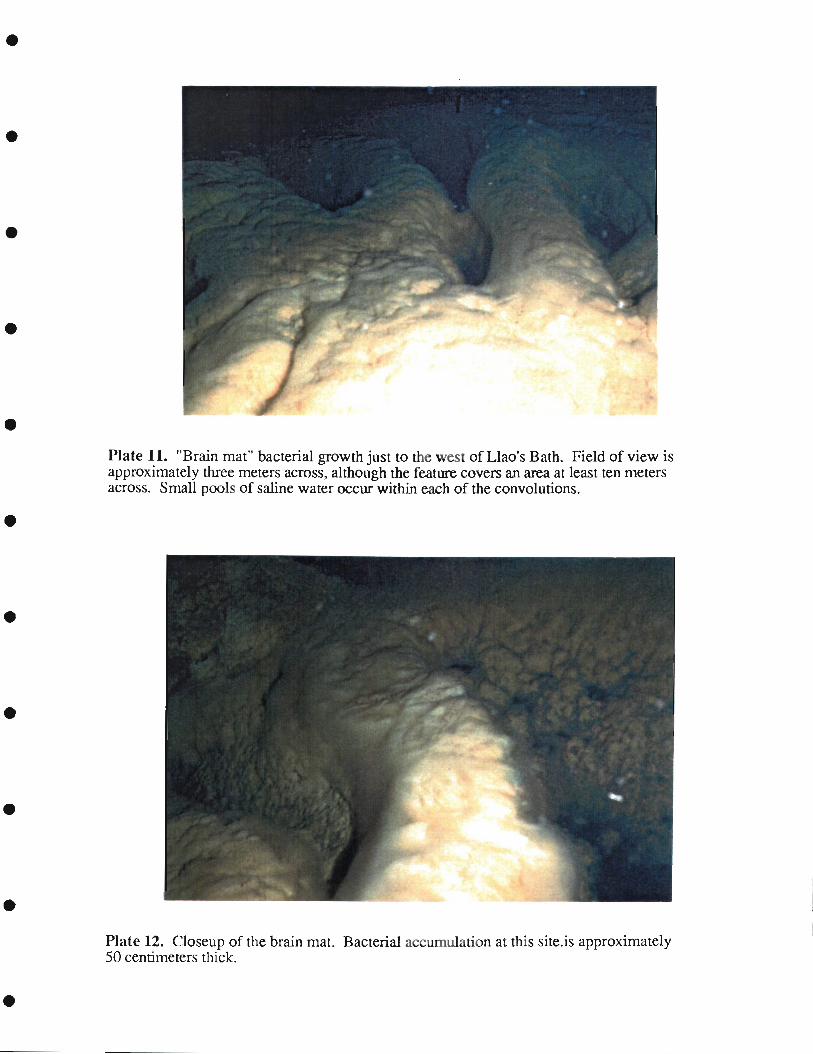
Plate 11. "Brain mat' bacterial growth just toil of Llaos Bath. Field of view isapproximately three meters across, although the teature covers an area at least ten metersacross. Small pool.. of saline water occur withm eh of the convolutions.
Plate 12. Closeup of the brain mat. Bacterial iLti )fl at thIs site.is approximately50 centimeters thick.
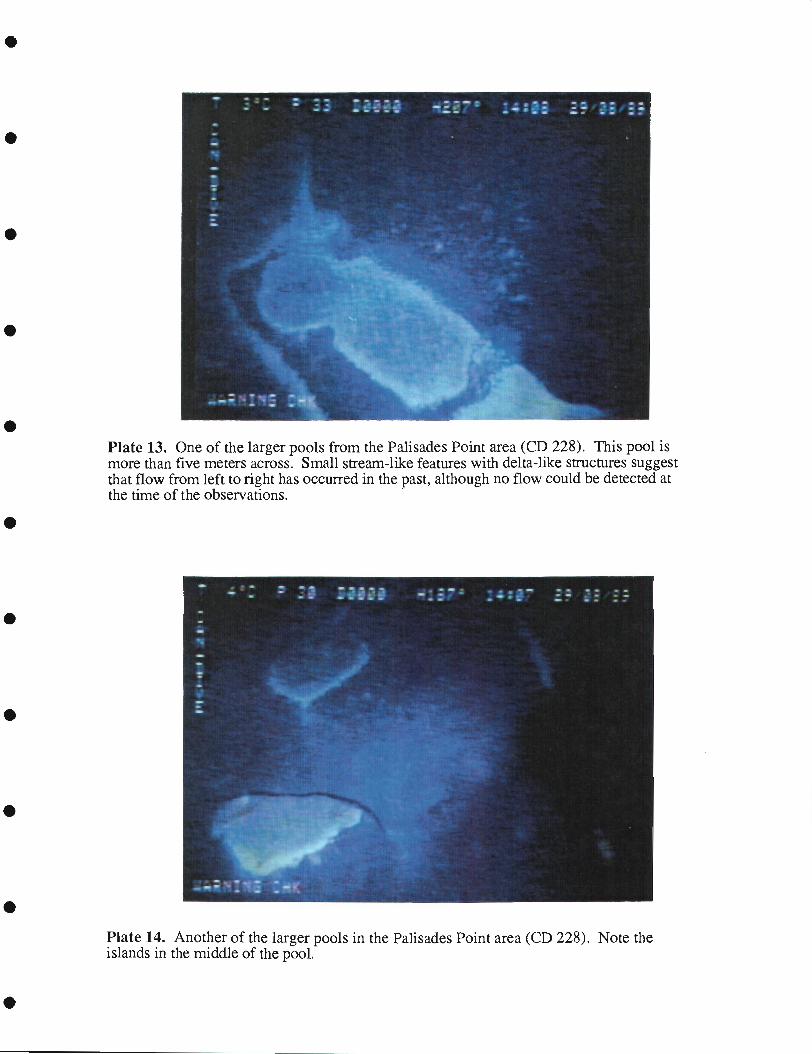
Plate 13. One of the larger pools from the Palisades Point area (CD 228). This pool ismore than five meters across. Small stream-like features with delta-like structures suggestthat flow from left to right has occurred in the past, although no flow could be detected atthe time of the observations.
Plate 14. Another of the larger pools in the Palisades Point area (CD 228). Note theislands in the middle of the pool.
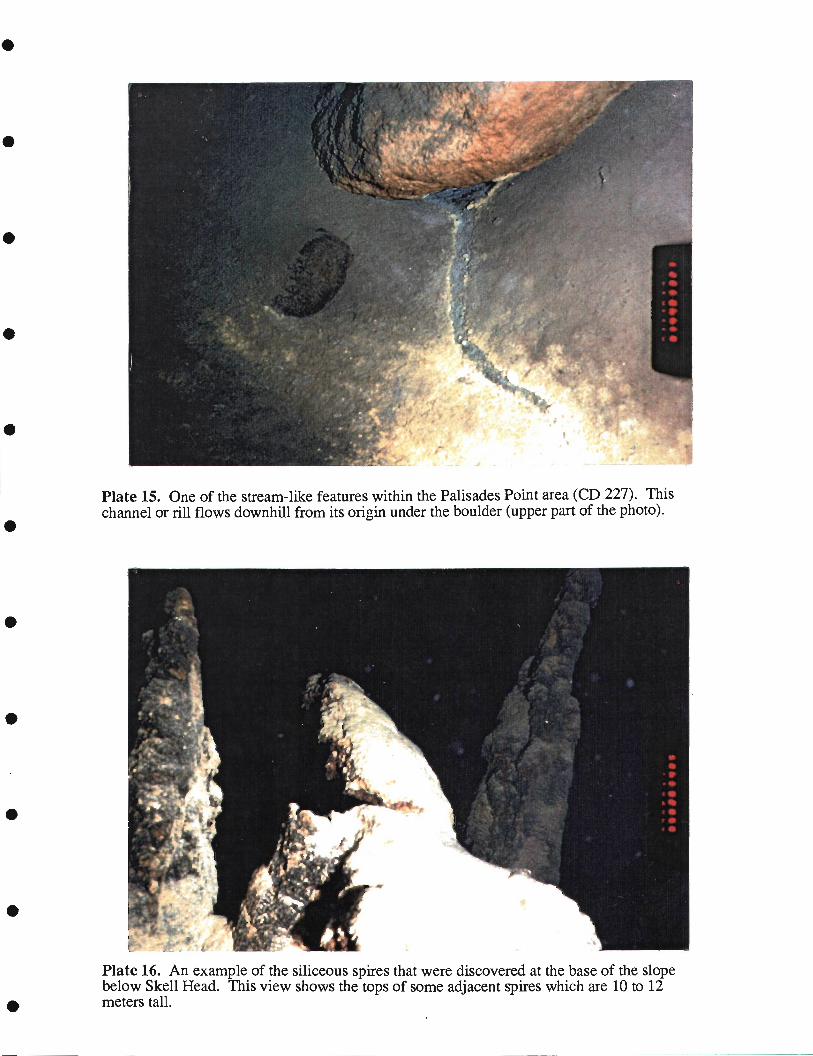
Plate 15. One of the stream-like features within the Palisades Point area (CD 227). Thischannel or nil flows downhill from its origin under the boulder (upper part of the photo).
Plate 16. An example of the siliceous spires that were discovered at the base of the slopebelow Skell Head. This view shows the tops of some adjacent spires which are 10 to 12meters tall.
.
1000
39
Hydrothermal Study Area
490-470 470-450 450-430 430-410 410-390meters
1800
-SC
1600
Z 1400(I)
ci
1200
-420- (a)
-430-
E -440- T ats
- -450-
-460- Uao!s Pool
-470-
200 4à0
Distance (m)A'
400 600 800 1000 1200 1400 1600 1800
Meters E of Eagle Point
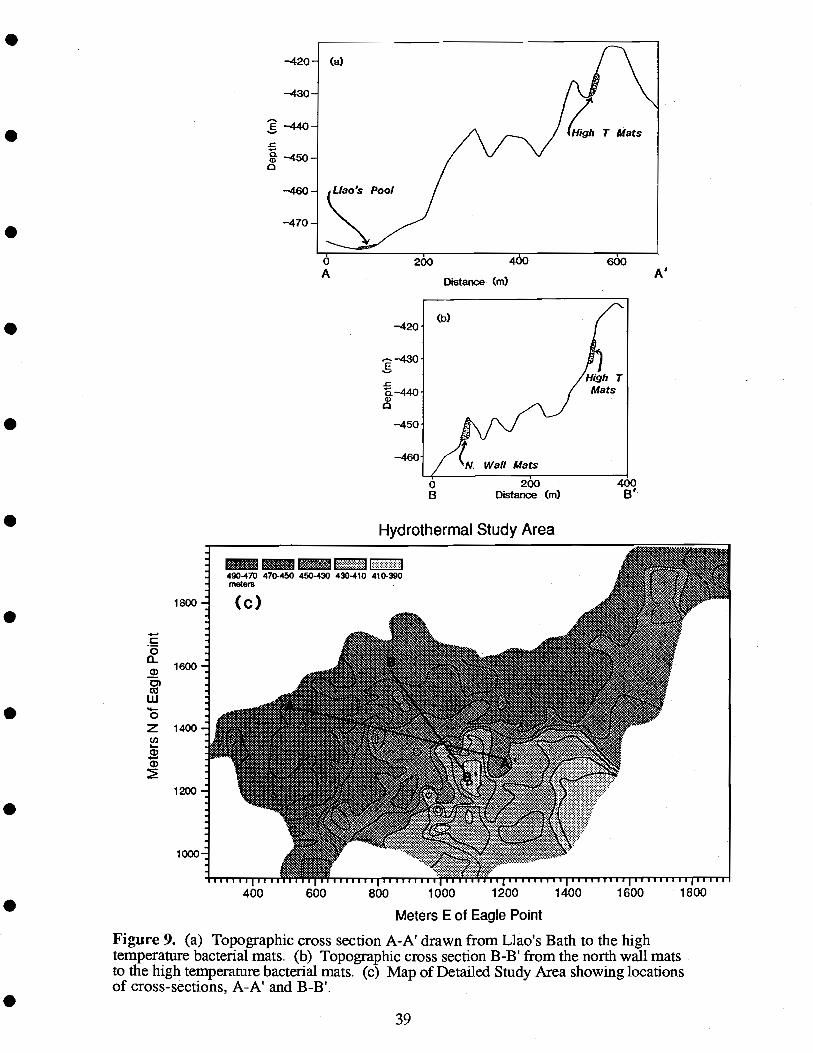
Figure 9. (a) Topographic cross section A-A' drawn from Llao's Bath to the hightemperature bacterial mats. (b) Topogiaphic cross section B-B' from the north wall matsto the high temperature bacterial mats. (c) Map of Detailed Study Area showing locationsof cross-sections, A-A' and B-B'.

A thin bacterial coating, 10-20 centimeters wide, rimmed the margin of the pool. This bacterial rimwas one to two centimeters thick. Although no distinctive inlet or outlet was apparent, thesouthern edge of the pool had a 20-40 centimeters wide and somewhat thicker bacterial covering.There were linear features in the bacterial rim which suggested that there has been overflow at thissection of the pool. A slightly elevated, sedimented area extended to the west of the pool. On thisgentle rise and within 10 meters of Llao's Bath we observed an extensive area of bacterial matswith associated saline poois. This area was termed the "brain mat" because of the convolutedmorphology of the colony (Plate 11). The convolutions were defined by small (20-100 cm)elongated pools which were surrounded by thick (>50 cm) masses of bacteria (Plate 12). Otherpools, both larger and smaller than Llao's Bath, were observed within 50 meters of the Llao'sBath/brain mat complex.
A second area of pools was discovered 300 meters southwest of Llao's Bath. It consisted ofseveral pools, only a few centimeters deep and 10 to 30 cm in diameter, which filled smalldepressions on a sedimented bottom. These small pools were not sampled.
The third pool area was discovered a few meters downslope from the bacterial mats on thenortheast side of the lake near Palisades Point. Many pools (approximately 20 individual features)were observed within an area 50 meters across by 100 meters long. The pool site is within the flat-lying sedimented area at the break in slope at the base of the caldera wall. Several of these pools,which we will refer to as the Palisades Point pools, were larger than any of those found within theDetailed Study Area. The largest Palisades Point pools had maximum dimensions ofapproximately 15 meters across. Islands, embayments, and delta-like features were observedwithin these pools (Plates 13 and 14). A striking aspect of these pools was that stream-likefeatures or rills entered from their up slope side. The rills had a dendritic pattern which indicateddownslope flow. Many of the dendritic features appeared to originate beneath an outcrop on theslopes (Plate 15). These channels were two to five centimeters across and one to two centimetersdeep. Although no fluid flow was observed, erosional features clearly indicated flow had occurredat an earlier time. Bacterial colonies were observed along the sides of the pools and along the rills.
Temperature measurements from both Llao's Bath and the Palisades Point pools were 4.5°C to5.5°C, respectively. These temperatures are significantly lower than those measured in many ofthe bacterial mats and in certain sedimented areas.
The geographic relationship between the pools and the bacterial mats in the Detailed Study Area isshown in Figure 9 (a,b, and c), which shows transects from the high temperature bacterial mats tothe north wall mats and Llao's Bath.
Spires.
Precipitate spires over 10 meters high were discovered at the eastern margin of the lake below SkellHead (Plate 16). These structures have a morphology and chemistry which is of subaqueousprecipitation from hydrothermal solutions. The spires have a composition similar to manysiliceous sinter deposits which form around continental hot springs. Silica and iron dominate thecomposition, but there are also strong enrichments of arsenic, phosphorus, and antimony.However, the deposits are morphologically unlike the broad mounds that characterize mostsubaerial siliceous deposits; the narrow, elevated forms indicate subaqueous formation. Thesedeposits were located at the base of the slope between the steep caldera wall and the relatively flat
40
sedimented basin. Although these tall structures were only observed in one location, smallerchimney-like features were observed in two other locations in the Detailed Study Area.
111.2. Distribution of Temperature, Salt, and Physical Properties.
General.
The vertical distribution of temperature in the lake was discussed by Neal et al. (1972), whopresented the first detailed high-precision measurements of the complete water column. Thegeneral features they described were the strong seasonal thermodine in the upper 100 meters, adecrease in temperature to a minimum value of 3.53°C at mid-depth (295 meters), and an increasein temperature below this point to values as high as 3.69°C. The average temperature of thesediments below these profiles was 3.80°C. Neal et al. (1972) postulated that the stability of thishyperadiabatic deep water column was maintained by an increase in dissolved ions or suspendedsediments with depth. Their field methods, however, did not include any way of directly testingthis hypothesis. The history of temperature measurements in the lake was reviewed by Williamsand Von Herzen (1983) in a paper presenting detailed water column temperatures and sedimentheatfiow analyses. Their research mapped several areas of the lake bottom with very high heatfiowand provided a detailed documentation of deep lake warming. They hypothesized that the verticalstructure and horizontal heterogeneity of several deep profiles could be directly attributed toconvection from active thermal springs. According to Williams and Von Herzen (1983) thesesprings appear to provide a warm "dense" water layer that is "ponding" in the South Basin.
Temperature and Density Structure.
Details of data collected in 1987 and 1988 have been discussed in Collier and Dymond (1988a and1989, respectively) and in Collier et al. (1990), but we review that data here. The high-precisionCTD data collected in 1987, 1988, and 1989 allow us to refine the general descriptions of Neal etal. (1972) and Williams and Von Herzen (1983). Furthermore, we have made the first detailedmeasurements of in situ conductivity, which enabled us to calculate salinities and densities atdifferent lake depths. The data set focuses on the magnitude and areal extent of the thermalanomalies in the deep lake and provides the first significant evidence of high dissolved salt contentassociated with the increases in temperature. Figure 10 shows the full water column distribution oftemperature and density at the east end of the South Basin. These data are based on directmeasurements from the CTD package as well as on calculated quantities derived from the equationof state applicable to this lake water (Chen and Millero, 1986).
The data collected late in the summer of 1987 documents the fully developed seasonal thermocinein the upper 100 meters (Figure lOa) and the associated decrease in density within this stable warmsurface water layer (Figure lOb). Below 100 meters depth, the density of the water is very nearlyhomogeneous with a total change of less than 4 ppm (Figure lOb, lOc). When the seasonalthermocline erodes and is cooled during the winter, storms drive significant mixing from above.As first noted by Williams and Von Herzen (1983), any significant heating from below byconductive and/or convective inputs may drive convection and mixing of these deep waters withshallower waters. Rapid mixing is indeed suggested by the vertically-homogeneous tritium data ofSimpson (1970b), and by dissolved oxygen concentrations which are near-saturation throughoutthe water column. Additional data on the rate of vertical exchange are presented in Appendix A andG. Data from the two thermistor chain moorings deployed in the South Basin of Crater Lake also
41

100
200
300
400
500
Temperature (°C)
_& - - -Cl1 00 b . Cl1
li ii Ii till*_'
Temperature ofmax. density
(a)
It 1111111 I 11111111 1111111
Figure 10. CTh data from. a water column profile in the east end of the south basin (Collier and Dymond, 1988a and 1989).All calculated physical properties are based on the equation of state for limnologic waters developed by Chen and Millero (1986).
Vertical distribution of temperature (°C) as a function of depth. The solid line indicates the temperature of maximum densityfor Crater Lake water at the in situ pressure.
Potential density vs. depth. The potential density is the density of a water parcel moved adiabatically to a common referencepressure - in this case to the lake surface. This parameter is critical in considering the stability of the water column and the rate ofturbulent mixing. It can be seen that the water column below 100 meters has a nearly uniform density.
Sigma (8) vs. depth. This parameter, derived from b, is defined as Sigma (8) = (potential density - 1) x 1000.
Potential density (glee)Cl ClICIC 'CIC IC
00
Sigma (theta)
Cl ClCl Cl
Cl Cl
0 0l
(b)
document both surface and deep lake processes. The data set from these chains are presented anddescribed in Appendix A. In these appendices we establish constraints on the overall mixing rates.A well-constrained estimate of mixing rate is critical for estimating the overall rates of input forheat, hydrothermal chemicals, and other materials to the deep lake. For the purposes of the heatand material balance models discussed in this report, we will use a vertical exchange (or deep-water "renewal") rate of two years.
Deep Lake Distributions.
Figure 11 shows expanded plots of the CTD record for the lower 100 meters of the water columnat the east end of the South Basin. The scales for temperature (a), salinity (b), and potentialdensity (c) have been significantly expanded over those in Figure 10. The major feature apparentin Figure 1 Ia is the increase in temperature with depth. The slow increase, which begins below300 meters depth, is seen throughout the lake and appears to reflect the net effect of conductive andconvective heat inputs. For example, the light dotted line shown in Figure 11 illustrates thetemperature structure in the North Basin.
The adiabatic increase in temperature with depth can be calculated from the equation of state (Chenand Millero, 1986); the resulting average is 3.2 x 10⁻⁶ °C/meter. This is an insignificant portion ofthe observed temperature increase (Figure 11 a). The general warming observed throughout thelake below 350 meters (e.g: the North Basin profile shown in Figure 1 la) has a gradient of 3.3 xiO C°/meter which is 100 times larger than the adiabatic gradient, thus the use of the termhyperadiabatic to describe the temperature distribution in the water column. The gradient seen nearthe bottom of the South Basin study area is approximately 1 x 10² C°/meter, 3400 times largerthan the adiabatic gradient. These "sharp" gradients in temperature, such as that seen at 430 metersin Figure 1 la, are horizontally heterogeneous and are sometimes followed by a complete reversalin the temperature, suggesting a locally unstable system. Consistent with the interpretations ofWilliams and Von Herzen (1983) and Collier and Dymond (1988a and 1989), we attribute thesefeatures to the active input of thermally and chemically enriched water.
Figure 12a shows a vertical integration of the "excess heat" contained within a portion of theDetailed Study Area. The "excess heat" is defined as the heat content of water with temperaturesgreater than water at the equivalent depths in the North Basin. That is, the values for each givendepth in the North Basin profile, shown as the dotted line in Figure 1 la, are subtracted from thevalues at the equivalent depth in the South Basin. A graph of "excess heat", using data from the1987 field season, was originally presented in Collier and Dymond (1988a). Figure 12a is a newplot which also incorporates the data collected during our 1988 and 1989 field program
From the same CTD data, we have also generated a plot of "excess salt" in the South Basin profilefrom the Detailed Study Area (Figure 12b). The calculation is the same as for "excess heat" Thatis, the North Basin salinity profile has been subtracted from the South Basin salinity profiles).
The local maxima in integrated heat and salt which occur in the center of the eastern-most portionof Figure 12 are immediately downslope from the highest temperature bacterial mats discoveredduring the program. The high values on the west end of the plot are primarily a function of theaccumulation of warm salty waters in the deeper portions of the South Basin (to the west). Notethat this calculation method focuses only on the localized anomalies seen in the South Basin whichare above and beyond the general heating effect observed throughout the rest of the deep lake.
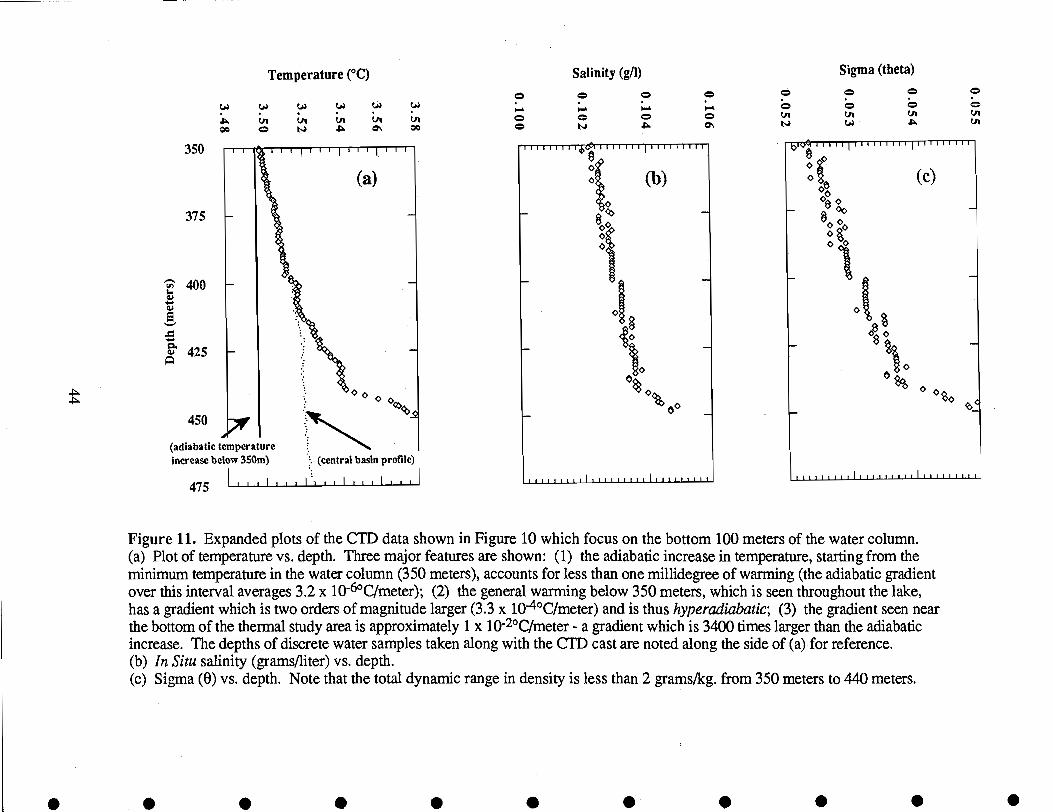
350
375
1400
425
450
(adJabatic temperatureincrease below 350m)
475 1111111
Temperature (°C)
A Ui00 A 00
(central basin profile)
I i I t I i i
Salinity (gil)
A
I I I I I I t1øi I I I I I
I
I I I I I I I
0.ci
(b)
0
0
11111 111111 liii till ii 11111
Sigma (theta)
II I I I I I I I
I
I I I I I I I I
-(c)
0 ...0
- V
ci
00
000
111111111111111111111 I lilt Ill
Figure 11. Expanded plots of the CTh data shown in Figure 10 which focus on the bottom 100 meters of the water column.Plot of temperature vs. depth. Three major features are shown: (1) the adiabatic increase in temperature, starting from the
minimum temperature in the water column (350 meters), accounts for less than one millidegree of warming (the adiabatic gradientover this interval averages 3.2 x 10⁶°Clmeter); (2) the general warming below 350 meters, which is seen throughout the lake,has a gradient which is two orders of magnitude larger (3.3 x 10°C/meter) and is thus hyperadiabatic; (3) the gradient seen nearthe bottom of the thermal study area is approximately 1 x 10²°C/meter - a gradient which is 3400 times larger than the adiabaticincrease. The depths of discrete water samples taken along with the CTD cast are noted along the side of (a) for reference.
In Situ salinity (grams/liter) vs. depth.Sigma (0) vs. depth. Note that the total dynamic range in density is less than 2 grams/kg. from 350 meters to 440 meters.
S S S S S S S
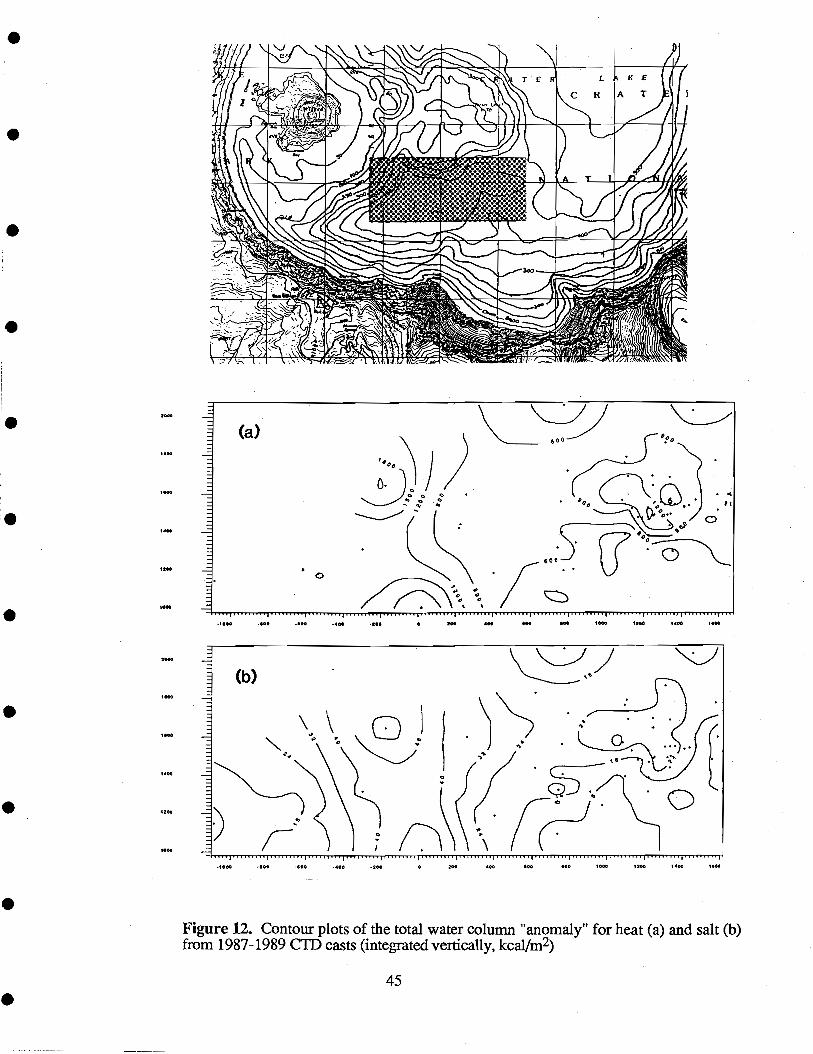
45
Figure 12. Contour plots of the total water column "anomaly" for heat (a) and salt (b)from 1987-1989 CTD casts (integrated vertically, kcal/m2)
4
wwrd)
4'I '."-"- -.-
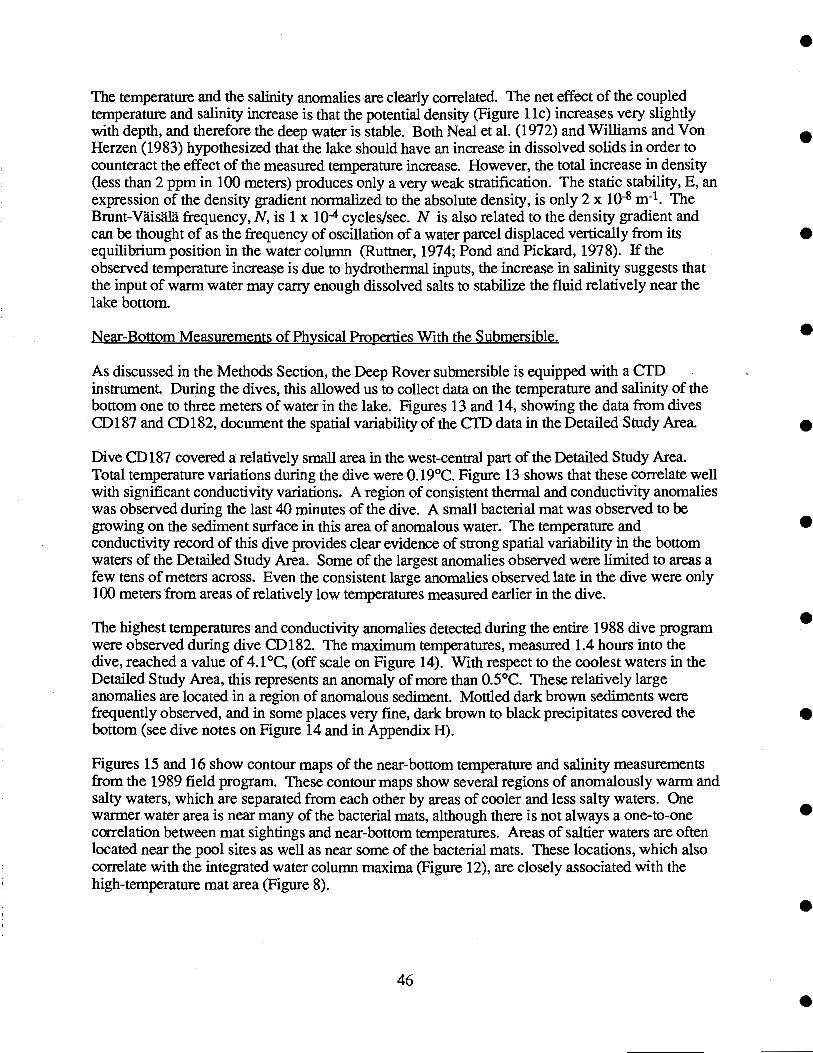
The temperature and the salinity anomalies are clearly correlated. The net effect of the coupledtemperature and salinity increase is that the potential density (Figure 1 ic) increases very slightlywith depth, and therefore the deep water is stable. Both Neal et al. (1972) and Williams and VonHerzen (1983) hypothesized that the lake should have an increase in dissolved solids in order tocounteract the effect of the measured temperature increase. However, the total increase in density(less than 2 ppm in 100 meters) produces only a very weak stratification. The static stability, E, anexpression of the density gradient normalized to the absolute density, is only 2 x 10⁻⁸ rn-1. TheBrunt-Vaisälä frequency, N, is 1 x io- cycles/sec. N is also related to the density gradient andcan be thought of as the frequency of oscillation of a water parcel displaced vertically from itsequilibrium position in the water column (Ruttner, 1974; Pond and Pickard, 1978). If theobserved temperature increase is due to hydrothermal inputs, the increase in salinity suggests thatthe input of warm water may carry enough dissolved salts to stabilize the fluid relatively near thelake bottom.
Near-Bottom Measurements of Physical Properties With the Submersible.
As discussed in the Methods Section, the Deep Rover submersible is equipped with a CTDinstrument. During the dives, this allowed us to collect data on the temperature and salinity of thebottom one to three meters of water in the lake. Figures 13 and 14, showing the data from divesCD 187 and CD182, document the spatial variability of the CTD data in the Detailed Study Area.
Dive CD 187 covered a relatively small area in the west-central part of the Detailed Study Area.Total temperature variations during the dive were 0.19°C. Figure 13 shows that these correlate wellwith significant conductivity variations. A region of consistent thermal and conductivity anomalieswas observed during the last 40 minutes of the dive. A small bacterial mat was observed to begrowing on the sediment surface in this area of anomalous water. The temperature andconductivity record of this dive provides clear evidence of strong spatial variability in the bottomwaters of the Detailed Study Area. Some of the largest anomalies observed were limited to areas afew tens of meters across. Even the consistent large anomalies observed late in the dive were only100 meters from areas of relatively low temperatures measured earlier in the dive.
The highest temperatures and conductivity anomalies detected during the entire 1988 dive programwere observed during dive CD 182. The maximum temperatures, measured 1.4 hours into thedive, reached a value of 4.1°C, (off scale on Figure 14). With respect to the coolest waters in theDetailed Study Area, this represents an anomaly of more than 0.5°C. These relatively largeanomalies are located in a region of anomalous sediment. Mottled dark brown sediments werefrequently observed, and in some places very fine, dark brown to black precipitates covered thebottom (see dive notes on Figure 14 and in Appendix H).
Figures 15 and 16 show contour maps of the near-bottom temperature and salinity measurementsfrom the 1989 field program. These contour maps show several regions of anomalously warm andsalty waters, which are separated from each other by areas of cooler and less salty waters. Onewarmer water area is near many of the bacterial mats, although there is not always a one-to-onecorrelation between mat sightings and near-bottom temperatures. Areas of saltier waters are oftenlocated near the pool sites as well as near some of the bacterial mats. These locations, which alsocorrelate with the integrated water column maxima (Figure 12), are closely associated with thehigh-temperature mat area (Figure 8).
46

crE C
D
CD
a_ ,-_
- .
CD
ocr
q
CD ,t
CD
'1 r
#<C
DC
D
CD
0
C) ri C
D
CD
CD
- on
bot
tom
- - -
follo
win
g co
ntou
r
- fa
cing
slo
pes
@ 9
00-
c/c
to 2
70°
goin
g up
slop
e, la
rge
boul
ders
- D
eep
Rov
er T
rack
; goi
ng u
p ri
se
mot
tled
sedi
men
t; m
ovin
g up
slop
e
- - pa
ralle
ling
slop
e; s
piky
tem
pera
ture
s-.
- go
ing
upsi
ope
at M
arke
r #2
-lea
ving
Mar
ker
#2
0-c
limbi
ng u
pslo
pe-s
outc
rop
10; c
emen
ted
rock
s'.3
--s
edim
ente
d ou
tcro
ps
-sta
rtin
g do
wnh
ill f
rom
top
-coa
rser
sed
imen
t
Tem
pera
ture
(°
-gra
pefr
uit v
ent
- -s
topp
ed to
take
tem
pera
ture
pro
bem
easu
rem
ent
-goi
ng u
pslo
pe-1
0cm
siz
e ro
cks
cem
ente
d by
hyd
roth
eapr
ecip
itate
s "l
ooks
like
an
old
vent
"
-3-1
Ct-
J
Con
duct
ivity
(Si
emem
s/m
eter
x 1
03)
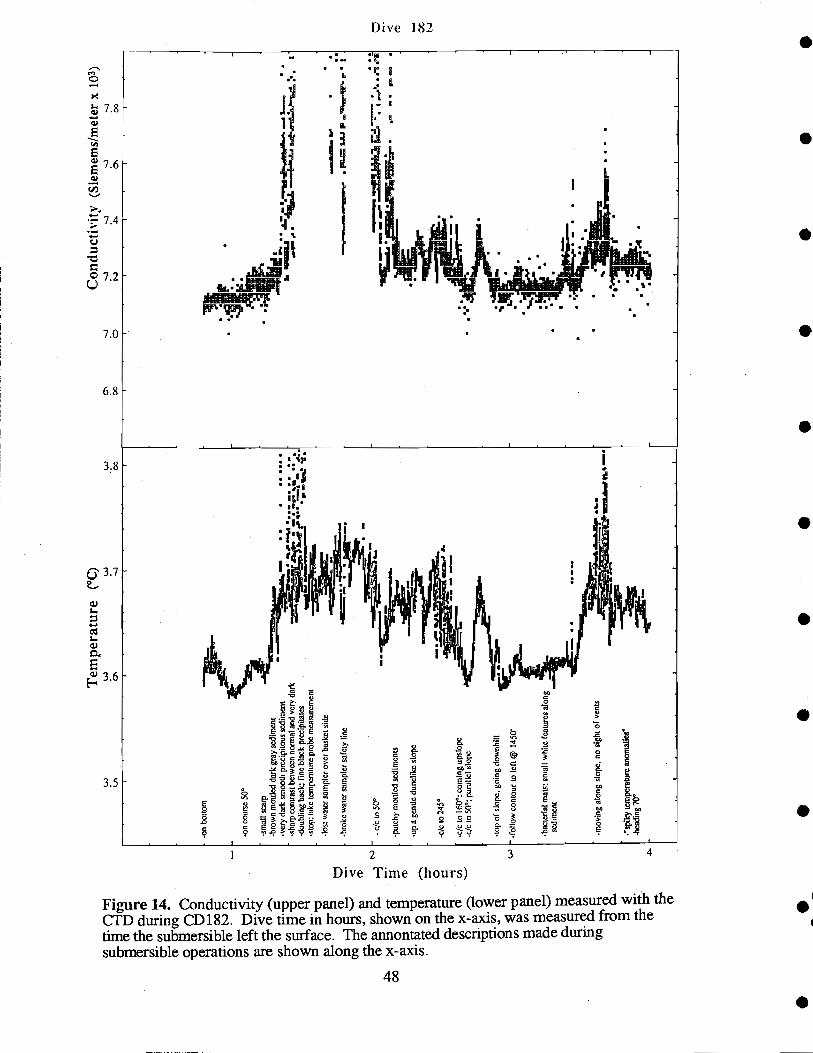
-on
botto
m
-on
cour
se 5
0°
-bro
ke w
ater
sam
pler
saf
ety
line
-c/c
to50
°
-pat
chy
mot
tled
sedi
men
ts
-up
a ge
ntle
dun
e! ik
e sl
ope
-c/c
to 2
45°
-I CM
-c/c
to 1
600;
com
ing
upsl
ope
'-'-c
/c to
500
; par
alle
l slo
pe
-sm
all s
etup
-bro
wn
mot
tled
dark
gra
y se
dim
ent
-vet
' dar
k sm
ooth
pre
cipi
tous
sed
imen
t-s
harp
con
tras
t bet
wee
n no
rms!
and
ver
y da
rk-d
oubl
ing
back
; fin
e bl
ack
prec
ipita
tes
-sto
p; ta
ke te
mpe
ratu
re p
robe
mea
sure
men
t
-lou
t wat
er s
ampl
er o
ver
bask
et s
ide
-top
of
slop
e, g
oing
dow
nhill
-fol
low
con
tour
to le
ft @
145
0
-bac
teri
al m
ats;
sis
tall
whi
le f
eatu
res
alon
gse
dim
ent
.mov
ing
alon
g sl
ope,
no
sigh
t of
vent
s
-"sp
iky
tem
pera
ture
ano
mal
ies"
-hea
ding
70°
Tem
pera
ture
(°C
)
___.
_ a
.....
-S
U S
--4.
.
Con
duct
ivity
(Si
emem
s/m
eter
x 1
O)
-a-
-4-.
4 be
'_I.
.-a
-. _
-
- I.
-rW
.J*.
.Sl..
.. _.
l__
"...
4.J.
:
I..
-
S
S
S
1000
M8
8
$
N
0
E
a
9
8
P0
0
Hydrothermal Study AreaTenperature Contour
490-470 470-450 450-430 430-410 410-390meters
Figure 15. Contour map of near-bottom temperatures (Top) as recorded by the CTD onDeep Rover for dives CD207-CD222. Detailed Study Area bathymetry is included forreference (Bottom).
49
1800
S1600
5 1400
1200S
600 800 1000 1200 1400
Meters E of Eagle Point
400 600 800 1000 1200 1400 1600
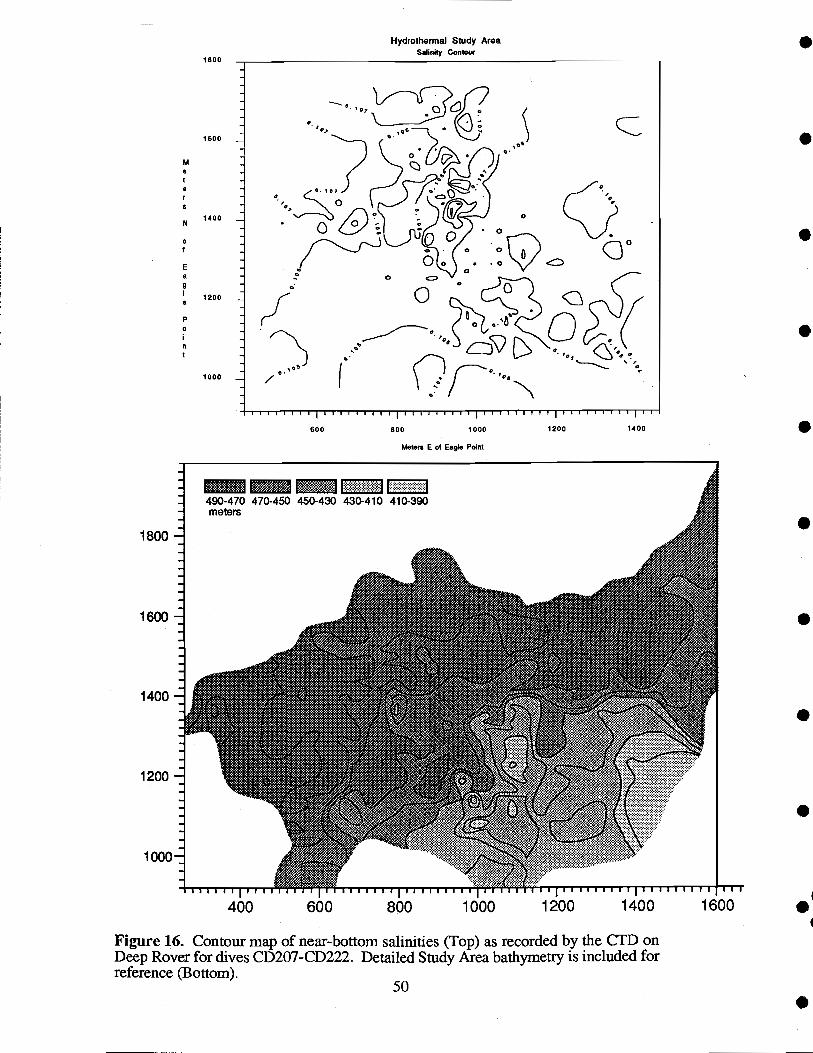
1800
1600
1400
1200
1000
Ma
0
N
0
E
a
9
a
P0
n
1800
1400
1200
1000
liii 111111 I IE III IIIII I
600 800 1000 1200 1400
490-470 470-450 450-430 430-410 410-390meters
Hydrothermal Study AreaSalinity Contour
Motors E of Eagle Point
Figure 16. Contour map of near-bottom salinities (Top) as recorded by the CTD onDeep Rover for dives CD207-CD222. Detailed Study Area bathymetiy is included forreference (Bottom).
50
I''400 600 800 1000 1200 1400 1600
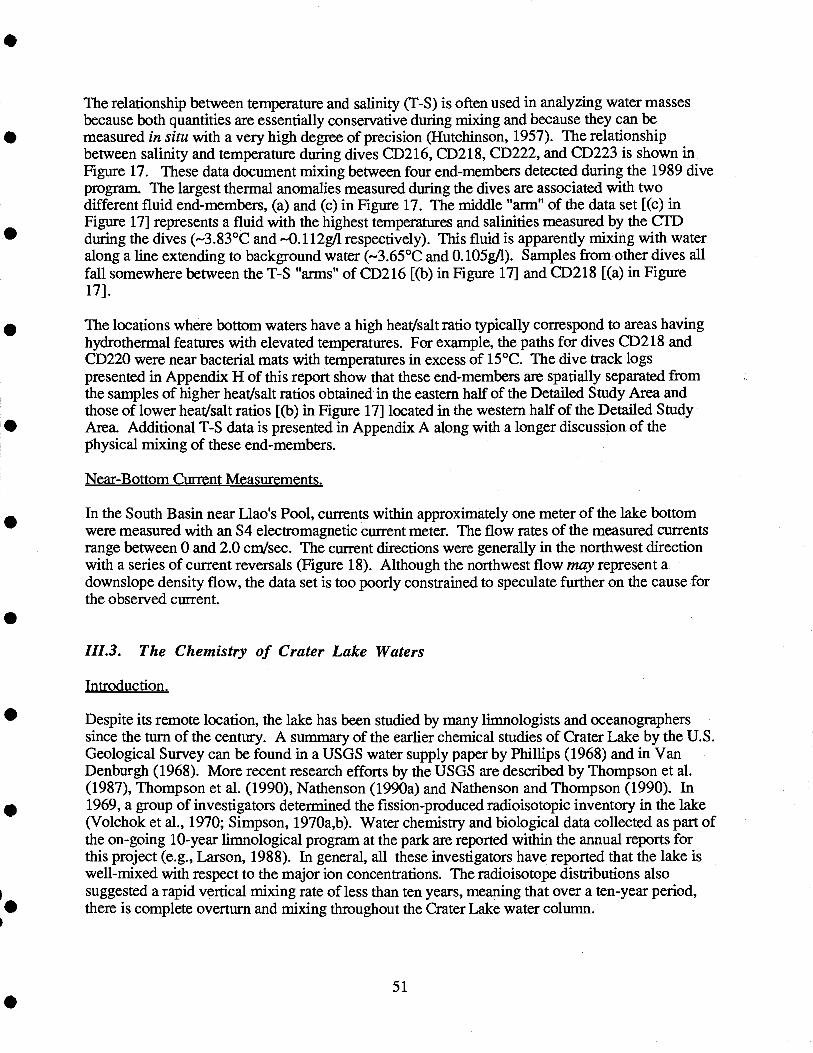
The relationship between temperature and salinity (T-S) is often used in analyzing water massesbecause both quantities are essentially conservative during mixing and because they can bemeasured in situ with a very high degree of precision (Hutchinson, 1957). The relationshipbetween salinity and temperature during dives CD216, CD218, CD222, and CD223 is shown inFigure 17. These data document mixing between four end-members detected during the 1989 diveprogram. The largest thermal anomalies measured during the dives are associated with twodifferent fluid end-members, (a) and (c) in Figure 17. The middle "am" of the data set [(c) inFigure 17] represents a fluid with the highest temperatures and salinities measured by the (JfL)during the dives (-3.83°C and 0.1 12g11 respectively). This fluid is apparently mixing with wateralong a line extending to background water (-3.65°C and 0. 105g11). Samples from other dives allfall somewhere between the T-S "arms" of CD216 [(b) in Figure 17] and CD218 [(a) in Figure17].
The locations where bottom waters have a high heat/salt ratio typically correspond to areas havinghydrothermal features with elevated temperatures. For example, the paths for dives CD218 andCD220 were near bacterial mats with temperatures in excess of 15°C. The dive track logspresented in Appendix H of this report show that these end-members are spatially separated fromthe samples of higher heat/salt ratios obtained in the eastern half of the Detailed Study Area andthose of lower heat/salt ratios [(b) in Figure 17] located in the western half of the Detailed StudyArea. Additional T-S data is presented in Appendix A along with a longer discussion of thephysical mixing of these end-members.
Near-Bottom Current Measurements.
In the South Basin near Llao's Pool, currents within approximately one meter of the lake bottomwere measured with an S4 electromagnetic current meter. The flow rates of the measured currentsrange between 0 and 2.0 cm/sec. The current directions were generally in the northwest directionwith a series of current reversals (Figure 18). Although the northwest flow may represent adownslope density flow, the data set is too poorly constrained to speculate further on the cause forthe observed current.
111.3. The Chemistry of Crater Lake Waters
Introduction.
Despite its remote location, the lake has been studied by many limnologists and oceanographerssince the turn of the century. A summary of the earlier chemical studies of Crater Lake by the U.S.Geological Survey can be found in a USGS water supply paper by Phillips (1968) and in VanDenburgh (1968). More recent research efforts by the USGS are described by Thompson et al.(1987), Thompson et al. (1990), Nathenson (1990a) and Nathenson and Thompson (1990). In1969, a group of investigators determined the fission-produced radioisotopic inventory in the lake(Voichok et al., 1970; Simpson, 1970a,b). Water chemistry and biological data collected as part ofthe on-going 10-year limnological program at the park are reported within the annual reports forthis project (e.g., Larson, 1988). In general, all these investigators have reported that the lake iswell-mixed with respect to the major ion concentrations. The radioisotope distributions alsosuggested a rapid vertical mixing rate of less than ten years, meaning that over a ten-year period,there is complete overturn and mixing throughout the Crater Lake water column.
51

3.85
3.80
3.70
E3.65
3.60
3.55
CD216, 218, 220, and 222
52
00 CC C CC C C C
Salinity (gil)
Figure 17. The relationship between temperature and salinity (T-S) for dives CD216,CD218, CD220, and CD222. This type of plot can be used to evaluate the T-Srelationships between end members detected during the dive(s). The samples from all thedives lie between the (a) "arm" of T-S points and the (b) "arm" of T-S points. The upperarm (a) represents a fluid of high heat to salt ratio, and the lower arm represents a fluid oflow heat to salt ratio. The curves represent isopycnals (lines of constant density calculatedat a constant pressure) for pressure of 435 db.
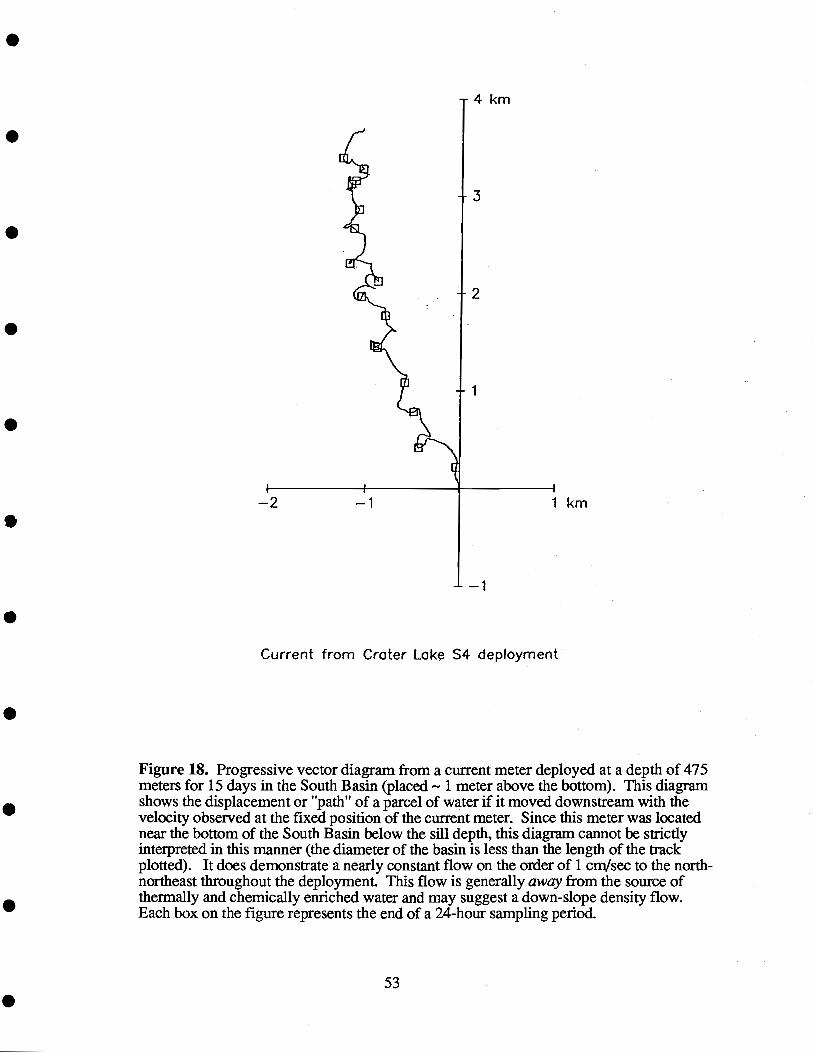
Current from Crater Lake S4 depJoyment
Figure 18. Progressive vector diagram from a current meter deployed at a depth of475meters for 15 days in the South Basin (placed - 1 meter above the bottom). This diagramshows the displacement or "path" of a parcel of water if it moved downstream with thevelocity observed at the fixed position of the current meter. Since this meter was locatednear the bottom of the South Basin below the sill depth, this diagram cannot be strictlyinterpreted in this manner (the diameter of the basin is less than the length of the trackplotted). It does demonstrate a nearly constant flow on the order of 1 cm/sec to the north-northeast throughout the deployment. This flow is generally away from the source ofthermally and chemically enriched water and may suggest a down-slope density flow.Each box on the figure represents the end of a 24-hour sampling period.
53
Distributions of Dissolved Ions with Depth
The distributions of ions in Crater Lake are approximately homogeneous, in parallel with the deeplake temperature. The cations are dominated by sodium with a significant contribution fromcalcium; their sum accounts for 75% of the total (Figure 19). Bicarbonate ion (HCO3) is thedominant anion comprising more than 50% of the anion budget in the lake. However, a closerexamination reveals slightly elevated concentrations of all ions at depth. Figure 20 shows thevertical distribution of sodium, magnesium, potassium, calcium, silicate, and manganese fromsamples collected within the Detailed Study Area. The concentration of these dissolved ionsincreases with depth in the South Basin and this increase correlates with the increase in temperatureand total salt measured by the CTD (Figure 11). This is consistent with a common carrier of thesignals - warm, salty fluids. While these data alone do not constrain a specific source location,character, or temperature, the horizontal and vertical complexity of the temperature and salinityvariations must be actively maintained by the input of anomalous fluids in order to counteract theeffects of rapid vertical mixing processes with a characteristic ventilation rate of twoyears (seeAppendices A and G). Thus, although the absolute values of enrichments are small, they providevery significant information about deep lake processes.
The increase of magnesium in the bottom water of the South Basin is shown in Figure 20a. Theincreased magnesium concentration indicates mixing of the warm, salty end-member fluid. Themagnesium content of the Crater Lake warm, salty end-member can be contrasted with thecharacter of marine hydrothermal fluids which are always depleted in magnesium due to thegreenschist facies metamorphism of oceanic basalt by seawater (Edmond et al., 1979). However,this depletion is relative to the seawater concentration of magnesium which is 500 times higher thanthat in Crater Lake. Indeed, magnesium has been shown to increase in many continentalhydrothermal systems of low-to-intermediate temperatures which are supplied by relatively purewaters (Mariner et al., 1980, 1982; Fournier and Potter, 1979). Hurst and Dibble (1981)documented an increase in magnesium concentration in Ruapehu Crater Lake (New Zealand) whichwas associated with lake water interaction with hot andesitic materials. Also, the concentrations ofmagnesium in Paulina and East Lake (within Newberry Crater) are elevated due to hot springinputs (Phillips, 1968; Johnson et aL, 1985).
However, detailed comparisons of concentrations of elements in hydrothermally-influenced lakesmust be done with caution because the concentrations are primarily controlled by the ratio ofhydrothermal to total water in the system - by the existence or absence of hot springs. Forinstance, East Lake and Paulina Lake which occupy a single volcanic crater to the northeast ofCrater Lake, are separated only by water-permeable lava and ash flows. Both lakes have knownhot springs with measured temperatures up to 48°C at their outflow, yet their bulk lake watercompositions are very different. While the concentrations of some cations are quite high in PaulinaLake compared to Crater Lake (e.g. Ca, Mg), the concentrations of sulfate and chloride are a factorof two higher in Crater Lake than in Paulina.
54
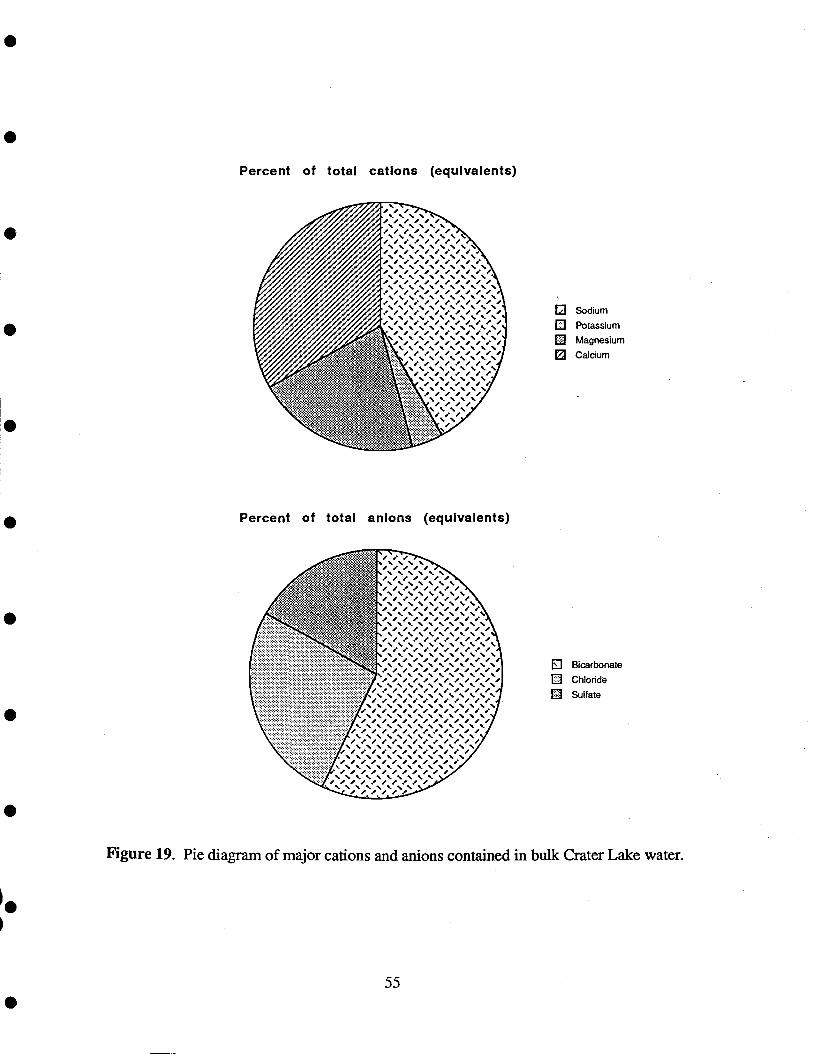
I
cç4 I)
-I I-I-I I-I-I- f-I-I-I
r)
I-I-I-I-I
0
I-I-I-I-1- -I-I-I-f-I -I-I-I-f-I-I -I-I-I-I-I-I I-I-I-I-I-I-l- I-I-I-I--I-f-I-I -I-I-I-i-I-I-I-I I-I-I-I-I-I-I-I- -I-I-I-I-11-11 I-I-I-I-I-I-I-I-I -I-I-I-I-I-I-I-I-I
-
I-I-f-I-I-I-I-I-I-I
.i
I-I-I-I-III1-I-I
-'
-I-I-I-I-I-I-I-I-I-I
-
-I-I-I-I-I-I-I-I-1I I-I-I-I-I-I-I-I-I11
-
-I-I-I-I-I-I-I-f-f-I-I I-I-I-I-II1111I -I-I-I-f-I-I-I-I-f-I-I I-I-I-I-I-I-I-I11-I-1 I-I-I-I-I-I-I-I-I-I-I-I
-I-I-I-I-I-I-I-I-I-I
-I-I-I-I-
0
I
GV? Gb I
I
4, f
I

300
350
300
350
UI
200
250
400
450
200
250
400
U'
Sodium (mM)
i;siI.'i.iH--
450 450
300
E
'. 350
200
250
400
450
200
250
300
. 350
400
I I I I I I
Silicate (jiM)
I -HI I I S Ii-. II S
(b)
I I I I I jjTlII I I I
UI
S
S
.
S
.
S
S
SFigure 20. The concentration of various ions as a function of depth in the south basin:(a) magnesium; (b) potassium; (c) sodium; (d) silicate.
56
S
Magnesium (mM) Potassium (mM) S
I I I II
I I I
(c)
UI 00
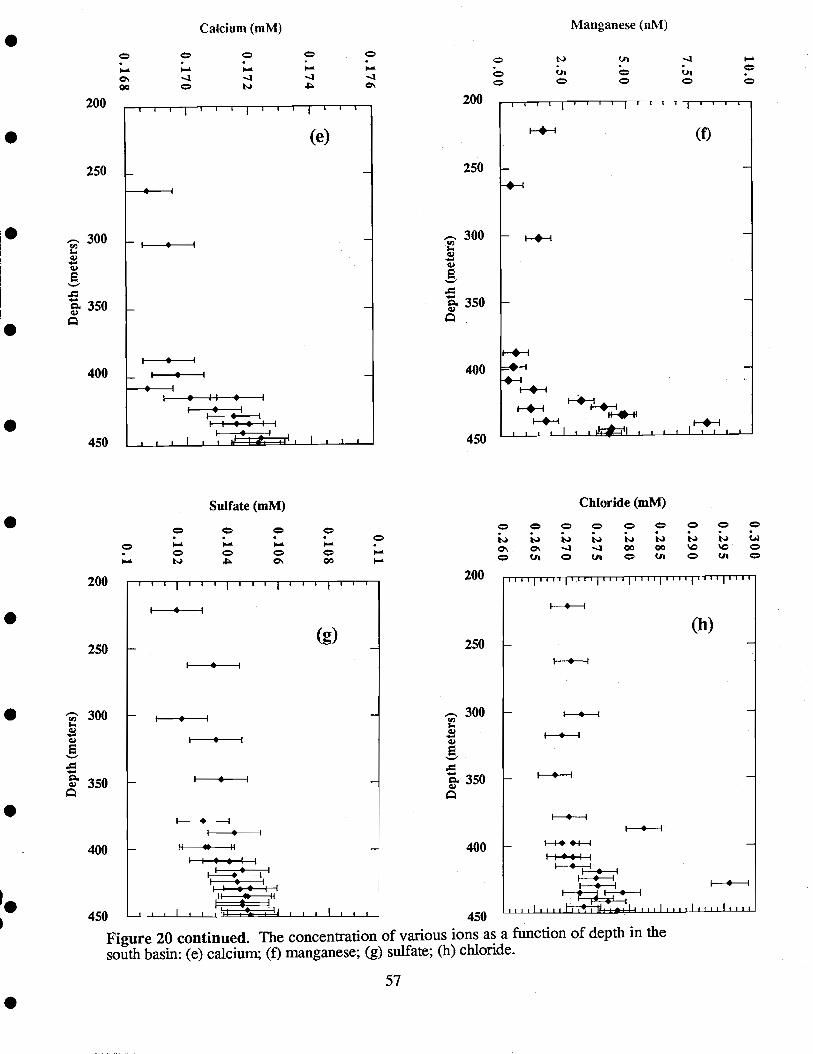
Figure 20 continued. The concentration of various ions as a function of depth in thesouth basin: (e) calcium; (f) manganese; (g) sulfate; (h) chloride.
57
Chloride (mM)
C'00
F FI-
C'
200 2001 I 4 I I I
(e)
250 250
j-.. 300I I
.- 300U) U)
I-
0?0)
0?0?
350 350
I S
400 400I S
S II I
I S It S Iii..;450 450I S
I I i i I
Sulfate (mM)
-4
I- 00
200 200I I I
II I I 1 I I I I I I
250(g)
250
S
300 I I U),- 300I-0?
0? 0?I S I
350 350I I
I I
I S I
400 400II * H -I
II .s ____II_I S 1r-I
SeIII
450 IhiI ItI I I I 450
Calcium (mM) Manganese (nM)
F F0\ C - 00 00 O
u Ui Ui
hull IIIIIIIIIIIIII 1141111111 h1II 11111
(h)
I
I SIIISSI I
Ii
Ii i SIIIIIIlIIIIiTi1+_4_a,f__I__IIIIIII1IIdIhIhhII
The Distribution of CO, in the Water Column
Throughout this report we refer to the total CO2 (CO2) of the system which is defined as:
CO2 = [H2CO3*] + [HCO3-] + [CO3-2]
where:
[H2CO3*] = [CO2 (aq.) + [H2CO3°]
and we refer to H2CO3* as carbonic acid, HCO3- as bicarbonate, and CO32 as the carbonate ion.
Samples were collected in a 100 ml, gas-tight syringe directly from the sample bottle and were keptcold until analysis. For analysis, the samples were brought to room temperature and thentransferred to a closed titration flask (Edmond, 1970). The sample temperature was maintained at25±0.5°C using a circulating water bath. Once the electrode had stabilized, the initial pH of thesamples was measured, after which 0.425 grams of purified KC1 were added to the flask (volume= 56.95 ml) to increase the ionic strength of the solution, and the pH was measured again. Thead1ition of the KC1 stabilizes the potentiometric readings and yields more precise pH values thanthe measurements at low ionic strength. All results are corrected for the ionic strength effects ofthe added salt (Stumm and Morgan, 1981). The titration alkalinity of the sample was determinedusing a Gran titration procedure (Gran, 1952; Dryssen and Sullen, 1967; Edmond, 1970). The
CO2 is calculated from the pH and titration alkalinity of the sample (Stumm and Morgan, 1981).
The vertical distributions of pH, CO2, HCO3-, and H2CO3* are presented in Figure 21. At thepH of the lake (Figure 21a), the CO2 is dominated by the bicarbonate ion (Figure 21b). Inparallel with the other ions (Figure 20) and temperature, the bicarbonate ion and ZCO2concentrations increase with depth. Also the pH decreases slightly with depth (Figure 2la) and theconcentration of H2CO3* increases with depth (Figure 21c). These data document that the fluidsentering the deep lake are enriched in CO2 compared to bulk lake water.
111.4. Ion-Ion Systematics
The covariation of ions in a system is useful for interpreting the sources of inputs. That is, byplotting the concentrations of different ions against each other, we can compare changes in theirratios which allow us to categorize the relative importance of different sources and processes.
Figure 22 shows the relationship between chloride and sodium in all classes of lake samplesincluding submersible-collected near-bottom samples, representative sediment pore waters, coldsprings around the caldera wall and water column samples within the deep lake (>200 meters).The water from the cold springs has very low sodium and essentially zero chloride. This water isderived from rainfall, and thus is considered meteoric (atmospheric) water. However, the watersamples from within the lake are clearly enriched in these ions with respect to all cold springswithin the caldera walls and to atmospheric inputs (Larson, unpublished data; Reilly et al., 1989).To a first order approximation, the lake water can be viewed as a mixture of meteoric waters, ofthermally and chemically enriched springs which contain various enriched source fluids (or "end-members"), and of upward-advecting porewaters (Appendix F).
58
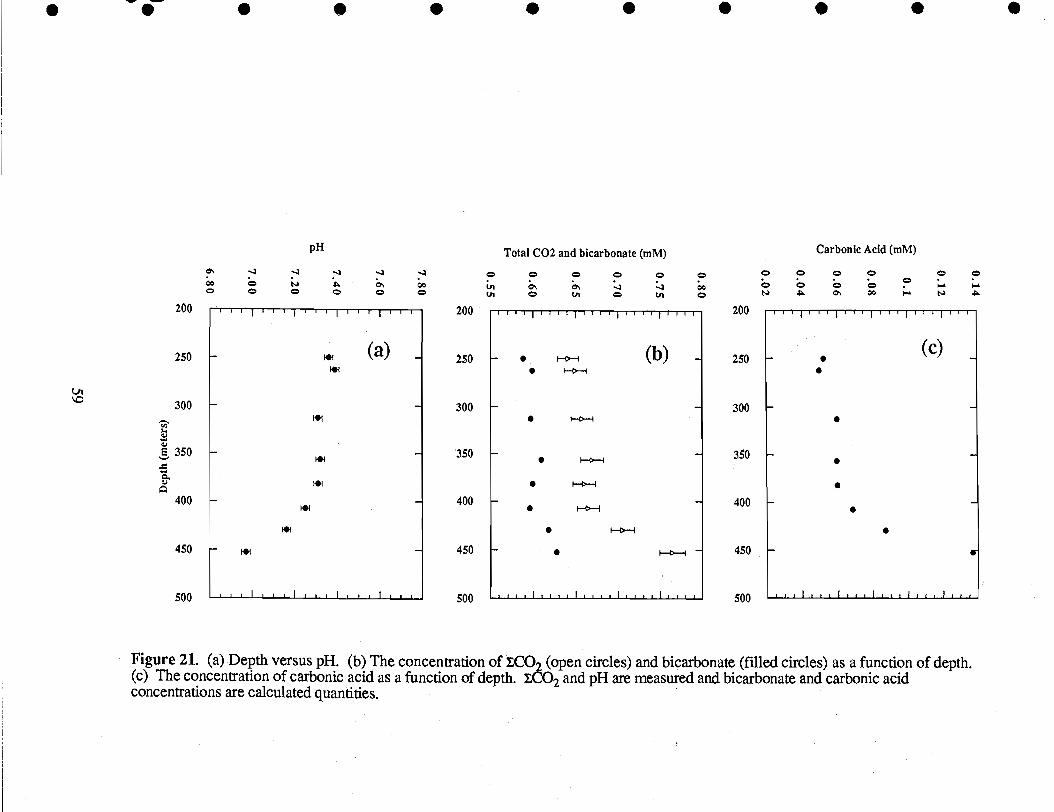
Figure 21. (a) Depth versus pH. (b) The concentration of ECO2 (open circles) and bicarbonate (filled circles) as a function of depth.(c) The concentration of carbonic acid as a function of depth. zCO2 and pH are measured and bicarbonate and carbonic acidconcentrations are calculated quantities.
200
00 000200I I ii Iii
250 250
300 300ld
4)
E 350 + 350
V
400 400
+450 450
500 I i i i I It till 500
0 00 0
00.'
000
0'-I
0 0
200 I I III 11111 II II 4
II
250(c)
300
350
400
450
500 lilt tilt lilt lilt lilt ill
pH Total CO2 and bicarbonate (mM) Carbonic Acid (mM)
0 0 0 0 0C.' C'i 4 4 000 0 01 0
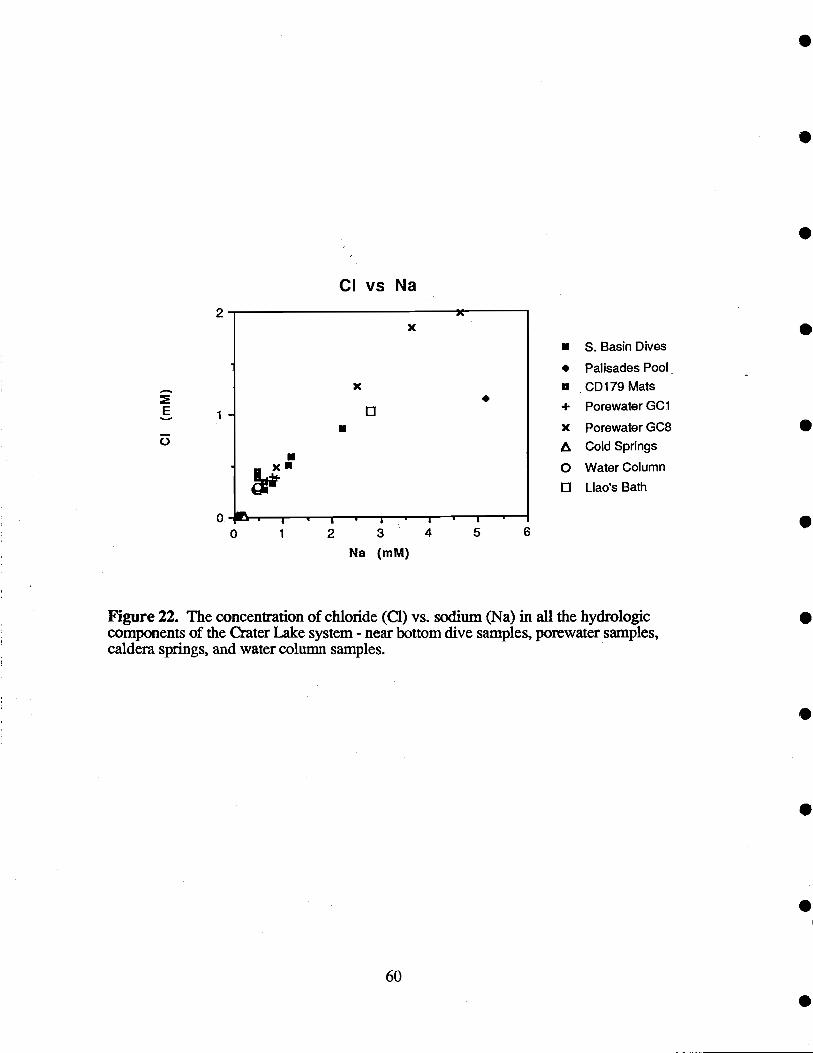
E
0
2
0
'C
0U
.
CI vs Na
I2 3 4
Na (mM)
60
S. Basin Dives
Palisades Pool
U CDl79Mats+ PorewaterGCl
x Porewater GC8
Cold Springs
o Water Column
o Llaos Bath
Figure 22. The concentration of chloride (Cl) vs. sodium (Na) in all the hydrologiccomponents of the Crater Lake system - near bottom dive samples, porewater samples,caldera springs, and water column samples.
5 60 1
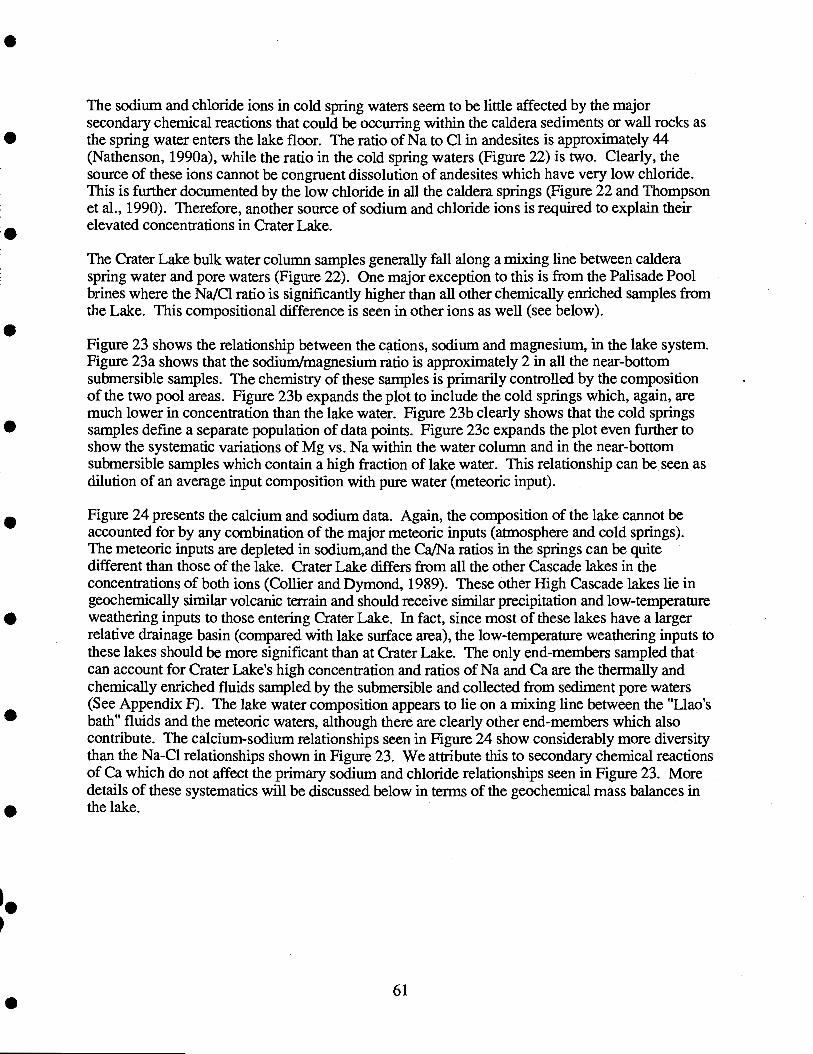
The sodium and chloride ions in cold spring waters seem to be little affected by the majorsecondary chemical reactions that could be occurring within the caldera sediments or wall rocks asthe spring water enters the lake floor. The ratio of Na to Cl in andesites is approximately 44(Nathenson, 1990a), while the ratio in the cold spring waters (Figure 22) is two. Clearly, thesource of these ions cannot be congruent dissolution of andesites which have very low chloride.This is further documented by the low chloride in all the caldera springs (Figure 22 and Thompsonet al., 1990). Therefore, another source of sodium and chloride ions is required to explain theirelevated concentrations in Crater Lake.
The Crater Lake bulk water column samples generally fall along a mixing line between calderaspring water and pore waters (Figure 22). One major exception to this is from the Palisade Poolbrines where the Na/Cl ratio is significantly higher than all other chemically enriched samples fromthe Lake. This compositional difference is seen in other ions as well (see below).
Figure 23 shows the relationship between the cations, sodium and magnesium, in the lake system.Figure 23a shows that the sodium/magnesium ratio is approximately 2 in all the near-bottomsubmersible samples. The chemistry of these samples is primarily controlled by the compositionof the two pool areas. Figure 23b expands the plot to include the cold springs which, again, aremuch lower in concentration than the lake water. Figure 23b clearly shows that the cold springssamples define a separate population of data points. Figure 23c expands the plot even further toshow the systematic variations of Mg vs. Na within the water column and in the near-bottomsubmersible samples which contain a high fraction of lake water. This relationship can be seen asdilution of an average input composition with pure water (meteoric input).
Figure 24 presents the calcium and sodium data. Again, the composition of the lake cannot beaccounted for by any combination of the major meteoric inputs (atmosphere and cold springs).The meteoric inputs are depleted in sodium,and the Ca/Na ratios in the springs can be quitedifferent than those of the lake. Crater Lake differs from all the other Cascade lakes in theconcentrations of both ions (Collier and Dymond, 1989). These other High Cascade lakes lie ingeochemically similar volcanic terrain and should receive similar precipitation and low-temperatureweathering inputs to those entering Crater Lake. In fact, since most of these lakes have a largerrelative drainage basin (compared with lake surface area), the low-temperature weathering inputs tothese lakes should be more significant than at Crater Lake. The only end-members sampled thatcan account for Crater Lake's high concentration and ratios of Na and Ca are the thermally andchemically enriched fluids sampled by the submersible and collected from sediment pore waters(See Appendix F). The lake water composition appears to lie on a mixing line between the "Llao'sbath" fluids and the meteoric waters, although there are clearly other end-members which alsocontribute. The calcium-sodium relationships seen in Figure 24 show considerably more diversitythan the Na-Cl relationships shown in Figure 23. We attribute this to secondary chemical reactionsof Ca which do not affect the primary sodium and chloride relationships seen in Figure 23. Moredetails of these systematics will be discussed below in terms of the geochemical mass balances inthe lake.
61
E
C)
0.30
0.25-
0.20
0.15-
0.10-
0.05-
0.00
0.115-
E
C)
0.110-
+
Mg vs Na
Mg vs Na
0 S.Basintjiveso water column
cold springs
U
B
(b)
U
(C)
0.8
0.1050.435 0.445 0.455 0.465 0.475
Na (mM)
Figure 23. Magnesium (Mg) vs. Sodium (Na) in Crater Lake and associated waters: (a)Mg vs. Na in the south basin dive samples, palisades pool, and the water column; (b) Anexpanded scale of Mg vs. Na for south basin dive samples, the water column, and thecaldera springs; (c) An expanded scale of Mg vs. Na for the water column samples andsome of the south basin dive samples.
62
0 1 2 3 4 S 6
Na (mM)
I I I00 0.2 0.4 0.6
Na (mM)
Mg vs Na0.120
u S. Basin Dives+ water column
3
o S. Basin Dives
Palisades Pool
o water column .2
Llaos Bath
(a)0 I I I I -' I

63
Ca vs Na1.0
xx
0.8- x U S. Basin Dives
+ x A Palisades Pool0.6- .f.
+ xA
O Water ColumnE Cold Springs
0.4-
0.2- XA
+ Porewater GC1
x Porewater GC8
o Llaos Bath(a).
0.00 1 2 3 4 5 6
Na (mM)
Ca vs Na0.30
0.25- 0
00.20- o S. Basin Dives
E 0.15-
Uo Water Column
Cold Springs0 0.10-
.
0.05-*0,
(b)0.00 I I
1.5
(c)9 S. Basin Dives
o Water Column1.0
Palisades Point
z +++ £ Cold Springs
+ Porewater GC80 +0.5 + Porewater GC1
Do DUU
0 Llaos BathU I
0.01 . I
0 1 2
CI (mM)
Figure 24. (a) The concentration of calcium (Ca) vs. sodium (Na) in the south basin divesamples, palisades pool, water column, caldera springs, and porewaters. (b) An expandedscale of Ca vs. Na in some of the south basin dive samples, water column samples, andcaldera springs. (c) Ca/Na vs. Cl in the south basin dive samples, water column samples,palisades pooi, caldera springs, and porewaters.
00 0.2 0.4 0.6 0.8
Na (mM)
Ca/Na vs CI
111.5. Helium Concentrations and Isotopic Ratios
In an earlier publication (Lupton et al., 1987), we reported Crater Lake data which documentedenrichments of helium with a mantle isotopic ratio (R = 3He/4He = 7.1) in deep lake waters. Thesedata are rigorous evidence for injection of magmatic volatiles into the deep lake. Although 3Heanomalies have been one of the most consistent and valuable tracers of hydrothermal activity in theoceans (Lupton et al., 1980; Lupton and Craig, 1985), it might be possible that helium is beingtransmitted as a volatile into the deep lake rather than within a hydrothermal fluid (La Fleur, 1990).Such a process may have occurred at Lake Monoun and Lake Nyos in Cameroon where deep lakeCO2 injections led to a lethal gas burst (Sigurdsson, 1987). The mantle-like 3He/4He values inLake Nyos (Sano et al., 1987; 1990) may be a consequence of gaseous inputs of helium thataccompanied the volatile CO2 injection. In this section of the report, we review the current CraterLake helium data in an attempt to distinguish between volatile and hydrothermal sources.
Water Column Samples.
The first helium isotopic measurements were made in 1985, and measurements were repeated in1987, 1988, and 1989. The earlier data were reported in Lupton et al. (1987), Collier andDymond (1988a,b), and Collier and Dymond (1989) and are tabulated in Appendix I. The depthdistribution of 3He in the North and South Basins as measured in 1989 is shown in Figure 25.Although these data show that the highest He values occur in the South Basin, significantenrichments also occur in the North Basin. The depth distribution pattern from 1989 is consistentwith the pattern defined by measurements made in previous years. The water samples obtainednear the bottom of the Detailed Study Area contain five to six times more 3He than air-saturatedfresh water (lake surface at 1882 meters elevation and 4°C).
In addition to the mantle source for 3He discussed above, it is also the stable daughter product ofthe decay of tritium (3H or T; half life = 12.33 years). The distribution of 3H in Crater Lake waspreviously discussed by Simpson (1970b) and its use in other closed basin lake hydrologic studieshas been discussed by Hercze and Imboden (1988). When a water parcel is isolated from theatmosphere, the decay of the 3H in that water produces excess 3He. The systematics of this closedsystem tritium-helium model are commonly used to estimate the time since a parcel of water waslast in contact with the atmosphere (Jenkins, 1988). In our case, in order to evaluate thegeothermal input of 3He, we need to examine the fraction of the total 3He in Crater Lake that maybe derived from H decay.
The primaiy input of "bomb" 3H, which dominates the total input to Crater Lake over the last threedecades, occurred between 1962-1967 (Simpson, 1970b). The average 3H content of Crater Lakein 1967 was 24 T.U. (T.U. = a concentration equivalent to 1 3H atom per 1018 1H atoms inwater) and the concentration of 3H at the time we collected our 3He samples (1987) was certainlyless than or equal to this value. The characteristic time of vertical mixing of Crater Lake wateraverages about 2 years and the "oldest" water, located at the bottom of the basins, is about 3 yearsold (Appendix A & G). If water is isolated on the bottom of the lake for 3 years, the decay of 3H[@24 T.U.] will produce 9 x 10-15 cc 3He/gram of water. This is approximately 3.6% of thetotal 3He found in the bottom water of Crater Lake (Figure 25). Therefore, the 3He concentrationin this rapidly-mixing lake is essentially unaffected by 3H decay. Although we do not have currentmeasurements completed for the actual concentration of H in the lake in 1987, it is more likely thatradioactive decay has reduced this concentration by as much as a factor of 3 since 1967 and the 3Hcontribution to 3He would be even smaller. From another perspective, if this process made a
64
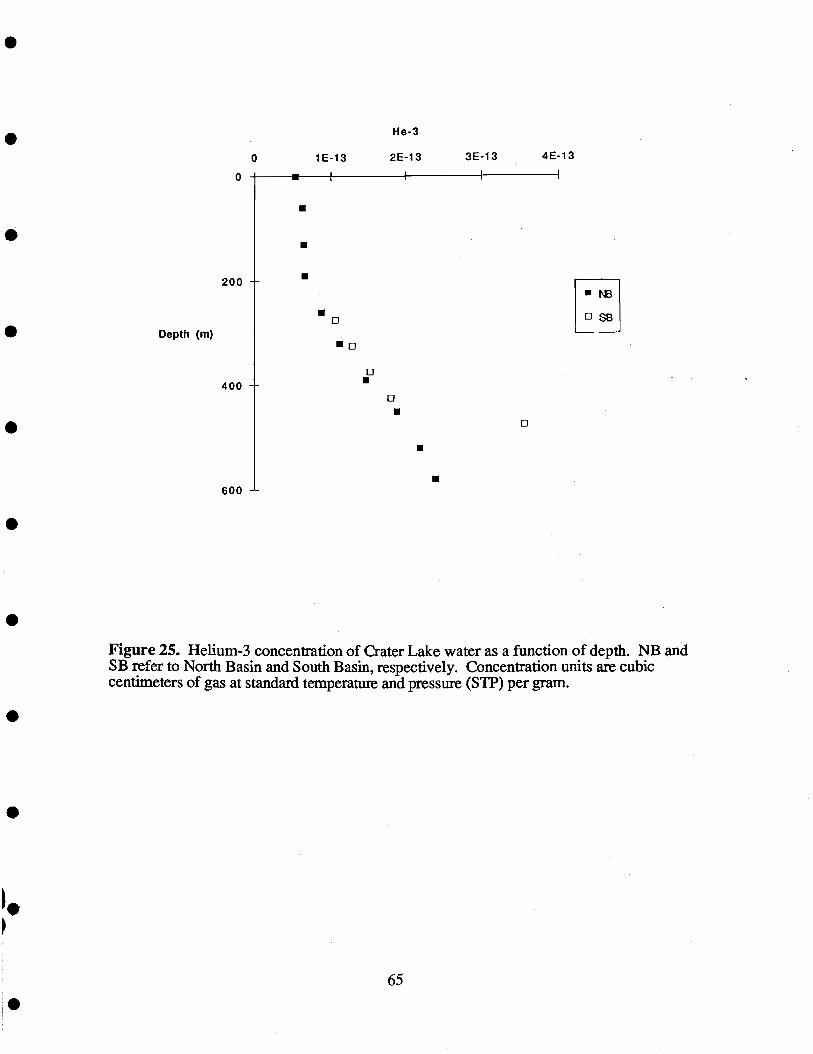
Depth (m)
0
600
Figure 25. Helium-3 concentration of Crater Lake water as a function of depth. NB andSB refer to North Basin and South Basin, respectively. Concentration units are cubiccentimeters of gas at standard temperature and pressure (SiP) per gram
0
U0
He-3
1E-13 2E-13
U
3E-13 4E-13
0
U
65
U NB
0 SB
U
U
U
U0
200 -
400 -0
U
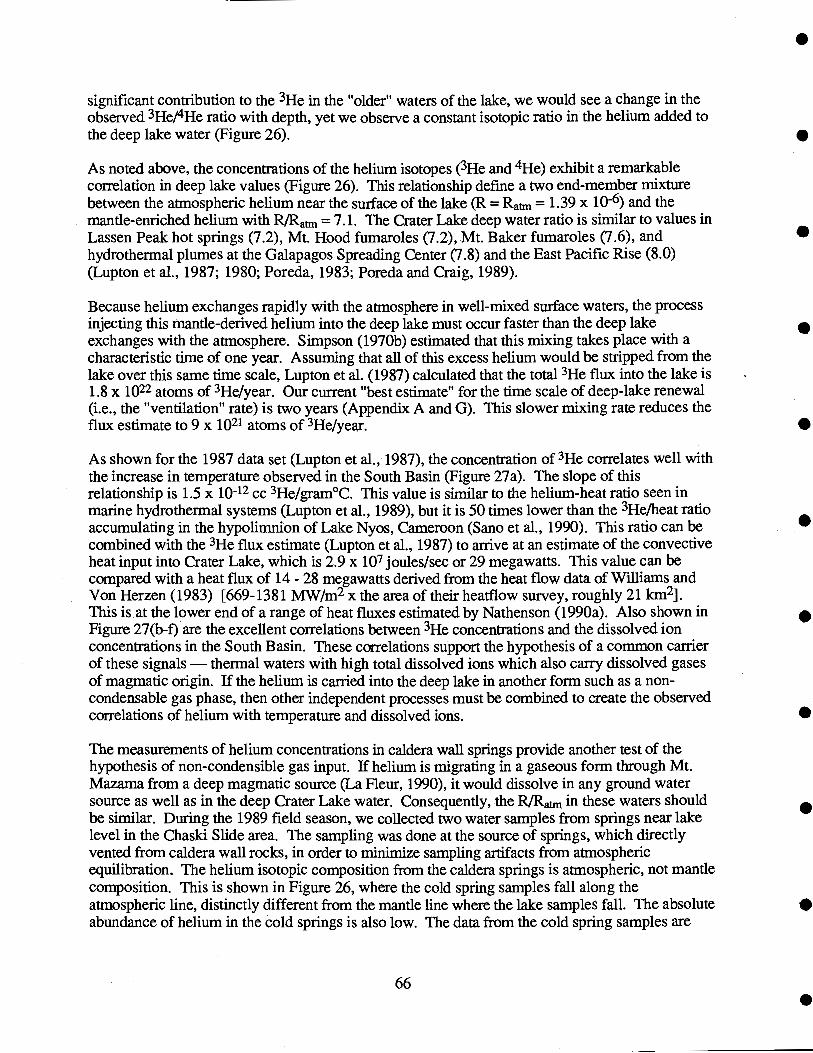
significant contribution to the 3He in the "older" waters of the lake, we would see a change in theobserved 3He/4He ratio with depth, yet we observe a constant isotopic ratio in the helium added tothe deep lake water (Figure 26).
As noted above, the concentrations of the helium isotopes (3He and 4He) exhibit a remarkablecorrelation in deep lake values (Figure 26). This relationship defme a two end-member mixturebetween the atmospheric helium near the surface of the lake (R = Ra = 1.39 x 10⁻⁶) and themantle-enriched helium with R/Ra = 7.1. The Crater Lake deep water ratio is similar to values inLassen Peak hot springs (7.2), Mt. Hood fumaroles (7.2), Mt. Baker fumaroles (7.6), andhydrothermal plumes at the Galapagos Spreading Center (7.8) and the East Pacific Rise (8.0)(Lupton et al., 1987; 1980; Poreda, 1983; Poreda and Craig, 1989).
Because helium exchanges rapidly with the atmosphere in well-mixed surface waters, the processinjecting this mantle-derived helium into the deep lake must occur faster than the deep lakeexchanges with the atmosphere. Simpson (1970b) estimated that this mixing takes place with acharacteristic time of one year. Assuming that all of this excess helium would be stripped from thelake over this same time scale, Lupton et al. (1987) calculated that the total 3He flux into the lake is1.8 x 1022 atoms of 3He/year. Our current "best estimate" for the time scale of deep-lake renewal(i.e., the "ventilation" rate) is two years (Appendix A and G). This slower mixing rate reduces theflux estimate to 9 x 10²¹ atoms of 3He/year.
As shown for the 1987 data set (Lupton et aL, 1987), the concentration of 3He correlates well withthe increase in temperature observed in the South Basin (Figure 27a). The slope of thisrelationship is 1.5 x 10⁻¹² cc 3He/gramoC. This value is similar to the helium-heat ratio seen inmarine hydrothermal systems (Lupton et al., 1989), but it is 50 times lower than the 3He/heat ratioaccumulating in the hypolimnion of Lake Nyos, Cameroon (Sano et al., 1990). This ratio can becombined with the 3He flux estimate (Lupton et al., 1987) to arrive at an estimate of the convectiveheat input into Crater Lake, which is 2.9 x 10⁷ joules/sec or 29 megawatts. This value can becompared with a heat flux of 14-28 megawatts derived from the heat flow data of Williams andVon Herzen (1983) {669-1381 MW/m2 x the area of their heatfiow survey, roughly 21 km2].This is at the lower end of a range of heat fluxes estimated by Nathenson (1990a). Also shown inFigure 27(b-f) are the excellent correlations between 3He concentrations and the dissolved ionconcentrations in the South Basin. These correlations support the hypothesis ofa common carrierof these signals - thermal waters with high total dissolved ions which also carry dissolved gasesof magmatic origin If the helium is carried into the deep lake in another form such as a non-condensable gas phase, then other independent processes must be combined to create the observedcorrelations of helium with temperature and dissolved ions.
The measurements of helium concentrations in caldera wall springs provide another test of thehypothesis of non-condensible gas input. If helium is migrating in a gaseous form through Mt.Mazama from a deep magmatic source (La Fleur, 1990), it would dissolve in any ground watersource as well as in the deep Crater Lake water. Consequently, the R/R in these waters shouldbe similar. During the 1989 field season, we collected two water samples from springs near lakelevel in the Chaski Slide area. The sampling was done at the source of springs, which directlyvented from caldera wall rocks, in order to minimize sampling artifacts from atmosphericequilibration. The helium isotopic composition from the caldera springs is atmospheric, not mantlecomposition. This is shown in Figure 26, where the cold spring samples fall along theatmospheric line, distinctly different from the mantle line where the lake samples fall. The absoluteabundance of helium in the cold springs is also low. The data from the cold spring samples are
66

He-3 (cclg) x1013
0
4 6 8 10
He-4 (cclg) x i8)
Figure 26. The relationship between the concentration of 3He and 4He in Crater Lakesamples collected in 1989. The R/Ra is the comparative value of the ratio of 3He /4He in asample relative to the ratio in the atmosphere (Ra = 1.39 x 10⁻⁶). The ratio of 7.1 is atypical mantle value. The dashed line shows the atmospheric ratio (1.0). Samples whichequilibrate with an atmospheric source, such as the cold spring waters, should fall alongthis line.
SB
O sub
mat
O spring
- air
67
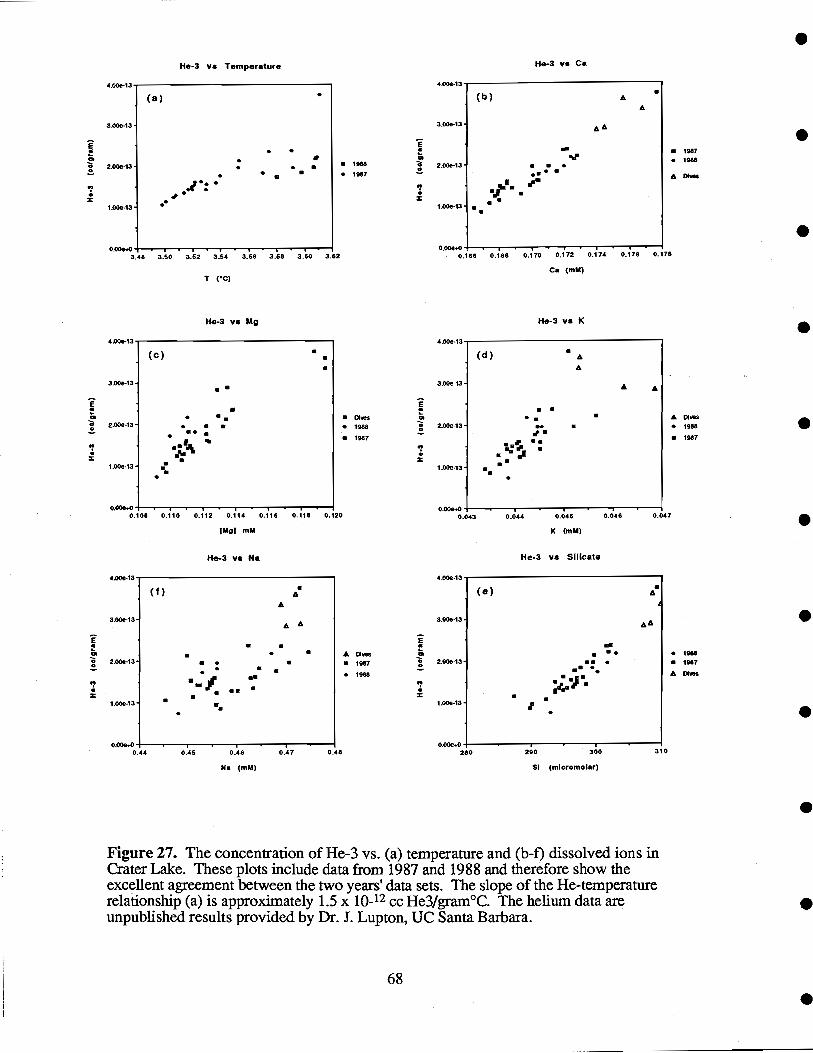
0.O0e.00_los o.lio 0.112 0.114 0.116 0.115 0.120
68
0000.00.043 0.044 0.045 0.046 0.047
E
a
E
a
140-3 vs Temperature
3.82
1988
1867
Dives1988
1987
aUa
S
4.000 13
3000-13.
2.000-13-
I.000-13
0.000+0
He-S vs Ca
a 1987
1968
A DI.6
A Dives1998
a 1987
0.178
4.000-13
3.000-13 -
2.008-13-
1.000-13 -
0.000+0
(a)
CC
. a
(b)
a a C.U U
AA
3.45 3.50
4.000-13
3.52 3.54 3.56
T (C)
He-3 vs Mg
3.58 3.60 0.166 0.168 0.170 0.172
C. (mM)
He-3 vs K
0.174 0.176
3.000-13 -
2.00e-13-
1.000-13
(C)
aC
5a.
a
a
a a
U
a
4.000-13
3.000-13 -
2.000-13
1.000-13
(d)
U
UAA
U. .
A
tUgi mM
He-3 vs Na
IC
He-3 vs
(mU)
Silicate
4.000-13 4.00. 13
(t) aA (a) a
AA 4
ECa
z
3.000-13-
2.00s-13a
Ca aa
5
a
.a
£
a
.U
A
U A DivesU 1967
1988
a
a
x
3.000-13-
2.000-13
a
aUU
LA
a
A
19881567
0198$
1.000-13 - 1.000-13 - I
0.000+0 0.008+00.44 0.45 0.46 0.47 0.48 280 280 300 310
54. (mu) SI (micromolar)
Figure 27. The concentration of He-3 vs. (a) temperature and (b-f) dissolved ions inCrater Lake. These plots include data from 1987 and 1988 and therefore show theexcellent agreement between the two years' data sets. The slope of the He-temperaturerelationship (a) is approximately 1.5 x 1O12 cc He3/gram°C. The helium data areunpublished results provided by Dr. J. Lupton, UC Santa Barbara.
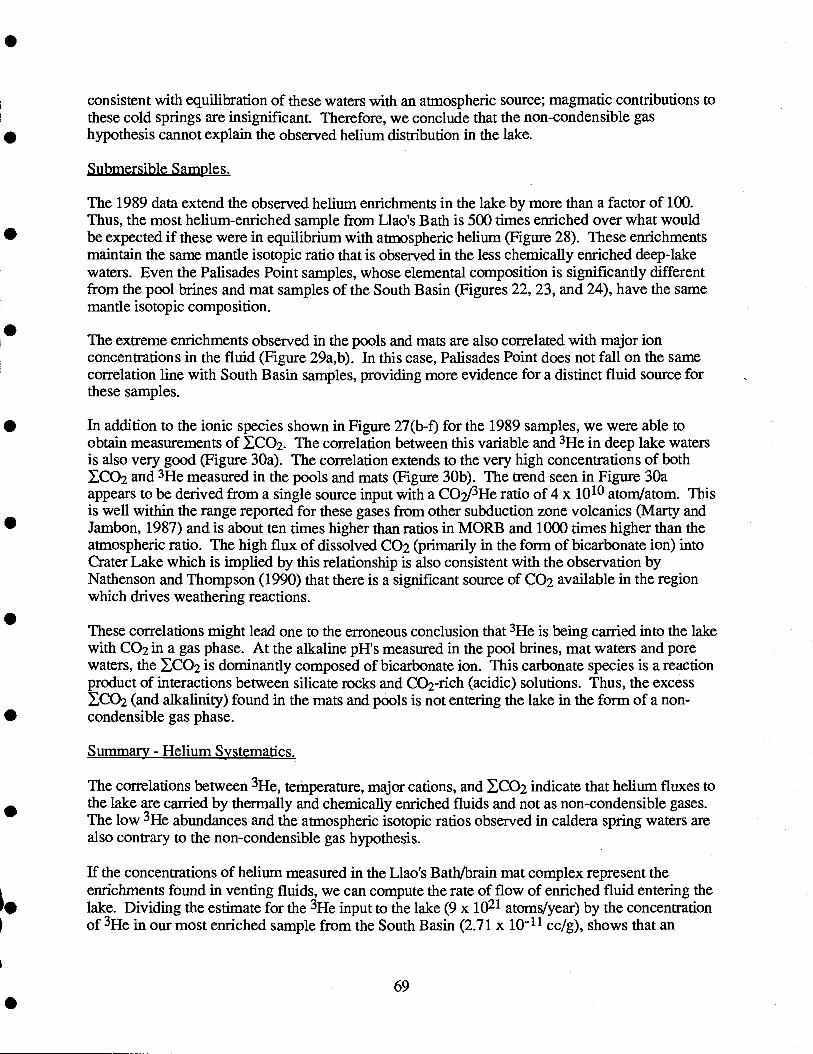
consistent with equilibration of these waters with an atmospheric source; magmatic contributions tothese cold springs are insignificant. Therefore, we conclude that the non-condensible gashypothesis cannot explain the observed helium distribution in the lake.
Submersible Samples.
The 1989 data extend the observed helium enrichments in the lake by more than a factor of 100.Thus, the most helium-enriched sample from Llao's Bath is 500 times enriched over what wouldbe expected if these were in equilibrium with atmospheric helium (Figure 28). These enrichmentsmaintain the same mantle isotopic ratio that is observed in the less chemically enriched deep-lakewaters. Even the Palisades Point samples, whose elemental composition is significantly differentfrom the pool brines and mat samples of the South Basin (Figures 22,23, and 24), have the samemantle isotopic composition.
The extreme enrichments observed in the pools and mats are also correlated with major ionconcentrations in the fluid (Figure 29a,b). In this case, Palisades Point does not fail on the samecorrelation line with South Basin samples, providing more evidence for a distinct fluid source forthese samples.
In addition to the ionic species shown in Figure 27(b-f) for the 1989 samples, we were able toobtain measurements of CO2. The correlation between this variable and 3He in deep lake watersis also very good (Figure 30a). The correlation extends to the very high concentrations of both
CO2 and 3He measured in the pools and mats (Figure 30b). The trend seen in Figure 30aappears to be derived from a single source input with a CO2/3He ratio of 4 x 10¹⁰ atom/atom. Thisis well within the range reported for these gases from other subduction zone volcanics (Marty andJambon, 1987) and is about ten times higher than ratios in MORB and 1000 times higher than theatmospheric ratio. The high flux of dissolved CO2 (primarily in the form of bicarbonate ion) intoCrater Lake which is implied by this relationship is also consistent with the observation byNathenson and Thompson (1990) that there is a significant source of CO2 available in the regionwhich drives weathering reactions.
These correlations might lead one to the erroneous conclusion that 3He is being carried into the lakewith CO2 in a gas phase. At the alkaline pH's measured in the pool brines, mat waters and porewaters, the CO2 is dominantly composed of bicarbonate ion. This carbonate species is a reactionproduct of interactions between silicate rocks and CO2-rich (acidic) solutions. Thus, the excess
CO2 (and alkalinity) found in the mats and pools is not entering the lake in the form of a non-condensible gas phase.
Summary - Helium Systematics.
The correlations between 3He, temperature, major cations, and CO2 indicate that helium fluxes tothe lake are can-led by thermally and chemically enriched fluids and not as non-condensible gases.The low 3He abundances and the atmospheric isotopic ratios observed in caldera spring waters arealso contrary to the non-condensible gas hypothesis.
If the concentrations of helium measured in the Llao's Bath/brain mat complex represent theenrichments found in venting fluids, we can compute the rate of flow of enriched fluid entering thelake. Dividing the estimate for the 3He input to the lake (9 x 10²¹ atoms/year) by the concentrationof 3He in our most enriched sample from the South Basin (2.71 x 10⁻¹¹ cc/g), shows that an
69
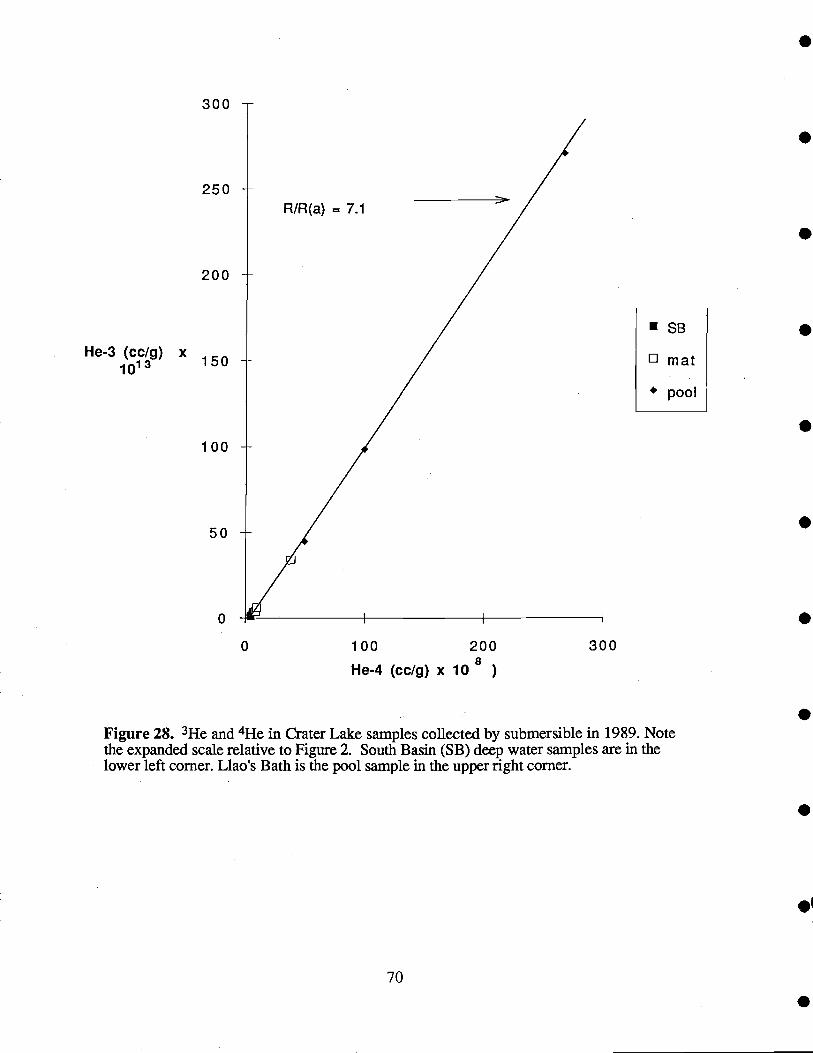
He-3 (cclg)
300
250
200
1013 150
100
50
70
R SB
O mat
poo'
0 100 200 300
He-4 (cclg) x 108
Figure 28. 3He and 4He in Crater Lake samples collected by submersible in 1989. Notethe expanded scale relative to Figure 2. South Basin (SB) deep water samples are in thelower left corner. Llao's Bath is the pool sample in the upper right corner.
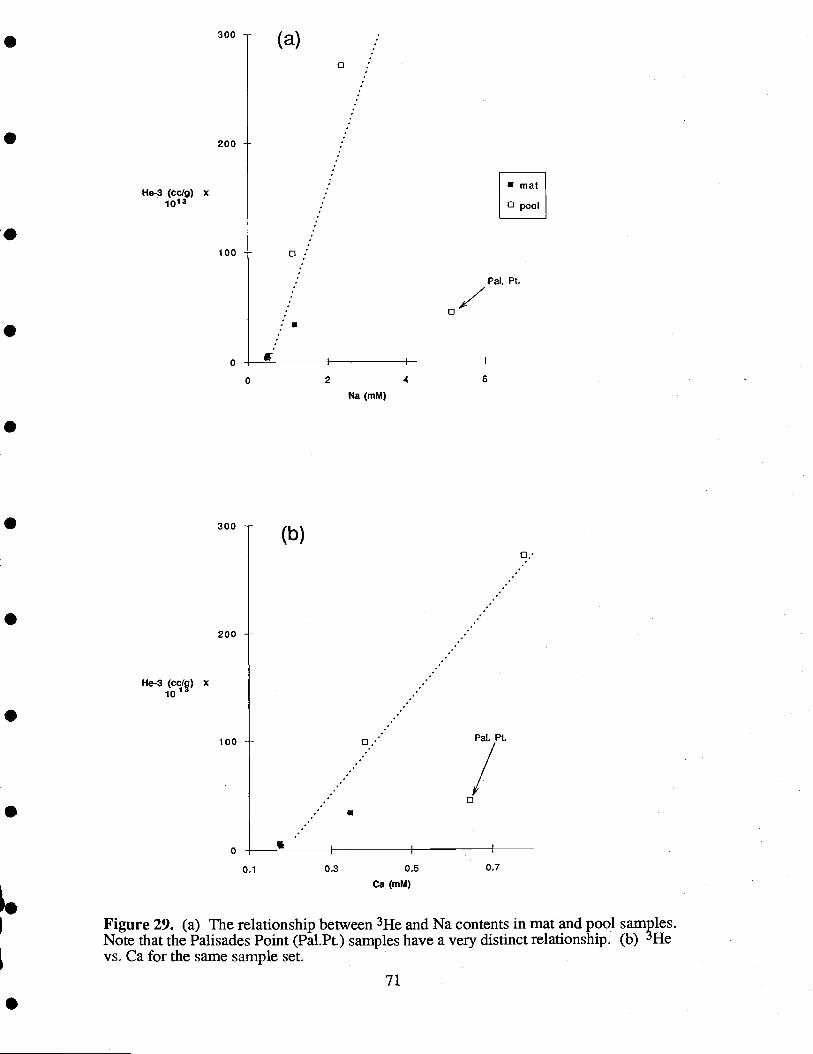
He-3 (cc/g) x1013
I-Ie-3 (cc(s) x10 1
300
200
100
0
300
200
100
0
0.1 0.3 0.5 0.7
Ca (mM)
Figure 29. (a) The relationship between 3He and Na Contents fl mat and pool samples.Note that the Palisades Point (Pal.Pt.) samples have a very distinct relationship. (b) 3Hevs. Ca for the same sample set.
0
(b)
2
Na (mM)
71
6
0.
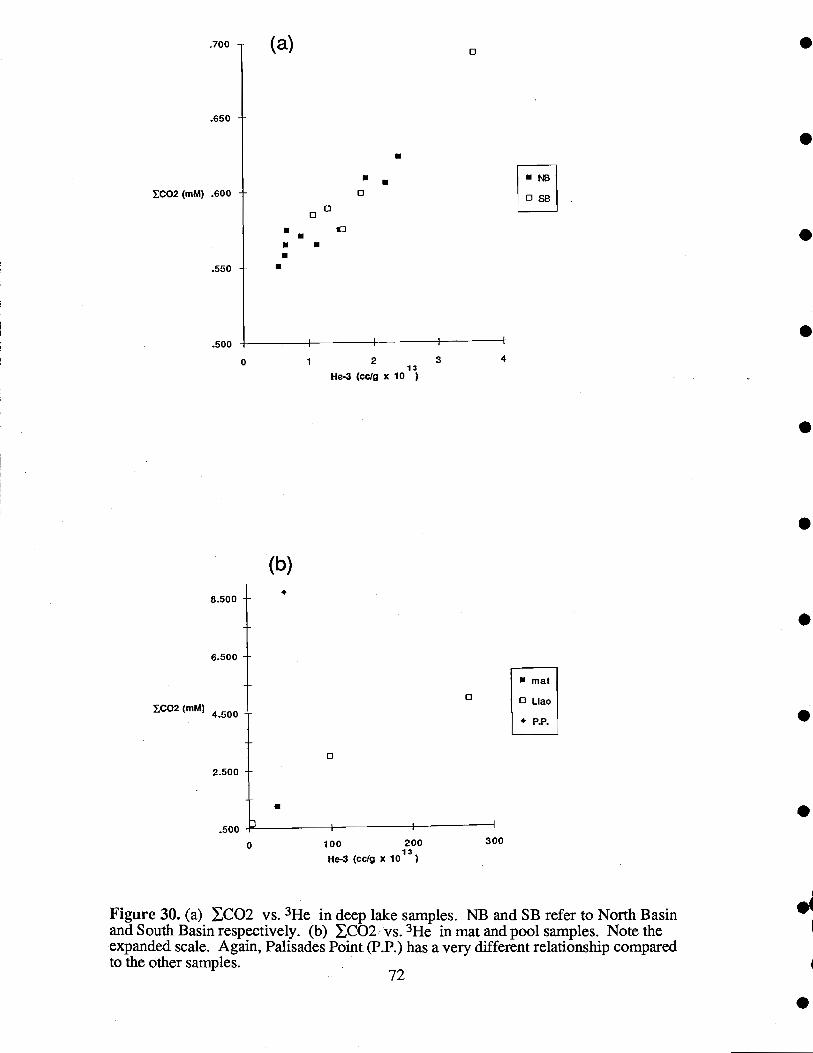
8.500
6.500
CO2 (mM) 4.500
2.500
.500
0
.
(b)
3 4
U mat
O LIao
P.R.
Figure 30. (a) CO2 vs. 3He in deep lake samples. NB and SB refer to North Basinand South Basin respectively. (b) CO2 vs. 3He in mat and pool samples. Note theexpanded scale. Again, Palisades Point (P.P.) has a very different relationship comparedto the other samples.
72
.700
.650
XCO2 (mM) .600 -
.550 -
(a)
00U
UU
UU
U
0
U
0
U
0 SB
.500
1 213
lle-3 (ccIg x 10 )
0 100 200 300
He-3 (cclg x 1013)
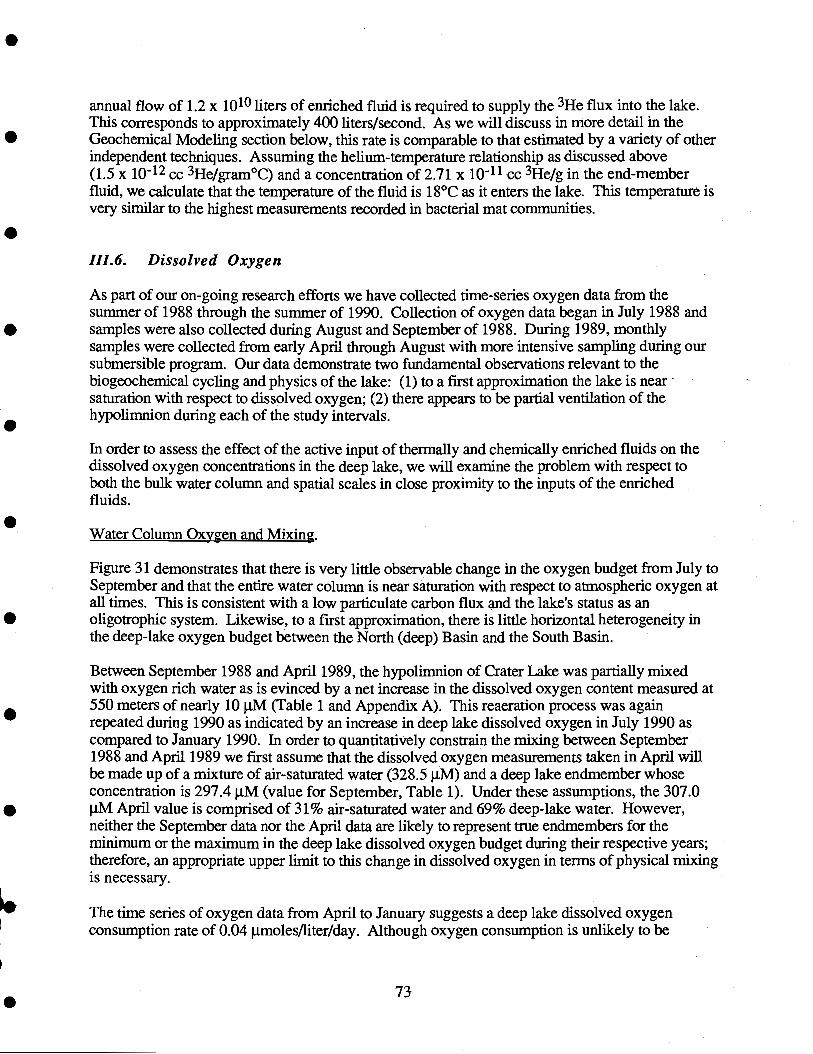
annual flow of 1.2 x 10¹⁰ liters of enriched fluid is required to supply the 3He flux into the lake.This corresponds to approximately 400 liters/second. As we will discuss in more detail in theGeochemical Modeling section below, this rate is comparable to that estimated by a variety of otherindependent techniques. Assuming the helium-temperature relationship as discussed above(1.5 x 10⁻¹²cc 3He/gram°C) and a concentration of 2.71 x 10⁻¹¹ cc 3He/g in the end-memberfluid, we calculate that the temperature of the fluid is 18°C as it enters the lake. This temperature isvery similar to the highest measurements recorded in bacterial mat communities.
111.6. Dissolved Oxygen
As part of our on-going research efforts we have collected time-series oxygen data from thesummer of 1988 through the summer of 1990. Collection of oxygen data began in July 1988 andsamples were also collected during August and September of 1988. During 1989, monthlysamples were collected from early April through August with more intensive sampling during oursubmersible program. Our data demonstrate two fundamental observations relevant to thebiogeochemical cycling and physics of the lake: (1) to a first approximation the lake is nearsaturation with respect to dissolved oxygen; (2) there appears to be partial ventilation of thehypolimnion during each of the study intervals.
In order to assess the effect of the active input of thermally and chemically enriched fluids on thedissolved oxygen concentrations in the deep lake, we will examine the problem with respect toboth the bulk water column and spatial scales in close proximity to the inputs of the enrichedfluids.
Water Column Oxygen and Mixing.
Figure 31 demonstrates that there is very little observable change in the oxygen budget from July toSeptember and that the entire water column is near saturation with respect to atmospheric oxygen atall times. This is consistent with a low particulate carbon flux and the lake's status as anoligotrophic system. Likewise, to a first approximation, there is little horizontal heterogeneity inthe deep-lake oxygen budget between the North (deep) Basin and the South Basin.
Between September 1988 and April 1989, the hypolimnion of Crater Lake was partially mixedwith oxygen rich water as is evinced by a net increase in the dissolved oxygen content measured at550 meters of nearly 10 j.LM (Table 1 and Appendix A). This reaeration process was againrepeated during 1990 as indicated by an increase in deep lake dissolved oxygen in July 1990 ascompared to January 1990. In order to quantitatively constrain the mixing between September1988 and April 1989 we first assume that the dissolved oxygen measurements taken in April willbe made up of a mixture of air-saturated water (328.5 i.tM) and a deep lake endmember whoseconcentration is 297.4 .tM (value for September, Table 1). Under these assumptions, the 307.0pM April value is comprised of 31% air-saturated water and 69% deep-lake water. However,neither the September data nor the April data are likely to represent true endmembers for theminimum or the maximum in the deep lake dissolved oxygen budget during their respective years;therefore, an appropriate upper limit to this change in dissolved oxygen in terms of physical mixingis necessary.
The time series of oxygen data from April to January suggests a deep lake dissolved oxygenconsumption rate of 0.04 .tmoles/liter/day. Although oxygen consumption is unlikely to be
73
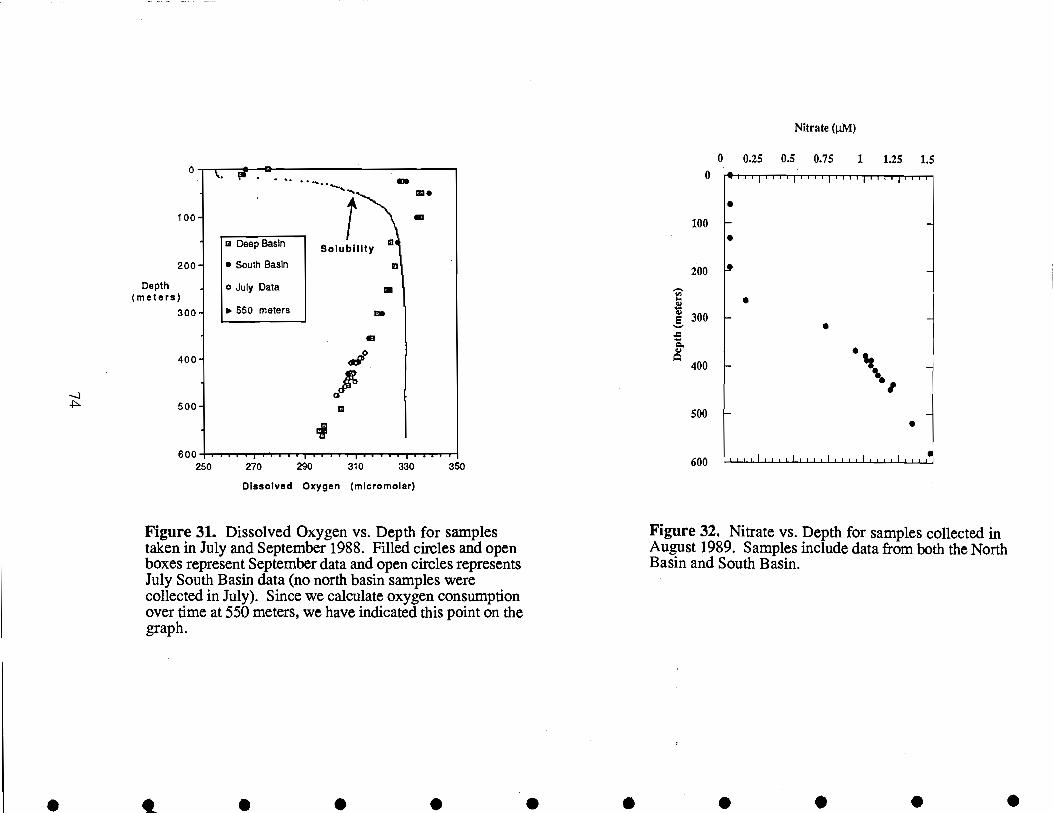
Depth(meters)
300-
Figure 31. Dissolved Oxygen vs. Depth for samplestaken in July and September 1988. Filled circles and openboxes represent September data and open circles representsJuly South Basin data (no north basin samples werecollected in July). Since we calculate oxygen consumptionover time at 550 meters, we have indicated this point on thegraph.
I
Nitrate ((.LM)
0.25 0.5 0.75 1 1.25 1.5
Iluilihill hull till 1,11111111
S
Figure 32. Nitrate vs. Depth for samples collected inAugust 1989. Samples include data from both the NorthBasin and South Basin.
100
200
.300
S
400 1¼
500
SI,
S
600 I u I I I u I I I I i I i i250 270 290 310
Dissolved Oxygen (micromolar)
350330
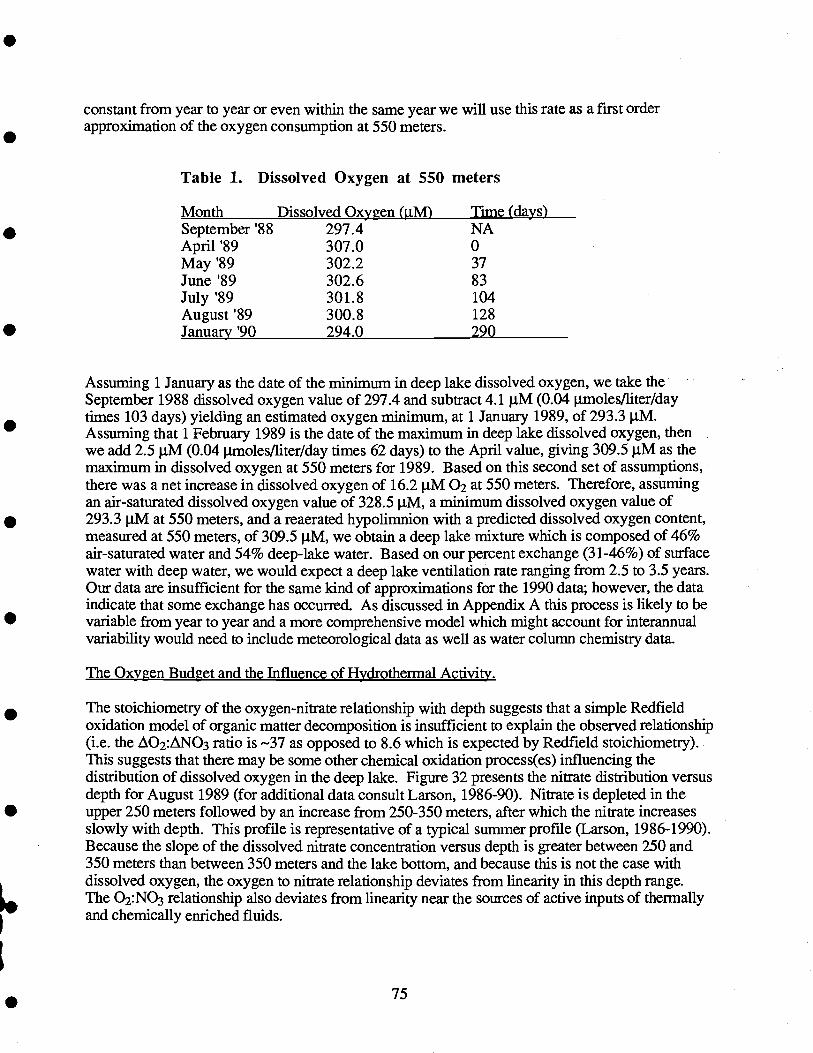
constant from year to year or even within the same year we will use this rate as a first orderapproximation of the oxygen consumption at 550 meters.
Table 1. Dissolved Oxygen at 550 meters
MonthSeptember '88April '89May '89June '89July '89August '89January '90
Dissolved Oxygen (pM)297.4307.0302.2302.6301.8300.8294.0
Assuming 1 January as the date of the minimum in deep lake dissolved oxygen, we take theSeptember 1988 dissolved oxygen value of 297.4 and subtract 4.1 p.M (0.04 p.moles/liter/daytimes 103 days) yielding an estimated oxygen minimum, at 1 January 1989, of 293.3 p.M.Assuming that 1 February 1989 is the date of the maximum in deep lake dissolved oxygen, thenwe add 2.5 p.M (0.04 p.moles/liter/day times 62 days) to the April value, giving 309.5 p.M as themaximum in dissolved oxygen at 550 meters for 1989. Based on this second set of assumptions,there was a net increase in dissolved oxygen of 16.2 p.M 02 at 550 meters. Therefore, assumingan air-saturated dissolved oxygen value of 328.5 p.M, a minimum dissolved oxygen value of293.3 p.M at 550 meters, and a reaerated hypolimnion with a predicted dissolved oxygen content,measured at 550 meters, of 309.5 p.M. we obtain a deep lake mixture which is composed of 46%air-saturated water and 54% deep-lake water. Based on our percent exchange (3 1-46%) of surfacewater with deep water, we would expect a deep lake ventilation rate ranging from 2.5 to 3.5 years.Our data are insufficient for the same kind of approximations for the 1990 data; however, the dataindicate that some exchange has occurred. As discussed in Appendix A this process is likely to bevariable from year to year and a more comprehensive model which might account for interannualvariability would need to include meteorological data as well as water column chemistry data.
The Oxygen Budget and the Influence of Hydrothermal Activity.
The stoichiometry of the oxygen-nitrate relationship with depth suggests that a simple Redfieldoxidation model of organic matter decomposition is insufficient to explain the observed relationship(i.e. the O2:ANO3 ratio is 37 as opposed to 8.6 which is expected by Redfield stoichiometry).This suggests that there may be some other chemical oxidation process(es) influencing thedistribution of dissolved oxygen in the deep lake. Figure 32 presents the nitrate distribution versusdepth for August 1989 (for additional data consult Larson, 198 6-90). Nitrate is depleted in theupper 250 meters followed by an increase from 250-350 meters, after which the nitrate increasesslowly with depth. This profile is representative of a typical summer profile (Larson, 1986-1990).Because the slope of the dissolved nitrate concentration versus depth is greater between 250 and350 meters than between 350 meters and the lake bottom, and because this is not the case withdissolved oxygen, the oxygen to nitrate relationship deviates from linearity in this depth range.The O2:NO3 relationship also deviates from linearity near the sources of active inputs of thermallyand chemically enriched fluids.
Time (days)NA03783104128290
75
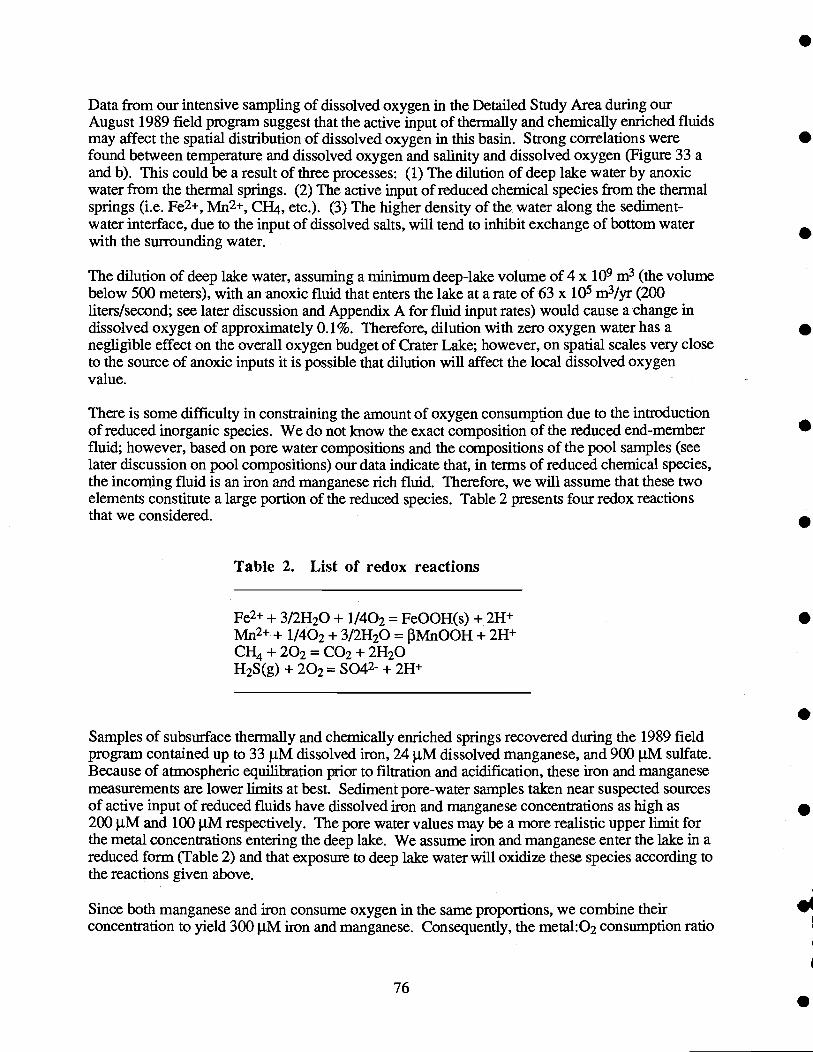
Data from our intensive sampling of dissolved oxygen in the Detailed Study Area during ourAugust 1989 field program suggest that the active input of thermally and chemically enriched fluidsmay affect the spatial distribution of dissolved oxygen in this basin. Strong correlations werefound between temperature and dissolved oxygen and salinity and dissolved oxygen (Figure 33 aand b). This could be a result of three processes: (1) The dilution of deep lake water by anoxicwater from the thermal springs. (2) The active input of reduced chemical species from the thermalsprings (i.e. Fe2+, Mn2+, CH4, etc.). (3) The higher density of the water along the sediment-water interface, due to the input of dissolved salts, wifi tend to inhibit exchange of bottom waterwith the surrounding water.
The dilution of deep lake water, assuming a minimum deep-lake volume of 4 x iO m3 (the volumebelow 500 meters), with an anoxic fluid that enters the lake at a rate of 63 x io m3/yr (200liters/second; see later discussion and Appendix A for fluid input rates) would cause a change indissolved oxygen of approximately 0.1%. Therefore, dilution with zero oxygen water has anegligible effect on the overall oxygen budget of Crater Lake; however, on spatial scales very closeto the source of anoxic inputs it is possible that dilution will affect the local dissolved oxygenvalue.
There is some difficulty in constraining the amount of oxygen consumption due to the introductionof reduced inorganic species. We do not know the exact composition of the reduced end-memberfluid; however, based on pore water compositions and the compositions of the pool samples (seelater discussion on pool compositions) our data indicate that, in terms of reduced chemical species,the incoming fluid is an iron and manganese rich fluid. Therefore, we will assume that these twoelements constitute a large portion of the reduced species. Table 2 presents four redox reactionsthat we considered.
Table 2. List of redox reactions
Fe2 + 3/2H20 + 1/402 = FeOOH(s) + 2H+ 1/402 + 3/2H20 = Mn00H + 2H
CH4 + 202 = CO2 + 2H20H2S(g) + 202 = S 042- +2W
Samples of subsurface thermally and chemically enriched springs recovered during the 1989 fieldprogram contained up to 33 .tM dissolved iron, 24 IIM dissolved manganese, and 900 jiM sulfate.Because of atmospheric equilibration prior to filtration and acidification, these iron and manganesemeasurements are lower limits at best. Sediment pore-water samples taken near suspected sourcesof active input of reduced fluids have dissolved iron and manganese concentrations as high as200 p.M and 100 jiM respectively. The pore water values may be a more realistic upper limit forthe metal concentrations entering the deep lake. We assume iron and manganese enter the lake in areduced form (Table 2) and that exposure to deep lake water wifi oxidize these species according tothe reactions given above.
Since both manganese and iron consume oxygen in the same proportions, we combine theirconcentration to yield 300 p.M iron and manganese. Consequently, the metal:02 consumption ratio
76
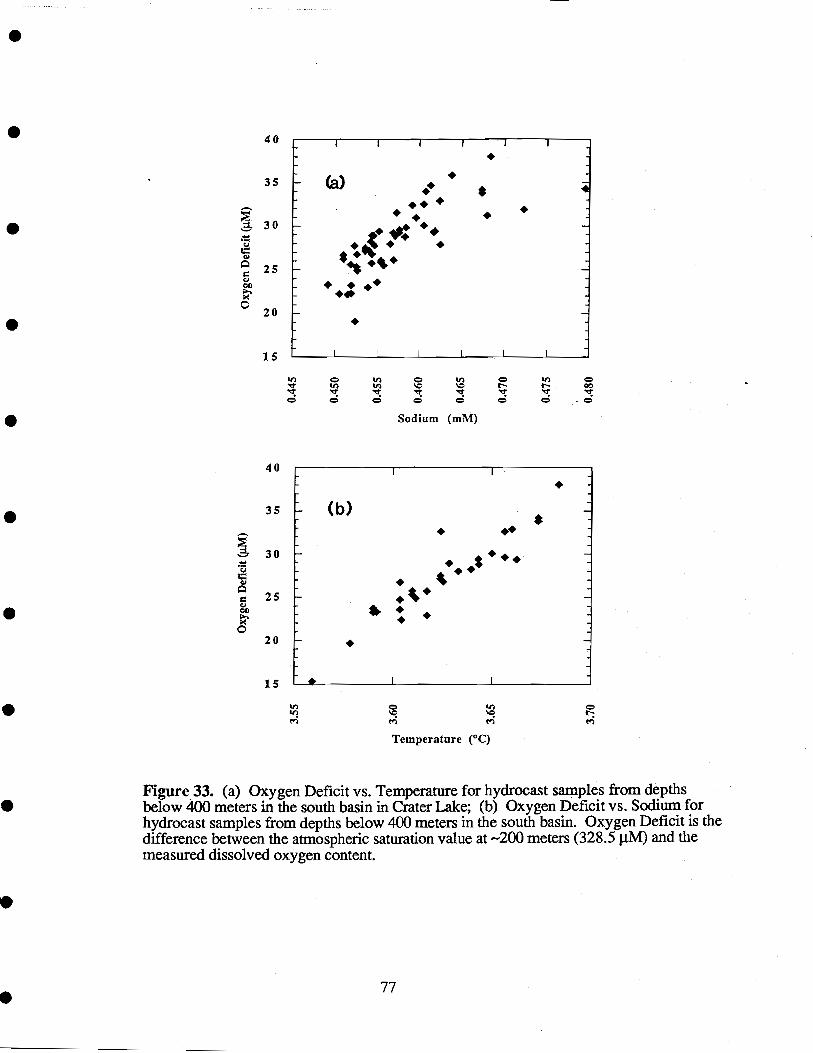
Temperature (°C)
Figure 33. (a) Oxygen Deficit vs. Temperature for hydrocast samples from depthsbelow 400 meters in the south basin in Crater Lake; (b) Oxygen Deficit vs. Sodium forhydrocast samples from depths below 400 meters in the south basin. Oxygen Deficit is thedifference between the atmospheric saturation value at 200 meters (328.5 tiM) and themeasured dissolved oxygen content.
40
35 (a).
.. *- . .=-
* .'.25
20 .15 I I I I
40
35
30
25
20
It)In InIt) 0. .0: '0:
Sodium (mM)
Int.-. 00
15
- (b)
*
is 4:1 which will require 75 j.iM 02 for the oxidation of 300 tM Fe and Mn. Hence, with a fluidinput rate of 63 x 108 liters/year, the Fe and Mn will consume 4.7 x 10¹¹ limoles of 0/year. Inthe deep lake (volume equivalent to a depth > 500 meters) this corresponds to a consumption of0.12 iM 02 per year. Therefore, iron and manganese account for between 2 and 5% of themeasured change in dissolved oxygen of the deep lake.
Although sulfate measured in the pool samples and the pore waters was found to be as high as900 j.tM, we do not expect that all the dissolved sulfate in the lake entered the lake as H2S(g). Tworeasons for suspecting that H2S(g) is not the primary sulfur species are: (1) The oxidation ofH2S(g) generates one mole of H for every mole of 02 consumed but the pH of the deep lake andthe pore waters is generally too close to neutral (between 6 and 8) for this reaction to be occurring.(2) There was no strong characteristic sulfide odor and even at H2S(g) concentrations <10 pM wewould be able to smell the sulfides in the pore waters and in the pool samples.
We have only a few methane samples to constrain the input of this constituent. Our results indicatethat the deep water column methane concentration is between 10 and 30 nM; likewise, divesamples CD215 Si, CD215 S2, CD216 Si and CD216 S2 ranged between 8 and 23 nM. Waterimmediately above a box core from a pool had approximately 6 pM methane, indicating that thereis some methane present in the reduced fluid.
Assuming concentrations of 10 p.M for HS(g) and CIT4. and assuming a consumptionstoichiometry of 2 moles of 02 for each mole of H2S(g) and CH4 (Table 2), then 40 p.M 02 will beconsumed by the incoming fluid. From the mass balance arguments above, this wifi be less than2% of the total oxygen deficit.
Circumstantial evidence suggests that the oxygen budget is dominated by the oxidation of organicmatter. This conclusion is largely based on the observation of a linear dissolved oxygen to nitraterelationship in the deep lake and on the observation that the active input of reduced fluids cannotaccount for the observed change in deep lake oxygen. It is beyond our data set to reconcile thediscrepancy between the observed O2:,NO3 relationship and that predicted based on a traditionalstoichiometric relationship. There are two distinct possibilities which could explain our inability tobalance the 02 budget: (1) The O2:ANO3 relationship in Crater Lake is not defined by atraditional 'Redfield' stoichiometric model. (2) We may have drastically underestimated theconcentration of reduced species entering the lake.
Small-Scale Variations in Bottom Water 0 Distribution.
The greater depletion of dissolved oxygen near the sediment-water interface in the South Basincompared to the North Basin may be due to a combination of density effects and local oxygenconsumption. Correlations between temperature and salinity with the oxygen deficit suggest adependence of the oxygen deficit on the active input of saline fluids (Figure 33). As mentionedabove, these fluids have enhanced concentrations of reduced chemical species which consumesome of the dissolved oxygen in the South Basin. Also, the dilution of deep lake water by anoxicwater may cause a net lowering of the dissolved oxygen content very close to the fluid source. Anadditional influence that these fluids have on the distribution of dissolved oxygen is to increase thestability (density) of near-bottom waters by addition of salts. Consequently, the consumption ofoxygen due to the decomposition of organic matter and the local input of reduced fluids canproceed to a greater degree in fluids nearer the source than in bulk deep-lake waters.
78
.
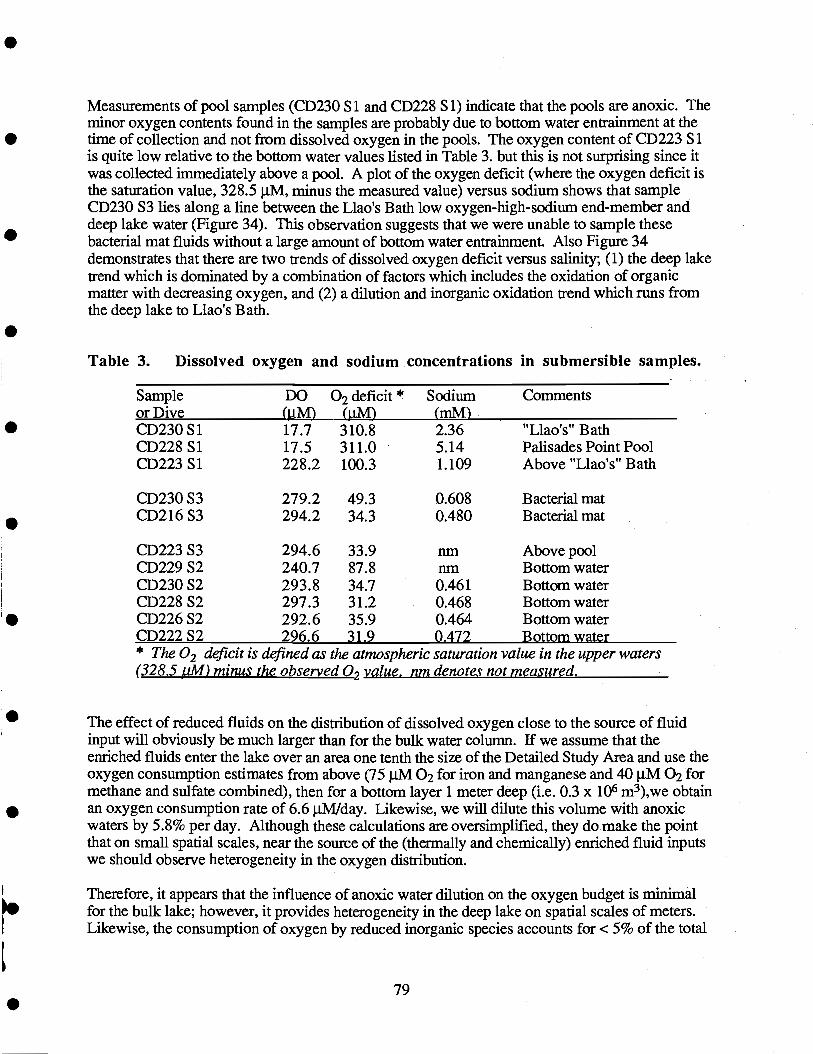
Measurements of pool samples (CD230 Si and CD228 Si) indicate that the pools are anoxic. Theminor oxygen contents found in the samples are probably due to bottom water entrainment at thetime of collection and not from dissolved oxygen in the pools. The oxygen content of CD223 Siis quite low relative to the bottom water values listed in Table 3. but this is not surprising since itwas collected immediately above a pool. A plot of the oxygen deficit (where the oxygen deficit isthe saturation value, 328.5 jiM, minus the measured value) versus sodium shows that sampleCD230 S3 lies along a line between the Llao's Bath low oxygen-high-sodium end-member anddeep lake water (Figure 34). This observation suggests that we were unable to sample thesebacterial mat fluids without a large amount of bottom water entrainment. Also Figure 34demonstrates that there are two trends of dissolved oxygen deficit versus salinity; (1) the deep laketrend which is dominated by a combination of factors which includes the oxidation of organicmatter with decreasing oxygen, and (2) a dilution and inorganic oxidation trend which runs fromthe deep lake to Llao's Bath.
Table 3. Dissolved oxygen and sodium concentrations in submersible samples.
.
* The °2 deficit is dej(328.5 jtM) minus the
med as the atmosphericobserved °2 value. nm
79
saturation value in the upper watersdenotes not measured.
The effect of reduced fluids on the distribution of dissolved oxygen close to the source of fluidinput will obviously be much larger than for the bulk water column. If we assume that theenriched fluids enter the lake over an area one tenth the size of the Detailed Study Area and use theoxygen consumption estimates from above (75 jiM 02 for iron and manganese and 40 p.M 02 formethane and sulfate combined), then for a bottom layer 1 meter deep (i.e. 0.3 x 10⁶ m3),we obtainan oxygen consumption rate of 6.6 p.M/day. Likewise, we will dilute this volume with anoxicwaters by 5.8% per day. Although these calculations are oversimplified, they do make the pointthat on small spatial scales, near the source of the (thermally and chemically) enriched fluid inputswe should observe heterogeneity in the oxygen distribution.
Therefore, it appears that the influence of anoxic water dilution on the oxygen budget is minimalfor the bulk lake; however, it provides heterogeneity in the deep lake on spatial scales of meters.Likewise, the consumption of oxygen by reduced inorganic species accounts for <5% of the total
Sampleor Dive
DO 02 deficit *(j.tM') (jiM
Sodium(mM)
Comments
CD230 Si 17.7 310.8 2.36 "Llao's" BathCD228 Si 17.5 311.0 5.14 Palisades Point PoolCD223 Si 228.2 100.3 1.109 Above "Llao's" Bath
CD230 S3 279.2 49.3 0.608 Bacterial matCD216 S3 294.2 34.3 0.480 Bacterial mat
CD223 S3 294.6 33.9 nm Above poolCD229 S2 240.7 87.8 nm Bottom waterCD230 S2 293.8 34.7 0.461 Bottom waterCD228 S2 297.3 31.2 0.468 Bottom waterCD226 S2 292.6 35.9 0.464 Bottom waterCD222 S2 296.6 31.9 0.472 Bottom water
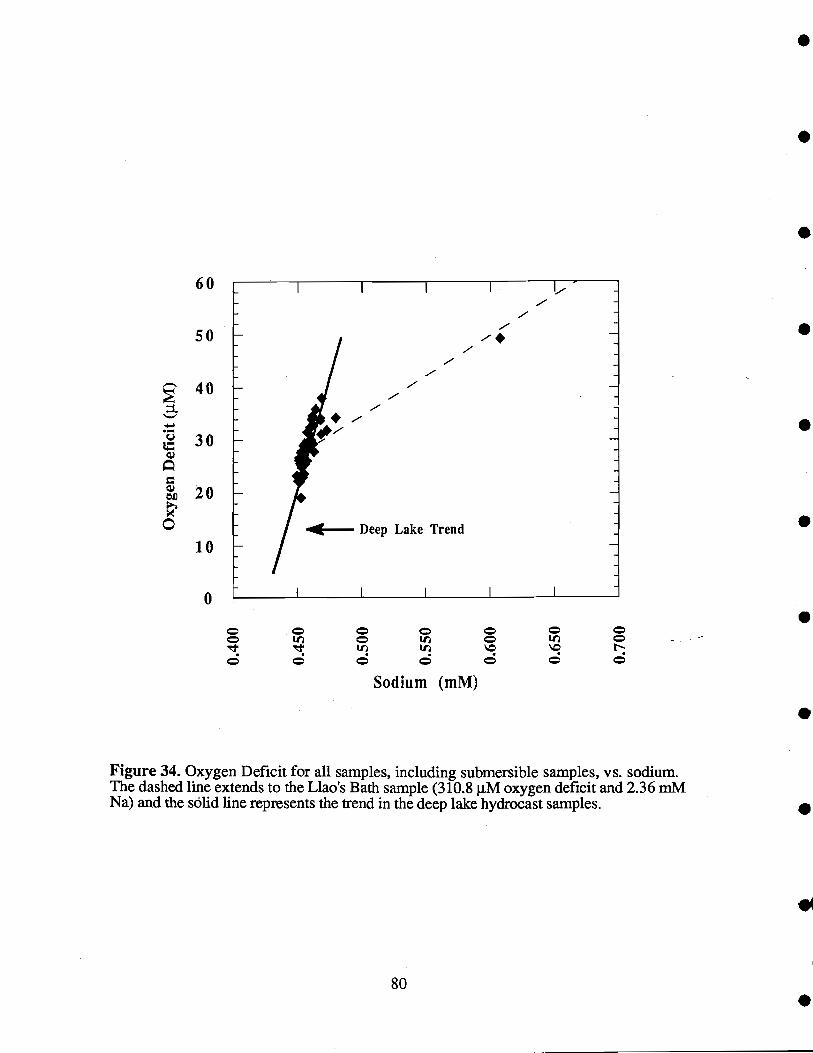
60
50
40
30
20
10
80
Lfltn N
Sodium (mM)
Figure 34. Oxygen Deficit for all samples, including submersible samples, vs. sodium.The dashed line extends to the Llao's Bath sample (310.8 tM oxygen deficit and 2.36 mMNa) and the solid line represents the trend in the deep lake hydrocast samples.

consumption for the bulk lake, although, it is probably greater on local scales in the South Basin.In accord with this concept, the dissolved oxygen content for the deep north basin (NPS station13) at the time Table 3 samples were collected was approximately 300 1iM whereas in the SouthBasin the values were 5 to 15 tM lower. This suggests that the active inputs of thermally andchemically enriched fluids may not be influencing the waters of the deeper north basin to the samedegree as the South Basin, again consistent with the South Basin being the dominant source ofreduce saline fluids. Ultimately, the stabilizing force provided by denser bottom waters causes theeffectiveness of deep lake mixing to decrease with depth, which is consistent with the mixingmodels presented in Appendix A and the ages of deep water as revealed through CFC data(Appendix G). For 1989-1990 this mixing corresponded to an effective exchange of surface (well-aerated water) with deep water of approximately 40%. If this exchange was consistent from yearto year, it would take 2.5 to 3.5 years to ventilate the deep lake.
111.7. Radon-222
One of the most effective tracers of hydrothermal input to the oceans has been 222Rii, a daughterproduct of 238U decay. Radon, like helium, is a noble gas, which means that it does not enter intochemical reactions during its movement through geochemical systems. Because of its relativelyshort half-life (3.8 days) measurements are made at sea to give real-time data (Rosenberg et al.,1988). Although hydrothermal fluids are strongly enriched in 222Rii over normal ocean waters(Dymond et al., 1983), it is not an unequivocal indicator of hydrothermal inputs because there areother sources of the isotope. Diffusive inputs from sediments can be a significant source of 222Rn(Broecker et al., 1968; Kadko, 1981). In addition, 222p is enriched in all ground waters, thermalor non-thermal, as a result of ct-recoil injection from the surfaces of uranium-bearing solids(Asikainen, 1981). Consequently, in the analyses of Crater Lake waters, this tracer can notdistinguish between hydrothermal and non-thermal ground water inputs.
Despite these complicating factors, measurement of this isotope is important because the 3.8 dayhalf life adds a temporal component that does not exist with nonradioactive tracers. One possibleanalytical technique is the evaluation of variability in the 222RnPHe values, which because bothisotopes are noble gases, should decrease according to the radon half life upon injection intobottom water. If there is input of hydrothermal fluid into the deep lake, the rates of dispersioncould be evaluated by studies of this isotope pair (Kadko et al.,1990). Similarly, 222RnfNa can beused as a nonreactive pair. Our previous studies have demonstrated that Na and 3He contents ofthe deep lake waters are correlated. Consequently, it is reasonable to expect that 222Rn and Na willbe venting into the lake at a constant ratio which will decay with the 3.8 day half life of 222Rri.
In addition, the radioactive decay of 2Rn is useful for estimating the flux of hydrothermalelements and heat into the lake. Estimates of the total inventory of 222R.n within the lake can beused to determine the flux of radon into the lake. A similar approach has been used to define thehydrothermal input of radon and other tracers at a major hydrothermal system on the Juan de FucaRidge (Rosenberg et al., 1988).
In Figure 35, we have plotted measured 222Rn contents of Crater Lake as a function of samplingdepth. The data include only samples recovered during 1989; however, all previous radonmeasurements of the water column resulted in a similar pattern (Collier and Dymond., 1989). Thesignificant features of this plot are the high values that occur between 400 and 470 meters depth.Above and below this depth, the radon contents decrease to the values expected from the decay of
81
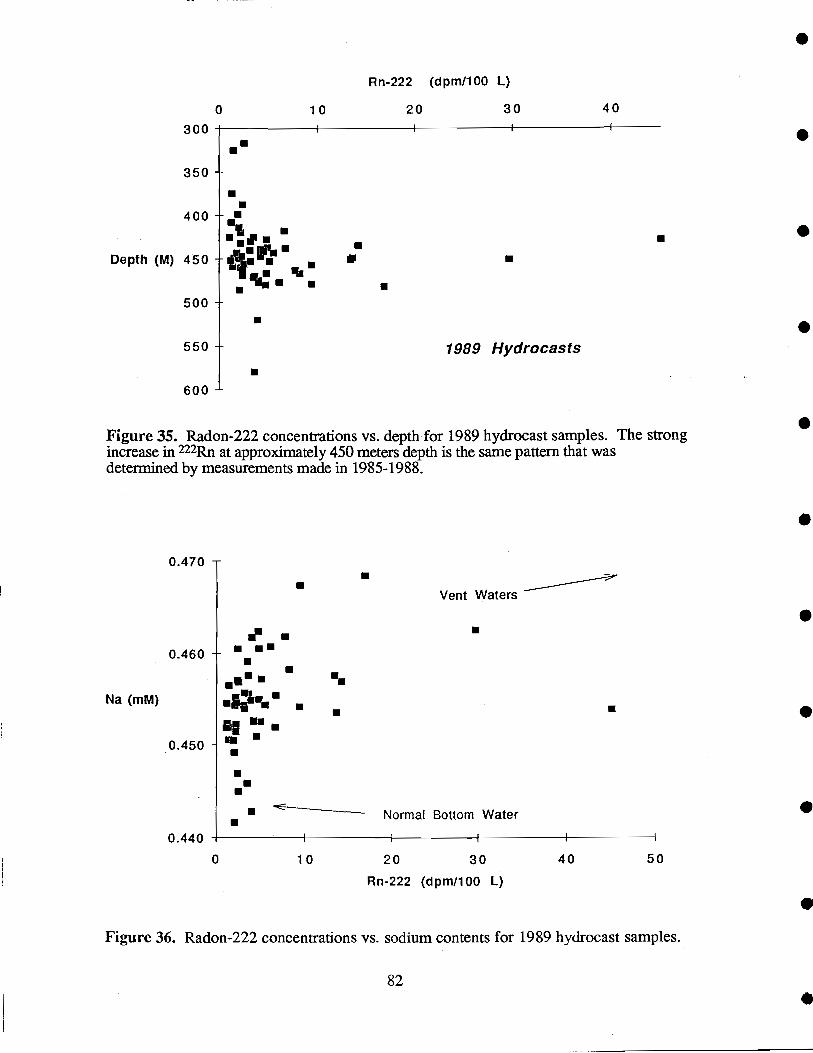
Na (mM)
300aa
350 -
0.460
0.450
0
U
550 1989 Hydrocastsa
600 -
Figure 35. Radon-222 concentrations vs. depth for 1989 hydrocast samples. The strongincrease in 222Rii at approximately 450 meters depth is the same pattern that wasdetermined by measurements made in 1985-1988.
0.470
U
a aU a
aU
aaa
10 20 30 40
a
Rn-222 (dpm/100 1)
82
Vent Waters
a
a
UU Normal Bottom Water
0.440
0 10 20 30 40 50
Rn-222 (dpm/100 L)
Figure 36. Radon-222 concentrations vs. sodium contents for 1989 hydrocast samples.
a400
a.l. Ua
Depth (M) 450 I a
U a500 -
aa
a
dissolved radium-226 (226Ra). The depth maximum for 222Rn is consistent with sources thatoccur at approximately 450 meters depth. Radium-226 was measured on selected samples in orderto defme the amount of 222Rn supplied by the decay of this parent isotope. Because of the lowvalues of radium in the lake waters, its measurement by in-growth of 222Rn (Mathieu, 1977) isrelatively imprecise. Bottle blanks in general have on the order of 50% of the measured activity,and the overall counting errors are large. Thus, within our precision, the radium content of thehydrocast samples appears to be constant everywhere in the lake. The mean 2Ra for 15 watercolumn samples is 2.4±1.3 dpm/100 liters. This value is similar to the lowest 222Rii valuesmeasured in our water samples. Decay rates of 226Ra as low as 1.1 dpm/100 liters were measuredon several samples, and we suspect this is the best estimate for the radium-supported 222Rii.Consequently, the high 222pj values which occur between 400 and 470m are clearly not the resultof decay of dissolved 226Ra.
The diffusive inputs of radon from sediment pore waters to the bottom waters appear to be small.This is demonstrated by the fact that near-bottom samples from the North Basin do not have 222Rivalues that are significantly above values supported by the decay of 226Ra. Since both the NorthBasin and the South Basin are covered with sediment, similar rates of 222Rji diffusion are expectedin each area unless the sediments in the South Basin are strongly enriched in radium compared tothose in the North Basin. Although we have not measured the radium contents of the lakesediments, the major-element abundances and some minor-element abundances in sediments fromthe two basins are essentially identical, except for some very localized areas of the South Basinwhich are strongly enriched in iron and believed to be influenced by precipitation fromhydrothermal fluids (Dymond et al., 1987).
In addition, we experimentally determined the radon diffusion rates from cores collected in the twobasins, following the procedures of Kadko (1981). A sealed core of the sediment and theoverlying waters was stripped of its 222pm contents after 5 to 9 days. The 222Rii values measuredin this way were close to detection limits for cores from both the North and South Basins, andtherefore, sediment sources cannot account for the high values measured in the water-columnsamples from some areas of the South Basin.
The 222Rn /Na values measured in the hydrocast samples vary strongly (Figure 36). Thesevariations can be accounted for by time-dependent mixing of lake waters which have a significantcomponent of fluids with a subsurface origin. The samples with the lowest Na and 222Rii valuesrepresent the normal lake bottom waters which do not have a strong signal from a bottom source(hydrothermal or cold springs). Conversely, samples enriched in Na and 222Rn show evidence forsuch a source. Rapid mixing of these two sources would result in a linear array of data points.The observed data, however, has a strong curvature, which is a consequence of 222Pi decayduring the mixing process.
Estimates of Radon-222 Inventory.
During the submersible operations in August 1990, 13 hydrocasts were made within the SouthBasin Detailed Study Area. At each station, radon samples were obtained from the three to five 30-liter water samples collected within the bottom 150 meters. Radon measurements of these samplesresult in a near-bottom profile of 222Rn (Figure 37). From this profile, we have computed theintegrated radon at each sampling site. A map of the integrated 222Rn contours is shown in Figure38. The integrated 222pj was computed by assuming a background 226Ra-supported value of1.1 dpm/100 liters. The measured values were extrapolated to this background value and to the
83
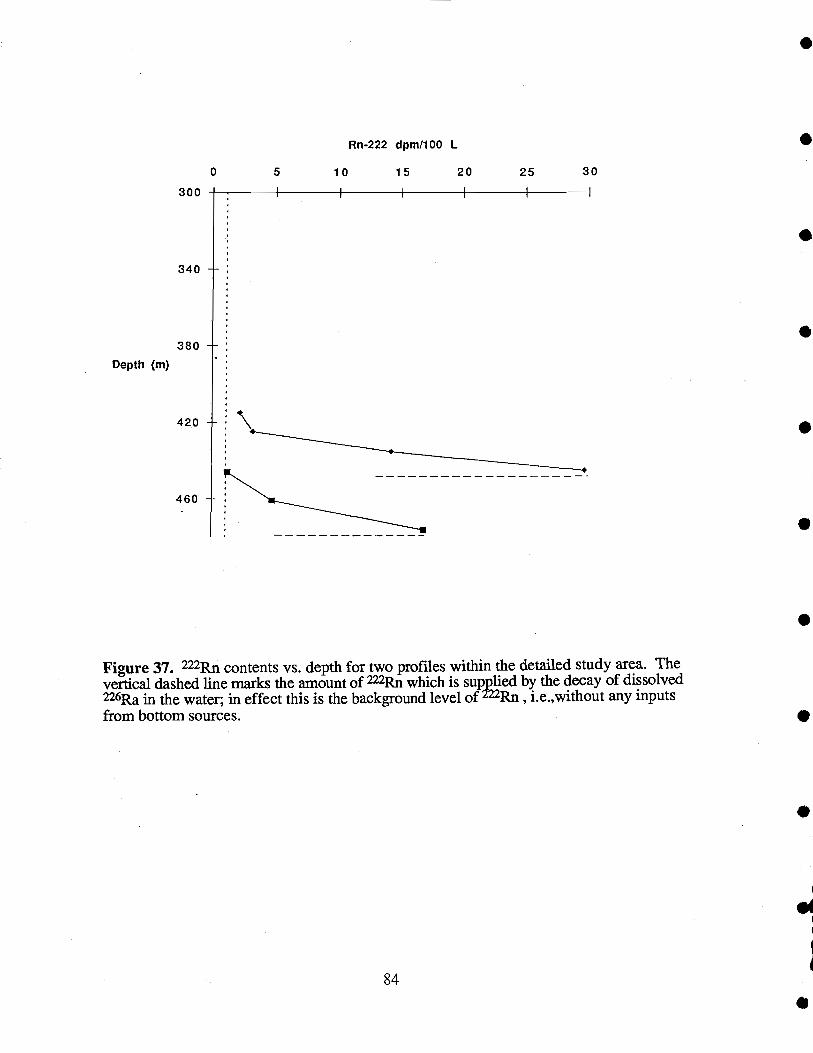
300
340 -
280 -Depth (m)
420 -
0
460 -
5 10 15 20 25 30
Rn-222 dpmIlOO I
Figure 37. 222Rn contents vs. depth for two profiles within the detailed study area. Thevertical dashed line marks the amount of 2Rn which is supplied by the decay of dissolved226Ra in the water; in effect this is the background level of mRn , i.e.,without any inputsfrom bottom sources.
84
S
S
S
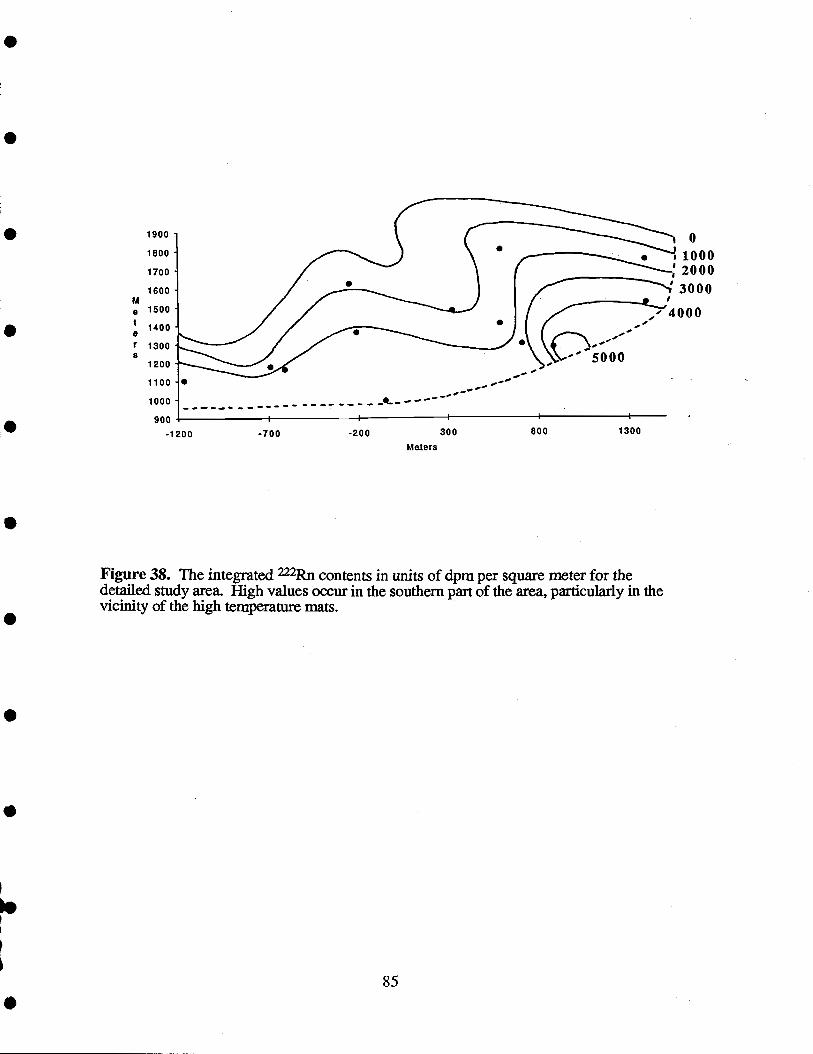
M
e
er$
1900
1800 -
1700
1600 -
1500
1400
1300
1200
1100 -
1000 -
900
-1200 -700 -200
I-
85
Maters
Figure 38. The integrated 2Rn contents in units of dpm per square meter for thedetailed study area. High values occur in the southern part of the area, particularly in thevicinity of the high temperature mats.
300 800
c'\ _---'----5000
1300
3000
depth of the bottom. In general, at depths shallower than 400 meters, the 222pj is derived solelyfrom the decay of 226Ra.
The results of these calculations indicate that the integrated 2Rn values from the sampling sitesvary by more than a factor of five (Figure 38). There is a general south to north decrease in theintegrated 222R contents across the sampled area. Unfortunately, our sampling pattern did notextend far enough to the south to defme the southern extent of the high values. The two highestvalues are both from relatively shallow sites located on the slopes of the presumed landslide/debrisflow that occurs on the southern margin of the Detailed Study Area. From the contoured values ofintegrated radon we have computed the total radon inventory of the area to be 1.7 x iO dpm.Assuming the computed inventory is maintained by continuous inputs, the value also represents thenumber of radon atoms which are injected into the area from all sources each minute. It is difficultto define the errors in this estimate, but the constraints on the contouring suggest that it represents aminimum value for the 222R inventory. The contouring is well constrained within the samplinglocations, however, we have not made broadly spaced measurements on the margins of the detailedsurvey area that allow us to estimate the extent of the area with low integrated 222Rn values. Thelack of broader sampling is particularly problematic for the southern part of our survey, where wehave not constrained the full extent of the areas with the highest integrated radon values.Extending the boundaries of areas with excess radon would have resulted in a larger 2Rninventory.
If we assume the 222pj flux comes from a fluid source with a radon content equivalent to thehighest value that we measured in any of our hydrocasts (45 dpm/100 liters), an influx of 8000liters per sec of fluid would be required. This number is approximately an order of magnitudehigher than the estimates for hydrothermal fluxes of Reilly et al. (1989) and Nathenson (1990a).As will be discussed below, the samples collected from near bacterial mats and from saline poolshave radon contents 100-200 times higher than our most enriched hydrocast samples. If input ofmat and pool fluids dominates the radon flux, the required volume of fluid input would be reducedcorrespondingly (to as low as 40 liters/sec).
Radon and Radium in Submersible Samples.
Because the submersible provides the ability to position samples near the bottom and in knownrelationship to sites of venting, the 2flpj measurements collected in this way are much higher thanthose collected with surface hydrocasts. The 1988 submersible samples collected near a bacterialmat extended the amount of 222Pm enrichment observed in the detailed study by more than a factorof six (approximately 200 dpm/100 liters) over our earlier data. The 1989 submersible programcollected a number samples with even higher 222Ri contents (Appendix I).
The most enriched samples were found in the pools. Two samples from Llao's Bath differed bymore than a factor of three (9961 and 3063 dpm/100 liters); however, the higher value wascollected by pumping fluid into a sampler. This sampling procedure should have less bottom waterdilution and therefore provides a better measure of the poo1 composition. This assertion issupported by the higher major element concentrations in the pumped sample.
Samples collected by the submersible in the vicinity of bacterial mats were also strongly enriched in222pii with values ranging from 373 to 1887 dpm/100 liters. Since the highest values generallycorrelate with Na and other major element contents, this range probably represents varying degrees
86
of dilution. However, the mixing of mat water with older deep lake waters whose 2Rn contentshave decayed would result in lower 2Rn contents and lower 222Rn /Na values.
Radon-222 Constraints on Pool Formation and Exchange Rates.
It is noteworthy that the Palisades Point pool sample, which was also collected by pumping, has15 times lower 222p content than Llao's Bath. Because there is evidence that the Palisades Pointpools fill by gravity flow from variable distances upsiope, it is tempting to account for the low222Rn through mixing with normal lake waters. The concentrations of sodium and other majorelements in the Palisades Point pool, however, are approximately two times higher than thosemeasured in Llao's Bath (Figure 39), indicating that mixing alone cannot account for theirrelatively low 222Rii contents.
It is possible that the difference in 222Rn contents between the Llaos Bath brines and the PalisadesPoint brines reflects a greater mean age of the Palisades point water. For example, if the PalisadesPoint pool had the same initial 222Rn that we measured in Llao's Bath, our data coupled with the3.8-day half-life imply that the Palisades Point pool water has a mean age approximately 15 daysolder than Llao's Bath. This difference in mean age could be a consequence of either time-variableinputs which fill the two pools episodically or continuous fill which results in lower steady-stateconcentrations of 222Pi in the Palisades Point pool.
To evaluate either case, it is necessary to have an estimate of the 2Rn content of the fluid whichenters the pool. The content of 222Rn in any ground water (thermal or non-thermal) is largelycontrolled by the uranium content of the rock which is in contact with the water. The time since thewater has been isolated from atmospheric exchange (degassing) as little effect. This follows fromthe fact that the relatively short half life of 222Rn results in rapid achievement of a balance betweeninput from recoil and loss by decay (Dymond et al., 1983). Although we cannot unequivocallydefine the initial values for the pool waters, we can provide some reasonable estimates from whichto compute the maximum ages for waters in Llao's Bath. Radon-222 measurements of Annie. Springs, a major spring near the southern border of the Park, may provide a good estimate ofsubsurface waters from the Cascades. Six measurements made in 1988 averaged 93,000 ± 34,000dpm/100 liters. We suspect the variation reflects sampling artifacts caused by atmosphericexchange. Consequently, the highest value measured, 140,000 dpm/100 liters, is probably thebest estimate. Ground water values of 222pj as large as 106 dpm/100 liters have been measured inarkosic aquifers (Krishnaswami et al., 1982), which undoubtedly have much higher uraniumcontents than Cascade volcanics. Accepting the Annie Springs' 222Rn measurements as an initial222pm value would mean that Llao's Bath waters are less than 15 days old. Even a value of 106dpm/100 liters, clearly a conservative estimate, would require the Llao's Bath waters to be lessthan 30 days old. These estimates are upper limits to the age of Llao's Bath fluids. As we statedin the previous paragraph, this episodic input model would imply that Palisades Point water filledwithin 30 to 45 days prior to sampling. The fluids entering the pool could have lower radoncontents if there had been mixing of lake water with the fluids prior to entering the pool.
In contrast, for a continuous input model, the 222Rn content of the pool can be described as abalance between input and decay plus outflow:
(R1 x Cj) = (R, x C0) + D
87
where R1 and R0 equal the rate of fluid input and output respectively. At steady state these rates areequal. C1 and C0 are the concentrations of 222n in the inflowing and outflowing waters. The lastterm in the equation, D, is the loss of 222Rn by radioactive decay. To determine the decay loss of222Rii it is necessary to determine the total inventory of 222p in the pool. This requires anestimate of the volume of the pooL We estimate the dimensions of the pool to be 3 to 4 meterslong and 1 to 1.5 meters wide. Although we could not see the bottom, based on the slopes of thepool margins, we estimate the average depth at 0.5 to 1.0 meters. These dimensions suggest thatthe pool contains 1500 to 4000 liters of fluid. We measured 100 dpm/1 (i.e. 10,000 dpm/100 L) of222Pm in Llao's Bath. Thus, the total inventory of radon in the bath is 1.5 x 10 to 6 x io dpm,which is the number of atoms lost from the pool each minute due to decay. Substituting theseestimates and R1 for R0 and rearranging, the above equation becomes:
R1 = (1.5 x 10 to 6 x 10 dpm) / (C1 - C0)
We assume that the 222Rn activity of the inlet fluid is the same as that measured at Annie Springs(1400 dpm/1), and that of the outlet is the measured activity in the pool (100 dpm/l). Thus, theequation solution indicates an inflow rate of 15 to 60 ml per minute. Although a similar calculationfor the Palisades Point pool could be made, the highly irregular shape of that pool precludes asufficiently accurate estimate of the volume to make such a calculation worthwhile. Nonetheless,we can say that if continuous input of fluid results in the lower 222Rii measured in the PalisadesPoint pool, the ratio of pool volume to fluid input must be higher in this pool compared to Llao'sBath.
A major implication of the estimated inflow/outflow rate for Llao's Bath is that it is sufficientlyslow that the flow probably could not be visually observed. The rate is also approximately 10times smaller than previous estimates of the fluid inputs from geothermal sources to the lake(Sorey, 1985; Nathenson, 1990a). Thus, the estimated continuous inflow to Llao's Bath could notbe a significant contribution to the salt balance that is required in these models. It is probable,however, that Llao's Bath is only a small fraction of the total reservoir of saline fluids which makeup the Llao's Bath/Brain Mat complex. Samples of fluids from pools within the Brain Mat havesalt contents very similar to Llao's Bath; it is possible that the general area is underlain by a salinereservoir of fluids with high salt content and that Llao's Bath is one of the larger extrusions of thatreservoir. If this is the case, the 222Ri inventory and the flow rate required to maintain thatinventory would be correspondingly larger.
There is no firm basis for choosing between the episodic and continuous input models. Becausewe have no physical models that explain episodic inflow, continuous flow seems inherently moresatisfactory. Nonetheless, we did observe flow channels entering the Palisades Point pools. Sinceno flow could be observed in these channels during our submersible dives, these features suggestthat the flow is episodic or has very recently ceased. Perhaps only through time-seriesmeasurements of temperature and salt content at the pools can we resolve the process which bringsthe salty fluid into the pools.
Determination of 222Rn/3He values provides some estimate of the relative ages of different watersamples. These values range from 1.5 to 9.8 x io dpm/cm3 in samples taken from pools andmats to values from 0.1 to 0.25 x iO dpm/cm3 in South Basin bottom water. This range may bedue to heterogeneity of source, to mixing between venting fluids and "older't lake waters, or toaging effects of pool waters. The low bottom water ratios are easily explained by advection andthe mixing of venting fluids. All three factors, however, could influence the ratios measured in
88
pools and mats. It may be significant that the highest ratio was observed in a bacterial mat sample.It is possible that the mats have a more vigorous input of crustal fluid sources, whereas slowerpooi fluid inputs result in a significantly longer residence time to produce measurable decay of222Rii. A mean age of approximately 10 days longer for the pools would account for thedifference in the 222Rn/He values measured in mats and pools.
Radium-226 Measurements.
Radium-226 values of submersible samples vaiy by more than a factor of 500 (1.5 to 877 dpm/l00L). The lowest values are similar to the background lake values of 2Ra (approximately 1.1dpm/lOO L). The high radium values may be significant with regard to the question of whether themat and pool samples have a geothermal origin. Unlike 222P,n, it is generally thought that 226Rconcentrations in geothermal fluids reflect high-temperature alteration of rocks by the fluids and nota-decay (Krishnaswantl and Turekian 1982; Dymond et al. 1983). In this regard, radium issimilar to its chemical analogue, barium it is well known that Ba is readily leached from rocks byhydrothermal solutions (Mottl and Holland, 1978). Thus, the very high 226Ra values indicatefluids modified by high temperature water-rock interactions.
Nonetheless, the few barium measurements on submersible samples suggest that the extent ofradium enrichment indicated by our data is excessive. Figure 40 suggests that samples collected atbacterial mats have high 226Ra and relatively low Ba contents. In contrast, samples collected fromthe pools have high barium contents and relatively low 226Ra contents. Because these elements areexpected to have similar geochemical behavior, we believe the high 226P,ii in the pools is asampling artifact. Submersible samples of mat fluids often contain large quantities of bacterialmaterial. While the fluid samples are filtered for the barium analyses, filtration of the largersamples required for radium analyses is not feasible. Consequently, it is possible that bacterial matsolids within the samples chosen for 2Ra provide a significant contribution to what we haveassumed to be the dissolved 226P content. Because the pool samples are relatively free ofparticulate debris, their contribution to the 226Ra contents is small. Consequently, we suspect thatthe pooi enrichments of 226Ra, which are a factor of 50 to 100 over background lake values aremore representative of the enrichments from vent sources on the bottom.
111.8. Lakefloor Temperature Data
Submersible Temperature Probe.
As discussed in the Methods Section, we used a temperature probe attached to the starboardmanipulator to determine the internal temperatures of sediments, mats, and pools. Variations intemperature with depth inside these features were determined using three thermistors containedwithin the probe; these thermistors were 20 cm apart. Because of uncertainties in the depth of theprobe penetration, these measurements are not particularly useful for estimating the rates ofadvection of fluids. In some cases the probe encountered hard layers or rocks and could not beinserted the full 60 centimeters. Sometimes, particularly for the bacterial mats, the surfaces wereso soft that over-penetration of up to 10 centimeters occurred. Whenever possible, the voice logsand the video record of the operation were used to correct the depth of insertion.
While the absolute depth of the temperature measurement has an uncertainty, the distance betweentemperature measurements is fixed (20 centimeters). However, even the thermal gradients
0
89
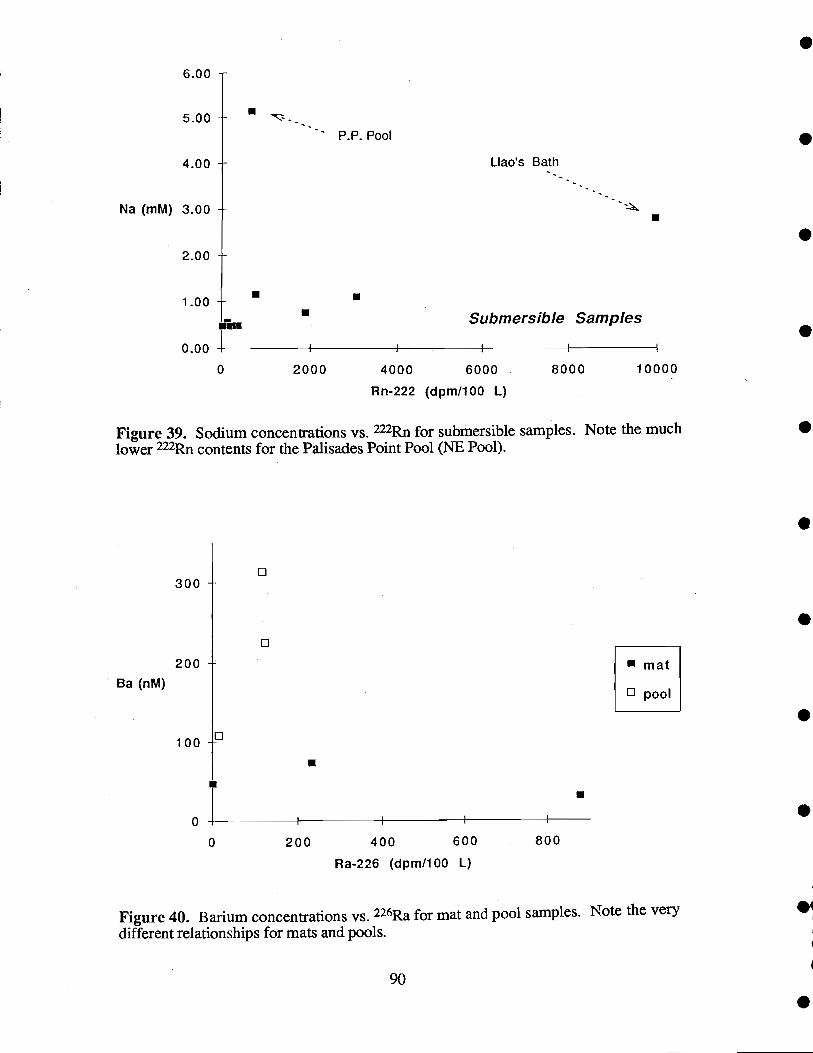
U
1 1 I
0 200 400 600 800
Ra-226 (dpm/100 L)
Figure 40. Barium concentrations vs. 226Ra for mat and pool samples. Note the verydifferent relationships for mats and pools.
90
U
Ba (nM)
300
200
100 D
a
0mat
0 pool
6.00 -
5.00 U-- P.P. Pool
4.00 - Llaos Bath
Na (mM) 3.00 -U
2.00 -
1.00 - U U
U Submersible SamplesuuI0.00
0 2000 4000 6000 8000 10000
Rn-222 (dpm/100 L)
Figure 39. Sodium concentrations vs. 222Rn for submersible samples. Note the muchlower 222p contents for the Palisades Point Pool (NE Pool).
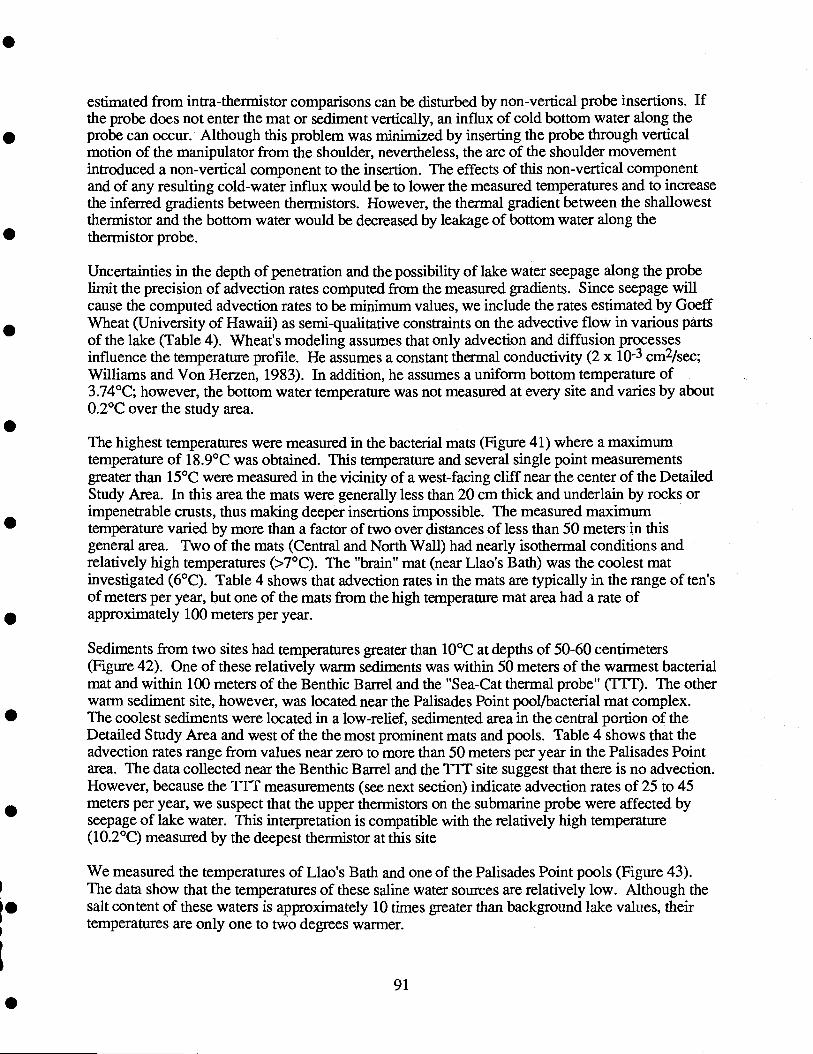
estimated from intra-thermistor comparisons can be disturbed by non-vertical probe insertions. Ifthe probe does not enter the mat or sediment vertically, an influx of cold bottom water along theprobe can occur. Although this problem was minimized by inserting the probe through verticalmotion of the manipulator from the shoulder, nevertheless, the arc of the shoulder movementintroduced a non-vertical component to the insertion. The effects of this non-vertical componentand of any resulting cold-water influx would be to lower the measured temperatures and to increasethe inferred gradients between thermistors. However, the thermal gradient between the shallowestthermistor and the bottom water would be decreased by leakage of bottom water along thethermistor probe.
Uncertainties in the depth of penetration and the possibility of lake water seepage along the probelimit the precision of advection rates computed from the measured gradients. Since seepage willcause the computed advection rates to be minimum values, we include the rates estimated by GoeffWheat (University of Hawaii) as semi-qualitative constraints on the advective flow in various partsof the lake (Table 4). Wheat's modeling assumes that only advection and diffusion processesinfluence the temperature profile. He assumes a constant thermal conductivity (2 x i0- cm2/sec;Williams and Von Herzen, 1983). In addition, he assumes a uniform bottom temperature of3.74°C; however, the bottom water temperature was not measured at every site and varies by about0.2°C over the study area.
The highest temperatures were measured in the bacterial mats (Figure 41) where a maximumtemperature of 18.9°C was obtained. This temperature and several single point measurementsgreater than 15°C were measured in the vicinity of a west-facing cliff near the center of the DetiiledStudy Area. In this area the mats were generally less than 20 cm thick and underlain by rocks orimpenetrable crusts, thus making deeper insertions impossible. The measured maximumtemperature varied by more than a factor of two over distances of less than 50 meters in thisgeneral area. Two of the mats (Central and North Wall) had nearly isothermal conditions andrelatively high temperatures (>7°C). The "brain" mat (near Llao's Bath) was the coolest matinvestigated (6°C). Table 4 shows that advection rates in the mats are typically in the range of ten'sof meters per year, but one of the mats from the high temperature mat area had a rate ofapproximately 100 meters per year.
Sediments from two sites had temperatures greater than 10°C at depths of 50-60 centimeters(Figure 42). One of these relatively warm sediments was within 50 meters of the warmest bacterialmat and within 100 meters of the Benthic Barrel and the "Sea-Cat thermal probe" (1TI). The otherwarm sediment site, however, was located near the Palisades Point pool/bacterial mat complex.The coolest sediments were located in a low-relief, sedimented area in the central portion of theDetailed Study Area and west of the the most prominent mats and pools. Table 4 shows that theadvection rates range from values near zero to more than 50 meters per year in the Palisades Pointarea. The data collected near the Benthic Barrel and the iTT site suggest that there is no advection.However, because the 1TF measurements (see next section) indicate advection rates of 25 to 45meters per year, we suspect that the upper thermistors on the submarine probe were affected byseepage of lake water. This interpretation is compatible with the relatively high temperature(10.2°C) measured by the deepest thermistor at this site
We measured the temperatures of Llao's Bath and one of the Palisades Point pools (Figure 43).The data show that the temperatures of these saline water sources are relatively low. Although thesalt content of these waters is approximately 10 times greater than background lake values, theirtemperatures are only one to two degrees warmer.
91

Table 4. SubmersIble temperature data and advection/diffuslon model estimatesof fluid advection rates.
92
Sample Type! Dive Depth (cm) Temperature Advection Ratem/y
Comments
SedimentCD 222 30 5.55
50 6.35 -1070 6.92
CD 223 15 3.8035 4.05 0
55 4.24
CD 226 20 5.340 7.9 0 probable seepage at
60 10.2 2Oand4Ocm
CD 228 2 4.622 10.2 50 to 7042 10.8
MatsCD 207 30 7.56
50 7.76 25 to 4570 8.1
CD215 10 9.0 >10030 9.6
CD 226 10 7.530 11.08 20 to 2550 12.9
CD 228 15 5.635 7.15 -1555 8.11
CD 230 20 4.8440 5.75 10 to 25 possible seepage
60 6.0
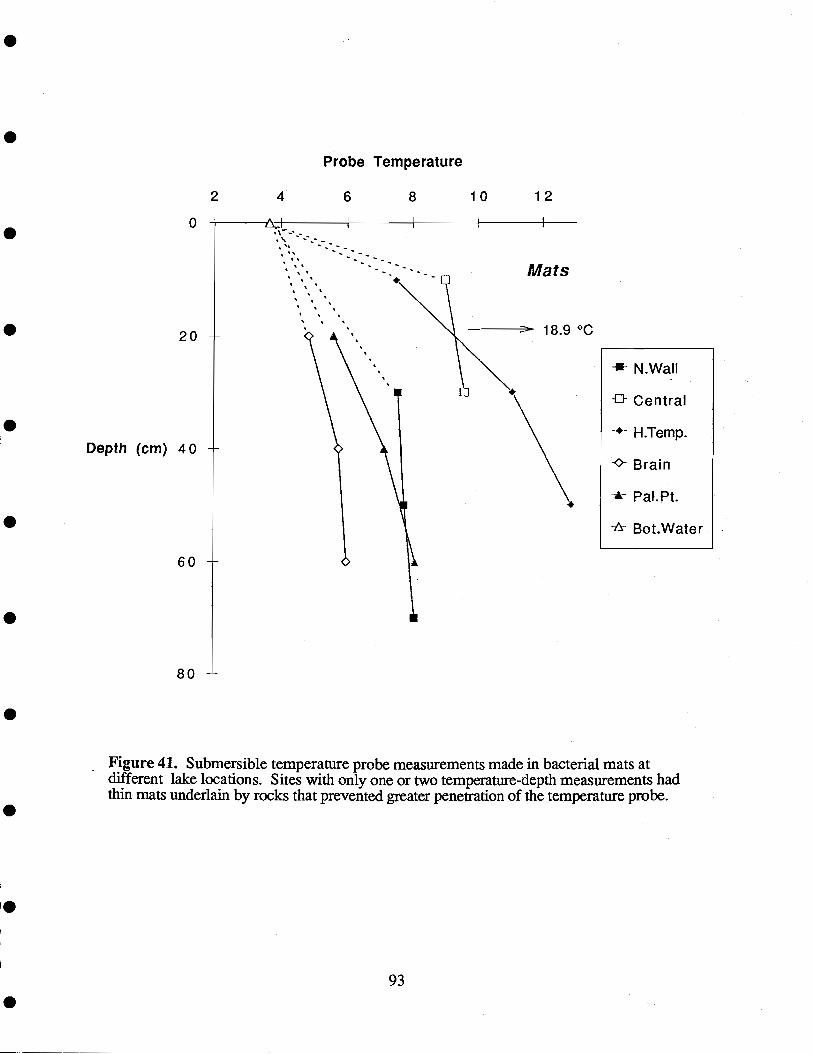
Probe Temperature
2 4 6 8 10 12
Figure 41. Submersible temperature probe measurements made in bacterial mats atdifferent lake locations. Sites with only one or two temperature-depth measurements hadthin mats underlain by rocks that prevented greater penetration of the temperature probe.
93
N.WalI
-0- Central
H.Temp.
Brain
Pal.Pt.
Bot.Water

2 4 6 8 10 12
Probe Temperature
Central
0 High T
Pal.Pt.
West
Bot.Water
Figure 42. Submersible temperature probe measurements made in sediments at differentlake sites.
0
20
Depth (cm) 40
60
80
3
Probe Temperature
4 5
95
Pools
Figure 43. Pool temperatures determined with the submersible temperature probe.
LIao
-0 PaI.Pt.
Bot.Water
Taken altogether, the temperature probe measurements show considerable variation in mat and pooltemperatures over a range of spatial scales. The observation that warm sediments (>10°C) arefound on essentially opposite sides of the lake demonstrates that the thermal anomalies have a lake-wide scale. On the other hand, measurements 50 to 100 meters apart have maximum temperatureswhich can differ by a factor of two. These observations suggest that venting of the anomalousfluids is highly localized. The pools, which have highly anomalous salt contents and relativelysmall thermal anomalies, may reflect the importance of conductive heat loss during and after theventing of these saline fluids.
Sediment Temperature Profiles.
Time series measurements of sediment temperatures were made at two sedimented sites near thehigh temperature bacterial mats (see Figure 3 for locations). As discussed in the Methods section,the instrument we used, a SeaCat 'i-ri, has an internal data recorder and three vertically-arrayed,high precision thermistors which can be inserted into the sediments. The instrument is designed sothat the uppermost thermistor records bottom water temperatures a few centimeters above thesediment-water interface.
The SeaCat ITT sediment temperature probe was deployed for a seven day period from 24 August1989 until 31 August 1989. The submersible deployed the instrument in its frame on the lakebottom. The variations of temperature with depth were collected by three thermistors containedwithin the probe - the deep thermistor was 35 cm below the sediment surface, the middlethermistor was 5 cm below the sediment surface, and the top thermistor monitored the bottomwater temperature 5 cm above the bottom. The SeaCat profiler automatically logged these bottomwater-sediment temperature profiles two times a second. It has an accuracy of ±0.01°C and aresolution of 0.001°C.
An example of the intercalibrated accuracy of the thermistor data can be seen in Figure 44. Allthree thermistors (Deep, Middle, and Top) registered identical temperatures during thesubmersiblets descent to the lake bottom. Only after initial penetration of the sediment by theprobe did the temperature readings of the three thermistors diverge in response to the thermalgradients within the sediment.
The sediment temperature probe was initially deployed next to the Benthic Barrel on 24 August1989 during Dive CD222. The barrel was deployed earlier at that site (Dive CD217 - 17 August1989) and was still collecting time-series samples of in situ vent water that had advected from thesediment. Also, a box core (BC6) had already been recovered only 20 meters away and aninterstitial sediment pore water sampler (Peeper B) had already been left there on 19 August 1989during Dive CD218. It was hoped that the thermal gradient data recorded by the sedimenttemperature probe would compliment the data from the other experiments. Three days later, thesediment temperature probe was moved (27 August 1989 - Dive CD226) to an adjacent, heavilymottled, sedimented area about 30 meters away where higher bottom water and sedimenttemperatures had been recorded.
The results of the TTT Sediment Temperature Probe deployment are shown in Figure 45. In Area#1 immediately next to the Benthic Barrel, the Deep thermistor registered 5.61°C at 35 cm depth,while 30 cm shallower, at 5 cm depth, the Middle thermistor recorded 4.36°C. Bottom watertemperatures at that time were fluctuating between 3.7°C and 4.1°C. It is remarkable how stablethe sediment temperatures were over this time period of more than three days.
96
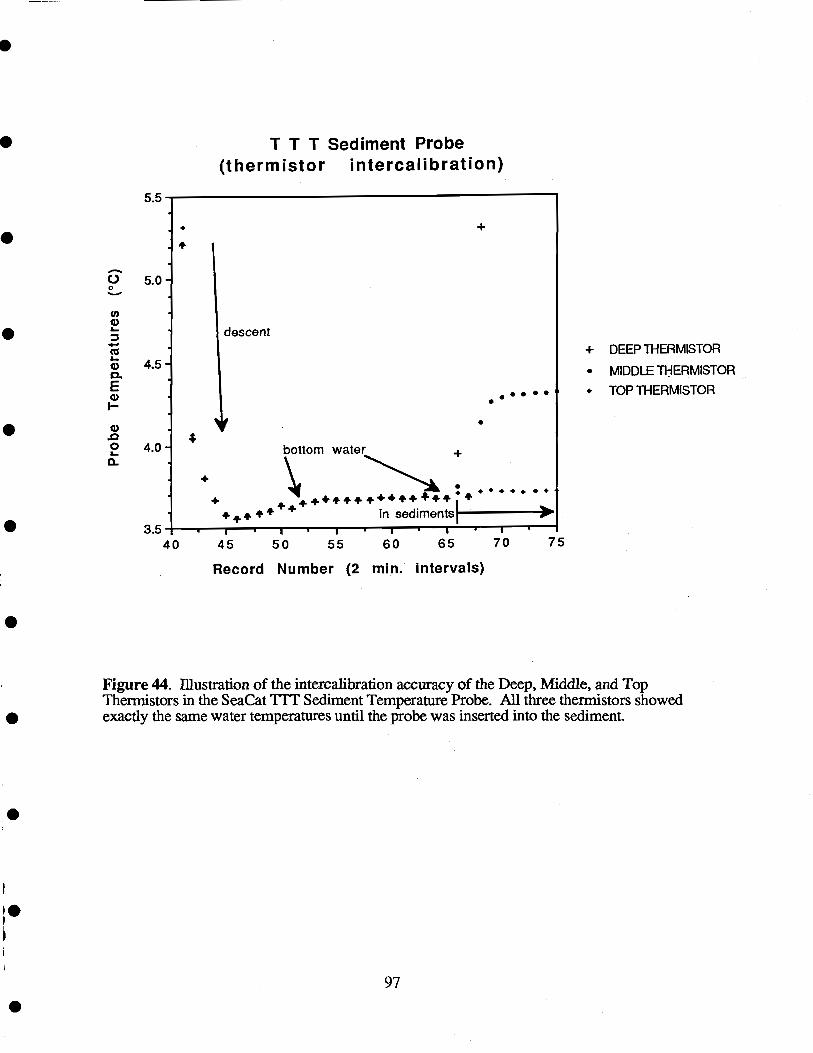
Figure 44. Illustration of the intercalibration accuracy of the Deep, Middle, and TopThermistors in the SeaCat TfT Sediment Temperature Probe. All three thermistors showedexactly the same water temperatures until the probe was inserted into the sediment.
5.5
C.) 5.0-0
(I)C,I-
1
C) 4.5C-EC)
C)
2 4.0-C-
3.540
T T T Sediment Probe(thermistor intercalibration)
*4.
4
descent
S
bottom water +
++ 444+ ++4+ #++4.4+ in sedimentsjI -. I
45 50 55 60 65 70 75
Record Number (2 mm. intervals)
..S
97
+ DEEP ThERMISTOR
MIDDLE ThERMISTOR
TOP ThERMISTOR
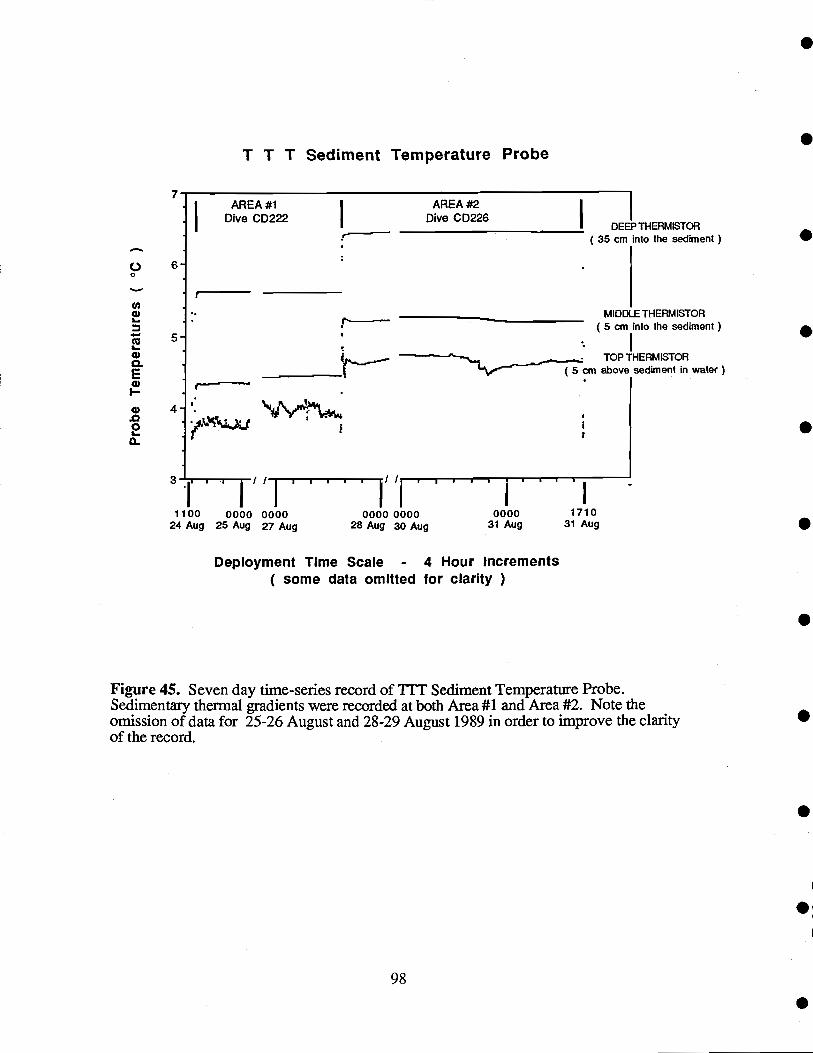
AREA #1Dive CD222
1100 0000 000024 Aug 25 Aug 27 Aug
T T T Sediment Temperature Probe
1/
0000 000028 Aug 30 Aug
Deployment Time Scale - 4 Hour Increments( some data omitted for clarity )
Figure 45. Seven day time-series record of TFT Sediment Temperature Probe.Sedimentary thermal gradients were recorded at both Area #1 and Area #2. Note theomission ofdatafor 25-26 August and 28-29 August 1989 in order to improve the clarityof the record.
DEEP THERMISTOR(35 cm into the sediment)
MIDDLE THERMISTOR(5 cm into the sediment)
TOP THERMISTOR(5 cm above sediment in water)
98
I I I I II0000 1710
31 Aug 31 Aug
The thermal gradient in Area #2 shows higher temperatures than Area #1 at equivalent depths, andthis supports the contention that a crusted sedimentary surface is indicative of an area of warmer,more rapidly-advecting interstitial pore water. The Deep thermistor, 35 cm below the crusty,mottled sediment in Area #2, registered 6.45°C; the Middle thermistor recorded 5.25 C. Bothvalues are approximately 0.80°C higher than those of the equivalent Area #1 sediments. The Topthermistor in Area #2 shows an anomalously high and stable temperature value unlike what onewould expect from a bottom water temperature record. One can only assume that the temperatureprobe settled at least 5 cm deeper into the soft sediments at Area #2, effectively covering the Topthermistor and shielding it from direct bottom water temperatures.
Advection-diffusion modeling of these data can be accomplished by assuming a constantcoefficient of thermal diffusion, 2 x 10-s cm2/sec, (Williams and Von Herzen, 1983). Thecalculated advection rates are 3.5 meters per year at the first deployment and 4.0 meters per yearfor the second site (Goeffrey Wheat, personal communication). These estimates for verticaladvection in the sediments lie between those determined from by pore fluid composition (AppendixF) and the measurements by the submersible temperature probe.
We believe that the range in estimated advection rates reflects horizontal heterogeneity, which willbe reflected in any sample or measurement taken in close proximity to a thermal or advectingfeature, such as a bacterial mat. Thus, gravity coring from the surface vessel has very limitedprecision in terms of knowing the relationship to specific features (realistically not better than ±50meters). Therefore, calculations based upon measurements of these cores resulted in the lowestadvection rates. The TTT was placed in a general area of elevated sediment temperatures andmottled sediments, but the deployment of this device could not be guided by detailed sedimenttemperature information. Box cores, which could be placed with a precision of ±2 meters frommat features associated with sediments, recorded advection rates of a few meters per year, similarto those of the TIT. Temperature measurements, made by inserting the temperature probe intoknown thermal-chemical features, provided estimates of advection rates in the range of 10 to 100meters per year.
111.9. Bacterial mats
1988 Observations.
During the 1988 field season Deep Rover dives discovered bacterial colonies which coveredportions of the bottom in six locations (Table 5). The mats observed during that year aregelatinous, low-density features (Plate 5), 15 to 300 cm in diameter and 2 to 15 cm thick. Some ofthe largest mats were draped over steep rock outcrops (Plate 5 and 7); however, smaller mats laydirectly upon sediments (Plate 6). Rusty-brown colors within the mats suggest that iron oxidationmay be important in mat formation. The sediments near the mats are dark and contrast stronglywith the normal buff sediments that cover most of the bottom. At some sites, many individualmats were observed.
The mats discovered in 1988 were all within 500 m of each other and were either on or near thescarp that extends across the Detailed Study Area with a NE-SW orientation. Several of the matswere found in the relatively flat, sedimented sites at the base of the scarp. Some of the largestmats, however, were found draped over the cliff face, 15 meters above the base of the slope. Aschematic drawing of the mats first observed during dive CD 179 in 1988 is shown in Figure 46.The mat on the right was the largest mat observed and extends from a dome-like mass down thecliff as a continuous feature for more than 10 meters.
99
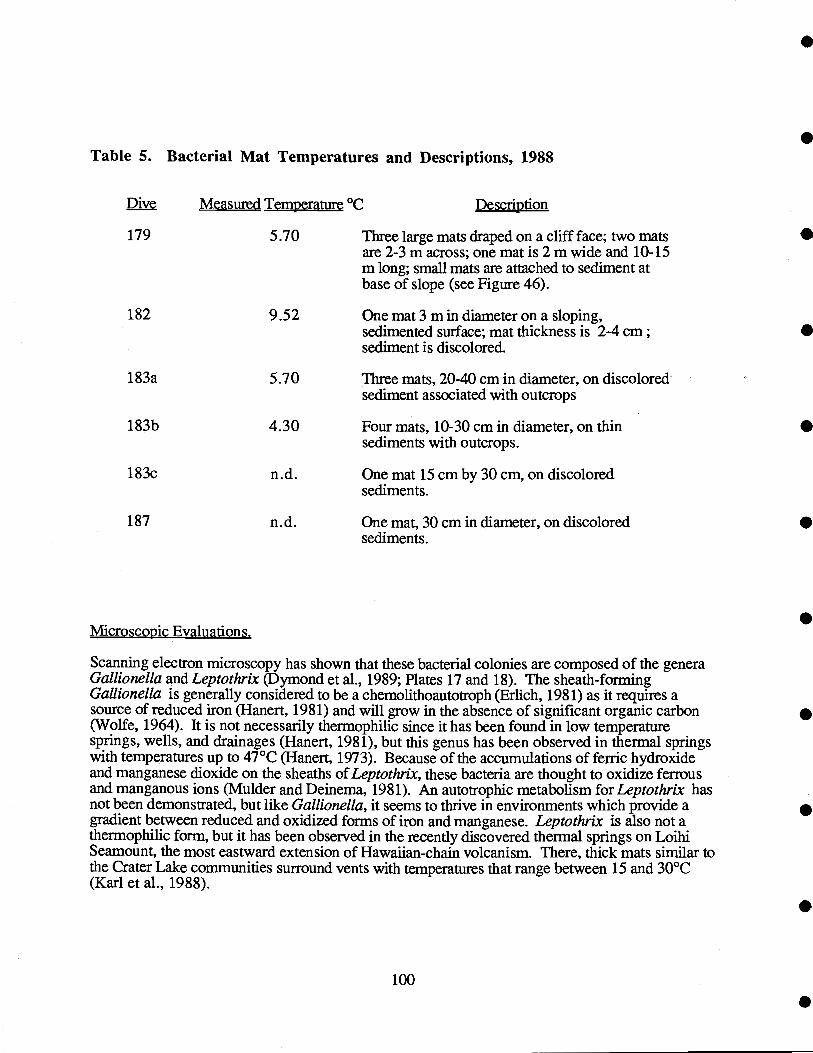
Table 5. Bacterial Mat Temperatures and Descriptions, 1988
Dive Measured Temperature °C Description
Three large mats draped on a cliff face; two matsare 2-3 m across; one mat is 2 m wide and 10-15m long; small mats are attached to sediment atbase of slope (see Figure 46).
One mat 3 m in diameter on a sloping,sedimented surface; mat thickness is 2-4 cm;sediment is discolored.
Three mats, 20-40 cm in diameter, on discoloredsediment associated with outcrops
Four mats, 10-30 cm in diameter, on thinsediments with outcrops.
One mat 15 cm by 30 cm, on discoloredsediments.
One mat, 30 cm in diameter, on discoloredsediments.
Microscopic Evaluations.
Scanning electron microscopy has shown that these bacterial colonies are composed of the generaGallionella and Leptothrix (Dymond et al., 1989; Plates 17 and 18). The sheath-formingGallionella is generally considered to be a chemolithoautotroph (Erlich, 1981) as it requires asource of reduced iron (Hanert, 1981) and will grow in the absence of significant organic carbon(Wolfe, 1964). It is not necessarily thermophilic since it has been found in low temperaturesprings, wells, and drainages (Hanert, 1981), but this genus has been observed in thermal springswith temperatures up to 47°C (Hanert, 1973). Because of the accumulations of ferric hydroxideand manganese dioxide on the sheaths of Leptothrix, these bacteria are thought to oxidize ferrousand manganous ions (Mulder and Deinema, 1981). An autotrophic metabolism for Leptothrix hasnot been demonstrated, but like Gallionella, it seems to thrive in environments which provide agradient between reduced and oxidized forms of iron and manganese. Leptothrix is also not athermophilic form, but it has been observed in the recently discovered thermal springs on LoihiSeamount, the most eastward extension of Hawaiian-chain volcanism. There, thick mats similar tothe Crater Lake communities surround vents with temperatures that range between 15 and 30°C(Karletal., 1988).
100
179 5.70
182 9.52
183a 5.70
183b 4.30
183c n.d.
187 n.d.
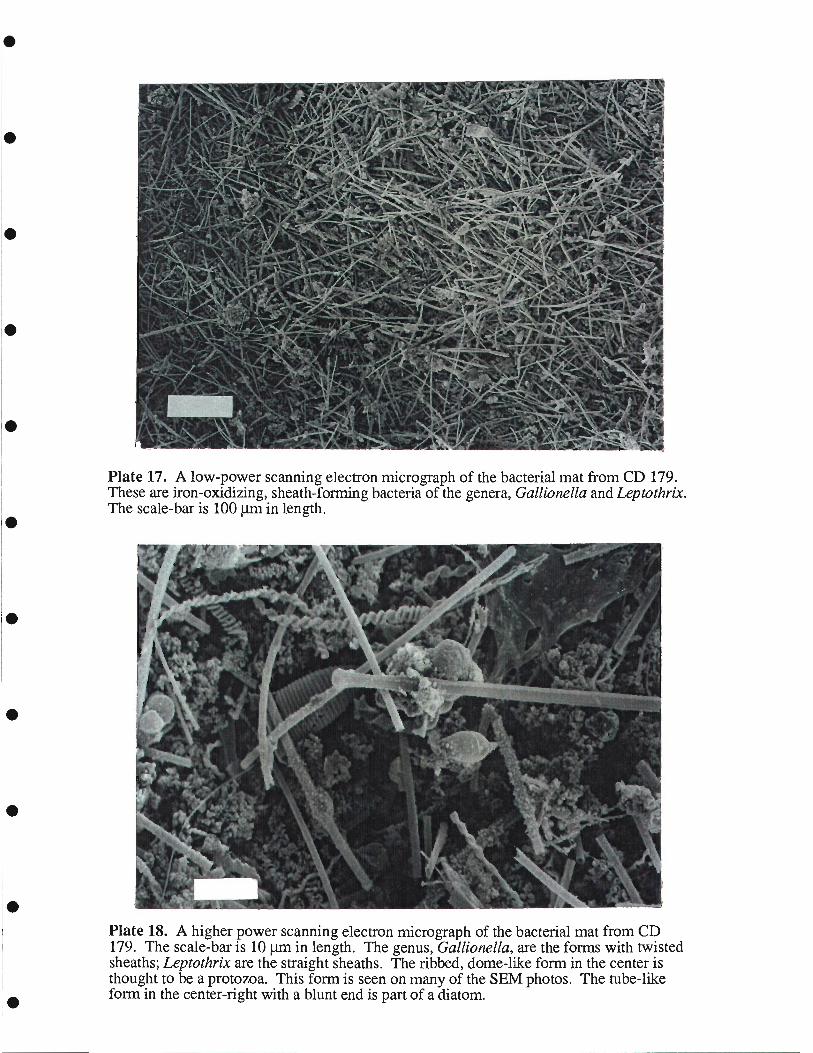
2:
:fr,'I-.td
__. a_&t
.
.
S
S
S
I
Plate 17. A low-power scanning electron micrograph of the bacterial mat from CD 179.These are iron-oxidizing, sheath-forming bacteria of the genera. Gallionella and Leptothrix.The scale-bar is 100 Lm in length.
N
p.
I
I'
Plate 18. A higher power scanning electron micrograph of the bacterial mat from CD179. The scale-bar is 10 I.tm in length. The genus, Gallionella, are the forms with twistedsheaths; Leptothrix are the straight sheaths. The ribbed, dome-like form in the center isthought to be a protozoa. This form is seen on many of the SEM photos. The tube-likeform in the center-right with a blunt end is part of a diatom.
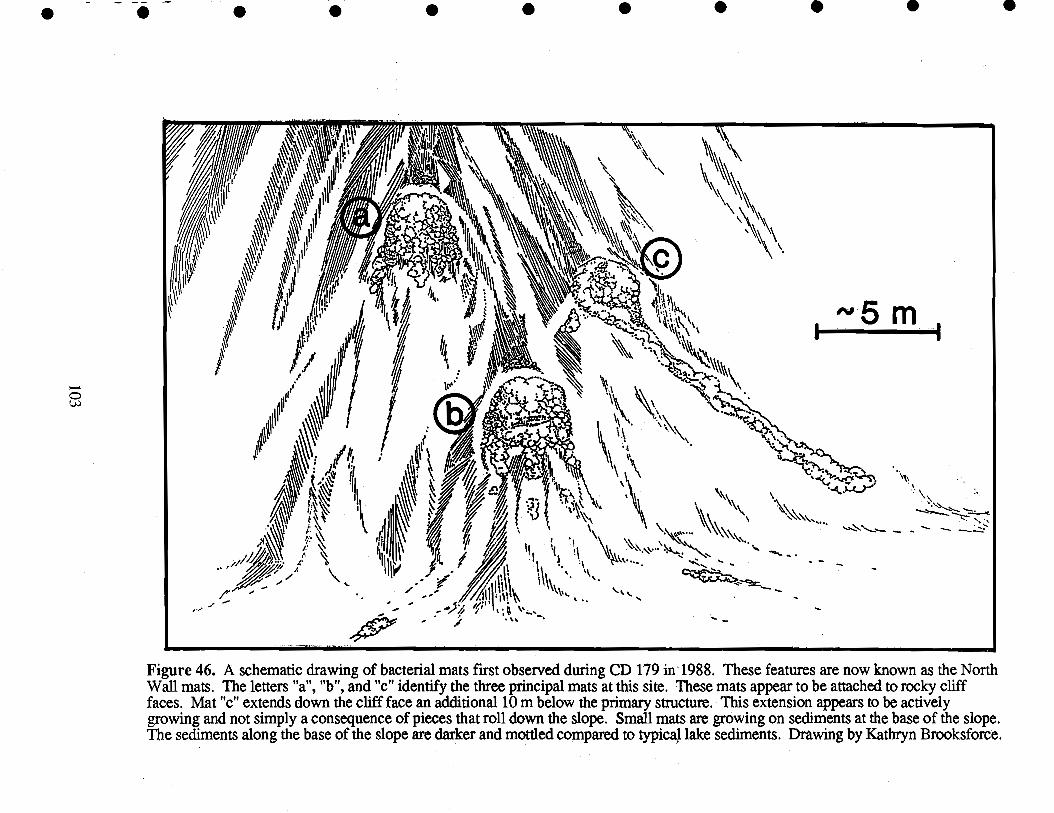
I
Figure 46. A schematic drawing of bacterial mats first observed during CD 179 in 1988. These featuresare now known as the NorthWall mats. The letters "a", "b", and "c" identify the three principal mats at this site. These mats appear to be attached to rocky clifffaces. Mat "c" extends down the cliff face an additional 10 m below the primary structure. This extensionappears to be activelygrowing and not simply a consequence of pieces that roll down the slope. Small matsare growing on sediments at the base of the slope.The sediments along the base of the slope are darker and mottled compared to typical lake sediments. Drawing by Kathryn Brooksforce.
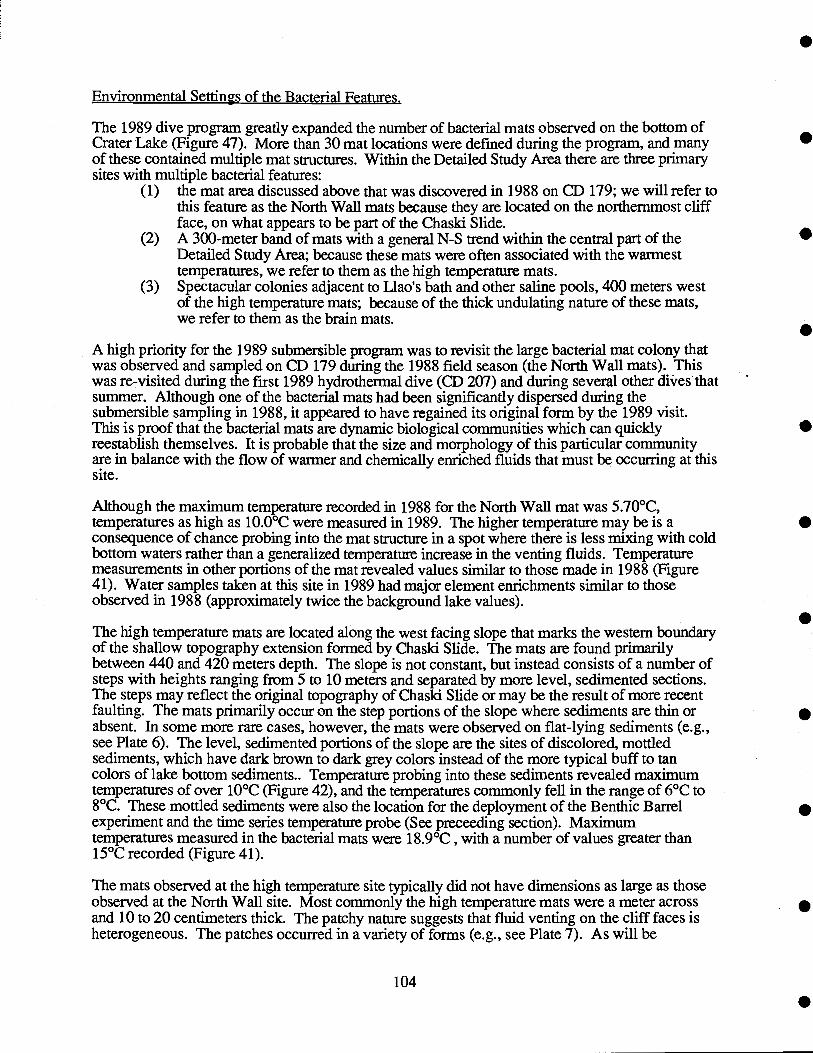
Environmental Settings of the Bacterial Features.
The 1989 dive program greatly expanded the number of bacterial mats observed on the bottom ofCrater Lake (Figure 47). More than 30 mat locations were defined during the program, and manyof these contained multiple mat structures. Within the Detailed Study Area there are three primarysites with multiple bacterial features:
the mat area discussed above that was discovered in 1988 on CD 179; we will refer tothis feature as the North Wall mats because they are located on the northernmost cliffface, on what appears to be part of the Chaski Slide.A 300-meter band of mats with a general N-S trend within the central part of theDetailed Study Area; because these mats were often associated with the warmesttemperatures, we refer to them as the high temperature mats.Spectacular colonies adjacent to Llao's bath and other saline pools, 400 meters westof the high temperature mats; because of the thick undulating nature of these mats,we refer to them as the brain mats.
A high priority for the 1989 submersible program was to revisit the large bacterial mat colony thatwas observed and sampled on CD 179 during the 1988 field season (the North Wall mats). Thiswas re-visited during the first 1989 hydrothermal dive (CD 207) and during several other dives thatsummer. Although one of the bacterial mats had been significantly dispersed during thesubmersible sampling in 1988, it appeared to have regained its original form by the 1989 visit.This is proof that the bacterial mats are dynamic biological communities which can quicklyreestablish themselves. It is probable that the size and morphology of this particular communityare in balance with the flow of warmer and chemically enriched fluids that must be occurring at thissite.
Although the maximum temperature recorded in 1988 for the North Wall mat was 5.70°C,temperatures as high as 10.0°C were measured in 1989. The higher temperature may be is aconsequence of chance probing into the mat structure in a spot where there is less mixing with coldbottom waters rather than a generalized temperature increase in the venting fluids. Temperaturemeasurements in other portions of the mat revealed values similar to those made in 1988 (Figure41). Water samples taken at this site in 1989 had major element enrichments similar to thoseobserved in 1988 (approximately twice the background lake values).
The high temperature mats are located along the west facing slope that marks the western boundaryof the shallow topography extension formed by Chaski Slide. The mats are found primarilybetween 440 and 420 meters depth. The slope is not constant, but instead consists of a number ofsteps with heights ranging from 5 to 10 meters and separated by more level, sedimented sections.The steps may reflect the original topography of Chaski Slide or may be the result of more recentfaulting. The mats primarily occur on the step portions of the slope where sediments are thin orabsent. In some more rare cases, however, the mats were observed on flat-lying sediments (e.g.,see Plate 6). The level, sedimented portions of the slope are the sites of discolored, mottledsediments, which have dark brown to dark grey colors instead of the more typical buff to tancolors of lake bottom sediments.. Temperature probing into these sediments revealed maximumtemperatures of over 10°C (Figure 42), and the temperatures commonly fell in the range of 6°C to8°C. These mottled sediments were also the location for the deployment of the Benthic Barrelexperiment and the time series temperature probe (See preceeding section). Maximumtemperatures measured in the bacterial mats were 18.9°C , with a number of values greater than15°C recorded (Figure 41).
The mats observed at the high temperature site typically did not have dimensions as large as thoseobserved at the North Wall site. Most commonly the high temperature mats were a meter acrossand 10 to 20 centimeters thick. The patchy nature suggests that fluid venting on the cliff faces isheterogeneous. The patches occurred in a variety of forms (e.g., see Plate 7). As will be
104

1000
Mat, Locations 1989
490-470 470-450 450-430 430-410 410-390meters
1800
1800
C
1600
Zci)
ci)
1400
1200
1600400 600 800 1000 1200 ' 1400
Meters E of Eagle PointFigure 47. Bacterial mat locations in the detailed study area which we observed in 1989.
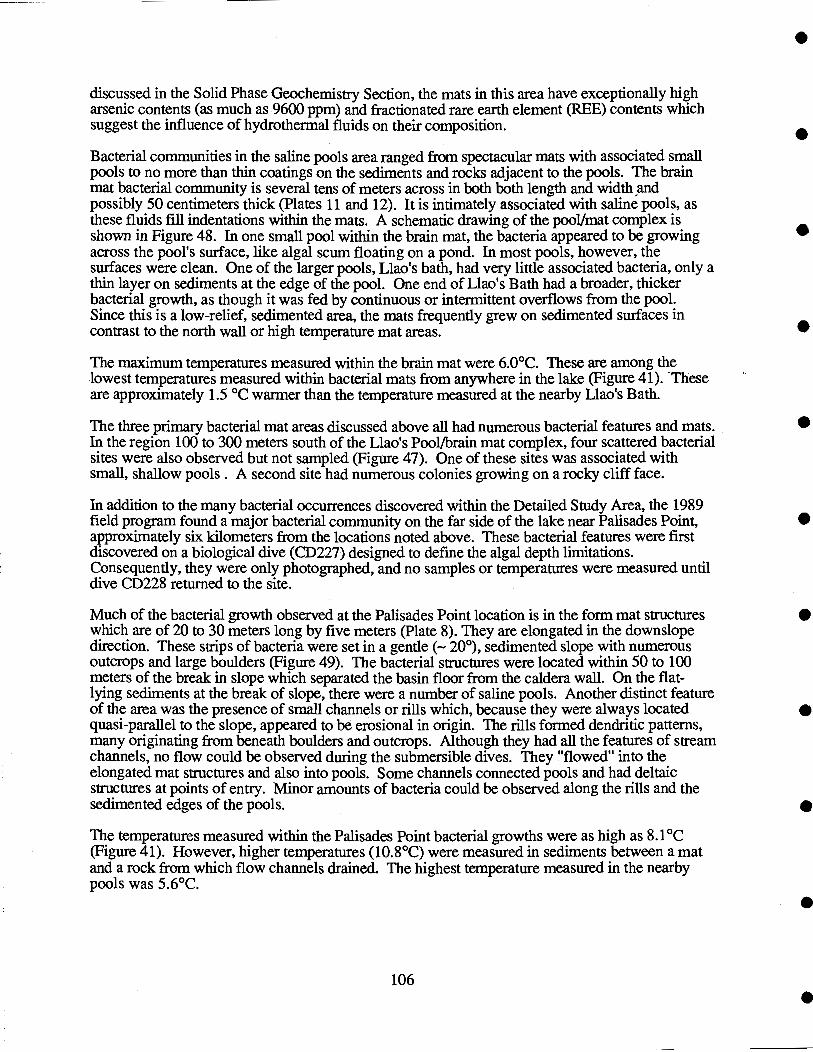
discussed in the Solid Phase Geochemistry Section, the mats in this area have exceptionally higharsenic contents (as much as 9600 ppm) and fractionated rare earth element (REE) contents whichsuggest the influence of hydrothermal fluids on their composition.
Bacterial communities in the saline pools area ranged from spectacular mats with associated smallpools to no more than thin coatings on the sediments and rocks adjacent to the pools. The brainmat bacterial community is several tens of meters across in both both length and width andpossibly 50 centimeters thick (Plates 11 and 12). It is intimately associated with saline pools, asthese fluids fill indentations within the mats. A schematic drawing of the pool/mat complex isshown in Figure 48. In one small pool within the brain mat, the bacteria appeared to be growingacross the pool's surface, like algal scum floating on a pond. In most pools, however, thesurfaces were clean. One of the larger pools, Llao's bath, had very little associated bacteria, only athin layer on sediments at the edge of the pool. One end of Llao's Bath had a broader, thickerbacterial growth, as though it was fed by continuous or intermittent overflows from the pool.Since this is a low-relief, sedimented area, the mats frequently grew on sedimented surfaces incontrast to the north wall or high temperature mat areas.
The maximum temperatures measured within the brainmat were 6.0°C. These are among thelowest temperatures measured within bacterial mats from anywhere in the lake (Figure 41). Theseare approximately 1.5 °C warmer than the temperature measured at the nearby Llao's Bath.
The three primary bacterial mat areas discussed above all had numerous bacterial features and mats.In the region 100 to 300 meters south of the Llao's Pool/brain mat complex, four scattered bacterialsites were also observed but not sampled (Figure 47). One of these sites was associated withsmall, shallow poois. A second site had numerous colonies growing on a rocky cliff face.
In addition to the many bacterial occurrences discovered within the Detailed Study Area, the 1989field program found a major bacterial community on the far side of the lake near Palisades Point,approximately six kilometers from the locations noted above. These bacterial features were firstdiscovered on a biological dive (CD227) designed to defme the algal depth limitations.Consequently, they were only photographed, and no samples or temperatures were measured untildive CD228 returned to the site.
Much of the bacterial growth observed at the Palisades Point location is in the form mat structureswhich are of 20 to 30 meters long by five meters (Plate 8). They are elongated in the downslopedirection. These strips of bacteria were set in a gentle (- 20°), sedimented slope with numerousoutcrops and large boulders (Figure 49). The bacterial structures were located within 50 to 100meters of the break in slope which separated the basin floor from the caldera wall. On the flat-lying sediments at the break of slope, there were a number of saline pools. Another distinct featureof the area was the presence of small channels or rills which, because they were always locatedquasi-parallel to the slope, appeared to be erosional in origin The rills formed dendritic patterns,many originating from beneath boulders and outcrops. Although they had all the features of streamchannels, no flow could be observed during the submersible dives. They "flowed" into theelongated mat structures and also into pools. Some channels connected pools and had deltaicstructures at points of entry. Minor amounts of bacteria could be observed along the rills and thesedimented edges of the pools.
The temperatures measured within the Palisades Point bacterial growths were as high as 8.1°C(Figure 41). However, higher temperatures (10.8°C) were measured in sediments between a matand a rock from which flow channels drained. The highest temperature measured in the nearbypools was 5.6°C.
106
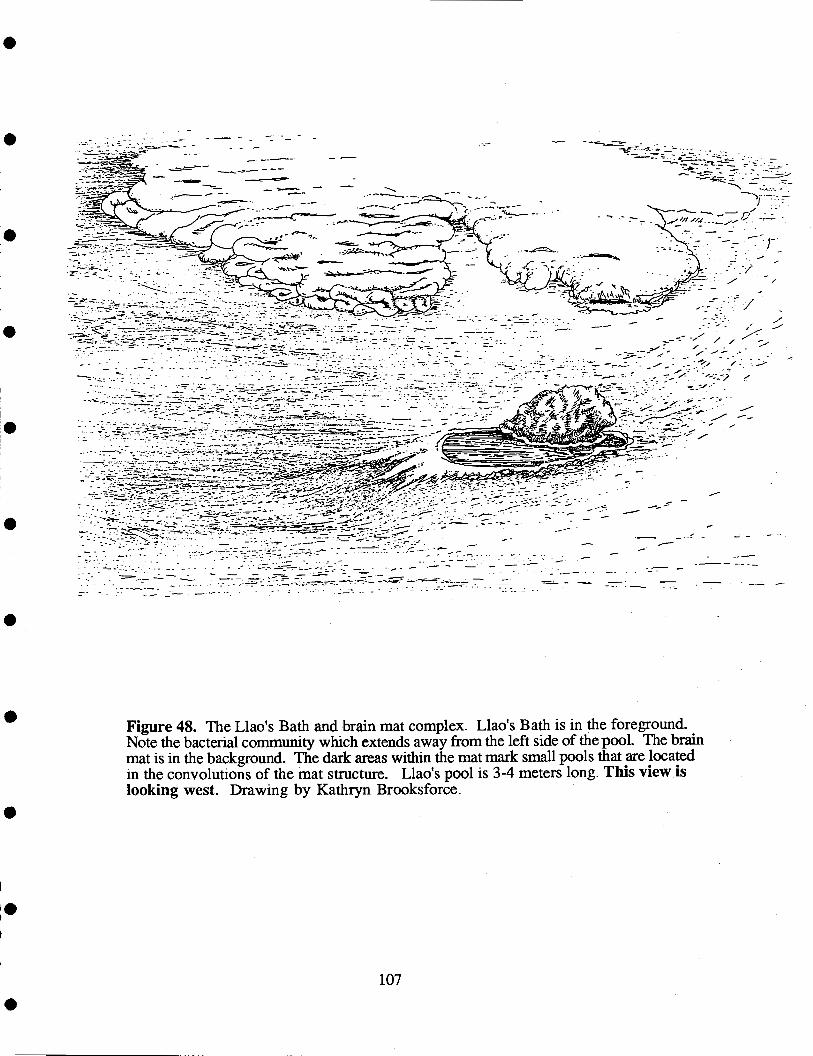
107
Figure 48. The Llao's Bath and brain mat complex. Llao's Bath is in the foreground.Note the bacterial community which extends away from the left side of the pool. The brainmat is in the background. The dark areas within the mat mark small pools that are locatedin the convolutions of the mat structure. Llao's pool is 3-4 meters long. This view islooking west. Drawing by Kathryn Brooksforce.
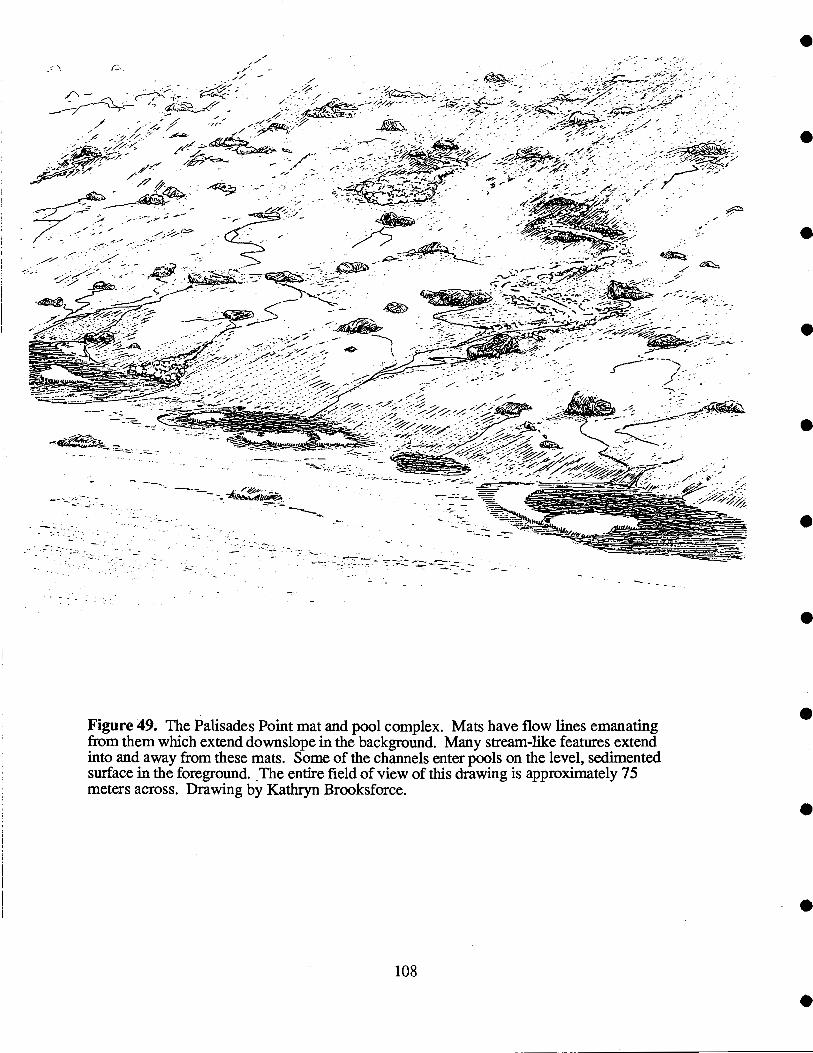
00
P
E CD
i
0C
D
- O '<
CD
r+ CD - C
D0
CD
-. tJ

Chemical Composition of Bacterial Samples.
The bulk chemical composition was determined on mats from the four major bacterial locations byour dives (Table 6). Iron is the most abundant element and, as FeOOH, can account for more than70% of the mass of the mat material. Significant amounts of silicon and phosphorus are alsopresent. Although the SEM photographs (Plates 17 and 18) show that the mats are predominantlycomposed of sheath-forming bacteria, organic carbon makes up only about 2% of the material.Probably, that most of the bacteria shown in Plates 17 and 18 are remnant sheaths rather thanliving bacteria. Analyses of the organic fraction show that the extractable lipids are simple fattyacids (B. Simoneit, personal communication). Sterols and other indicators of phytoplankton,zooplankton, or local terrigenous sources are absent. These data are consistent with fresh organicmatter of microbial origin.
Although there are general similarities in the composition of the bacteria from different sites, there. are also some significant differences. Aluminium content varies by more than an order ofmagnitude (Table 6). These variations most likely reflect the differences in contamination bytypical Crater Lake sediments which are dominantly composed of detrital aluminosilicate materials.Thus, the Palisades Point sample, which has the highest Al content (3.26 %), probably containsnearly 40% aluminosilicate material. This contamination could either result from accidentalinclusion of settling aluminosilicate particulates or from the intermixing of underlying sediments
duringthe sampling process with the submersible. The aluminosiicate contamination primarily
enhances the measured Si content and decreases the measured iron content of the samples,although it would also affect the content of minor elements which were primarily associated witheither the mat or the aluminosiicates.
There are other variations between samples which cannot be accounted for by aluminosilicatecontributions. In the five samples, arsenic and antimony contents vary by approximately a factorof 30. Manganese varies by approximately a factor of 40. Because we have multiple samplesfrom only one location (the brain mat), it is difficult to say whether these variations reflect site-to-site differences in vent fluid composition and bacterial metabolisms or inter-site variability. Theremay well be intra-site differences in the fluid composition. The very high As and Sb contents ofthe high temperature mat, for example, may reflect the more rapid venting and higher As and Sbcontents of what are the warmest fluids detected. These fluids may have a stronger hydrothermalsignal. Variations in the numbers of manganese-oxidizing bacteria at different sites could alsoaccount for the differences in observed manganese. The two samples from the brain mat,however, show that even relatively close samples can differ in composition. One sample hassignificantly higher Mn and Zn, while the other has higher arsenic.
Biological and Biochemical Studies.
For the 1989 field program we enlisted the help of Dr. David Karl of the University of Hawaii toundertake microbiological studies. Dr. Karl is a renowned marine microbiologist who has workedextensively on hydrothermal systems and most recently with the Loihi Seamount bacterial colonieswhich are also iron oxidizing systems (Karl et al., 1988; Karl et al., in press). Dr. Karl was notable to personally participate in the field program, but he provided our research group withequipment and detailed sampling instructions in order to collect bacteria and other materials. Fromthe various samplings of bacterial mats and fluids we provided: 1) live and preserved bacterialmats collected from a variety of sites for direct microscopy and pure culture isolation; (2)unpreserved, frozen bacterial mats for chemical, isotopic and enzymatic (carboxylase)determinations; and (3) frozen porewaters for measurement of DOC, DON, DOP and specificorganic constituents (amino acids and nucleic acids). No formal funding for this work wasprovided from the Park Service or other agencies. Despite the lack of funding, significant workhas been completed. He provided a report on his results so far which is reproduced in uneditedform in Appendix E.
109
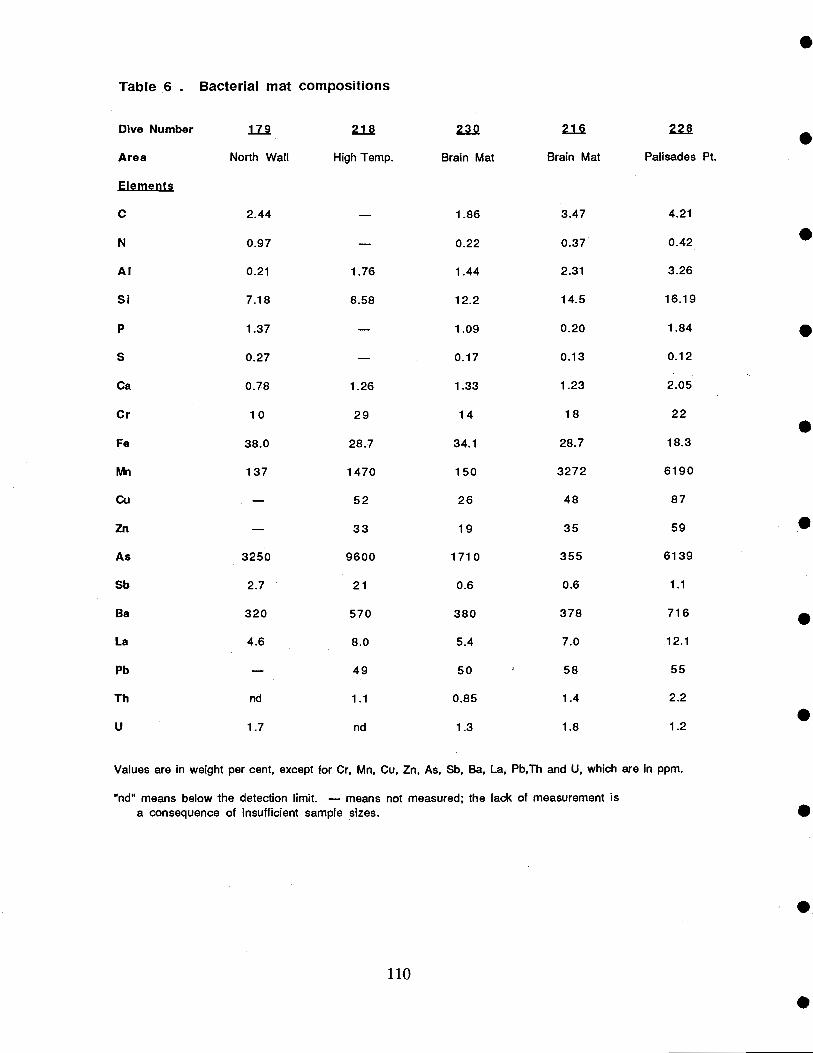
Va'ues are in weight per cent, except for Cr, Mn, Cu, Zn, As, Sb, Ba, La, Pb,Th and U, which are in ppm.
end" means below the detection limit. - means not measured; the lack of measurement isa consequence of insufficient sample sizes.
110
.
Table 6 . Bacterial mat compositions
Dive Number j.z. 2i1 aQ 21 22
Area North Wall High Temp. Brain Mat Brain Mat Palisades Pt.
Elements
C 2.44 - 1.86 3.47 4.21
N 0.97 - 0.22 0.37 0.42
Al 0.21 1.76 1.44 2.31 3.26
Si 7.18 8.58 12.2 14.5 16.19
p 1.37 - 1.09 0.20 1.84
S 0.27 - 0.17 0.13 0.12
Ca 0.78 1.26 1.33 1.23 2.05
Cr 10 29 14 18 22
Fe 38.0 28.7 34.1 28.7 18.3
137 1470 150 3272 6190
cu 52 26 48 87
Zn 33 19 35 59
As 3250 9600 1710 355 6139
Sb 2.7 21 0.6 0.6 1.1
Ba 320 570 380 378 716
La 4.6 8.0 5.4 7.0 12.1
Pb 49 50 58 55
Th rid 1.1 0.85 1.4 2.2
U 1.7 nd 1.3 1.8 1.2
.
Dr. Karl's bacterial culture experiments document the the presence of the Leptrothrix andGallionella genera. Since all samples tested positive for Gallionella, an obligate autotroph, at leastone of the forms within the bacterial community requires a continuous input of a reduced chemicalspecies, in this case ferrous iron. The lack of growth of the sulfur-oxidizing autolrophs maysuggest that sulfur is not an important source of energy. This would be consistent with the lowsulfur contents of the bacteria material (Table 6). Sediment pore waters in locations with a strongadvective signal have both high and low sulfate zones which are compatible with an upwardadvection of reduced sulfur species followed by sulfate oxidation. As suggested in Karl's report,the positive evidence of autotrophic growth indicated by the cultural experiments is not necessarilycontradictory to the enzymatic measurements. Although the autotrophic enzyme, RuBPCase, wasnot observed, this could be the result of the low numbers of viable cells in communities such asthis and of the need for more sensitive detection limits.
We have estimated how much heat is supplied to the mats by bacterial metabolism (Dymond andCollier, 1989). Assuming that the heat produced by oxidation of all dissolved ferrous ions in matfluids is retained within the mat, an upper limit to the metabolic heat production can be computed.Using this closed system assumption, the increase in temperature is strictly a function of the.concentration of iron in the fluids. An appropriate reaction is:
Fe2 + 3/2H20 + 1/402 = FeOOH (s) + 2H
The enthalpy of this reaction is -9.2 kcal/mole (Garrels and MacKenzie, 1967). Assuming an upperlimit of 1.0 millimolar iron (Mariner et al., 1980), the conversion of all the dissolved iron to solid formwould add approximately 9 calories of heat to each liter of water. Thus, the reaction would raise thetemperature of that water by less than 0.01 degrees, an insignificant amount compared to the measuredtemperatures of the mats (>10°C) or the estimated temperatures based on chemical geothermometers(>100°C).
Summary.
The bacterial mats are visible indicators of sites where thermally and chemically enriched fluids areventing into the lake. The environmental settings for these venting fluids are variable, and thesevariations result in site-to-site differences in sizes and morphologies of the bacterial communities.Despite the distinct morphologies, all the vent-related communities appear to have iron-oxidation asa major component of their metabolism. This requires a continuous supply of reduced iron fromthe venting fluids. The energy from this exothermic reaction cannot account for the measuredinternal temperatures of the bacterial features. High temperature interactions (>100°C) of waterwith rocks can supply the iron andthe other ions observed in the fluids. Site-to-site variations inthe bulk composition of the bacterial communities probably reflect variations in the advecting fluidcomposition.
111.10. Solid-Phase Geochemistry
General.
Three components can describe the overall composition of Crater Lake sediments (Dymond andCollier, 1990): (1) aluminosiicate debris eroded from the caldera walls; (2) biogenic debrisproduced by biological activity in the upper levels of the lake; (3) iron and manganeseoxyhydroxide precipitates.
111
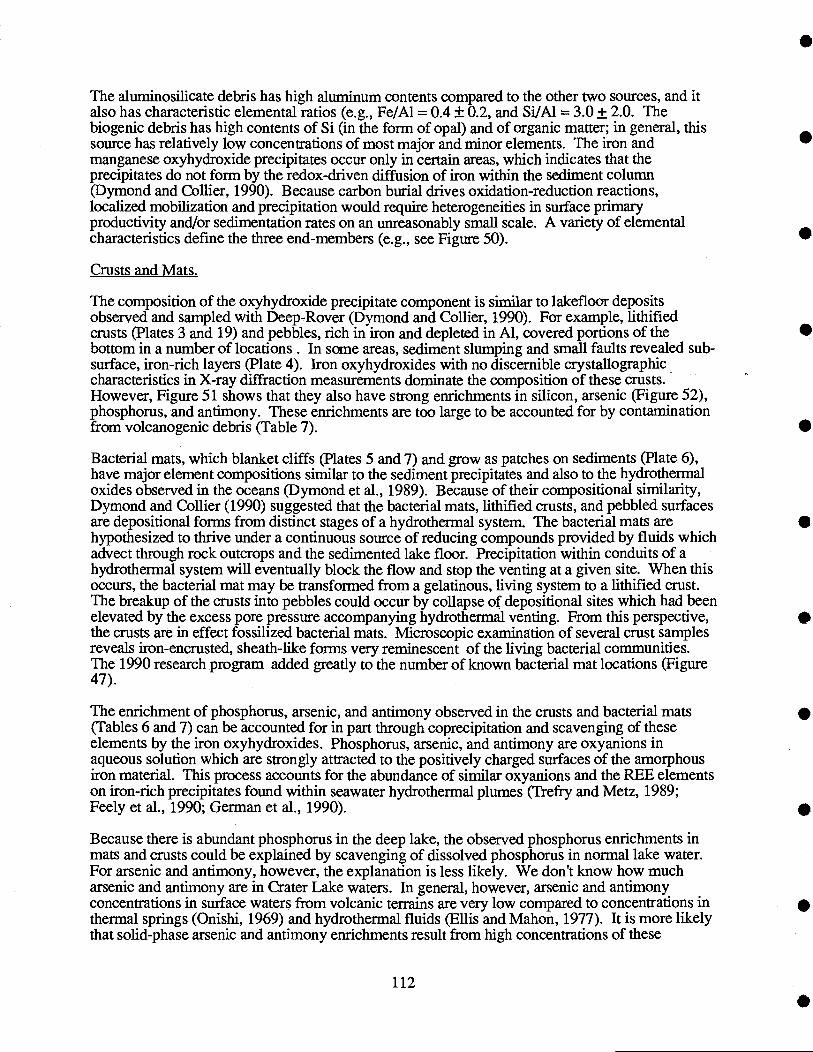
The aluminosilicate debris has high aluminum contents compared to the other two sources, and italso has characteristic elemental ratios (e.g., Fe/Al = 0.4 ± 0.2, and Si/Al = 3.0 ± 2.0. Thebiogenic debris has high contents of Si (in the form of opal) and of organic matter; in general, thissource has relatively low concentrations of most major and minor elements. The iron andmanganese oxyhydroxide precipitates occur only in certain areas, which indicates that theprecipitates do not form by the redox-driven diffusion of iron within the sediment column(Dymond and Coffier, 1990). Because carbon burial drives oxidation-reduction reactions,localized mobilization and precipitation would require heterogeneities in surface primaryproductivity and/or sedimentation rates on an unreasonably small scale. A variety of elementalcharacteristics define the three end-members (e.g., see Figure 50).
Crusts and Mats,
The composition of the oxyhydroxide precipitate component is similar to lakefloor depositsobserved and sampled with Deep-Rover (Dymond and Collier, 1990). For example, lithifledcrusts (Plates 3 and 19) and pebbles, rich in iron and depleted in Al, covered portions of thebottom in a number of locations. In some areas, sediment slumping and small faults revealed sub-surface, iron-rich layers (Plate 4). Iron oxyhydroxides with no discernible crystallographiccharacteristics in X-ray diffraction measurements dominate the composition of these crusts.However, Figure 51 shows that they also have strong enrichments in silicon, arsenic (Figure 52),phosphorus, and antimony. These enrichments are too large to be accounted for by contaminationfrom volcanogenic debris (Table 7).
Bacterial mats, which blanket cliffs (Plates 5 and 7) and grow as patches on sediments (Plate 6),have major element compositions similar to the sediment precipitates and also to the hydrothermaloxides observed in the oceans (Dymond et al., 1989). Because of their compositional similarity,Dymond and Collier (1990) suggested that the bacterial mats, lithifled crusts, and pebbled surfacesare depositional forms from distinct stages of a hydrothermal system. The bacterial mats arehypothesized to thrive under a continuous source of reducing compounds provided by fluids whichadvect through rock outcrops and the sedimented lake floor. Precipitation within conduits of ahydrothermal system will eventually block the flow and stop the venting at a given site. When thisoccurs, the bacterial mat may be transformed from a gelatinous, living system to a lithified crust.The breakup of the crusts into pebbles could occur by collapse of depositional sites which had beenelevated by the excess pore pressure accompanying hydrothermal venting. From this perspective,the crusts are in effect fossilized bacterial mats. Microscopic examination of several crust samplesreveals iron-encrusted, sheath-like forms very reminescent of the living bacterial communities.The 1990 research program added greatly to the number of known bacterial mat locations (Figure47).
The enrichment of phosphorus, arsenic, and antimony observed in the crusts and bacterial mats(Tables 6 and 7) can be accounted for in part through coprecipitation and scavenging of theseelements by the iron oxyhydroxides. Phosphorus, arsenic, and antimony are oxyanions inaqueous solution which are strongly attracted to the positively charged surfaces of the amorphousiron material. This process accounts for the abundance of similar oxyanions and the REE elementson iron-rich precipitates found within seawater hydrothermal plumes (Trefry and Metz, 1989;Feely et al., 1990; German et al., 1990).
Because there is abundant phosphorus in the deep lake, the observed phosphorus enrichments inmats and crusts could be explained by scavenging of dissolved phosphorus in normal lake water.For arsenic and antimony, however, the explanation is less likely. We don't know bow mucharsenic and antimony are in Crater Lake waters. In general, however, arsenic and antimonyconcentrations in surface waters from volcanic terrains are very low compared to concentrations inthermal springs (Onishi, 1969) and hydrothermal fluids (Ellis and Mahon, 1977). It is more likelythat solid-phase arsenic and antimony enrichments result from high concentrations of these
112
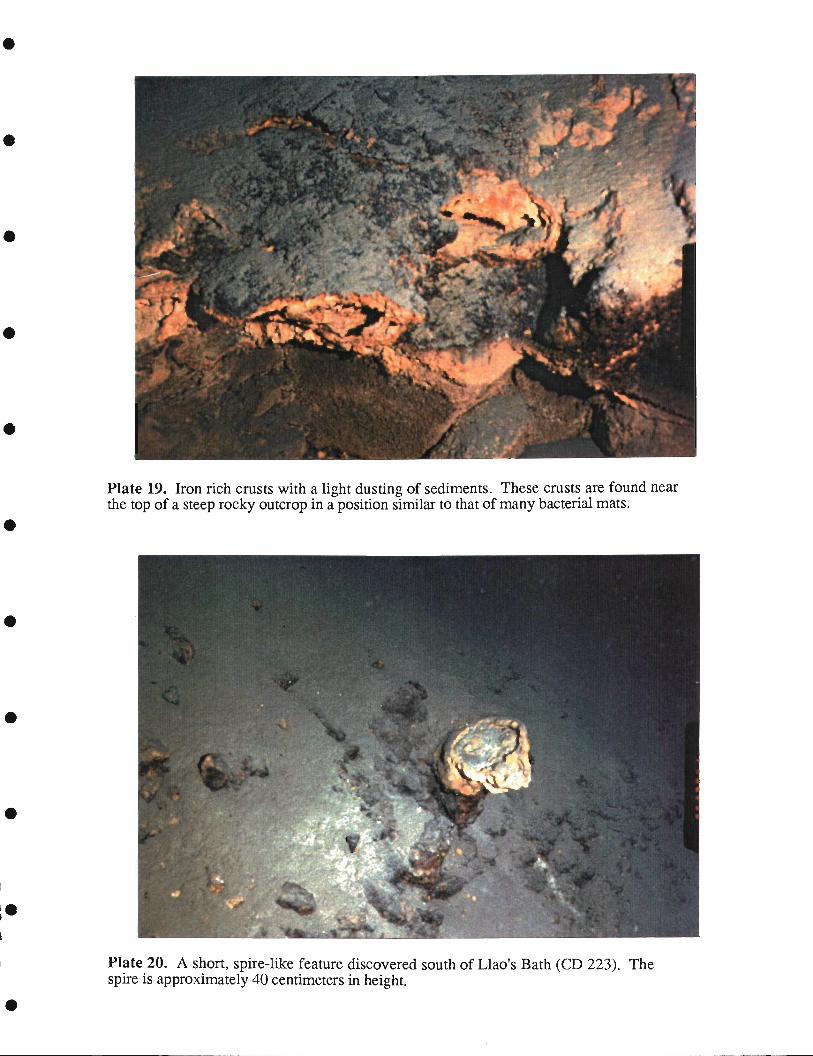
Plate 19. Iron rich crusts with a light dusting of sediments. These crusts are found nearthe top of a steep rocky outcrop in a position similar to that of many bacterial mats.
Plate 20. A short, spire-like feature discovered south of Llao's Bath (CD 223). Thespire is approximately 40 centimeters in height.

. 12.00
16.00
Fe 8.00(%)
4.00
0.00
0.00
1500 -
Biogenic
0Precipitate 0
115
tJ
a
(a)
Alu minosilicate
Aluminosilicate
Traps
o 79-1
80-7
80-14
A 85-3
. 85-4
Traps
o 79-1
80-7
O 80-14
A 85-3
85-4
Ba(ppm)
0
1000 -0
500 - Biogenic U.11
U..UJP
0
2500 - (b)
0.00 2.00 4.00 6.00 8.00 10.00
Al (%)
Figure 50. (a) Concentration of aluminum vs. the concentration of iron in sediment coreand sediment trap samples. (b) Barium vs. iron for the same samples. Both plots aretaken from Dymond and Collier (1990).
8.00 10.004.00 6.00
Al (%)
2.00
Precipitate2000 -
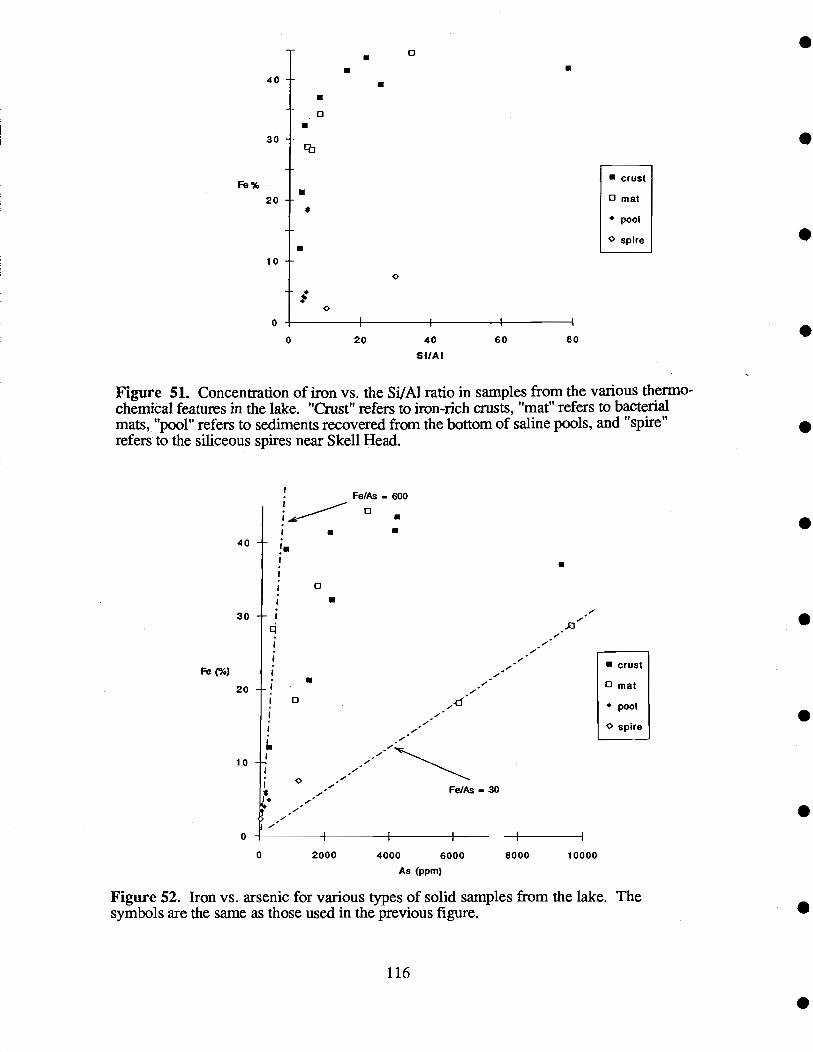
116
crust
0 mat
pool
0 spire
Fe%
40
3Ô
20 -
10 -
0
-
U-
U
U
U
U
0
U
U
0U
0
crust
0 mat
pool
spire
0 2000 4000 6000 8000 10000
As (ppm)
Figure 52. Iron vs. arsenic for various types of solid samples from the lake. Thesymbols are the same as those used in the previous figure.
0 20 40 60 80
SIIAI
Figure 51. Concentration of iron vs. the Si/Al ratio in samples from the various thermo-chemical features in the lake. "Crust" refers to iron-rich crusts, "mat" refers to bacterialmats, "pool" refers to sediments recovered from the bottom of saline pools, and "spire"refers to the siliceous spires near Skell Head.
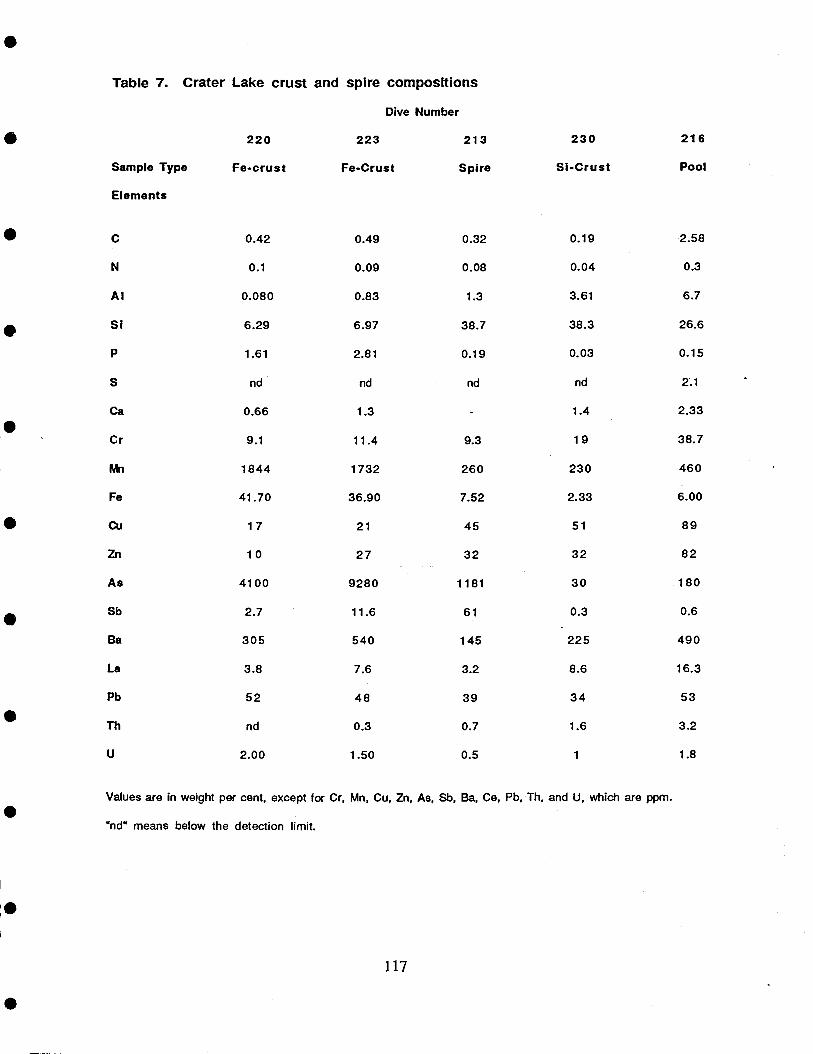
Table 7. Crater Lake crust and spire compositions
Dive Number
220 223 213 230 216
Sample Type Fe-crust Fe-Crust Spire Si-Crust Pool
Elements
.
117
Values are in weight per cent, except for Cr, Mn, Cu, Zn, As, Sb, Ba, Ce, Pb, Th, and U, which are ppm.
"nd" means below the detection limit.
0.42 0.49 0.32 0.19 2.58
N 0.1 0.09 0.08 0.04 0.3
Al 0.080 0.83 1.3 3.61 6.7
Si 6.29 6.97 38.7 38.3 26.6
P 1.61 2.81 0.19 0.03 0.15
S nd nd nd nd 2.1
Ca 0.66 1.3 1.4 2.33
Cr 9.1 11.4 9.3 19 38.7
1844 1732 260 230 460
Fe 41.70 36.90 7.52 2.33 6.00
Cu 17 21 45 51 89
Zn 10 27 32 32 82
As 4100 9280 1181 30 180
Sb 2.7 11.6 61 0.3 0.6
Ba 305 540 145 225 490
La 3.8 7.6 3.2 8.6 16.3
Pb 52 48 39 34 53
Th nd 0.3 0.7 1.6 3.2
U 2.00 1.50 0.5 1.8
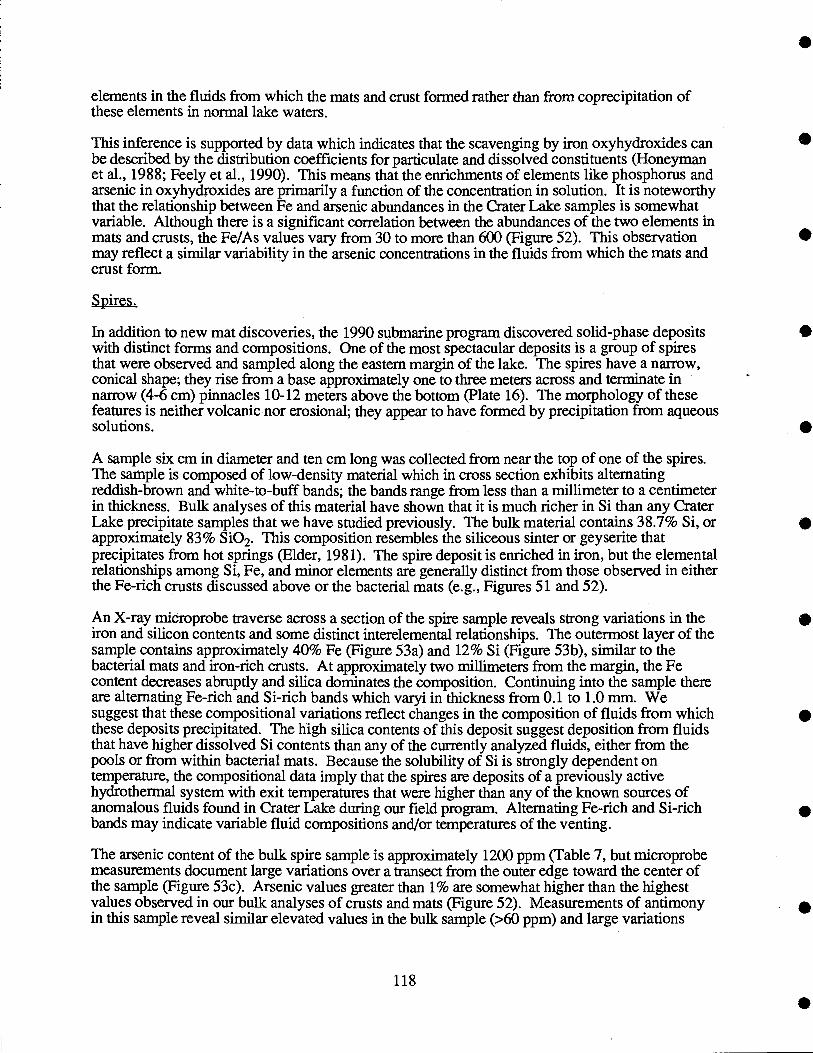
elements in the fluids from which the mats and crust formed rather than from coprecipitation ofthese elements in normal lake waters.
This inference is supported by data which indicates that the scavenging by iron oxyhydroxides canbe described by the distribution coefficients for particulate and dissolved constituents (Honeymanet al., 1988; Feely et al., 1990). This means that the enrichments of elements like phosphorus andarsenic in oxyhydroxides are primarily a function of the concentration in solution. It is noteworthythat the relationship between Fe and arsenic abundances in the Crater Lake samples is somewhatvariable. Although there is a significant correlation between the abundances of the two elements inmats and crusts, the Fe/As values vary from 30 to more than 600 (Figure 52). This observationmay reflect a similar variability in the arsenic concentrations in the fluids from which the mats andcrust form.
Spires.
In addition to new mat discoveries, the 1990 submarine program discovered solid-phase depositswith distinct forms and compositions. One of the most spectacular deposits is a group of spiresthat were observed and sampled along the eastern margin of the lake. The spires have a narrow,conical shape; they rise from a base approximately one to three meters across and terminate innanow (4-6 cm) pinnacles 10-12 meters above the bottom (Plate 16). The morphology of thesefeatures is neither volcanic nor erosional; they appear to have formed by precipitation from aqueoussolutions.
A sample six cm in diameter and ten cm long was collected from near the top of one of the spires.The sample is composed of low-density material which in cross section exhibits alternatingreddish-brown and white-to-buff bands; the bands range from less than a millimeter to a centimeterin thickness. Bulk analyses of this material have shown that it is much richer in Si than any CraterLake precipitate samples that we have studied previously. The bulk material contains 3 8.7% Si, orapproximately 83% Si02. This composition resembles the siliceous sinter or geyserite thatprecipitates from hot springs (Elder, 1981). The spire deposit is enriched in iron, but the elementalrelationships among Si, Fe, and minor elements are generally distinct from those observed in eitherthe Fe-rich crusts discussed above or the bacterial mats (e.g., Figures 51 and 52).
An X-ray microprobe traverse across a section of the spire sample reveals strong variations in theiron and silicon contents and some distinct interelemental relationships. The outermost layer of thesample contains approximately 40% Fe (Figure 53a) and 12% Si (Figure 53b), similar to thebacterial mats and iron-rich crusts. At approximately two millimeters from the margin, the Fecontent decreases abruptly and silica dominates the composition. Continuing into the sample thereare alternating Fe-rich and Si-rich bands which varyi in thickness from 0.1 to 1.0 mm. Wesuggest that these compositional variations reflect changes in the composition of fluids from whichthese deposits precipitated. The high silica contents of this deposit suggest deposition from fluidsthat have higher dissolved Si contents than any of the currently analyzed fluids, either from thepools or from within bacterial mats. Because the solubility of Si is strongly dependent ontemperature, the compositional data imply that the spires are deposits of a previously activehydrothermal system with exit temperatures that were higher than any of the known sources ofanomalous fluids found in Crater Lake during our field program. Alternating Fe-rich and Si-richbands may indicate variable fluid compositions and/or temperatures of the venting.
The arsenic content of the bulk spire sample is approximately 1200 ppm (Table 7, but microprobemeasurements document large variations over a transect from the outer edge toward the center ofthe sample (Figure 53c). Arsenic values greater than 1% are somewhat higher than the highestvalues observed in our bulk analyses of crusts and mats (Figure 52). Measurements of antimonyin this sample reveal similar elevated values in the bulk sample (>60 ppm) and large variations
118
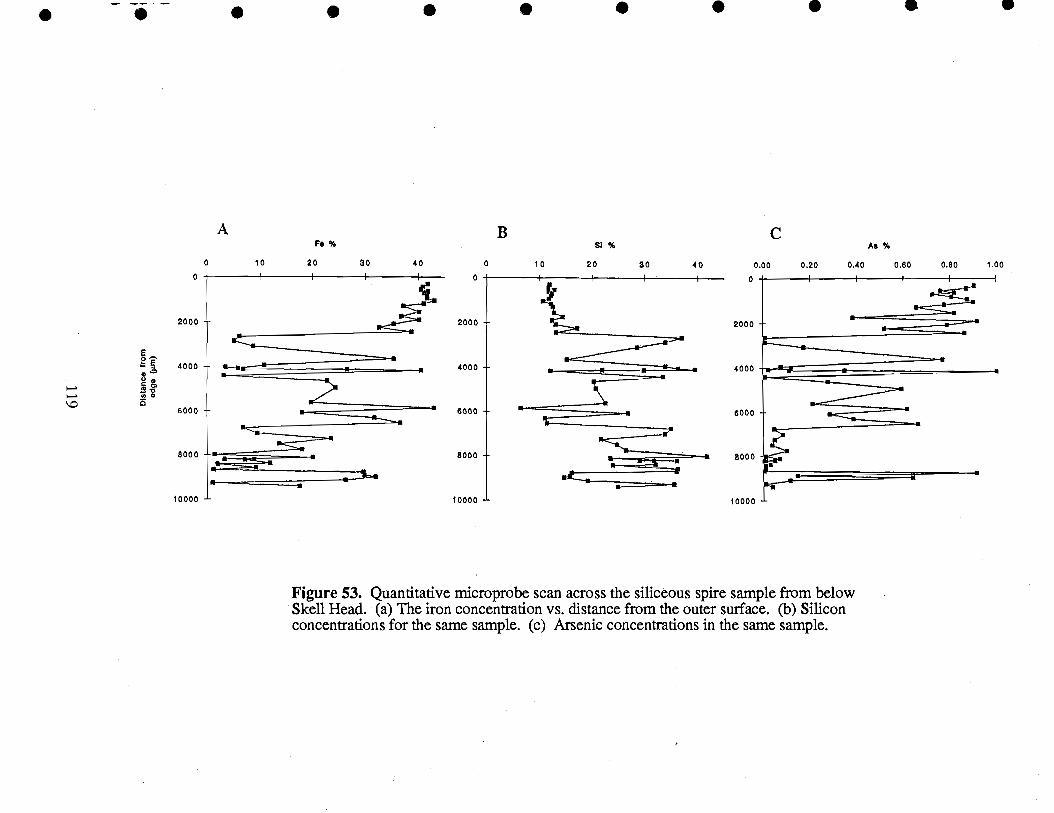
CAs%
20 30 40 0.00 0.20 0.40 0.60 0.80 1.00
I 0I
2000 -
a 4000
U.10000
8000
Figure 53. Quantitative microprobe scan across the siliceous spire sample from belowSkell Head. (a) The iron concentration vs. distance from the outer surface. (b) Siliconconcentrations for the same sample. (c) Arsenic concentrations in the same sample.
S
0
AFe %
0 10 20 30 40
B
0 10
0
2000 2000 -
4000 -p 4000U
a6000 6000
8000 -8000 -.---___________
10000 - 10000 -
6000

along the microprobe transect The highest As and Sb concentrations are generally found insamples with high iron contents. However, as in crusts and mats, the Fe/As and the Fe/Sb valuesshow significant variations over the transect. The high and variable abundances of As and Sbsupport the hypothesis of precipitation from a hydrothermal source.
The tall, chimney-like morphology is unlike the typical siliceous sinter deposits that occur aroundsubaerial hot springs; these deposits are typically broad mounds (Don White, personalcommunication). The morphology is more akin to submarine black-smoker chimneys. It isprobable that spire morphology is characteristic of subaqueous precipitation. Fluids exiting from asubaqueous vent are not controlled by the same gravitational forces which result in downslopeflow, lateral spreading of fluids, and broad zones of precipitationin subaerial systems. Taken alltogether, the spire chemistry and morphology indicate subaqueous precipitation from ahydrothermal spring. No active flow was noted. it appears the hydrothermal activity is currentlyquiescent. The age of the deposit is unknown, but the spires appear to have their pnstine form.No broken or fallen spires were noted. The fact that the deposits are located at the base of thecaldera wall, the general location of frequent downslope debris flows and turbidites, suggests thatthese structures are not thousands of years old. Because the spires have steep surfaces, the lack ofsediment cover (Plate 16) does not constrain the age of the deposits. An attempt to measure the228Ra and 226Ra contents of this material was unsuccessful because the concentrations were toolow to determine if these isotopes were in radioactive equilibrium with their parent thorium anduranium isotopes. Consequently, the age of formation of the deposits is unknown.
Although nothing with the sizable dimensions and exact morphology of the spires has yet beenobserved in other parts of the lake, several other deposits either have similar features orcompositions that warrant comparison with the spire samples. One of these was observed within afew tens of meters from the bacterial mat sample where 18.9°C temperatures were recorded.There, small protuberances (approximately 20-30 cm) were attached to the same sloping surface onwhich the bacterial mats were growing. We were unable to collect a sample of these features, butthe color and morphology suggest they may be compositionally similar to the spire samples.
At another site, approximately 200 meters south of Llaos Bath, a protuberance on a sedimentedsloping surface was observed (Plate 20). Although chimney-like, the morphology of this featurediffers from either the large or small spire-like forms discussed above. Its friable texture made iteasy to break loose, and we recovered a sample which is listed in Table 7 as an iron crust fromdive CD 223. The general composition of this material is similar to other iron-rich crusts. It is anamorphous iron-oxyhydroxide with significant concentrations of Si. Minor element contents, as inmost crusts, are low except for As; this sample has the highest As concentration of any bulk solidsample analyzed (9300 ppm). 2Ra and 226Ra activities in this small spire were measured bygamma counting; both isotopes are present in excess of the 2Th and 238U activities. Because thehalf-life of 228Ra is 5.7 years, excess 228Ra activity indicates that this spire formed less than 30years ago.
A crust of unusual composition was recovered from the edge of Llao's Bath. A rock outcropcovered by a one centimeter thick crust extends into this pool (Plate 10). A sample of this coatingwas recovered with the submersible; it has a very high silica content and is similar to the bulk spiresample from the eastern margin of the lake (Table 7). This crust, however, has lower abundancesof iron and arsenic.
The precipitates, like many iron-rich precipitates, are composed mainly of material which iscryst1lographically amorphous to X-rays. The spire sample has the typical broad amorphoussilica spectrum, with possibly some cristobalite present (Figure 54a). There are also peaks fromvery minor amounts of feldspar and quartz, probably from cemented aluminosilicate debris fromthe caldera wall. The iron-rich crusts are highly amorphous (Figure 54b).
120
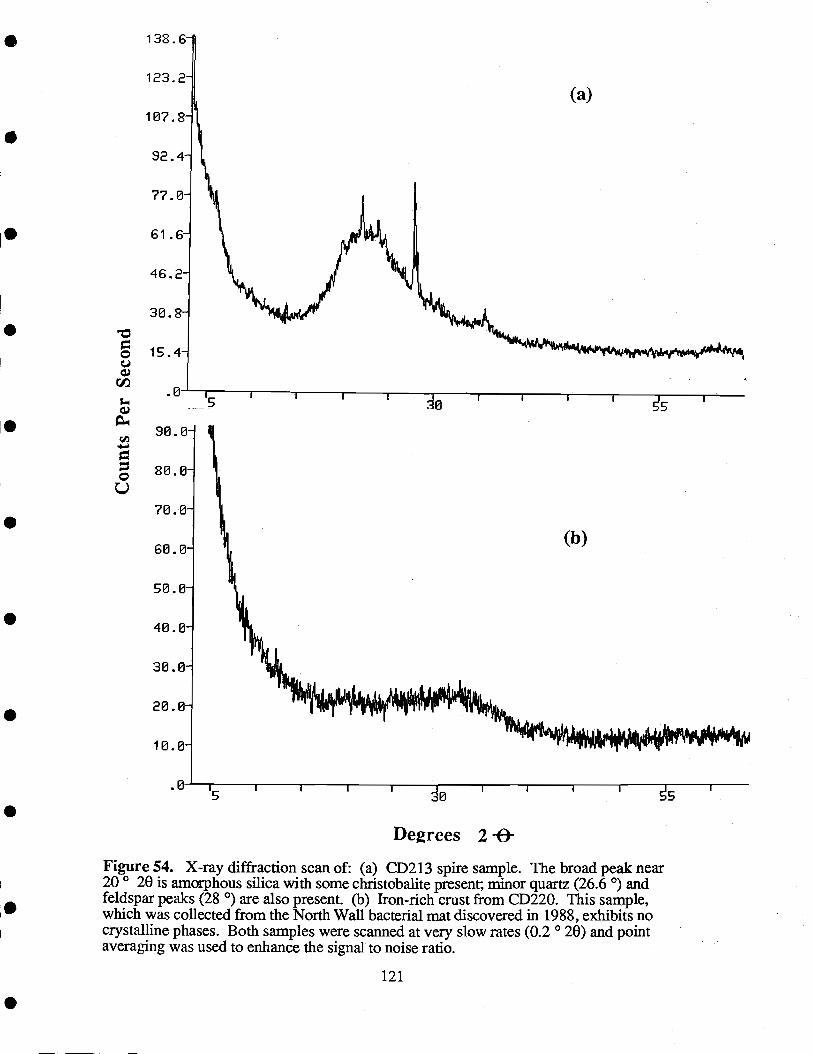
138.6-
123.2-
107.8-
92.4-
77.0-
61.6-
46.2-
30.8-
15.4-
90.0-
80.0-
70.8-
60..0-
50.8-
48.0-
38.6-
20.0-
10.8-
.0 1 I I
Degrees 2 -&Figure 54. X-ray diffraction scan of: (a) CD213 spire sample. The broad peak near200 20 is amorphous silica with some christobalite present; minor quartz (26.60) andfeldspar peaks (28 0) are also present. (b) Iron-rich crust from CD220. This sample,which was collected from the North Wall bacterial mat discovered in 1988, exhibits nocrystalline phases. Both samples were scanned at very slow rates (0.2020) and pointaveraging was used to enhance the signal to noise ratio.
121
(a)L
.0'5
1

Pool Sediments.
Solid samples from the pools were obtained either by box coring from the submarine or bypumping water and suspended particles into the water bottle. The pooi samples were composed ofvery black mud. The aluminium content of the pool samples, which range from four to fivepercent, indicate that volcanic aluminosilicate debris comprises 50 to 60 percent of the sample.However, there are small iron and silica enrichments over normal caldera wall material. Arsenicand minor metals also appear to be slightly enriched over typical Crater Lake sediments.
The pooi sediments have significant enrichments of sulfur and carbon (Table 7). Because thepools are essentially anoxic, sulfide precipitation is possible and the preservation of organic mattermight also be enhanced. Abundant organic matter and the presence of sulfides can account for theblack color of the mud.
Sediment Core Analyses.
The solid-phase chemical composition was determined on samples from two submersible-deployedbox cores, BC6 and BC8. Both cores were recovered within the Detailed Study Area. BC6 isfrom the Benthic Barrel site, a low relief, sedimented area which has elevated sedimenttemperatures (approximately 8°C at 75 centimeters sediment depth) and mottled sediments. BC8was recovered a few meters from the "brain mat", a bacteria/pool complex that lies 10-20 meterswest of Llao's Bath. Pore water analyses and advection-diffusion modeling suggest thatsignificant advection of fluids is occurring at both sites. Approximately 200 cm/year of upwardpore water flow is occurring at the BC6 site (Appendix F), while 100 cm/year is estimated at theBC8 site.
Both cores have compositional variations which cannot be explained by deposition of the biogenicor aluminosilicate components of Crater Lake sediments. Iron varies from 4% to nearly 10% inBC6 and from 4% to nearly 25% in BC8 (Figure 55a). Large ranges in concentration are alsoobserved for Mn (Figure 55b) and As (Figure 55c). The strong enrichment of Mn within the uppertwo centimeters of both cores suggests that this is a steady-state pattern resulting from advection ofmanganese-rich pore waters and precipitation within a surface oxic zone. Pore watermeasurements document high dissolved iron concentrations below approximately 10 cm in bothcores (Figure 56), indicating iron reduction below this depth. Steady state diffusion and advectionwith oxic precipitation above 10 centimeters could account for the increase in solid iron which isfound at 5 to 10 centimeters depth in each core. However, the strong increase in Fe and As at 18centimeters depth in BC8, indicates a deviation from purely steady-state diffusion/advection andprecipitation effects.
S S S S S S S
As (ppm)
100 200 00 400
Figure 55. Downcore variations in the concentrations of iron (A), manganese (B), and arsenic (C) in two box cores from thedetailed study area. BC6 was cored near the high temperature mats. BC8 was cored near the Llao's Bath/brain mat complex.(A) Iron vs depth. (B) Manganese vs depth. (C) Arsenic vs depth.
A B
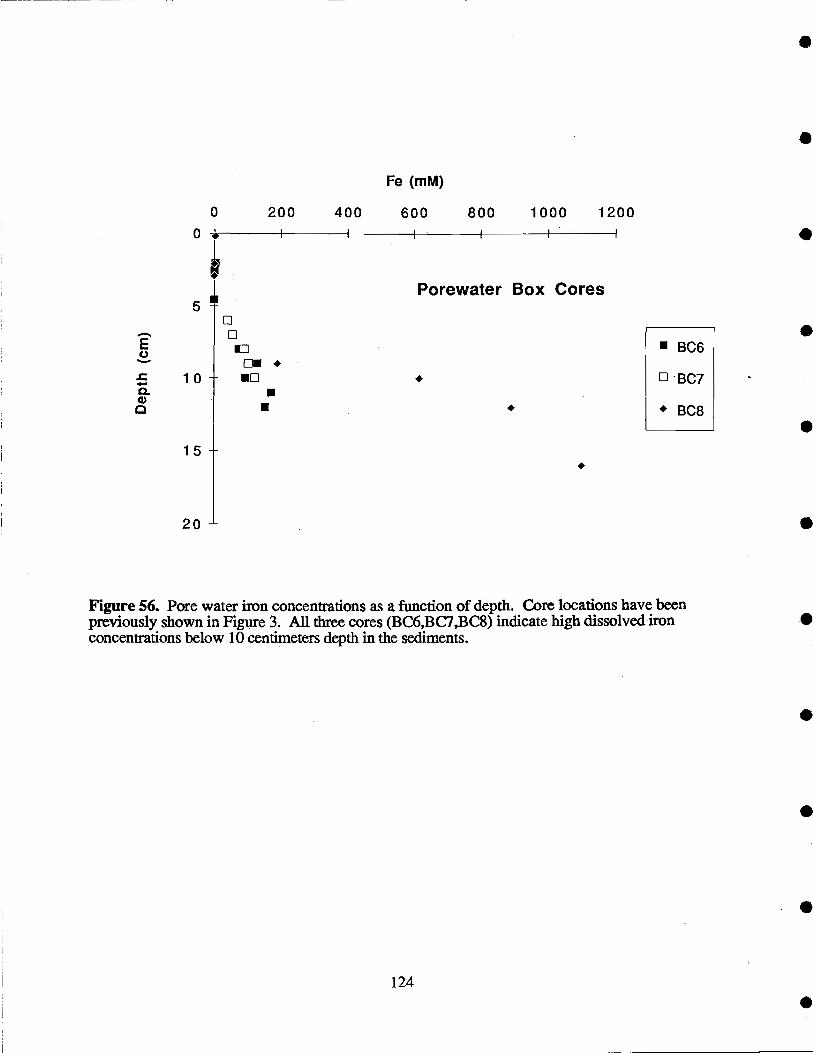
Fe (mM)
200 400 600 800 1000 12000
aPorewater Box Cores
5
Figure 56. Pore water iron concentrations as a function of depth. Core locations have beenpreviously shown in Figure 3. All three cores (BC6,BC7,BC8) indicate high dissolved ironconcentrations below 10 centimeters depth in the sediments.
124
00
C., o . BC6
4-a.10 D
Uo BC7
C)U BC8
15-
20 -
IV. Discussion
IV.1. Geological Setting of Features in the Detailed Study Area
Regional Setting.
Mount Mazama is a major site of Quaternary volcanism in the volcanic arc known as the OregonCascade Range. This volcanism is linked to the subduction and melting of the Juan de Fuca Platebeneath the North American Plate. The central Oregon segment of the Cascades, which includesMount Mazama, has the highest regional rates for volcanic extrusion found in the entire 1200 kmrange of the Cascades (Sherrod and Smith 1990). Large areas of high regional conductive heatflow coincide with this magmatic activity (Blackwell et al., 1982; Blackwell et al., 1990;Ingebritsen et al., 1989). Moreover, the total convective discharge of thermal waters in the Oregonsegment of the Cascades is the highest measured within the volcanic arc (Mariner et al., 1990).
The dramatic physiographic setting of Crater Lake is a consequence of the relatively recentvolcanism of Mount Mazama. Although the major explosive eruption which led to caldera collapseand the formation of the Crater Lake basin occurred 6845±50 years ago, Mount Mazama has beenan eruptive center for approximately 400,000 years (Bacon and Lanphere, 1990). Within a fewhundred years after the climactic eruption, andesitic outpourings within the caldera producedWizard Island, Miriam Cone, and the so-called Central Platform on the east side of Wizard Island(Bacon and Druitt, 1988; Nelson et al., 1988). The most recent activity within the mountain isthought to be a small rhyodacite dome extruded on the east flank of Wizard Island approximately4,000 years ago (Bacon and Lanphere, 1990).
Because of the relatively recent volcanism of Mount Mazama, thermal springs and/or other modesof hydrothermal activity might reasonably be expected. Such features could be driven by theresidual heat of cooling intrusive bodies within the mountain or a residual magma chamber. On thebasis of gravity data, Williams and Finn (1985) infer a dense mass of intrusive material a fewkilometers below the floor of Crater Lake. Fumaroles and thermal springs are found near thecrests of some other nearby volcanoes, for example, Mt. Hood (Steele et al., 1982) and NewberryCrater (Mariner et al., 1990). In general, however, the majority of the Cascade thermal springs arefound away from the central axis of the volcanic arc (Blackwell et al., 1982; Ingebritsen et al.,1989). In addition, the upper 200 to 1000 meters of young volcanic crust in the high Cascades isnearly isothermal (and therefore has low conductive heat flow). These observations have led to theproposal that ground water circulation away from the crest of the high Cascades transports heateast and west to lower elevations where it is discharged in thermal springs (Ingebritsen et al.,1989).
The hydraulic effects hypothesized for the high Cascades are expressed on a more local scale by anumerical simulation of the hydraulic system under Crater Lake and Mount Mazama (Sanimel andBenson, 1987). Although the model is not based on measured geothermal gradients orpermeabilities in the crust beneath Crater Lake, it indicates that the regional ground-water flow fieldwill transport fluids away from the lake. Nonetheless, several variations of Sammel and Benson's1987 model exhibit a convective upflow of warm water into the lake that is driven by heat from ahypothesized deep intrusive body.
125
The thennal structure of Newbeny Volcano, an eruptive center 95 km to the northeast of MountMazaina, can be used as an analogue to the Crater Lake/Mount Mazama system. AlthoughNewberry is more shield-like than the Mazama stratocone, the volcano has a collapsed caldera,which now contains two lakes, and a volcanic history which extends from 500,000 years to 1,300years before present (Fitterman, 1988). Consequently, Newberry has some of the same structuralfeatures and volcanic history as Mount Mazama, but its thermal structure has been documented bydeep drilling data. Drilling on the volcanic slopes outside the Newbeny caldera revealed a shallowisothermal zone (Swanberg et aL, 1988), which may reflect meteoric recharge near the summit andthrough the flanks of the volcano. Nevertheless, vertical advection of thermal waters at NewberryVolcano is also indicated by the presence of thermal springs on the margins of the caldera lakes(Mariner et al., 1990) and the existence of temperatures as high as 265°C at depths less than onekilometer below the caldera floor (Sammel, 1981; Sammel et al., 1988). Hydrothermal modelingsuggests that upward convection in the Newberry Volcano takes place only in localized zones ofhigh vertical permeability, such as intrusive conduits or ring fractures (Sammel et al., 1988).These modeling results are similar to numerical simulations for Mount Mazama (Sammel andBenson, 1987)
In summary, the available thermal gradient data and ground-water flow simulations indicate thatthere are few hydrothermal oufflows at the crests of the most recent Cascade volcanic centers.Much of the upper crust is characterized by near-isothermal conditions except where structuralfeatures provide conduits which favor the vertical advection of water heated by underlyingmagmatic bodies. At these sites of enhanced permeability, upward flow of thermal fluids results inexceptional thermal gradients and, in some cases, thermal springs. Such patterns are consistentwith the possibility of hydrothermal inputs into the deep basins of Crater Lake.
General Bathymetry.
The original caldera morphology of Mount Ma7ama has been modified by the subsequentdevelopment of volcanic edifices, by erosion of the caldera wall, and by basin sedimentation.Wizard Island, the submerged Miriam Cone, and a shallow area to the east of Wizard Island (theCentral Platform) are the major constructional volcanic features within the basin (Figure 57). TheSouth Basin and the North Basin are the major depositional basins of the lake. These basins formlarge areas of low relief which are covered by 30 to 60 meters of volcanoclastics, turbidites, andfine lacustrine sediments (Barber and Nelson, 1990).
The Detailed Study Area is located in a geologically complex portion of the Crater Lake basin. Thebase of the relatively shallow Wizard Island platform bounds the northern edge of the area.Crossing diagonally through the study area with a NE-SW orientation is a zone of rather steeptopography which descends from local high spots of 380 to 405 meters depth in the southern partof the study area to basin depths of 450 to 475 meters in the center of the area (Figures 1 and 2).The entire Detailed Study Area and much of the South Basin lie within a pmposed ring fracturezone (Figure 57). This feature was first identified by Bacon (1983) as a zone of volcanism duringcaldera collapse. Wizard Island and Miriam Cone fall within the fracture zone. More recentlyNelson et al. (1988) pointed out that this zone marked the maximum depths of acoustic basementand included the two areas of high heat flow that were defined by Williams and Von Herzen(1983). A saddle between the South Basin and the deeper North Basin of Crater Lake is formedby the elevated topography on the north and south margins of the area. This saddle lies within thering fracture zone. It may be significant that anomalous bottom waters, bacterial mats, pools Of
more saline water, and siliceous deposits of probable hydrothermal origin all are found within orclose to the proposed ring fracture zone. Many of these features are found within a few meters to afew tens of meters from the change in slope that occurs at the base of the steep caldera wall.
Chaski Slide.
The elevated topography on the south side of the Detailed Study Area may be an extension of asubaqueous portion of the Chaski Bay Slide, a prominent catastrophic feature on the south calderawall. An acoustic proffle across the southern edge of our Detailed Study Area shows the presenceof chaotic beds beneath the flat-lying turbidites and slowly accumulating lake sediments (Nelson etal., 1988). The lake bathymetry (Byrne, 1965) exhibits a deflection of the depth contours into theSouth Basin away from the subaerial portion of the Chaski Bay Slide. Nelson et al. (1988), usethe bathymeiry and the chaotic acoustic siratigraphy as evidence of debris flow and avalanchedeposits at this location. They suggest that deposits of this type formed in response to seismicactivity in association with post-caldera volcanism that began soon after the caldera collapsed. Thehummocky topography, which is revealed by our finer-scale bathymetry (Figure 2, Figure 7), isalso compatible with a debris flow.
The area identified as a possible debris flow terminates near the middle of our Detailed Study Area.Its northern limit may coincide with escarpments and steep rock outcrops which we observed in theregion from the submersible. Some of the bacterial mats were found on the face of one of theescarpments, and other mats were found on flat lying sediments near the base of cliffs. Theassociation of the escarpments with the bacterial mats suggests that these cliffs may be related tothe origin of the anomalous fluids that provide a chemosynthetic energy source for the bacteria. Ifthe escarpments mark a fault, perhaps part of a ring-fracture zone that has continued to subsidesince the original caldera collapse, then the association may simply be due to the fact that faultsprovide a conduit for convecting waters. Movement on this hypothetical fault would maintain theconduit and prevent the blockage of flow by crack-filling precipitation of hydrothermal minerals.From a seismic reflection record through our Detailed Study Area (Nelson et al., 1988), it ispossible to infer that normal faulting has occurred in the region where we observe scarps.However, because of the difficulty in interpreting chaotic beds in the record, such an interpretationis equivocal. Nonetheless, faulting does provide a mechanism for maintaining the exposure of thechaotic beds despite the deposition of a relatively thick sequence of turbidites and more slowlydeposited sediments.
Semi-consolidated sediments within the Detailed Study Area have vertical displacements of 0.5 to 2meters (Plate 4) which appear to mark the locations of recent normal faulting. For three of thesefeatures, our navigation and documentation was sufficient to define their alignment. All three havea general northeast-southwest trend and are down-dropped to the northwest. Two of the apparentfaults are located within the general area where the high temperature mats are located (Figures 8,9,and 43). The third is near the north wall mats. Although bacterial mats were not observed directlyon these zones of vertical displacement, the proximity of the mats, the elevated temperatures, andthe apparent faults are all consistent with a fault-induced permeability that allows verticalconvection of fluids through the crust. As indicated by the hydrologic modeling of Crater Lake(Sanimel and Benson, 1987) and Newberry Volcano (Sammel et al., 1988), enhanced permeabilityzones beneath the caldera floor will result in vertical convection of waters that have been heated byintrusive magmatic features in the cores of these volcanoes.
127
The escaiments and rock outcrops in the middle of the Detailed Study Area could also mark thenorthern limit of the debris flow comprising the Chaski Slide. If this is the case, any causal orspatial relationship between the possible hydrothermal activity and the debris flow is less clear.Possibly, the debris flow forms a cap over the ring-fracture zone and directs hydrothermal flow tothe face of the cliff that marks the termination of the chaotic beds. It is more reasonable, however,to think that the debris flow, if it is composed of large blocks, is more permeable than horizontally-bedded lake sediments that have accumulated over the past 5000 to 6000 years of lake history. Ifthis is the case, deposition of the debris flow on top of a ring-fracture zone may provide pathwaysfor fluid flow that extend from deep within the volcano to the lake floor (Barber and Nelson,1990). In any case, the chaotic beds in the deeper parts of our Detailed Study Area are overlain by20 to 25 meters of flat-lying lake sediments (Nelson et aL, 1988). This indicates the landslideevent must have taken place early in lake history.
The visual and photographic evidence suggests that the cliff faces where bacterial mats are foundand the outcrops common on the steeper portions of the Detailed Study Area are composed ofhydrothermally-altered rock. The fact that much of the rock making up the south caldera wall andthe Chaski Slide is also hydrothermally altered and similar in appearance to the the submergedoutcrops (C. Bacon, personal communication), supports the concept that many of the submergedoutcrops are exposures of an earlier debris flow. Because the Chaski Slide rocks are at least200,000 years old (C. Bacon, personal communication), the alteration predates the climacticeruption considerably. However, in some cases, the sediments adjacent to the subaqueous clifffaces appeared to be highly altered, an observation which may indicate that at least some in situalteration has also occurred there.
Implications of the Palisades Point Thermal-Chemical Features.
The presence of bacterial mats, pools, and elevated temperatures at Palisades Point indicates thatthermal features are not limited to the portion of the lake affected by the large landslide events, suchas the Chasid Slide. The subaqueous topography extending off Palisades Point is among thesteepest found within the lake (Figure 1). There is no bathymetric evidence for major slumping orlandslide features. The steep topography at this site is a consequence of a step-like pattern ofsequential vertical wall and talus slope couplets. This topography is probably what should beexpected from normal faulting following the climactic eruption, and not the result of catastrophicfailure of portions of the caldera wall.
The Palisades Point area and the Detailed Study Area do share a proximity to what has beenidentified as a ring fracture zone (Figure 57). This zone was previously defmed by the existence ofintercaldera volcanic features, Wizard Island and Miriam Cone, as well as by the high heat flowsites found by Williams and von Herzen (1983). In fact, the studies of Williams and Von Herzen(1983) defined an area of anomalous heat flow less than one kilometer southwest of our PalisadesPoint thermal features. It is possible that both observations are related to the ring fracture zone.
A linkage between the fracture zone and the Palisades Point features is reasonable if the source ofthe fluids which supply the thermally and chemically enriched inputs to the mats and pools is deepbeneath the lake. As discussed above, occasional movements on the fracture zone would helpmaintain a conduit for convecting fluids. Likewise, the Skell Head spires, which havemorphologies and chemical compositions similar to hydrothermal deposits, are also located justshoreward of the ring fracture zone. Since very little of the area near the break in slope has been
128
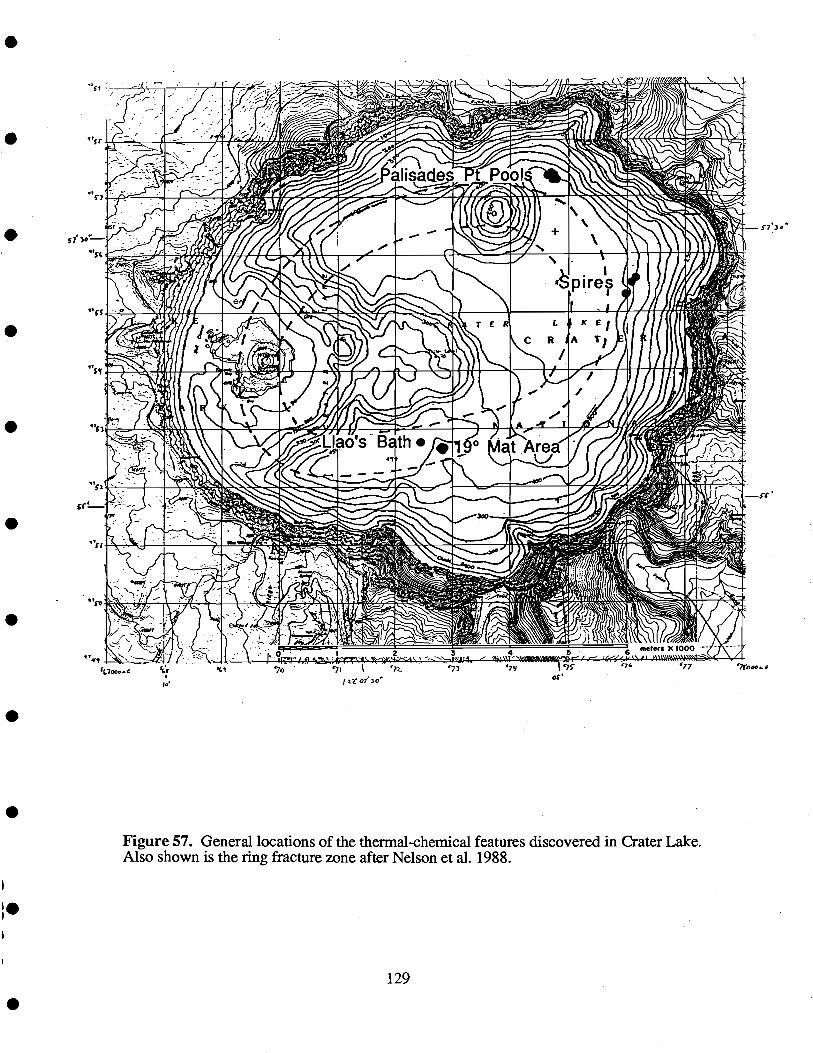
Figure 57. General locations of the thermal-chemical features discovered in Crater Lake.Also shown is the ring fracture zone after Nelson et al. 1988.
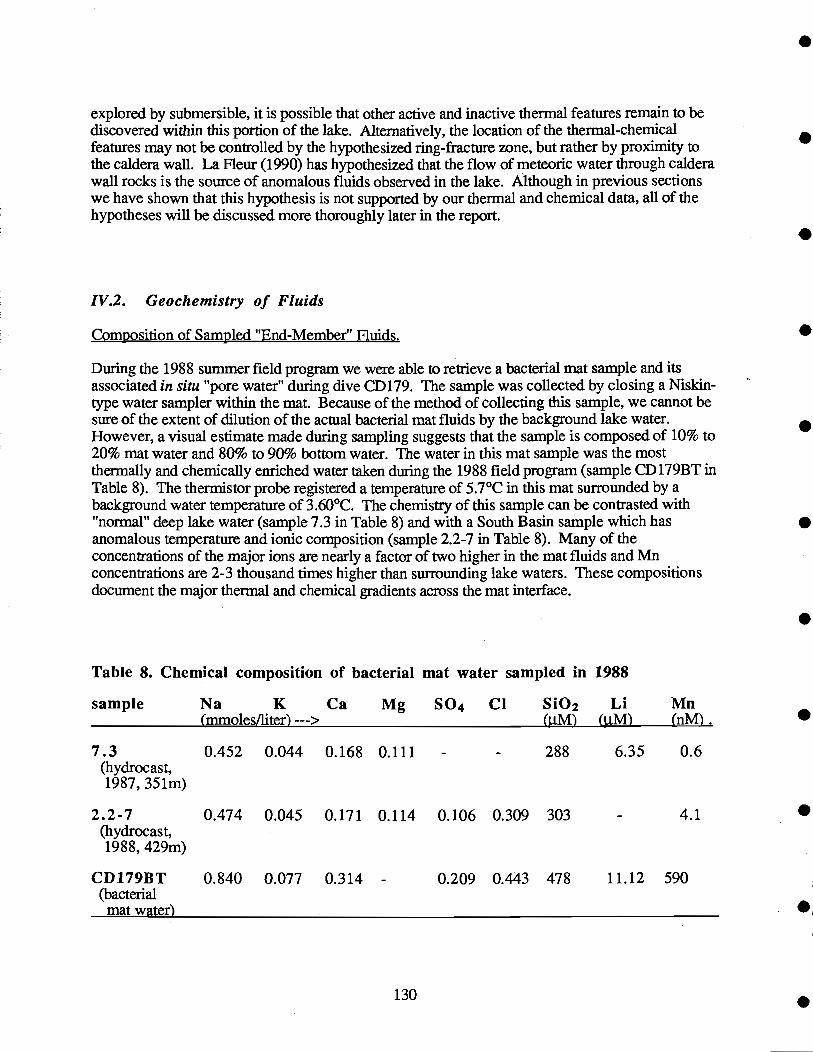
explored by submersible, it is possible that other active and inactive thermal features remain to bediscovered within this portion of the lake. Alternatively, the location of the thermal-chemicalfeatures may not be controlled by the hypothesized ring-fracture zone, but rather by proximity tothe caldera wall. La Fleur (1990) has hypothesized that the flow of meteoric water through calderawall rocks is the source of anomalous fluids observed in the lake. Although in previous sectionswe have shown that this hypothesis is not supported by our thermal and chemical data, all of thehypotheses will be discussed more thoroughly later in the report.
IV.2. Geochemistry of Fluids
Composition of Sampled "End-Member" Fluids.
During the 1988 summer field program we were able to retrieve a bacterial mat sample and itsassociated in situ "pore water" during dive CD 179. The sample was collected by closing a Niskin-type water sampler within the mat. Because of the method of collecting this sample, we cannot besure of the extent of dilution of the actual bacterial mat fluids by the background lake water.However, a visual estimate made during sampling suggests that the sample is composed of 10% to20% mat water and 80% to 90% bottom water. The water in this mat sample was the mostthermally and chemically enriched water taken during the 1988 field program (sample CD179BT inTable 8). The thermistor probe registered a temperature of 5.7°C in this mat surrounded by abackground water temperature of 3.60°C. The chemistry of this sample can be contrasted with"normal" deep lake water (sample 7.3 in Table 8) and with a South Basin sample which hasanomalous temperature and ionic composition (sample 2.2-7 in Table 8). Many of theconcentrations of the major ions are nearly a factor of two higher in the mat fluids and Mnconcentrations are 2-3 thousand times higher than surrounding lake waters. These compositionsdocument the major thermal and chemical gradients across the mat interface.
Table 8. Chemical composition of bacterial mat water sampled in 1988
130
sample Na K(mmoles/liter) --->
Ca Mg SO4 Cl Si02(.tM)
Li(tM)
Mn(nM).
7.3(hydrocast,1987, 351m)
2.2-7(hydrocast,1988, 429m)
CD179BT(bacterialmat water
0.452
0.474
0.840
0.044
0.045
0.077
0.168
0.171
0.314
0.111
0.114 0.106
0.209
0.309
0.443
288
303
478
6.35
-
11.12
0.6
4.1
590
In 1989, we were able to sample a variety of new fluids including the warm brines collecting inpools at the bottom of the lake ("Llao's Bath" and "Palisade Pool", Plates 9,10,13, 14) and porewater samples from a number of locations throughout the lake. We also sampled several morebacterial mat pore fluids. Table 9 shows a composite list of these various fluids which appear to bethe "least diluted" by lake water during sampling and best represent the "end-member" compositionof fluids entering the lake. The concentration of dissolved oxygen in the Palisade Pool sample wasvery nearly zero (Table 9) indicating that this sample could have only a small amount of"contamination" from the well-oxygenated bottom water. Furthermore, the pool fluids resemblethe pore water concentrations indicating that the pool brines represent relatively undiluted chemicalend-members. We will use these end-member compositions in a variety of geochemical and massbalance calculations in our discussions below.
The composition of these end-members is quite different than that of most cold springs in theCrater Lake area, which attain their composition through normal low temperature weatheringprocesses (Nathenson and Thompson, 1990). Also, for comparison to the Crater Lake samples,we have included our analyses of the thermal spring at East Lake within the Newberry Calderalocated 95 km to the northeast. Analyses of this sample, collected in September, 1989, are similarto the concentrations reported by Mariner et al. (1990) for an East Lake hot spring sample collectedin June, 1982. The spring has an outlet temperature of 57°C and is associated with a complexhydrothermal system which reaches temperatures of at least 265°C at 932 meters below the calderafloor (Sammel et al., 1988). The major cation concentrations in this hot spring are quite similar tothe Llao's Bath and Palisades Pool samples (Table 9). While springs at both Crater Lake andNewberry Crater have relatively high concentrations of Mg, their other cation concentrations aregenerally included within the wide range of compositions of thermal springs in Oregon andWashington (Mariner et al., 1990). The concentration of chloride in the East Lake spring isanomalously low compared to the Crater Lake warm springs and other regional thermal springs.The anion charge balance for both sites is dominated by bicarbonate.
The pore waters, sampled for the first time in 1989, significantly expanded our list of sampled end-members. A first order similarity between pore water compositions and pool waters is suggestedby their comparable Cl and Na concentrations and proportions (Figure 22). However, variabilitythat seems to exceed analytical precision exists both between pools and pore waters and among thepore waters. Because this variability is relatively subtle, it is best observed by examination ofelemental ratios. For example, variations in the Ca/Na contents appear to distinguish between bothsediment-pore water reaction effects and advection of a relatively homogeneous fluid (Figure 24c).Reaction is indicated by the increase in Ca/Na with little increase in Cl contents in GC1, a trendwhich reflects the relative immobility of Na and low abundance of Cl in the aluminosilicates thatcomprise the sediments. In contrast, cores whose pore water gradients indicate appreciableadvection, have somewhat lower Ca/Na than lake waters and appreciable enrichments in Cl.Variations of similar scale exist for other element pairs reflecting differences in the enrichments ofthe different ions in advecting fluids as well as their reactivity during low temperature weathering.We emphasize that the reaction effects are subtle and only apparent by examining elemental ratiosand only then by contrasting cores with different apparent advection rates.
As discussed by Wheat (Appendix F), gravity cores GC8 and GC13 have the most non-linearconcentration-depth profiles and thus the highest apparent advection rates of all of the gravitycores. The deeper portions of these cores tend to have the highest ion concentrations of any fluidsobserved in the lake and appear to have distinctive elemental ratios for the less reactive elements.For example, the Li/Na values of GC8 and GC13 are higher than either the lake values or those for
131
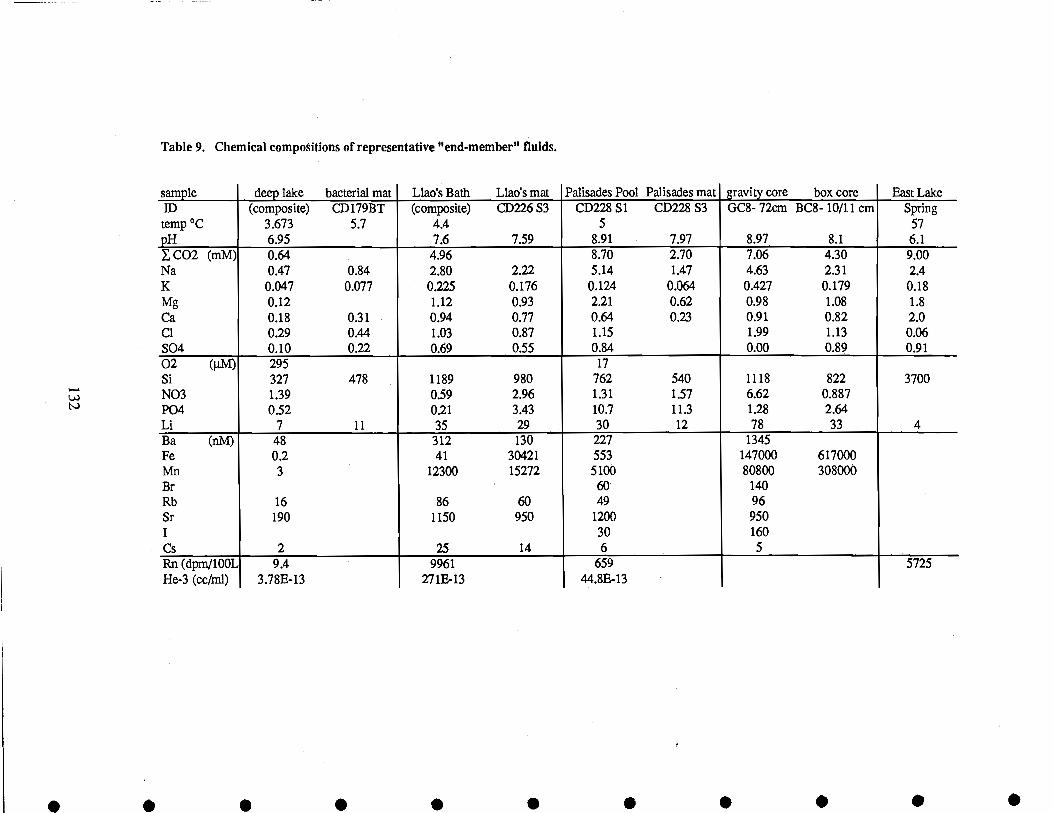
Table 9. Chemical compositions of representative "end-member" fluids.
sample deep lake bacterial mat Llao's Bath Llao's mat Palisades Pool Palisades mat gravity core box core Fi.ct LakeID (composite) CD179BT (composite) CD226 S3 CD228 Si CD228 S3 008- 72cm BC8- 10/il cm Springtemp °C 3.673 5.7 4.4 5 57pH 6.95 7.6 7.59 8.91 7.97 8.97 8.1 6.1
CO2 (mM) 0.64 4.96 8.70 2.70 7.06 4.30 9.00Na 0.47 0.84 2.80 2.22 5.14 1.47 4.63 2.31 2.4K 0.047 0.077 0.225 0.176 0.124 0.064 0.427 0.179 0.18Mg 0.12 1.12 0.93 2.21 0.62 0.98 1.08 1.8Ca 0.18 0.31 0.94 0.77 0.64 0.23 0.91 0.82 2.0Cl 0.29 0.44 1.03 0.87 1.15 1.99 1.13 0.06SO4 0.10 0.22 0.69 0.55 0.84 0.00 0.89 0.9102 (p.M) 295 17Si 327 478 1189 980 762 540 1118 822 3700NO3 1.39 039 2.96 1.31 1.57 6.62 0.887PO4 032 0.21 3.43 10.7 11.3 1.28 2.64Li 7 11 35 29 30 12 78 33 4Ba (nM) 48 312 130 227 1345Fe 0.2 41 30421 553 147000 617000Mn 3 12300 15272 5100 80800 308000Br 60 140Rb 16 86 60 49 96Sr 190 1150 950 1200 950I 30 160Cs 2 25 14 6 5Rn(dpm/100L 9.4 9961 659 5725He-3 (cc/mi) 3.78E-13 271E-13 44.8E-13
Llao and Palisades Point pools. Likewise, GC8 has lower Na/Cl values than either of the poollocations; however, Na/Cl both in these pore waters and the pools are still higher than thoseobserved in the lake. It is tempting to view the deeper fluids in GC8 and GC13 as an advectingpore water end-member. Since both cores are from approximately the same location near the high-temperature mat region (Wheat, Appendix F, Figure 1), the regional significance of this fluid end-member is uncertain.
Geothermometry.
If we assume that the brine fluids were at equilibrium with a solid mineral phase or authigenicprecipitate in a geothermal system below the lake floor, then we can consider applying any of avariety of empirical chemical geothermometers to estimate the temperature at which this chemicalequilibrium was reached (Foumier, 1981). In general, however, the approach to equilibrium iskinetically favorable only at relatively high temperatures (>150°C). The application ofgeothemiometers at lower temperatures must be carried out with caution. In order for anygeothermometer model to work, a geothermal fluid must reach equilibrium with a solid phase at insitu temperatures, and then it must retain that equilibrium composition during conductive cooling.These conditions axe only possible if the kinetics of re-equilibration with secondary phases is slowwith respect to the rate of cooling such that the water preserves a "memory" of the higherequilibration temperature. Obviously, mixing of a high temperature geothermal water with any lowtemperature meteoric water can also affect the composition and therefore the predicted temperaturesgiven by many geothermometers. This is absolutely the case for any single-variablegeothermometers (e.g. the various Si02 solubifity systems), and any mixing will invalidate theirdirect application. Other geothermometers describe exchange equilibria through ratios of ions (e.g.Na/Li). In principle, these are less sensitive to mixing as long as the diluting fluid has insignificantconcentrations of the geothermometer's ions.
It is important to contrast the way that the quartz (silica) geothermometers have been used in marinehydrothermal systems with their common application in continental geothermal wells. The firstactive marine hydrothermal vents discovered, located at the Galapagos Spreading Center, weresampled in 1977 and the chemical compositions and quartz geothermometry of these fluids werediscussed by Edmond et al. (1979). A more detailed discussion of various Si02 - T systematicsapplied to the Galapagos system is given by Herzig et al. (1988). The primary difference in thissystem is that it is dominated by mixing of the high temperature end-member with cool seawater -not by conductive cooling. All the samples fall along a single mixing line between the warmestsample collected (12.1°C, 775 jM Si) and background seawater (2.0°C, 165 .tM Si). Mixing isthe dominant control on the range of Si concentrations in the samples; t the end-membertemperature. Applying a closed system quartz geothermometer to any of these individual fluids ismeaningless: the direct calculation of the quartz geothermometer temperature for the warmest end-member sampled at the Galapagos would predict an equilibrium temperature of less than 100°C.Independent evidence shows that these fluids equilibrated at temperatures near 3 50°C. However,by incorporating mixing in the model, geothermometry can still be used. Because of the tightmixing line, we are able to extrapolate the Si-T relationship to the point where it intersects thequartz solubility curve above 300°C. Once the hydrothermal fluid reaches these high temperatures,equilibrium with quartz is rapidly established and subsequent mixtures with cold seawater retainthis Si/T ratio - but not the Si concentration.
The compositions of fluids sampled at Crater Lake generally suggest relatively low to intermediatetemperatures. Consequently, the application of geothermometry is subject to the errors notedabove. Thus, we will use these tools only as a first-order indication of the temperature history ofthe fluid. Because the predicted temperatures appear to be relatively low, we have chosen a Set ofgeothermometers that have been constrained by low temperature data in their calibration. Theseinclude: chalcedony as a controlling silica phase (Fournier, 1981); the Mg-corrected Na-K-Cageothermometer (Foumier and Truesdell, 1973; Foumier and Potter, 1979); the Na/Ligeothermometer (Fouillac and Michard, 1981); and the Mg-Li geothermometer (Kharaka andMariner, 1989). Some of these geothermometers were also discussed by Nathenson andThompson et al. (1990) in application to low temperature water samples from the Wood Riverarea, southeast of Crater Lake. Below (Table 10) we present a summary of the temperaturepredictions from these geothermometers.
The data in Table 10 show that the geothermometers do not provide a "consensus" temperature.As noted above, relatively low temperature equilibria apparently dominate the final concentration ofmost elements in the sampled Crater Lake end-members, and mixing of any primary fluid withcolder fluids in the system may further complicate a geothermometric interpretation. While wecannot yet assess the amount of mixing that occurs between a higher temperature geothermal fluidand a sub-lakefloor aquifer, the very low concentration of 14C in the pool fluids and pore waters(see table below) indicate that the ratio of mixing is not large. This would suggest that thetemperatures of our system have primarily been affected by conductive cooling. Ingebritsen et al.(1989) show that this is also the case for many hot springs throughout the Cascades. Thesesprings have been shown to contain very low concentrations of 3H (tritium) which indicates theyhave not mixed significantly with shallow ground water aquifers.
The Na/Li geothermometer (Table 10) suggests that the fluid may have equilibrated at temperaturesof up to 165°C and that the fluid has not re-equilibrated, with respect to these ions, at lowertemperatures (Fouillac and Michard, 1981). The chalcedony geothermometer suggests anintermediate temperature and the Mg-Li and the Mg-corrected Na-K-Ca geothermometers suggestlower equilibration temperatures between 40-50°C. These may reflect the lower temperatures ofsecondary mineral alteration controlling the composition of the cooling fluids, and are primarilydriven by the very high Mg2 in the fluids. Finally, it may be significant that all of the applicablegeothennometers predict that the Palisades Pool fluids equilibrated at a lower temperature thanwater from Llao's Bath in the South Basin.
The same geothermometers have been applied to the fluid at the East Lake hot spring and these alsopredict a wide range of temperatures (Table 10). While the Mg-corrected Na-K-Ca and silicageothermometers both yield temperatures near 160°C, the deepest parts of this system, which havebeen drilled for geothermal resource exploration, have measured temperatures of 265°C (Carotherset al., 1987). The surface outflow of the spring is 57°C (Mariner et al., 1990). Carothers et al.(1987) and Sammel et al. (1988) have discussed the hydrology of this system and includedextensive subsurface mixing with meteoric water in their models. The concentration of Li in theEast Lake spring is remarkably low which yields an anomalously low temperature using the Li-based geothermometers.
134
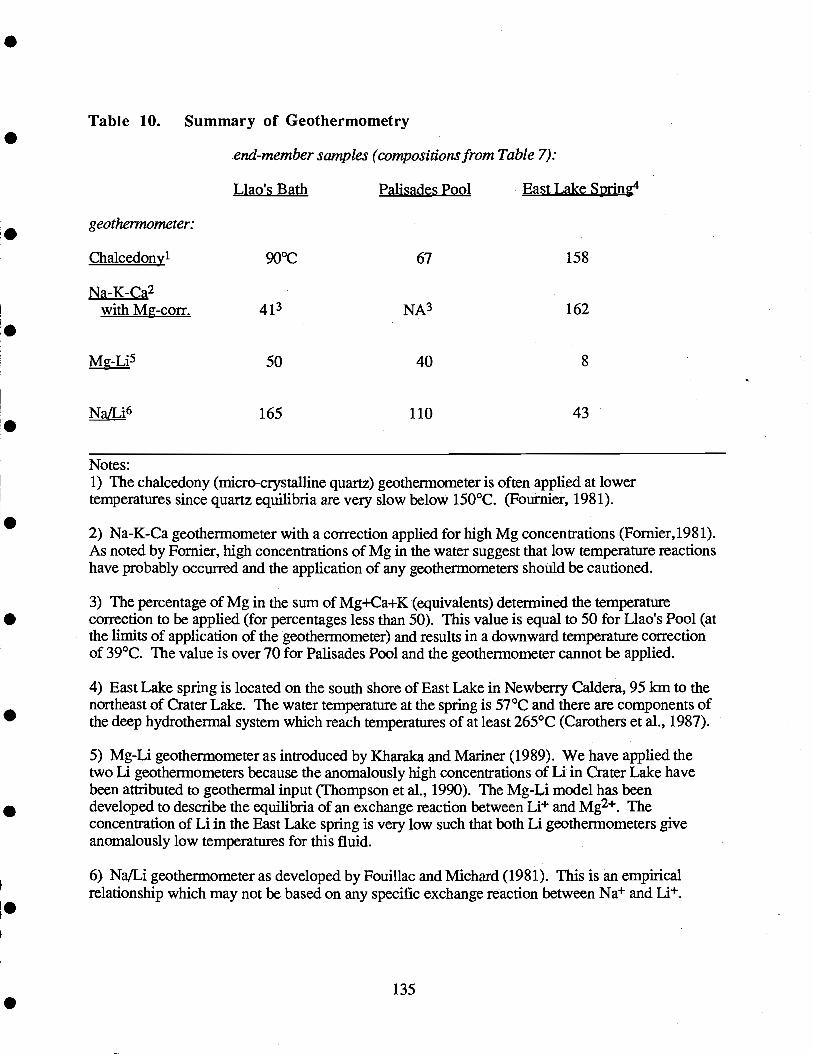
135
The chalcedony (micro-crystalline quartz) geothermometer is often applied at lowertemperatures since quartz equilibria are very slow below 150°C. (Fournier, 1981).
Na-K-Ca geothermometer with a correction applied for high Mg concentrations (Fomier, 1981).As noted by Fomier, high concentrations of Mg in the water suggest that low temperature reactionshave probably occurred and the application of any geothermometers should be cautioned.
The percentage of Mg in the sum of Mg-i-Ca-i-K (equivalents) determined the temperaturecorrection to be applied (for percentages less than 50). This value is equal to 50 for Llao's Pool (atthe limits of application of the geothermometer) and results in a downward temperature correctionof 39°C. The value is over 70 for Palisades Pool and the geothermometer cannot be applied.
East Lake spring is located on the south shore of East Lake in Newberry Caldera, 95 km to thenortheast of Crater Lake. The water temperature at the spring is 57°C and there are components ofthe deep hydrothermal system which reach temperatures of at least 265°C (Carothers et al., 1987).
Mg-Li geothermometer as introduced by Kharaka and Mariner (1989). We have applied thetwo Li geothermometers because the anomalously high concentrations of Li in Crater Lake havebeen attributed to geothermal input (Thompson et al., 1990). The Mg-Li model has beendeveloped to describe the equilibria of an exchange reaction between Li and Mg2t Theconcentration of Li in the East Lake spring is very low such that both Li geothermometers giveanomalously low temperatures for this fluid.
Na/Li geothermometer as developed by Fouilac and Michard (1981). This is an empiricalrelationship which may not be based on any specific exchange reaction between Na+ and Lit
Table 10. Summary
geothermometer:
of Geothermometry
end-member samples (compositions from Table 7):
Llao's Bath Palisades Pool East Lake Spring4
Chalcedony1 90°C 67 158
Na-K-Ca241 NA3 162with Mg-corr.
Mg-Li5 50 40
Na/Li6 165 110 43
Notes:
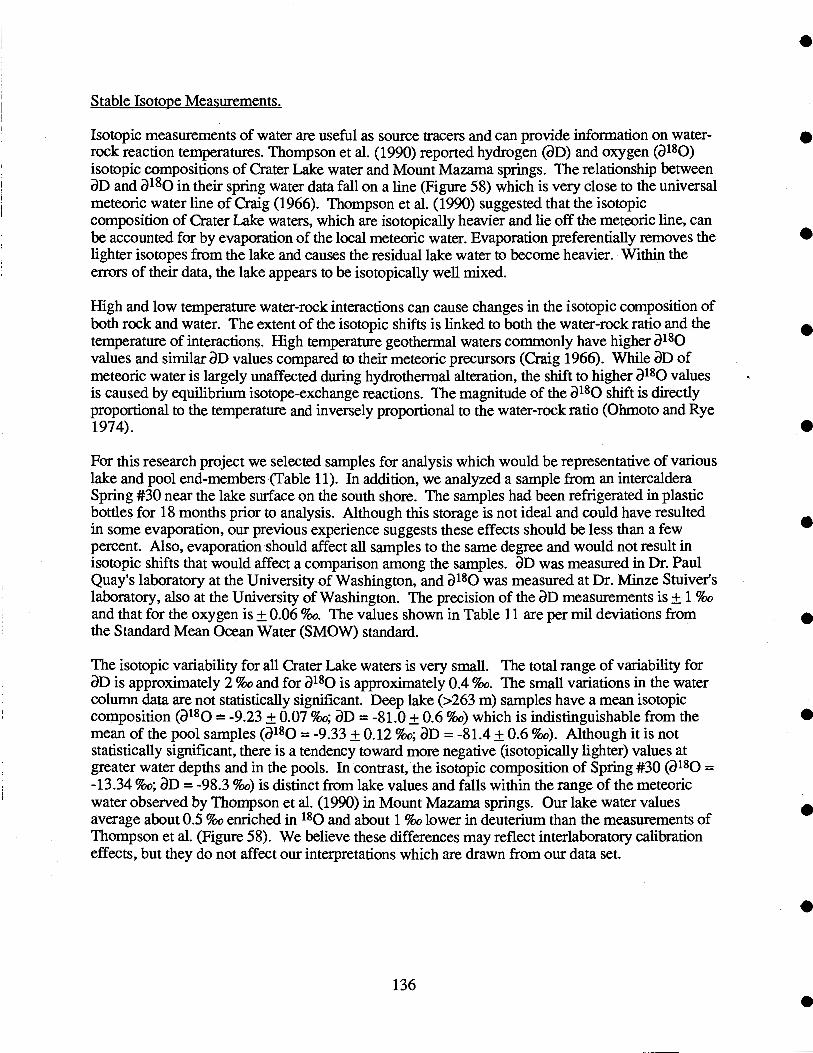
Stable Isotope Measurements.
Isotopic measurements of water are useful as source tracers and can provide information on water-rock reaction temperatures. Thompson et al. (1990) reported hydrogen (SD) and oxygen (al8o)isotopic compositions of Crater Lake water and Mount Mazama springs. The relationship between
D and a180 in their spring water data fall on a line (Figure 58) which is vely close to the universalmeteoric water line of Craig (1966). Thompson et al. (1990) suggested that the isotopiccomposition of Crater Lake waters, which are isotopically heavier and lie off the meteoric line, canbe accounted for by evaporation of the local meteoric water. Evaporation preferentially removes thelighter isotopes from the lake and causes the residual lake water to become heavier. Within theerrors of their data, the lake appears to be isotopically well mixed.
High and low temperature water-rock interactions can cause changes in the isotopic composition ofboth rock and water. The extent of the isotopic shifts is linked to both the water-rock ratio and thetemperature of interactions. High temperature geothermal waters commonly have higher 18Ovalues and similar D values compared to their meteoric precursors (Craig 1966). While D ofmeteoric water is largely unaffected during hydrothermal alteration, the shift to higher 18O valuesis caused by equilibrium isotope-exchange reactions. The magnitude of the a'o shift is directlyproportional to the temperature and inversely proportional to the water-rock ratio (Ohmoto and Rye1974).
For this research project we selected samples for analysis which would be representative of variouslake and pool end-members (Table 11). In addition, we analyzed a sample from an intercalderaSpring #30 near the lake surface on the south shore. The samples had been refrigerated in plasticbottles for 18 months prior to analysis. Although this storage is not ideal and could have resultedin some evaporation, our previous experience suggests these effects should be less than a fewpercent. Also, evaporation should affect all samples to the same degree and would not result inisotopic shifts that would affect a comparison among the samples. D was measured in Dr. PaulQuay's laboratory at the University of Washington, and a18() was measured at Dr. Minze Stuiver'slaboratory, also at the University of Washington. The precision of the )D measurements is ± 1 %oand that for the oxygen is ± 0.06 %o. The values shown in Table 11 are per mil deviations fromthe Standard Mean Ocean Water (SMOW) standard.
The isotopic variability for all Crater Lake waters is very small. The total range of variability forD is approximately 2 %o and for a18() is approximately 0.4 96o. The small variations in the water
column data are not statistically significant. Deep lake (>263 m) samples have a mean isotopiccomposition (a180 = -9.23 ± 0.07 %o; D = -81.0 ± 0.6 %o) which is indistinguishable from themean of the pool samples (a180 = ...933 ± 0.12 %o; D = -81.4 ± 0.6 %o). Although it is notstatistically significant, there is a tendency toward more negative (isotopically lighter) values atgreater water depths and in the pools. In contrast, the isotopic composition of Spring #30 ( 180 =-13.34 %o; D = -98.3 %o) is distinct from lake values and falls within the range of the meteoricwater observed by Thompson et al. (1990) in Mount Mazama springs. Our lake water valuesaverage about 0.5 %o enriched in 180 and about 1 96 lower in deuterium than the measurements ofThompson et al. (Figure 58). We believe these differences may reflect interlaboratory calibrationeffects, but they do not affect our interpretations which are drawn from our data set.
136
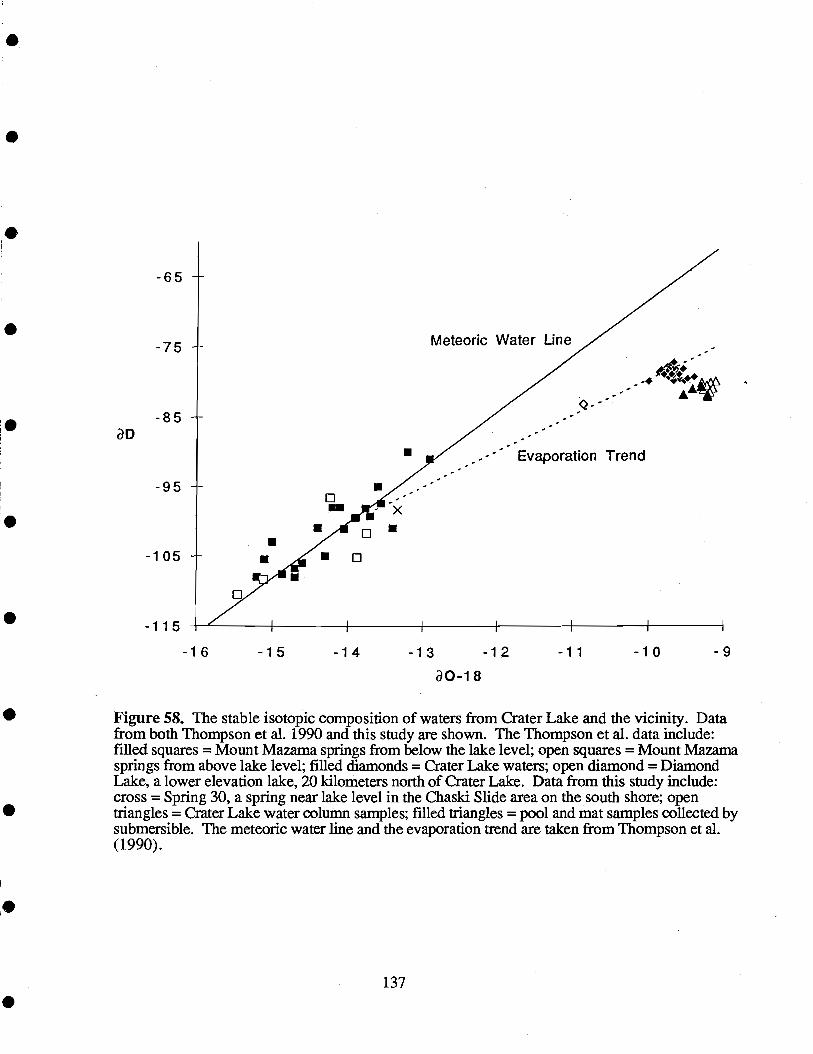
-65 -
-75 -
-85 -
-95 -
U-105--- U
-15 -14
137
Meteoric Water Line
-13 -12aO-18
- - - Evaporation Trend
-11 -10 -9
Figure 58. The stable isotopic composition of waters from Crater Lake and the vicinity. Datafrom both Thompson et al. 1990 and this study are shown. The Thompson et al. data include:filled squares = Mount Mazama springs from below the lake level; open squares = Mount Mazamasprings from above lake level; filled diamonds = Crater Lake waters; open diamond = DiamondLake, a lower elevation lake, 20 kilometers north of Crater Lake. Data from this study include:cross = Spring 30, a spring near lake level in the Chaski Slide area on the south shore; opentriangles = Crater Lake water column samples; filled triangles = pool and mat samples collected bysubmersible. The meteoric water line and the evaporation trend are taken from Thompson et al.(1990).
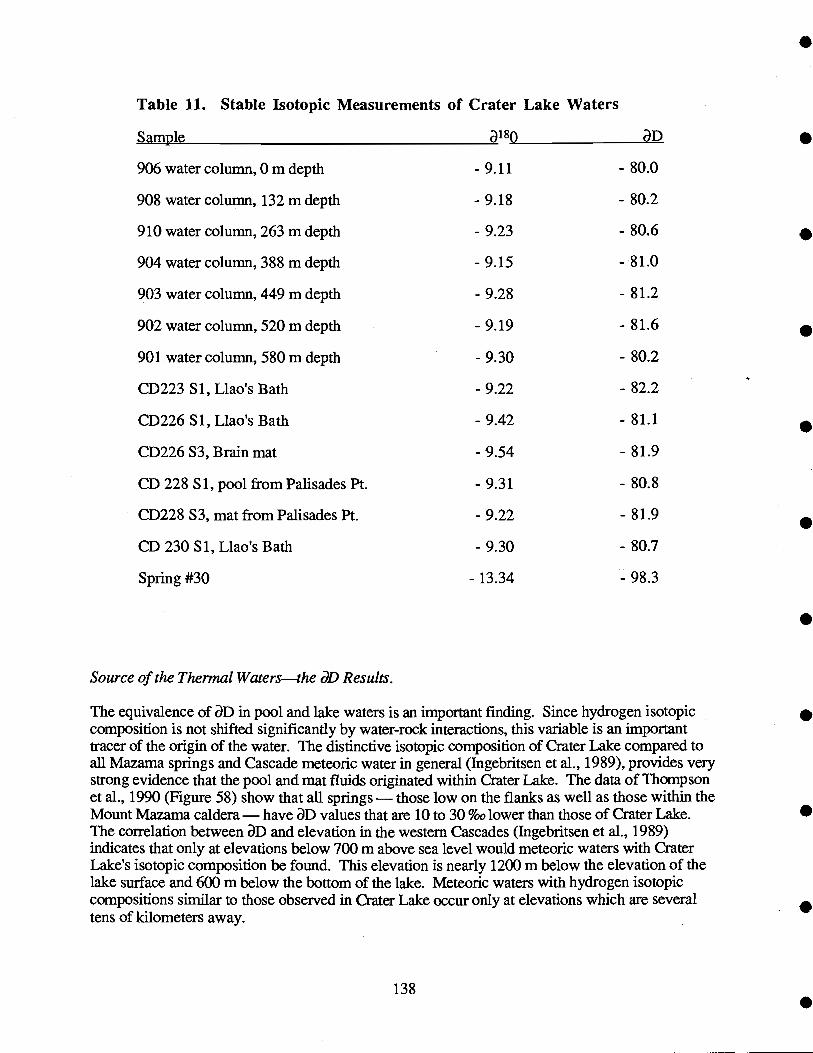
Source of the Thennal Watersthe D Results.
The equivalence of D in pool and lake waters is an important finding. Since hydrogen isotopiccomposition is not shifted significantly by water-rock interactions, this variable is an importanttracer of the origin of the water. The distinctive isotopic composition of Crater Lake compared toall Mazama springs and Cascade meteoric water in general (Ingebritsen et al., 1989), provides verystrong evidence that the pool and mat fluids originated within Crater Lake. The data of Thompsonet al., 1990 (Figure 58) show that all springs - those low on the flanks as well as those within theMount Mazama caldera - have D values that are 10 to 30 %o lower than those of Crater Lake.The correlation between D and elevation in the western Cascades (Ingebritsen et al., 1989)indicates that only at elevations below 700 m above sea level would meteoric waters with CraterLake's isotopic composition be found. This elevation is nearly 1200 m below the elevation of thelake surface and 600 m below the bottom of the lake. Meteoric waters with hydrogen isotopiccompositions similar to those observed in Crater Lake occur only at elevations which are severaltens of kilometers away.
138
Table 11. Stable Isotopic Measurements of Crater Lake Waters
Sample a180 aD
906 water column, 0 m depth - 9.11 - 80.0
908 water column, 132 m depth - 9.18 - 80.2
910 water column, 263 m depth - 9.23 - 80.6
904 water column, 388 m depth - 9.15 - 81.0
903 water column, 449 m depth - 9.28 - 81.2
902 water column, 520 m depth - 9.19 - 81.6
901 water column, 580 m depth - 9.30 - 80.2
CD223 Si, Llao's Bath - 9.22 - 82.2
CD226 Si, Llao's Bath - 9.42 - 81.1
CD226 S3, Brain mat - 9.54 - 81.9
CD 228 Si, pool from Palisades Pt. - 9.31 - 80.8
CD228 S3, mat from Palisades Pt. - 9.22 - 81.9
CD 230 Si, Llao's Bath - 9.30 - 80.7
Spring#30 -13.34 -98.3
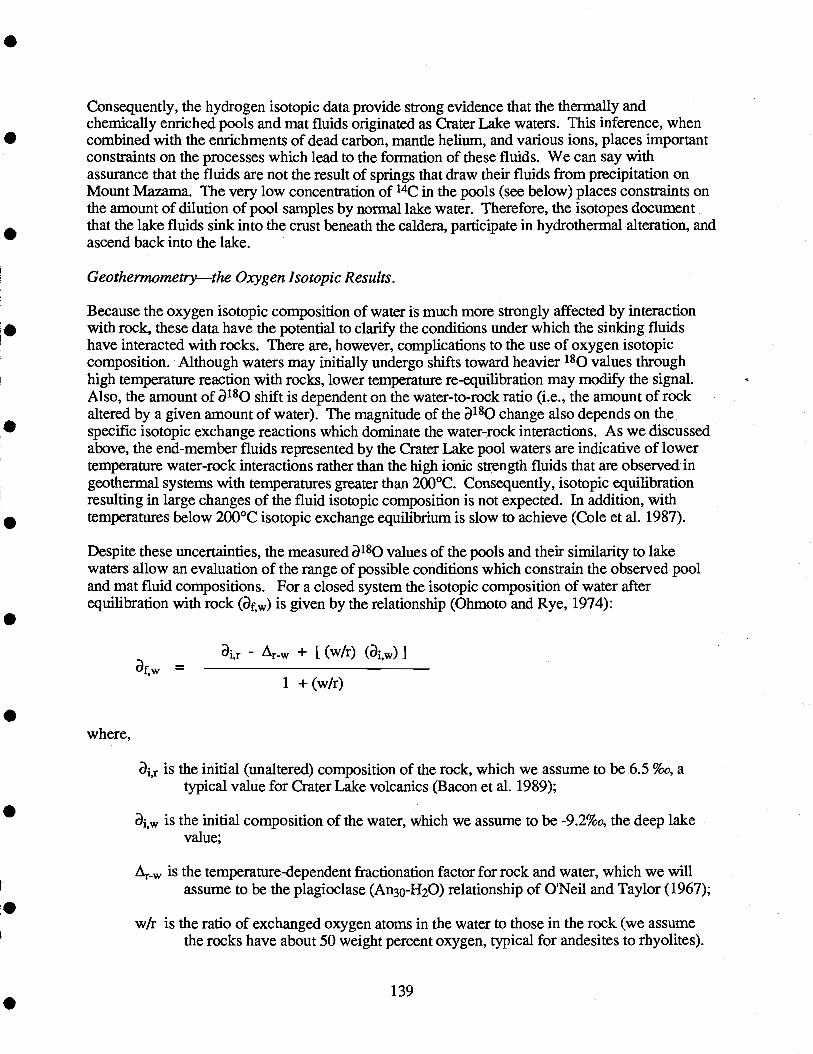
Consequently, the hydrogen isotopic data provide strong evidence that the thermally andchemically enriched pools and mat fluids originated as Crater Lake waters. This inference, whencombined with the enrichments of dead carbon, mantle helium, and various ions, places importantconstraints on the processes which lead to the formation of these fluids. We can say withassurance that the fluids are not the result of springs that draw their fluids from precipitation onMount Mazama The very low concentration of 14C in the pools (see below) places constraints onthe amount of dilution of pool samples by normal lake water. Therefore, the isotopes documentthat the lake fluids sink into the crust beneath the caldera, participate in hydrothermal alteration, andascend back into the lake.
Geothermomerry the Oxygen Isotopic Results.
Because the oxygen isotopic composition of water is much more strongly affected by interactionwith rock, these data have the potential to clarify the conditions under which the sinking fluidshave interacted with rocks. There are, however, complications to the use of oxygen isotopiccomposition. Although waters may initially undergo shifts toward heavier 180 values throughhigh temperature reaction with rocks, lower temperature re-equilibration may modify the signalAlso, the amount of shift is dependent on the water-to-rock ratio (i.e., the amount of rockaltered by a given amount of water). The magnitude of the 18O change also depends on thespecific isotopic exchange reactions which dominate the water-rock interactions. As we discussedabove, the end-member fluids represented by the Crater Lake pool waters are indicative of lowertemperature water-rock interactions rather than the high ionic strength fluids that are observed ingeothermal systems with temperatures greater than 200°C. Consequently, isotopic equilibrationresulting in large changes of the fluid isotopic composition is not expected. In addition, withtemperatures below 200°C isotopic exchange equilibrium is slow to achieve (Cole et al. 1987).
Despite these uncertainties, the measured a180 values of the pools and their similarity to lakewaters allow an evaluation of the range of possible conditions which constrain the observed pooland mat fluid compositions. For a closed system the isotopic composition of water afterequilibration with rock (af,w) is given by the relationship (Obmoto and Rye, 1974):
where,
af,w =i,r - Arw + [(w/r) (ai,w)]
1 + (w/r)
is the initial (unaltered) composition of the rock, which we assume to be 6.5 %o, atypical value for Crater Lake volcanics (Bacon et al. 1989);
a1, is the initial composition of the water, which we assume to be -9.2%, the deep lakevalue;
rw is the temperature-dependent fractionation factor for rock and water, which we willassume to be the plagioclase (An30-H20) relationship of O'Neil and Taylor (1967);
w/r is the ratio of exchanged oxygen atoms in the water to those in the rock (we assumethe rocks have about 50 weight percent oxygen, typical for andesites to rhyolites).
139
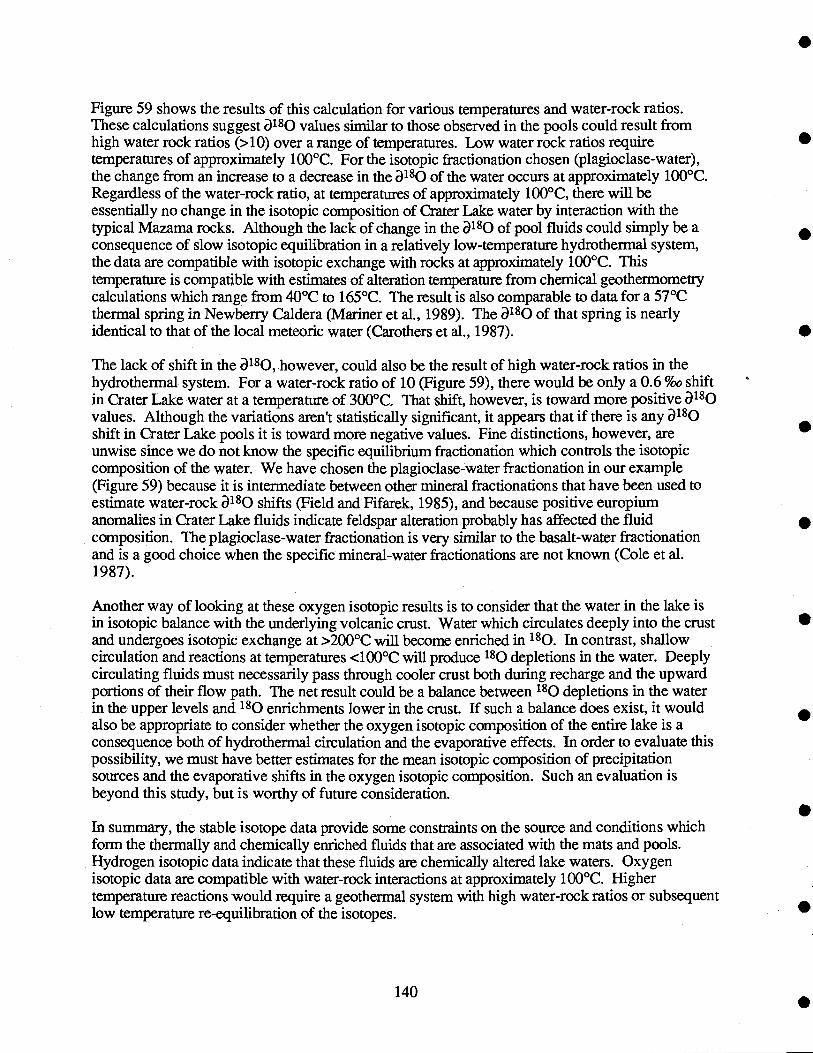
Figure 59 shows the results of this calculation for various temperatures and water-rock ratios.These calculations suggest 18O values similar to those observed in the pools could result fromhigh water rock ratios (>10) over a range of temperatures. Low water rock ratios requiretemperatures of approximately 100°C. For the isotopic fractionation chosen (plagioclase-water),the change from an increase to a decrease in the 1O of the water occurs at approximately 100°C.Regardless of the water-rock ratio, at temperatures of approximately 100°C, there will beessentially no change in the isotopic composition of Crater Lake water by interaction with thetypical Mazama rocks. Although the lack of change in the 1O of pool fluids could simply be aconsequence of slow isotopic equilibration in a relatively low-temperature hydrothermal system,the data are compatible with isotopic exchange with rocks at approximately 100°C. Thistemperature is compatible with estimates of alteration temperature from chemical geothemiometrycalculations which range from 40°C to 165°C. The result is also comparable to data for a 57°Cthenrial spring in Newbeny Caldera (Mariner et al., 1989). The ao of that spring is nearlyidentical to that of the local meteoric water (Carothers et al., 1987).
The lack of shift in the however, could also be the result of high water-rock ratios in thehydrothennal. system. For a water-rock ratio of 10 (Figure 59), there would be only a 0.6 %o shiftin Crater Lake water at a temperature of 300°C. That shift, however, is toward more positivea180values. Although the variations aren't statistically significant, it appears that if there is any 18Ø
shift in Crater Lake pools it is toward more negative values. Fine distinctions, however, areunwise since we do not know the specific equilibrium fractionation which controls the isotopiccomposition of the water. We have chosen the plagioclase-water fractionation in our example(Figure 59) because it is intermediate between other mineral fractionations that have been used toestimate water-rock 'O shifts (Field and Fifarek, 1985), and because positive europiumanomalies in Crater Lake fluids indicate feldspar alteration probably has affected the fluidcomposition. The plagioclase-water fractionation is very similar to the basalt-water fractionationand is a good choice when the specific mineral-water fractionations are not known (Cole et al.1987).
Another way of looking at these oxygen isotopic results is to consider that the water in the lake isin isotopic balance with the underlying volcanic crust. Water which circulates deeply into the crustand undergoes isotopic exchange at >200°C will become enriched in 180. In contrast, shallowcirculation and reactions at temperatures <100°C will produce 180 depletions in the water. Deeplycirculating fluids must necessarily pass through cooler crust both during recharge and the upwardportions of their flow path. The net result could be a balance between 180 depletions in the waterin the upper levels and 180 enrichments lower in the crust. If such a balance does exist, it wouldalso be appropriate to consider whether the oxygen isotopic composition of the entire lake is aconsequence both of hydrothermal circulation and the evaporative effects. In order to evaluate thispossibility, we must have better estimates for the mean isotopic composition of precipitationsources and the evaporative shifts in the oxygen isotopic composition. Such an evaluation isbeyond this study, but is worthy of future consideration.
In summary, the stable isotope data provide some constraints on the source and conditions whichform the thermally and chemically enriched fluids that are associated with the mats and pools.Hydrogen isotopic data indicate that these fluids are chemically altered lake waters. Oxygenisotopic data are compatible with water-rock interactions at approximately 100°C. Highertemperature reactions would require a geothermal system with high water-rock ratios or subsequentlow temperature re-equilibration of the isotopes.
140
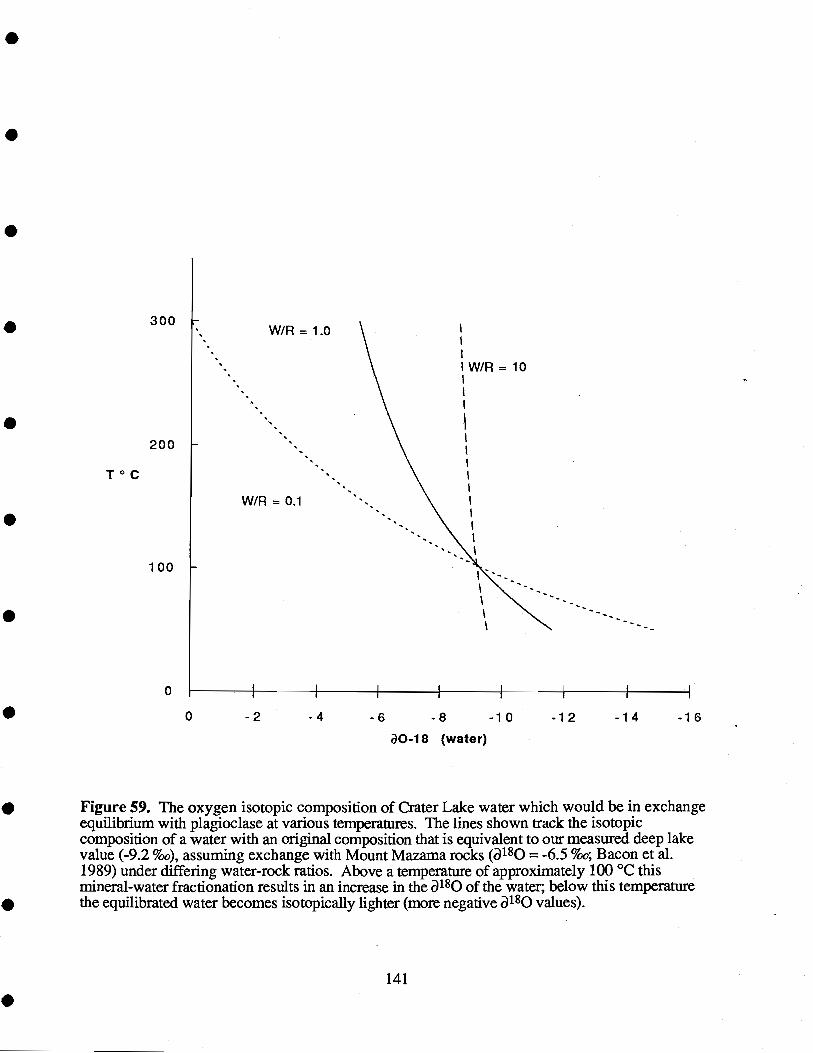
300
200
T°C
1 00
W/R = 1.0
Win = 0.1
0 I I I
0 -2 4 -8 -8 -10 -12 -14 -16
aO-i 8 (water)
Figure 59. The oxygen isotopic composition of Crater Lake water which would be in exchangeequilibrium with plagioclase at various temperatures. The lines shown track the isotopiccomposition of a water with an original composition that is equivalent to our measured deep lakevalue (-9.2 %o), assuming exchange with Mount Mazama rocks (a180 = -6.5 %o; Bacon et al.1989) under differing water-rock ratios. Above a temperature of approximately 100 °C thismineral-water fractionation results in an increase in the )18() of the water, below this temperaturethe equilibrated water becomes isotopically lighter (more negative also values).
141
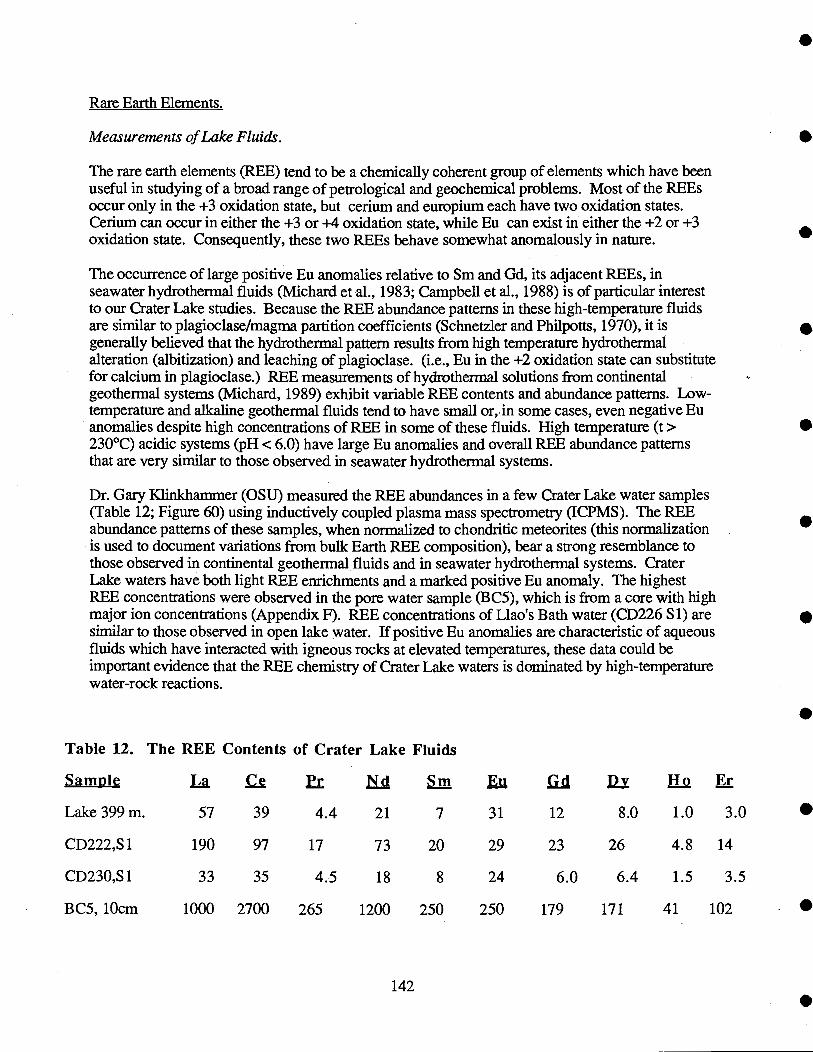
Rare Earth Elements.
Measurements of Lake Fluids.
The rare earth elements (REE) tend to be a chemically coherent group of elements which have beenuseful in studying of a broad range of petrological and geochemical problems. Most of the REEsoccur only in the +3 oxidation state, but cerium and europium each have two oxidation states.Cerium can occur in either the +3 or oxidation state, while Eu can exist in either the +2 or +3oxidation state. Consequently, these two REEs behave somewhat anomalously in nature.
The occurrence of large positive Eu anomalies relative to Sm and Gd, its adjacent REEs, inseawater hydrothermal fluids (Michard et al., 1983; Campbell et al., 1988) is of particular interestto our Crater Lake studies. Because the REE abundance patterns in these high-temperature fluidsare similar to plagioclase/magma partition coefficients (Schnetzler and Philpotts, 1970), it isgenerally believed that the hydrothermal pattern results from high temperature hydrothermalalteration (albitization) and leaching of plagioclase. (i.e., Eu in the +2 oxidation state can substitutefor calcium in plagioclase.) REE measurements of hydrothermal solutions from continentalgeothermal systems (Michard, 1989) exhibit variable REE contents and abundance patterns. Low-temperature and alkaline geothermal fluids tend to have small or, in some cases, even negative Euanomalies despite high concentrations of REE in some of these fluids. High temperature (t>230°C) acidic systems (pH < 6.0) have large Eu anomalies and overall REE abundance patternsthat are very similar to those observed in seawater hydrothermal systems.
Dr. Gary Klinkhanimer (OSU) measured the REE abundances in a few Crater Lake water samples(Table 12; Figure 60) using inductively coupled plasma mass spectrometry (ICPMS). The REEabundance patterns of these samples, when normalized to chondritic meteorites (this normalizationis used to document variations from bulk Earth REE composition), bear a strong resemblance tothose observed in continental geothermal fluids and in seawater hydrothermal systems. CraterLake waters have both light REE enrichments and a marked positive Eu anomaly. The highestREE concentrations were observed in the pore water sample (BC5), which is from a core with highmajor ion concentrations (Appendix F). REE concentrations of Llao's Bath water (CD226 Si) aresimilar to those observed in open lake water. If positive Eu anomalies are characteristic of aqueousfluids which have interacted with igneous rocks at elevated temperatures, these data could beimportant evidence that the REE chemistry of Crater Lake waters is dominated by high-temperaturewater-rock reactions.
Table 12. The REE Contents of Crater Lake Fluids
142
Sample Br Em ii lid 11-2
Lalce399m. 57 39 4.4 21 7 31 12 8.0 1.0 3.0
CD222,Si 190 97 17 73 20 29 23 26 4.8 14
CD230,S1 33 35 4.5 18 8 24 6.0 6.4 1.5 3.5
BC5, 10cm 1000 2700 265 1200 250 250 179 171 41 102
Sample /Chond rite
10000.0
1 000.0
100.0
10.0
Lake CD222 CD230 5BC
I I I I I I I I I I
La Ce Pr Nd Sm Eu Gd Dy Ho Er
Figure 60. The abundances of rare earth elements in Crater Lake samples normalized tochondritic meteoritic abundances (Hasldn et al. 1966). The lake sample is from 399 m depth in theSouth Basin. CD222 and CD230 are submersible samples taken from the high temperature matarea and Llao's Bath respectively. BC 5 refers to a pore water sample taken from a depth of 10centimeters in a box core. The core was deployed in a large pool near Llao's bath and sampled thepool bottom sediments.
143

Several lines of evidence suggest that low-temperature alteration of igneous rocks will not generatepositive Eu anomalies. In general, the REE are considered refractory elements which are resistantto leaching by both low and high temperature alteration (Ludden and Thompson, 1979; Michard,1989). Nonetheless, the low concentrations of REEs expected in cold ground waters and othermeteoric waters should reflect the composition of the rocks they weather. Analyses of REEabundances in Mt. Mazama volcanics reveal only light REE enrichments and no positive Euanomalies, which is typical of andesites (Bacon and Druit, 1988). Therefore, anomalous REEpatterns in ground waters, if they exist, could only occur by selective alteration of differentvolcanic phases. Although plagioclase phenociysts within these rocks may have positive Euanomalies, the feldspars are not likely to be leached of their REEs as rapidly as the fine-grainedgroundmass and glass that comprise most of the Mount Mazama lavas and ash. Thus, the REEabundance patterns of cold waters in contact with Mt. Mazama volcanics are probably similar to thebulk rock composition. Although we do not have measurements of REEs in Mt. Mazama coldsprings, our conclusion is supported by measurements of the REE contents of Oregon rivers thatdrain volcanic terrain (Keasler and Loveland, 1982), which reveal only light REE enrichments andno Eu anomalies when normalized to chondrites. REEs from rivers around the world do notexhibit positive Eu anomalies (Goldstein and Jacobsen, 1988; Elderfleld et al., 1990). Additionalevidence that Eu is not selectively leached by low-temperature reactions comes from studies ofocean floor basalts. Ludden and Thompson (1979) observed that basalts altered by lowtemperature interaction with seawater do not have negative Eu anomalies, which would be expectedif Eu was being leached relative to the other REEs.
Consequently, it appears that the REE patterns of Crater Lake fluids reflect high-temperaturehydrothermal alteration rather than low temperature alteration processes. We propose twomechanisms to account for these patterns, both of which involve the convection of lake watersthrough the volcanic crust beneath Crater Lake: (1) the REE contents are controlled by high-temperature interaction between primary igneous rocks and deeply circulating lake waters; (2) theREE contents reflect dissolution of secondary alteration phases that were deposited in MountMazama volcanics during an earlier stage of hydrothermal alteration. The first mechanism canaccount for the observed REE patterns as well as the other chemical and thermal enrichments inlake fluids through processes similar to those which form continental geothermal fluids andseawater hydrothermal fluids. The second mechanism is based on the fact that precipitation ofminerals from hydrothermal fluids can reflect the Eu anomalies in these fluids (Sverjensky, 1984).Because Eu2 has an ionic radius nearly identical to Ba2, hydrothermal barites have large positiveEu anomalies (Guichard et al., 1979; Morgan and Wandless, 1980). Dissolution of barite,carbonate veins, and other secondary minerals by waters which circulate into zones of earlierhydrothermal alteration beneath the lake could produce the observed REE patterns. The REEresults alone cannot distinguish between these two possibilities. We will discuss additionalevidence which bears on the two hypotheses later in the report.
Solid Phase Rare-Earth Element Analyses.
We measured the rare earth element (REE) abundances of selected mat, crust, and pool samples(Tables 6 and 7; Appendix I). The iron-rich crusts and bacterial mats have low REE concentrations(Figure 61) however, these samples have significant variations in the relative abundances of thedifferent REEs. For example, the La/Eu values in most iron-rich mat and crust samples range from16 to 38 (Figure 62). The data shown in Figures 62 and 63 suggest that there are three end-members: First, an aluminosiicate component which has low iron contents, high Al contents, and
144
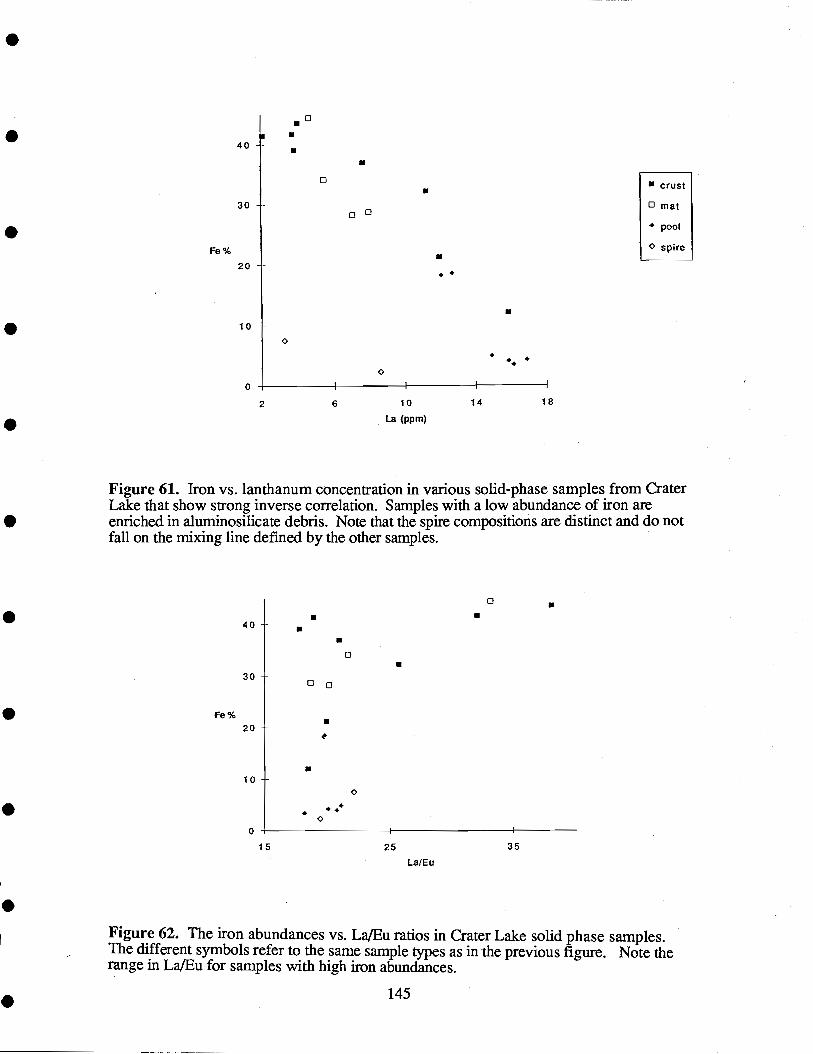
.
.
Figure 61. Iron vs. lanthanum concentration in various solid-phase samples from CraterLake that show strong inverse correlation. Samples with a low abundance of iron areenriched in aluminosilicate debris. Note that the spire compositions are distinct and do notfall on the mixing line defmed by the other samples.
145
Fe %
40 -
30 -
20 -
10
_0U a
U
-0
aa
a
.
0I
U
.
crust
o mat
poo'
0 spfre
0
2 6 10
La (ppm)
14 18
U
0 Ua
40 - aU
aU
30 - DO
Fe %20
U-
10 -0
00
15 25 35
La/Eu
Figure 62. The iron abundances vs. La/Eu ratios in Crater Lake solid phase samples.The different symbols refer to the same sample types as in the previous figure. Note therange in La/Eu for samples with high iron abundances.
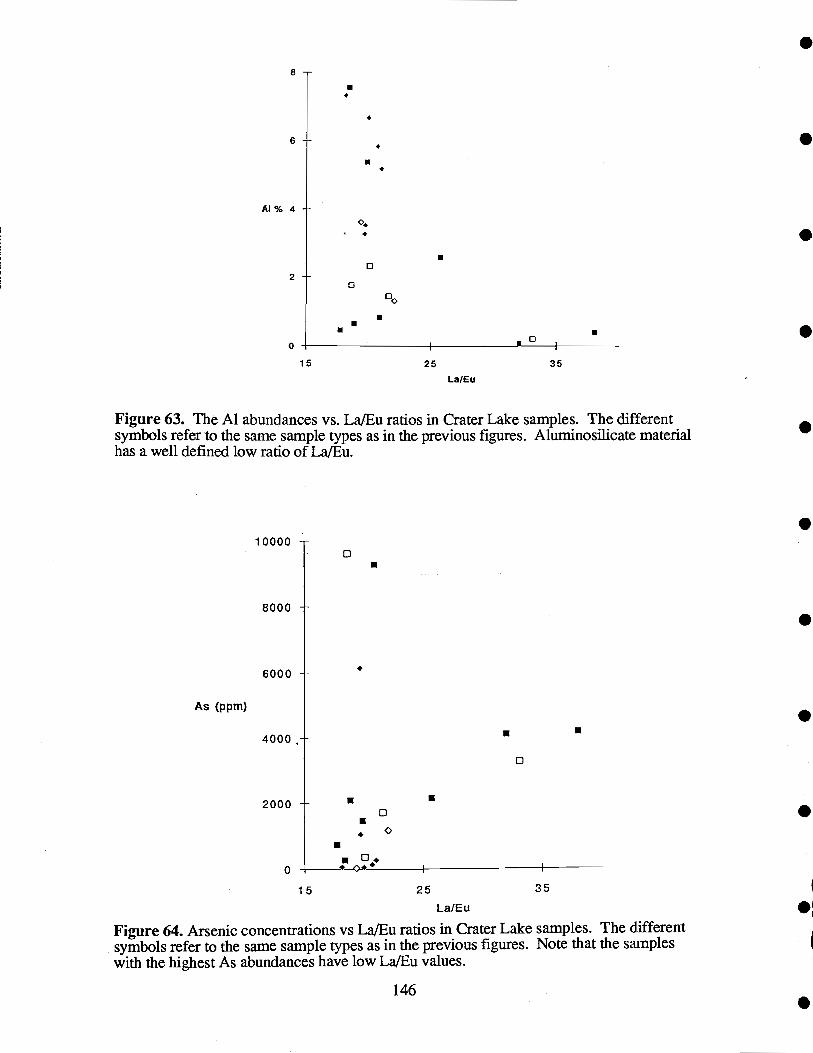
15 25 35
La/Eu
Figure 64. Arsenic concentrations vs La/Eu ratios in Crater Lake samples. The differentsymbols refer to the same sample types as in the previous figures. Note that the sampleswith the highest As abundances have low La/Eu values.
146
As (ppm)
10000 -
8000 -
6000
4000
2000-
-
0
U
U
0. 0
I
U
U
0
I
U
0
15 25 35
La/Eu
Figure 63. The Al abundances vs. La/Eu ratios in Crater Lake samples. The differentsymbols refer to the same sample types as in the previous figures. Aluminosilicate materialhas a well defined low ratio of La/Eu.

relatively low La/Eu values; second is an end-member with high iron and high La/Eu; and third, anend-member with high iron and low La/Eu.
It is probable that the minor element contents of iron oxyhydroxide precipitates reflect thecomposition of the surrounding fluids. Co-precipitation of dissolved REEs with iron hydroxide isa standard analytical technique for quantitative stripping of these elements from aqueous solution.In nature this process occurs during precipitation of iron oxyhydroxides from marine hydrothermalfluids. The scavenging and co-precipitation of seawater REEs by these oxyhydroxides result inmetalliferous sediments with a distinctive seawater REE pattern (Dymond et aL, 1973; Ruhlin andOwen, 1986). Consequently, we suggest that variations in the REE abundances of the mat andcrust samples reflect distinct venting fluids. Although all the fluids from which these depositsform are enriched in iron, some are apparently more enriched in As and Eu in comparison withother fluids. It is noteworthy that those mats and crusts with relatively high Eu (low La/Eu) arealso enriched in As (Figure 64). The association of arsenic with hydrothermal systems suggeststhat these crusts and mats have precipitated from fluids with a stronger hydrothermal signal. Thissuggestion is compatible with the recent finding that continental geothermal systems can havestrong Eu enrichments (Michard, 1989) and with the data of Klinkhammer (Table 12) whichdocument Eu anomalies in Crater Lake fluids.
The Distribution of Dissolved Carbon-14.
Introduction.
As discussed earlier, CO2 in the deep lake is enriched by approximately 10 % over valuesmeasured in the upper water column. In addition, the thermally and chemically enriched poolshave ZCO2 contents ranging from 7 to 14 times higher than deep lake water values (Appendix 1).The sources of this carbon enrichment can be clarified through isotopic measurements of the fluids.Carbon-14, a cosmogenic isotope produced in the upper atmosphere, has a half-life ofapproximately 5700 years. Rapid mixing of 14C within the atmospheric CO2 reservoir makes thisisotope useful both for tracer studies and for age determinations of organic material. The global14Q system has been affected by both nuclear weapons testing and fossil fuel burning. The neteffect of these two inputs is to increase the present-day C content of the atmosphere over what itwould be in an unperturbed system. Because of the large dynamic range of 14C for natural waters,we collected samples during the 1989 field program which would enable us to evaluate thisisotopic system and address the source of the carbon enrichments observed in the pool fluids.
In part, our measurements were stimulated by the earlier studies of Simpson (1970) who measured14c in a few large water samples collected from the surface and deep waters of Crater Lake. Hisdata revealed 14C "ages" of the deep lake carbon that were incompatible with an atmosphericsource of the CO and with rapid lake mixing implied by other tracers. Simpson suggested thatfumarole or hot spring inputs near the bottom could account for "old" 14C ages of deep-lake water.In addition, Simpson measured 14C ages of surface sediments that had apparent ages ofapproximately 1,800 years. He suggested these surprisingly old ages reflected the mean 14C ageof lake water which was affected by the input of old carbon. His sediment results are similar to themore recent unpublished data of S. Trumbore (personal communication, 1991), who found that thebulk organic carbon age of a sediment sample in a core from the Wizard Island platform is roughly11,000 years (i.e., older than the 6,900 year age of Crater Lake caldera). Since the true age of
S
.
147
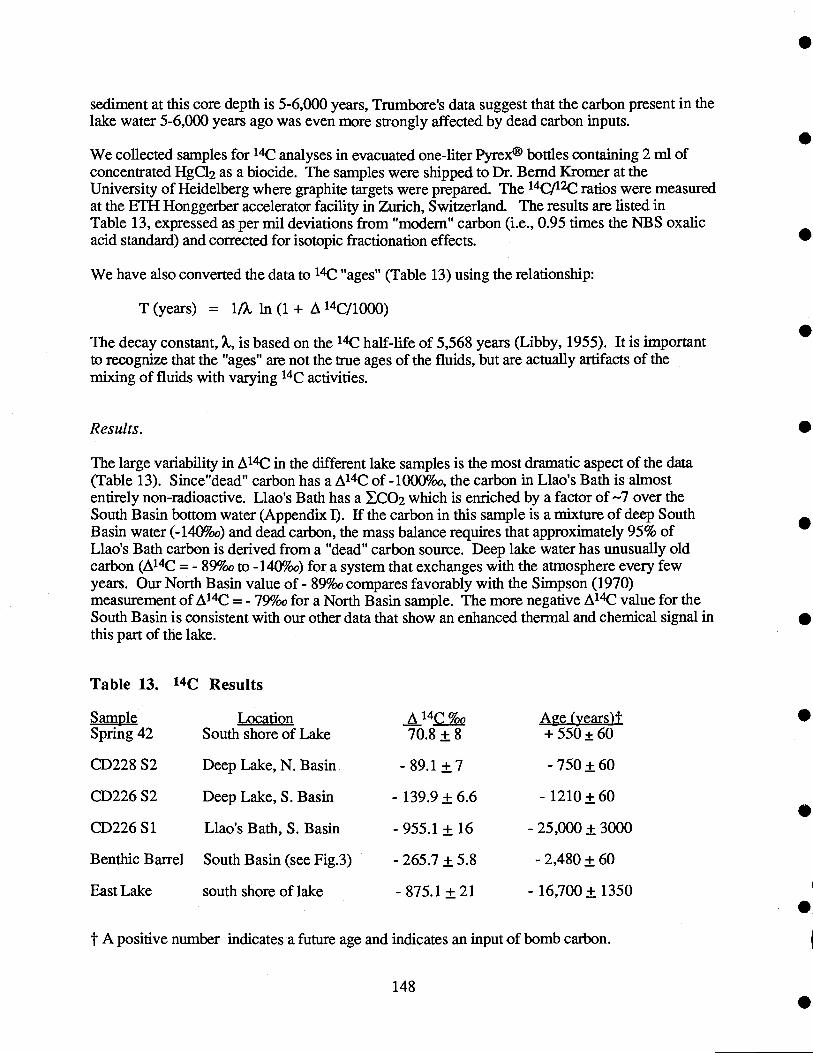
sediment at this core depth is 5-6,000 years, Trumbore's data suggest that the carbon present in thelake water 5-6,000 years ago was even more strongly affected by dead carbon inputs.
We collected samples for 14C analyses in evacuated one-liter Pyrex® bottles containing 2 ml ofconcentrated HgC12 as a biocide. The samples were shipped to Dr. Bemd Kromer at theUniversity of Heidelberg where graphite targets were prepared. The 14C/12C ratios were measuredat the ETH Honggerber accelerator facility in Zurich, Switzerland. The results are listed inTable 13, expressed as per mu deviations from "modern" carbon (i.e., 0.95 times the NBS oxalicacid standard) and corrected for isotopic fractionation effects.
We have also converted the data to 14C "ages" (Table 13) using the relationship:
T (years) = 1A ln (1 + A 14C/1000)
The decay constant, ?, is based on the 14C half-life of 5,568 years (Libby, 1955). It is importantto recognize that the "ages" are not the true ages of the fluids, but are actually artifacts of themixing of fluids with varying 14( activities.
Results.
The large variability in A14C in the different lake samples is the most dramatic aspect of the data(Table 13). Since"dead" carbon has a A14C of - 1000%o, the carbon in Llao's Bath is almostentirely non-radioactive. Llao's Bath has a CO2 which is enriched by a factor of 7 over theSouth Basin bottom water (Appendix I). If the carbon in this sample is a mixture of deep SouthBasin water (-140%o) and dead carbon, the mass balance requires that approximately 95% ofLlao's Bath carbon is derived from a "dead" carbon source. Deep lake water has unusually oldcarbon (A'4C = - 89% to -l4O9too) for a system that exchanges with the atmosphere every fewyears. Our North Basin value of - 89%o compares favorably with the Simpson (1970)measurement of A14C = - 79%o for a North Basin sample. The more negative A14C value for theSouth Basin is consistent with our other data that show an enhanced thermal and chemical signal inthis part of the lake.
t A positive number indicates a future age and indicates an input of bomb carbon.
148
Table 13. '4C Results
Sample Location 14C %o Age (vearstSpring 42 South shore of Lake 70.8±8 +550±60
CD228 S2 DeepLake,N.Basin -89.1±7 -750±60
CD226 S2 DeepLake,S.Basin -139.9±6.6 -1210±60
CD226 Si Llao's Bath, S. Basin - 955.1 ± 16 - 25,000 ±3000
Benthic Barrel South Basin (see Fig.3) - 265.7 ± 5.8 - 2,480±60
East Lake south shore of lake -875.1±21 - 16,700± 1350
Assuming the deep lake values are the result of mixing between modem atmospheric carbon,which has a A'4C of approximately +lO5%o ( Berger et al., 1987) and a source of "dead" carbonsuch as that observed in Llao's Bath, the fraction of "dead" carbon can be estimated. This mixingcalculation indicates that approximately 20% of the deep lake carbon is free of '4C. Consequently,the A'4C value of the deep lake is maintained both by lake mixing processes, which transferatmospherically equilibrated surface waters to the deep lake, and by deep injection of "dead"carbon, which our data shows is associated with the thermally and chemically enriched pools.
Table 13 also shows the A14C content of the caldera wall spring #42. The caldera springmeasurement is similar to the current I14C value for the atmosphere, indicating that this waterexchanged relatively recently with with atmospheric carbon dioxide. Because atmospheric A'Cvalues have varied greatly during the past 40 years as a result of atmospheric testing of nuclearbombs (Berger and Libby, 1966; Berger et al., 1987), refmed estimates of the equilibration age ofthe spring water or of possible"dead" carbon inputs are not possible. In general, however, theSpring #42 concentration is comparable to the A14C measurements made by Simpson (1970) onAnnie Springs and Murchison Springs. Simpson measured values of approximately +170%o forthese two Mt. Mazama springs. This was very similar to Crater Lake surface water and a littlelower than the 14( content of the atmosphere at that time. The Spring #42 result is compatiblewith the He data (Figure 26) from this spring which also indicate equilibration with theatmosphere.
The CO2 content of the Benthic Barrel sample increased by 18% during the 6.7 days that thebarrel water was isolated from the lake (Section IV.3) Table 13 shows its A14C equaled -265.7 ±5.8%o after 6.7 days. Mass balance mixing calculations indicate that nearly all of theCO2increase resulted from the input of "dead" carbon. This is an important result because it indicatesthat the sediment pore waters, which have migrated into the barrel, also have predominantly deadcarbon. Since there are no feasible dead carbon sources within the sediments, such a findingcannot be explained by any possible reactions within the sediments. Only water advection throughthe sediments can supply the CO2 (as bicarbonate ions) added to the Benthic Barrel, and thissame process must be contributing "dead" carbon-bearing fluids to the lake bottom waters.
In addition, a sample of water from an East Lake thermal spring was analyzed, because of itsproximity to Crater Lake (95 km northeast of Crater Lake) and its similar geologic setting withinNewbeny Caldera. The 14( sample was collected at the thermal spring location on the south shoreof East Lake. Like the Llao's Bath sample, the carbon in the East Lake sample has very little '4C.If the sample contains a mixture of "dead", hydrothermal carbon and atmospheric carbon, the ACmeasurement indicates that 89% of the total carbon is hydrothermal.
Discussion.
The A14C data clearly demonstrate that there are active inputs of "dead" carbon into the deep lakeand that the sources of this carbon could be pore water advection and mixing of thermally andchemically-enriched pool waters with deep lake water. The stable hydrogen isotopic datadiscussed above show that it is not possible for the anomalous pool fluids to have been derivedfrom an aquifer source. As a result, the concept that the "dead" carbon is derived from deepaquifers with an atmospheric equilibration age of more than 25,000 years is untenable. Therefore,we will consider three possible sources of the dead carbon: (1) the carbon is a non-condensible
p
magmatic gases which may evolve from deep-seated magmatic sources beneath Mt. Mazama; (2)
149
the carbon is carried in hydrothermal fluids that have interacted with primary igneous rocks at hightemperatures; and (3) the carbon is carried by fluids that have dissolved carbonate vein material thatwas deposited in Mazama volcanics during an earlier stage of hydrothermal alteration.
The first hypothesis requires the mobility of magmatic CO2 through Ma7ma volcanics and into thedeep lake or into ground waters that enter the lake. Although such a mechanism could explain the
CO2 enrichments of "dead" carbon in the deep lake and pools, it does not account for the closeassociation of these enrichments with the thermal anomalies observed in the deep lake. It also doesnot account for the advection of carbon-enriched fluids which is indicated by the Benthic Barreldata. The input of carbon to the Benthic Barrel cannot occur except by fluid transport which bringsboth bicarbonate ion and other ions into the bottom of the lake. The observation that three Mazamasprings (spring #42 in Table 13 and the two springs measured by Simpson, 1970) all have carboncontents which are essentially in equilibrium with the atmosphere is evidence that a transfer ofmagmatic volatiles to these aquifers does not occur. The lack of "dead" carbon in these springsdoes not preclude gaseous transfers into some Mount Mazama aquifers, but it does demonstratethat the process is not a pervasive influence on springs either inside or outside the Crater Lakecaldera. Finally, if CO2 were entering the lake as a noncondensable gas, the pH of Crater Lakewater would be much more acid than is observed. The CO2 of the lake is dominantly in the formof bicarbonate ion, which must form by interaction of CO2-bearing waters with volcanic rocks.
Nonetheless, it is known that CO2 is a major gaseous component in magmatic systems. Meteoricwaters circulate through cracks that form in cooling magmatic bodies. The waters become enrichedin "dead", magmatic carbon. The interaction of these fluids with hot igneous rocks results in ahydrothermal fluid which has a high ionic content and whose CO2 will predominantly be ofmagmatic origin. This process can explain the "dead" carbon and associated thermal and chemicalenrichments of the pool and pore water samples. As discussed above, the hydrogen isotopic dataindicate that the anomalous water collected from the pools was originally lake water. Since massbalance calculations indicate that only 5% of the carbon in the pool samples can have a modemsource, the hypothesized hydrothermal process must result in re-equilibration between a largemagmatic carbon reservoir and any atmospheric carbon which was originally in the circulating lakewater. In effect magmatic carbon sources completely dominate any initial atmospheric carbon fromlake waters.
The third hypothesis requires the dissolution of secondary carbonate minerals by water circulatingthrough the rocks which lie beneath Crater Lake. This process requires that the dissolvedcarbonates either be old (>40,000 years) or the result of precipitation from "dead", magmaticcarbon. Mount Mazama has a 300,000 to 400,000 year history of volcanism, and hydrothermalalteration was a common feature of that volcanic activity. We cannot ascertain the extent of thehydrothermal alteration of the crust beneath Crater Lake from the few surficial rocks collected bythe submersible; however, hydrothermal alteration of rocks near the current lake surface has beenreported (Bacon and Lanphere, 1990). Although the presence of carbonate veins in these rockshas not been documented (C. Bacon, personal communication, 1991), the common association ofcarbonate precipitation with hydrothermal alteration indicates that carbonate minerals probably existin some of the Crater Lake rocks.
The dissolution of carbonates by meteoric water would normally be driven by dissolved CO2originally derived from the atmosphere. This is typically represented by the following reaction:
CO2 + H20 + CaCO3 = Ca + 2HCO3
150
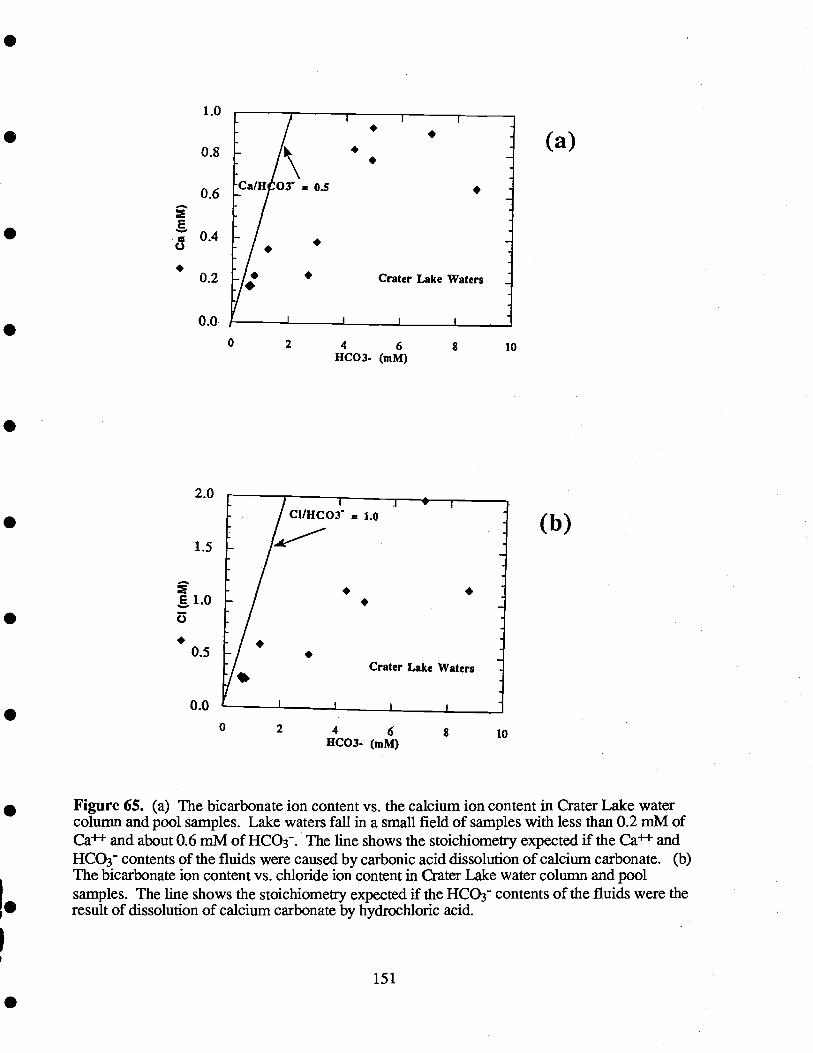
0.6
E0.4
40.2
E 1.0C)
.
1.0
0.8
0.0 ,
0 2 4 611CO3. (mM)
2.0
1.5
0.5
0.0
151
10
(a)
(b)
0 2 4 611CO3- (mM)
Figure 65. (a) The bicarbonate ion content vs. the calcium ion content in Crater Lake watercolumn and pool samples. Lake waters fall in a small field of samples with less than 0.2 mM ofCa and about 0.6 mM of HCO3. The line shows the stoichiometry expected if the Ca andHCOç contents of the fluids were caused by carbonic acid dissolution of calcium carbonate. (b)The bicarbonate ion content vs. chloride ion content in Crater Lake water column and poolsamples. The line shows the stoichiometry expected if the HCO contents of the fluids were theresult of dissolution of calcium carbonate by hydrochloric acid.
8 10
Significantly, this equation demonstrates that one mole of atmospheric carbon is required todissolve one mole of carbon from a calcium carbonate precipitate. The impact of this dissolutionprocess would be to increase the CO2 content of the circulating fluid, but the A'4C of those fluidswould not be -l000%o (i.e., dead carbon). After dissolution of a carbonate precipitate containingonly "dead" carbon, the A14C in the water (the bicarbonate) would be approximately -500%o whichis clearly distinct from that observed in Llao's Bath and from the value inferred for pore waters bythe benthic barrel sampling. In addition, the equation suggests that the molar ratio of Ca to HCO3should be 0.5. However, as shown in Figure 65a, the thermally and chemically enriched fluidssampled in the deep lake have much greater proportions of bicarbonate ion. Thus, it is highlyunlikely that this process could be responsible for the observed increase in CO2 concentrations ofthe saline pools and the advected pore water.
In an alternative process, pre-existing carbonates could be dissolved by a strong acid such as HC1.HO could be injected into crustal waters from a cooling magma body that may exist beneath MountMazama The appropriate equation for this reaction is:
HC1 + CaCO3 = Ca + HCOç + C1
With this process the molar ratios of calcium, carbon, and chloride should be 1:1:1. However, asshown in Figure 65b, Llao's Bath and other pool samples have HCO3/Cl ratios which aresignificantly greater than 1.0. Consequently, the abundance of bicarbonate in these thermally andchemically enriched waters also cannot be accounted for by dissolution of calcium carbonate by HC1.
From the combination of 14C and CO2 measurements, we can compute the amount of admixedlake water present in our pool sample (CD226 Si; Table 13). If we assume that the pool sample iscomposed of a mixture of lake water and thermal water with a mantle carbon signature (i.e. deadcarbon) the following equation describes the isotope ratio in the sample:
Rsaznpie = (Riake X Ciake X L) + (Rthermal X Cthermal X T)
where:Rsampie is the '4C/12C ratio in the sample mixture;
Riaie is the 14C/12C ratio in the lake;
Rth is the 14C/12C ratio in thermal waters (assumed to be equal to zero);
Ciake is the CO2 concentration of the lake in moles per liter,
is the CO2 concentration of thermal waters;
L is the fraction of lake water in the mixture;
T is the fraction of thermal water in the mixture (where L + T = 1);
Since Rr is zero for dead (magmatic) carbon, this equation can be rearranged to solve for L andreduced to:
L - Rsampie I (Re x Ciake)
152
By converting our measured A'4C values (Table 13) to 14C/'2C ratios and using the deep lakeCO2 concentration (0.6 mM), we can solve for the fraction of lake water (L) in any sample. For
the pool sample (CD226 Si) with a A14C value of -955 %o, the equation indicates 43% of thesample is lake water.
It is also possible to compute the concentration of CO2 in the unmixed thermal waters by solvingthe carbon balance equation:
Cpooi = Cthermal X T + Cia X L
Since T = 1 - L, we can solve this equation using our computed value of L (43%) and themeasured CO2 in the pools (5 mM) and lake (0.6 mM). From this calculation we fmd theestimated CO2 (i.e., Cth) for an undiluted thermal fluid is 8.3 mM. This concentration issimilar to the highest values measured in Palisades Pool (Table 9) and in pore waters which havethe highest computed advection rates (Appendix F).
Our estimate of admixed lake water in Llao's Bath places important constraints on the evolution ofthe thermally and chemically enriched fluids found in the lake. As we discussed in the stableisotope section, the hydrogen isotopic composition indicates that the fluid sampled in the pools islake water. By itself, the D composition could be explained by major dilution of a primarythermal water source with bottom waters, and we would not have been able to constrain theultimate source of the pool waters. However, the 14C data indicate that the thermal waters in thepools are no more than 50 % diluted with lake water. Consequently, the pool fluids must havebeen lake waters that were incorporated into a convection system which operates within the' volcanic crust beneath Crater Lake. This circulation adds heat, "dead" carbon, magmatic helium,and various ions to the fluid. During their buoyant ascent through fractured volcanic crust, thehydrothermal fluids have mixed with roughly equal parts of deep lake water to form chemicallyenriched pools on the lake bottom.
This scenario further implies that the concentrations of ions in primary hydrothermal fluids beforemixing with lake water were not more than a factor of two higher than the values we measured inthe pools. It is possible, however, that the warmest temperatures in the primary convecting fluidsare higher than would be expected from simple mixing with cold lake water. Conductive heat losscan also result in major changes in the temperature of the hydrothermal waters. The importance ofconductive heat loss in many thermal springs has been pointed out by Ingebritsen et al. (1989).Many Cascade thermal springs have temperatures in the 20°C to 60°C range, despite rock-equilibration temperatures based on geothermometry that are much higher (Mariner et al., 1990).Ingebritsen et al.(1989) point out that these springs have very low tritium (3H) concentrations, anobservation which, like our 14C data for a Crater Lake saline pool, strongly limits the extent ofmixing with cold, ambient waters. Apparently these lower temperature Cascade thermal springshave lost considerable heat by conductive cooling.
In summary, the presence of "dead" carbon in lake bottom waters, pore waters, and pool samplesis not consistent with a direct input of CO2 gas from a cooling igneous intrusive body or from thedissolution of secondary carbonate minerals within the rocks that underlie Crater Lake. Theinteraction of aqueous fluids with cooling igneous rocks within the volcano, i.e., hydrothermalprocesses, appears to offer the best explanation for the observed "dead" carbon as well as itsassociation with thermal and chemical enrichments. The extremely low concentrations of 14C in
the fluids entering the deep lake limit the extent to which these fluids could have mixed with lakewaters or other modern aquifers.
IV.3. Fluxes of Materials Through the Lake System
Mixing Rates of Lake Water.
To this point, we have identified a set of variables that document the active input of thermally andchemically enriched fluids to the bottom of Crater Lake. These observations range from samplesof concentrated fluid "end-members" to more dilute signals seen in the water column. Then, inorder to evaluate how these inputs are dispersed through the system, we must discuss the overallmixing rates of fluids in different portions of the lake. Furthermore, based upon an understandingof the vertical and horizontal mixing rates in the lake, we are able to constrain the input rates for thehydrothermal fluids which have generated gradients in dissolved concentrations within the lake.Our discussion below will first focus on the local-scale processes which are associated with theinitial introduction of these fluids into the lake. We will then summarize the observations whichdirectly constrain the mixing rates within the water column.
Modes of Introduction.
Our combined submersible and porewater sampling program has delineated the followingcharacteristics of the thermally and chemically enriched fluids found in Crater Lake:
the initial source of the fluids is from within Crater Lake (from D composition);measured temperatures vary from approximately 4°C to 19°C;pore waters from sediment cores are the most saline fluids, however, pools such as
Llao's Bath have salinities which approach pore water values;despite their high salinities, the pool samples are much cooler than bacterial mats from
cliff areas and nearby sediments from these areas;various geothermometers suggest rock-water equilibration temperatures ranging from
'40°C to 165°C for fluids from the Detailed Study Area;fluids from the Detailed Study Area exhibit a range of heat-to-salt ratios;the chemically enriched fluids from the Palisades Point area have elemental
relationships which are distinct from those within the Detailed Study Area, andgeothermometiy suggests a lower temperature of water-rock equilibration.;
the low concentration of 14C in the pools suggests that these fluids do not containsignificant mixtures of deep lake or meteoric water.
Definition of these characteristics challenges us to formulate the processes which introduce andmodify these enriched lake fluids. We proceed with this task under the assumption that thechemical evidence for a geothermal origin of these fluids is convincing. We will review thisevidence and the alternative explanations later in the report. Our effort here is to examine whether ageothermal source can account for the full range of compositions and temperatures observed in thelake.
154
Within the Detailed Study Area the variations in salinity range from 0.1 g/kg in the backgroundlake water to approximately 0.6 g/kg in the pools and pore waters. The generally consistent inter-element relationships between pools, mats, and pore waters implies that the range of salinity seenin the deep lake may represent variations in dilution with the background lake water rather thandistinct compositional differences in the venting fluids. Any mixing prior to or during sampling ofthe fluids can explain the observed salinities within the Detailed Study Area.
Simple end-member mixing, however, cannot explain the distinct heat-to-salt ratios of the differentnear-bottom waters (Figure 16 in Appendix A) or the pool, mat, and pore fluids. However, sincethermal diffusion is approximately 100 times faster than molecular diffusion of salt, conductiveheat loss from various fluid reservoirs can account for these variations. Thus, venting of fluidswith the maximum temperature and salinity observed in the deep lake (19° C and 0.6 g/kg) canproduce any other fluids or deep lake waters by a combination of mixing and conductive heat loss(Appendix A).
As discussed in Appendix A, fluids with salinities of 0.6 g/kg are buoyant relative to lake water ifthey have temperatures >12°C. Thus, many of the bacterial mat fluids whose temperatures wemeasured would be buoyant if they have salinities similar to pools or the enriched porewaters.Unfortunately, we were not able to obtain an unmixed sample of the warmest mat fluids todocument their salinity. Their buoyancy, however, is confirmed by heat probe measurementswhich suggest convection rates in the mats of 15 to 40 m/year (Section ffl.9 LakefloorTemperature Data). Consequently, these fluids can ascend to the lakefloor, whereupon mixing andconductive cooling can produce fluids with both lower salinities and lower heat-to-salt ratios.
These mixed fluids can become non-buoyant as a result of conductive heat loss, which lowers theirheat-to-salt ratio. Due to the non-linearities in the equation of state of water for the temperaturerange of the deep lake waters, mixtures of the warm saline fluids with lake water can result in afluid that is more dense than either of the end-member fluids (Appendix A; Turner and Gustafson,1978; Turner and Campbell, 1987). These dense mixtures may flow downslope as densitycurrents resulting in the wide distribution of thermally and chemically enriched fluids at the bottomof the South Basin.
Because the saline fluids found within Llao's Bath and the Palisades Point pools have temperaturesof less than 6°C, these fluids are currently non-buoyant and we must consider how they initiallyentered the pools. We suggest that the filling of these small pools could occur by down slope. density flows, or through episodic or steady state input of buoyant fluids from below the pools.
Density flows have been deduced from the rills and channels at the Palisades Pool site. Suchfeatures are not present in the Llao's Bath region. Because some of these pools axe locally elevatedone to two meters above the surrounding terrain, they appear to fill from below. There may alsobe downslope sub-lake floor flow from the more elevated topography to the east where hightemperature mats and sediments occur (Figure 9). Conductive heat loss during this type of lateralflow would account for their lack of buoyancy. However, we cannot yet further constrain thenature of this input.
Episodic buoyant input could contribute fluids to the pools. Such a process could hypotheticallybe associated with a thermal buildup of crustal fluids which would produce an intermittentlybuoyant fluid column. The fluid parcel would then rise to the lakefloor. However, conductivecooling and/or mixing could reduce the buoyancy and then end the convection. The rills at
155
Palisades Point, which had no observable flow during the submersible dive, may be evidence ofepisodic input at this site. As discussed in the Radon and Radium section, the observed 222Rnvalues in the pools could be modeled as a batch inflow which occurred 15 to 30 days prior to oursampling. Since we have shown that a small, nearly unobservable flow of fluid could maintainthese poois, there is no inherent reason to choose this model over a steady state input model(section 111.8).
Continuous vertical flow of denser waters could be occurring if the complete fluid columnunderlying the pools has an integrated density less than an equivalent column of lake bottom water.Buoyant forces would move the column upward, even though continuous conductive heat losses inthe upper parts of the crust or sediments could result in a non-buoyant fluid at the top of thecolumn. The observation that the pore fluids in a core taken a few meters from the brainmat/Llao's Bath complex appear to be advecting at a rate of 1 meter per year, suggest continuousinput at the site. Given an estimated area of Llao's Bath of 3 to 12 m2, this advection rate results ina throughput of fluid at Llao's Bath of 3 to 12 m3/year. Our continuous input model of Llao'sBath required an input of 8 to 30 m3/year to account for the 222p.ii inventory. These two estimatesof fluid flow into the pools, which are derived from totally independent models are in satisfactoryagreement. This result serves to emphasize that slow vertical advection could account for some ofthe dramatic thermal features observed on the lake floor.
In summary, very reasonable physical processes can account for the major thermal and chemicalcharacteristics of waters found within the deep lake. Hydrothermal convection can provide thethermally and chemically enriched fluids. Simple mixing can account for the observed range in saltcontents in the deep lake, whereas conductive cooling of fluids will produce variable heat-to-saltratios. Several processes could account for the emplacement of relatively dense, saline pools in thedeep lake. While we cannot definitively choose among the possibilities, all are compatible with ahydrothermal fluid source.
Vertical and Horizontal Mixing Rates.
In this report and its appendices, several lines of evidence have been discussed to demonstrate arelatively high rate of mixing for the water in Crater Lake. We will summarize these importantresults here because the mixing rate determines the degree to which the hydrothermal inputs arefurther diluted and dispersed throughout the lake. This information will let us reconcile the generalhomogeneity of the water column with the observation of near-bottom gradients in thermal andchemical properties. Finally, a knowledge of the mixing rate coupled with these observedgradients provides one of our most direct estimates for the input rate of hydrothermal materials andheat to Crater Lake. The mechanisms and rates of lake mixing are discussed in more detail inAppendices A and G.
The upper 200 meters of the lake are completely homogenized twice each year. This is confirmedby many observations of an isothermal and isohaline water column to this depth and atmosphericsaturation of this layer for oxygen, helium, and chiorofluorocarbons. While the gradients thatbegin to develop below this layer document incomplete mixing with the surface lake, the annualexchange of materials and heat down to at least 350 meters is significant.
The mixing rates between the upper and lower lake have been estimated using several techniques.Simpson (1970a) examined the vertical distribution of tritium (3H) and first showed that the lake
156
mixes with a characteristic time of 1-2 years. Through the use of thermistor chains and CTD castswe have directly observed the vertical exchange of heat from the bottom of the lake (see Figures 3,4, 5 and 10 in Appendix A). The steady state mixing rate we derive from these observations isconsistent with a 2-3 year exchange rate with surface water. When this vertical mixing occurs eachyear, we have observed the partial reaeration of oxygen in the deep lake (see Figure 9 in AppendixA). The observed flux of this new oxygen into the deep basins predicts a vertical exchange ratewith surface waters on the order of 2.5-3.5 years. Finally, our CTD measurements in the variousbasins of the lake demonstrate the rapid horizontal dispersion of materials with a characteristic timeof several weeks (see Figure 12 in Appendix A).
The chlorofluorocarbons (i.e. CFC's or freons) in the global atmosphere have roughly doubledover the past 15 years. The concentration of these atmospheric pollutants in the water column ofCrater Lake provides an unambiguous estimate of the vertical mixing rate (Appendix G). Theconcentrations in the upper 200 meters are at equilibrium with today's atmosphere. Below 200meters, there is a steady decrease in concentration of CFC's to values which were in equilibriumwith the atmosphere three years earlier (see Figure 2 in Appendix G). The derived mixing ratebetween the upper and lower lake using both freons (CFC-12 and CFC-13) averages 2 years.There is a steady increase in freon "age" between the winter mixed layer and the lake bottom. Thisis consistent with our hypothesis that the primary mode of vertical mixing in the deep lake is bestmodeled as a small- to intermediate-scale turbulent mixing process as opposed to a "complete"overturn of the water column.
In summary, all our data are consistent with a rapid vertical mixing rate of two years. This rapidmixing explains the first-order observation of a chemically homogeneous water column.Significantly, all the chemical and thermal gradients that we observe must be actively maintained inspite of these rapid homogeneous mixing processes. Below we will use these gradients andmixing rates to help quantify the active input rates of heat and salt.
Mass Balances of Materials.
Introduction.
Before we re-examine the observations of active inputs, we will evaluate an inventory of the totalflux or "mass balance" of materials through the lake system. Since the lake is a closed basin with arelatively simple hydrologic budget, many investigators have evaluated geochemical budgets forvarious materials in this system (Simpson, 1970a; Voichok et al., 1970; Reilly et al., 1989;Nathenson, 1990a). During discussion of our 1987 and 1988 results (Collier and Dymond, 1988aand 1989), we also applied a geochemical mass balance model to the lake. As noted by allprevious investigators, we identified a major imbalance in the dissolved ion budget of the lake ifprecipitation and runoff from the caldera wall are assumed to be the only inputs. We hypothesizedthat the input of a thermally and chemically enriched fluid balanced the lake's composition at"steady state".
The mass balance inventory of material moving into and out of a system like Crater Lake can bestated in terms of the change in mass (dM) in the lake over time (dt):
= input rate - output rate + internal processes = 0 (at steady state) [eq.TV.3. 1]
157
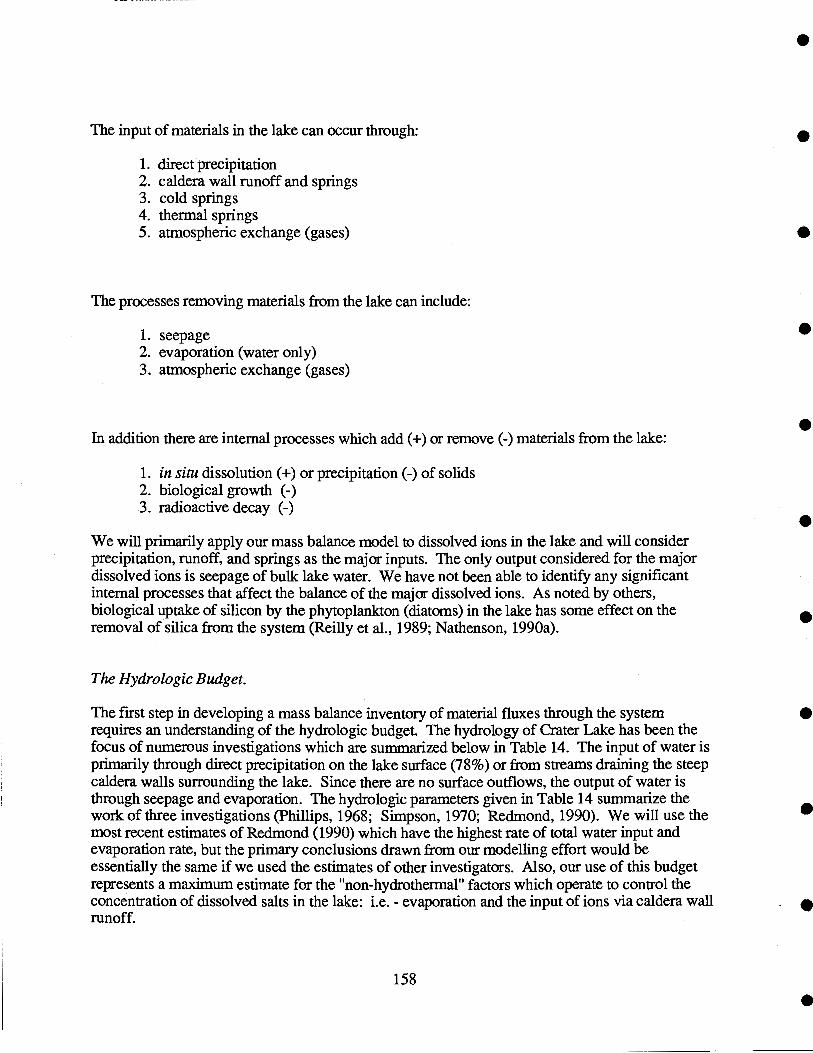
The input of materials in the lake can occur through:
direct precipitationcaldera wall runoff and springscold springsthermal springsatmospheric exchange (gases)
The processes removing materials from the lake can include:
seepageevaporation (water only)atmospheric exchange (gases)
In addition there are internal processes which add (+) or remove (-) materials from the lake:
in situ dissolution (+) or precipitation (-) of solidsbiological growth (-)radioactive decay (-)
We will primarily apply our mass balance model to dissolved ions in the lake and will considerprecipitation, runoff, and springs as the major inputs. The only output considered for the majordissolved ions is seepage of bulk lake water. We have not been able to identify any significantinternal processes that affect the balance of the major dissolved ions. As noted by others,biological uptake of silicon by the phytoplankton (diatoms) in the lake has some effect on theremoval of silica from the system (Reilly et al., 1989; Nathenson, 1990a).
The Hydrologic Budget.
The first step in developing a mass balance inventoiy of material fluxes through the systemrequires an understanding of the hydrologic budget. The hydrology of Crater Lake has been thefocus of numerous investigations which are summarized below in Table 14. The input of water isprimarily through direct precipitation on the lake surface (7 8%) or from streams draining the steepcaldera walls sunounding the lake. Since there are no surface outflows, the output of water isthrough seepage and evaporation. The hydrologic parameters given in Table 14 summarize thework of three investigations (Phillips, 1968; Simpson, 1970; Redmond, 1990). We will use themost recent estimates of Redmond (1990) which have the highest rate of total water input andevaporation rate, but the primary conclusions drawn from our modelling effort would beessentially the same if we used the estimates of other investigators. Also, our use of this budgetrepresents a maximum estimate for the "non-hydrothermal" factors which operate to control theconcentration of dissolved salts in the lake: i.e. - evaporation and the input of ions via caldera wallrunoff.
158
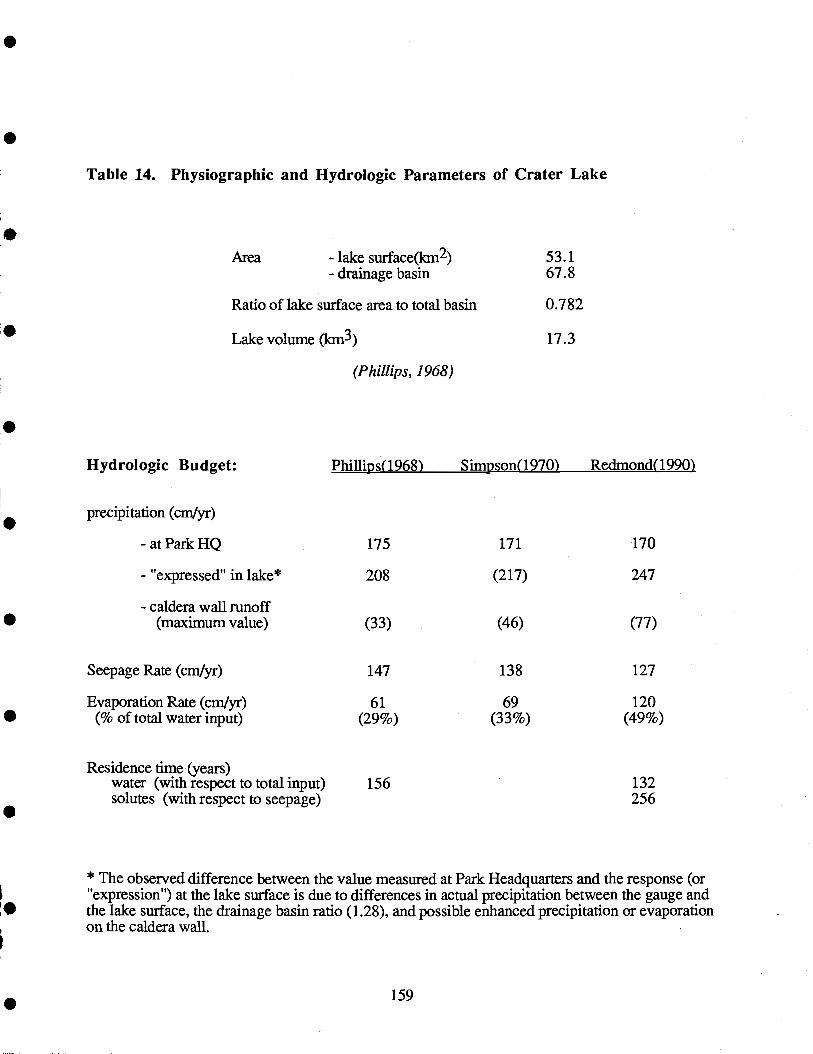
Table 14. Physiographic and Hydrologic Parameters of Crater Lake
(Phillips, 1968)
* The observed difference between the value measured at Park Headquarters and the response (or"expression") at the lake surface is due to differences in actual precipitation between the gauge andthe lake surface, the drainage basin ratio (1.28), and possible enhanced precipitation or evaporationon the caldera wall.
159
Hydrologic Budget:
precipitation (cm/yr)
Phillips(1968) Simpson( 1970) Redmond( 1990)
- at Park HQ 175 171 170
- "expressed" in lake* 208 (217) 247
- caldera wall runoff(maximum value) (33) (46) (77)
Seepage Rate (cm/yr) 147 138 127
Evaporation Rate (cm/yr) 61 69 120(% of total water input) (29%) (33%) (49%)
Residence time (years)water (with respect to total input) 156 132solutes (with respect to seepage) 256
Area - lake surface(km2) 53.1- drainage basin 67.8
Ratio of lake surface area to total basin 0.7 82
Lake volume (3) 17.3
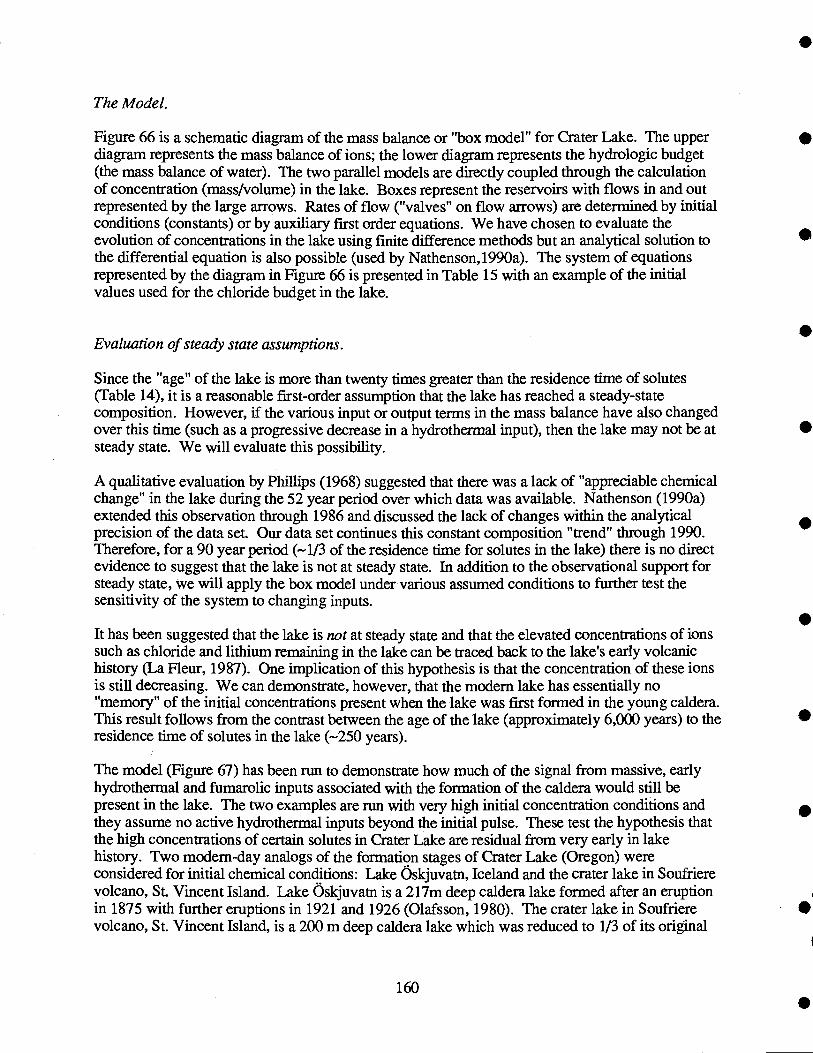
The Model.
Figure 66 is a schematic diagram of the mass balance or 'box model" for Crater Lake. The upperdiagram represents the mass balance of ions; the lower diagram represents the hydrologic budget(the mass balance of water). The two parallel models are directly coupled through the calculationof concentration (mass/volume) in the lake. Boxes represent the reservoirs with flows in and outrepresented by the large arrows. Rates of flow ("valves" on flow arrows) are determined by initialconditions (constants) or by auxiliary first order equations. We have chosen to evaluate theevolution of concentrations in the lake using finite difference methods but an analytical solution tothe differential equation is also possible (used by Nathenson, 1990a). The system of equationsrepresented by the diagram in Figure 66 is presented in Table 15 with an example of the initialvalues used for the chloride budget in the lake.
Evaluation of steady state assumptions.
Since the "age" of the lake is more than twenty times greater than the residence time of solutes(Table 14), it is a reasonable first-order assumption that the lake has reached a steady-statecomposition. However, if the various input or output terms in the mass balance have also changedover this time (such as a progressive decrease in a hydrothermal input), then the lake may not be atsteady state. We will evaluate this possibility.
A qualitative evaluation by Phillips (1968) suggested that there was a lack of "appreciable chemicalchange" in the lake during the 52 year period over which data was available. Nathenson (1990a)extended this observation through 1986 and discussed the lack of changes within the analyticalprecision of the data set. Our data set continues this constant composition "trend" through 1990.Therefore, for a 90 year period (-1/3 of the residence time for solutes in the lake) there is no directevidence to suggest that the lake is not at steady state. In addition to the observational support forsteady state, we will apply the box model under various assumed conditions to further test thesensitivity of the system to changing inputs.
It has been suggested that the lake is not at steady state and that the elevated concentrations of ionssuch as chloride and lithium remaining in the lake can be traced back to the lake's early volcanichistory (La Fleur, 1987). One implication of this hypothesis is that the concentration of these ionsis still decreasing. We can demonstrate, however, that the modem lake has essentially no"memory" of the initial concentrations present when the lake was first formed in the young caldera.This result follows from the contrast between the age of the lake (approximately 6,000 years) to theresidence time of solutes in the lake (-250 years).
The model (Figure 67) has been run to demonstrate how much of the signal from massive, earlyhydrothermal and fumarolic inputs associated with the formation of the caldera would still bepresent in the lake. The two examples are run with very high initial concentration conditions andthey assume no active hydrothermal inputs beyond the initial pulse. These test the hypothesis thatthe high concentrations of certain solutes in Crater Lake are residual from very early in lakehistory. Two modem-day analogs of the formation stages of Crater Lake (Oregon) wereconsidered for initial chemical conditions: Lake Oskjuvatn, Iceland and the crater lake in Soufrierevolcano, St. Vincent Island. Lake ()skjuvatn is a 217m deep caldera lake formed after an eruptionin 1875 with further eruptions in 1921 and 1926 (Olafsson, 1980). The crater lake in Soufrierevolcano, St. Vincent Island, is a 200 m deep caldera lake which was reduced to 1/3 of its original
160
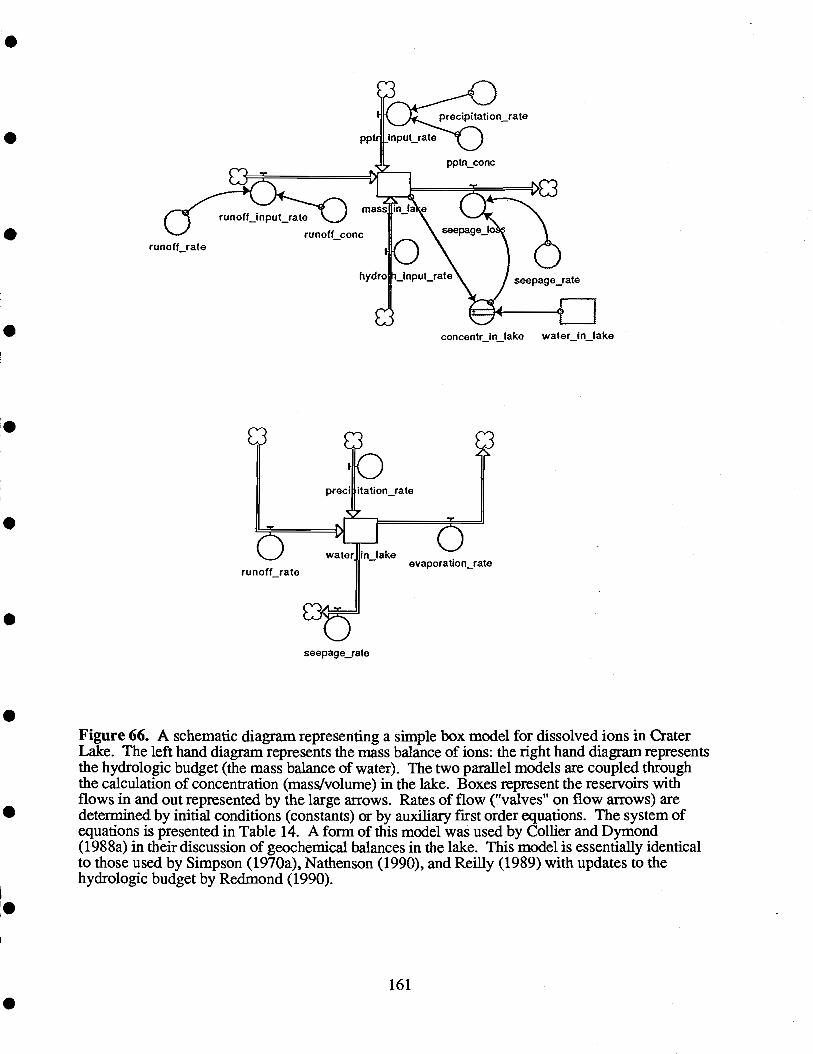
runoff_rate
runoff_input_rate
runoff_conc
runoff_rate
mass
hydro jnput_rate
precipitation_rate
wa er in_lake
seepage_rate
Figure 66. A schematic diagram representing a simple box model for dissolved ions in CraterLake. The left hand diagram represents the mass balance of ions: the right hand diagram representsthe hydrologic budget (the mass balance of water). The two parallel models are coupled throughthe calculation of concentration (mass/volume) in the lake. Boxes represent the reservoirs withflows in and out represented by the large arrows. Rates of flow ("valves" on flow arrows) aredetermined by initial conditions (constants) or by auxiliary first order equations. The system ofequations is presented in Table 14. A form of this model was used by Collier and Dymond(1988a) in their discussion of geochemical balances in the lake. This model is essentially identicalto those used by Simpson (1970a), Nathenson (1990), and Reilly (1989) with updates to thehydrologic budget by Redmond (1990).
161
precipitation_rate
pptn_conc
seepage_rate
concentr_in_lake water_in_lake
evaporation_rate
pp input_rate
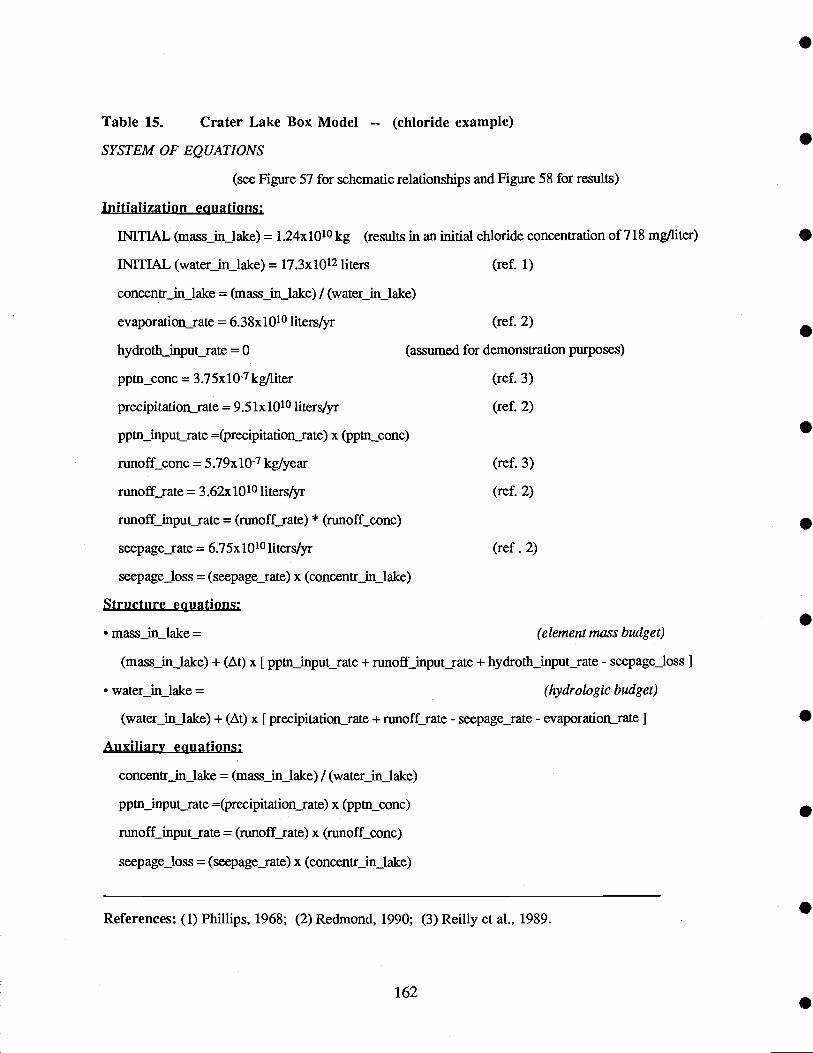
Table 15. Crater Lake Box Model -- (chloride example)
SYSTEM OF EQUATIONS
(see Figure 57 for schematic relationships and Figure 58 for results)
Initialization equations:
INiTIAL (mass_in_lake) = 1 .24x1010 kg (results in an initial chloride concentration of 718 mgfliter)
INITIAL (water_in_lake) = 17.3x 10¹² liters (ref. 1)
concentr_in_lake = (mass_in_lake) / (water_in_lake)
evaporation_rate = 6.38x10¹⁰ liters/yr (ref. 2)
hydroth_input_rate =0 (assumed for demonstration purposes)
ppm_cone = 3.75x 10⁷ kgfliter (ref. 3)
precipitation_rate = 9.51x10¹⁰ liters/yr (ref. 2)
ppm_input_rate =(precipitation_rate) x (ppm_conc)
runoff_cone = 5.79x10⁷ kg/year (ref. 3)
runoff_rate = 3.62x10¹⁰ liters/yr (ref. 2)
runoff_input_rate = (runoff_rate) * (runoff_cone)
seepage_rate = 6.75x 101a liters/yr (ref. 2)
seepage_loss = (seepage_rate) x (concentr_in_lake)
Structure equations:
mass_in_lake (element mass budget)
(mass_in_lake) + (At) x [ppm_input_rate + runoff_input_rate + hydroth_input_rate - seepage_loss I
water_in_lake = (hydrologic budget)
(water_in_lake) + (At) x [precipitation_rate + runoff_rate - seepage_rate - evaporation_rate I
Auxiliary equations:
concentr_in_lake = (mass_in_lake) / (water_in_lake)
ppm_input_rate =(precipitation_rate) x (ppm_cone)
runoff_input_rate = (mnoff_rate) x (runoff_cone)
seepage_loss = (seepage_rate) x (concentr_in_lake)
References: (1) Phillips, 1968; (2) Redmond, 1990; (3) Reilly et al., 1989.
162

(A)
o 3.75
(B)
15.0
0.0
50.0
0
25.0
o 12.5r.
0.0
2
CHLORIDE
2-.--.-..-. .-.-.--.--?.3000.00 4500.00 6000.00
Time (years)
LITHIUM
Concentration in(b) Crater 1_ake
_I_1 1...............-?.-0.0 1500.00 3000.00 4500.00
Time (years)
Figure 67. Results from the box model (Figure 66) applied to chloride (A) and lithium (B).Curves with a 1 represent concentration in units labelled to the left and those with a 2 representmass in units labelled to the right. The overall residence time of ions in the model, with respect toseepage, is approximately 250 years. The initial chloride concentration (A) is chosen to be 718mg/liter (Soufriere volcano). The concentration in the lake reaches 101% of the steady state valuedetermined by precipitation and runoff (0.84 mg/liter) within 3000 years. The actual chlorideconcentration in Crater Lake is shown with a dotted line. The initial lithium concentration (B) waschosen to be 0.29 mg/liter (Soufriere volcano) and the concentration falls off even more rapidly (B- curve a). The actual concentration of Li in Crater Lake is shown by the dotted line. As anextreme example, an initial Li concentration of 1 gram/liter still falls to the same steady state within3600 years (B - curve b).
163
Concentration inCrater Lake
- 12.0x10⁹
- 9.0x10⁹
6.0x1091
I. 3.0x10⁹
0.0
0.06000.00
5.00x10⁶
3.75x10⁶
2.50x10⁶
1 .25x 106
1500.000.0
volume in 1971-72 by the eruption of 80 x 106 m3 of lava up through the lake floor (Sigurdsson,1977). We have chosen the higher concentration for any element between these two caldera lakesas the initial conditions for Crater Lake, Oregon.
The models are run for 6,000 years - the approximate age of the lake, but the time axis can beconsidered as any point in time since the termination of volcanism. There is no evidence ofvolcanic eruptions inside the caldera within the last 4,000 years (Bacon and Lanphere, 1990). Theinitial chloride concentration (Figure 67A) is chosen to be 718 mg/liter (Soufriere). Theconcentration in the Crater Lake model reaches 101% of a steady state value (0.84 mg/liter) within3,000 years. At this point in time, the model predicts a chloride concentration which is less than10% of the actual chloride concentration in Crater Lake (shown with a dotted line). The initiallithium concentration (Figure 67B) was chosen to be 0.29 mg/liter (Soufriere), and theconcentration falls below the Crater Lake value even more rapidly (Figure 67B - curve a). Theactual concentration of Li is shown by the dotted line. As an extreme example, an initialconcentration of 1 gram Li/liter, five times higher than the Salton Sea Brines (Thompson andFournier, 1988), still falls to the same steady state within 3,600 years.
In order to reach steady state at the observed sodium concentration in the lake, an additional sourceof approximately 106 kg/year of sodium must be added to balance the outflow. This is nearly tentimes higher than the inputs derived from the atmosphere and caldera wall runoff and documentsthe "need" for another major source to account for the steady state flux. A reasonable source forthe missing ion fluxes is the input of the hydrothermal fluids at the lakefloor. If this"hydrothermal" source had stopped early this century (for instance at the time of the first chemicalanalyses of Crater Lake water), we would have seen nearly a 25% decrease in lake concentrationby today. Obviously, we do not have the analytical sensitivity to detect much shorter termvariability in the input fluxes, but the data are entirely consistent with steady state.
Summary of Steady State Model Results.
We have evaluated the steady state model for nine ions in the lake assuming that the mass of thesematerials is not changing with time (equation 11/.3.1 0 such that input rate = output rate).The input is the sum of the precipitation, wall runoff, and lakefloor springs. The only outputconsidered is seepage of bulk lake water. Precipitation and runoff sources are independentlyestimated using the concentrations of ions in precipitation and intercaldera wall springs summarizedby Reilly et al. (1989). The total output rate is the product of the seepage rate for water and ourdata for bulk lake concentrations (Table 9 and Appendix I). The input flux from the lakefloorsprings (also referred to as the hydrothermal flux) is calculated as the difference between the otherinputs and the output. Table 16 presents the results of these steady-state calculations.
The budget for Si developed in Table 16 assumes the seepage loss is the only output for dissolvedSi (at these pH values Si is present in solution as Si(OH)4). However, this element is a significantnutrient for the diatoms in the lake which dominate the phytoplankton assemblage (Larson, 1988),and its removal to the sediments with biogenic debris must be included in a proper mass balance(Reilly et al., 1989; Nathenson, 1990a). Using unpublished results from our sediment trapprogram and sediment core analyses, we have estimated the burial rate of biogenic opal (as distinctfrom the burial of total SiO'2 which is dominated by aluminosilicates). Approximately 28 x 106moles Si year per year are buried as opal which represents an additional output from the dissolvedreservoir. Because the seepage flux (Table 16) is 20 x 106 moles Si year per year, the burial of
164

opal accounts for approximately 50% of the output. Consequently, the output term in the massbalance will increase. This causes an increase in the predicted hydrothermal flux of Si to ratesequivalent to 67% to 77% of the total input rate.
The steady-state model (Table 16) documents that the hydrothermal input, calculated as the deficitin the mass balance, is the dominant input for dissolved components in the lake and accounts forgreater than 90% of the Na+, Cl- and Li fluxes. If we sum the mass of all elements in thehydrothermal input, we calculate a net flux of 3.4 to 4.2 x 10⁶ kg/year as total dissolved solids orabout 5-6 pg/m2.sec (integrated over the area of the lake deeper than 350 meters). Directobservations of salt accumulation based on a time-series of CTD measurements (Figure 68), leadsto an estimate of the active salt flux (5±2 p.g/m2.sec) which is indistinguishable from the steadystate value estimated by our mass balance model.
1Estimates based on the hydrologic budget of Redmond (1990) and concentrations in theatmospheric and runoff sources from Reilly et al. (1989). The range in fluxes is derived fromthe first and third quartile for the mean annual concentrations of various intercaldera wall springs(the runoff term).
2The large range for Ca2 and SO42 reflect the high concentration of these ions in springs drainingChaski Slide. Although we have no quantitative method of weighting the concentration of anyparticular spring in the net input, we believe the high values of the input range are driven byover-representing these Chaski Slide springs.
3The output term for Si listed is based only on seepage, as are all the other outputs in thiscalculation. Due to Si removal by diatoms, this output rate may be approximately 2 times larger,requiring a higher hydrothermal input flux. See text.
165
TABLE 16. Steady State Mass Flux Calculations.
Precipitation plus Seepage Hydrothermalrunoff inputs' output flux (difference) % of total
Component (x 106 moles/year) (x 106 moles/year) (x 106 moles/year) input
Na 3.4-4.2 28.3 24.1-24.9 85-88%
0.71-0.96 2.8 1.8-2.1 66-74%
Ca2 1.9_5.12 10.7 5.6-8.8 52-82%
Mg2 0.8-2.4 6.9 4.5-6.1 65-88%
HCO 8.7-10.4 36.8 26.4-28.1 72-76%
Cl- 1.5-1.6 17.1 15.5-15.7 90-91%
So42- 0.6_4.32 6.4 2.0-5.8 32-91%
Si 11.7-16.1 20.2 4.0-8.5 20-42%
Li 0 0.43 0.43 100%
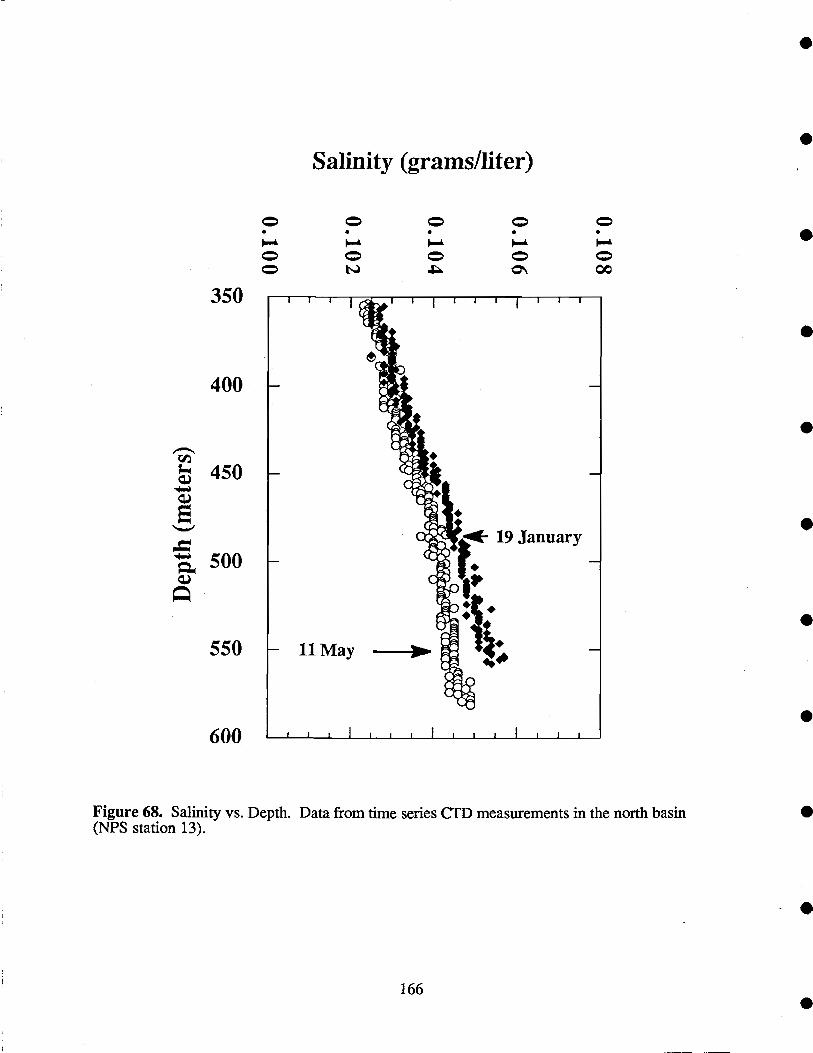
350
400
550
600
Salinity (grams/liter)
166
Figure 68. Salinity vs. Depth. Data from time series Cii) measurements in the north basin(NPS station 13).
We can divide these steady state hydrothermal fluxes (moles/year, Table 16) by the composition ofour hypothesized source end-members (moles/liter, Table 9) to arrive at an estimate of the actualfluid flux (liters/year). Separate calculations can be done for each individual ion measured in thevarious end-members (e.g., Llao's Bath, the Palisades Pool, and porewaters from GC8 and BC8;Table 9). The average of all these flow rate estimates is265 liters/second with a standard deviationof 115 liters/second. This value may be compared to the ranges of 80-1,900 liters/seconddiscussed by Nathenson (1990a), 120 liters/second estimated by Reilly et al. (1989) and 200-400liters/second reported by McManus and Collier (Appendix A, this report).
The standard deviation in the mean flow is largely a consequence of different inter-elementrelationships between the lake water and the end-members. The flow estimates for a particular iontend to have smaller variability (standard deviations50 liters/sec) than the variation of the meanestimates derived by including all the different ions. In particular, the flow rates needed to balancethe Cl- mass balance are nearly 400 liters/sec while the flows needed for the Na+ model are only230 liters/sec. This difference reflects the fact that the sampled end-members do not exactlyaccount for the lake composition - the Na/Cl ratio in the lake is 1.6 while the ratio in all the sampledend-members ranges from 2 to over 4. This is a significant problem for which we have nodefinitive answer. Several possibilities can be suggested: the steady-state mass balance may beinaccurate for particular ions; a significant input or output source or process may have beenoverlooked; the lake is not at steady state with respect to our sampled end-members or other inputestimates. In spite of the uncertainty, the mass balance approach and the direct sampling of thecomposition of the thermally and chemically enriched fluids entering the lake has given us a muchbetter estimate of the integrated significance of hydrothermal inputs to the overall chemistry of thelake.
Since we have hypothesized that some or all of this flux might be in the form of diffuse flowthrough sediments, it is useful to evaluate the vertical velocity of porewaters that could carry thisflux. For demonstration purposes, we can assume that an area the same size as the high heat andsalt "anomaly" area (approximately 3 x 10⁶ m2 - Figure 12) has a flow rate of 3 meters/year aspredicted from box cores near the site (see Appendix F). This would result in a flow of30liters/second. If we further assume that the remaining lake sediment floor (below 400 meters) hasa flow rate of 0.1 meters/year (based on the gravity cores), we obtain an additional fluid flow rateof 70 liters/second. If we assume that 20 meters/year represents the flow through the mat sites andwe assume that this flow occurs over an area one tenth of the size of the high heat/salt anomalyarea, then we obtain an additional 190 liters/second of flow. These estimates yield a total flow ofhydrothermal fluid of approximately 290 liters/second. These hypothetical calculationsdemonstrate that reasonable porewater flows can account for the necessary flux of heat and salt tothe lake. However, considerably more data would be needed to constrain this further (seeAppendix F).
167

Fluid Flows Through Sediments.
Flows deduced from sediment pore water distributions.
The pore water studies of Crater Lake sediments demonstrate a broad range of gradients and majordifferences in the dissolved ion content from different sites of the lake (Figure 69). Wheat(Appendix F) has shown that the non-linear gradients cannot be explained by sediment reactions,diffusion, or changes in lake composition. Only advection rates of a few centimeters/year to morethan 100 centimeters/year appears capable of accounting for the observed gradients.
Since Crater Lake sedimentation is the result a variety of mixing processes which introducevolcanic debris from the summit and caldera wall, the solid phase sediment composition isrelatively uniform. Except for variations in the biogenic opal and iron-rich precipitate content, thechemical composition of cores reflects a relatively uniform aluminosiicate input (Dymond andCollier 1990). Consequently, the differences in pore water concentrations cannot be the result ofreactions. For example, GC8 has >5 times higher Na and Cl contents than are observed in GC1(Appendix F). Any low temperature alteration of the aluminosilicate material in the core wouldproduce similar pore water concentrations. The strong differences in the pore water concentrationsin the GC8 core can only be maintained by advection of enriched pore fluids.
Comparisons of the compositions of caldera wall debris, sediment trap material, and buriedsediments also document the inadequacy of low temperature alteration processes as an explanationof pore fluid compositions. The composition of caldera wall debris, sediment trap samples, andsediments are statistically indistinguishable (Figure 70). Because calcium is a relatively mobileelement compared to aluminum, low temperature alteration is expected to decrease the Ca/Al valuessystematically from caldera wall debris to sediment traps to progressively deeper sediments. Nosuch trend is observed, suggesting low temperature alteration does not mobilize major amounts ofcalcium. However, if we assume opposing two standard deviations of error on the Ca/Al meansfor sediments and traps, we estimate a maximum amount of Ca leached:
[(Ca/Al), I (Ca/A1)j - 1] X 100 = % Ca lost by low temperature alteration
This equation assumes no Al is lost after deposition. For the data shown in Figure 70, this calculationindicates that a maximum of 40% of the Ca could go into solution through reaction in the sediments.The trap data also indicate that the flux of particulate material to the bottom is approximately 40j.ig/cm2/y. Thus, an upper limit to the alteration loss is: 40 pg/cm2Iy x 0.4 16 .tg/cm2/y.
To set this estimate in context, Wheat (Appendix F) estimates an advection rate of 8 cni/y wouldaccount for the pore water gradients in the GC8 core. Since pore water Ca contents areapproximately 32 mg/I in this core, 256 jiglcm2/y of Ca is being removed from this core byadvection of pore fluids. Consequently, the advective loss is 16 times our maximum possibleestimate of low temperature reaction loss of Ca and 7 times the total flux of particulate Ca whichreaches the bottom of the lake. Clearly, the estimated advective fluxes of Ca are impossible toexplain by alteration reactions in the sediments. Similar conclusions can be documented for otherions.
168
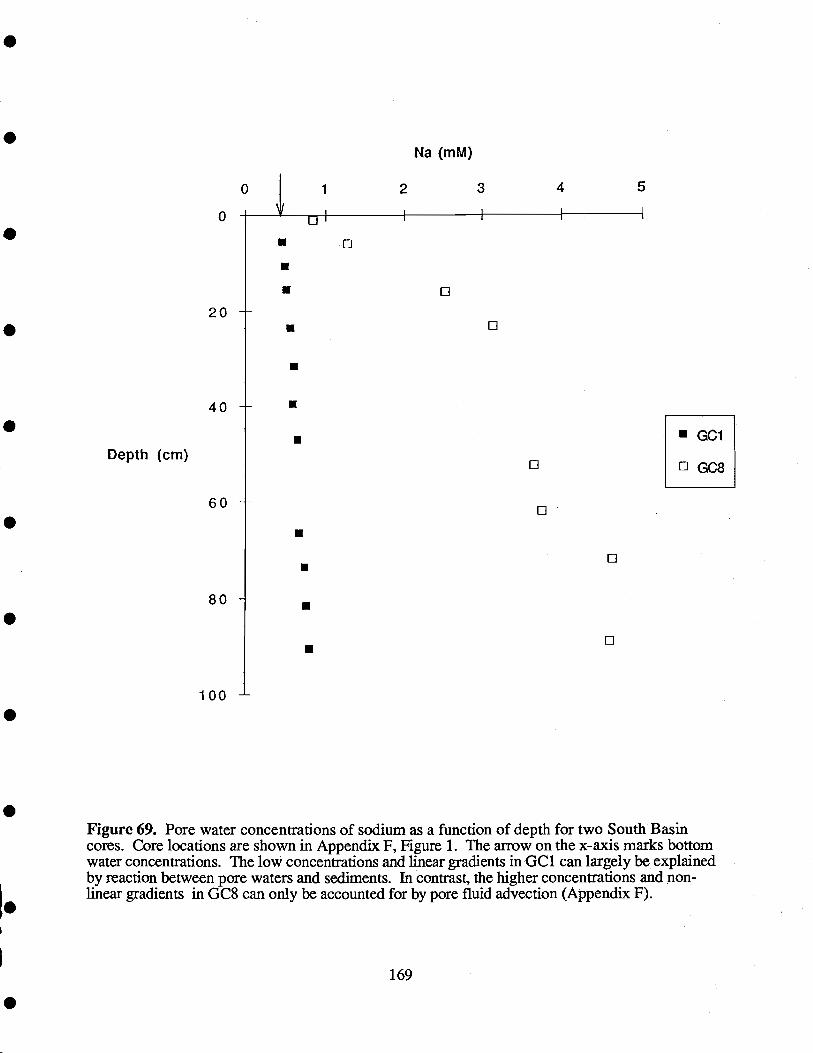
Depth (cm)
169
Na (mM)
GC1
DGC8
Figure 69. Pore water concentrations of sodium as a function of depth for two South Basincores. Core locations are shown in Appendix F, Figure 1. The arrow on the x-axis marks bottomwater concentrations. The low concentrations and linear gradients in GCI can largely be explainedby reaction between pore waters and sediments. In contrast, the higher concentrations and non-linear gradients in GC8 can only be accounted for by pore fluid advection (Appendix F).
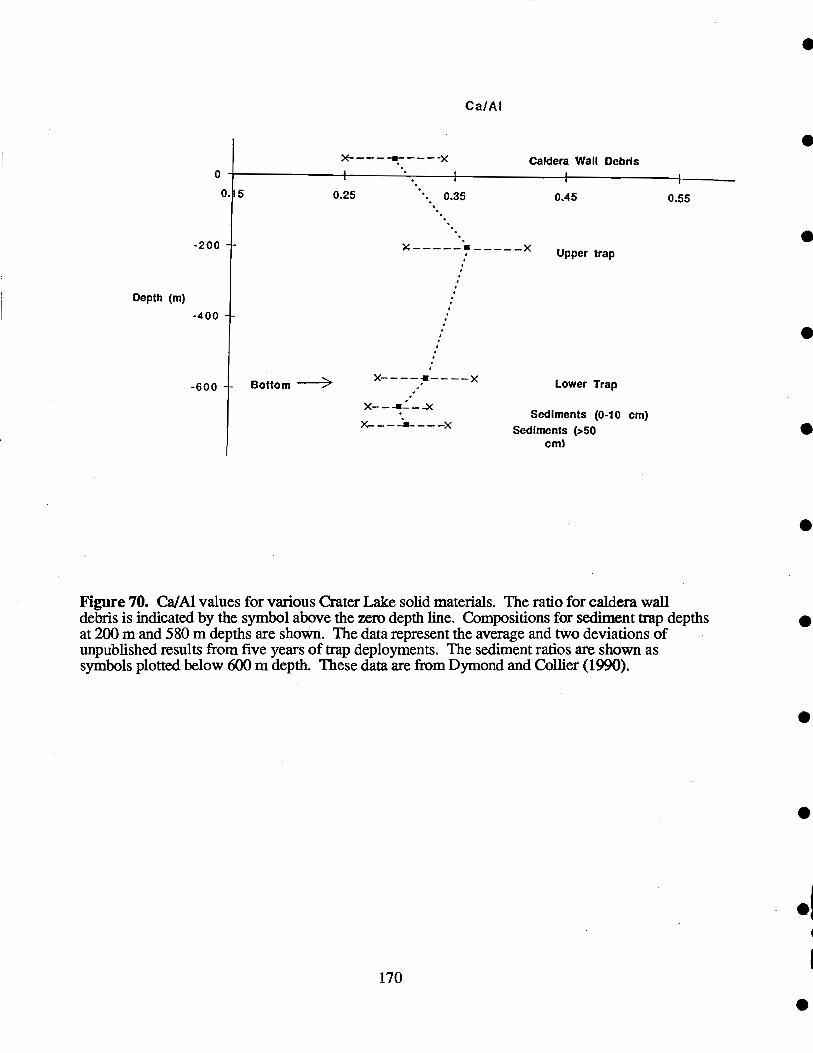
0
-200
Depth (m)
-400
0. 5 0.25 0.35
170
Ca/Al
-x Caldera Wail Debris
0.45 0.55
Upper trap
-600 Bottom >----------A Lower Trap
- - -Sediments (0-10 cm)- - - - x SedIments (>50
cm
Figure 70. Ca/Al values for various Crater Lake solid materials. The ratio for caldera walldebris is indicated by the symbol above the zern depth line. Compositions for sediment trap depthsat 200 mand 580 m depths are shown. The data represent the average and two deviations ofunpublished results from five years of trap deployments. The sediment ratios are shown assymbols plotted below 600 m depth. These data are from Dymond and Collier (1990).
Flux Through the Sediments Collected by the Benthic Chamber.
A benthic chamber ("barrel") was deployed in the South Basin thermal area for 6.7 days. Thebarrel, with a 2.5 cm-diameter hole at the top to allow the passage of fluids, accumulates porewater moving upwards through the sediments. Only three of the six time-sequenced watersamplers operated properly within the barrel which limits our ability to discern the functionality ofthe concentration increase within the chamber. For initial conditions inside the barrel at the time ofdeployment, we will assume the composition of a bottom water sample collected by the sub. Thetime series of water samples collected within the barrel clearly defines an accumulation of dissolvedmaterials within the barrel. This observation is a direct confirmation of the upward flux ofporewater through the sediments (Figure 71). The concentrations of Na, K, Li, Mg, Ca, Si,
CO2 and Mn all increased (SO4, Cl and temperature were not determined) while the concentrationof 02 decreased. The concentration of 3He also increased from 2.8 to 8.5 x 10⁻¹³ cc/g and thefraction of "dead" carbon in the CO2 increased with 4C dropping from -140%o to -266%during the 6.7 day deployment.
In theory, the change in concentration in the open barrel over time can be described by thedifferential equation:
dC M Qdt - VV
where: M = mass flux (grams/sec)
Q advective fluid flow (in out; liters/sec)
V = volume of the chamber (208 liters)
C = concentration (grams/liter)
t = time (sec)
The solution is of the form:
MC(t) = (lexp
If we choose a concentration for the pore water fluid entering the barrel (e.g. one of the pore waterend-members from near the barrel), then the time series of data applied to this equation wouldideally determine the advection rate. Conversely, if we use a fluid flow rate estimated from thepore water profile models (Appendix F), the concentration of the end-member is determined.Unfortunately, when we attempt to apply this model to the data in Figure 71, we fmd that noreasonable selection of flows or end-member concentrations properly describe the data. Theprimary problem is the shape of the curves in Figure 71, suggesting a rapid approach to somesteady state value. This requires a very large flow rate (many meters/year) and projects to a verylow end-member concentration. We believe that our estimate of the initial conditions within the
C
t) )
171
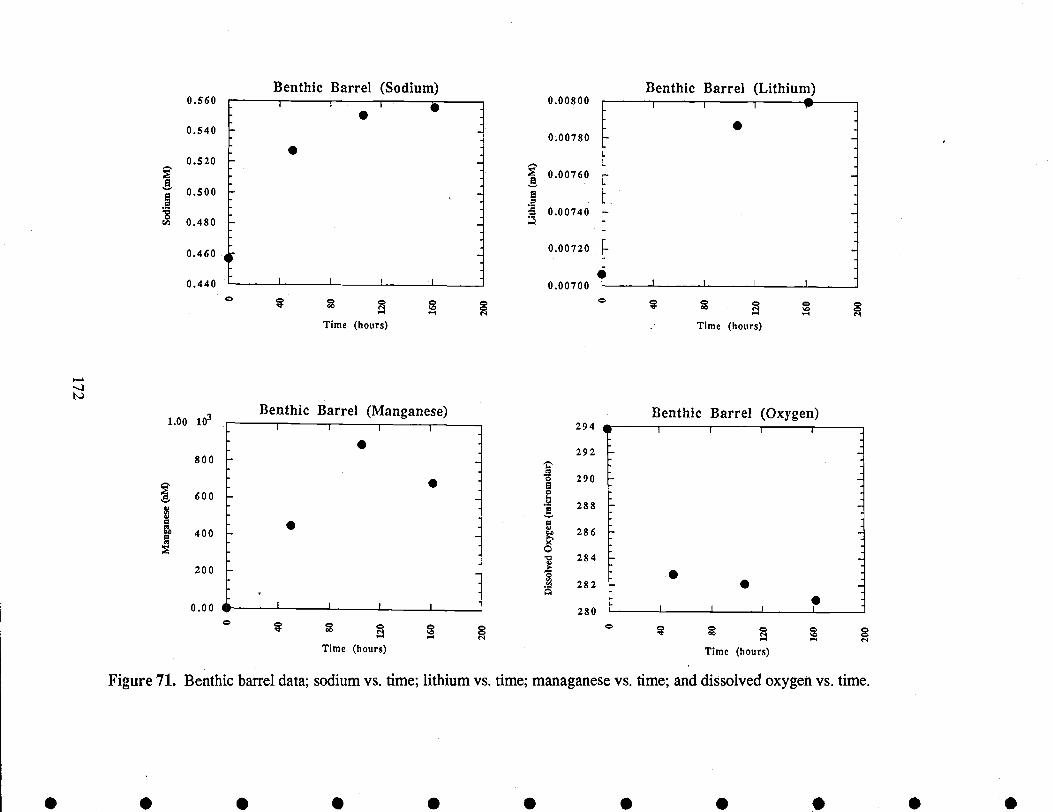
Figure 71. Benthic barrel data; sodium vs. time; lithium vs. time; managanese vs. time; and dissolved oxygen vs. time.
1.00
800
600
400
200
0.00
Benthic Barrel (Manganese)
2
0
Benthic Barrel (Oxygen)I
I0
S
I .
I I
294
292
290
288
286
284
282
280
I
I
S
I
I
S
I I
S0 0 0 0 0
0.560
0.540
0.520
0.500
0.480
0.460
Benthic Barrel (Sodium)0.00800
0 .00780
0.00760
a
0.00740
0 .0 0 7 20
0 .0 07 0 0
Benthic Barrel (Lithium)
0.440
S
0.
I I
Time (hours) Time (hours)
Time (hours) Time (hours)
barrel probably too low, which largely forces the apparent shape. If we drop this point from thetime series, there is insufficient data to constrain any functionality, although the observation of anincrease with time is still clear. Therefore, we do not believe we can refine our estimates ofsediment advection rates or the end-member concentrations with this experiment. However, theobserved fluxes are consistent with the upward advection of the chemically and thermally enrichedfluids predicted by the direct porewater analyses.
IV.4. Fluxes of Heat
Using various techniques and models as part of our research we have made estimates of the rate ofheat input associated with the observed flux of anomalous fluids to Crater Lake. We willsummarize these estimates here and compare them to the estimates made by Wffliams and VonHerzen (1983) and to other convective heat flows associated with hydrothermal springs in theCascade Range (Ingebritsen et al., 1989; Mariner et al., 1990).
Direct Observations of the Accumulation of Heat.
As noted during our discussion of the temperature distribution of Crater Lake (section 111.3), thereis a clear increase in temperature in the bottom 200 meters of the lake. One of the significantcontributions of our work are the estimates of heat fluxes which are needed to maintain thesethermal gradients (section P1.3). In addition to this "steady-state" model of heat flux, we havedirectly observed an increase in the temperature of the deep lake over several field seasons. Theseobservations, which are discussed in detail in Appendix A, are summarized below in order toemphasize this important result (Figure 72).
The observation of temporal changes require the application of precise instrumentation andcollection of time series data. Time series of CTD profiles (Figure 72a) show the increase intemperature in the North Basin over a four month period in the summer. Although most of thisheat is added in the South Basin, horizontal mixing is effective, and the warming is expressedthroughout the deep lake. Due to the seasonal thermocline that develops during this period, thereis very little exchange between the upper and lower lake. Consequently, there is little temperaturechange between 325 and 375 m. The deep lake isolation means that the origin of the observed heatincrease is not the lake surface. Instead it must be derived from the input of geothermal heat frombelow. The time series of temperature can be integrated to estimate the total heat flux into the deeplake.
In addition to our CTD time series, we collected a continuous record of temperature at 10 meterintervals in the water column using a moored thermistor chain. The instrument was deployed inthe South Basin between September, 1989 and July, 1990. Figure 72b shows the record for onedepth, and the data for more than 20 depths in the lake is discussed in Appendix A. The dataclearly document the seasonal cycle of geothermal heating when the lake is stratified followed byvertical mixing in the winter which results in a heat exchange with the deep water.
The observed temperatures changes can be integrated to yield estimates of the net input of heat(Appendix A). Assuming horizontal homogeneity and integrating over the deep basin area(.-21km2), we estimate a heat flux of 20 to 30 megawatts into the whole lake is required to producethe observed temperature increases.
I.
173

(b)
250
300
350
' 4004)
4504)
500
550
600
Temperature (°C)
U' C' C' C' C'GO C'
'-4 Day
Figure 72. (a) Temperature versus depth. Data is from time series CTD taken from the northbasin. (b) Temperature versus time from thermistor deployed in the south basin. Both figuresdemonstrate warming in the deep lake due to active inputs of thermally enriched fluids.
174
3.64
0 3.630
4) 3.62
I-4) 3.61E4) 3.60
3.59
Helium-based Estimates of Heat Fluxes.
In section ffl.6 we discussed the large enrichments of 3He over the concentration in equilibriumwith the atmosphere. We have also discussed that the atmospheric gases dissolved in the lakeequilibrate with a characteristic time of two years. Therefore, an amount equivalent to the completeinventory of "excess" 3He (1.8 x 10² atoms 3He) must be added to the deep lake every two years.This would require a flux of 9 x 10²¹ atoms 3He/year. The strong correlation of 3He withtemperature (Figure 21a) implies that the heat and 3He have a common carrier. Consequently, wecan divide the 3He flux by the ratio of 3He/AT (1.5 x 10⁻¹² cc 3He/gram °C) to get an estimate ofthe heat flux which is associated with the thermal flows that carry the 3He. The result is 29megawatts which is comparable to the estimates based on the direct observations of temperatureincreases in the deep lake.
Using the same approach as our other steady state mass balance calculations (Table 16), we canestimate the flow rate of this hydrothermal fluid carrying the 3He. We assume that theconcentration of 3He in the end-member is equal to that measured in Llao's Bath (271 x 10-13cc/mi; Table 9) and divide this into the total 3He flux (9 x 10²¹ atoms 3He/year) and calculate aflow rate for the fluid of 400 liters/sec. We can also estimate the temperature of the end-memberby dividing the end-member 3He concentration by the water column ratio of 3He/zT (1.5 x 10⁻¹²cc 3He/gram °C). This calculation predicts an end-member temperature of 18°C which is very closeto the highest lake bottom temperature measured during the submersible program.
Ion-based Estimates of Heat Flux.
Finally, we can make use of the estimates for the hydrothermal fluxes of ions derived from themass balance model (Table 16) to estimate the total convective heat flux into the lake (Collier andDymond, 1988a and 1989). Since these fluids are also warmer than deep lake water, this cationflux is associated with a heat flux. We compute the heat-to-cation ratio from the cation/3He ratiosderived from Figure 27b-f and the 3He/AT ratio used above. A total convective heat flux into thedeep lake can be estimated from the product of the cation flux (deficit) and the heat-to-cation ratio.The average of the estimates from different cations is 15 megawatts (Table 17).
In summary, three methods, which are based on very different data sets and assumptions, predictheat fluxes ranging from 15-30 megawatts. The relatively close agreement gives us confidence inthe quality of this estimate. Williams and Von Herzen (1983) estimate a net heat flux into the lakeequivalent to 15-28 megawatts based on sediment heat flow measurements and water columntemperature distributions. Our flux estimates could also be compared to the heat flux associatedwith other Cascade thermal springs. Mariner et al. (1990) estimate the convective heat flux ofthermal springs and aquifers in the Cascade Range. The total direct discharge of thermal springs is82 megawatts, and the total aquifer flux is estimated to be 190 megawatts based on a "chlorideinventory" model. A summary of all fluid and heat flux estimates for the Crater Lake system ispresented in Table 18.
175
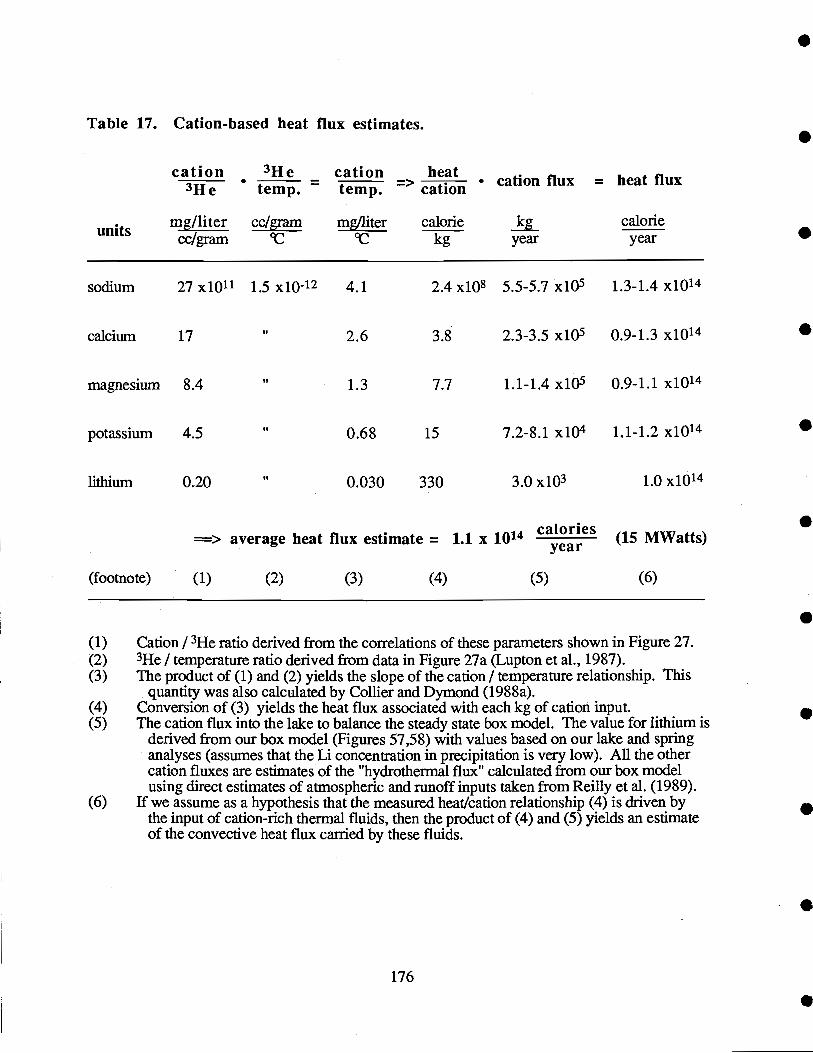
==> average heat flux estimate = 1.1 1014 caloriesyear
176
(15 MWatts)
Cation / 3He ratio derived from the correlations of these parameters shown in Figure 27.3He / temperature ratio derived from data in Figure 27a (Lupton et al., 1987).The product of (1) and (2) yields the slope of the cation / temperature relationship. This
quantity was also calculated by Collier and Dymond (1988a).Conversion of (3) yields the heat flux associated with each kg of cation input.The cation flux into the lake to balance the steady state box model. The value for lithium is
derived from our box model (Figures 57,5 8) with values based on our lake and springanalyses (assumes that the Li concentration in precipitation is very low). All the othercation fluxes are estimates of the "hydrothermal flux" calculated from our box modelusing direct estimates of atmospheric and runoff inputs taken from Reilly et al. (1989).
If we assume as a hypothesis that the measured heat/cation relationship (4) is driven bythe input of cation-rich thermal fluids, then the product of (4) and (5) yields an estimateof the convective heat flux carried by these fluids.
Table 17. Cation-based heat flux estimates.
cation 3He cation heat cation flux = heat flux3He temp. - temp. -> cation
units mg/liter cc/gram mg/liter calorie kg caloriecc/gram CC CC kg year year
sodium 27 x1011 1.5 xlO-12 4.1 2.4 x10⁸ 5.5-5.7 x10⁵ 1.3-1.4 xlO'4
calcium 17 2.6 3.8 2.3-3.5 x10⁵ 0.9-1.3 x10¹⁴
magnesium 8.4 'I 1.3 7.7 1.1-1.4 x10⁵ 0.9-1.1 xlO'4
potassium 4.5 0.68 15 7.2-8.1 x10⁴ 1.1-1.2 x10¹⁴
lithium 0.20 'I 0.030 330 3.0 x10³ 1.0 x10¹⁴
(footnote) (1) (2) (3) (4) (5) (6)
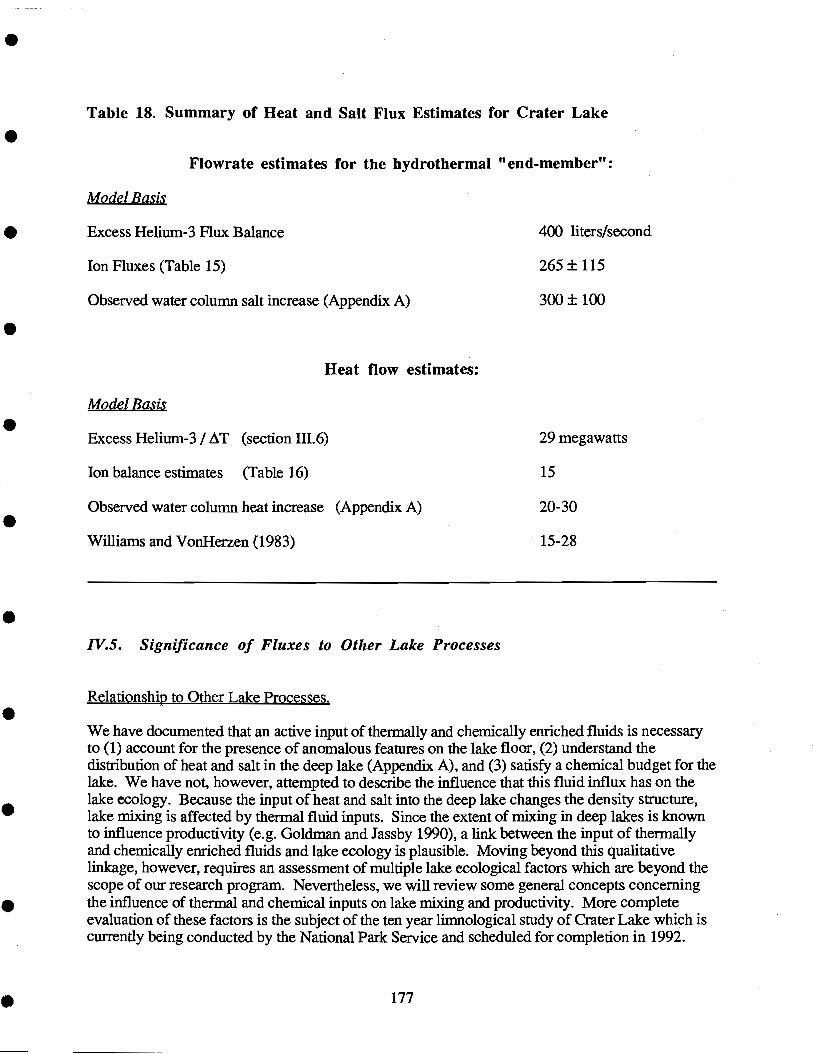
I
I
S
S
S
Table 18. Summary of Heat and Salt Flux Estimates for Crater Lake
Flowrate estimates for the hydrothermal "end-member":
Model Basis
Excess Helium-3 Flux Balance 400 liters/second
Ion Fluxes (Table 15) 265 ± 115
Observed water column salt increase (Appendix A) 300 ± 100
Heat flow estimates:
Model Basis
Excess Helium-3 / AT (section ffl.6) 29 megawatts
Ion balance estimates (Table 16) 15
Observed water column heat increase (Appendix A) 20-30
Williams and Vonllerzen (1983) 15-28
IV.5. Significance of Fluxes to Other Lake Processes
Relationship to Other Lake Processes.
We have documented that an active input of thermally and chemically enriched fluids is necessaryto (1) account for the presence of anomalous features on the lake floor, (2) understand thedistribution of heat and salt in the deep lake (Appendix A), and (3) satisfy a chemical budget for thelake. We have not, however, attempted to describe the influence that this fluid influx has on thelake ecology. Because the input of heat and salt into the deep lake changes the density structure,lake mixing is affected by thermal fluid inputs. Since the extent of mixing in deep lakes is knownto influence productivity (e.g. Goldman and Jassby 1990), a link between the input of thermallyand chemically enriched fluids and lake ecology is plausible. Moving beyond this qualitativelinkage, however, requires an assessment of multiple lake ecological factors which are beyond thescope of our research program. Nevertheless, we will review some general concepts concerningthe influence of thermal and chemical inputs on lake mixing and productivity. More completeevaluation of these factors is the subject of the ten year limnological study of Crater Lake which iscurrently being conducted by the National Park Service and scheduled for completion in 1992.
177
Hydrothermal inputs to Crater Lake could either increase or decreases lake stability. Thermalinputs alone would destabilize the water column, but the addition of salt increases density andstability. Net stability enhancement by hydrothermal activity is suggested by the observation thatthe most dense lake waters are found near the lake bottom in the South Basin where chemical andthermal inputs appear to be greatest (Appendix A). The bulk water column, however, is onlymarginally stable , and this condition may reflect the combined influence of thermally andchemically enriched fluid inputs to the basin. These fluid inputs enhance the horizontal mixing ofthe whole lake as the more dense South Basin fluids mix horizontally across the sill connecting thetwo basins (Appendix A). The acivection of South Basin fluids across the sill necessarily requiresdisplacement of North Basin fluids, and the overall process must contribute to the turbulent energyand mixing of the entire lake.
Although perfect analogs to Crater Lake without the thermal and chemical enrichments do not exist,inter-lake comparisons may have some value. Goldman and Jassby (1990) suggest basinmorphology, as defmed by 4, the maximum depth as a percentage of mean surface diameter, is apredictor of ease of mixing. Higher Zr indicates greater depth and lower wind fetch, both of whichcould decrease the rate of vertical mixing Consequently, Crater Lake with a Zr of 7.2 might beexpected to mix more slowly than Lake Tahoe with a 4 of 2.0. The available data, however,suggest both lakes have a characteristic mixing time of two to three years (Pearl et al. 1975;Appendix G). This comparison, however, does not establish that the enhanced mixing in CraterLake is due to thermally and chemically enriched inputs. Two significant features of lake mixingnot considered in the calculation of 4 are the temperature of maximum density and the timing ofatmospheric mixing forces. Fresh water has a density maximum around 4°C, and this basic featuresupplements mixing of lakes (Farmer and Carmack, 1981; Carmack and Farmer, 1982; Weiss et.al., 1991). The timing of maximum wind forcing with respect to the period when much of thewater column is near this temperature of maximum density can determine the effectiveness ofvertical mixing. Although basin morphology is certainly related to wind mixing effectiveness, itdoes not provide a quantitative measure of lake mixing.
It should also be recognized that the water column of Crater Lake has a total change in the verticaldensity structure which may be similar to other deep lakes - independent ofhydrothermal activity.Unfortunately, the precise temperature and salinity measurements, necessary for accurateassessment of lake stability, do not exist for other deep lakes - e.g. Lake Baikal or Lake Tahoe.Thus, inter-lake stability comparisons based on the existing data are difficult.
Although we cannot definitively say what the influence of a hydrothermal input would be on lakemixing, exchange between the upper and deeper levels of Crater Lake undoubtedly alters the lake'sproductivity and overall ecology. Current estimates suggest 80% of the nitrate flux to the euphoticzone is a result of deep mixing, with the remaining fraction coming from atmospheric, and runoffsources (Reilly et al. 1989; McManus et al. in prep.). Clearly, a decrease in the rate of verticalmixing of the lake would result in relatively rapid decrease in the productivity, assuming the extentof nutrient recycling in the euphoric zone remains constant. The long term effects of ahypothesized decrease in mixing are not so clear because of possible shifts in lake ecology andfeed-back processes which wifi tend to increase the deep lake nitrate pool. Without detailedmodeling of the nutrient dynamics, the complexity of the system allows only qualitative views ofthe long-term changes in productivity.
178
. IV.6. Evaluation of Hypotheses for the Thermal and Chemical Features
As we have shown throughout this report, Crater Lake has a number of physical, chemical, andbiological features which are not typical of Cascade lakes or deep lakes in general. We haveattempted in this study to collect the essential data which can account for these features. In ourreport on field studies conducted in 1988 (Collier and Dymond, 1988a), we considered sevenhypotheses to account for the chemical composition of the bulk lake, the thermal and chemicalvariability in near-bottom waters, and the chemical variability in deep lake sediments:
The high salt content of the lake is a consequence of fumarolic and thermal spring inputs thatoccurred soon after the collapse of Mt. Mazama.
The evaporation rates in the lake are greater than previous estimates and can account for itshigh salt content.
The chemical alteration of Mazama ash could introduce chloride and other elements into thelake, thereby accounting for the high content of these elements compared to other Cascade lakeswhich are dominantly fed by precipitation.
The anomalous volatile contents (helium and radon) are a consequence of gaseous injection(i.e., non-condensable volatiles) and do not require a hot water source.
The observed temperature pattern of the deep lake is a consequence of conductive heat fluxthrough the lake bottom and does not involve any fluid injection.
The near-bottom increases in major-ion content and the observed metal-rich deposits are theconsequence of cold, saline spring input.
There are hydrothermal inputs to the lake which are driven by convection of waters throughcooling magmatic bodies that underlie Crater Lake.
In this section of the report we wifi evaluate the data which support or contradict each of thesehypotheses.
(fl Early Fumarolic Input Hypothesis.
This hypothesis has been put forth by La Fleur (1987) as a means of explaining the elevated saltcontent of Crater Lake relative to other nearby lakes in the Cascade Range. The early stages ofcaldera lake evolution are often associated with continued volcanism, hot springs, and fumarolicinputs. As a consequence, these lakes can become extremely concentrated in dissolved ions andgases. For instance, in our discussion of the mass balance and residence time of ions, we usedtwo such lakes as possible analogues for the young Crater Lake, Lake Oskjuvatn in Iceland(Olafsson, 1980) and the crater lake in the Soufriere volcano (Sigurdsson, 1977). We then appliedsimple mass balance calculations using the current hydrologic model for Crater Lake anddemonstrated that Crater Lake (or any reservoir) has relatively little residual "memory" of eventsoccurring more than ten residence times in the past. Therefore, dissolved chloride or solub1e
179
materials added to Crater Lake following the collapse of Mount Mazama (La Fleur, 1987) wouldhave been effectively purged from the lake within 2,500 years. Thus, if hydrothermal input haddeclined and ceased shortly after caldera collapse, ion concentrations would have declined to arelatively low, steady-state level maintained by precipitation and weathering. On the other hand, ifthere were continuous hydrothermal inputs into the lake, ion concentrations would achieve asteady-state balance between loss and new input. It is clearly more difficult to evaluate steady stateconditions over time scales which are short compared to the response time of the system.Nonetheless, because the current concentration of ions in Crater Lake remains high compared tothe concentration supported by precipitation and weathering, the exponential drop in ionconcentrations toward a precipitation/weathering steady state should still be easily visible (Figure58). Nathenson (1990a) has shown that there have been no such significant changes discernable inthe chemical composition data for Crater Lake since 1912.
Consequently, although this hypothesis might potentially affect the very earliest phases of lakeevolution, early fumarolic sources of dissolved ions cannot be significant at the present time.
(2 Evaporation hypothesis.
If a major fraction of the waters which have entered the lake evaporated, this would concentrate theions dissolved in the lake and increase its salt content above that predicted by losses due to seepageoutflow alone. A high evaporation rate has been proposed to explain the anomalously highchloride in the lake (La Fleur, 1987).
It has long been recognized that a significant fraction of the water in Crater Lake evaporates (Diller,1902; Phillips, 1968; Simpson, 1970a; Redmond, 1990). Therefore, all of the hydrologic budgetsused in examining the mass balance of ions in the lake include evaporation effects (Simpson,1970a; Nathenson, 1990a). The hydrogen and oxygen isotope ratios in Crater Lake water fall offthe meteoric trend and follow a reasonable evaporation trend (Thompson et al., 1987; 1990)(Figure 58). As discussed by Redmond (1990), direct measurements of evaporation areinaccurate and cannot represent an annual average until observations are made in the winter.Therefore, most estimates of evaporative losses from the lake have been based on water budgetconsiderations. The values most frequently used for evaporation are quoted or derived fromPhillips (1968). His water budget indicates that approximately 28% of the water entering the lakeevaporates. The value chosen by Simpson (1970a,b) results in 33% loss by evaporation. In adetailed analysis of extensive records of climate and lake-level variations, Redmond (1990)proposes an evaporation rate equivalent to 50% of the total water input and shows that this rate isconsistent with the long-term data record.
We have used the hydrologic data set of Redmond (1990) and the high evaporation rate heproposes in our application of the mass balance model for chloride and lithium (Figure 67a,b).Our mass balance calculation demonstrates that the steady-state concentration of chloride in thelake, assuming zero hydrothermal input, would be less than 10% of the observed level. Even ifthe evaporation accounted for 60% of the net water loss, the steady-state chloride value would bebarely 10% of the concentration present in Crater Lake.
During evaporation, the ionic ratios between conservative salts remain constant - i.e., the finalbrine has the same ionic ratio as the parent fluids. If the source of these ions in the lake isprimarily the weathering products carried by runoff, then the lake would have the same ion ratios
180
as those seen in that runoff. Figure 24 shows that this is not the case; ratios measured in the lakeare markedly different from those in the caldera springs. Although evaporation removesapproximately half of the annual inflow of water, it cannot account for the observed pattern of ionabundances or the magnitude of the ion concentrations in Crater Lake.
(3 The Ash Alteration Hypothesis.
Volcanic ash is reactive and can be readily altered to various hydrous phases. The classic rock-weathering reactions of Garrels and MacKenzie (1967) release cations and silicon to solution andproduce alkalinity. Because of the abundance of fme, glassy pumice debris on the rim and calderawalls of Crater Lake, this debris weathering could provide a source of cations to Crater Lakewaters. This hypothesis has been proposed by La Fleur (1987) as a source of chloride to the lake.
The weathering of volcanic phases as a source of elements in Crater Lake waters and Mazamasprings has been discussed in detail by Nathenson and Thompson (1990). They found that simpleweathering reactions involving the transformation of glass and clinopyroxene to kaolinite couldaccount for the composition of most Mazama cold springs. However, the computed and observedcontents of most cations dissolved in spring water were 25% to 35% of those observed in CraterLake. In addition, Nathenson and Thompson (1990) computed the Cl contribution to springwaters from weathering by using measured ratios of chloride to sodium and assuming that all thechloride would dissolve with the sodium. The resulting value is more than 100 times less than theobserved chloride contents in Crater Lake. Their data demonstrate that weathering of volcanicmaterials cannot account for the observed chloride concentration. At best, weathering contributes asmall fraction of the other ionic constituents of Crater Lake waters. Alternative mass balanceapproaches have also come to similar conclusions (Reilly et al. 1989).
In addition, pore water studies conducted in 1989 (Appendix F) show that low temperaturereactions between Crater Lake sediments and pore fluids produce only small changes in pore fluidoomposition. For sediment cores with slow advection rates(<1 cm/y), these changes can beexplained by small amounts of fluid-solid reaction and molecular diffusion. In contrast, cores withmoderate advection rates (approximately lOcm/y) have as much as 10 times the ionic content oflake water.
Finally, chemical comparisons among caldera wall debris, sediment trap particles, and sedimentsrecovered by coring reveal similar compositions (Figure 70). Thus, the weathering and low-temperature alteration processes, which transform caldera volcanic material into setthng particlesand finally into buried sediments, does not produce major changes in the chemical composition ofthe material. Mass balance estimates based on this observation indicate that the low temperaturerelease of ions into the lake is minor relative to the fluxes of ions carried by pore water advection.
Consequently, mass balance studies and pore water data indicate that alteration of sedimentaryvolcanic debris cannot account for the elevated concentrations of salts in Crater Lake.
(4 Volatile Transport Hypothesis.
Because volcanic gases are enriched in 3He, it might be possible that volatile transport of heliuminto the deep lake, independent of advecting thermal waters, could account for the observed 3He
181
anomalies (La Fleur, 1990). For example, magmatic degassing has been suggested for the CO2buildup of Lake Monoun and Lake Nyos in Cameroon which led to a lethal gas burst (Sigurdsson,1987). At these lakes, the SO4 and Cl levels are very low, suggesting that there is little fumarolicor hydrothermal input. The 3He/4He values in these lakes, however, are similar to mantle values(Sano et al., 1987; 1990). If volcanic emanations carry HC1, this process could also account forthe high concentration of chloride that is observed in Crater Lake (La Fleur, 1987) relative toprecipitation-dominated lakes in the Cascades. An input of volatile CO2 to the lake could accountfor the "dead" carbon inputs that are necessary to account for the gradients in 14C observed bySimpson (1970a) in the deep lake.
Evidence against the volatile injection hypothesis comes from evaluation of the lake's pH andalkalinity budget. Thompson et al. (1990) argue that because Crater Lake is a near neutral lake(pH 7.5), acidic gases such as HC1 and H2S are not the source of chloride and sulfate in the lake.They suggest that Na and Cl are entering the lake together in aqueous solution. Becauseprecipitation and runoff can account for only a small fraction of the chloride in the lake, anyinjection of gaseous HC1 to balance the chloride deficit (Simpson, 1970a; Nathenson, 1990aReilly et al., 1989) must produce a major impact on the observed pH and the alkalinity of the lake.If volatile CO2 were injected to the lake, it would also result in a lower pH and would not directlyaccount for Crater Lake's bicarbonate content, which is high relative to the precipitation-dominatedlakes in the Cascades. The alkalinity deficit, which is needed to supplement inputs fromprecipitation and caldera spring sources (Reilly et al., 1989), requires sources of bicarbonate ion,not dissolved CO2.
The volatile input hypothesis also does not account for the correlation between the heliumconcentrations and the thermal-chemical anomalies that are observed in the deep lake. In order toaccount for the observed correlation between these features, the volatile inputs must be interwovenwith thermal sources (perhaps conductive heating from the lake floor) and chemical sources(perhaps cold springs) in such a way that the volcanic degassing would impact only those sites inthe lake that receive cold spring input and experience high conductive heating. The fact that the3He-to-heat ratio measured in the bottom of Crater Lake is very similar to values measured inhydrothermal systems at oceanic hot springs (Lupton et al., 1989) suggests that only byremarkable coincidence could the heat and helium correlation be due to a combination of conductiveheating and volatile degassing.
Finally, the observation that cold springs have atmospheric rather than mantle helium and carbonisotopic compositions, indicates that volatile inputs of helium are an ubiquitous feature of coldspring sources.
In summary, non-condensible gas inputs cannot account for the necessary sources of Cl, SO4, orCO2 needed to balance the elemental budgets of Crater Lake waters. The volatile transport
hypothesis also fails to explain the consistent relationship among helium enrichments, bottomwater temperatures, and salt contents in Crater Lake water. These same interrelationships whichare observed in highly enriched saline pools and in bacterial mats. This can only be explained byadvection of thermally and chemically enriched fluids.
182
The Conductive Heat Hypothesis.
Conductive heating may be able to explain the gradual increase in temperature in the deep lake, but,an expansion of the hypothesis is required to explain the variability in the horizontal and verticalthermal gradients found at the lake bottom. Conductive heat transport into the lake should producemonotonic decreases in temperature with increasing height above the bottom. This is observed insome cases; however, a number of profiles in the Detailed Study Area have complex patterns, withwarmer water overlying colder water (Collier and Dymond, 1988a). Moreover, conductive inputof heat alone cannot explain the horizontal gradients in bottom water temperature except by evenstronger gradients in the conductive heat flux. Variability in conductive heat flow is present inCrater Lake, but this variability has been interpreted to be a consequence of variable proximity to aconvective heat source (Williams and Von Herzen, 1983).
The measurements of temperature gradients made with the submersible document the existence ofconvective heat transport (Figures 41,42,and 43). Non-linear thermal gradients imply advectiveflow in the range of 10 to 100 meters per year. The convective heat fluxes are heterogeneous andprobably reflect localized pathways for fluid input.
In summary, because Crater Lake sits within a volcanic center, conductive heat transport into thebottom water must be occurring. However, this mechanism by itself cannot explain the mostsignificant patterns of heat distribution within the lake. Documented convective sources are locatedwithin the areas of generalized thermal anomalies in bottom waters. The presence of convectivesources can explain the bottom water temperature anomalies and the highly variable conductive heatflow found by Williams and Von Herzen (1983).
The Cold Spring Hypothesis.
Input of cold spring water has been proposed to explain the increase in ionic content seen near thebottom of Crater Lake (La Fleur, 1990). Cold saline springs entering the deep lake would bedenser than ambient lake water and could form a near-bottom layer. La Fleur (1990) developedthis hypothesis to explain the association of unique thermal-chemical features with Chaski Slide onthe south side of the lake. La Fleur (1990) suggests that ground waters flow through Chaski Slideand into the lake because of hydraulic forces. His model calls upon dissolution of iron and sulfatewithin Chaski Slide rocks to explain the observed enrichments of these species in bacterial matfluids sampled in 1988. La Fleur (1990) also suggests that the temperature of ground waterswithin the area is typically about 10°C and that these ground waters could explain the maximumtemperatures noted in the 1988 study.
Because some low-temperature processes can mobilize metals, the metal-rich deposits andsediments observed in the Detailed Study Area and recovered in cores (Dymond and Collier, 1990)do not in themselves prove that there are thermal spring inputs to the lake. Consequently,precipitation of metals from cold springs is possible, especially if a change in pH or oxygencontent accompanies the mixing of spring and lake water. La Fleur (1990) suggested that coldsprings might also provide iron for the observed bacterial mats. Although the particular bacterialgenera described from samples of the Crater Lake mats have been observed in geothermal waters,they are not obligate thermophyllic bacteria. All that is required for their growth (particularly thegenus Gallionella) is a continuous source of reduced iron and a redox boundary. Anoxic coldsprings might provide such a source.
183
Although La Fleur (1990) makes a reasonable case for cold springs as an explanation of thethermal-chemical enrichments observed in the 1985-88 studies, certain observations made in the1989 field program rule out this mechanism. The 1989 program discovered bacterial mats that hadtemperatures of approximately 19°C. These temperatures are not within typical ground watervalues as suggested by La Fleur (1990). In fact, data for Mazama cold spring temperatures(Nathenson, 1990b) directly contradict La Fleur's (1990) contention of 10°C ground watertemperatures. Nathenson (1990b) has shown that cold springs at the elevation of the surface ofCrater lake have temperatures which are very similar to the cold deep lake waters (4°C) and thatthese spring temperatures appear to be related to the mean annual air temperatures. Ourmeasurements of fluid temperatures on the bottom of Crater Lake, which are more than 15°C aboveambient water temperatures, clearly lie outside known values for cold water springs in the region.
In addition, the most saline fluids recovered in 1989 from pools and advecting sediment porewaters are 6 to 10 times enriched in major elements and 500 times enriched in certain minorspecies. The larger thermal-chemical anomalies measured in 1989 make the cold springshypothesis less tenable. For cold springs to supply Crater Lake's ionic concentrations and the"missing" source of elements needed for mass balance considerations (Nathenson, 199th; Reffly etal., 1989), the springs must either be very saline or of high volume. Springs from the ChaskiSlide area, which are relatively close to the Detailed Study Area, have Mg, Ca, and SO4concentrations that are sufficiently enriched (Nathenson and Thompson, 1990) to account for theobserved anomalies in the most chemically-altered water sample collected at the bacterial mat in1988. Even for these elements, however, springs of a Chaski Slide composition would have to bea major source of water to the lake in order to account for the abundance of Mg, Ca, and SO4observed in the lake. Chaski Slide springs, however, are far more dilute than the pools andenriched porewaters sampled in 1989. The alternative of voluminous cold spring input wouldrequire major modification to the water budget of the lake which would contradict the fmdings ofnumerous researchers (Van Denburgh, 1968; Simpson, 1970b; Redmond, 1990; Nathenson,1990a).
Significantly, Chaski Slide spring samples are no more enriched in Na, K, Li, and Cl than otherMazama springs. Thus, these springs could not account for these elemental enrichments in poolsand mat samples or their abundance in the lake in general. In other words, neither the Chaski Slidesprings nor any of the low-temperature Mazama springs have the appropriate composition toaccount for the anomalous fluids sampled in 1988 and 1989 nor to sustain the overall compositionof Crater Lake.
Theoretically, cold anoxic springs might deposit metals in the form of bacterial mats and theirpossible fossil equivalents, the iron-rich crusts. However, we know these features are directlyassociated with fluids having the highest temperatures recorded in the deep lake. As we havedemonstrated (Dymond and Collier, 1989), these temperatures cannot be maintained by metaboliciron oxidation in the associated bacterial communities. The strong enrichment of arsenic andantimony observed in the mats and crusts is additional evidence that these features are precipitatingfrom fluids that have a high-temperature origin. Furthermore, the presence of silica-rich depositsin the lake (siliceous spires) is strong evidence of past hydrothermal inputs, although the age ofthese deposits has not been documented.
184
In addition, the cold spring hypothesis is inconsistent with '4C measurements of pool waters,advecting pore fluids (Benthic Barrel), and deep lake waters. These data document the influx of afluid which carries essentially no 1C. In contrast, aquifer sources would be expected to havecarbon with a modern 14C signature. Measurements from caldera springs confirm a recentatmospheric equilibration of aquifers which feed Mount Mazama springs and indicate that thesesources could not account for the dead carbon observed in the deep lake.
Finally, our hydrogen isotopic data in themselves eliminate the cold spring hypothesis. Thehydrogen isotopic similarity between deep lake waters and the pool and mat fluids are unequivocalevidence that these anomalous fluids originated from within the lake and not from the meteoricwaters found in local aquifers.
In summaiy, the cold spring hypothesis fails to account for either the elevated temperatures or thechemical and isotopic compositions of fluids observed in the deep lake. These thermally andchemically enriched fluids are the source of reduced chemical species used by bacterialcommunities and the metals which form other deposits present in the deep lake.
(7 The Hydrothermal Hypothesis.
As we have seen, none of the previous six hypotheses can account for all of the observed thermaland chemical anomalies found in Crater Lake. While each can explain a few of the features, eachof the six has serious flaws. The major appeal of the hydrothermal hypothesis is that it can accountfor many and probably all of the unusual thermal and chemical features of Crater Lake.
The high ionic content of the lake compared to other precipitation-dominated Cascade lakes can beaccounted for by input from thermal springs which are known to carry elevated concentrations ofmany elements relative to precipitation sources or cold-spring sources (Mariner et al. 1982). Theconcentrations of several elements in Crater Lake are high compared to those in most other Cascadelakes. East Lake, which has concentrations that are even higher.than Crater Lake, is an exception.However, East Lake is known to have hot spring inputs. These comparisons suggest that thermalsprings can dominate the ion content of lakes. Similar conclusions have come from studies oflakes found in the volcanically active region of the North Island of New Zealand (Timperly andVigor-Brown, 1986; Hoare, 1985: McColl, 1975 ; Forsyth, 1977).
Hydrothermal sources can explain the elevated concentrations of elements in Crater Lake, and canalso account for the first-order features of the lake's inter-element relationships. As shown inFigures 22 and 23, a mixture of waters from precipitation and the anomalous fluids sampled inpools, bacterial mats, and sediment pore waters can account in a general way for the major elementrelationships in the lake.
The enrichments of certain minor elements in Crater Lake fluids also are evidence for ahydrothermal source. Thompson et al. (1990) have reported that boron is enriched by a factor oftwo and that lithium is enriched by a factor of ten in Crater Lake compared to the average watersfrom Mazama cold springs. Both elements are typically enriched in geothermal waters (White etal., 1976; Ellis and Mahon, 1977). Moreover, Cl/Li values in Crater Lake lie within the range ofthose observed for typical thermal waters, but outside the values measured in Mazama cold springs(Thompson et al., 1990). Thompson et al.(1990) suggest that both the chloride and lithiumconcentrations in the lake are controlled by hydrothermal input.
185
Our results show that lithium is correlated with temperature in near-bottom samples from the SouthBasin (Coffier and Dymond, 1988a), and the data from submersible sampiing show that theseenrichments in pooi and pore fluids are nearly 10 times greater than the bulk lake composition(Table 9). Lithium enrichments are particularly relevant because low-temperature weathering ofrocks does not extract Li efficiently (Thompson, 1973), whereas high temperature, hydrothermalalteration can remove much of the Li from rocks, thereby strongly enriching the hydrothermal fluid(Von Damm et al., 1985). This temperature influence is illustrated by the relatively lowconcentrations of Li in all inter-caldera springs (J. McManus, unpublished data) and in Mazamasprings in general (Thompson et aL, 1990).
Two other highly successful tracers of hydrothermal activity in the oceans, manganese andradon-222, cannot be unequivocally linked to this source in Crater Lake because other processesmight also cause enrichments. However, enrichments of these species are a necessary, but notsufficient, evidence for hydrothermal inputs. Thus, the hydrothermal hypothesis can account forthe localized, strong enrichments of these tracers observed in the Detailed Study Area.
3He is a primordial isotope which is a distinctive tracer of mantle origin; our measurements ofelevated concentrations of 3He are rigorous evidence for the injection of magmatic volatiles into thedeep lake. The observation that this isotopic tracer positively correlates with temperature and withmajor element content in the deep lake waters is consistent with helium injection by a hydrothermalfluid. Further support for a hydrothermal input to the lake is provided by a ratio of 3He to heatwhich is very similar to that observed in known deep-ocean hydrothermal vents (Lupton et al.,1989). Although the 1989 sampling program extended the known enrichments of 3He in CraterLake to 500 times the atmospheric equilibration value, these highly enriched samples have the samecorrelation with major element composition as found in deep lake water.
Thermal spring inputs can also account for the surprisingly low abundances of 14C in the near-bottom waters of the lake and the predominantly "dead" carbon observed in pool samples.Magmatic carbon, released as CO2 to circulating hydrothermal fluids, could be a source of deadcarbon. Reaction of the hydrothermal fluids with wall rock will result in leaching of cations,neutralization of the acidity of the fluids, and an increase in carbonate alkalinity. Consequently,hydrothermal fluids generally have high bicarbonate ion content (Mariner et al., 1982).Bicarbonate is the major anion in Crater Lake waters and is in greater concentration than can beaccounted for by low-temperature weathering reactions (Nathenson, 1990a). Pool and pore watersamples collected in 1989 from the deep lake have >.0O2 values that are more than 10 times greaterthan the ambient deep lake values. Consequently, these values are a source for the "missing"alkalinity identified by mass balance studies (Nathenson, 1990a; Reilly et al., 1989).
The presence of bacterial mats and the measurements of elevated temperatures and chemicalanomalies associated with these communities are perhaps the most direct evidence of hydrothermalfluid venting into the lake. Temperatures within the mats are 15°C above background lake valuesand are compatible with a diffuse flow of hydrothermal fluids. Hydrothermal advection ofchemically enriched fluids can supply the necessary continuous source of reduced chemicals to thebacterial communities in the mats. We have deduced flow rates of 10 m/yto 100 m/y in thesebacterial mats from temperature measurements made from the submersible in 1989.
The bacterial mats have a composition similar to the metal-rich crusts and pebbles that have beenobserved at a number of locations in the Detailed Study Area. Such deposits have been observed
186

nowhere else in the lake. These deposits may be the fossilized equivalents of the mats and mayrepresent previous sites of hydrothermal fluid venting. Arsenic and antimony enrichments in theseiron oxyhydroxides imply that they were precipitated from a fluid which was enriched in theseelements. Such fluid enrichments are commonly observed in hydrothermal solutions.
Chemical geothermometers based on empirical data have been applied to our enriched pore-waterand pool samples to define the possible rock-water equilibration temperatures. These resultsindicate that the enriched fluids found at the bottom of Crater Lake could have equilibrated attemperatures ranging from 40°C to 165°C consistent with a hydrothermal hypothesis. Theseelevated equilibration temperatures suggest that the enriched, lower-temperature fluids sampled inthe deep lake are either diluted with normal lake water by a factor of 10 or that these enriched fluidshave lost most of their heat by conduction to surrounding rocks and sediments. The predominanceof isotopically clead" carbon in pool samples indicates mixing of roughly equal parts of thermalfluids and deep lake water and suggests the importance of conductive heat losses.
Hydrothermal fluids can also account for the small thermal and chemical enrichments of bottomwaters and the highly enriched pools at certain locations in Crater Lake. Calculated densities forwaters with the highest temperatures observed (19°C) indicate these fluids are buoyant with respectto lake bottom water. However, conductive heat loss from these fluids can result in the formationof fluids which are more dense than ambient waters, thereby creating chemically enriched pools.
In addition, time-series measurements of temperature and conductivity document the continuedaccumulation of heat and salt in the deep lake. These measurements are used to compute a totalheat input to the lake ranging between 20 and 30 megawatts and the total flux of chemically-enriched fluids of approximately 300 liters per second. These estimates, based on directmeasurements, compare favorably with model-based estimates of heat and salt fluxes which predicta heat flux of 15 to 29 megawatts and a hydrothermal fluid input of 200 to 400 liters per second.Consequently, diverse approaches, which use very different data and assumptions, all indicate asimilar flux of heat and salt into the deep-waters of Crater Lake. This flux is compatible with acommon carrier - hydrothermal fluids.
Summary of Hypothesis Testing.
We summarize the seven hypotheses and their tests in an abbreviated form in Table 19. Despite thecollection of a broad range of chemical and physical data, we have not been able to disprove thehydrothermal hypothesis. This hypothesis is completely compatible with the isotopicmeasurements, the major element compositions, the mass balance constraints, the minor elementdata, the temperature observations, the fluid advection rates, and the biological communities inCrater Lake. Consequently, the evidence strongly supports the concept of hydrothermal activity asan important Crater Lake process.
187
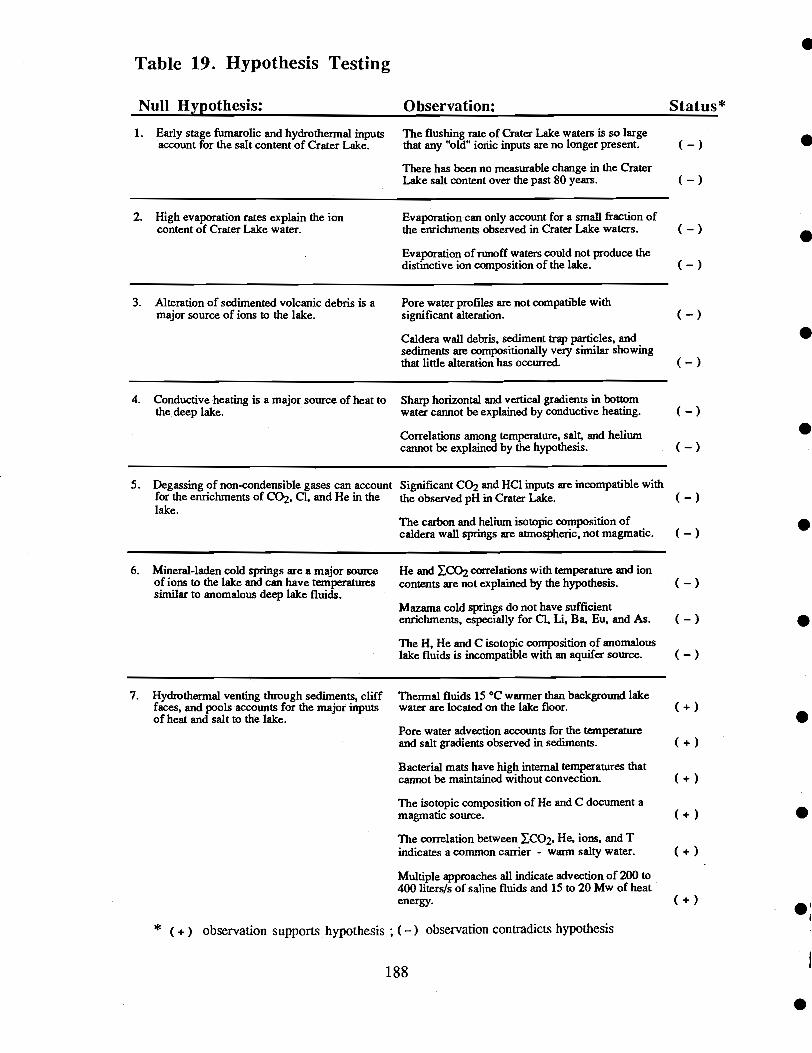
Table 19. Hypothesis Testing
Null Hypothesis: Observation: Status *
Early stage fumarolic and hydrothermal inputs The flushing rate of Crater Lake waters is so largeaccount for the salt content of Crater Lake. that any "old" ionic inputs are no longer present. ()
There has been no measurable change in the CraterLake salt content over the past 80 years. ()
High evaporation rates explain the ion Evaporation can only account for a small fraction ofcontent of Crater Lake water, the enrichments observed in Crater Lake waters. ()
Evaporation of runoff waters could not produce thedistinctive ion composition of the lake. ()
Alteration of sedimented volcanic debris is a Pore water profiles are not compatible withmajor source of ions to the lake. significant alteration. ()
Caldera wall debris, sediment trap particles, andsediments are compositionally very similar showingthat little alteration has occurred. ()
Conductive heating is a major source of heat to Sharp horizontal and vertical gradients in bottomthe deep lake. water cannot be explained by conductive heating. ()
Correlations among temperature, salt, and heliumcannot be explained by the hypothesis. ()
Degassing of non-condensible gases can account Significant CO2 and HC1 inputs are incompatible withfor the enrichments of CO2, Cl, and He in the the observed pH in Crater Lake. ()lake.
The carbon and helium isotopic composition ofcaldera wall springs are atmospheric, not magmatic. ()
Mineral-laden cold springs are a major source He and CO2 correlations with temperature and ionof ions to the lake and can have temperatures contents are not explained by the hypothesis. ()similar to anomalous deep lake fluids.
Mazama cold springs do not have sufficientenrichments, especially for Cl, Li, Ba, Eu, and As. ()The H, He and C isotopic composition of anomalouslake fluids is incompatible with an aquifer source. ()
Hydrothennal venting through sediments, cliff Thermal fluids 15°C warmer than background lakefaces, and pools accounts for the major inputs water are located on the lake floor. (+)of heat and salt to the lake.
Pore water advection accounts for the temperatureand salt gradients observed in sediments. (+)Bacterial mats have high internal temperatures thatcannot be maintained without convection. (+)The isotopic composition of He and C document amagmatic source. (+)
The correlation between CO2, He, ions, and Tindicates a common carrier - warm salty water. (+)Multiple approaches all indicate advection of 200 to400 liters/s of saline fluids and 15 to 20 Mw of heatenergy. (+)
* (+) observation supports hypothesis ; () observation contmdicts hypothesis
188
V. Summary and Conclusions
Significant observations
Submersible observations within the South Basin have defmed fine-scale variations in thetemperature and salt content of the near-bottom waters. Temperature variations of up to 0.5°C andconductivity variations of more than 10 percent occur over distances of a few meters. Themagnitude and spatial scale of these variations require a continuing input of warmer and moresaline water to maintain the high gradients.
Deep-lake communities of bacteria, which produce impressive mat features on rock outcrops andsediment surfaces, mark the site of diffuse venting on the lake floor. Some of these features coverareas tens of meters across and have internal temperatures elevated over background water by morethan 15°C. These communities apparently use the abundant reduced iron which occurs in theadvecting fluids to fuel their metabolism. Although there were no visual indications of flow fromthe mats, advection is implied by the requirements of the prolific bacterial communities forcontinuous inputs of reduced chemical species. Furthermore, a flow of warm fluids is required tomaintain the temperature gradients observed within the mats. Advection as high as 100 m/y areindicated. Consequently, the bacterial mats are aptly described as visual markers of thermally andchemically enriched fluid venting.
Pools of saline water with major element contents that are approximately ten times greater thanbackground lake values have been discovered in two widely separated areas of the lake. Sedimentpore waters are another source of enriched fluids in the lake system. Various lines of evidenceshow that the pore water enrichments in salt cannot be the result of sediment reaction with normallake water. Significantly, the pore water measurements reveal non-linear gradients of the enrichedpore fluids. Consequently, the concentration profiles in the core require vertical fluid advectionrates of up to 2 m/y.
Although comparisons among the pool, mat, and pore water compositions reveal some differences,similarities in the overall elemental contents suggest that the fluids advecting through the sedimentsand supplying the pools and mats have a similar source. Chemical geothermometry suggest thefluids equilibrated with silicate rocks at temperatures ranging from 40°C to 165°C.
Sampling of mat fluids, pools, and pore waters has greatly extended the range of anomalous watercompositions which are found within Crater Lake. For example, the anomalies with respect tobackground lake levels for major elements are approximately a factor of ten. Manganese and222Rii, which are important tracers of hydrothermal sources in the ocean have some of thestrongest enrichments. Manganese in the end-member fluids is a million times more enriched thanobserved in normal lake water. 222P is 100,000 times enriched over typical lake values. Helium-3, perhaps the most distinctive indicator of a magmatic source, is enriched 500 times over valuesfor water that is in equilibrium with the atmosphere. Rare earth element concentrations in sedimentpore water, pool fluid, and lake samples have a distinctive pattern. The abundance of europium ismarkedly enriched over the other rare earth elements, which is a pattern commonly observedobserved in hydrothermal fluids.
Isotopic measurements of pool samples places important constraints on the origin and evolution ofthese anomalous fluids. The hydrogen isotopic composition indicates that the pool fluid wasoriginally lake water. This observation is unequivocal evidence that meteoric fluids carried inregional cold springs could not be the source of the pool waters. In addition, the deep lakecontains surprising amounts of "dead" carbon (i.e., carbon with no radioactive 14c). Carbon-14measurements of a pool sample reveal that the carbon in these fluids is almost entirely "dead";Pore waters also contain abundant "dead" carbon. Magmatic carbon, which is carried by fluids
189
that have interacted with rocks at elevated temperatures, is the best hypothesis for the source of thiscarbon. Mass balance calculations based on both total carbon and 14C isotopic systematics,suggest the pool fluids are a mixture of approximately equal parts of a primary hydrothermal fluidand normal lake waters. Further mixing of pool and pore fluids in addition to conductive heattransfer can account for the range of heat-to-salt ratios observed in the deep lake.
These data have permitted us to recalculate the geochemical mass balances for the lake whichinclude realistic estimates of composition of a hydrothermal input. A variety of models result insimilar estimates of the hydrothermal flows into the lake. For example, a helium flux modelpredicts a heat flow of 29 megawatts (MW) with a temperature of 18°C for the fluid as it enters thelake. This can be compared with the maximum measured bacterial mat temperature of 18.9°C. Thecation budget predicts a heat flow of 15 MW. Similarly, we calculate that the flow rate of thisthermally and chemically enriched fluid is approximately 200-400 liters/sec. This estimate isderived from the helium budget (400 liters/see), the ion mass balance budgets (265 ± 115liters/see).
Significantly, these model-based estimates are entirely consistent with direct observations of heatand salt accumulations in the deep lake. Time series observations of annual temperature changes inthe deep lake predict a heat flow of 20 to 30 MW. In addition, an observed accumulation rate ofsalt in the bottom of the lake requires 200 to 400 liters/sec of chemically-enriched fluid input(Appendix A).
Conclusions
As a result of the past three years of field studies and our interpretation of these and other data fromthe literature, we conclude that there inputs of hydrothermal fluids into the bottom of CraterLake. The dissolved materials associated with these thermally and chemically enriched fluids,coupled with the overall hydrologic balance, control the observed chemical composition of theLake. While other geochemical processes are certainly operative, these geothermal inputs aresignificant in that they dominate the material fluxes for most chemicals into Crater Lake.Furthermore, the geothermal inputs have a direct effect on the density structure of the deep lakeand the character of vertical mixing. The vertical mixing rate determines the rate of redistributionof heat, salt, and nutrients.
Many young caldera lake systems have been studied during their early post eruption phases(McColl, 1975; Sigurdsson, 1977; Timperley and Vigor-Brown, 1986). Crater Lake represents alate-stage in the evolution of these lakes. It has recently become clear that other lakes from a rangeof tectonic settings experience hydrothermal activity including Yellowstone Lake (Klump et al.,1988) and Lake Baikal (Golubev, 1978, 1984 and personal communication). Taken together,these studies and our results from Crater Lake demonstrate a broad range of hydrothermalexpressions in diverse limnological systems.
190
VI. References
Asikainen, M. 1981. State of disequilibrium between 28U, U, 226Ra, and 222Rn ingroundwater from bedrock. Geochim. Cosmochim. Acta 45:20 1-206.
Bacon, C. R. 1983. Eruptive history of Mount Mazama and Crater Lake Caldera, CascadeRange, U.S.A. J. Volcan. Geotherm. Res. 18:57-115.
Bacon, C. R., and T. H. Druitt. 1988. Compositional evolution of the zoned caic-alkaline magmachamber of Mount Mazama, Crater Lake, Oregon. Contrib. Mineral. Petrol. 98:224-256.
Bacon, C. R., and M. A. Lanphere. 1990. The geologic setting of Crater Lake, p. 19-28. In E.T. Drake, G. L. Larson, J. Dymond, and R. Coffier [eds.], Crater Lake: An EcosystemStudy. American Association for the Advancement of Science, Pacific Division.
Bacon, C. R., L. H. Adami, and M. A. Lanphere. 1989. Direct evidence for the origin of low-180 silicic magmas: quenched samples of a magma chamber's partially-fused granitoid walls,Crater Lake, Oregon. Earth Planet. Sci. Letts. 96:199-208.
Barber, J. H., Jr., and C.H. Nelson. 1990. Sedimentary history of Crater Lake Caldera,Oregon., p. 29-40. In E. T. Drake, G. L. Larson, J. Dymond, and R. Collier [eds.], CraterLake: An Ecosystem Study. American Association for the Advancement of Science, PacificDivision.
Bender, M., W. Martin, J. Hess, F. Sayles, L. Ball, and C. Lambert. 1987. A whole coresqueezer for interfacial pore water sampling. Limnol. Oceanogr. 32:1214-1225.
Bender, M. L. 1983. Pore water chemistry of the Mounds Hydrothermal Field, GalapagosSpreading Center: Results from Glomar Challenger piston coring. J. Geophys. Res.88:1049-1056.
Benson, B. B., and D. Krause Jr. 1980. The concentration and isotopic fractionation of gasesdissolved in freshwater in equilibrium with the atmosphere. 1. Oxygen. Limnol. Oceanogr.25:662-671.
Berger, R., T.B. Jackson, R. Michael, and H.E. Suess. 1987. Radiocarbon content oftropospheric CO2 at China Lake, California 1977-1983. Radiocarbon 29:18-23.
Berger, R. and W.F. Libby. 1966. UCLA radiocarbon dates V. Radiocarbon 9:477-504.Blackwell, D.D., R.G. Bowen, D.A. Hull, J. Riccio, and J.L. Steele. 1982. Heat flow,
volcanism and subduction in northern Oregon. J. Geophys. Res. 87:8735-8754.Blackwell, D.D., J.L. Steele, S. Kelley, and M.A. Korosec. 1990. Heat flow in the state of
Washington and thermal conditions in the Cascade Range.J. Geophys. Res. 95:19495-19516.
Blackwell, D. D., J. L. Steele, M. K. Frohme, C. F. Murphey, G. R. Priest, and G. L. Black.1990. Heat flow in the Oregon Cascade Range and its Correlation with Regional Gravity,Curie Point Depths, and Geology. J. Geophys. Res. 95: 19475-19493.
Bostrom, K., and L. Widenfalk. 1984. The origin of iron-rich muds at the Kameni Islands,Santorini, Greece. Chem. Geol. 42:203-2 18.
Bredehoeft, J. D., and I. S. Papadopulos. 1965. Rates of vertical groundwater movementestimated from the earth's thermal profile. Water Resources Res. 1:325-328.
Broecker, W. S., J. Cromwell, and Y. H. Li. 1968. Rates of vertical eddy diffusion near theocean floor based on measurements of the distribution of excess Rn-222. Earth Planet. Sci.Lett. 5:101.
Bruland, K. W. 1983. Trace elements in seawater, p. 157-220. In J. P. Riley and G. Skirrow[eds.], Chemical Oceanography, 2nd edition, V. 8. Academic Press.
191
Bruland, K. W., R. P. Franks, G. A. Knauer, and J. H. Martin. 1979. Sampling and analyticalmethods for the determination of copper, cadmium, zinc, and nickel at the nanogram per literlevel in sea water. Analyt. Chim. Acta 105:233-245.
Bullister, J. L., and R. F. Weiss. 1983. Anthropogenic chlorofluoromethanes in the Greenlandand Norwegian Seas. Science 221:265-221.
Buffister, J. L., and R. F. Weiss. 1988. Determinations of CC13F and CC12F2 in seawater andair. Deep-Sea Res 35:839-853.
Byrne, J. V. 1962. Bathymetry of Crater Lake, Oregon. The Ore Bin 24:161-164.Byrne, J. V. 1965. Morphometry of Crater Lake, Oregon. Limnol. Oceanogr. 10(3):462-465.Campbell, A. C., M. R. Palmer, G. P. Klinkhammer, T. S. Bowers, J. M. Edmond, J. R.
Lawrence, J. F. Casey, G. Thompson, S. Humphris, P. Rona, and J.A Karson. 1988.Chemistry of hot springs on the Mid-Atlantic Ridge. Nature, 335:514-5 19.
Carniack, E.C., and D.M. Farmer. 1982. Cooling processes in deep, temperate lakes: A reviewwith examples from two lakes in British Columbia. J. Mar. Res. 40:85-111.
Carmack, E.C., R.F. Weiss, and V.M. Koropalov. 1989. Physical studies of mixing processesin Lake Baikal [absir.]. EOS 70:1136.
Carothers, W. W., R. H. Mariner, and T. E. C. Keith. 1987. Isotope geochemistry of mineralsand fluids from Newberry Volcano, Oregon. J. Volcan. Geotherm. Res. 31:47-63.
Carpenter, I. H. 1965a. The Chesapeake Bay Institute technique for the Winkler dissolvedoxygen method. Limnol. Oceanogr. 10:141-143.
Carpenter, S. H. 1965b. The accuracy of the Winider method for dissolved oxygen analysis.Limnol. Oceanogr. 10:135-140.
Chen, C. T., and F. S. Millero. 1986. Precise thermodynamic properties for natural waterscovering only the limnological range. Limnol. Oceanogr. 3(3):657-662.
Clark, E.E. 1953. Indian Legends of the Pacific Northwest. University of California Press.225 p. quoting Applegate, O.C. January 1907, The Kiamath Legend of La-o, Steel Points1:75-76.
Cole, D.R., M.J. Mottl, and H. Ohmoto. 1987. Isotopic exchange in mineral-fluid systems. II.Oxygen and hydrogen isotopic investigation of the experimental basalt-seawater system.Geochim. Cosmochim Acta 51:1523-1538.
Collier, R., and J. Dymond. 1988a. Studies of hydrothermal processes in Crater Lake. Apreliminary report of field studies conducted in 1987 for the Crater Lake National Park.Oregon State University, College of Oceanography Reference #88-5,49 pp.
Collier, R., and J. Dymond. 1988b. Observations of bacterial mats associated with thermalsprings at 450 meters depth in Crater Lake, OR [abstr.]. EOS 69:1138.
Collier, R., and J. Dymond. 1989. Studies of hydrothermal processes in Crater Lake. A reportof field studies conducted in 1988 for the National Park Service. Oregon State University,College of Oceanography Reference #89-2,79 pp.
Collier, R., J. Dymond, S. Lupton, A. Chen, M. Lilley, and M. Thompson. 1987. Effects ofhydrothermal inputs on the chemistry and physics of Crater Lake, OR [abstr.]. EOS68: 1721.
Collier, R. W. 1985. Molybdenum in the northeast Pacific Ocean. Limnol. Oceanogr. 30:1351 -1354.
Collier, R. W., S. Dymond, J. McManus, and J. Lupton. 1990. Chemical and physical propertiesof the water column at Crater Lake, OR., p. 69-80. In E. T. Drake, G. L. Larson, J.Dymond, and R. Collier [eds.], Crater Lake: An Ecosystem Study. American Associationfor the Advancement of Science, Pacific Division.
Conway, B. E. 1952. Electrochemical Data. Butterworths.
192
Corliss, J. B., M. Lyle, J. Dymond, and K. Crane. 1978. The chemistry of hydrothermalmounds near the Galapagos Rift. Earth Planet. Sci. Lett. 40:12-24.
Cox, R. A., F. Culldn, and J. P. Riley. 1967. The electrical conductivity/chiorinity relationshipin natural seawater. Deep-Sea Res. 14:203-220.
Craig, H. 1966. Isotopic composition and origin of the Red Sea and Salton Sea geothermalbrines. Science 154:1544-1548.
Deny, L.A., and S.B. Jacobsen. 1990. The chemical evolution of Precambrian seawater:Evidence form REEs in banded iron formations. Geochim. Cosmochim. Acta 54:2965-2977.
Diller, J. S. 1902. The geology and petrography of Crater Lake National Park. U.S. GeologicalSurvey Prof. Paper No. 3, Part I, 62 pp.
Dymond, J., J.B. Corliss, G.R.Heath, C.W. Field, E.J. Dasch, H.H. Veeh. 1973. Origin ofmetalhiferous sediments from the Pacific Ocean. GSA Bull. 84:3355-3372.
Dymond, J. 1981. Geochemistry of Nazca Plate surface sediments: An evaluation ofhydrothermal, biogenic, detrital, and hydrogenous sources, p. 133-173. In L.D. Kulm, J.Dymond, E.J. Dasch, D.M. Hussong, and R. Roderick [eds.], The Nazca Plate. Geol. Soc.Amer. Memoir 154.
Dymond, J., E. Baker, and J. Lupton. 1988. Plumes: The oceanic limb of seafloor hydrothermalsystems. Proceedings of the Salishan Meeting, The National Academy of Sciences.
Dymond, J., R. Cobler, L. Gordon, P. Biscaye, and G. Mathieu. 1983. 226Ra and 222Racontents of Galapagos Rift hydrothermal waters - the importance of low-temperatureinteractions with crustal rocks. Earth Planet. Sci. Lett. 64:417-429.
Dymond, J., and R. Coffier. 1990. The chemistry of Crater Lake sediments: Definition ofsources and implications for hydrothermal activity, p. 41-60. In E. T. Drake, G. L. Larson,J. Dymond, and R. Collier [eds.], Crater Lake: An Ecosystem Study. American Associationfor the Advancement of Science, Pacific Division,.
Dymond, J., R. W. Collier, and M. E. Watwood. 1989. Bacterial mats from Crater Lake,Oregon, and their relationship to possible deep-lake hydrothermal venting. Nature 342:673-675.
Dymond, J., J. B. Corliss, R. Cobler, C. M. Muratli, C. Chou, and R. Conard. 1980.Composition and origin of sediments recovered by deep drilling of sediment mounds,Galapagos Spreading Center, p. 377-385. In B.R. Rosendahl, R. Hekinian, et.al. [eds.],Initial Reports of the Deep Sea Drilling Project, Vol. LW.
Dymond, J., M. Lyle, B. Finney, D. Z. Piper, K. Murphy, R. Conard, and N. Pisias. 1984.Fenomanganese nodules from MANOP Sites H, S, and R - Control of mineralogical andchemical composition by multiple accretionary processes. Geochim. Cosmochim.. Acta48:931-949.
Dymond, J., C. Perhats, R. Conard, and R. Collier. 1987. Hydrothermal activity in Crater Lake:Evidence from sediments [abstr.]. EOS 68: 1721.
Dyrssen, D. and L.G. Sillen. 1967. Alkalinity and total carbonate in sea water; a plea for P-T-independent data. Tellus 19:113-121.
Edmond, J.M. 1970. High precision determination of titration alkalinity and total carbon dioxidecontent of sea water by potentiometric titration. Deep-Sea Res.17:737-750.
Edmond, J. M., C. I. Measures, R. E. McDuff, L. H. Chan, R. Collier, B. Grant, L. I. Gordon,and J. B. Corliss. 1979. Ridge Crest hydrothermal activity and the balance of the major andminor elements in the ocean; the Galapagos data. Earth Planet. Sci. Lea. 46:1-18.
Ehrenberg, C. G. 1836. Vorlaufige Mitteilungen über das wirkliche Vorkommen fossilerInfusorien und ihre grosse Verbreitung. Poggendorf s Annalen 38:213-227.
Elder, J. 1981. Geothermal Systems. Academic Press. London. 5O8pp.
Elderfield, H., R. tJpstill-Goddard, and E. R. Sholkovjtz. 1990. The rare earth elements inrivers, estuaries, and coastal seas and their significance to the composition of ocean waters.Geochimica et Cosmochimica Acta 54:971-991.
Effis, A. J., and W. A. J. Mahon. 1977. Chemistry and geothermal systems. Academic Press.Emerson, S. 1976. Early diagenesis in anaerobic lake sediments: chemical equilibria in interstitial
waters. (3eochim. Cosmochim. Acta 40:925-934.EPA. 1979. Methods for Chemical Analysis of Water and Wastes. EPA-600/4-79-020.Erlich, H. L. 1981. The geomicrobiology of iron, p. 393. [eds.], Geomicrobiology. Marcel
Dekker, Inc.Farmer, D.M., and E. Carmack. 1981. Wind mixing and restratification in a lake near the
temperature of maximum density. J. of Phys. Ocean. 11:1516-1533.Feely, R.A., G.J. Massoth, E.T. Baker, J.P. Cowen, M.F. Lamb, and K.A. Krogslund. 1990.
The effect of hydrothermal processes on midwater phosphorus distributions in the northeastPacific. Earth Planet. Sci. Letts. 96:305-3 18.
Field, C. W., and R. H. Fifarek. 1985. Light stable-isotope systematics in the epithermalenvironment. In Berger, B. R., and P. M. Bethke [eds.], Reviews in Economic Geology,Volume 2p. 99-128.
Fine, R. A., M. J. Warner, and R. F. Weiss. 1988. Water mass modification at the AguihasRetroflection: chiorofluoromethane studies. Deep-Sea Res 35:311-332.
Fittermaji, D. V. 1988. Overview of the structure and geothermal potential of Newberry Volcano,Oregon. J. Geophys. Res. 93:10059-10066.
Forsyth, D. J. 1977. Limnology of Lake Rotokawa and its outlet stream. New Zealand Journalof Marine and Freshwater Research 11(3):525-.539.
Fouillac, C., and G. Michard. Sodium/Lithium ratio in water applied to geothermometry ofgeothermal reservoirs. Geothermics 10(1):55-70.
Fournier, R. 0. 1981. Application ofwater geochemistry to geothermal exploration and reservoirengineering, p. In L. Rybach and L. P. J. Muffler [eds.], Geothermal Systems: Principlesand Case Histories. J. Wiley and Sons.
Fournier, R.O.,and A.H. Truesdell. 1973. An empirical Na-K-Ca geothermometer for naturalwaters. Geochim Cosmochim. Acta 37:1255-1275.
Fournier, R. 0., and R. W. Potter II. 1979. Magnesium correction to the Na-K-Ca chemicalgeothermometer. Geochim. Cosmochim. Acta 43:1543-1550.
Froelich, P.N., G.P. Klinkhammer, M.L. Bender, N.A. Luedtki, G.R. Heath, D. Cullen, P.Dauphin, D. Hammond, and B. Hartmart. 1979. Early oxidation of organic matter inpelagic sediments of the eastern equatorial Atlantic: Suboxic diagenesis. Geochim.Cosmochim. Acta 43:1075.
Garrels, R. M., and C. L. Christ. 1965. Solutions, Minerals, and Equilibria. Harper and Row.Garrels, R. M., and F. T. MacKenzie. 1967. Origin of the chemical compositions of some
springs and lakes, p. 222-242. Equilibrium Concepts in Natural Water Systems. 15 1stMeeting of the American Chemical Society, 1966, American Chemical Society.
German, C.R., G.P. Klinkhammer, J.M. Edmond, A. Mitra, and H. Elderfield. 1990.Hydrothermal scavenging of rare-earth elements in the ocean. Nature 345:516-518.
Goldman, C.R., and A. Jassby. 1990. Spring mixing depth as a determinant of annual primaryproduction in lakes. In M.M. Tilzer, and C. Serruya [eds.], Large Lakes EcologicalStructure and Function. Springer-Verlag. 125-132.
Goldman, J. C., D. A. Caron, and M. R. Dennett. 1987. Regulation of gross growth efficiencyand ammonium regeneration in bacteria by substrate C:N ratio. Limnol. Oceanogr.32(6): 1239-1252.
194
Goldstein, S.J., and S.B. Jacobsen. 1988. Rare earth elements in river waters. Earth Planet.Sci. Lens. 89:35-47.
Golubev, V.A. 1978. Geothermal investigations on Lake Baikal using a cable probe-thermometer. Izvestiya 14(3): 235- 238.
Gran, G. 1952. Determination of the equivalence point in potentiometeric titrations. Part II.Analyst 77:661-671.
Guichard, F., R.M. Church, M. Treuil, and H. Jaifrezic. 1979. Rare earths in barites:distribution and effects on aqueous partitioning. Geochim. Cosmochim. Acta 43:983-997.
Hanert , H. H. 1981. The Genus Gallionella, p. 509-5 15. In M. P. Starr, H. Stoip, H. G.Truper, A. Balows, and H. G. Schiegel [eds.], The Prokaryotes: A Handbook on Habitats,Isolation, and Identification of Bacteria. Springer-Verlag.
Hanert, H. H. 1973. Rezente marine Eisenerze auf Santorin, Griechenland. II. Bakterogenesevon Eisenhydroxidsedimenten. Geologische Rundschau 62:786-812.. Harned, H. S., and B. B. Owen. 1958. The Physical Chemistry of Electrolyte Solutions, 3rdEdition. Reinhold.
Haskin, L.A., F.A. Frey, R.A. Schmitt, and R.H. Smith. 1966. Meteoritic, solar and terrestrialrare earth distribution, in Physics and Chemistry of the Earth, VII (L. II. Ahrens, F. Press,S.K. Runcom, and H.C. Urey, eds.), Pergamon Press, London.
Herczeg, A.L., and D.M. Imboden. 1988. Tritium hydrologic studies in four closed-basin lakesin the Great Basin, U.S.A. Limnol. Oceanogr. 33(2):157-173.
Herzig, P.M., K.P. Becker, P. Stoffers, H. Backer, and N. Blum. 1988. Hydrothermal silicachimney fields in the Galapagos Spreading Center at 86°W. Earth Planet. Sci. Letts. 89:26 1-272.
Hoare, R. A. 1985. Inferred geothermal inflows to Lake Rotorua. New Zealand Journal ofMarine and Freshwater Research 19:15 1-156.
Holbrook, S., R. Coffier, and J. Dymond. 1985. Dissolved and particulate trace metaldistributions in Crater Lake, Oregon [abstr.]. EOS 66:1326.
Honeyman, B.D., L.S. Balisirieri, and J.W. Murray. 1988. Oceanic trace metal scavenging: theimportance of particle concentration. Deep-Sea Res. 35:227-246.
Huppert, H. E. 1971. On the stability of a series of double diffusive layers. Deep-Sea Res.18:1005-1021.
Hurst, A. W., and R. R. Dibble. 1981. Bathymetry, heat output and convection in RuapehuCrater Lake, New Zealand. J. Volcanol. Geotherm. Res. 9:215-236.
Hutchinson, G. E. 1957. A Treatise on Limnology, Vol. 1. Wiley.Imboden, D.M.,R.F. Weiss, H. Craig, R.L. Michel, and C.R. Goldman. 1977. Lake Tahoe
geochemical study. 1. Lake chemistry and tritium mixing study. Limnol. Oceanogr,22:1039-1051.
Ingebritsen, S. E., D. R. Sherrod, and R. H. Mariner. 1989. Heat flow and hydrothermalcirculation in the Cascade Range, North-Central Oregon. Science 243: 1458-243.
Jahnke, R. A. 1988. A simple, reliable, and inexpensive pore-water sampler. Limnol. Oceanogr.33:483-487.
Jenkins, W.J. 1988. The use of anthropogenic iritium and helium-3 to study subtropical gyreventilation and circulation. In Charnock, H., F.R.S., J.E. Lovelock, F.R.S., P.S. Liss,and M. Whitfieki. [eds.], Tracers in the Ocean. 43-6 1.
Johnson, D. M., R. R. Petersen, D. R. Lycan, J. W. Sweet, M. E. Neuhaus, and A. L. Schaedel.1985. Atlas of Oregon Lakes. Oregon State University Press.
Juniper, S. K., and Y. Fouquet. 1988. Filamentous iron-silica deposits from modern and ancienthydrothermal sites. Canadian Minerologist 26:859-869.
195
Kadko, D.C., N.D. Rosenberg, J.E. Lupton, R.W. Collier, and M.D. Lilley. 1990. Chemicalreaction rates and entrainment within the Endeavour Ridge hydrothermal plume. Eart Planet.Sci. Letts. 99:315-335.
Kadko, D., J. E. Lupton, R. Collier, M. D. Lilley, and H. Pak. 1986. Endeavour Ridgehydrothermal plume study [abstr.]. EOS 67:1027.
Kadko, D. C. 1981. A detailed study of uranium series nudides for several sedimentary regimesof the Pacific. Ph.D. Thesis, Columbia University, 312 p.
Karl, D. M., A. Brittain, and B. Tilbrook. In press. Initial microbiological investigations ofPelee's vent, Loihi Seamount. NOAA Symposium Series for Undersea Research, 6.
Karl, D. M., G. M. McMurtiy, A. Malahoff, and M. 0. Garcia. 1988. Loihi Seamount, Hawaii:A mid-plate volcano with a distinctive hydrothermal system. Nature 335:532-535.
Keasler, K. M., and W. D. Loveland. 1982. Rare earth elemental concentrations in some PacificNorthwest rivers. Earth Planet. Sci. Letts. 61:68-72.
Kelley, D. E. 1984. Effective diffusivities within oceanic thermohaline staircases. J. Geophys.Res. 89: 10,484-10,488.
Kelley, D. E. 1988. Small-scale turbulence and mixing in the ocean, p. 48 1-502. In J. C. J.Nihouc and B. M. Jamart [eds.], Proceedings of the 19th International Liege Colloquium onOcean Hydrodynamics, Elsevier Oceanography Series.
Kelley, D. B. 1990. Fluxes through diffusive staircases: A new formulation. J. Geophys. Res.95: 3365-3371.
Kharaka, Y.K., and R.H. Mariner. 1989. Chemical geothermometers and their application toformation waters from sedimentary basins. In N.D. Naeser and T.H. McCulloh [eds.],Thermal History of Sedimentary Basins Methods and Case Histories. Springer-Verlag 99-117.
Kibby, H. V., J. R. Donaldson, and C. E. Bond. 1968. Temperature and current observations inCrater Lake, Oregon. Limnol. Oceanogr. 363-366.
Klump, J.V., R. Paddock, P.A. Anderson, C.C. Remsen, and J. MaId. 1988. Hydrothermalactivity in Yellowstone Lake, WY: Preliminary observations of a unique lacustrineenvironment. EOS 69:1109.
Krauskopf, K. B. 1957. Separation of manganese from iron in sedimentary processes.Geochim. Cosmochim Acta 12:61-84.
Krishnaswami, S., W. C. Graustein, and K. K. Turekian. 1982. Radium, thorium andradioactive lead isotopes in groundwaters: Application to the in situ determination ofadsorption-desorption rate constants and retardation factors. Water Resources Res.18:1633-1675.
Krishnaswami, S., and K. K. Turekian. 1982. 238U, 226p, and 210Pb in some vent waters ofthe Galapagos spreading center. Geophys. Res. Lett. 9:827-830.
La Fleur, J. G. 1987. Legend of the Crater Lake hot springs: A product of model mania.Geothermal Resources Council, Transactions 11:267-279.
La Fleur, J. G. 1990. An alternative hypothesis to explain temperature anomaly and other dataobserved at Crater Lake, Oregon., p. 61-68. In E. T. Drake, 0. L. Larson, J. Dymond, andR. Collier [eds.], Crater Lake: An Ecosystem Study. American Association for theAdvancement of Science, Pacific Division.
Larson, G. L. 1986. Crater Lake Limnological Program. 1985 Annual Report, National ParkService Cooperative Studies Unit. Oregon State University.
Larson, G. L. 1987. A review of the Crater Lake limnological programs, p. 58-69. In T. P.Boyle [eds.], New Approaches to Monitoring Aquatic Ecosystems. ASTM.
Larson, G. L. 1988. Crater Lake Limnological Studies. 1987 Annual Report, National ParkService Cooperative Studies Unit. Oregon State University.
196
Larson, G. L. 1989. Geographical distribution, morphology and water quality of caldera lakes:A review. Hydrobiologia 171:23-32.
Larson, G. L. 1990. Status of the ten-year limnological study of Crater Lake, Crater LakeNational Park, p. 7-18. In E. T. Drake, G. L. Larson, J. Dymond, and R. Collier [eds.],Crater Lake: An Ecosystem Study. American Association for the Advancement of ScienceSpecial Volume, Pacific Division.
Leinen, M., R. McDuff, K. Becker, P. Schuitheiss, K. Dadey, M. Yamano, N. Fujii, J. Delaney,C. G. Wheat, M. Robotham, B. Holmen, and A. Isley. Submitted. Off-axis hydrothermalactivity near the Mañana Trough Spreading Center. Earth Planet. Sci. Lett.
Libby, W.F. 1955. Radioactive Dating, 2nd ed. University of Chicago Press, Chicago. hip.Ludden, J. N., and G. Thompson. 1979. An evaluation of the behavior of the rare earth elements
during the weathering of sea-floor basalt. Earth Planet. Sci. Letts. 43:85-91.Lupton, J. E., E. T. Baker, and G. J. Massoth. 1989. Variable 3He/heat ratios in submarine
hydrothermal systems: Evidence from two plumes over the Juan de Fuca ridge. Nature337:161-164.
Lupton, J. E., R. Collier, and J. Dymond. 1987. Excess 3He in Crater Lake, Oregon: Evidencefor geothermal input [abstr.]. EOS 68: 1722.
Lupton, J.E., and H. Craig. 1985. A major helium-3 source at 15S on the East Pacific Rise.Science 214:13-18.
Lupton, J. E., R. Collier, and J. Dymond. In preparation. Evidence for hydrothermal inputs toCrater Lake, OR. II. -The Helium isotopes. Limnol. Oceanogr.
Lupton, J. E., G. P. Klinkhammer, W. R. Normark, R. Haymon, K. C. MacDonald, R. F.Weiss, and H. Craig. 1980. Helium-3 and manganese at the 21°N East Pacific Risehydrothermal site. Earth Planet. Sci. Len. 50:115-127.
Mariner, R. H., T. S. Presser, and W. C. Evans. 1982. Chemical and isotopic composition ofwater from thermal and mineral springs of Washington. U.S. Geological Survey Open-FileReport 82-98.
Mariner, R. H., T. S. Presser, W. C. Evans, and M. K. W. Pringle. 1990. Discharge rates offluid and heat by thermal springs of the Cascade Range, Washington, Oregon, and northernCalifornia. J. Geophys. Res. 95:19517-19531.
Mariner, R. H., J. R. Swanson, G. J. Orris, T. S. Presser, and W. C. Evans. 1980. Chemicaland isotopic data for water from thermal springs and wells of Oregon. U.S. GeologicalSurvey Open-File Report 80-737, SOp.
Mans, C. R. P. 1983. Chemical evidence for advection of hydrothermal solutions in ridge flanksediments. Ph.D. Thesis, University of Rhode Island, 264 p.
Mans, C. R. P., and M. L. Bender. 1982. Upwelling of hydrothermal solutions through ridgeflank sediments shown by pore water profiles. Science 216:623-626.
Mans, C. R. P., and M. L. Bender. 1984. Ridge flank hydrothermal solutions in the GalapagosMounds Hydrothermal Field. Geochim. Cosmochim. Acta 48:2331-2346.
Mans, C. R. P., M. L. Bender, P. N. Froelich, P. N. Barnes, and N. A. Luedtke. 1984.Chemical evidence for advection of hydrothermal solutions in the sediments of the GalapagosMounds hydrothermal field. Geochim. Cosmochim. Acta 48:2331-2346.
Marmorino, G. 0., and D. R. Caldwell. 1976. Heat and salt transport through a diffusivethermohaline interface. Deep-Sea Res. 23:59-67.
Marty, B., and A. Jambon. 1987. C/He3 in volatile fluxes from the solid Earth: implications forcarbon geodynarnics Earth Planet. Sci. Lett. 83:16-26.
Mathieu, G. G. 1977. 222Rn-226Ra technique of analysis, Annual Technical Report COO 2185-0to ERDA. Lamont Doherty Geological Observatory, Palisades, NY.
197
McColl, R. H. S. 1975. Chemical and biological conditions in lakes of the volcanic plateau, p.123-139. In V. H. Jolly and J. M. A. Brown feds.], New Zealand Lakes. AukiandUniversity Press.
McDuff, R. E. 1987. Chemistry of seafloor hydrothermal systems. Reviews of Geophysics25:1427-1429.
MeManus, J., R. Coffier, and J. Dymond. 1990. Heat and salt flux in Crater Lake, OR asdeduced from water column CTD measurements. EOS 71:
McManus, J., R. Coffier, J. Dymond, and G. Larson. in prep. The role of mixing, carbon flux,and thermo-chemical inputs on the oxygen budget in Crater Lake, OR.
Michard, A. 1989. Rare earth element systematics in hydrothermal fluids. Geochimica etCosmochimica Acta 53:745-750.
Michard, A., F. Albarède, 0. Michard, J.F. Minster, and J.L. Charlou. 1983. Rare-earthelements and uranium in high-temperature solutions form East Pacific Rise hydrothermal ventfield (13°N). Nature 303:795-797.
Morgan, J.W., and G.A. Wandless. 1980. Rare earth element distribution in some hydrothermalminerals: evidence for crystallographic control. Geochim. Cosmochim Acta 44:973-980.
Mortimer, C. H. 1981. The oxygen content of air-saturated fresh waters over ranges oftemperature and atmospheric pressure of limnological interest. Mitt. int. Ver. LimnoL22:23.
Mottl, M. J., and H. D. Holland. 1978. Chemical exchange during hydrothermal alteration byseawater, I. Experimental results for major and minor components of seawater: The role ofseawater/basalt ratio. Geochim. Cosmochim. Acta 42:1103-1115.
Mulder, E. 0., and M. H. Deinema. 1981. The sheathed bacteria, p. 425-440. In M. P. Starr,H. Stolp, H. G. Truper, A. Balows, and H. G. Schlegel feds.], The Prokaryotes: AHandbook on Habitats, Isolation, and Identification of Bacteria. Springer-Verlag.
Nathenson, M. 1990a. Chemical balance for major elements in water in Crater Lake, Oregon, p.In E. T. Drake, G. L. Larson, J. Dymond, and R. Collier [eds.], Crater Lake: AnEcosystem Study. American Association for the Advancement of Science, Pacific Division.
Nathenson, M. 1990b. Temperatures of springs versus elevation in the vicinity of Crater Lake,Oregon [abstr.]. EOS 71:
Nathenson, M., and J. M. Thompson. 1990. Chemistry of Crater Lake, Oregon, and nearbysprings in relation to weathering, p. In E. T. Drake, G. L. Larson, J. Dymond, and R.Collier [eds.], Crater Lake: An Ecosystem Study. American Association for theAdvancement of Science, Pacific Division.
Neal, V. T., S. J. Neshyba, and W. W. Denner. 1971. Temperature microstructure in CraterLake, Oregon. Limnol. Oceanogr. 16:695-700.
Neal, V. T., S. J. Neshyba, and W. W. Denner. 1972. Vertical temperature structure in CraterLake, Oregon. Limnol. Oceanogr. 17(3):45 1-454.
Nelson, C. H., P. R. Carlson, and C. R. Bacon. 1988. The Mount Mazama climatic eruption(-6900 yr B.P.) and resulting convulsive sedimentation on the Crater Lake caldera floor,continent, and ocean basin. Geol. Soc. Amer. Special Paper 229:37-57.
Nelson, C. H., A. W. Meyer, D. Thor, and M. Larsen. 1986. Crater Lake, Oregon: A restrictedbasin with base-of-slope aprons of nonchannelized turbidites. Geology 14:238-24 1.
Newman, F.C. 1976. Temperature steps in Lake Kiva: A bottom heated saline lake. J. Phys.Ocean. 6: 157-163.
Ohmoyo, H., and R. 0. Rye. 1974. Hydrogen and oxygen isotopic compositions of fluidinclusions in the Kuroko deposits, Japan. Economic Geology 69:947-953.
Olafsson, J. 1980. Temperature structure and water chemistry of the caldera Lake Oskjuvatn,Iceland. Limnol. Oceanogr. 25:779-788.
198
O'Neil, J. R., and H. P. Taylor Jr. 1967. The oxygen isotope and cation exchange chemistry offeldspars. American Mineralogist 52:1414-1437.
Onishi, H. 1969. Arsenic, p. In K. H. Wedepohi [eds.], Handbook of Geochemistry, Section33-I.
Padman, L., and T. M. Dillon. 1989. Thermal microstructure and internal waves in the CanadaBasin diffusive staircase. Deep-Sea Res. 36(4):531-542.
Pearl, H. W., R. C. Richards, R. L. Leonard, and C. R. Goldman. 1975. Seasonal nitratecycling as evidence for complete vertical mixing in Lake Tahoe, California-Nevada. LimnoLOceanogr. 20(1):1-8.
Perkin Elmer. 1982. Analytical Methods for Atomic Absorption Spectrophotometry.Phillips, K. N. 1968. Hydrology of Crater Lake, East Lake, and Davis Lakes, Oregon: U.S.
U.S. Geological Survey.Pond, S., and 0. L. Pickard. 1978. Introductory Dynamic Oceanography. Pergamon Press.Poreda, R. 1983. Helium, neon, water and carbon in volcanic rocks and gases. Ph.D. Thesis,
University of California, San Diego.Poreda, R., and H. Craig. 1989. Helium isotope ratios in Circum-Pacific volcanic arcs. Nature
338:473-478.Redmond, K. T. 1990. Crater Lake climate and lake level variability, p. In E. T. Drake, 0. L.
Larson, 3. Dymond, and R. Collier [eds.], Crater Lake: An Ecosystem Study. AmericanAssociation for the Advancement of Science, Pacific Division.
Reilly, J., P. Nelson, 0. Larson, and M. Hurley. 1989. A chemical mass balance of Crater Lake,Oregon. Masters Thesis paper, Environmental Engineering, Oregon State University.
Robinson, R. A., and R. H. Stokes. 1959. Electrolyte Solutions: The Measurement andInterpretation of Conductance, Chemical Potential and Diffusion in Solutions of SimpleElectrolytes. Butterworths.
Rosenberg, N. D., 3. E. Lupton, D. Kadko, R. Collier, M. D. Lilley, and H. Pak. 1988. Ageochemical method of estimating the heat and mass flux from a seafloor hydrothermal ventfield [abstr.]. EOS 68:1721.
Ruhlin, D.E. and R.M. Owen. 1986. The rare earth element geochemistry of hydrothermalsediments form the East Pacific Rise: Examination of a seawater scavenging mechanism.Geochim. Cosmochim. Acta 50:393-400.
Ruttner, F. 1974. Fundamentals of Limnology. University of Toronto Press.Sammel, E.A. 1981. Results of test driffing at Newberry Volcano, Oregon. Bull. Geotherm.
Resour. Counc. 10:3-8.Sanimel, E. A., S. E. Ingebritsen, and R. H. Mariner. 1988. The hydrothermal system at
Newberry Volcano, Oregon. J. Geophys. Res. 93: 10149-10162.Sammel, E. A., and S. Benson. 1987. An analysis of the hydrologic effects of proposed test
drilling in the Winema National Forest near Crater Lake, Oregon. Internal Report - Bureauof Land Management, Oregon State Office, 33p.
Sano, Y., M. Kusakabe, J. Hirabayashi, Y. Nojiri, H. Shinohara, T. Njine, and G. Tanyileke.1990. Helium and carbon fluxes in Lake Nyos, Cameroon: constraint on next gas burst.Earth Planet. Sci. Lett. 99:303-3 14.
Sano, Y., Y. Nakamura, K.Notsu, and H. Wakita. 1988. Influence of volcanic eruptions onhelium isotope ratios in hydrothermal systems induced by volcanic eruptions. Geochim.Cosmochim. Acta 52:1305-1308.
Sano, Y., H. Wakita, T. Ohsumi, and M. Kusakabe. 1987. Helium isotope evidence formagmatic gases in Lake Nyos, Cameroon. Geophys. Res. Lett. 14(10):1039-1041.
Sato, T. 1972. Behaviours of ore-forming solutions in sea water. Mining Geology 22:31-42.
199
Sayles, F. L., and W. J. Jenldns. 1982. Advection of pore fluids through sediments in theEquatorial East Pacific. Science 217:245-248.
Schnetzler, C.C., and J.A. Philpotts. 1970. Partition coefficients of rare-earth elements betweenigneous matrix material and rock-forming mineral phenocrysts-il. Geochim. Cosmochim.Acta 34:331-340.
Schultheiss, P. J., and S. D. McPhail. 1986. Direct indication of pore-water advection from porewater measurements in Madeira abyssal plain sediments. Nature 320:348-350.
Sherrod, D.R., and J.G. Smith. 1990. Quaternary extrusion rates of the Cascade Range,northwestern United States and southern British Columbia. J. Geophys. Res. 95:19465-19474.
Sigurdsson, H. 1977. Chemistry of the crater lake during the 1971-72 Soufriere eruption. J.Vocanol. Geotherm. Res. 2:165-186.
Sigurdsson, H. 1987. Lethal gas bursts from Cameroon Crater Lakes [abstr.]. EOS 68:570-573.
Simpson, H. J. 1970a. Closed basin lakes as a tool in geochemistry. Ph.D. Dissertation,Columbia University, 325p.
Simpson, H. J. 1970b. Tritium in Crater Lake, Oregon. J. Geophys. Res. 75(27):5195-5207.Sorey, M. L. 1985. Types of hydrothermal convection systems in the Cascade Range of
California and Oregon, p. 63-67. In M. Guffanti and L. J. P. Muffler [eds.], Proceedings ofthe Workshop on Geothermal Resources of the Cascade Range. U.S. Geological SurveyOpen-file report 85-521.
Steele, J.L., D.D. Blackwell, and J.H. Robison. 1982. Heat flow in the vicinity of the Mt. Hoodvolcano, Oregon, Geology and Geothermal Resources of the Mt. Hood Area, Oregon, editedby G.R. Priest and B.F. Vogt. Spec. Pap. Oreg. State Dep. Geol. Mner. md. 14:31-42.
Stumm, W., and J.J. Morgan. 1981. Aquatic Chemistry. An Introduction EmphasizingChemical Equilibria in Natural Waters. John Wiley & Sons, Inc., New York. 780p.
Sverjensky, D. A. 1984. Europium redox equilibria in aqueous solution. Earth Planet. Sci Lett.67:70-78.
Swanberg, C.A., W.C. Walkey, and J. Combs. 1988. Core hole drilling and the "Rain Curtain"phenomenon at Newberry Volcano, Oregon. J. Geophys. Res. 93:10163-10173.
Thompson, G. 1973. A geochemical study of the low-temperature interaction of sea-water andoceanic igneous rocks. EOS 54:1015-1019.
Thompson, J. M., and R. 0. Fournier. 1988. Chemistry and geothermometry of brine producedfrom the Salton Sea scientific drill hole, Imperial Valley, California. J. Geophys. Res.93:13,165-13,173.
Thompson, J. M., M. Nathenson, and L. D. White. 1990. Chemical and isotopic compositionsof waters fromCrater Lake and nearby vicinity, p. In E. T. Drake, G. L. Larson, J.Dymond, and R. Collier [eds.], Crater Lake: An Ecosystem Study. American Associationfor the Advancement of Science, Pacific Division.
Thompson, J. M., L. D. White, and M. Nathenson. 1987. Chemical analyses of waters fromCrater Lake, Oregon, and nearby springs. U.S. Geological Survey OpeiI-File Report 87-587.
Timperley, M. H., and R. J. Vigor-Brown. 1985. Weathering of pumice in the sediments as apossible source of major ions for the waters of Lake Taupo, New Zealand. Chem. Geol.49:43-52.
Timperley, M. H., and R. J. Vigor-Brown. 1986. Water chemistry of lakes in the TaupoVolcanic Zone, New Zealand. New Zealand Journal of Marine and Freshwater Research20(2): 173-184.
200
Trefry, J.H. and S. Metz. 1989. Role of hydrothermal precipitates in the geochemical cycling ofvanadium Nature 342:531-533.
Turner, I. S. 1965. The coupled turbulent transports of salt and heat across a sharp densityinterface, hit. J. Heat Mass Transfer 8:759-767.
Turner, J. S. 1973. Bouyancy Effects in Fluids. Cambridge University Press.Turner, J. S., and I. H. Campbell. 1987. Temperature, density and buoyancy fluxes in "black
smoker" plumes, and the criterion for buoyancy reversal. Earth. Planet. Sci. Lett. 86: 85-92.Turner, J. S., and L. B. Gustafson. 1978. The flow of hot saline solutions from vents in the sea
floor--some implications for exhalative massive suffide and other ore deposits. EconomicGeology 73:1082-1100.
Van Denburgh, A. S. 1968. Chemistry of the Lakes, p. 41-45. In K. N. Phfflips [eds.],Hydrology of Crater, East, and Davis Lakes, Oregon. U.S. Geological Survey.
Volchok, H. L., M. Feiner, H. J. Simpson, W. S. Broecker, V. E. Noshkin, V. T. Bowen, andE. Willis. 1970. Ocean fallout-the Crater Lake experiment. J. Geophys. Res. 75:1084-1091.
Von Damm, K. L., J. M. Edmond, B. Grant, C. I. Measures, B. Walden, and R. F. Weiss.1985. Chemistry of submarine hydrothermal solutions at 21°N, East Pacific Rise. GeochimCosmochim Acta 49:2197-2220.
Weiss, R. F., J. L. Bullister, R. H. Gammon, and M. J. Warner. 1985. Atmosphericchlorofluoromethanes in the deep equatorial Atlantic. Nature 314:608-610.
Weiss, R. F., E. C. Carmack, and V. M. Koropalov. 1991. Deep water renewal and biologicalproduction in Lake Baikal. Nature 349:665-669.
Wheat, C. G., and R. E. McDuff. 1988. Fluid circulation and water-rock interaction in theMariana Mounds hydrothermal region [abstr.]. EOS 69:1499.
Wheat, C. G., and R. E. McDuff. submitted. Fluid circulation in the Mariana MoundsHydrothermal Region: Chemical tracers. Earth Planet. Sci. Lett.
White, D. E., J. M. Thompson, and R. 0. Fournier. 1976. Lithium contents of thermal andmineral springs, p. 58-60. In J. D. Vine [eds.], Lithium Resources and Requirements by theYear 2000. U.S. Geological Survey Professional Paper 1005.
Williams, D.L., and C. Finn. 1985. Analysis of gravity data in volcanic terrain and gravityanomalies and subvolcanic intrusions in the Cascade Range. U.S.A. and at other selectedvolcanoes, in W.J. Hinze, ed., The utility of regional gravity and magnetic anomaly maps.Soc. Explor. Geophys. 52nd Annual Mtg. 1982, Proc. 13:36 1-374.
Williams, D. L., K. Green, T. H. van Andel, R. P. Von Herzen, J. R. Dymond, and K. Crane.1979. The hydrothermal mounds of the Galapagos Rift: Observations with DSRV ALVINand detailed heat flow studies. J. Geophys. Res. 84(B13):7467-7484.
Williams, D. L., and R. P. Von Herzen. 1983. On the terrestrial heat flow and physicallimnology of Crater Lake, Oregon. J. Geophys. Res. 88(B2): 1094-1104.
Williams, S., Y. Sano, and H. Wakita. 1987. Helium-3 emission from Nevado Del Ruizvolcano, Colombia. Geophys. Res. Lett. 14(10): 1035-1038.
Wolfe, R. 5. 1964. Iron and manganese, p. 82-97. In H. Heukelakian and N. C. Dondero[eds.], Principles and Applications in Aquatic Microbiology. Wiley.
201
Appendix A.
On the Physical Limnology of Crater Lake, Oregon:Mechanisms for the redistribution of heat and salt in the watercolumn.
James McManus, Robert Collier, and Jack DymondCollege of OceanographyOregon State University
Abstract
Introduction
Methods
Results and Discussion
Heat and Salt flux into the deep lake.
Cli) dataThermistor data
Full water column mixing of heat and salt.
Mixing and heat exchange in the upper water column during periods ofminimum vertical stability.
Surface to deep lake exchange.
Observations on the horizontal and vertical transport of heat and salt through thehypolimnion.
Analysis of the significance of double diffusive convectionBasin to Basin exchange.Vertical mixing processes in the deep lake.
T-S properties of the hypolimnion.
A conceptual model describing the near-bottom distribution of temperatureand salinity in the South Basin.
The influence of hydrothermal activity on the physics of the water column in CraterLake.
Conclusions
.
Abstract
The heat and salt budgets of the deep lake in Crater Lake, OR appear to be dominated bysubsurface hydrothennal activity. Based on time series CI'D data and data from athermistor chain mooring, we estimate that the total conductive and convective heat flow,due to hydrothermal activity, is -4W/rn2 and the conesponding salt flux is -5
p.gfrn2. second. This paper discusses the observation of these fluxes and the mechanismsand timescales of mixing responsible for the redistribution of these properties through thewater column.
In Crater Lake, like many temperature lakes, annual vertical exchange of surface waterswith waters from the lake's hypolimnion occurs during the early winter and possiblyduring late spring. This exchange mixes the heat and salt from the deep lake to the surface.Likewise, oxygen rich waters from the surface are mixed with the deep waters, resulting ina net increase in the deep lake dissolved oxygen content at the time of mixing. This mixingprocess is not complete, that is, the deep lake does not reach equilibrium saturation withrespect to dissolved oxygen at any time during the year.
The active input of thermally and chemically enriched fluids produces heterogeneities andinstabilities in the density structure of the deep lake which drive deep lake mixing.Horizontal advection, turbulent diffusion, and a variety of other physical mechanismscontribute to the relatively rapid mixing of heat and salt from their origin in the South Basmto the rest of the deep lake. The result of this rapid mixing is that, over timescales ofseveral weeks to months, heat and salt are mixed horizontally.
Our data suggests that the South Basin of Crater Lake is the dominant region of activehydrothermal input. Detailed mapping of the near-bottom temperature and salinitystructure, in the South Basin, has allowed us to propose a conceptual model whichdescribes the ently of the enriched fluids into the deep lake. It is clear from our data set thatsimple linear mixing of warm, salty waters with ambient waters does not accurately accountfor the distribution of temperature and salinity observed near the sediment-water interface.It is possible that there are multiple fluid sources, each with their own temperature andsalinity characteristics; however, it is more reasonable that there is one source whichundergoes a variety of mixing processes. These processes must include the preferentialloss of heat over salt, coupled with linear mixing with ambient waters. Since the observedchanges in the heat to salt ratio of near-bottom waters follow the local bathymetry, thepreferential loss of heat over salt may be occurring prior to the fluid's entry into the lake,i.e. while the fluid travels through the sediment/debris which covers the caldera basementrock.
A.2
Introduction
Crater Lake is a closed basin lake with a surface area of 53.2 km2, which covers 78.5% ofits total drainage basin. It is situated at an elevation of 1882 meters and has a volume of17.3 km3 (Phiffips, 1968). The lake has two semi-enclosed basins, one in the northeasternportion of the lake (referred to here as the North Basin) which has a maximum depth ofapproximately 590 meters and the second in the southwestern section of the lake which hasa maximum depth of approximately 485 meters (South Basin). There is a station buoysituated in the northeastern portion of the North Basin (NPS station 13), where much ofour time series hydrographic data was collected. Some of the time series data presented inthis paper was also collected in the South Basin, NPS station 23, and in the northwesternportion of the lake, NPS station 11 (see map Figure 1).
An understanding of the physical processes which control the redistribution of heat and saltin Crater Lake are essential to modeling the biogeochemical cycling of elements in the lake.Relatively little has been documented about the physical limnology of Crater Lake. Kibbyet. al. (1968) reported surface current observations as well as vertical and horizontaltemperature measurements in the upper water column. Data from Simpson (1970a &b) andVolchok et. al. (1970) indicate that the characteristic time-scale of surface to bottomexchange is approximately one year. Neal et. al. (1971, 1972) provided early temperaturemicrosiructure measurements which indicated the hyperadiabatic nature of the thermalgradient of the deep lake. Williams and Von Herzen (1983) provided the first empiricaltreatment of the water column physics in Crater Lake. Although the work of Williams andVon Herzen (1983) served as a catalyst to the current work, the lack of high precision saltdeterminations limited their ability to interpret the temperature microstructure of thehypolimnion in Crater Lake. Our research has provided the necessary high precisionsalinity data which when coupled with the temperature data, allows for the accuratedetermination of the physical properties and the mixing dynamics of the lake (McManus et.al, submitted).
To a first approximation Crater Lake is well mixed with respect to major ions (Collier et.al., 1990a; Nathenson, 1990; Thompson et. al., 1990; Nathenson and Thompson, 1990;McManus et. al., submitted). The upper water column (top 200 meters) is nearly isohaline,and this observation holds throughout most of the year (Figure 2). Due to evaporation,small increases in surface salinity are often observed by late summer/early falL Below 200meters the salinity increases with depth at all times (Figure 2). This increase is observedthroughout the lake; however, there are small-scale spatial and temporal variations in thesalt as well as the heat distribution of the deep lake. These variations in the heat and saltdistribution of the deep lake can create vertical and horizontal heterogeneities in the densitystructure of the hypolimnion (McManus et. al., submitted). These density heterogeneitiesmay act to drive mixing processes in the waters of the hypolimnion.
In section I of the results and discussion we will present the heat and salt budget for thedeep (>3 50 meters) hypolimnion of Crater Lake. The remaining focus of this paper will beon identifying the processes, both large and small scale, which govern the redistribution ofthis heat and salt through the water column of Crater Lake. Our research has demonstratedthat the mechanisms governing the redistribution of heat and salt in Crater Lake may begrouped into two categories; large scale vertical exchange of surface waters with bottomwaters and small scale mixing processes. Annual exchange of surface waters with bottomwaters affects the distribution of temperature and salinity throughout the entire watercolumn. This mixing is due to conditional "thermobaric instabilities" which are generatedduring periods of lowered vertical stability. During periods of high surface stratificationthe deep lake is dominated by small scale horizontal and vertical mixing processes driven -
A.3
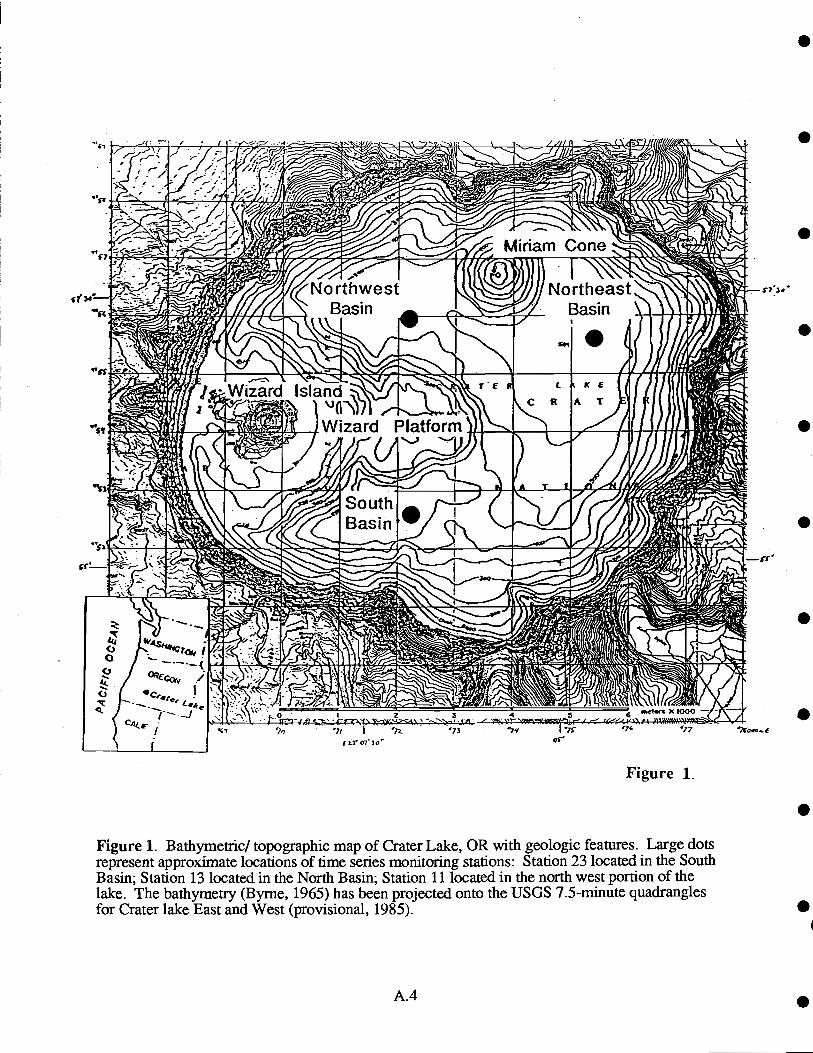
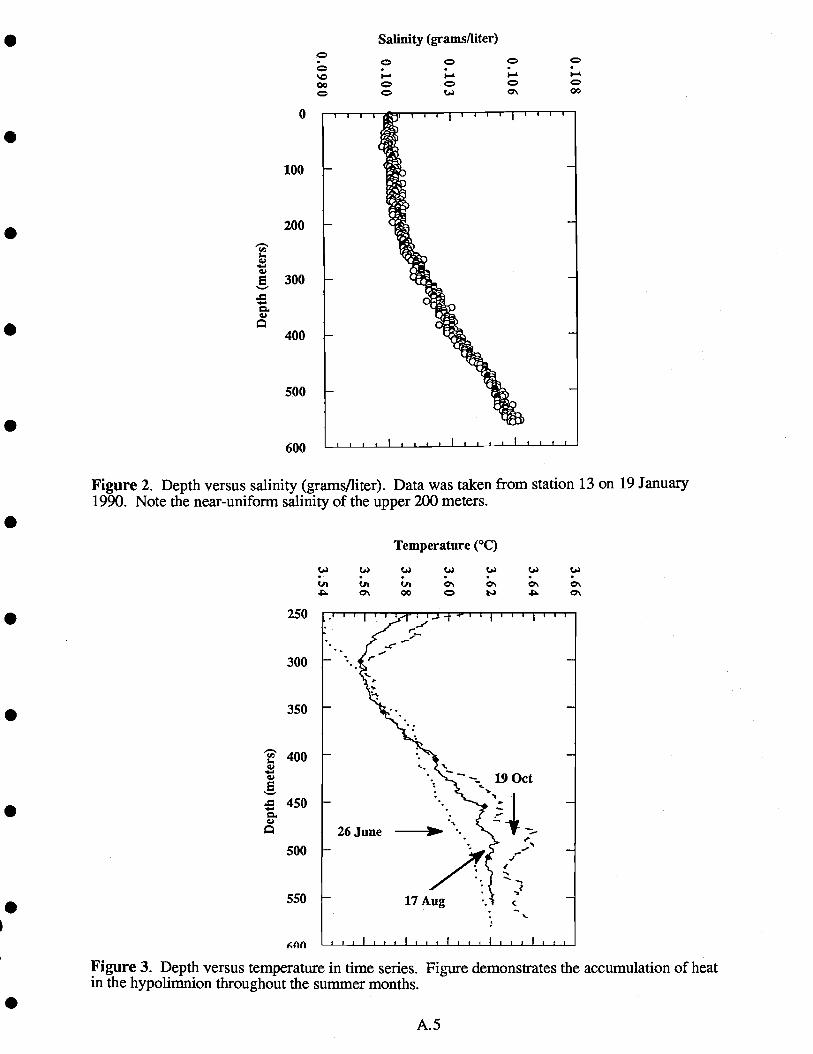
Salinity (grams/liter)
I.100
200
300
400
500
600
00
0
Figure 2. Depth versus salinity (grams/liter). Data was taken from station 13 on 19 January1990. Note the near-uniform salinity of the upper 200 meters.
Temperature (°C)
C'C' 00 . C'
250
300
350
' 400VI
450C.V
500
550
'cnn
Figure 3. Depth versus temperature in time series. Figure demonsirates the accumulation of heatin the hypolimnion throughout the summer months.
A.5
0 00
by the active input of heat and salt into the lak&s hypolimnion. The small scale physicalmechanisms for the mixing of heat and salt include; horizontal advection, turbulentdiffusion, and the periodic formation of convective cells and other water column densityinstabilities.
Methods
Temperature, pressure, conductivity, and light transmission were measured using a "CTD"(SEACAT® model SBE19, Sea-Bird Electronics Inc.) modified for low conductivitywaters and equipped with a 25 cm path length light beam transmissometer (Sea Tech. Inc.).The Cli) records all data internally at 2 scans per second. Temperature resolution is±0.0005°C and, based on laboratory triple point calibrations of the temperature sensor, theabsolute accuracy of the temperature sensor was better than 0.001°C from 1987 to 1989.Most of the CTD data presented in this paper was acquired with the profiler deployed on ahydrographic wire which was lowered from the NPS research boat. However, datadescribing the near-bottom disthbution of temperature and salinity were collected with theCTD mounted on an "arm" of a one-man submersible (Dymond et. aL, 1989).
Laboratory calibration of the conductivity sensor using Crater Lake water and subsequentchemical analysis of this water provided us with sufficient salinity, conductivity, andtemperature data to obtain an expression for salinity as a function of in situ conductivity andtemperature (McManus et. al., submitted). The expression was derived using a multipleregression analysis package and is similar in form to the expression for salinity used inseawater (Cox et. al., 1967). Salinities calculated from this expression are 25% greaterthan would be predicted from strong electrolytes alone; this is due to the fact that siicic acidaccounts for approximately 25% of the total dissolved solids load in the lake. The rationalefor including siicic acid as part of the total "salt" content is that in order to accuratelycalculate the physical properties of the water column (e.g. density), an accurate measure ofthe total dissolved solids is necessary. Our work has indicated that silicic acid isproportional to the total salt content and specific conductance in Crater Lake. The details ofthe experiments and further explanation of the affects of siicic acid on the density of lakewater are presented in McManus et. al. (submitted).
Time series temperature data was also collected using two moored thermistor chains, onelocated in the upper water column, 50-150 meters, and the other extended from 350 to 450meters -- where 450 meters is the approximate bottom depth at this location. The chainshad 11 thermistors spaced at 10 meter intervals. Temperature data was recorded everythree hours throughout deployment and the thermistors were calibrated at the OSUcalibration facility both before and after deployment. From this calibration, the absoluteaccuracy of the thermistors was found to be ±0.010°C and the in-field precision, based ondaily temperature measurements from the deep lake, was ±0.005°C.
Oxygen samples were analyzed according to a whole-flask Winkler titration method withthe modifications of Carpenter (1965a &b). The overall precision of the oxygenmeasurement is based on the percent difference between duplicate sample analysis andappears to be better than 0.5%. To calculate oxygen solubility for Crater Lake theequations presented in Benson and Krause (1980) were employed. The mean barometricpressure was calculated from the altitude dependent equation given by Mortimer (1981).
A.6
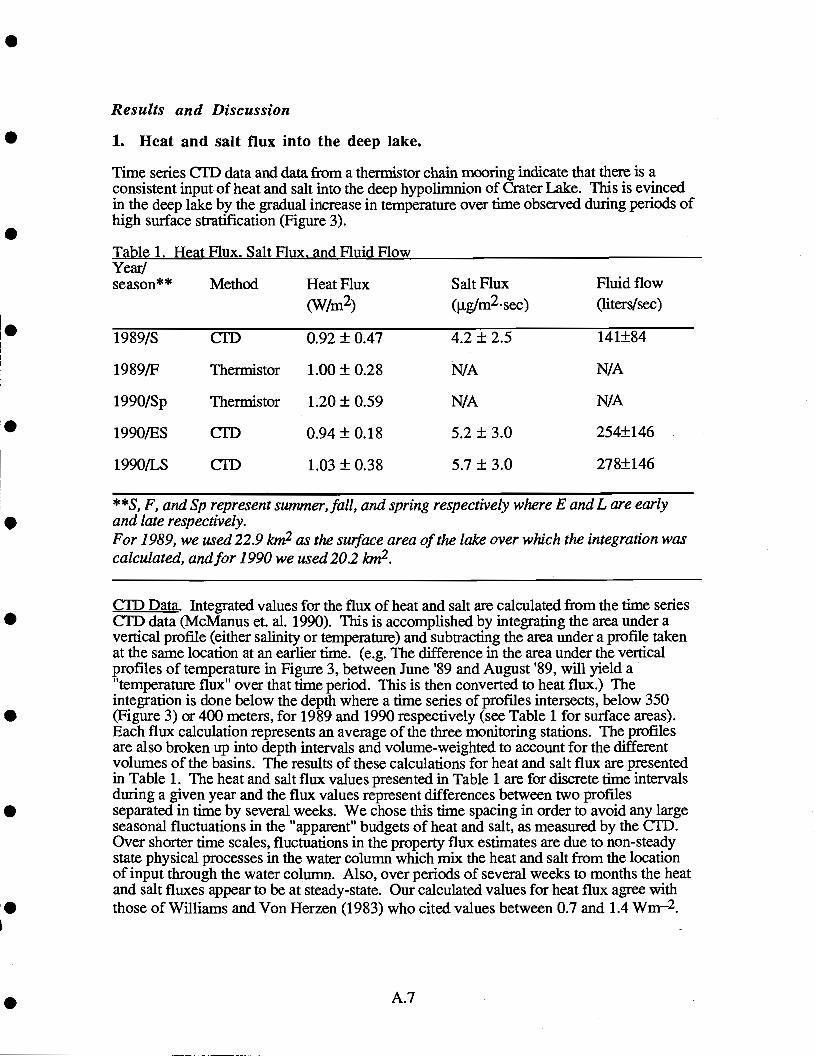
Results and Discussion
1. Heat and salt flux into the deep lake.
Time series CTD data and data from a thermistor chain mooring indicate that there is aconsistent input of heat and salt into the deep hypolimnion of Crater Lake. This is evincedin the deep lake by the gradual increase in temperature over time observed during periods ofhigh surface stratification (Figure 3).
Table 1. Heat Flux. Salt Flux. and Fluid FlowYear!
**9, F, and Sp represent summer, fall, and spring respectively where E and L are earlyand late respectively.For 1989, we used 22.9 kin2 as the suiface area of the lake over which the integration wascalculated, and for 1990 we used 20.2 kin2.
CTD Data. Integrated values for the flux of heat and salt are calculated from the time seriesCTD data (McManus et. al. 1990). This is accomplished by integrating the area under avertical profile (either salinity or temperature) and subtracting the area under a profile takenat the same location at an earlier time. (e.g. The difference in the area under the verticalprofiles of temperature in Figure 3, between June '89 and August '89, will yield a"temperature flux" over that time period. This is then converted to heat flux.) Theintegration is done below the depth where a time series of profiles intersects, below 350(Figure 3) or 400 meters, for 1989 and 1990 respectively (see Table 1 for surface areas).Each flux calculation represents an average of the three monitoring stations. The profilesare also broken up into depth intervals and volume-weighted to account for the differentvolumes of the basins. The results of these calculations for heat and salt flux are presentedin Table 1. The heat and salt flux values presented in Table 1 are for discrete time intervalsduring a given year and the flux values represent differences between two profflesseparated in time by several weeks. We chose this time spacing in order to avoid any largeseasonal fluctuations in the "apparent" budgets of heat and salt, as measured by the CT]).Over shorter time scales, fluctuations in the property flux estimates are due to non-steadystate physical processes in the water column which mix the heat and salt from the locationof input through the water column. Also, over periods of several weeks to months the heatand salt fluxes appear to be at steady-state. Our calculated values for heat flux agree withthose of Williams and Von Herzen (1983) who cited values between 0.7 and 1.4 Wm2.
A.7
season** Method Heat Flux(W/m2)
Salt Flux
(tgfm2sec)Fluid flow(liters/sec)
1989/S CW 0.92 ± 0.47 4.2 ± 2.5 14 1±84
1989/F Thermistor 1.00 ± 0.28 N/A N/A
1990/Sp Thermistor 1.20± 0.59 N/A N/A
1990/ES CW 0.94 ± 0.18 5.2 ± 3.0 254±146
1990/LS Cli) 1.03 ± 0.38 5.7 ± 3.0 278±146
Fluid flow values are derived directly from the salt flux values. In calculating the fluidflow, we have assumed that the salinity of the fluids as they enter the South Basin is0.6 grams/kg. This salinity value is based on pore water chemistry data (Wheat,unpublished) and the chemical composition of brines which are found at the bottom of theSouth Basin (Collier et. al., 1990b). Our estimates for fluid flow and salt flux (Table 1)are consistent with other values suggested by Reilly (1990), 121 liters/second and 6-7
tg/m2.sec, and Nathenson (1990), 80-1900 liters/second.
Thermistor Data. Using deep lake temperature data from a thermistor chain moored fromthe bottom of the South Basin (-450 meters) extending up through the water column to adepth of approximately 350 meters we can estimate the rate of deep lake warming. This isaccomplished by determining the slope of the line which represents the change intemperature over time in the deep lake during periods of high surface stratification. We dothis calculation for the thermistors below 350 meters and above 440 meters on the chainand obtain an average of all the resulting heat fluxes. The results are presented in Table 1.To demonstrate the warming of the deep lake we show an expanded-scale plot oftemperature versus time for the thermistor deployed at 410 meters (Figure 4). The arrowsindicate deep lake warming during periods of relatively high water column stability (fall andlate spring/early summer). During winter there is some cooling of the deep waters which isassociated with vertical mixing of surface waters with deep lake waters; these processeswill be discussed later in the text. The absence of data apparent in Figure 4 marks a periodof time when a large offset occurred in each thermistor record.
The "steady state" flux of heat and salt is difficult to precisely ascertain because the physicalprocesses that transport these properties, through the water column, are not necessarily atsteady state. The tendency of the thermally and chemically enriched fluids to "pond't alongthe bottom of the lake as suggested by the work of Williams and Von Herzen (1983) andCollier et. al. (1990) will result in the trapping of heat and salt within these fluids. Despitethe uncertainty in our calculations, our method for estimating heat flux, salt flux and fluidflow confirm and refine the previously reported values.
2. Full water column mixing of heat and salt.
Annual vertical exchange of surface waters with waters from the deep lake mixes heat andsalt during periods of reduced vertical stability of the water column Since deep lake wateris rich in biochemically important nutrients, particularly dissolved nitrate, this exchange iscritical to new biological productivity in the upper 200 meters. Such exchange also carriescooler, oxygen rich waters from the surface to the hypolimnion. Therefore, the dissolvedoxygen content of the deep lake allows us to estimate the degree to which surface to bottomexchange has occurred. For example, if the entire lake were to reach saturation withrespect to dissolved oxygen, we would then conclude that all of the waters have come intocontact with the surface during a single mixing period.
In the following section we will discuss surface mixing using data obtained from athermistor chain mooring deployed at depths between 50 and 150 meters in the SouthBasin. Since we do not have the supporting data to develop a detailed model of upperwater column physical processes, our discussion of this thermistor data will be limited togeneral observations on this part of the lake. We then examine the results from a near-bottom thermistor chain deployed between 350 and 450 meters, also in the South Basin, inrelation to the exchange of surface water with deep lake water. In addition to the thermistorchain data, CTD data and dissolved oxygen data are also presented as evidence for verticalexchange. Once we have established the data base supporting our hypothesis, that the
A. 8
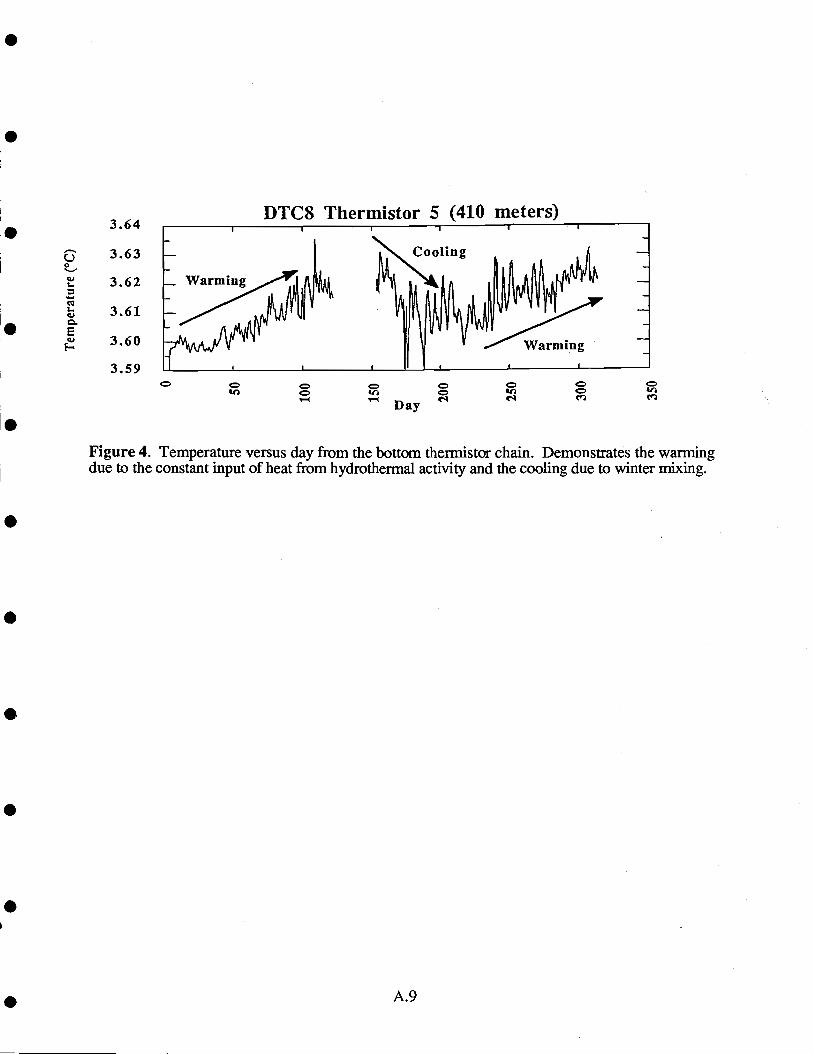
3.64
3.63
3.62
3.61
3.60
3.59
Figure 4. Temperature versus day from the bottom thermistor chain. Demonstrates the warmingdue to the constant input of heat from hydrothermal activity and the cooling due to winter mixing.
A.9
water column undergoes annual vertical mixing, we will attempt to elucidate the mechanismfor this exchange.
Mixin heat -xchane in h r w t rc 1 mn dunn erio of minimum v - cal
A.l0
stability. Results from two thermistor chains deployed in the South Basin from 3September 1989 until 11 July 1990 reveal information on both surface and deep lake heatexchange. The chains are both 100 meters in length with thermistors spaced at 10 meterintervals. TC1084 was moored from 50 to 150 meters and thermistor chain TC8 wasmoored from 350 meters to 450 meters (the approximate bottom depth at this particularlocation in the South Basin).
TC1084 provides a record of upper water column temperatures (Figure 5). The upperwater column begins to undergo destratification in late fall as the density of the surfacewaters increases due to cooling. Forcing due to wind mixing at the surface and cold-waterconvection allow the surface water to be transferred down the water column and mixedwith the ambient water at depth. The result of this process is seen as an increase intemperature at 90 meters by late December (Figure 6a). By mid-January the deepthermistors show an increase in temperature due to this process (Figure 6b). At this timethe entire upper 150 meters is isothermal. The rate that the initial warming signal istransferred through this upper water column mostly reflects the stronger stratification in theupper 100 meters as compared to the 100-150 meter depth range. From 50 to 90 metersthis warm water signal (Figures 5 and 6) descends through the water column at a rate of1.0 meter/day ±10%. From 100 meters to 130 meters the rate of transfer of this signal ismuch higher, 7.7 meters/day ± 10%. Mter the initial increase in temperature down thewater column, there is a gradual decrease in temperature of the upper 200 meters over timedue to continued cooling. From mid-February to mid-March the upper water column is atits minimum in temperature and is nearly isothermal and isopycnal.
By early April, spring warming has begun to influence the temperature structure at 150meters. Initial warming of the cold surface water produces water of greater density (e.g.the temperature of maximum density is greater than ambient water); hence, unstable parcelsof surface water form and drive convection. This process is best demonstrated bytemperature profiles obtained with the CTD from early May 1989 (Figure 7). As shown inFigure 7, the surface waters are heated during the day, forming convective cells which sinkthroughout the course of the day (solid line Figure 7). This continued process warms theentire water column through which convection may occur leaving a warmer column ofnear-uniform temperature water at the end of the day (dashed line Figure 7). The threeprofiles in Figure 7 were taken from the three different monitoring stations in the lateafternoon to early evening on 11 May. Therefore, the net warming apparent between thethree proffles does not reflect the total, one-dimensional heat input into the upper lake.Differential heating at the three stations causes STN 11 (the heavy dashed line) to receivemore solar input than either of the other two stations.
During the spring warming process described above, a diurnal cycle of heating during theday and cooling at night appears to be established (Figure 8 a-cl). The maximum in dailywater temperature at 50 meters during the month of April is recorded at 1300 and theminimum between 0100 and 0500. The problem with this simple one-dimensional conceptis that if this daily heating-cooling cycle were to be going on in the entire upper 50 meters(i.e. a daily change in temperature of the upper 50 meters of approximately 0.1°C), then theupper water column would be exchanging approximately 550 W/m2 of heat, which is anunreasonably large amount of heat. It is more likely that this diurnal cycle is due toincreases in the temperature of the convective plumes until mid-day followed by a decreasein temperature of the plumes. After these plumes cease forming (after sunset), diffusive -
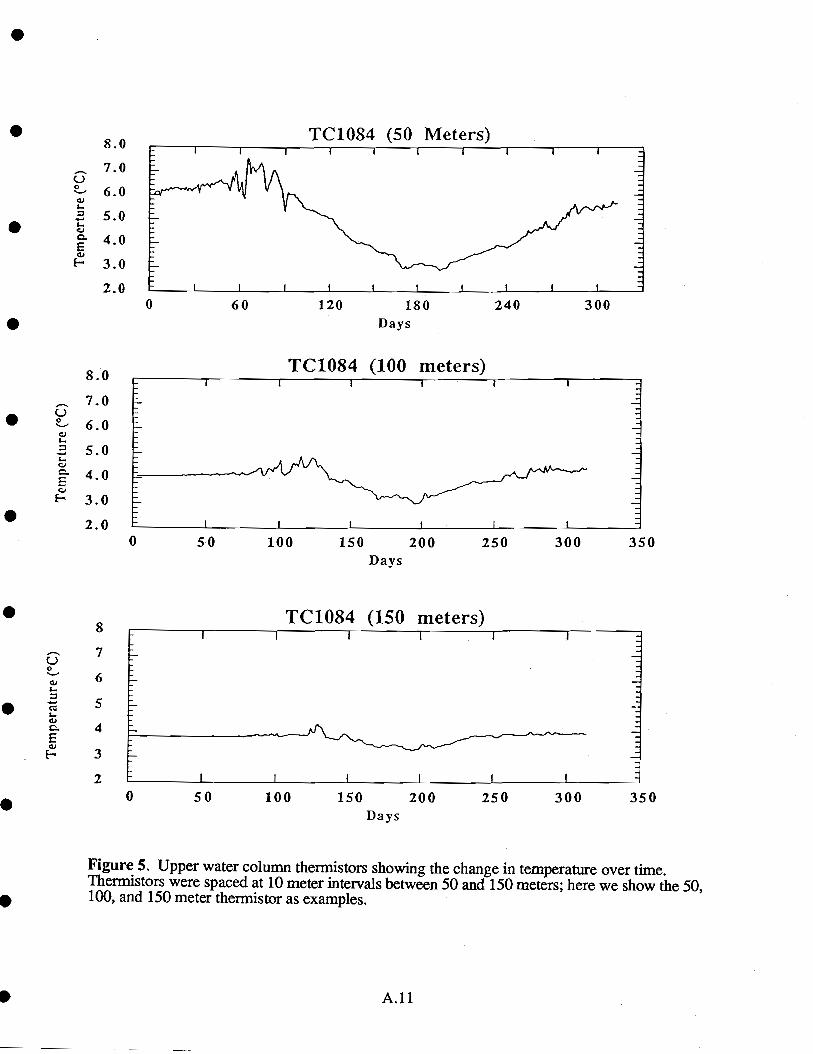
0 60I
TC1084 (50 Meters)I I I
180Days
120
A.11
240 300
0 50 100 150 200 250 300 350Days
Figure 5. Upper water column thermistors showing the change in temperature over time.Thermistors were spaced at 10 meter intervals between 50 and 150 meters; here we show the 50,100, and 150 meter thermistor as examples.
8.0
7.06.0
5.0p4.0
3.02.0
8
7
6
5
4
3
2
TC1084 (100 meters
1 1
0
TC1084 (150 meters)
50 100 150 200Days
250 300 350
I 1 I I I I
8.07.0
00 6.0
5.0I-
4.0
3.0
2.0 I I

50
70
130
150
Temperature (5C)
us . . us0 n US 0 U.0 0 0 0 0 0 0
December Profiles
A.12
January ProfilesTemperature (5C)
Figure 6. Depth versus temperature in the upper part of the water column for (a) December and(b) January. Data is taken from the thermistor chains as in Figure 5.
usm o e.e0 0 0 0 0 00 0 0
50 uiuulil, J! utJI I e4tS ,, IS
I!SITmd I
70I I
301 I1
/'I /90
S.Ce
120Ce
E
110 - Il'JI
130
150

11 May 1989 Profiles
Temperature (°C)
C3 Cj
a. a.
A.13
Figure 7. One day time series of depth versus temperature for Crater Lake. The figuredemonstrates convective warming in the late afternoon (solid line), the gradual slowing of theconvection by early evening (dotted line), and the near-uniform temperature profile by sunset(heavy dashed line).
processes mix the heat from these features with the ambient colder waters, this mixingprocess reduces the temperature seen by the thermistors to a minimum by early morning.Horizontal heterogeneity in the upper water column heat content wifi tend to enhance thisapparent cycle as waters heated more at one end of the lake are iransported to the other"cooler" side of the lake. In order to evaluate the total heat budget of the upper lake, longerterm (days to weeks) averages of heat input should be evaluated.
Based on the thermistor at 50 meters depth, we calculate a net heat input from 1 April to 20April and from 1 May to 20 May of approximately 55 W/m2. This represents a reasonableheat flux due to the input of solar energy, at this time of year. As the temperature of theupper water column approaches the temperature of maximum density at 50 meters (line ofTmd in Figure 8a-d), the upper water column becomes nearly isothermal at about 3.9°C.After this point (approximately 1 May), rapid warming of the surface waters stratifies thewater column, thereby isolating the deeper waters as suggested by the near-constant watertemperature at 100 meters until approximately 12 May. After approximately 10 May, weobserve large variations in the daily water column temperatures. Our calculations suggestthat these large changes in the "apparent" daily heat input, seen in Figure 8c & d, are on theorder of hundreds of W/m2, as measured by all the thermistors between 50-150 meters.These fluctuations are likely being driven by storms, surface driven convection due tocooling, strong horizontal thermal gradients, and other upper water column mixingprocesses.
A more detailed study of the upper water column-atmosphere interactions needs to includethermistors which extend to the surface as well as detailed meteorological data. Ofparticular importance to this work is the observation that the surface mixing processesdescribed here yield an upper water column (top 200 meters) which is well-mixed withrespect to dissolved ions (Figure 2) and oxygen (Figure 9) throughout the year. This upperregion of the lake is also generally deplete of dissolved nitrate, suggesting that this entireregion of the water column supports at least some biological productivity.
Mixing of surface water with deep lake water. Time series oxygen data, CTD data, andthermistor chain data all indicate that some exchange of surface water with deep wateroccurs in Crater Lake at least once a year. The data suggests that this annual mixing processis likely to be incomplete. As a result, progressively "older" water mixtures are founddeeper in the lake.
As discussed above, the upper 200 meters of the lake becomes isothermal and isopycnaltwice annually. The formation of this isothermal-isopycnal layer results in the near-saturation of dissolved oxygen in these upper waters (Figure 9). Oxygen data collectedfrom July 1988 through July 1990 reveal that there is annual mixing of well-oxygenated(surface) water with bottom water. Our data collected from September 1988 and April1989 demonstrate an increase in dissolved oxygen, measured at 550 meters, of nearly 10j.tmoles/liter (Figure 9). Likewise, from January 1990 to July 1990 we observe anotherincrease in deep lake dissolved oxygen indicating that the reaeration process was againrepeated during the winter and/or spring of 1990. This mixing is, however, incomplete,leaving the deep lake undersaturated with respect to atmospheric saturation of oxygen at alltimes sampled. Simple mass balance calculations and some assumptions on the organicmatter oxidation rate within the deep lake suggest that for the 198 8-89 field season 30-45%of deep lake water was exchanged with well aerated surface water. This implies that ittakes approximately 2 to 4 years for the deep lake to undergo complete ventilation.
CTD data collected at the same time as the dissolved oxygen data and thermistor chain dataalso provide evidence for the exchange of surface waters with waters from the
A.l4
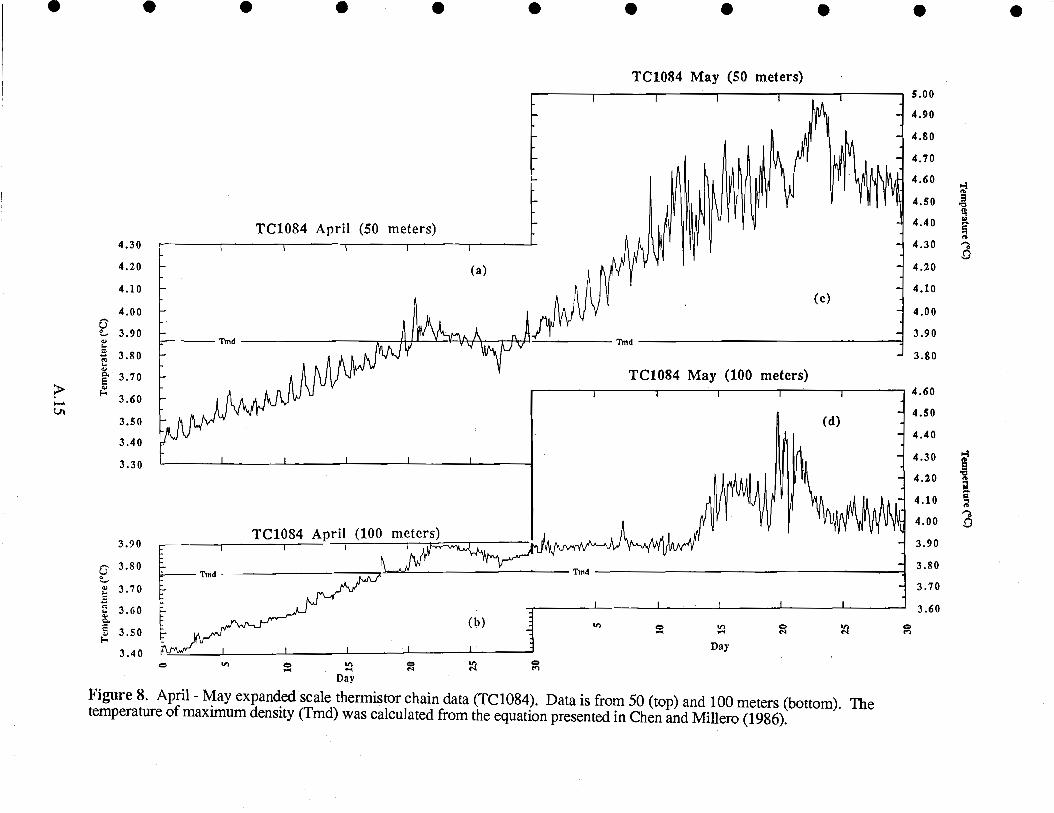
3.80
3,70
4.30
4.20
4.10
4.00
3.90
3.80
3.70
3.60
3.S0
3.40
3.30
3.90
3.60
Tnid
Tnid
TC1084 April (50 meters)
TC1084 April (100 meters
(a)
(b)
- TTnd
-IDay
TC1084 May (100 meters)I I I
(d)
Day
Figure 8. April - May expanded scale thermistor chain data (IC 1084). Data is from 50 (top) and 100meters (bottom). Thetemperature of maximum density (Tmd) was calculated from the equation presented in Chen and Millero (1986).
4.60
4.50
4.40
4.30
4.20
4.10
4.00
3.90
3.80
3.70
3.60
S S S S
TC1084 May (SO meters)5.00
I I
4.90
4.80
4.70
4.60
4.50
4.40
4.30
4.20
4.10(c)
4.00
3.90Thd
3.80
E 3.50
3.40

100-
200-
Depth(meters)
300-
500-
0 September 1988
April 1990
A.16
a.
a
a
Solublilty/
Dissolved Oxygen (micromolar)
Figure 9. Depth versus dissolved oxygen for September 1988 and April 1989. The figuredemonstrates the increase in deep lake oxygen from fall/winter to spring/summer. The line ofoxygen solubility is for April and is calculated from equations presented in Benson and Krause(1980).
360600 .
260 280 300 320 340
400- a
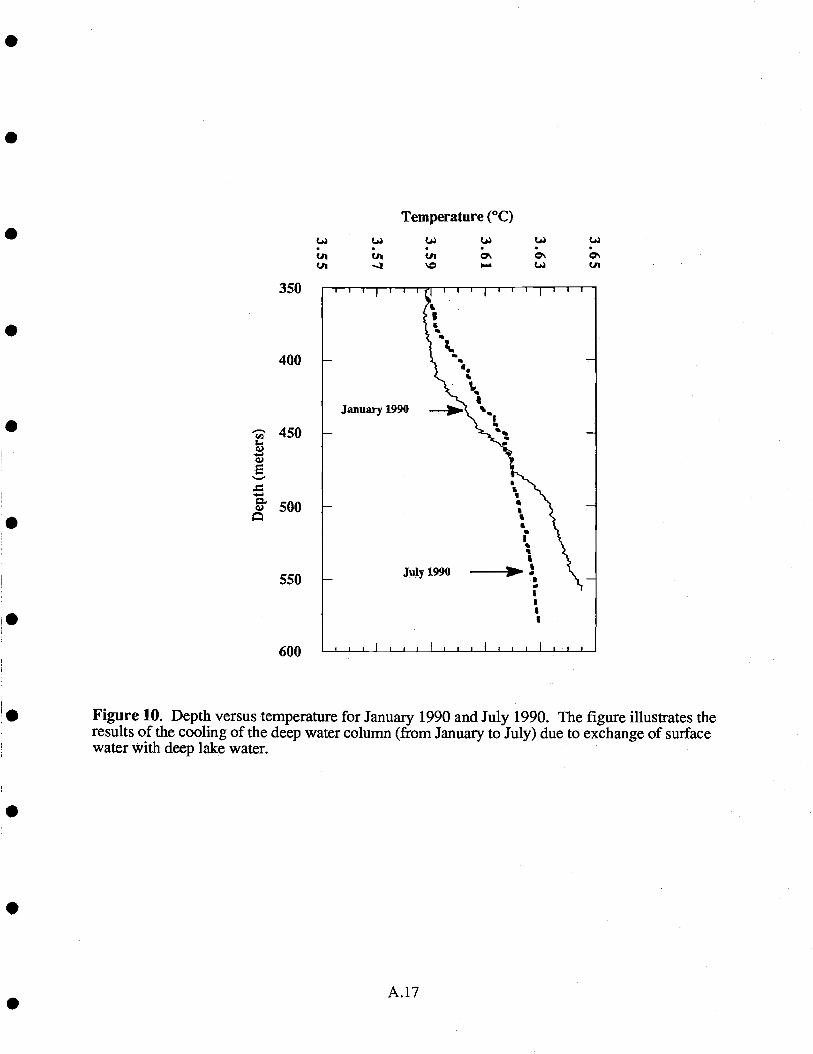
U,U'
350
400
- 450
500
550
600
Temperature (°C)
Figure 10. Depth versus temperature for January 1990 and July 1990. The figure illustrates theresults of the cooling of the deep water column (from January to July) due to exchange of surfacewater with deep lake water.
C.'U'
hypolimnion. A one dimensional approximation of the heat budget in the deep North Basinfrom January 1990 to July 1990 (Figure 10) indicates that a net loss of heat (225 kcal/m2)occurred between January 1990 and July 1990 in the North Basin deep water (350-550meters). This loss of heat is presumably due to the mixing of cooler surface waters withbottom waters, providing further evidence for exchange between surface and deep waters.These findings are also consistent with the deep water cooling evident in the thermistorchain data collected from the South Basin (Figure 4).
The magnitude or effectiveness of this type of mixing will likely vary form year to year.As surface waters cool below the temperature of maximum density, the upper watersbecome restratified. The faster the upper waters cool and become restratified the less timeavailable for deep water reaeration, hence influencing the "completeness" of verticalexchange. Year to year climate variations will therefore affect the extent of annual verticalexchange. This exchange is more likely to occur during the winter mixing phase ratherthan in the spring. Calmer weather conditions at Crater Lake typically dominate duringspring, and heating of surface waters occurs fairly rapidly thereby making verticalexchange less likely or less efficient during this period.
The deep lake thermistor chain data imply that the deep lake reaeration process lasted atleast one month (Figure 4). Most of the thermistors in this chain recorded the maximum indeep lake temperature shortly after day 150 (early February). After this time the deep lakeundergoes some cooling, for about one month, until it again begins to warm. Watercolumn cooling is caused by a reduction in water column stability whereby cold watersfrom the upper 200-300 meters can mix with the deep warmer waters. This mixing takesthe form of both turbulent diffusion and a sudden or episodic mixing event. This latterprocess provides the impetus for the majority of the deep lake reaeration.
We hypothesize that the actual mixing "mechanism" for the majority of the exchangebetween surface and deep water is similar to that proposed by Farmer and Carmack (1981),Carmack and Farmer (1982), Carmack et. aL, (1989), and Weiss et. aL, (1991). Thismechanism relies on the effects of pressure on the temperature of maximum density and hastherefore been termed "thermobaric instability". Since the temperature of maximum densitydecreases with increasing pressure, colder water overlying warmer water becomes"conditionally unstable" with respect to water immediately below. Wind forcing and/orinternal waves displace a water parcel vertically to a depth where its temperature is closer tothe temperature of maximum density than the ambient water at that depth. Once the parcelis displaced it will continue to descend through the water column, because of its greaterdensity relative to the surrounding water, until it reaches a point of neutral stability. Forour purposes, water parcel stability is assessed with respect to the density gradient wheredepth (z) increases from the surface to the bottom and the density (p) is taken to be thedensity a fluid would have at some reference pressure which is in close proximity to thedepth interval of interest. For the model of thermobaric instability, density is considered asa function of pressure and temperature (p p [T,P]). Where z increases with depth and
Ap/Az >0 between two water parcels over distances of approximately 10 meters (thedistance between our thermistors) the parcels at those two positions are stable relative toeach other, and if Lp//Xz <0 the parcels are unstable with respect to each other.
A requirement for the deep penetration of a water parcel is that AS/Az (the vertical salinitygradient) is approximately equal to zero or is negligible compared to the temperature andpressure effects on density. In Lake Baikal, U.S.S.R., where the results of this processhave been dramatically demonstrated (Cannack, 1989; Weiss et. al., 1991), thisrequirement is satisfied. The result, in Lake Baikal, is that surface water descends through
A.18
the water column to near-bottom depths with a well-preserved surface signature intemperature, dissolved oxygen, and other geochemical tracers. In Crater Lake, over shortvertical distances between the depths of 200 and 400 meters, the approximation of AS/Az =0 may hold; however, below this depth increases in salinity with depth will increase thedensity of the ambient fluid making exchange of the colder, less salty fluids (upper waters)with the warmer, saltier fluids more difficult. Therefore, we have a situation in Crater Lakewhere two of the components of density, temperature and salinity, must be evaluated fortheir affect on the stability of the fluid and we must consider density as a function oftemperature, pressure, and salinity.
Using estimates of the salinity gradient obtained from Januaty 1990 Cli) data and thethermistor data presented in Figure 1 la, we calculate that the densities, relative to 400decibars, of the waters above 390 meters are more dense than the waters at 400 meters.The result is a density profile which is schematically represented in Figure 1 lb. Figure 1 icdemonstrates the temperature profile for the following day. Here, there has been someapparent exchange between the colder water from above and the warmer water below,resulting in colder waters now underlying warmer water. In the subsequent days there arerapid changes in the vertical temperature distribution in this part of the water column,eventually resulting in a stable density gradient. It is also apparent from the figure that thenear-bottom waters have not been mixed to the same degree as the waters above 420meters. The net effect of mixing dense cold waters from above with warm, salty watersfrom below, is that any instability-driven mixing decreases in effectiveness with increasingdepth in Crater Lake due to the resisting force of the salinity gradient.
Prior to the development of the instability and subsequent overturn described above,mixing through the hypolimnion appears to be dominated by the diffusion of cold waterfrom above. This is seen in Figure 11 a as a gradual decrease in temperature between 1February and 20 February, over the depth interval 350 to 420 meters. This mixing of coldwater from above with warm water from below can be modeled according to a simplediffusion model where the heat flux (F11) can be calculated by
F11 (z,t) = pC (aT[z,t]/&) dz (2a)
and
FH (z,t) = -Pc K(z,t) (aT[z,t]/az)t (2b)
where aTR)z and aTR)t are the slopes of the temperature versus depth and temperatureversus time relationships respectively (Li, 1973), P and C are the density and the specificheat capacity respectively. The vertical diffusion coefficient (K) evaluated from this data is1.5 -2 x 10-s m2/sec, which reflects relatively rapid vertical transfer. (We will comparethis diffusion coefficient to the effective diffusion coefficient calculated for the hypolimnionduring periods of high surface stratification, later in the text.)
The oxygen and temperature data presented here suggests that the annual exchange ofsurface water with deep water is an important process for the vertical redistribution of heatand salt in the lake. It is difficult to predict the annual magnitude or extent of this mixingprocess in the water column without yearly time series data collection. It is likely that acomprehensive model of surface-to-bottom exchange is impossible without detailedmeteorological data as well as water column chemistry and temperature data. The use oftime-dependent chemical tracers (e.g. tritium, Lupton [unpublished.], and CFC's, Weiss
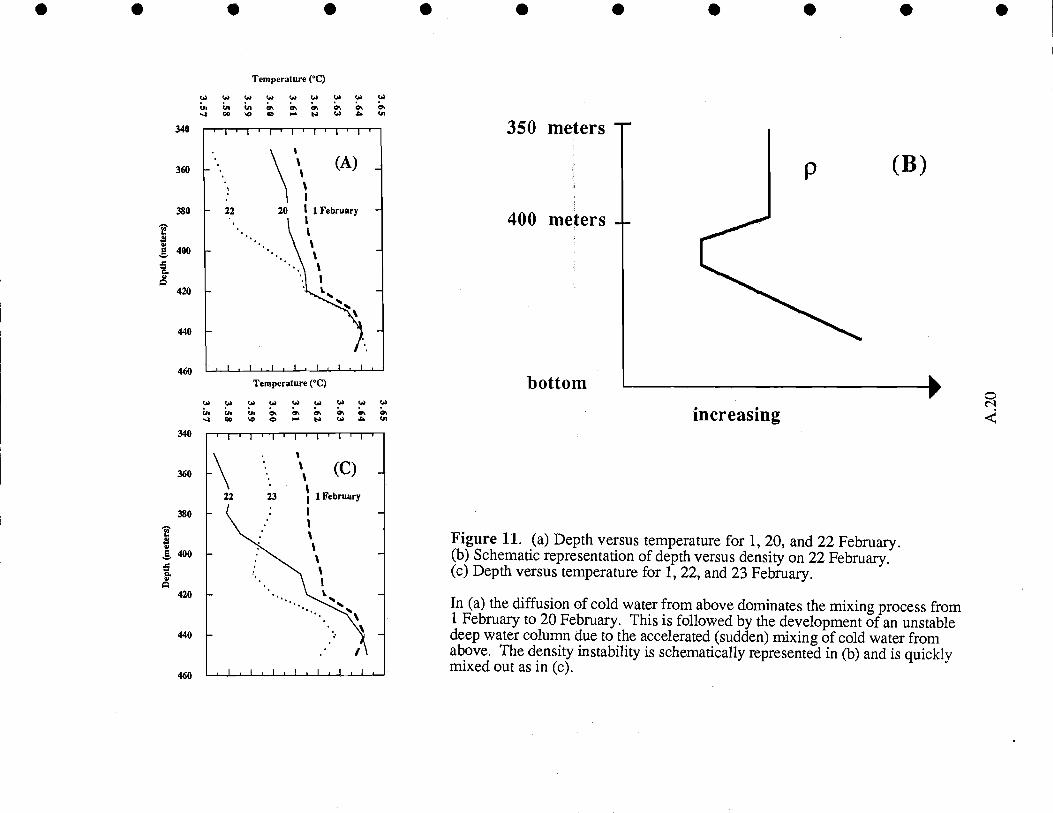
440
460
340
360
380
a.g 400
C.a
420
440
460
Temperature (CC)
Ui Ji.4 00 'Q - b N Ui
Temperature (°C)
us Ui %
00 O 0 - J us Us
350 meters
400 meters
bottom
increasing
(B)
Figure 11. (a) Depth versus temperature for 1, 20, and 22 February.Schematic representation of depth versus density on 22 February.Depth versus temperature for 1, 22, and 23 February.
In (a) the diffusion of cold water from above dominates the mixing process from1 February to 20 February. This is followed by the development of an unstabledeep water column due to the accelerated (sudden) mixing of cold water fromabove. The density instability is schematically represented in (b) and is quicklymixed out as in (c).
340
360
380
400
C.a
420
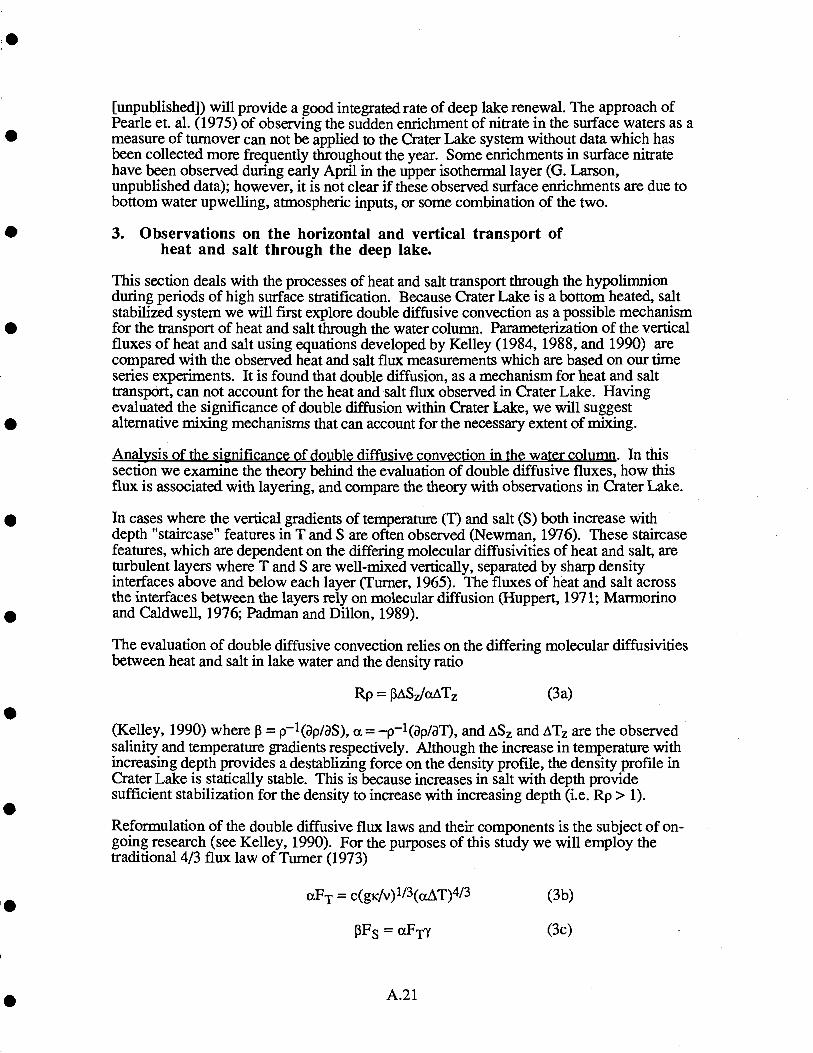
[unpublished]) will provide a good integrated rate of deep lake renewal. The approach ofPearle et. al. (1975) of observing the sudden enrichment of nitrate in the surface waters as ameasure of turnover can not be applied to the Crater Lake system without data which hasbeen collected more frequently throughout the year. Some enrichments in surface nitratehave been observed during early April in the upper isothermal layer (G. Larson,unpublished data); however, it is not clear if these observed surface enrichments are due tobottom water upweffing, atmospheric inputs, or some combination of the two.
3. Observations on the horizontal and vertical transport ofheat and salt through the deep lake.
This section deals with the processes of heat and salt transport through the hypolimnionduring periods of high surface stratification. Because Crater Lake is a bottom heated, saltstabilized system we will first explore double diffusive convection as a possible mechanismfor the transport of heat and salt through the water column. Parameterization of the verticalfluxes of heat and salt using equations developed by Kelley (1984, 1988, and 1990) arecompared with the observed heat and salt flux measurements which are based on our timeseries experiments. It is found that double diffusion, as a mechanism for heat and salttransport, can not account for the heat and salt flux observed in Crater Lake. Havingevaluated the significance of double diffusion within Crater Lake, we will suggestalternative mixing mechanisms that can account for the necessary extent of mixing.
Analysis of the significance of double diffusive convection in the water column. In thissection we examine the theory behind the evaluation of double diffusive fluxes, how thisflux is associated with layering, and compare the theory with observations in Crater Lake.
In cases where the vertical gradients of temperature (T) and salt (S) both increase withdepth "staircase" features in T and S are often observed (Newman, 1976). These staircasefeatures, which are dependent on the differing molecular diffusivities of heat and salt, areturbulent layers where T and S are well-mixed vertically, separated by sharp densityinterfaces above and below each layer (Turner, 1965). The fluxes of heat and salt acrossthe interfaces between the layers rely on molecular diffusion (Huppert, 1971; Marmorinoand Caldwell, 1976; Padman and Dillon, 1989).
The evaluation of double diffusive convection relies on the differing molecular diffusivitiesbetween heat and salt in lake water and the density ratio
Rp = !3ASz/WTz (3a)
(Kelley, 1990) where p = p-1(p/aS), a = -p-1(ap/aT), and LSZ and iT are the observedsalinity and temperature gradients respectively. Although the increase in temperature withincreasing depth provides a destablizing force on the density profile, the density profile inCrater Lake is statically stable. This is because increases in salt with depth providesufficient stabilization for the density to increase with increasing depth (i.e. Rp> 1).
Reformulation of the double diffusive flux laws and their components is the subject of on-going research (see Kelley, 1990). For the purposes of this study we will employ thetraditional 4/3 flux law of Turner (1973)
aFT = c(gi/v)1/3(cxAT)4/3 (3b)
I3FS = aFTY (3c)
A.21
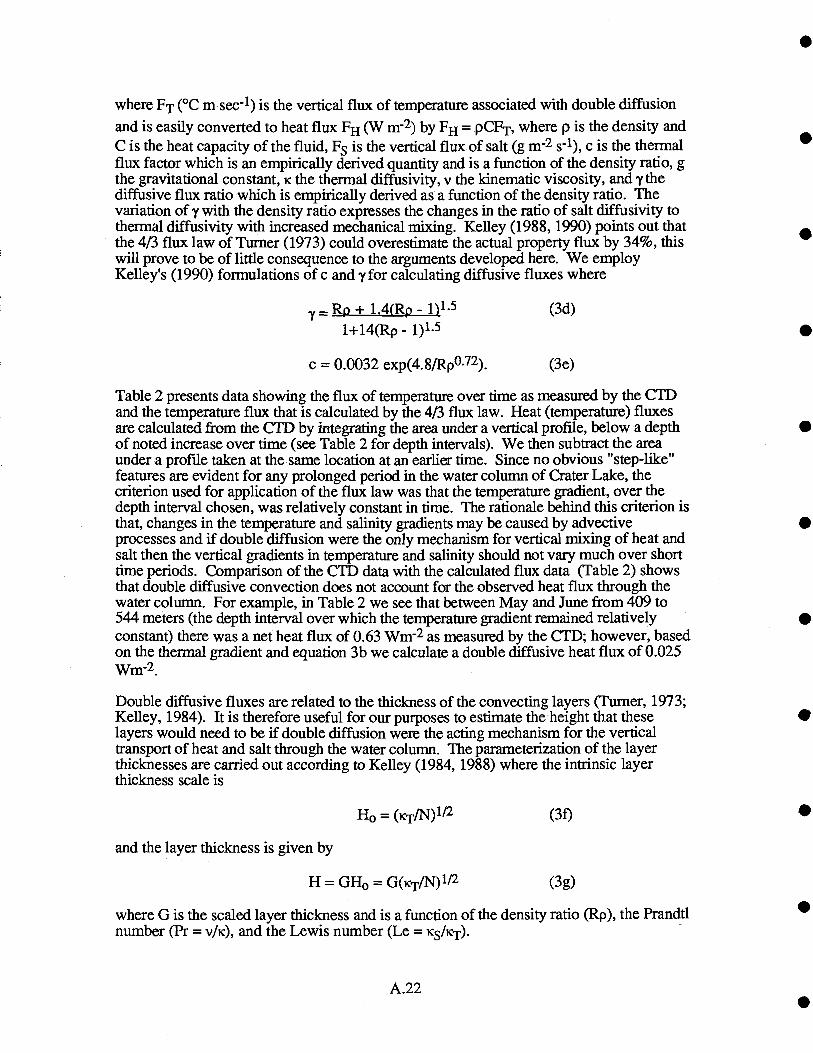
where FT (°C m sec-1) is the vertical flux of temperature associated with double diffusion
and is easily converted to heat flux FH (W rn-2) by FH = PCFT, where p is the density andC is the heat capacity of the fluid, Fs is the vertical flux of salt (g rn-2 s-1), c is the thermalflux factor which is an empirically derived quantity and is a function of the density ratio, gthe gravitational constant, i the thermal diffusivity, v the kinematic viscosity, and y thediffusive flux ratio which is empirically derived as a function of the density ratio. Thevariation of y with the density ratio expresses the changes in the ratio of salt diffusivity tothermal diffusivity with increased mechanical mixing. Kelley (1988, 1990) points out thatthe 4/3 flux law of Turner (1973) could overestimate the actual property flux by 34%, thiswill prove to be of little consequence to the arguments developed here. We employKeiley's (1990) formulations of c and y for calculating diffusive fluxes where
- Rp + l.4(Rp - iV- (3d)1+14(Rp - 1)1.5
c = 0.0032 exp(4.8/Rp072). (3e)
Table 2 presents data showing the flux of temperature over time as measured by the CTDand the temperature flux that is calculated by the 4/3 flux law. Heat (temperature) fluxesare calculated from the CTD by integrating the area under a vertical profile, below a depthof noted increase over time (see Table 2 for depth intervals). We then subtract the areaunder a profile taken at the same location at an earlier time. Since no obvious "step-like"features are evident for any prolonged period in the water column of Crater Lake, thecriterion used for application of the flux law was that the temperature gradient, over thedepth interval chosen, was relatively constant in time. The rationale behind this criterion isthat, changes in the temperature and salinity gradients may be caused by advectiveprocesses and if double diffusion were the only mechanism for vertical mixing of heat andsalt then the vertical gradients in temperature and salinity should not vary much over shorttime periods. Comparison of the CTD data with the calculated flux data (Table 2) showsthat double diffusive convection does not account for the observed heat flux through thewater column. For example, in Table 2 we see that between May and June from 409 to544 meters (the depth interval over which the temperature gradient remained relativelyconstant) there was a net heat flux of 0.63 Wm2 as measured by the CTD; however, basedon the thermal gradient and equation 3b we calculate a double diffusive heat flux of 0.025Wnr2
Double diffusive fluxes are related to the thickness of the convecting layers (Turner, 1973;Kelley, 1984). It is therefore useful for our purposes to estimate the height that theselayers would need to be if double diffusion were the acting mechanism for the verticaltransport of heat and salt through the water column. The parameterization of the layerthicknesses are carried out according to Kelley (1984, 1988) where the intrinsic layerthickness scale is
H0 = (icTfN)"2 (31)
and the layer thickness is given by
H = GH0 (3g)
where G is the scaled layer thickness and is a function of the density ratio (Rp), the Prandtlnumber (Pr = v/K), and the Lewis number (Le = s/KT).
A.22
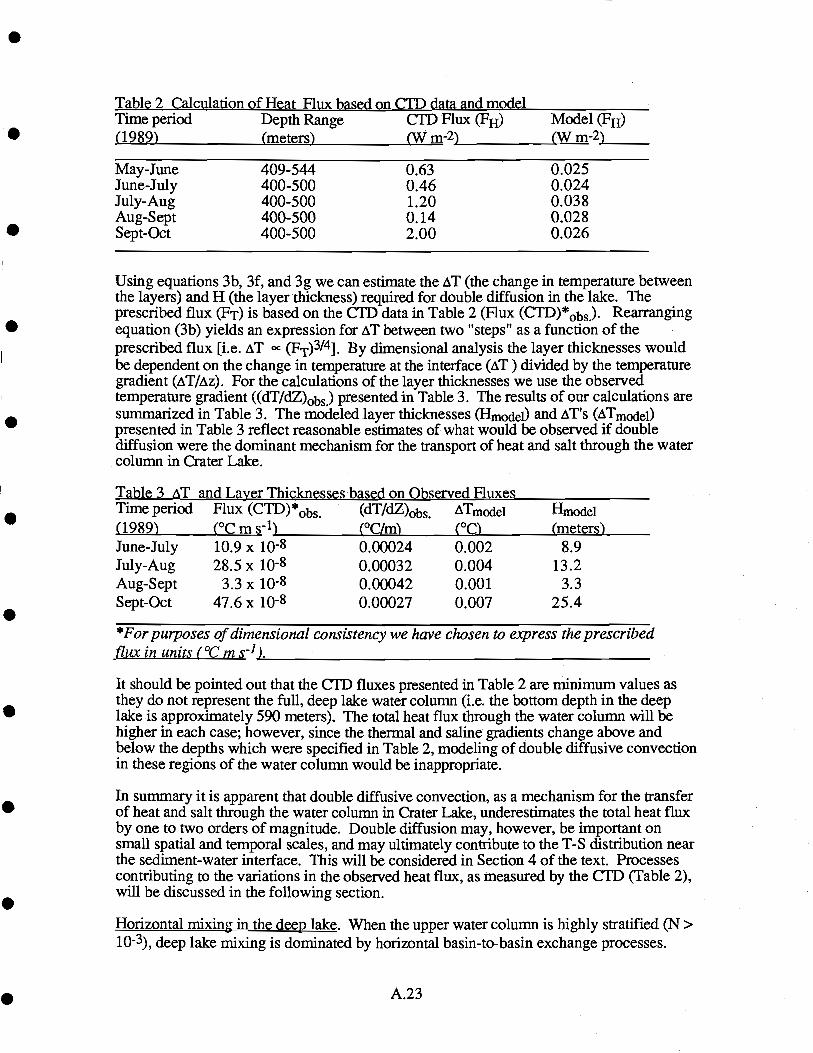
Table 2 Calculation of Heat Flux based on CTD data and model
Using equations 3b, 3f, and 3g we can estimate the AT (the change in temperature betweenthe layers) and H (the layer thickness) required for double diffusion in the lake. Theprescribed flux (F-r) is based on the CTD data in Table 2 (Flux (CTD)*obs). Rearrangingequation (3b) yields an expression for AT between two "steps" as a function of theprescribed flux [i.e. AT oc (FT)3141. By dimensional analysis the layer thicknesses wouldbe dependent on the change in temperature at the interface (AT) divided by the temperaturegradient (AT/Az). For the calculations of the layer thicknesses we use the observedtemperature gradient ((dTIdZ)obs) presented in Table 3. The results of our calculations aresummarized in Table 3. The modeled layer thicknesses (Hmodel) and AT'S (ATmodel)presented in Table 3 reflect reasonable estimates of what would be observed if doublediffusion were the dominant mechanism for the transport of heat and salt through the water
*For purposes of dimensional consistency we have chosen to express the prescribedflux in units (°C m s1).
It should be pointed out that the CTD fluxes presented in Table 2 are minimum values asthey do not represent the full, deep lake water column (i.e. the bottom depth in the deeplake is approximately 590 meters). The total heat flux through the water column will behigher in each case; however, since the thermal and saline gradients change above andbelow the depths which were specified in Table 2, modeling of double diffusive convectionin these regions of the water column would be inappropriate.
In summary it is apparent that double diffusive convection, as a mechanism for the transferof heat and salt through the water column in Crater Lake, underestimates the total heat fluxby one to two orders of magnitude. Double diffusion may, however, be important onsmall spatial and temporal scales, and may ultimately contribute to the T-S distribution nearthe sediment-water interface. This will be considered in Section 4 of the text. Processescontributing to the variations in the observed heat flux, as measured by the CTD (Table 2),will be discussed in the following section.
Horizontal mixing in the deep lake. When the upper water column is highly stratified (N>10-3), deep lake mixing is dominated by horizontal basin-to-basin exchange processes.
A.23
column in Crater Lake.
Table 3 AT and Layer Thicknesses based on Observed FluxesTime period Flux (CTD)*obs (dT/dZ)obs. ATmodel Hmodei
(1989) (°C m (°cLm) (°C) (meters)June-July 10.9 x 10⁻⁸ 0.00024 0.002 8.9July-Aug 28.5 x 10⁻⁸ 0.00032 0.004 13.2Aug-Sept 3.3 x 10⁻⁸ 0.00042 0.001 3.3Sept-Oct 47.6 x 10⁻⁸ 0.00027 0.007 25.4
Time period Depth Range CTD Flux (FH) Model (FH)
(1989) (meters) (W rn-2) (W rn-2)
May-June 409-544 0.63 0.025June-July 400-500 0.46 0.024July-Aug 400-500 1.20 0.038Aug-Sept 400-500 0.14 0.028Sept-Oct 400-500 2.00 0.026

Our data suggests that the thermally and chemically enriched fluids derived from the theSouth Basin are frequently mixed with waters from the rest of the deep lake. Data used tosupport the contention of deep lake horizontal exchange include, time series CTD data andother geochemical data (e.g. dissolved gases and trace elements).
Temperature and salinity data taken from the North Basin in September 1988 showsdramatic mid-water column microstructure variations in temperature and salinity (Figure 12a & b). We propose that these microstructure variations are due to the lateral flow of SouthBasin thermally and chemically enriched water. As the South Basin fills with warm, saltywater, it will "spill over" into the deeper portions of the lake because of its greater densityrelative to non-enriched fluids. The sill depth between these two basins is between 425 and450 meters depth. This is consistent with the data from the South Basin in that there wasthermal and saline microstructure observed at approximately 425 meters depth in this basin(Figure 12a). (The term "microst.ructure" refers to small changes in the vertical gradients oftemperature and salt.)
In order to accurately assess the stability of the deep water column in September 1988, wecomputed sigmao.5 ('o.$). Where a05 = (P0.5 - 1) x 1000 and po. is the density a fluidwould have at 500 decibars. In deep freshwater systems, sigma does not accuratelyrepresent the local "stability" of the water column (Figure 12d). Conceptually, this isbecause of the changes in the temperature of maximum density with pressure where at thesurface the Tmd is nearly 4°C in Crater Lake, whereas at 500 decibars it is less than 3°C.Most of the water throughout the water column appears to be statically stable with respectto 500 decibars (Figure 12c); however, the calculation of the stability of discrete pointswithin the water column reveals that there are some unstable parcels of water (arrows inFigure 12c). The parcels are unstable over vertical distances of 5-10 meters. These aredifficult to see with the naked eye because of the apparent scatter in the data. The dynamicnature of these parcels is further suggested by the rapid (hours-days) changes in the verticaltemperature and salinity structure of the deep lake.
222Rn and Fe (dissolved and particulate) measurements further illustrate the basin to basinexchange process as water high in 222Rn and Fe may often overlay water of lower 222Rtiand Fe content in the North Basin. Figure 13a demonstrates that the horizontal transport ofiron leads to a maximum in dissolved and particulate Fe between 450 and 500 meters in theNorth Basin. 222Rn also exhibits a deep-water maximum at 475 meters in the North Basin(Figure 13b). Although not on the graph, the deepest 222Rn value from that particularSouth Basin hydrocast was 35 dpm/100 liters. The net effect of the proposed horizontalmovement of waters from the South Basin to the North Basin is that "younger" (222Rnenriched) waters overlie the "older" (222Rn depleted) waters in the North Basin. Althoughwe do not have the time series 222p data to demonstrate it, we do not expect to alwaysobserve this pattern. As already suggested, the influx of South Basin waters to the NorthBasin is variable; therefore, sometimes a more uniform 222P distribution in the deep waterof the North Basin may exist due to the vertical mixing and decay of these South Basinwaters after transport to the North Basin.
The timing of these horizontal mixing "events" also seems to be somewhat consistent fromyear to year. Although it is clear from the data set that these events may potentially occur atany time during the year it seems that the events of greatest magnitude are consistentlyoccurring in late summer/early fall (September-October). These periods of more intensehorizontal exchange are characterized by the largest observed changes in the deep lakemicrostructure. Since September and October are periods which have strong stratificationat the surface, it would seem that surface disturbances could not supply the necessary
A.24
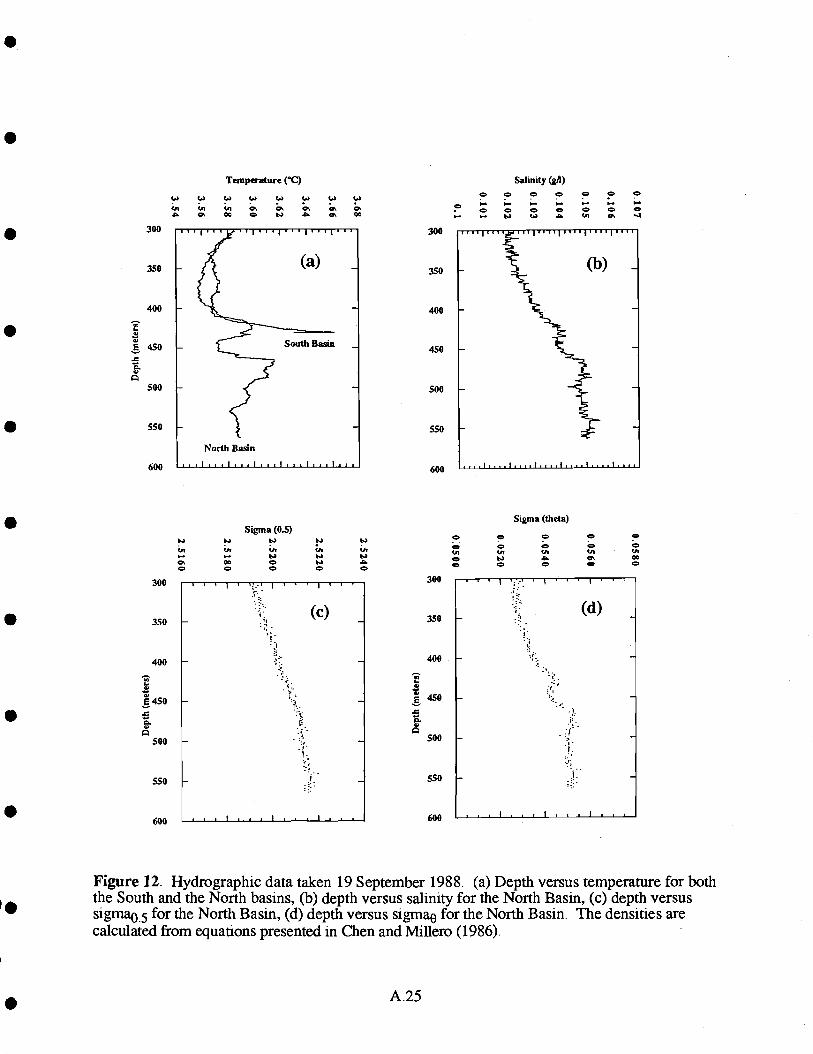
I.
B 450 -0.
00 00 00 O Os Os Os.0. C\ 00 .0. Os 00
300
350 -
400 -
500 - -
550 - -North Basin
600
(a)
South Basin -
A.25
350
450
500
550
350
400
450
500
550
600
- t. ( .0. 00 Os
Sigma (theta)
Figure 12. Hydrographic data taken 19 September 1988. (a) Depth versus temperature for boththe South and the North basins, (b) depth versus salinity for the North Basin, (c) depth versussigma05 for the North Basin, (d) depth versus sigma0 for the North Basin. The densities arecalculated from equations presented in Chen and Millero (1986).
000%.0.0
00U.000
Temperature (°C) Salinity (g/l)o m
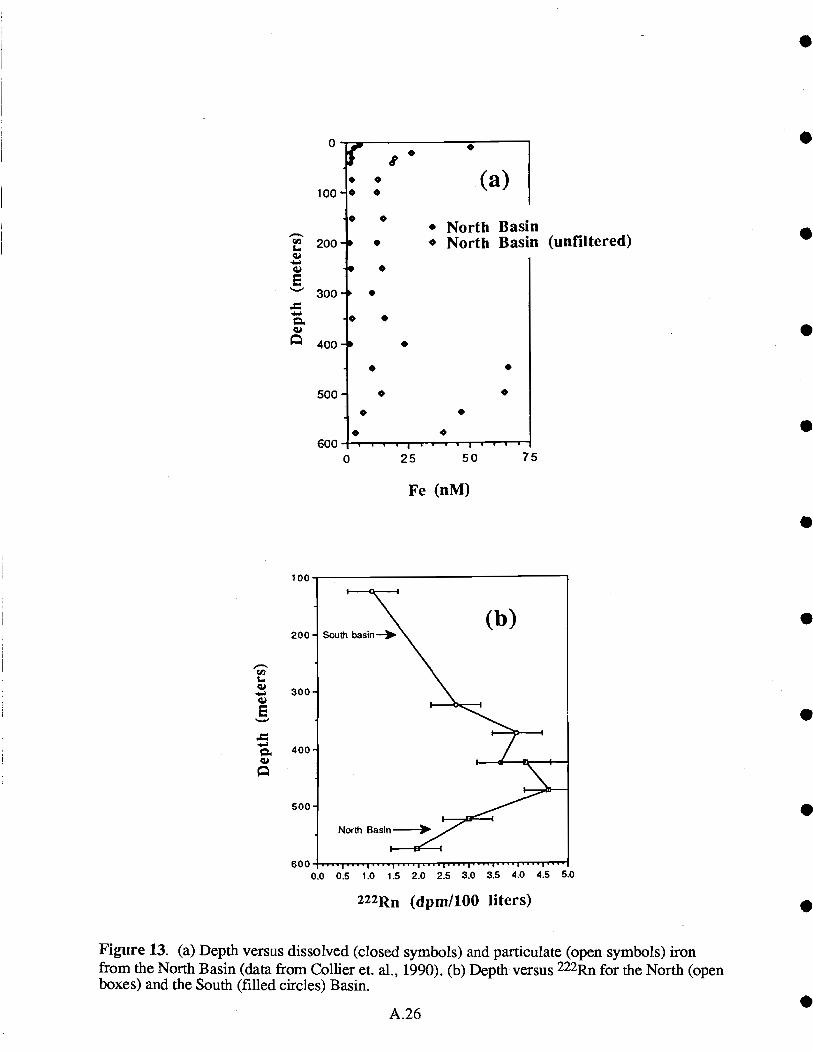
100
200-
300-
400
500-
.25
A.26
Fe (nM)
0
'0
50
North BasinNorth Basin (unfiltered)
75
0.0 0.5 1.0 1.5 2.0 2.5 3.0 3.5 4.0 4.5 50
222Rn (dpm/100 liters)
Figure 13. (a) Depth versus dissolved (closed symbols) and particulate (open symbols) ironfrom the North Basin (data from Collier et. al., 1990). (b) Depth versus 222Rn for the North (openboxes) and the South (filled circles) Basin.
1...
C.
100
200
300
400
500
00
0
0
0
0
.0
forcing for the initiation of this mixing process. We suggest that once the enriched water inthe South Basin reaches a depth where inter-basin exchange may occur (approximately425-450 meters) the South Basin enriched waters may, in effect, "spill over" into the NorthBasin. To demonstrate the plausibility of this process we take an average inflow of fluid,with a salinity of 0.6 grams/kg, of 0.2 m3/second (Table 1). This fluid is diluted manytimes with background lake water, which has a salinity of 0.104 grams/kg, to make SouthBasin bottom water which has a salinity of 0.106 grams/kg. This yields a net inflow rateof 50 m3/second for a fluid containing 0.106 grams/kg of salt. If we suppose that theSouth Basin can be represented by a box with the dimensions of l000m x 2000m x 50mdeep then it takes approximately 23 days for the enriched fluid to fill this box. This rathersimple representation of the process simply demonstrates that, given our cunent knowledgeof inflow and salt distribution, frequent "spillovers" are possible and are even likely.
The basin to basin exchange process proposed here is not a steady state process and one ofthe results of this non-steady state horizontal exchange of heat and salt is that there arenoticeable variations in the heat flux estimates over short time scales (Table 2).
Vertical mixing processes in the deep lake. In addition to horizontal advection playing alarge role in the transport of heat and salt through the deep lake, additional mechanisms alsocontribute to the vertical transport of these properties through the hypolimnion. Wepropose that turbulent diffusion coupled with vertical convection are likely contributingmechanisms for heat and salt transport through the hypolimnion, and we base thishypothesis on two observations: (1) since the calculated effective diffusivities for both heatand salt in Crater Lake are the same order of magnitude and are many orders of magnitudelarger than the molecular values, the mixing process can not simply be driven by moleculardiffusion (or double diffusion) (2) there axe small-scale vertical instabilities in the watercolumn which do not appear to be due to the horizontal transport of heat and salt.
The effective diffusivities for heat (KCT) and salt (K) can be modeled according to asimple diffusion model (see equations 2a and 2b for the development)
FT = KeT (dT/dz) (3h)
and
= K (dS/dz) (3i)
where FT and F are the measured flux of temperature (°C m s1) and salt (g mkg' s)respectively (for dimensional simplicity we use FT as opposed to FH -- the heat flux).These measurements are again based on time series CTD measurements (Table 1). Ourcalculations reveal that the effective diffusivities for heat and salt are approximately 6 to8 x l0 m2 s-i. If molecular diffusion was an important mechanism for the transport ofheat and salt through the water column, we would expect that the effective diffusivity forheat would be two orders of magnitude larger than the effective diffusivity for salt (e.g.molecular diffusivities for heat and salt are 0(10-7 m2 s-i) and 0(10-p m2 s-I) respectively).This effective diffusion coefficient is approximately a factor of two smaller than thediffusion coefficient calculated for diffusion during the month of February 2 x 10 m2 s
This observation suggests that the intensity of deep lake mixing during winter is greaterthan during the summer, which is not surprising since the overall stability of the upperwater column is greater during the summer. However, both winter and summer diffusionprocesses will obviously be smaller in magnitude than the instability-driven convectiondescribed in Section 2.
A.27
Observations of small temperature inversions through the mid-water column suggest thepresence of small, upwardly moving convective "plumes". Examples of potentialconvective cells are presented in Figure 14 where the unstable plumes are indicated by thearrows. In Figure 14 we only show the temperature profile, because the salinity profilelacks the resolution of the temperature profile. We therefore can not accurately calculatethe stability of these thermal features; however, our data suggest that they are transientfeatures which are not uncommon in the mid-to-deep lake. These "plumes" could becaused by either of two processes (or some combination of the two). The plumes may becaused by direct inputs of buoyant water into the South Basin. Alternatively, they may begenerated by conductive heating of thermally and chemically enriched waters which areresting at the sediment-water interface. This latter process would eventually lead toinstability and formation of thermal convection cells that vertically mix the excess heat andsalt.
As discussed in the previous section, the horizontal transport of fluids with anomalous heatand salt content, followed by their sinking or their buoyant rise through the water column,is also important to the vertical mixing of these properties in the hypolimnion. However,the magnitude of this two-dimensional process is not constant in time, which leads tovarying fluxes of heat and salt through the water column.
Another dimension of mixing heat and salt through the water column, is presented as alarge temperature anomaly in the middle of the water column (Figure 15a). Thistemperature anomaly was measured in the South Basin of Crater Lake on 11 September1987 and is greater than 0.1°C between 225 and 275 meters, relative to the North Basinprofile. This corresponds to a total heat anomaly of 9600 kcallm2, which is a factor of fiveto ten larger than typical near bottom thermal anomalies measured in the South Basin ascompared to the North Basin (McManus and Collier, unpublished data). Shown with thisdata (Figure 15a) are temperature profiles taken from the South Basin approximately 6hours earlier (solid line) and the North Basin approximately 3 hours earlier (dotted line).The earlier South Basin profile was taken in the same general location of the South Basin asthe profile showing the dramatic temperature anomaly (dashed line); however, there issome uncertainty as to the relative location of the two South Basin temperature profiles andthey may be separated in space by as much as 500-1000 meters. T-S diagrams (Figure15b) of the three hydrocasts (below 100 meters) demonstrate the dramatic change in the T-S characteristics in the hydrocast with the large thermal anomaly (SBEO28) as compared tothe earlier South Basin diagram (SBEO26) and the North Basin diagram (SBEO27).However, the T-S diagrams of SBEO26 and SBEO27 both show some influence of thewarmer, more saline water found in SBEO28, suggesting that the heat and salt fromSBEO28 may be spreading horizontally along an isopycnal surface.
The large thermal anomaly demonstrated in Figure 15a is hydrostatically stable with respectto 250 decibars and is buoyant relative to 450 decibars. This suggests that perhaps thewater column anomaly represents a "plume" which originated at the sediment-waterinterface and has risen to neutral buoyancy. Alternatively, there could be a source ofthermally and chemically enriched water along the caldera wall at this depth, which weconsider to be unlikely. It is apparent that this feature is anomalous in both time and space,and since we have not seen such an anomaly again it is difficult to ascertain the origin orsignificance of this feature.
In summary, the one dimensional calculation of an "effective" turbulent diffusioncoefficient shows that the transport of heat and salt through the water column is severalorders of magnitude faster than would be expected by molecular diffusion. The turbulentdiffusion coefficient calculated here does not discriminate between the variety of
A.28
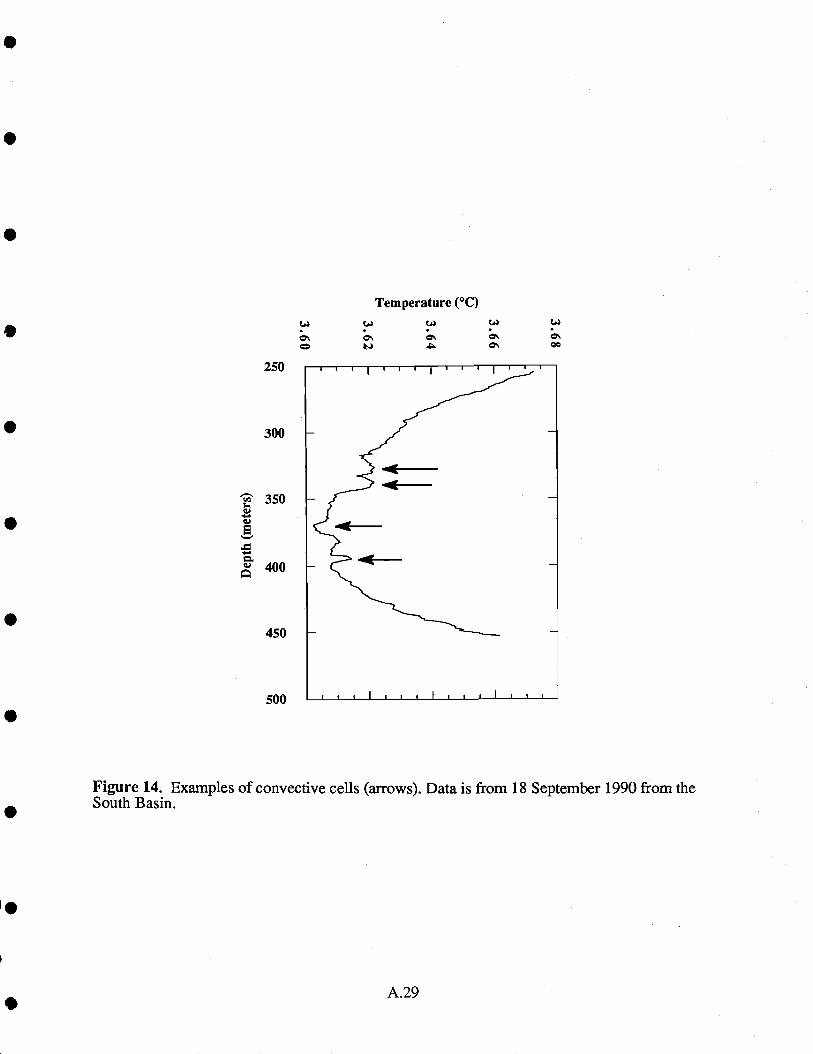
250
. 300
350
400
.450
500S
Temperature (°C)
t)
Figure 14. Examples of convective cells (arrows). Data is from 18 September 1990 from theSouth Basin.
A.29
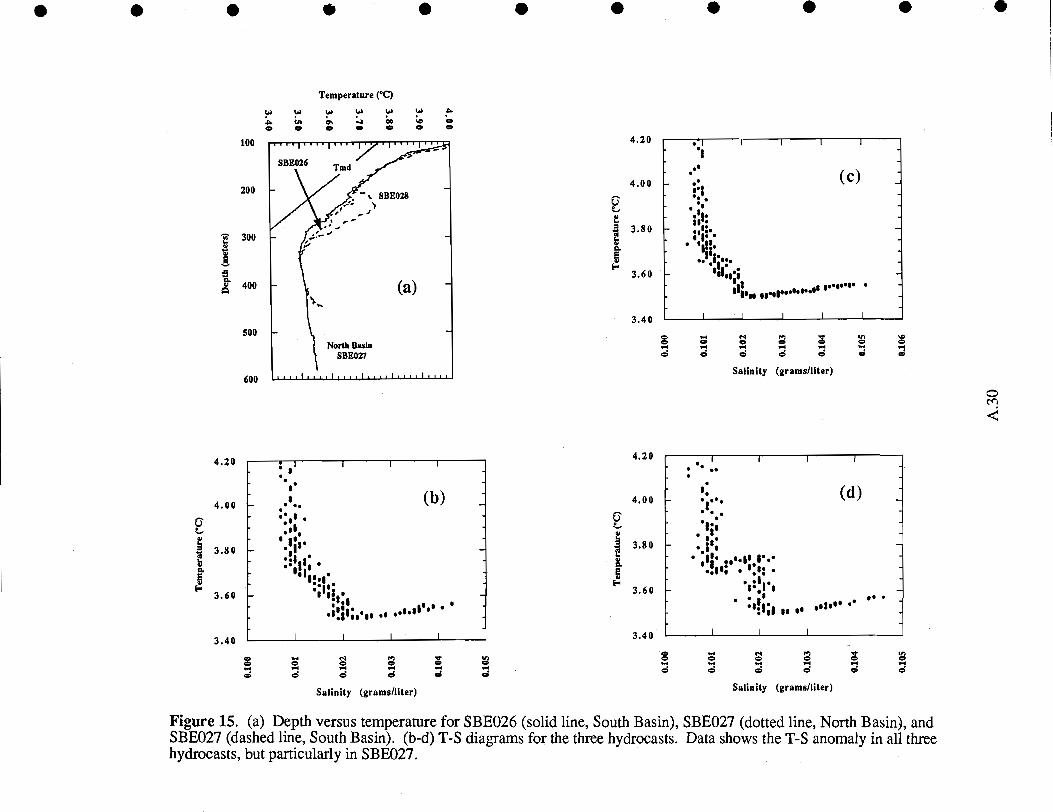
I
300
0
400
4.20
4.00
3.80
3.60
3.40
100
200
500
600
Temperature (°C)
th % - 500 0 0 0 04.20
4.00
3.40
(c)S.;
..$I.-
I.I.. S I..'I.
'$1.11
:',.,, ..,........ S
0 0- -Salinity (grams/liter)
- .-d0
-I0
'I:. $.e'II.
.I$
oil,.'.*
I
(b)
I. .,.IlIs0 S
I I
I-
4.00
3.80
3.60
3.40
0
4.20 I
.
- eIII::;
IS.- .pS. l.
;sl .I
(d)
I..I
00 d
-00
00
0
0 -0- 0_4
0 0
Salinity (grams/liter) Salinity (grams/liter)
Figure 15. (a) Depth versus temperature for SBEO26 (solid line, South Basin), SBEO27 (dotted line, North Basin), andSBEO27 (dashed line, South Basin). (b-d) T-S diagrams for the three hydrocasts. Data shows the T-S anomaly in all threehydrocasts, but particularly in SBEO27.
I.
3.80
3.60
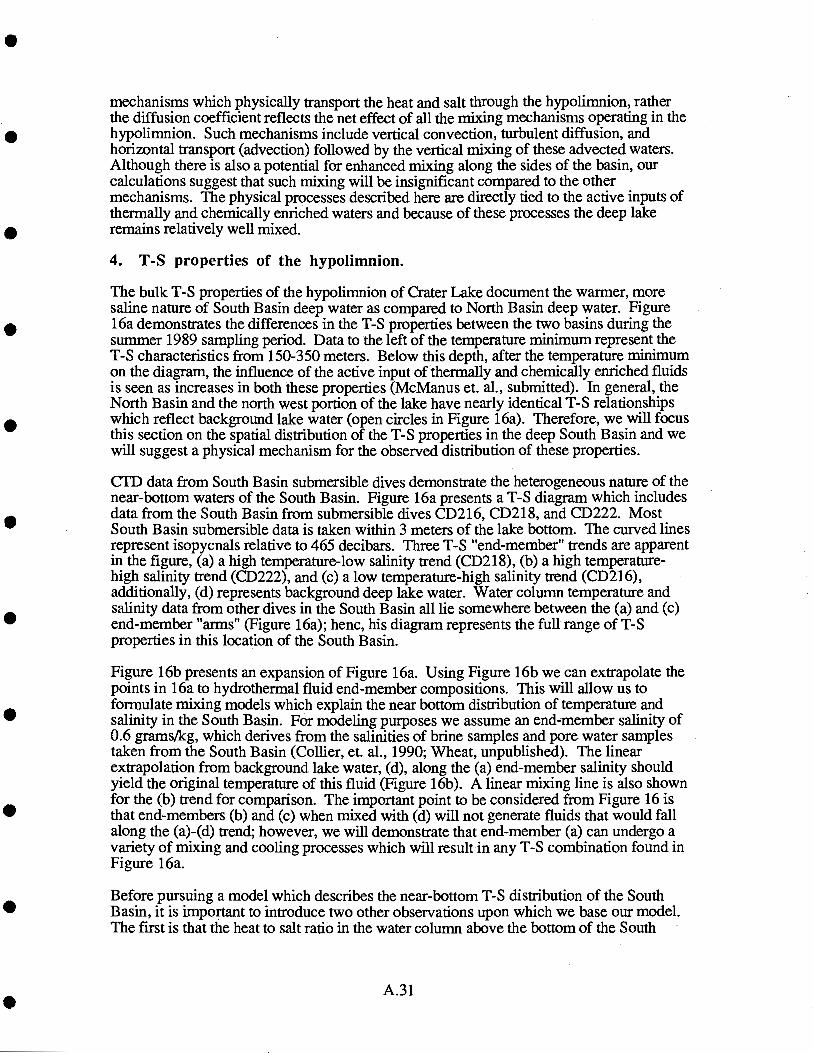
mechanisms which physically transport the heat and salt through the hypolimnion, ratherthe diffusion coefficient reflects the net effect of all the mixing mechanisms operating in thehypolimnion. Such mechanisms include vertical convection, turbulent diffusion, andhorizontal transport (advection) followed by the vertical mixing of these advected waters.Although there is also a potential for enhanced mixing along the sides of the basin, ourcalculations suggest that such mixing wifi be insignificant compared to the othermechanisms. The physical processes described here are directly tied to the active inputs ofthermally and chemically enriched waters and because of these processes the deep lakeremains relatively well mixed.
4. T-S properties of the hypolimnion.
The bulk T-S properties of the hypolimnion of Crater Lake document the warmer, moresaline nature of South Basin deep water as compared to North Basin deep water. Figure16a demonstrates the differences in the T-S properties between the two basins during thesummer 1989 sampling period. Data to the left of the temperature minimum represent theT-S characteristics from 150-350 meters. Below this depth, after the temperature minimumon the diagram, the influence of the active input of thermally and chemically enriched fluidsis seen as increases in both these properties (McManus et. al., submitted). In general, theNorth Basin and the north west portion of the lake have nearly identical T-S relationshipswhich reflect background lake water (open circles in Figure 16a). Therefore, we will focusthis section on the spatial distribution of the T-S properties in the deep South Basin and wewifi suggest a physical mechanism for the observed distribution of these properties.
Cli) data from South Basin submersible dives demonstrate the heterogeneous nature of thenear-bottom waters of the South Basin. Figure 16a presents a T-S diagram which includes. data from the South Basin from submersible dives CD216, CD218, and CD222. MostSouth Basin submersible data is taken within 3 meters of the lake bottom. The curved linesrepresent isopycnals relative to 465 decibars. Three T-S "end-member" trends are apparentin the figure, (a) a high temperature-low salinity trend (CD218), (b) a high temperature-high salinity trend (CD222), and (c) a low temperature-high salinity trend (CD216),additionally, (d) represents background deep lake water. Water column temperature andsalinity data from other dives in the South Basin all lie somewhere between the (a) and (c)end-member "arms" (Figure 16a); henc, his diagram represents the full range of T-Sproperties in this location of the South Basin.
Figure 16b presents an expansion of Figure 16a. Using Figure 16b we can extrapolate thepoints in 16a to hydrothermal fluid end-member compositions. This will allow us toformulate mixing models which explain the near bottom distribution of temperature andsalinity in the South Basin. For modeling purposes we assume an end-member salinity of0.6 grams/kg, which derives from the salinities of brine samples and pore water samplestaken from the South Basin (Collier, et. aL, 1990; Wheat, unpublished). The linearextrapolation from background lake water, (d), along the (a) end-member salinity shouldyield the original temperature of this fluid (Figure 16b). A linear mixing line is also shownfor the (b) trend for comparison. The important point to be considered from Figure 16 isthat end-members (b) and (c) when mixed with (d) wifi not generate fluids that would fallalong the (a)-(d) trend; however, we will demonstrate that end-member (a) can undergo avariety of mixing and cooling processes which will result in any T-S combination found inFigure 16a.
Before pursuing a model which describes the near-bottom T-S distribution of the SouthBasin, it is important to introduce two other observations upon which we base our model.The first is that the heat to salt ratio in the water column above the bottom of the South
A.31

Salinity (grams/liter)
A.32
Figure 16. (a) T-S diagram of the hypolimnion of Crater Lake showing four T-S extremes: highheat to salt ratio; low heat to salt ratio, intermediate heat to salt ratio; background lake water. Thelettering in the figure corresponds to the various heat to salt ratios. The open circles represent CTDhydrocast data taken from the North Basin. All the other symbols represent Cli) data taken fromsubmersible dives in the South Basin as described in the text. (b) Extrapolations of points in (a) toa salinity of 0.6 grams/kg.
25
20
015I-
I-
E
5
0
1.00.0 0.20 0.40 0.60 0.80Salinity (grams/kg)
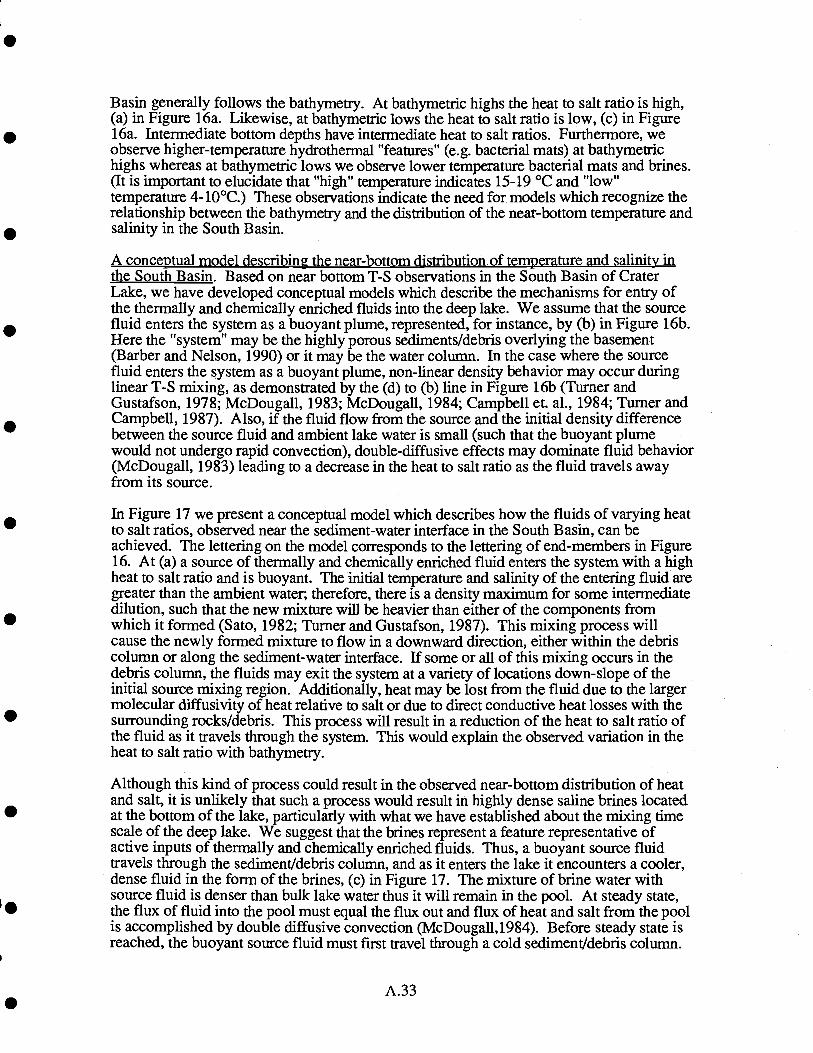
Basin generally follows the bathymetiy. At bathymetric highs the heat to salt ratio is high,(a) in Figure 16a. Likewise, at bathymetric lows the heat to salt ratio is low, (c) in Figure16a. Intermediate bottom depths have intermediate heat to salt ratios. Furthermore, weobserve higher-temperature hydrothermal "features" (e.g. bacterial mats) at bathymetrichighs whereas at bathymetric lows we observe lower temperature bacterial mats and brines.(It is important to elucidate that "high" temperature indicates 15-19 °C and "low"temperature 4-10°C.) These observations indicate the need for models which recognize therelationship between the bathymetry and the distribution of the near-bottom temperature andsalinity in the South Basin.
A conceptual model describing the near-bottom distribution of temperature and salinity inthe South Basin. Based on near bottom T-S observations in the South Basin of CraterLake, we have developed conceptual models which describe the mechanisms for entry ofthe thermally and chemically enriched fluids into the deep lake. We assume that the sourcefluid enters the system as a buoyant plume, represented, for instance, by (b) in Figure 16b.Here the "system" may be the highly porous sediments/debris overlying the basement(Barber and Nelson, 1990) or it may be the water column. In the case where the sourcefluid enters the system as a buoyant plume, non-linear density behavior may occur duringlinear T-S mixing, as demonstrated by the (d) to (b) line in Figure 16b (Turner andGustafson, 1978; McDougall, 1983; McDougall, 1984; Campbell et. al., 1984; Turner andCampbell, 1987). Also, if the fluid flow from the source and the initial density differencebetween the source fluid and ambient lake water is small (such that the buoyant plumewould not undergo rapid convection), double-diffusive effects may dominate fluid behavior(McDougall, 1983) leading to a decrease in the heat to salt ratio as the fluid travels awayfrom its source.
In Figure 17 we present a conceptual model which describes how the fluids of varying heatto salt ratios, observed near the sediment-water interface in the South Basin, can beachieved. The lettering on the model corresponds to the lettering of end-members in Figure16. At (a) a source of thermally and chemically enriched fluid enters the system with a highheat to salt ratio and is buoyant. The initial temperature and salinity of the entering fluid aregreater than the ambient water; therefore, there is a density maximum for some intermediatedilution, such that the new mixture will be heavier than either of the components fromwhich it formed (Sato, 1982; Turner and Gustafson, 1987). This mixing process willcause the newly formed mixture to flow in a downward direction, either within the debriscolumn or along the sediment-water interface, if some or all of this mixing occurs in thedebris column, the fluids may exit the system at a variety of locations down-slope of theinitial source mixing region. Additionally, heat may be lost from the fluid due to the largermolecular diffusivity of heat relative to salt or due to direct conductive heat losses with thesurrounding rocks/debris. This process will result in a reduction of the heat to salt ratio ofthe fluid as it travels through the system. This would explain the observed variation in theheat to salt ratio with bathymetry.
Although this kind of process could result in the observed near-bottom distribution of heatand salt, it is unlikely that such a process would result in highly dense saline brines locatedat the bottom of the lake, particularly with what we have established about the mixing timescale of the deep lake. We suggest that the brines represent a feature representative ofactive inputs of thermally and chemically enriched fluids. Thus, a buoyant source fluidtravels through the sediment/debris column, and as it enters the lake it encounters a cooler,dense fluid in the form of the brines, (c) in Figure 17. The mixture of brine water withsource fluid is denser than bulk lake water thus it will remain in the pool. At steady state,the flux of fluid into the pool must equal the flux out and flux of heat and salt from the poolis accomplished by double diffusive convection (McDougall,1984). Before steady state isreached, the buoyant source fluid must first travel through a cold sediment/debris column.
A.33
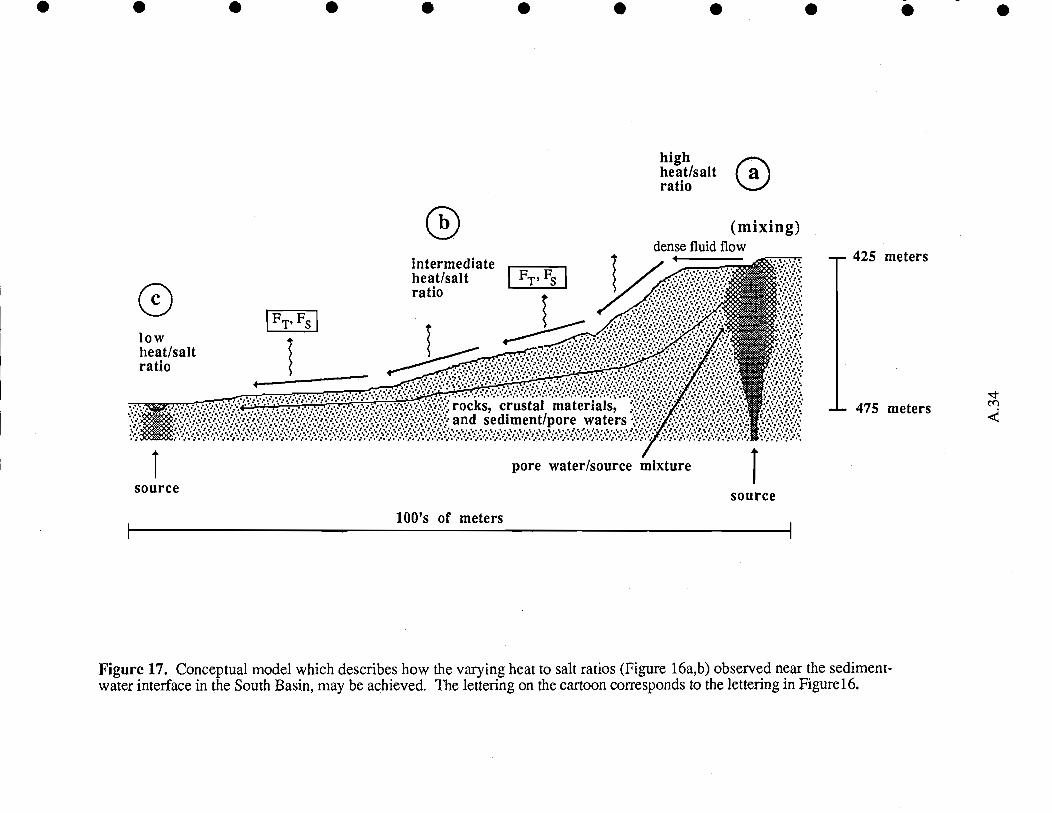
lowheat/saltratio
FT, Fs
intermediateheat/saltratio
[FT FsI
rocks, crustal materials,and sediment/pore waters
pore water/source mixturesource source
100's of meters
highheat/saltratio
(mixing)dense fluid flow
425 meters
- 475 meters
Figure 17. Conceptual model which describes how the varying heat to salt ratios (Figure 16a,b) observed near the sediment-water interface in the South Basin, may be achieved. The lettering on the cartoon corresponds to the lettering in Figurel6.
The fluid will loose heat by conduction with the surrounding debris during its buoyantphase and by the time the fluid reaches the sediment-water interface it is no longer buoyantand therefore "ponds" along the bottom of the lake (McDougall, 1984).
If preferential loss of heat over salt is occurring somewhere within the system, then wewould expect to find curved T-S profiles as opposed to lines in T and S (Ingham, 1966;Schmitt, 1981; McDougall, 1983). In Figure 16a we note that the T-S trend from (d) to (c)is a curve rather than a line which suggests that the water in this region has undergonedouble diffusive loss of heat. In contrast, the data that extends to (a) in Figure 16a appearsto fall along a line rather than a curve, indicating that linear mixing is occurring in this areaof the South Basin. Because the scales of mixing (Section 3) suggest that double-diffusiveconvection is not a dominant mechanism for the redistribution of heat and salt in the bulkwater column, we expect that the affects of any double diffusive convection on the overallT-S properties of the hypolimnion of Crater Lake will be confined to these small or localscales. It should also be pointed out that although curvature in the T-S relationships maybe indicative of multiple sources of varing composition, we have no physical or chemicalevidence that this may be the case.
Another mechanism for changing the heat to salt ratio of near bottom waters is throughreactions within the sediments. This would tend to change the heat to salt ratio byincreasing the salinty of the pore fluids. However, our observations indicate that there areno systematic changes in fluid chemistry throughout the system. In general, changes influid composition are primarily due to dilution with lake water and not reaction.
In this section, we have attempted to describe the likely processes which govern the near-bottom distribution of temperature and salinity, additionally, we have postulated amechanism whereby dense saline pools can be maintained on the floor of the lake. Ourproposed mechanisms rely on the non-linear density behavior of fluids during linear T-Smixing and on the preferential loss of heat from a fluid due to the larger moleculardiffusivity of heat over salt [0(102)1 and due to conductive losses of heat with thesurrounding rock/debris. In order to better elucidate the physical mechanisms influencingthe T-S distribution, we would need more extensive pore water chemistry and temperaturedata from the sediments and other hydrothermal features.
5. The influence of hydrothermal activity on the physics of the watercolumn in Crater Lake.
The hypolimnion of Crater Lake is only marginally stable. This is reflected by thebuoyancy frequency (N), which for the hypolimnion of Crater Lake is 0(10 second-1)(Collier et. al., 1990; McManus, et. al., submitted). Correspondingly, the turbulentdiffusion coefficient ranges between iO-4 and iO3 m2/sec, which reflects relatively rapidvertical exchange through the the deep lake. The question is then, if there were not activeinputs of heat and salt into the hypolimnion what would be the scales of mixing? Withoutthe input of heat into the hypolimnion there would be no destabilizing force acting on thewater column. The addition of salt to the hypolimnion through the reminerialization ofbiogenic materials in the deep lake would tend to stabilize the deep water column; therefore,we might expect the magnitude of the diffusion coefficients to decrease. Alternatively, ifCrater Lake were conductively heated from the bottom (due to the fact that it rests in acaldera) yet there were no fluid inputs, we might expect the lake to undergo thermalconvection which would result in a more rapid mixing time scale.
The overall stability of the water column also has some influence on the effectiveness of theconditional convective overturn described in Section 2. If the change in the salinity
A.35

gradient were to be dominated only by reminerialization, it may, in principle, be easier todevelop the thermobaric instabilities due to a reduced salinity gradient. Hence, the surfacesignal carried by this mixing process could be carried all the way to the bottom as in LakeBaikal (Carmack et. al, 1989; Weiss et. al, 1991); however, because of the conditionalnature of the instability, it is likely that annual exchange would rely much more heavily onthe severity of winter storms, as in Lake Tahoe (Pearl, et. al., 1975). Also because of therelatively small fetch of the lake, wind forcing may be relatively less significant and wifimake this kind of mixing more difficult.
It is difficult to ascertain the precise effect of hydrothermal activity on the overall physics ofCrater Lake; however, there are a variety of unique physical features of the water columnwhich can only be attributed to the active input of heat and salt near the bottom of the lake.It is clear that the active inputs of hydrothermal fluids generate both vertical and horizontaldensity instabilities. These instabilities contribute to the rapid mixing of deep lake water,both horizontally and vertically. It follows then, that hydrothermal activity is important tothe relatively rapid vertical mixing that occurs in Crater Lake, OR (characteristic time-scaleof mixing 2 years). This mixing brings biologically important nutrients from the deeplake to the surface lake at least once a year. Without such nutrients, principally dissolvednitrate, the new production which relies on these nutrients would be lower.
Conclusions
Our estimations of the deep lake heat budget of Crater Lake confirms the previous estimatesof Williams and Von Herzen (1983). Since our method for estimating heat flow differsfrom that of Williams and Von Herzen (1983), who used sediment heat flowmeasurements, the agreement between the two data sets lends credence to both estimates.The salt flux and fluid flow estimates offer additional constraints on these estimates whichwere first proposed by Reilley (1990) and Nathenson (1990).
Time series dissolved oxygen data, data from a thermistor chain mooring, and CTD data allindicate that annual surface to bottom exchange is an important mechanism for theredistribution of heat and salt in the hypolimnion of Crater Lake. Our data also indicate thatthis exchange process is incomplete, resulting in undersaturation of dissolved oxygen at alltimes in the hypolimnion.
During periods of high surface stratification, deep lake mixing is dominated by small-scalevertical and horizontal exchange processes. Our data suggests that vertical convection is amechanism for the transport of heat and salt through the hypolimnion; however, the relativeimportance of this type of mixing process is not clear. Calculation of a turbulent diffusioncoefficient for heat and salt confirms that the mixing mechanisms which transport the bulkof the heat and salt through the hypolimnion are turbulent as opposed to molecular. Thediffusion coefficient will allow us to model the transport of biochemically importantnutrients/elements during periods of high surface stratification. Horizontal exchangeprocesses allow the thermally and chemically enriched fluids from the South Basin to bemixed with the deep water from the rest of the lake. The varying fluxes of heat and salt, asdeduced from Cii) data, suggest that the mixing processes acting in the hypolimnion arenon-steady state.
The T-S properties of the hypolimnion reveal that the waters in the South Basin are warmerand saltier than those in the rest of the hypolimnion. Three T-S end-member fluids areapparent in the South Basin of Crater Lake. (1) Background deep lake water which issimilar to deep water found elsewhere in the lake. (2) Water of high heat to salt ratio. (3)Water of low heat to salt ratio. We hypothesize that the formation and mixing of these threeend-members is due to the buoyant rise of the thermally and chemically enriched fluids
A.36
through the debris/sediment column, mixing of these fluids with pore fluids, followed bymolecular diffusion above and/or below the sediment-water interface, and finally advectiveprocesses once the fluid enters the water column The preferential loss of heat over saltthrough thermal diffusion and/or conductive heat loss allows for the formation of waterswith varying heat to salt ratios. Subsequent advective transport through the water colunmallows for the mixing of these waters with waters from the rest of the lake.
I.
A.37
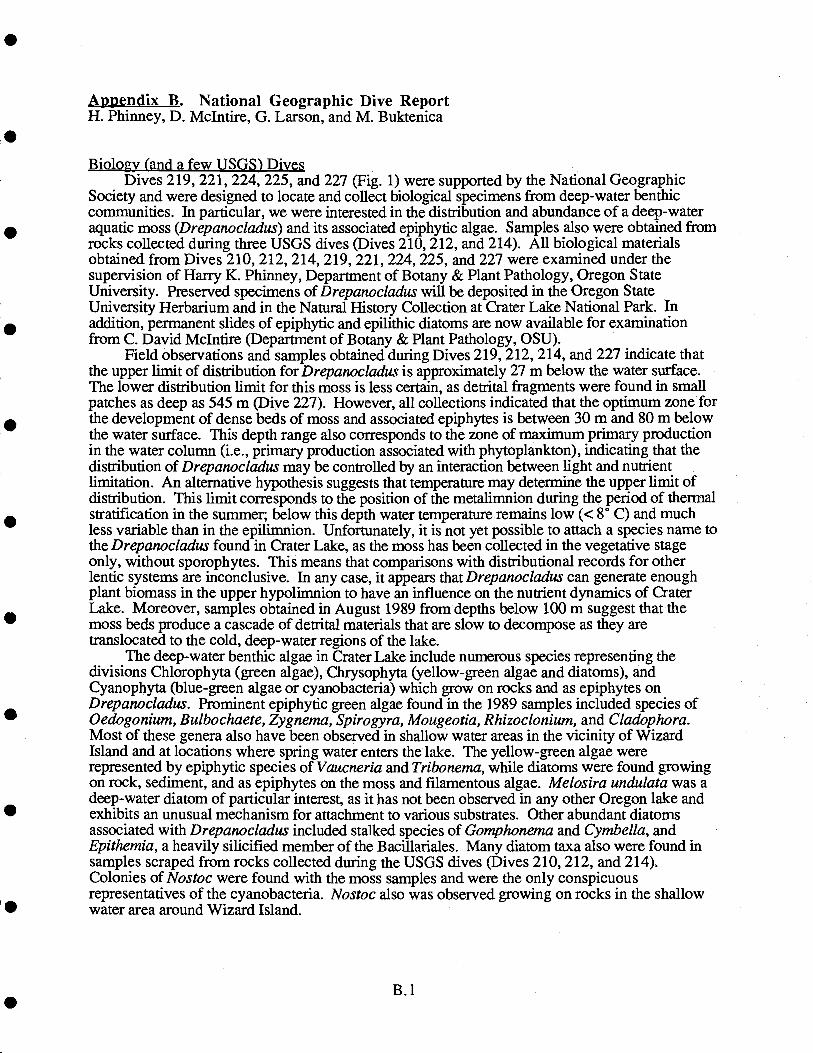
Appendix B. National Geographic Dive ReportH. Phinney, D. Mclntire, G. Larson, and M. Buktenica
Biology (and a few USGS') DivesDives 219,221, 224, 225, and 227 (Fig. 1) were supported by the National Geographic
Society and were designed to locate and collect biological specimens from deep-water benthiccommunities. In particular, we were interested in the distribution and abundance of a deep-wateraquatic moss (Drepanocladus) and its associated epiphytic algae. Samples also were obtained fromrocks collected during three USGS dives (Dives 210,212, and 214). All biological materialsobtained from Dives 210,212, 214, 219, 221, 224, 225, and 227 were examined under thesupervision of Harry K. Phinney, Department of Botany & Plant Pathology, Oregon StateUniversity. Preserved specimens of Drepanocladus will be deposited in the Oregon StateUniversity Herbarium and in the Natural History Collection at Crater Lake National Park. Inaddition, permanent slides of epiphytic and epilithic diatoms are now available for examinationfrom C. David Mclntire (Department of Botany & Plant Pathology, OSU).
Field observations and samples obtained during Dives 219, 212, 214, and 227 indicate thatthe upper limit of distribution for Drepanocladus is approximately 27 m below the water surface.The lower distribution limit for this moss is less certain, as detrital fragments were found in smallpatches as deep as 545 m (Dive 227). However, all collections indicated that the optimum zone forthe development of dense beds of moss and associated epiphytes is between 30 m and 80 m belowthe water surface. This depth range also corresponds to the zone of maximum primary productionin the water column (i.e., primary production associated with phytoplankton), indicating that thedistribution of Drepanocladus may be controlled by an interaction between light and nutrientlimitation. An alternative hypothesis suggests that temperature may determine the upper limit ofdistribution. This limit corresponds to the position of the metalimnion during the period of thermalstratification in the summer, below this depth water temperature remains low (<8° C) and muchless variable than in the epilimnion. Unfortunately, it is not yet possible to attach a species name tothe Drepanocladus found in Crater Lake, as the moss has been collected in the vegetative stageonly, without sporophytes. This means that comparisons with distributional records for otherlentic systems are inconclusive. In any case, it appears that Drepanocladus can generate enoughplant biomass in the upper hypolimnion to have an influence on the nutrient dynamics of CraterLake. Moreover, samples obtained in August 1989 from depths below 100 m suggest that themoss beds produce a cascade of detrital materials that are slow to decompose as they aretranslocated to the cold, deep-water regions of the lake.
The deep-water benthic algae in Crater Lake include numerous species representing thedivisions Chlorophyta (green algae), Chrysophyta (yellow-green algae and diatoms), andCyanophyta (blue-green algae or cyanobacteria) which grow on rocks and as epiphytes onDrepanocladus. Prominent epiphytic green algae found in the 1989 samples included species ofOedogonium, Bulbochaete, Zygnema, Spiro gyra, Mougeotia, Rhizocloniu,n, and Cladophora.Most of these genera also have been observed in shallow water areas in the vicinity of WizardIsland and at locations where spring water enters the lake. The yellow-green algae wererepresented by epiphytic species of Vaucnerja and Tribonerna, while diatoms were found growingon rock, sediment, and as epiphytes on the moss and filamentous algae. Melosira undulata was adeep-water diatom of particular interest, as it has not been observed in any other Oregon lake andexhibits an unusual mechanism for attachment to various substrates. Other abundant diatomsassociated with Drepanocladus included stalked species of Gomphonema and Cymbella, andEpithemia, a heavily silicified member of the Bacilariales. Many diatom taxa also were found insamples scraped from rocks collected during the USGS dives (Dives 210,212, and 214).Colonies of Nostoc were found with the moss samples and were the only conspicuousrepresentatives of the cyanobacteria. Nostoc also was observed growing on rocks in the shallowwater area around Wizard Island.
B.l
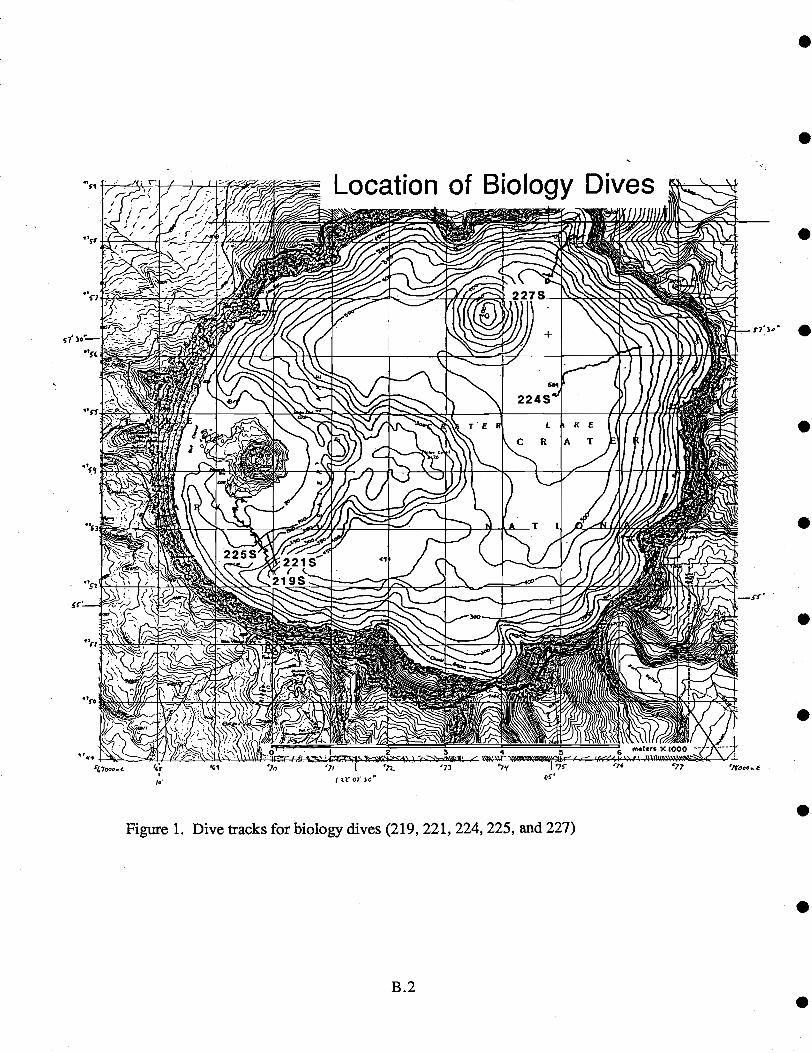
Appendix C. Geological Observations and Sampling
Charles R. BaconU.S. Geological SurveyMenlo Park, CA 94025
Nine dives with the submersible Deep Rover were dedicated to geologic studies. The majorobjectives of this program were to characterize the submerged caldera walls and postcalderavolcanic rocks. A secondary objective was to observe features related to sediment transport fromthe caldera walls to the deep basins of the lake.
Postealdera volcanic rocksThe post caldera volcanics are those lavas and pyroclastic rocks that were erupted after
collapse of Crater Lake caldera 6,845 +1- 50 yr B.P. All postcaldera volcanic activity in the CraterLake area occurred within the caldera. Use of Deep Rover provided access to volcanic features onthe lake floor. Postcaldera volcanic rocks previously were known only from limited videocoverage obtained with an ROV, from a few dredge samples, and from the exposed part of WizardIsland. Observations made during four dives with Deep Rover in 1988 coupled with morphologicfeatures of rock samples have allowed us to determine, with varying degrees of confidence, whichpostcaldera lava flows were emplaced beneath lake water and which were subaerial. This isimportant because it helps to constrain the relative ages of volcanic features, using filling of thelake as a timing device to supplement relative age information based on morphology andsuperposition of features (i.e., younger lava overlies older lava).
All postcaldera volcanic rocks, with the exception of the little rhyodacite dome east of WizardIsland, are andesites. These form the central platform (east of Wizard Island) and lava flowsbeneath it on the north and probably east sides (covered by sediment), Merriam Cone, and theWizard Island edifice, only the tip of which projects above the lake surface. The oldest postcalderaandesite from which a sample was recovered is a flow north of the central platform. Domes orthick flows that form the central platform rest on this lava and were erupted before the lake filled totheir level. Low ridges east-southeast of the central platform appear to be landslide materialderived from the south caldera wall that was deflected eastward into the deep basin when the slideencountered the south side of the platform. Merriam Cone and the lava flows that form most of thesurface of the submerged part of the Wizard Island volcano cooled under lake water, the WizardIsland lavas when the lake level was approximately 250' lower than at present. The rhyodacitedome east of Wizard Island is the youngest postcaldera volcanic feature on the basis of other work.The dome may have been emplaced when the lake surface was close to its present level.
Peirographic features of the volcanic rocks give information on the igneous processesresponsible for the chemical compositions of the lavas. Thin sections were cut from about thirtypostcaldera lava samples collected with Deep Rover. Samples from the central platform haverelatively large (1-3 mm) plagioclase phenocrysts set in a glassy groundmass containingcomparatively few small crystals, while lavas of Wizard Island and Merriam Cone have plagioclasephenocrysts generally less than 2 mm and abundant microphenocrysts in glassy groundmasses.Plagioclase, pyroxene, titanomagnetite, and olivine phenocrysts in nine representative sampleswere analyzed with the electron microprobe. Cores of plagioclase phenocrysts form threecompositional populations that reflect different origins: (1) the majority of phenocrysts haveanorthite contents of 50-60 mol % and probably crystallized from the andesitic liquids; (2) virtuallyall samples also contain phenocrysts with anorthite contents near 80 mol % that indicate a basalticsource; (3) most samples also contain more sodic plagioclase, around anothite 40 or less, thatcrystallized from silicic magma. The plagioclase data suggest that the andesites formed, at least inpart, by mixing of basaltic and siicic magma, followed by precipitation of phenocrysts (population1) from the hybrid liquid. Alternatively, the sodic and calcic plagioclase crystals are xenocrystsderived from cumulate crystal mush or subvolcanic pulutonic rocks that crystallized from both
C.1
basaltic and silicic magmas. Plagioclase of all groups tends to be zoned toward rims, anorthite 40-50 mol %, that apparently were in equilibrium with the groundmass glass as the lava cooled.Augite and orthopyroxene phenocrysts have compositions that suggest crystallization fromandesitic and more siicic liquids. The more Fe-rich pyroxenes commonly are reversely zoned torelatively magnesian rims, as would be the case if crystals from silicic magma were introduced intoandesitic liquid; normally zoned pyroxene phenocrysts probably grew in the andesitic liquid.Olivine phenocrysts are rare and appear to be xenocrysts from basaltic sources. Mosttitanomagnetite phenocrysts crystallized from, or at least equilibrated with, the hybrid andesiticmagmas. In summary, the mineralogic data indicate that the postcaldera andesites do not representliquid compositions related by crystal fractionation alone but also include material that crystallizedfrom more mafic and more silicic magmas.
Fifteen postcaldera andesite whole-rock samples collected with deep rover were analyzed formajor and trace elements by x-ray fluorescence, instrumental neutron activation, and inductively-coupled plasma techniques. Results of this work and earlier analysis of dredge and Wizard Islandsamples show that: (1) Si02 content ranges from 58.3 to 62.7 wt % among unaltered andesites; (2)central platform lavas have relatively high K/Na, Mg/Fe, and Si02; (3) Merriam Cone and theearliest Wizard Island lavas are more differentiated than later Wizard Island flows, and there iscontinuous variation between compositional extremes; (4) the morphology of the central platform,which suggests a group of coalescing domes, is consistent with the more Si02-rich compositionsof its lavas that imply somewhat higher viscosities than for other postcaldera andesites.
Seven postcaldera andesite samples were analyzed for rare earth elements (REE) by isotope-dilution mass spectrometry in order to provide more precise data than obtained by neutronactivation analysis. Six of the samples have very similar, negatively sloping chondrite-normalizedREE patterns. Among these, three show no Eu anomaly, two have slight positive anomalies, andone has a small negative anomaly. As Eu is preferentially incorporated into plagioclase, thepositive anomalies may be explained by contamination with xenoclysts, as suggested by themicroprobe data. Negative Eu anomalies are traditionally interpreted as being due to plagioclasefractionation. The seventh sample, from the central platform, has a REE pattern parallel to theothers but higher REE abundances and a distinct negative Eu anomaly. This is the mostdifferentiated andesite sample on other chemical grounds, so it is not surprising that its REE patternis suggestive of fractionation of an assemblage of REE-exciuding (except Eu) phases dominated byplagioclase.
Volatile element concentrations in glassy lava would be expected to be abnormally high iferuption took place under the confming pressure of a deep body of water instead of at atmosphericpressure. Contents of H20, Cl, and F in subaerial and submerged Wizard Island andesites aresimilar, implying that the submerged lavas were erupted from the subaerial vent, degassed, andflowed into the lake. Two dredge samples from Merriam Cone (minimum depth about 180 m)have volatile-element contents like the Wizard Island andesites; as Merriam Cone andesites havemorphologies that suggest cooling under water, we tentatively suggest that the lake was shallowerwhen Merriam Cone formed.
In addition to the postcaldera andesite lava samples, a number of xenoliths in Wizard Islandsubaerial lavas were collected. The xenoliths are fragments of cumulates from andesitic magmaand partially-fused basaltic homfels. Minerals in representative xenoliths have been analyzed withthe electron microprobe. One lava sample collected with Deep Rover contains partially-fusedgranodiorite similar to blocks ejected in the climactic eruption. These materials may be importantcomponents in the genesis of the postcaldera magmas. The next phase of the postcaldera lavastudy will be to model the lava compositions using the complete set of mineral and whole-rockcompositional data.
Submerged caldera wallsThe submerged caldera walls were studied and sampled during five dives in 1989 and at the
beginning of one of the 1988 dives. The dives traversed from the lake bottom up the wall at five
C.2
points off Llao Rock, Palisade Point, Skell Head, Sentinel Rock, and Eagle Point. These localitieswere chosen in order to obtain the widest possible geographic coverage and to maximizeopportunities to sample outcrops. The nature of this work is different from the postcaldera lavastudy in that outcrops on the deep caldera walls represent many different times in the history ofMount Mazama and consist of volcanic rocks from several eruptive centers. The following resultsare preliminary and are based on examination of thin sections and chemical analyses ofapproximately thirty-five samples.
The dive off Llao Rock yielded ten lava samples from outcrops between depths of 1064' and193'. The four deepest samples (1064', 895', 639', 568') are compositionally similar silicicandesites that contain chlorite or clay alteration minerals in their groundmasses. These lavas maycorrelate with flows near lake level on the southwest side of the caldera. Between 500' and 300'we recovered relatively fresh andesites and one dacite (445'). The shallowest sample (193') islow-silica andesite that has clay alteration and probably belongs to the same set of flows as thoseexposed at the shore.
Eight samples were collected between 1530' and 318' below Palisade Point. None of theserocks has been significantly affected by hydrothermal alteration. The sample from the greatestdepth is an andesite block from a large outcrop of probable flow-top breccia. Glassy rhyodacitewas collected at 1495'. It is possible that this remarkably fresh sample is related to pre-Mazamarhyodacites to the east. However, there remains some question as to whether either this or theunderlying andesite outcrops may be landslide blocks. The remaining six samples were collectedat 1020' and above. These are andesite, silicic andesite, and dacite.
The dive opposite Skell Head netted one sample of vesicular andesite from 700'. Of greaterinterest were spires of siliceous sinter observed between about 1800' and 1500'. These aredescribed elsewhere in the report.
Ten samples were collected below Sentinel Rock between 975' and 62'. Samples collectedfrom between 975' and 528' are rather similar silicic andesites with clay alteration. One samplefrom this interval (955'), however, is distinctive, altered hornblende dacite that resembles rockssignificantly older than Mount Mazama. The four shallowest samples are notably less altered thanthe deeper ones. They are dacite and silicic andesite collected from 386' and above. Most of thesamples from this dive probably can be correlated with rocks above lake level to the southwest,below Dutton Cliff, and were erupted early in the history of Mount Mazama.
A total of seven samples were obtained between 1445' and 1290' during two dives nearEagle Point. These are the most altered rocks collected. All appear to have andesitic compositions.Some of the samples may be lava flow materials and some may be intrusive rocks. Epidote,chlorite, calcite, and quartz are alteration or secondiry phases present in varying amounts.Hydrothermal alteration of these samples occurred before collapse of the caldera but the age of thisalteration is unknown. The presence of epidote indicates alteration at temperatures above 200°C.These apparently are Mazama lavas that are older than those of the exposed caldera wall, althoughwe cannot say with certainty that the approximately 400'-high steeply-sloping pile of lava flowsfrom which the samples were collected is not a large landslide block.
Continuing studiesVideo coverage of the dives made in 1989 is yet to be thoroughly analyzed. Hence, we do
not report here on observations related to sediment transport or possible geologic relationshipsbetween bedrock outcrops in the caldera walls. Attempts will be made to date by the K-Ar methodselected, relatively fresh samples from the submerged caldera walls. In the future, we intend topublish the results of the postcaldera lava study in a scientific journal and to incorporate themformation on the geology of the submerged caldera walls in other publications on MountMazama.
C.3

.
Appendix D. Geological Observations and Sampling
C. Hans Nelson and John H. Barber, Jr.Branch of Pacific Marine Geology
U.S. Geological SurveyMenlo Park, CA 94025
The Ring Fracture Zone and its Association with Continuing GeologicActivity
Bacon (1983) suggests that multiple vents fonned along a ring fracture as the calderacollapsed. Observation of a number of geologic features led to the hypothesis by Nelson etal. (1988) that the expression of a ring fracture zone associated with the caldera collapsewas evident in the acoustic basement as defined by continuous seismic reflection profiling.In the seismic profiles, this zone at the base of the caldera wall slopes is characterized by aring of closed depressions in the acoustic basement surface, which are thought to bephreatic explosion craters, and by maximum thicknesses of subaerial and lake sediment.The main post-caldera vents of Merriam Cone and Wizard Island also lie along this ringfracture zone. The zones of warmer water from apparent lake-floor hydrothermal ventsoriginally defined by Williams and Von Herzen (1983) also occur in the proposed ringfracture zone.
Examination of seismic records (Barber and Nelson, 1990), bottom samples, and DeepRover observations suggests that deposits of the largest observed landslide off the calderawall underlie the main vent site in the south basin of the lake floor. This extensive calderawall failure consists of thick deposits of very coarse debris that cover the ring fracturezone. These deposits are likely to be relatively permeable, which may help explain thepresence of the most extensive continuing hydrothermal activity in the southern ringfracture area. Elsewhere, hydrothermal plumes may be inhibited from reaching the lakefloor by the thick lake sediment deposits that typically cover the ring fracture zone.
Further study of diving observations will permit more detailed mapping of sediment coverover the ring fracture area. This in turn may provide more evidence for defining theassociation of the ring fracture zone, sediment cover, and presence of thermal springs.
D.1
Appendix E
Bacterial Studies of Materials Collected at Crater Lake Vent Locations
Status Report, September 1990
David Karl, University of Hawaii
IntroductionMy involvement in the 1989 Crater Lake hydrothermal processes study was by invitation of Drs.Jack Dymond and Robert Collier. Although I was unable to participate in the field expedition dueto a previous commitment, I did provide the co-P.Ls with a list of basic research objectives andsampling instructions. In September 1989, I received the following samples: (1) live andpreserved bacterial mats collected from a variety of sites for direct microscopy and pure cultureisolation, (2) unpreserved, frozen bacterial mats for chemical, isotopic and enzymatic (carboxylase)determinations and (3) frozen porewaters for measurement of DOC, DON, DOP and specificorganic constituents (amino acids and nucleic acids). No formal funding was provided, and nonehas been solicited since receiving the samples. Consequently, my progress towards the completionof sample analysis has been uncharacteristically (for me, at least) slow. Below I summarize ourprogress to date and prospectus for future work.
Pure Culture IsolationsResults from the 1988 submersible expedition revealed the presence of large concentrations ofwhat the authors tentatively identified as iron-oxidizing bacteria of the genera, Gallionella andLeptothrix (Dymond et al. 1989, Nature 342: 673-675). These bacterial mats appear to be similarto the iron-oxidizing bacteria recently discovered at Loihi Seamount, a deep-sea, hot-spot volcanonear Hawaii (Karl et al. 1988, Nature 335: 532-535). We attempted to isolate pure cultures ofthese putative iron-oxidizing bacteria using enrichment culture procedures. Media were preparedfor the following "target" organisms: Leptothrix discophera., Gallionella sp., Sphaerotilus natans.,Thiobaciflus ferroxidans, L intermedius and L thioxidans. Of these, Gallionella., L ferroxidansand L thioxidans were "obligate autotroph" enrichments. Each medium type was prepared with abottom plug of either ferrous iron (as ferrous ammonium sulfate), ferrous iron plus sulfide (asferrous sulfide) or sulfide (as sodium sulfide) in 1.5-2% agar as the lithotrophic energy source,with a 0.2% soft agar plus medium overlay. A redox gradient was allowed to establish beforeprimary inoculation was made throughout each tube. Eleven separate samples from a variety ofsites were used for these enrichment studies. Positive enrichments were common. All samplestested were positive on Sphaerotilus medium; all but one (CD215) were positive on Leptothrixmedium; all but one were positive on Gallionella medium (CD223); and all but two on Lintermedius medium (CD228, CD230). There was no growth on L ferroxidans medium and noconsistent growth on I thioxidans medium. At present these cultures have survived severaltransfers without loss of viability. To date we have not had an opportunity to further characterizeany of the isolates.
Enzyme AssaysA primary objective of our involvement in the Crater Lake project was to examine the bacterial matassemblage for evidence of chemolithotrophic activity. This was to have been done in two ways:by C isotopic analysis of the organic matter and by measurement of RuBPCase (ribulose 1,5-bisphosphate carboxylase- oxygenase) enzyme activity.
RuBPCase is found in all photosynthetic and chemolithoautotrophic organisms where it catalyzes adual reaction: (1) carboxylation of ribulose- 1,5-bisphosphate to yield two molecules of glycerate3-phosphate and (2) oxygenation of ribulose-1,5-bisphosphate to form phosphoglycolate and
.
I. E.1
glycerate 3-phosphate. Previous studies of deep-sea hydrothermal vent ecosystems have revealedthe presence of RuBPCase thus providing supportive evidence for chemolithoautotrophic bacterialproduction (Tuttle 1985, Biol. Soc. Wash. Bull 6: 335-343).
Ms. Lara Asato, an undergraduate student in my laboratory, spent approximately 6 mo. of hardwork refining these enzymatic methods for use in our laboratory. In particular, we were concernedwith improving the detection limit of the existing methods for application to the Crater Lakesamples. Before leaving Hawaii to start a graduate career at U.S.C. Lara made a preliminaryanalysis of the bacterial mat samples. RuBPCase was undetectable by our procedures. Additionof commercially available RuBPCase to subsamples of the mat had little effect on activity (relativeto controls) so we conclude that the samples do not have any specific inhibitors which mightotherwise complicate these quantitative assays. Although one interpretation is simply thatRuBPCase and therefore, chemolithoautotrophic bacteria are not present in the Crater Lakesamples, we feel that conclusion is premature. The main reason for our caution is that we werealso unable to detect the heterotrophic carboxylaiing enzyme phosphoenolpyruvate carboxylase(PEPCase) in these samples which implies that we are simply below the detection limit for thesemeasurements. From our previous work at Loihi Seamount we know that the majority of the iron-oxidizing bacterial mat is non-living and that the organic carbon content is low (1-3% by weight).Consequently we need to either improve the sensitivity of the carboxylase assay systems, findsome method of separating and concentrating intact cells from the bacterial mats or try a differenttype of detection system. Regarding the latter, we are currently investigating the possible use ofgene probes and polymerase chain reaction (PCR) technology as a mechanism for the sensitivedetection of these specific enzymes.
III. Dissolved Substrate Analyses
The measurement of dissolved organic substrates in aquatic environments has recently becomevery controversial, again (Williams and Druffel 1988, The Oceanography Magazine 1: 14-17).We currently have the capability of measuring total dissolved organic nitrogen (DON) in smallsample volumes using a commercially available, high temperature combustion instrument (AntekInstrument Co., Model #703C; Walsh 1989, Marine Chemistry 26: 295-3 1 1). We also have onorder a commercially available, high-temperature dissolved organic carbon (DOC) analyzer (lonicsModel #555). In order to provide the most up-to-date methods possible, we are awaiting thearrival and complete set-up of these instruments before committing the Crater Lake porewatersamples to analysis.
E.2
ppendix F. Fluid Circulation and Diagenesis in the Basementof Crater Lake, Oregon: Pore water Constraints
C. Geoffrey WheatSOEST, 1000 Pope Road
University of HawaiiHonolulu, Hawaii, 96822
1. INTRODUCTION
Crater Lake is located in the caldera of Mt. Mazama, an andesidic volcano in the southern sectionof the Cascade mountain range of Oregon (Fig. 1). The caldera was produced by a cataclysmiceruption roughly 685Oy b.p. (Bacon, 1983), and is completely enclosed by steep walls that riseseveral thousand feet above the caldera floor. Crater Lake formed shortly after the formation of thecaldera from inputs of meteoritic waters. Volcanic activity in the caldera continued for severalthousand years after formation of the lake with the last eruption happening 4000 y b.p. (Bacon andLanphere, 1990). Based on the geologic structure in which Crater Lake resides, it would not besurprising to fmd active hydrothermal venting through the lake floor.
Several studies of Crater Lake, Oregon, support the hypotheses that hydrothermal fluids issuefrom the lake floor. Inputs of hydrothermal fluids to Crater Lake were first postulated by VanDenburgh (1968) after discovering high concentrations of chloride and sulfate relative toconcentrations measured in neighboring lakes. Since this discovery, chemical gradients have beenmeasured in the water column that support the presence of hydrothermal inputs (Simpson, 1970aand 1970b; Dymond et al., 1989; Dymond and Collier, 1990; Collier et al., 1990a and 1990b;McManus et al., 1990). Further support for hydrothermal inputs to the lake are based on massbalance calculations of dissolved ions. These calculations are constrained by the hydrologic budgetand require subsurface inputs of dissolved ions, presumably from subsurface hydrothermalsprings (Nathenson, 1990; Reilly, 1989).
Physical measurements taken in Crater Lake also support the presence of hydrothermal inputs.Numerous temperature profiles have been measured in the upper 2.5 m of the sediment column(Williams and Von Herzen, 1983) and in the water column (Appendix A). All of the measuredprofiles in the sediment column were linear with an average conductive heat flow of 0.14W/m2;however, some beat flow values are as high as 5 W/m2 (Williams and Von Herzen, 1983). Thesedata suggest that fluid flow into the lake is either confined to zones of focused upflow, which werenot sampled, or fluid flow is less than 1.3 m/y for profiles measured with a 2.5 m probe or lessthan 6.3 m/y for profiles measured with a 0.5 m probe (Bredehoeft and Papadopulos, 1965).Further support for hydrothermal inputs is from calculations of excess heat and salt in the watercolumn (Appendix A).
The first direct evidence of hydrothermal flow through the sediments of Crater Lake based onsystematic variations in pore water chemical and thermal properties is presented. These data werecollected from a surface vessel and from a one-person submersible Deep Rover. By fitting thesedata to models that account for time dependant, advective, diffusive, and reactive processes(Wheat, 1990; Wheat and McDuff, submitted A), we estimate where and how fast fluids areflowing through the sediments. Other models based on systematic variations in the chemicalcomposition of pore fluids allow us to constrain the general pattern of fluid circulation throughbasement, the composition of the fluid in basement, and the flux of ions and fluid from basementto the deep lake.
F. 1

2. GEOLOGIC SETI1NG AND METHODS
The composition and accumulation of sediments in Crater Lake are controlled by the lake'sgeologic setting. Crater Lake represents about 78% of its own drainage area (Phillips, 1968). Theremaining drainage area consists of the steep caldera walls, which limit sedimentary inputs to thelake. Sediments in Crater Lake are comprised of aluminosilicate debris from the caldera wall,biogenic debris from the euphoric zone, and iron-manganese rich precipitates from inputs ofhydrothermal fluids at the lake bottom (Dymond and Coffier, 1990). Net sediment accumulationsin the lake differ from tens of centimeters on the slopes of the caldera walls to several meters onWizard Platform to about 100 meters in basement depressions (Barber and Nelson, 1990).
The aluminosilicate debris is derived from the caldera wall and has an average aluminum content of8.9% ±0.5% and an iron content of about 3.5% (Dymond and Collier, 1990). Thesemeasurements are consistent with the concentration of aluminum in the rhyodacite that was ejectedduring the climatic eruption (8.1%, McBimey, 1968). In contrast to the alimnosiicate debris,biogenic debris contains no measurable iron or aluminum, and appears to be largely comprised ofbiogenic opal (Dymond and Collier, 1990).
hon-manganese rich crusts are enriched in iron, manganese, phosphorus, and barium and aredepleted in aluminum, silica, potassium, and calcium compared with weathered material from thecaldera wail (Dymond and Collier, 1990). These crusts contain about 35% iron and less than 1%aluminum and are found in three settings: (1) pavements of multicolored (ochre to darkbrown)crusts that cover ten to hundreds of m2; (2) fields of pebbles that also cover tens to hundreds ofm2; and (3) multiple ochre-colored layers that are visible in areas of sediment slumping (Dytnondand Collier, 1990). These crusts are located in areas with high heat flow and are associated withbacterial mats and saline pools (Fig. 2). Bacterial mats are 2 to 20 m in length and several metersacross and are mostly comprised of iron oxidizing sheath-forming bacteria of the genera,Gallionella and Leptothrix (Dymond et al., 1989). Most pools have salinities and temperatures thatare greater than that measured in the surrounding bottom water and located in areas with little or nobasement relief (Fig. 2). A more detailed physical, chemical, and thermal description of the matsand pools are found within the body of the report.
Sediments, crusts, bacterial mats, and pools were sampled with a gravity corer, a box corer, andpeepers. These sampling devices provided a means to obtain pore fluids,which were analyzed fortheir chemical composition. Temperature profiles in the sediments were measured with twoprobes.
Fourteen gravity cores were retrieved from Crater Lake in 1989 (Fig. 1). Gravity coring providedthe means to recover the longest section of the sediment column, 0.5 to 1.5 mm length, andtargeted general areas of interest. Gravity cores were kept cold and split, described, and sampledfor pore water analysis within twelve hours. Sediment samples for pore water analysis werecentrifuged in a van held at 3-5°C and the supematant was filtered through 0.45 micron filters.
A Soutar box corer was deployed from the submersible Deep Rover to retrieve sediments close toor in specific geologic features (Fig. 2). Five box cores were retrieved with core lengths rangingfrom 0.06 to 0.2 m. Box cores were sampled by whole core squeezing (Bender et al., 1987)immediately upon retrieval, and discrete samples were taken at the base of the cores. Thesediscrete samples were kept cold until they could be centrifuged and filtered, within 3-15 hours afterthe cores were retrieved.
F.3
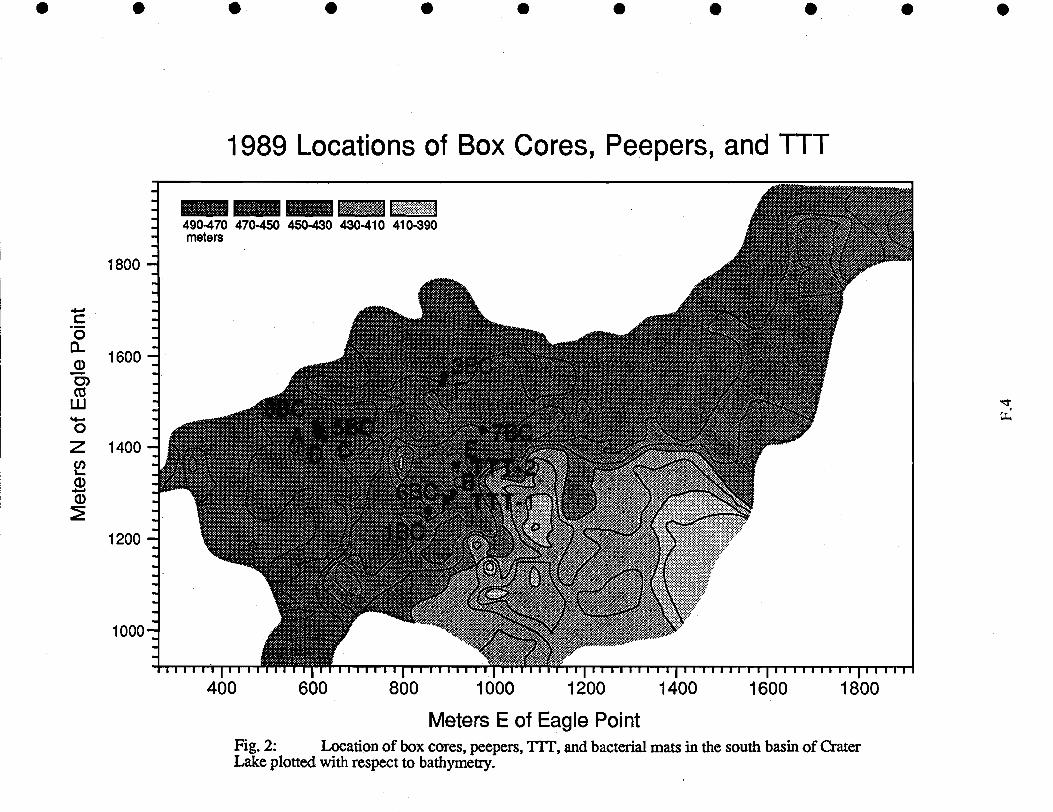
1000
490-470 470-450 450-430 430-410 410-390
1989 Locations of Box Cores, Peepers, and TTT
:. '
F, ,/ FF,. .... ,.. .
FS/ /7/ // //
.5 .:'V . .,/.F
400 600 800 1000 1200 1400
Meters E of Eagle PointFig. 2: Location of box cores, peepers, TTF, and bacterial mats in the south basin of CraterLake plotted with respect to bathymetry.
1600 1800
meters
1800
1600
Zci)
ci)
1400
1200
Fluids extracted from gravity and box cores were divided into four aliquots. One aliquot wasstored in polystyrene test tubes for analysis of nutrients, pH and total CO2 within several days afterthe cores were retrieved. Chloride, sulfate and the stable isotopes of oxygen were analyzed on analiquot sealed in a glass ampule. A 4-6 ml aliquot was spiked with 10 p.L of redistilled iNhydrochloric acid and stored in an acid washed polyethylene bottle. This aliquot was used fordetermining the concentrations of several metals. The remaining fluid was frozen for laterdetermination of dissolved organic carbon (DOC).
Peepers were made of polycarbonate and were deployed by the submersible in specific features.Peepers provide a means to obtain pore fluids that are not chemically altered by samplingprocedures. Cavities 1 cm in length were milled every two centimeters down the length of thesampler. These cavities held about 4.5 ml of fluid and two cavities were milled at each sampledepth. Cavities were filled with deoxygenated distilled water and covered by a 0.45 microndialysis membrane. Peepers were stored in deoxygenated distilled water until they were deployedby the submersible. A plastic T-handle was added to the peeper to aid in deployment and thebottom edge of the peeper was bevelled to cause minimal disturbance of the sediments. Fourpeepers with twenty cavities and one peeper with thirty-six cavities were deployed by thesubmersible for about one week (Fig. 2), allowing the fluid in the cavities to equilibrate withadjacent pore fluids via diffusion. Aliquots of pore fluids from the peepers were taken uponretrieval and stored in vacutainers. One aliquot was analyzed for nutrients, pH and total CO2. Theother aliquot was spiked with 10 p.L of redistilled iN hydrochloric acid and analyzed for severalmetals.
Chemical compositions of pore waters from representative cores are reported in Tables 1 and 2.Dissolved silica was measured using a standard colorimetric technique with a precision of about2% (is) (Parsons et al., 1984). Concentrations of chloride were determined by ionchromatography with a precision of <2% (is) and oxygen isotopic compositions were determinedby mass spectrometry with a precision of 0.1 per mil (is). Atomic absorption spectrometrytechniques were used to measure the concentration of sodium, calcium, magnesium, potassium,and lithium with precisions better than 5% and typically less than 2% (is). Sampling artifactsincreased the concentration of sodium by 0.3 mlvi in samples stored in vacutainers. Centrifugingthe sediments for pore water adds 0.02 mM potassium to pore fluids. These sampling artifacts areinferred from offsets in property-property relationships of pore fluids collected by differenttechniques.
Two temperature probes were used, each requiring the submersible for deployment. One probe is60 cm in length with thermistors mounted at 20,40 and 60 cm along the probe. The resolution ofeach thermistor is 0.01°C with an accuracy of ±0.2°C which was calibrated against knownresistance values periodically throughout the sampling program. This probe was connected to anOmega Model 5830 Thermistor Thermometer in the submersible. Temperature measurements wererecorded on a video record of the operation, which allowed us to determine the depth ofpenetration. Forty-eight temperature profiles were recorded in discrete features (Table 3);however, twenty-eight of these measurements were made with only one thermistor inserted into aparticular feature. Impenetrable crusts or underlying rocks prevented complete penetration of theprobe.
The other temperature probe is a Sea-Bird Electronics SeaCat SBE 19 Profiler ([Ti) with threethermistors epoxy-potted inside a 24-inch long, 0.25-inch diameter stainless steel tube. Whenfully inserted into the sediment, thermistor depths are 35 and 5 cm below the sediment-waterinterface and 5 cm above the sediment-water interface. The SeaCat profiler recorded temperatureprofiles two times a second with a resolution of 0.001°C and an accuracy of ±0.01°C over a
F. 5
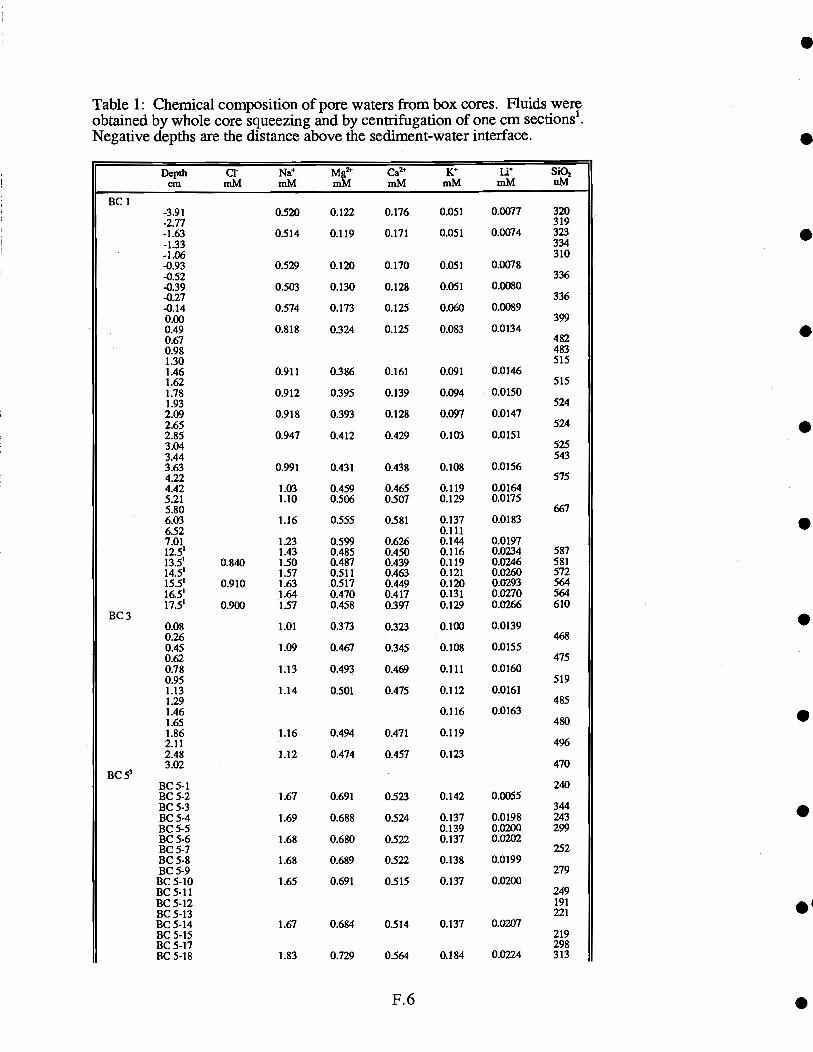
Table 1: Chemical composition of pore waters from box cores. Fluids wereobtained by whole core squeezing and by centrifugation of one cm sections'.Negative depths are the distance above the sediment-water interface.
epthcm
Na Mg2 2+ Li Si02mM mM mM mM mM uM
-3.91 0320 0.122 0.176 0.051 0.0077 320-2.fl 319-1.63 0.514 0.119 0.171 0.051 0.0074 323-1.33 334-1.06 310-0.93 0.529 0.120 0.170 0.051 0.0078-032 336-0.39 0.503 0.130 0.128 0.051 0.0080.027 336-0.14 0.574 0.173 0.125 0.060 0.00890.00 3990.49 0.818 0.324 0.125 0.083 0.01340.67 4820.98 4831.30 5151.46 0.911 0.386 0.161 0.091 0.01461.62 5151.78 0.912 0.395 0.139 0.094 0.01501.93 5242.09 0.918 0.393 0.128 0.097 0.01472.65 5242.85 0.947 0.412 0,429 0.103 0.01513.04 5253.44 5433.63 0.991 0.431 0.438 0.108 0.01564.22 5754.42 1.03 0.459 0.465 0.119 0.01645.21 1.10 0306 0.507 0.129 0.01755.80 6676.03 116 0.555 0.581 0.137 0.01836.52 0.1117.01 1.23 0.599 0.626 0.144 0.019712.5' 1.43 0.485 0.450 0.116 0.0234 58713.51 0.840 1.50 0.487 0.439 0.119 0.0246 58114.51 1.57 0.511 0.463 0.121 0.0260 57215.5' 0.910 1.63 0.517 0.449 0.120 0.0293 56416.5' 1.64 0.470 0.417 0.131 0.0270 56417.51 0.900 137 0.458 0.397 0.129 0.0266 610
0.08 1.01 0.373 0.323 0.100 0.01390.26 4680.45 1.09 0.467 0.345 0.108 0.01550.62 4750.78 1.13 0.493 0.469 0.111 0.01600.95 5191.13 1.14 0.501 0.475 0.112 0.0161129 4851.46 0.116 0.01631.65 4801.86 1.16 0.494 0.471 0.1192.11 4962.48 1.12 0.474 0.457 0.1233.02 470
BC5-1 240BC 5-2 1.67 0.69 1 0323 0.142 0.0055BC 5-3 344BC 5-4 1.69 0.688 0324 0.137 0.0 198 243BC 5-5 0.139 0.0200 299BC 5-6 1.68 0.680 0322 0.137 0.0202BC 5-7 252BC 5-8 1.68 0.689 0322 0.138 0.0199BC 5-9 279BC 5-10 1.65 0.691 0.515 0.137 0.0200BC5-11 249BC 5-12 191
BC 5-13 221BC 5-14 1.67 0.684 0.514 0.137 0.0207BC 5-15 219BC 5-17 298BC 5-18 1.83 0.729 0.564 0.184 0.0224 313
F.6
BC 1
BC 3
BC 53
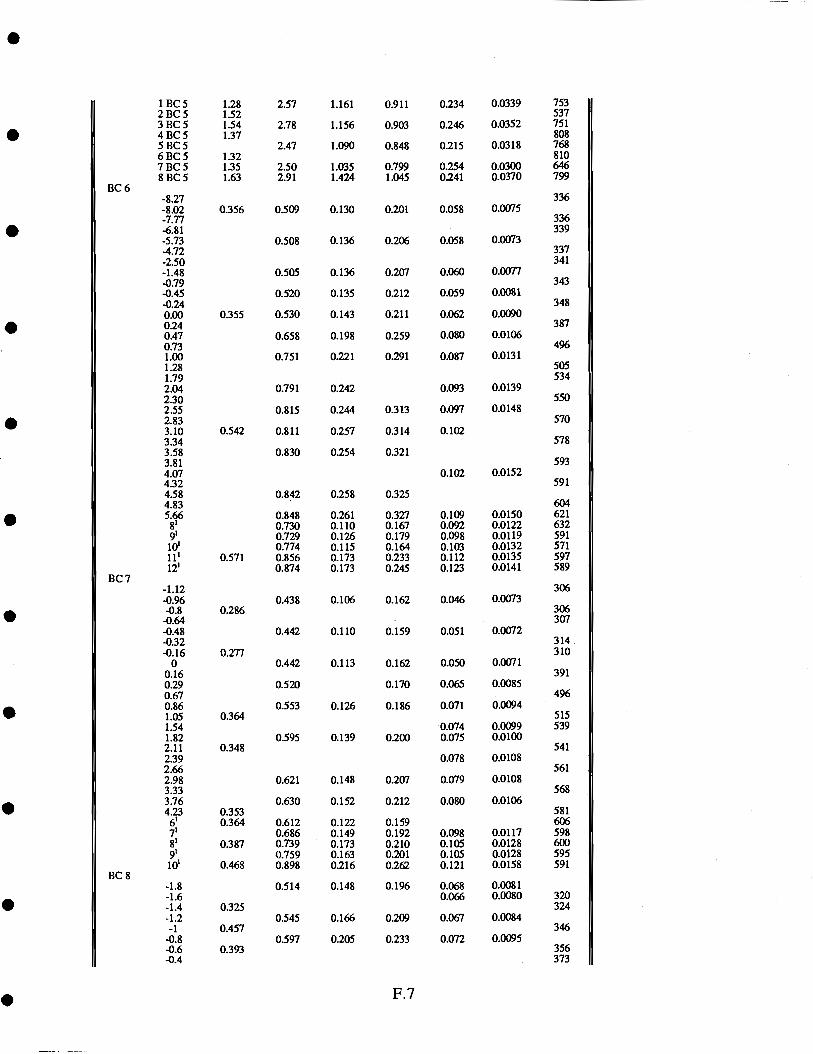
LI
E6E0 90- c600o ZLOO coro L6c0 80-
LcvO 1- 1'8000 L900 60Z0 99F0 cco VI-
cz:o vi- 080(10 99(10 91- 180(10 89(10 9610 8PFO t'ico 81-
gcioo IZFO t9V0 91V0 8680 89V0 01 8t100 couo loro £9F0 6cLo gzio0 coro 01Z0 ELIO 6EC0 L8E0 L1100 86(10 Z6VO 6iF0 9890
6cU0 ZZFO Z190 1'9E0 ESE0 EVI'
901(10 0800 Z1Z0 ZF0 0E90 9LE £E.E
80100 6L00 L0t0 81F0 1t90 86Z 99Z
801(10 8L00 6EZ 8PE0 lit 001(10 L00 OOZO 6E10 cco Z81
660(10 tL00 coi
1'60(10 ILOO 9810 9ZL0 :cco 980 L90
cs000 c900 0LF0 ozco 6V0 910
1W00 ocoo Z910 EIFO tWO 0 LLZO 9F0-
ZL000 icoo 6cF0 otro ztvo gvo-
9810 80- EL000 9100 Z910 9010 8EV0 960-
tl.l- 11'I00 ctro ELFO i'LSO 1t1 c:ioo Zl10 EEVO EL10 9c80 ILSO LL
tE100 EOFO I'9F0 ciro tLL0 611(10 8600 6LFO 9t10 6ZL0 tZ100 t6(i0 L910 OIFO OWO ocioo 60F0 LZEO 1910 8P80 99S
£81' ct:o cVo zt'wo 8c1'
ZE1' zcioo ZOFO Lift'
'g.E 1tE0 t'Z0 OEWO 8SE
zoro tsto uwo zt'co oi: E8t
81'lOO L6if0 E1E0 l'PZO S180 cçz °E-z
6E100 E600 ZPVO 16L0 t'OZ 6C1 8Z1
1E100 L800 16V0 ItrO lcLo 001 EL0
901(10 08(10 6cVO 8610 8c90 LVO i't.O
060(10 Z900 uzo :t'ro o:co cc:o 000
isooo 6çifO tiVO c:ro ozco cvo- 6L0-
LLOOO 0900 LOVO 9110 coco Sri- oct- ZL1'-
EL000 8c00 9010 9EF0 80c0 189- LLL
çL0ifO loro 0110 6O() 9cEo zcis- LVS-
OLEOTI wro ct'oi I'ZVI 16Z £91 c DH 8 oo:oo t'cvo 66t0 c:oi oct c 311 L
tEl D1I9 S1Z0 8P80 0601 LYZ
LEI zc:oo 9t'VO £060 9cFI 8Lt ic! c 311
zci caz 6E:00 I'EVO 1160 1911 LcZ 8V1 c a t
9cE
9t'E
t,ZE otE
16c cc 009
86 909 isc
89c
19c
wc
6Ec
96
16:
t1E
90:
68ç L6c ILc 16S tE9 1t9 09
16c
E6c
8/S
oLc
occ
coc
96I
L8E
WE LEE
6EE XE
XE
66L 9" 018 89L 808 IcL LEc EcL
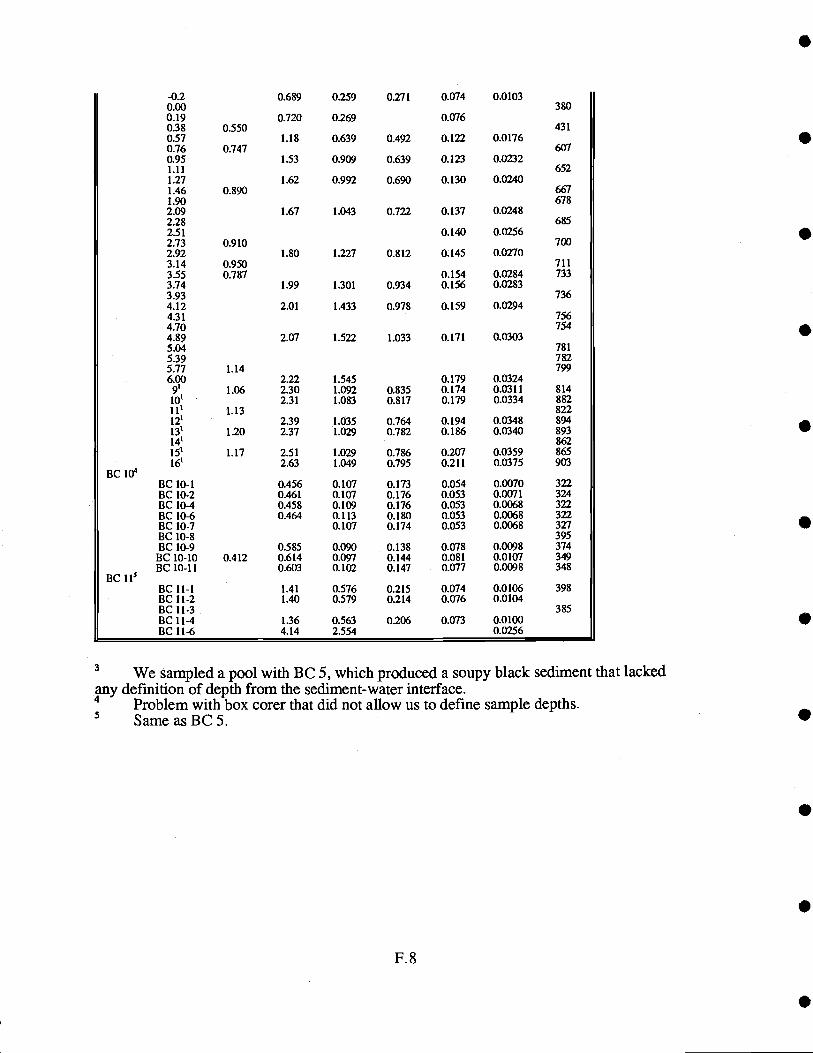
We sampled a pool with BC 5, which produced a soupy black sediment that lackedany defmition of depth from the sediment-water interface.
Problem with box corer that did not allow us to define sample depths.Same as BC 5.
F.8
-0.2 0.689 0.259 0.271 0.074 0.01030.00 3800.19 0.720 0.269 0.0760.38 0.550 4310.57 1.18 0.639 0.492 0.122 0.01760.76 0.747 6070.95 1.53 0.909 0.639 0.123 0.02321.11 6521.27 1.62 0.992 0.690 0.130 0.02401.46 0.890 6671.90 6782.09 1.67 1.043 0.722 0.137 0.02482.28 6852.51 0.140 0.02562.73 0.9 10 7002.92 1.80 1.227 0.812 0.145 0.02703.14 0.950 7113.55 0.787 0.154 0.0284 7333.74 1.99 1.301 0.934 0.156 0.02833.93 7364.12 2.01 1.433 0.978 0.159 0.02944.31 7564.70 7544.89 2.07 1.522 1.033 0.171 0.03035.04 7815.39 7825.77 1.14 7996.00 2.22 1.545 0.179 0.0324
1.06 2.30 1.092 0.835 0.174 0.0311 8142.31 1.083 0.817 0.179 0.0334 882
1.13 8222.39 1.035 0.764 0.194 0.0348 894
1.20 2.37 1.029 0.782 0.186 0.0340 893862
1.17 2.51 1.029 0.786 0.207 0.0359 8652.63 1.049 0.795 0.211 0.0375 903
BC ioBC 10-1 0.456 0.107 0.173 0.054 0.0070 322BC 10-2 0.461 0.107 0.176 0.053 0.0071 324BC 10-4 0.458 0.109 0.176 0.053 0.0068 322BC 10-6 0.464 0.113 0.180 0.053 0.0068 322BC 10-7 0.107 0.174 0.053 0.0068 327BC 10-8 395BC 10-9 0.585 0.090 0.138 0.078 0.0098 374BC 10-10 0.412 0.614 0.097 0.144 0.081 0.0107 349BC 10-11 0.603 0.102 0.147 0.077 0.0098 348
BC ii5BC 11-1 1.41 0376 0.215 0.074 0.0106 398BC 11-2 1.40 0.579 0.214 0.076 0.0104BC 11-3 385BC 11-4 1.36 0.563 0.206 0.073 0.0100BC 11-6 4.14 2.554 0.0256
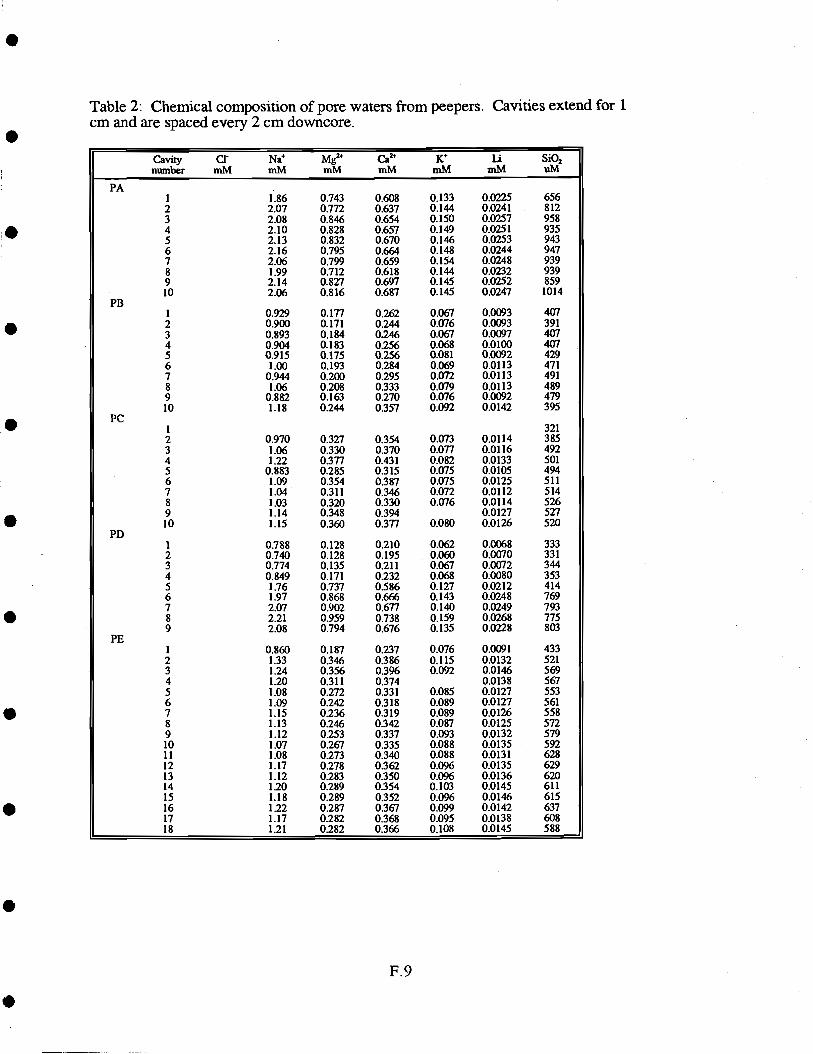
Table 2: Chemical composition of pore waters from peepers. Cavities extend for 1cm and are spaced every 2 cm downcore.
Cavity CF Nanumber mM mM
Mg2mM
Ca2mM mM
Si02
1 1.86 0.743 0.608 0.133 0.0225 6562 2.07 0.772 0.637 0.144 0.0241 8123 2.08 0.846 0.654 0.150 0.0257 9584 2.10 0.828 0.657 0.149 0.0251 9355 2.13 0.832 0.670 0.146 0.0253 9436 2.16 0.795 0.664 0.148 0.0244 9477 2.06 0.799 0.659 0.154 0.0248 9398 1.99 0.712 0.618 0.144 0.0232 9399 2.14 0.827 0.697 0.145 0.0252 85910 2.06 0.816 0.687 0.145 0.0247 1014
1 0.929 0.177 0.262 0.067 0.0093 4072 0.900 0.171 0244 0.076 0.0093 3913 0.893 0.184 0.246 0.067 0.0097 4074 0.904 0.183 0.256 0.068 0.0100 4075 0.9 15 0.175 0.256 0.081 0.0092 4296 1.00 0.193 0.284 0.069 0.0113 4717 0.944 0.200 0.295 0.072 0.0113 4918 1.06 0.208 0.333 0.079 0.0113 4899 0.882 0.163 0.270 0.076 0.0092 47910 1.18 0.244 0.357 0.092 0.0142 395
1 3212 0.970 0.327 0.354 0.073 0.0114 3853 1.06 0.330 0.370 0.077 0.0116 4924 1.22 0.377 0.431 0.082 0.0133 5015 0.883 0.285 0.315 0.075 0.0105 4946 1.09 0.354 0.387 0.075 0.0125 5117 1.04 0.311 0.346 0.072 0.0112 5148 1.03 0.320 0.330 0.076 0.0114 5269 1.14 0.348 0.394 0.0127 52710 1.15 0.360 0.377 0.080 0.0126 520
1 0.788 0.128 0.210 0.062 0.0068 3332 0.740 0.128 0.195 0.060 0.0070 3313 0.774 0.135 0.211 0.067 0.0072 3444 0.849 0.171 0.232 0.068 0.0080 3535 1.76 0.737 0.586 0.127 0.0212 4146 1.97 0.868 0.666 0.143 0.0248 7697 2.07 0.902 0.677 0.140 0.0249 7938 2.21 0.959 0.738 0.159 0.0268 7759 2.08 0.794 0.676 0.135 0.0228 803
1 0.860 0.187 0.237 0.076 0.0091 4332 1.33 0.346 0.386 0.115 0.0132 5213 1.24 0.356 0.396 0.092 0.0146 5694 1.20 0.311 0.374 0.0138 5675 1.08 0.272 0.331 0.085 0.0127 5536 1.09 0.242 0.318 0.089 0.0127 5617 1.15 0.236 0.319 0.089 0.0126 5588 1.13 0.246 0.342 0.087 0.0125 5729 1.12 0.253 0.337 0.093 0.0132 57910 1.07 0.267 0.335 0.088 0.0135 59211 1.08 0.273 0.340 0.088 0.0131 62812 1.17 0.278 0.362 0.096 0.0135 62913 1.12 0.283 0.350 0.096 0.0136 62014 1.20 0.289 0.354 0.103 0.0145 611
15 1.18 0.289 0.352 0.096 0.0146 61516 1.22 0.287 0.367 0.099 0.0142 63717 1.17 0.282 0.368 0.095 0.0138 60818 1.21 0.282 0.366 0.108 0.0145 588
PA
PB
PC
PD
PE
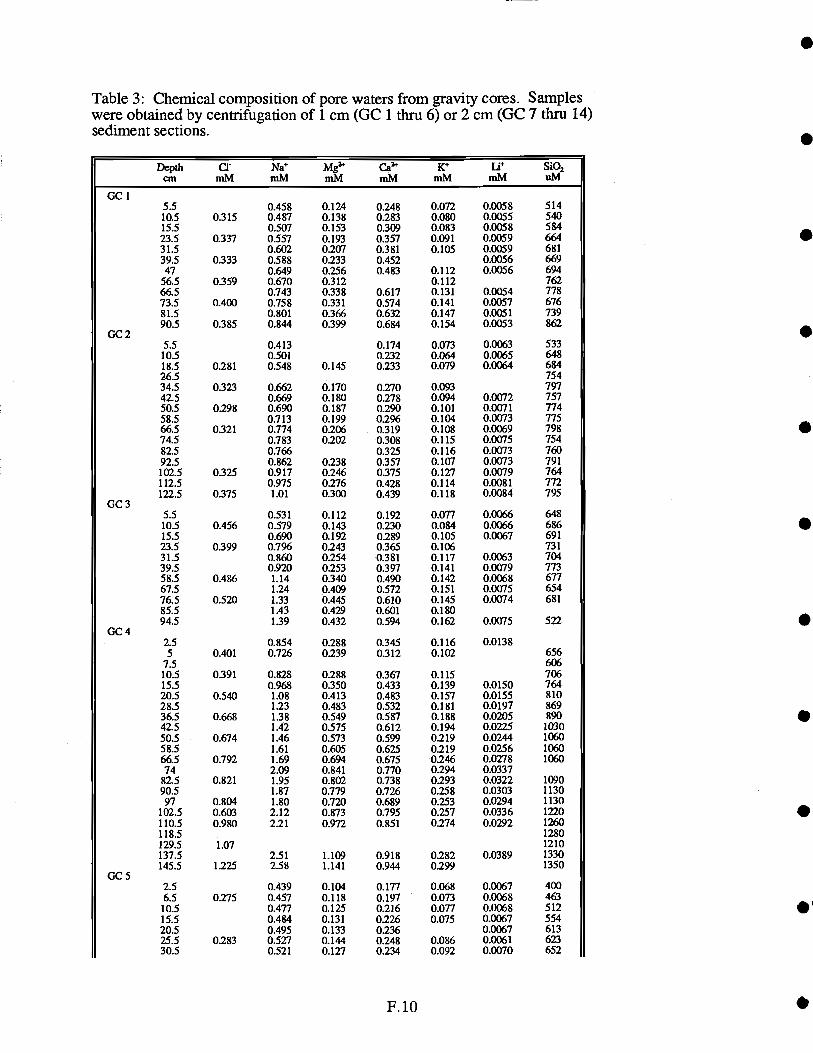
Table 3: Chemical composition of pore waters from gravity cores. Sampleswere obtained by centrifugation of 1 cm (GC 1 thru 6) or 2 cm (GC 7 thru 14)sediment sections.
Si02uM
F.1O
th Na MgmM mM mM
GC15.5 0.458 0.124 0.248 0.072 0.0058 514
10.5 0.315 0.487 0.138 0283 0.080 0.0055 54015.5 0.507 0.153 0.309 0.083 0.0058 58423.5 0.337 0.557 0.193 0.357 0.091 0.0059 66431.5 0.602 0.207 0.381 0.105 0.0059 68139.5 0.333 0.588 0.233 0.452 0.0056 66947 0.649 0.256 0.483 0.112 0.0056 694
56.5 0.359 0.670 0.312 0.112 76266.5 0.743 0.338 0.617 0.131 0.0054 77873.5 0.400 0.758 0.33 1 0.574 0.141 0.0057 67681.5 0.801 0.366 0.632 0.147 0.0051 73990.5 0385 0.844 0.399 0.684 0.154 0.0053 862
CC 25.5 0.413 0.174 0.073 0.0063 533
10.5 0.501 0.232 0.064 0.0065 64818.5 0.281 0.548 0.145 0233 0.079 0.0064 68426.5 75434.5 0323 0.662 0.170 0270 0.093 79742.5 0.669 0.180 0.278 0.094 0.0072 75750.5 0.298 0.690 0.187 0.290 0.101 0.0071 77458.5 0.713 0.199 0.296 0.104 0.0073 77566.5 0.321 0.774 0.206 0.319 0.108 0.0069 79874.5 0.783 0.202 0.308 0.115 0.0075 75482.5 0.766 0.325 0.116 0.0073 76092.5 0.862 0.238 0.357 0.107 0.0073 791
102.5 0325 0.917 0.246 0375 0.127 0.0079 764112.5 0.975 0.276 0.428 0.114 0.0081 7721223 0375 1.01 0.300 0.439 0.118 0.0084 795
GC 35.5 0.531 0.112 0.192 0.077 0.0066 64810.5 0.456 0.579 0.143 0.230 0.084 0.0066 68615.5 0.690 0.192 0.289 0.105 0.0067 69123.5 0.399 0.796 0.243 0.365 0.106 73131.5 0.860 0.254 0.381 0.117 0.0063 70439.5 0.920 0.253 0.397 0.141 0.0079 77358.5 0.486 1.14 0.340 0.490 0.142 0.0068 67767.5 1.24 0.409 0.572 0.151 0.0075 65476.5 0.520 2.33 0.445 0.610 0.145 0.0074 68185.5 1.43 0.429 0.601 0,18094.5 139 0.432 0.594 0.162 0.0075 522
CC 42.5 0.854 0.288 0.345 0.116 0.01385 0.401 0.726 0239 0.312 0.102 656
7.5 60610.5 0.391 0.828 0.288 0.367 0.115 70615.5 0.968 0.350 0.433 0.139 0.0150 76420.5 0.540 1.08 0.413 0.483 0.157 0.0155 81028.5 1.23 0.483 0.532 0.181 0.0197 86936.5 0.668 1.38 0.549 0.587 0.188 0.0205 89042.5 1.42 0375 0.612 0.194 0.0225 203050.5 0.674 1.46 0.573 0.599 0.219 0.0244 106058.5 1.61 0.605 0.625 0.219 0.0256 106066.5 0.792 1.69 0.694 0.675 0246 0.0278 106074 2.09 0.841 0.770 0.294 0.0337
82.5 0.821 1.95 0.802 0.738 0.293 0.0322 109090.5 1.87 0.779 0.726 0.258 0.0303 113097 0.804 1.80 0.720 0.689 0253 0.0294 1130
102.5 0.603 2.12 0.873 0.795 0257 0.0336 1220110.5 0.980 2.21 0.972 0.851 0.274 0.0292 12601183 1280129.5 1.07 12101373 2.51 1.109 0.918 0.282 0.0389 1330145.5 1.225 2.58 1.141 0.944 0.299 1350
CC 52.5 0.439 0.104 0.177 0.068 0.0067 4006.5 0.275 0.457 0.118 0.197 0.073 0.0068 463
10.5 0.477 0.125 0.216 0.077 0.0068 51215.5 0.484 0.131 0.226 0.075 0.0067 55420.5 0.495 0.133 0.236 0.0067 61325.5 0.283 0.527 0.144 0.248 0.086 0.0061 62330.5 0.521 0.127 0.234 0.092 0.0070 652
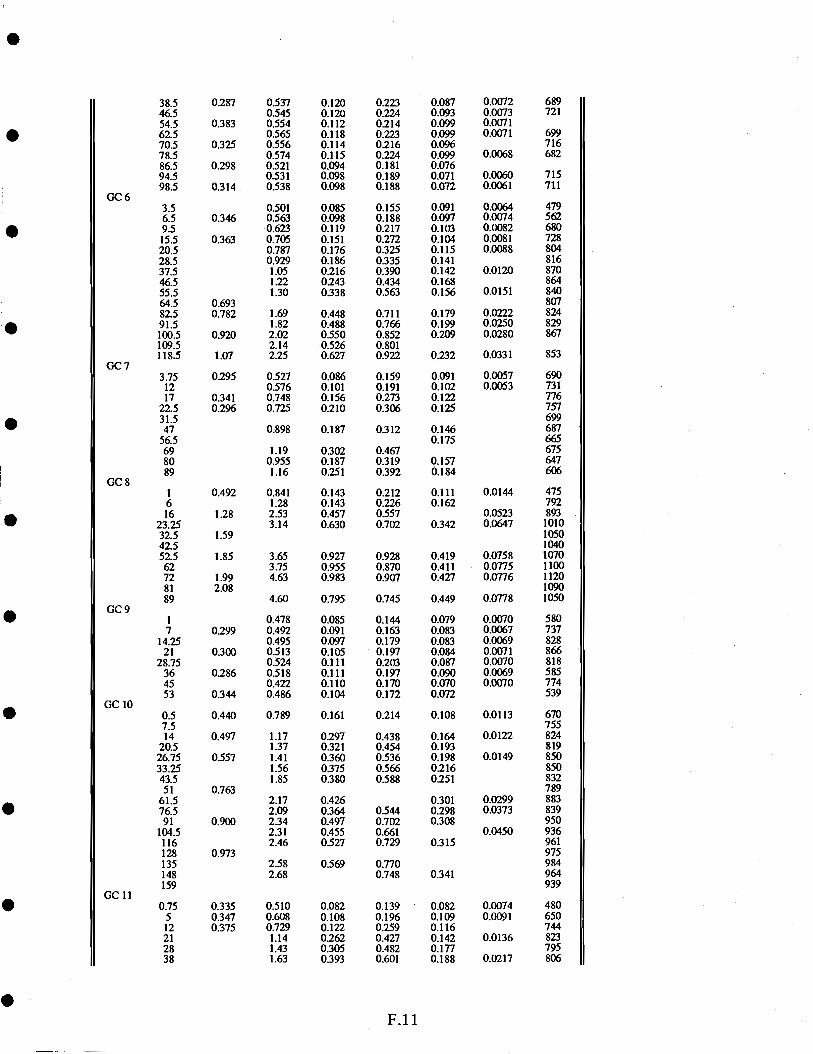
908 L1t00 88F0 1090 £6E0 £91 SE c61. uto zsvo coo vi EtS 9E100 Zf'UO LZVO t9V0 17F1 It 'p171. 91F0 6cv0 tZI0 6ZL0 SLEO 0c9 16000 60F0 96U0 SOFO 8090 L1'EO c 0817 tL0(YO zsoo 6EVO z800 oIco cco LO
6E6 6c1 1796 Si'LO 89t 81'! 1786 OLLO 69c0 8c cE! L6 £L60 StI 196 cico 6ZL0 LZcO 91'Z 911 9E6 oct'00 1990 ccvo lEt ct'oi 0c6 800 ZOLO L610 17EZ 0060 16 6E8 ELEOO 860 t*0 t'9ç0 60t 9L £88 66tff0 I00 9ZVQ LIt 19 681. E9L0 ic zs icro ssco 08E0 csi cEt' ocs 91Z0 99co cLEo 9c1 ocs 6171(10 56F0 9Eco 09E0 WI Lcco cL9t 618 £6F0 t'cvo IZEO LE1 0Z 1ZS Zt100 t'9F0 8W0 L6VO 1.11 L6VO cc ci.
01.9 £I100 8010 t'iZO 1910 68L0 OWO c0
6Eç ZLOO ZLIO tOFO 98V0 t't'EO Ec 17LL OLO(10 OLOO 0L10 OIVO zzvo çp cgc 69000 0600 L6VO IWO SIO 98r0 818 ot.000 L800 WZO itro t'zco cLsz 998 110(10 178(10 L6FO couo ctco ooco it 8t8 690(10 E800 6LFO L600 E6YO czti LEt L9000 E800 E910 16(10 Z6VO 66Z0 1.
osc OLO(10 6L(10 1'I'FO csoo SLVO I
ocol SLLOO 6W0 ct'co 6L0 0917 68 0601 SOt 18 0Z11 9LL(Y0 LZVO L060 £860 E91 661 ZL 0011 cLLOO IWO 0L80 cc6o SLE Z9 OLDI 6W0 8Z61) Lt60 S9E cwi czc Ot'OI Zt' ocol 6ci 0101 1i'900 Zl'EO ZOLO 0E90 I'UE crt £68 EZcoo Lcco two Ect 8V1 91 t6L Z9VO 9Z0 EPUO SZ1 9 SLI' t$100 11i0 ziro £1710 IWO t6V0 1
909 psrO Z6E0 icz'o 911 68 Lt9 two 61E0 LSUO cc60 08 cL9 1.9170 Z0E0 611 69 c99 LFO c.9c L89 9t'IO Z1E0 L810 8680 669 /SL t10 900 01Z0 StL0 96Z0 czz 9LL ?ZFO ELVO 9c10 81'LO I1'EO LI tEL £0C10 WFO 1611) 1011) 9L1) ZI 069 LcOO0 16(10 6cr0 Lzc1) c6to LE
cs ZEZO Zz61) LZ90 ctt Lot csi 1
1081) 9zco t'1Z c601 L98 oszoo 60Z0 zcwo occo Z0Z 0Z61) coot 6Z8 OSZO1) 6611) 991.1) SSt'1) Z81 c16 17Z8 ZZZO1) 61.11) 11L0 81*1) 691 tWO czs LOS £691) ct'9 0178 icloo 9cF0 £9co swo OE1 ccc 1795 5911) 17EVO LIZ 0 WI c917 01.8 OZIO1) Z1710 06E0 91Z0 coi çLL 918 11711) EE1) 9811) 6t61) hog 880(10 c11o czLo 91.11) L8L0 cot 8ZL 180(10 17011) ZLZO iwo coLo £9E0 089 Z8001) EO10 LI0 6111) EZ91) c6 Z9c I'LOOl) 1.600 8810 8601) L9ç1) 91'EO c9 61.17 1'900O 1601) ccro csoo Ioco
111. 19001) ZLIYO SSVO 8600 SL0 17W0 86 cIL 090(10 1L00 6811) 86(10 IEO ct'6
9L01) 18F0 t'óOO itcO 86V0 ç98 Z89 890(10 6601) h'ZtO SIFO t'tco 58L 91L 96110 91V0 I'IFO 9551) SZE1) 669 1L000 6600 LZ0 8110 cco cz9
11.0(10 66110 t'IVO tWO t'cco E8E0 ct'c Itt £L.001) £601) 17ZVO 0Z10 ct'co 689 ZL000 1.801) EZZ0 0111) LEcO LSrO csi
11 3D
01 3D
6 3D
S 3D
L 3D
930

GC 12
GC 13
GC 14
46 0.752 1.77 0.415 0.634 0.199 0.0235 82257 1.91 0.490 0.742 0.212 0.0266 85968 0.885 2.00 0.521 0.794 0.226 0.0287 86379 2.09 0.5 10 0.797 0.234 866
90.5 0.950 2.24 0.555 0.874 0.245 0.0321 869101.5 2.33 0.603 0.943 0.262 0.0345 903
112 1.055 2.47 0.623 0.972 0.288 0.0373 852122 892
2.5 0.528 0.105 0.168 0.078 0.0072 5388 0.343 0.640 0.131 0.217 0.095 643
18.5 0.976 0.200 0.324 0.130 80128 786
37.75 1.61 0.347 0.529 0.188 77847.5 1.78 0.419 0.634 0.202 0.0238 79456 1.85 0.426 0.668 0.209 82863 1.93 0.467 0.701 0.225 820
73.5 0.980 2.23 0.537 0.831 0.251 86381.75 2.08 0.458 0.716 0.244 0.0307 81392.5 2.33 0.500 0.763 0.271 792
102.75 2.44 0.584 0.921 0.278 922
0.5 0.94 0.299 0.397 0.141 0.0126 4886 0.570 1.72 0.250 0.357 0.132 0.0154 696
15 108029 3.44 0.896 0.952 0.351 0.0673 1220
38.25 3.77 1.045 1.002 0.377 0.0734 116045.75 1.98 121053.5 3.73 0.891 0.861 0.0722 124058.5 3.78 0.931 0.870 0.422 0.0847 1220
03 0.503 0.107 0.175 0.075 0.0074 4784.5 0.360 0.722 0.177 0.255 0.102 64812 0.868 0.269 0.369 0.126 0.0115 68127 2.21 0.660 0.560 0.293 97636 106044 2.29 0.621 0.502 0.329 0.0345 95753 2.35 0.588 814
59.5 2.40 0.549 860
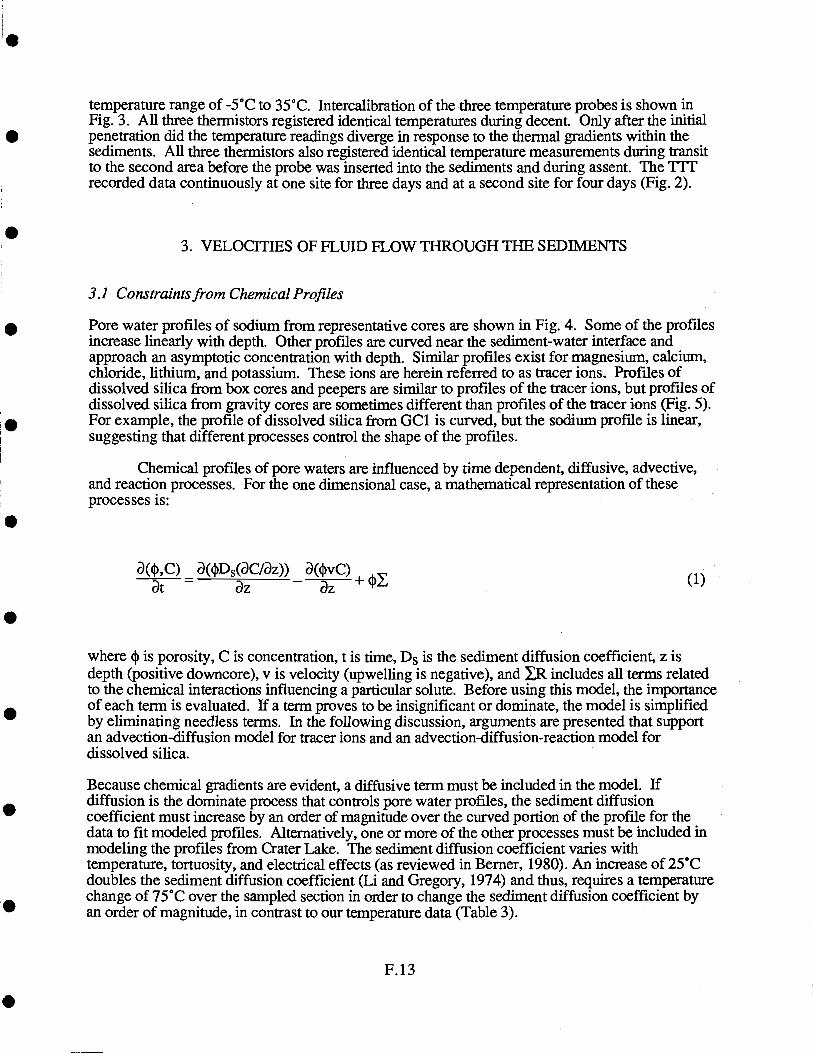
temperature range of -5°C to 35°C. Intercalibration of the three temperature probes is shown inFig. 3. All three thermistors registered identical temperatures during decent. Only after the initialpenetration did the temperature readings diverge in response to the thermal gradients within thesediments. All three thermistors also registered identical temperature measurements during transitto the second area before the probe was inserted into the sediments and during assent. The TVI'recorded data continuously at one site for three days and at a second site for four days (Fig. 2).
3. VELOCnIES OF FLUB) FLOW THROUGH THE SEDIMENTS
3.1 Constraints from Chemical Profiles
Pore water profiles of sodium from representative cores are shown in Fig. 4. Some of the profilesincrease linearly with depth. Other profiles are curved near the sediment-water interface andapproach an asymptotic concentration with depth. Similar profiles exist for magnesium, calcium,chloride, lithium, and potassium. These ions are herein referred to as tracer ions. Profiles ofdissolved silica from box cores and peepers are similar to profiles of the tracer ions, but profiles ofdissolved silica from gravity cores are sometimes different than profiles of the tracer ions (Fig. 5).For example, the profile of dissolved silica from GC1 is curved, but the sodium profile is linear,suggesting that different processes control the shape of the profiles.
Chemical profiles of pore waters are influenced by time dependent, diffusive, advective,and reaction processes. For the one dimensional case, a mathematical representation of theseprocesses is:
a(,C) a(4D(aC/az)) a(vC)at - az - az
where 4 is porosity, C is concentration, t is time, Ds is the sediment diffusion coefficient, z isdepth (positive downcore), v is velocity (upwelling is negative), and R includes all terms relatedto the chemical interactions influencing a particular solute. Before using this model, the importanceof each term is evaluated. If a term proves to be insignificant or dominate, the model is simplifiedby eliminating needless terms. In the following discussion, arguments are presented that supportan advection-diffusion model for tracer ions and an advection-diffusion-reaction modelfordissolved silica.
Because chemical gradients are evident, a diffusive term must be included in the model. Ifdiffusion is the dominate process that controls pore water profiles, the sediment diffusioncoefficient must increase by an order of magnitude over the curved portion of the profile for thedata to fit modeled profiles. Alternatively, one or more of the other processes must be included inmodeling the profiles from Crater Lake. The sediment diffusion coefficient varies withtemperature, tortuosity, and electrical effects (as reviewed in Berner, 1980). An increase of 25°Cdoubles the sediment diffusion coefficient (Li and Gregory, 1974) and thus, requires a temperaturechange of 75°C over the sampled section in order to change the sediment diffusion coefficient byan order of magnitude, in contrast to our temperature data (Table 3).
F. 13
(1)
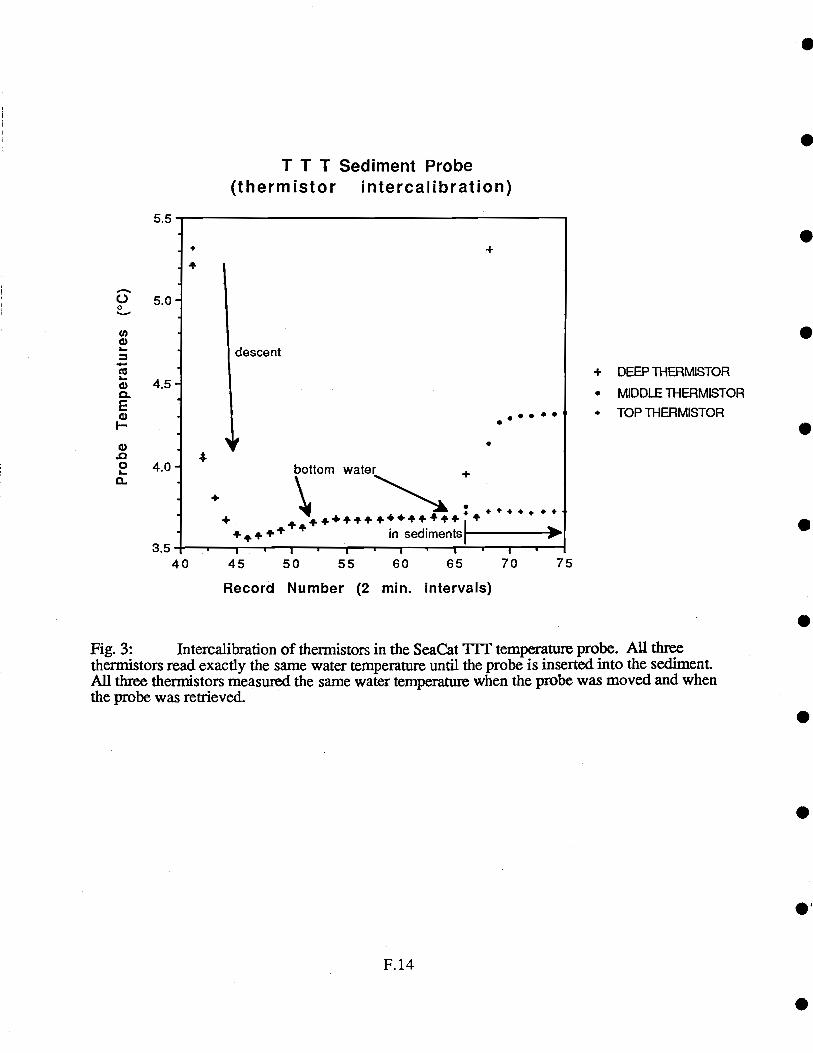
T T T Sediment Probe(thermistor intercalibration)
+
S
++44. 4,..in sedimentsl
+
I -. I
+ DEEP THERMISTOR
MIDDLE THERMISTOR
TOP THERMISTOR
F.14
5.5
4
+
C) 5.0-0
'I)a- descent
w 4.5-C-E
I-
.02a-
4.0- bottom water
++ 44+4 4+44+
3.5 I I
40 45 50 55 60 65 70 75
Record Number (2 mm. intervals)
Fig. 3: Intercalibration of thermistors in the SeaCat IT!' temperature probe. All threethermistors read exactly the same water temperature until the probe is inserted into the sediment.All three thermistors measured the same water temperature when the probe was moved and whenthe probe was retrieved.

2
10 -
14 -
U
0
1 2 3 4 5
PD
130cm/yBC8
BC6 llOcm/y
U
210 cmly
0 1 2 3 4I I I I I
GC 113.1 cmly
Fig. 4: Sodium profiles from representative cores plotted with modeled profiles. Modeledprofiles are calculated from equation (9) using parameters that ait defined in the text.
5
GC86.8cmly
Sodium (mM) Sodium (mM)
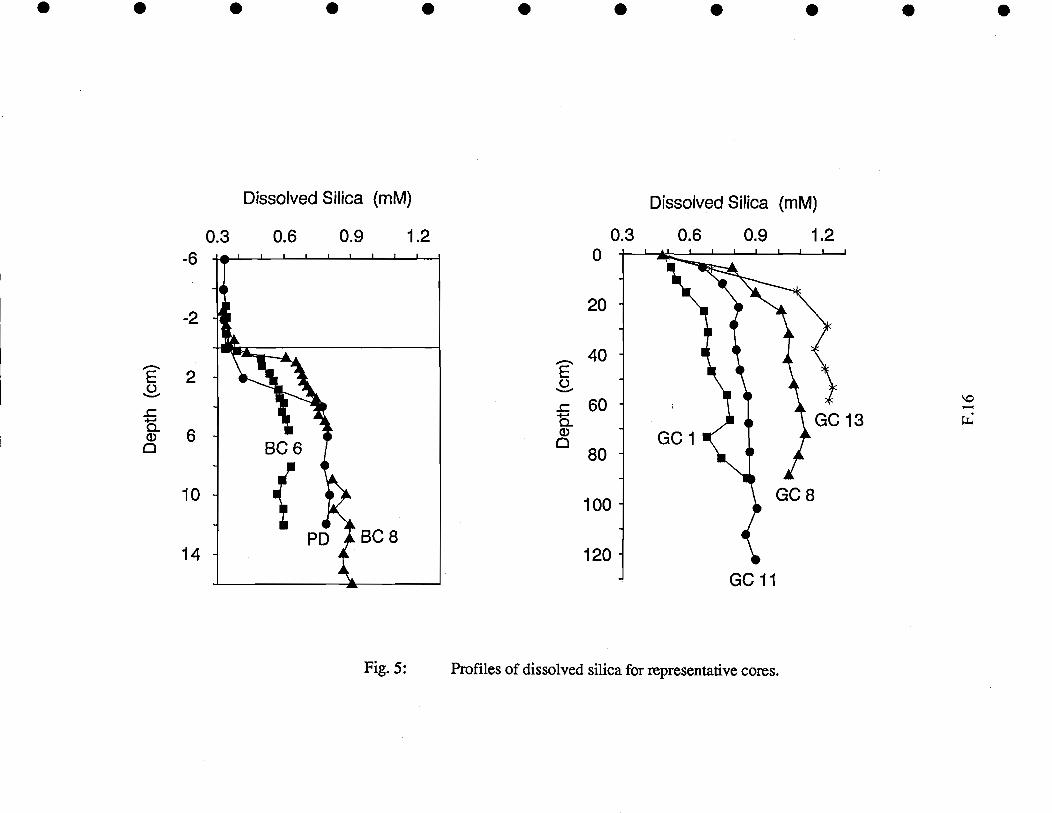
. S S
Dissolved Silica (mM) Dissolved Silica (mM)
0.3 0.6 0.9 1.2 0.3 0.6 0.9 1.2
BC8
0
20
40E
60a-
80
100
120
GC1
GC11
Fig. 5: Profiles of dissolved silica for representative cores.
GC8
GC13
-6
-2
E0
) 60
10
14

The sediment diffusion coefficient is a function of tortuosity, which is a function of the formationfactor and porosity. Although the formation factor was not measured, it is related to porosity byArchie's law (Berner, 1980), and thus, the tortuosity is a function of porosity. The averageporosity decreases from 0.85 near the sediment-water interface to 0.65 at 1.7 m below the lakefloor. This translates to a decrease in the sediment diffusion coefficient with depth.
Electrical effects influence the sediment diffusion coefficient by causing the more mobile ions todiffuse slower and the less mobile ions to diffuse faster. These effects are produced by gradientsof charged ions generating an electrical potential while maintaining elecironeuirality. Electricaleffects alter the sediment diffusion coefficient by less than 25% in most cases, but approach 100%in some samples that have a measured charge balance that is not zero. Because we cannot justifyan order of magnitude change in the sediment diffusion coefficient in the curved portion of theprofile, other terms are needed to model chemical profiles from Crater Lake.
If we develop a time dependent-diffusion model, then for a well mixed lake, such as Crater Lake(Appendix A), all chemical proffles of pore waters would have the same curvature for a particularchemical species, in contrast to the data (Fig. 4). To generate some of the observed profiles, theconcentration of lake water in the past year would have to be more than five times moreconcentrated than present values (Fig. 6), but the concentration of dissolved species in Crater Lakehas been uniform for the past 100 years (Nathenson, 1990). A change in the composition of thefluid in basement with time will produce curved profiles, however these profiles will be concave-down and the measured profiles are concave-up. Therefore, diffusive and either reactive oradvective processes or both are necessary in modeling the chemical profiles from Crater Lake.
Some profiles of dissolved species are influenced by fluid-sediment reactions. For example,dissolution of amorphous silica has been reported to increase the concentration of dissolved silicaover bottom water values in the upper section of the sediment column. Once equilibrium isreached, the concentration of dissolved silica remains uniform with depth (Boudreau, 1990; Wheatand McDuff, submitted B). Similar profiles of dissolved silica are observed in Crater Lake (Fig.5). These profiles are modeled with a reaction term that is first order with respect to the degree ofundersaturation (Schink et al., 1975). If we assume fluid flow does not occur, profiles ofdissolved silica are governed by the following equation:
a2cD---K(C-C)=0 (2)
where k is the first order rate constant and C is the pseudo equilibrium constant. Given thefollowing boundary conditions:
C=C0 at z=0 (3)
C=Ct at Z=zt (4)
the solution is:C = (C0 - C - Ai)exp(-jz) + A1 exp(3z) + Ceq (5)
where:
= (k/d)°5 A1Cbot - Ceq + (Ceq - Co)exp(-fzbot)
exp(zbot) - exp(-3z,ot)
F.17
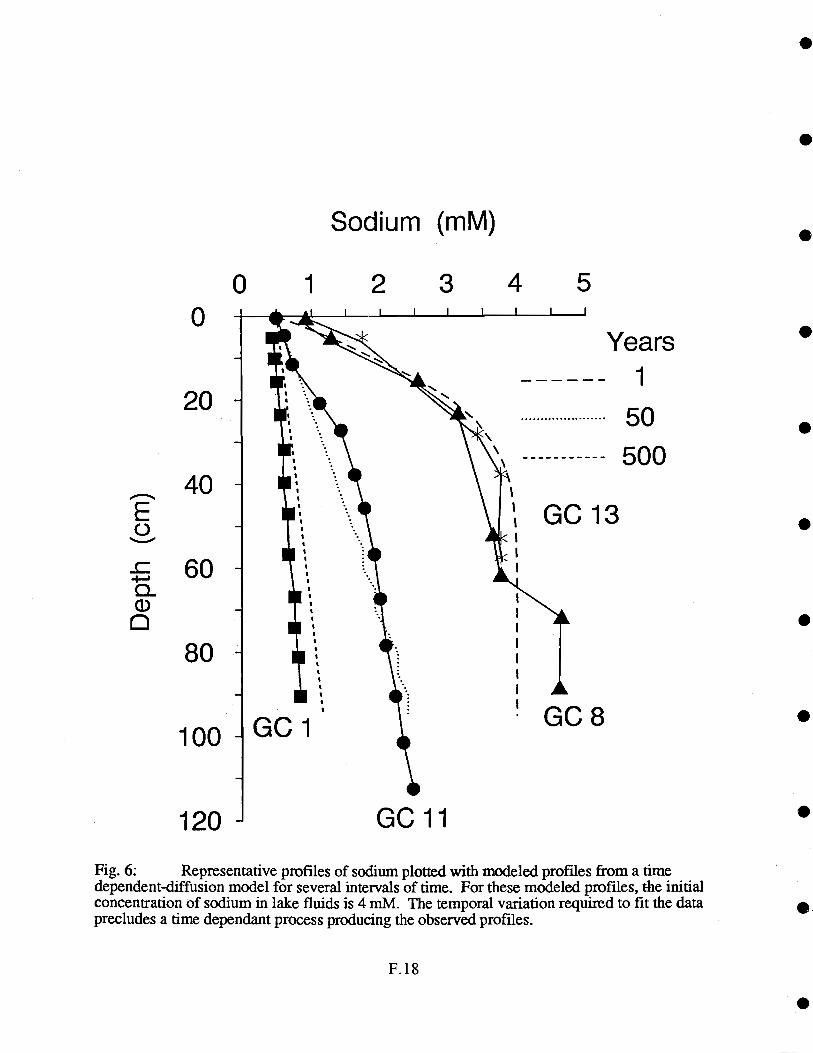
0
Sodium (mM)
GO 11
F. 18
Years1
50500
Fig. 6: Representative pmfiles of sodium plotted with modeled profiles from a timedependent-diffusion model for several intervals of time. For these modeled profiles, the initialconcentration of sodium in lake fluids is 4 mM. The temporal variation required to fit the dataprecludes a time dependant process producing the observed profiles.
52 310
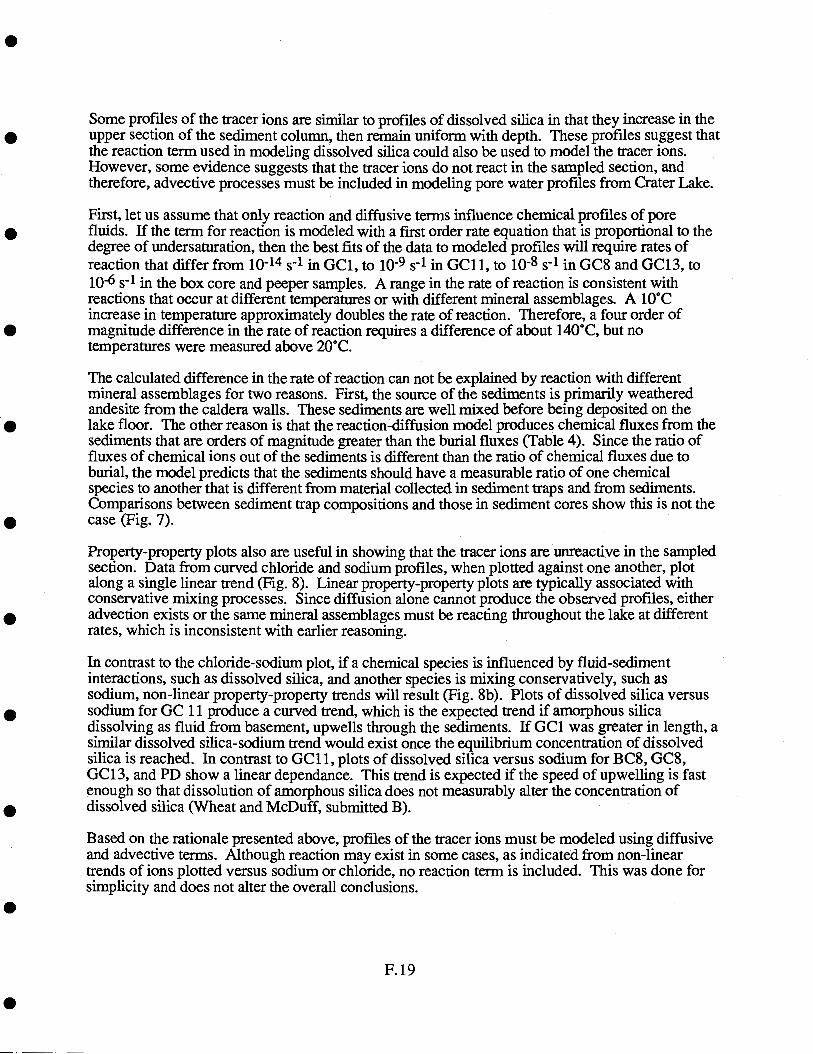
Some profiles of the tracer ions are similar to profiles of dissolved silica in that they increase in theupper section of the sediment column, then remain uniform with depth. These profiles suggest thatthe reaction term used in modeling dissolved silica could also be used to model the tracer ions.However, some evidence suggests that the tracer ions do not react in the sampled section, andtherefore, advective processes must be included in modeling pore water profiles from Crater Lake.
First, let us assume that only reaction and diffusive terms influence chemical profiles of porefluids. If the term for reaction is modeled with a first order rate equation that is proportional to thedegree of undersaturation, then the best fits of the data to modeled profiles will require rates ofreaction that differ from iO-14 s-i in GC1, to io- s-1 in GC11, to 10 s1 in GC8 and GC13, to10-6 s-i in the box core and peeper samples. A range in the rate of reaction is consistent withreactions that occur at different temperatures or with different mineral assemblages. A 10°Cincrease in temperature approximately doubles the rate of reaction. Therefore, a four order ofmagnitude difference in the rate of reaction requires a difference of about 140°C, but notemperatures were measured above 20° C.
The calculated difference in the rate of reaction can not be explained by reaction with differentmineral assemblages for two reasons. First, the source of the sediments is primarily weatheredandesite from the caldera walls. These sediments are well mixed before being deposited on thelake floor. The other reason is that the reaction-diffusion model produces chemical fluxes from thesediments that are orders of magnitude greater than the burial fluxes (Table 4). Since the ratio offluxes of chemical ions out of the sediments is different than the ratio of chemical fluxes due toburial, the model predicts that the sediments should have a measurable ratio of one chemicalspecies to another that is different from material collected in sediment traps and from sediments.Comparisons between sediment trap compositions and those in sediment cores show this is not thecase (Fig. 7).
Property-property plots also are useful in showing that the tracer ions are unreactive in the sampledsection. Data from curved chloride and sodium profiles, when plotted against one another, plotalong a single linear trend (Fig. 8). Linear property-property plots are typically associated withconservative mixing processes. Since diffusion alone cannot produce the observed profiles, eitheradvection exists or the same mineral assemblages must be reacting throughout the lake at differentrates, which is inconsistent with earlier reasoning.
In contrast to the chloride-sodium plot, if a chemical species is influenced by fluid-sedimentinteractions, such as dissolved silica, and another species is mixing conservatively, such assodium, non-linear property-property trends will result (Fig. 8b). Plots of dissolved silica versussodium for GC 11 produce a curved trend, which is the expected trend if amorphous silicadissolving as fluid from basement, upwells through the sediments. If GC1 was greater in length, asimilar dissolved silica-sodium trend would exist once the equilibrium concentration of dissolvedsilica is reached. In contrast to GCI 1, plots of dissolved silica versus sodium for BC8, GC8,GC13, and PD show a linear dependance. This trend is expected if the speed of upwelling is fastenough so that dissolution of amorphous silica does not measurably alter the concentration ofdissolved silica (Wheat and McDuff, submitted B).
Based on the rationale presented above, profiles of the tracer ions must be modeled using diffusiveand advective terms. Although reaction may exist in some cases, as indicated from non-lineartrends of ions plotted versus sodium or chloride, no reaction term is included. This was done forsimplicity and does not alter the overall conclusions.
F.19

Table 4: Chemical fluxes (mg/cm2y) fivm the sediments to the overlyingwater column compared to the burial rate (mglcm2y).
1unpublished data
Table 5: Vertical fluid velocities (cni/y) estimated from the chemical data.Upwelling is negative.
insufficient data
not determined because of sampling artifacts
Table 6: Average TIT measurements for each day of deployment.Fluid velocities are estimated from fits of the data to equation (13).The adjusted depth accounts for the depth that the probe over pene-trated. Upwelling is negative and negative depths are the distanceabove the sediment-water interface.
F.20
Core Na Ca2chemical Species
Mg2 CF r LiOverall
Rate
GC 1 ±0.05 -0.6 ±0.05 ±0.05 ±0.05 ±0.05 ±0.05CC 8 -9.5 -5.2 -4 -11 -16 -10 -8CC 11 -3.1 -1.5 -1.4 -3.6 -3.6 -1.5 -3GC13 -13 -9.6 -8 - -12 -7 -11
PD -130 -100 -80 - -200 -110 -120BC 6 -210 *** *** -220 -220 -240 -220BC8 -110 -150 -120 -80 -120
Date' Area - Temperature (C) ofProbe at:
-5cm 5cm 35cm
Velocity(m/y)
8j24/91 1 3.80 435 5.62 -408/25/91 1 3.95 4.43 5.60 -378/26/91 1 4.03 4.43 5.60 -29
Adjusted Depths11cm 21cm 51cm
8,27/91 2 4.68 5.22 6.44 -118/28/91 2 4.68 5.22 6.44 -118/29/91 2 4.75 5.27 6.45 -148/30/91 2 4.63 5.19 6.44 -108/31/91 2 4.63 5.19 6.44 -10
Chemical BC8 PD BC6 GC13 Burial1Species Rate
Na 4.5 1.9 0.58 0.42 0.032Ca 2.0 0.77 0.23 0.11 0.035Mg 2.0 0.70 0.13 0.06 0.020K 0.75 0.32 0.19 0.11 0.015L 1.6 x 10.2 6.3 x iO 3.2 x i0 2 x iO3 4x l0
Si (as 3.1 1.6 0.82 0.44 0.13H,4SiO4)
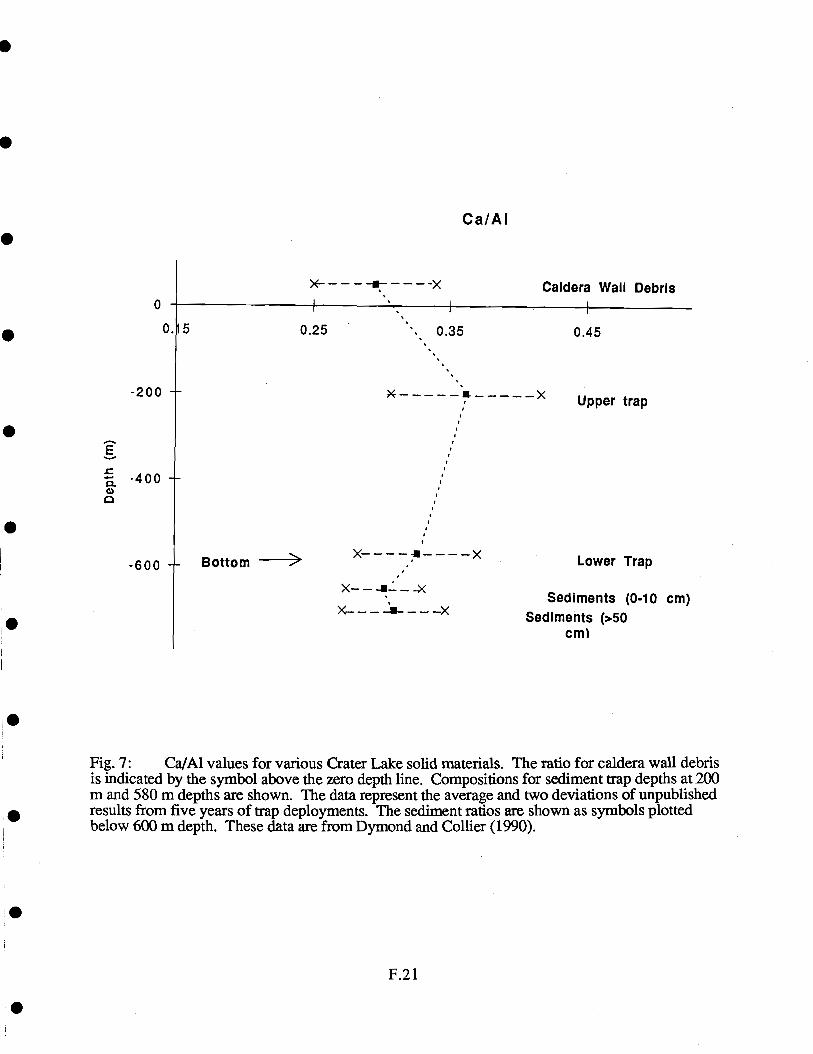
E
:1
0. 5 0.25
Bottom
- ..a -- - - - -x
F.21
Ca/Al
0.35 0.45
Caldera Wall Debris
cm
Upper trap
Lower Trap
Sediments (0-10 cm)Sediments (>50
Fig. 7: Ca/Al values for various Crater Lake solid materials. The ratio for caldera wall debrisis indicated by the symbol above the zero depth line. Compositions for sediment trap depths at 200m and 580 m depths are shown. The data represent the average and two deviations of unpublishedresults from five years of trap deployments. The sediment ratios are shown as symbols plottedbelow 600 m depth. These data are from Dymond and Collier (1990).
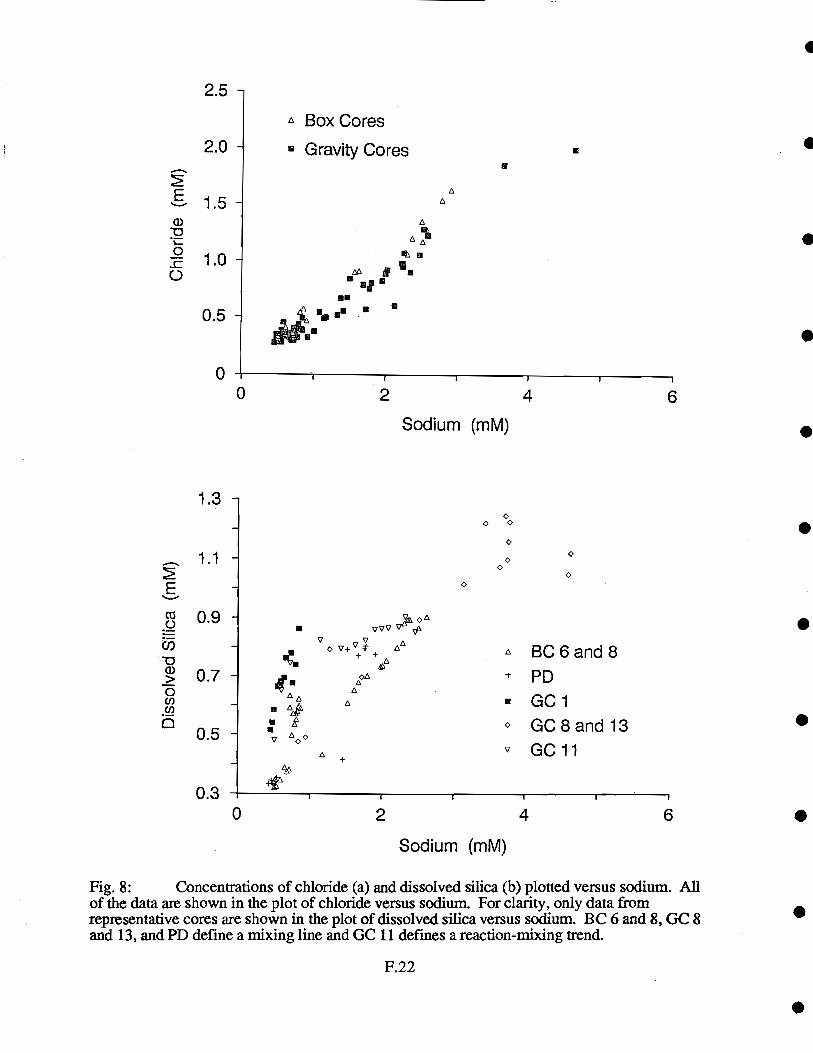
ci)
0
0
2.5 -
2.0 -
1.5 -
1.0 -
0.5 -
0.5
A Box Cores
Gravity Cores
U
u.4'..
v A00
A
A
IIU
V0
A
VVV V
V+V AA+ +A
+
A
A
A
F.22
0
U
S
AA
0
00
0
0
A BC6and8PD
GC10 GC8andl3
GC11
4 6
Sodium (mM)
00 0
0.30 2 4 6
Sodium (mM)
Fig. 8: Concentrations of chloride (a) and dissolved silica (b) plotted versus sodium. Allof the data are shown in the plot of chloride versus sodium.. For clarity, only data fromrepresentative cores are shown in the plot of dissolved silica versus sodium. BC 6 and 8, GC 8and 13, and PD define a mixing line and GC 11 defines a reaction-mixing trend.
. An advection-diffusion model was developed which considers a diffusive term that varies withtortuosity, temperature, and electrical effects. No temperature measurements were made where thecores were taken, however the range of temperatures recorded in hydrothermal features is about 4to 15°C above ambient (Fable 3). An increase of 15°C produces an increase in the sedimentdiffusion coefficient of 60%. Based on the data in Table 3 and in Williams and Von Herzen(1983), the sediment diffusion coefficient most likely increases by less than 30% downcore incores taken in geologic features and even less in other cores. A decrease in the porosity of 14%over the sampled section produces a decrease in the sediment diffusion coefficient of 14%downcore. The use of electrical corrections to the sediment diffusion coefficient was notimplemented, because the charge balance based on measured concentrations was not consistentlyzero. Therefore, because of the uncertainties in calculating proffles of the sediment diffusioncoefficient, a uniform sediment diffusion coefficient with depth was assumed. These coefficientsare calculated from those listed in Li and Gregory (1974) taking into account the temperature ofbottom water 3.7°C, Archiets Law, and a uniform porosity of 0.85 downcore.
Based on a uniform diffusion coefficient with depth and allowing for only advective anddiffusive processes, equation (1) reduces to:
D(2C/az2) - v(aC/az) =0 (6)
Equation (6) is solved subject to the following conditions:
C=C0 at z=0 (7)
C=C at z=Z (8)
where Cj is the concentration of the pore fluid at the base of the core and zt)Ot is the length of thesampled section. The solution is:
C = C0 = A1 + A1 exp(vz/D) (9)where
A1 = tCbotCo}/texp(vzbot/Ds) 1)
Fluid velocities are calculated by fitting profiles of the tracer ions to calculations of equation (9) andminimizing the squared deviation (Figure 4 and Table 5). Differences in the calculated upwellingvelocity for a particular core are a result of the method in which the diffusion coefficient ismodeled, a result of the quality of analytical measurements, and a result of the number ofmeasurements taken in the curved portion of the profile. The calculated advective rates may alsodiffer if fluid-sediment interactions occur in the sampled section. For example, dissolution ofcalcite in GC1 produces a fit to the model with a faster upwelling speed than the speed estimatedfrom the other tracer ions. Similarly, fluid-sediment interactions may influence the calculatedupwelling speed that is estimated from the potassium profile from GC8. In both cases, plots of theion versus sodium are non-linear, which is the expected trend if calcium and potassium areinvolved in fluid-sediment interactions and sodium is mixing conservatively. Differences in thecalculated fluid velocities could be eliminated if a reaction term were included in equation (6) and ifthe rate of reaction were known.
Overall estimates of fluid velocities in representative cores are listed in Table 5. These velocitiesare based primarily on the sodium data, because sodium does not react in the sampled section.
F.23
Other ions, such as chloride and lithium, also do not react in the sampled section; however,chemical analyses of these ions are less sensitive and fewer in number than analyses of sodium.Fluid-sediment reactions involving the other tracer ions may exist in the sampled section of somecores, making these ions less reliable for use in estimating fluid velocities. Fluid velocitiesestimated from the box cores and peeper PD profiles are a minimum. Diffusion in the absence ofadvection after core retrieval and disturbance of the sediment-water interface produce a calculatedvelocity that is slower than the in situ velocity (Wheat and McDuff, submitted A). Velocitiesestimated from PD are a minimum because of the lack of any samples in the curved section of theprofile.
Fluid velocities estimated from calcium and magnesium profiles from box cores are sometimesinconsistent with velocities estimated from the other profiles. This is a product of whole coresqueezing. Whole core squeezing forces pore fluids to flow through overlying sediments. Iffluid-sediment reactions are relatively quick, such as the dissolution of calcite or adsorption-exchange reactions (Bender et al., 1987), an artifact is introduced that increases the concentrationof calcium and magnesium relative to sodium. This is illustrated in property-property plots andproduces a calculated velocity that is different from the in situ velocity.
A measure of the uncertainty in estimating fluid velocities is the value of the reduced x2. Reduced
x2 is calculated with variances that are estimated from concentrations of pore fluids in uniform
sections of the profiles. For sodium, the variance is 0.0021 mM2. Contours of reduced x2 areplotted as a function of the sediment diffusion coefficient and upwelling speed for BC6 and GC1 1(Fig. 9). Reduced x2 values that are greater than 1.8, the 5% value, have a low probability ofbeing the correct set of parameters that describes the observed profile. Note that a range of fluidvelocities and diffusion coefficients provides a reduced X2 that is less than 1.8. The range of fluidvelocities that fit BC6 for a particular diffusion coefficient is greater than the range calculated fromfits of GC1 1 for the same parameters. This is a result of BC6 having only several data points inthe curved section of the profile compared with thirteen points in GC1 1. Below the curved sectionof BC6, data and modeled profiles with fluid velocities greater than lm/y are uniform with depth.Thus, for any velocity greater than 1 nily, reduced x2 values will be the same over the uniformsection. These examples illustrate the uncertainty in modeling chemical profiles from areas withfluid velocities on the order of cm/y compared with larger uncertainties when estimating fluidvelocities on the order of m/y. In areas with fluids upwelling at velocities greater than several mly,a better method for estimating fluid velocities is to fit temperature profiles to advection-diffusionmodels.
32 Constraints from Temperature Profiles
Table 3 presents twenty temperature profiles taken in discrete locations. Temperature profiles aremodeled with an advection-diffusion equation in one dimension:
D'r(a2T/z2) - v(T/az) =0 (10)
where T is temperature (°C) and DT is the thermal diffusivity (2 x 10 cm2/s, Wiffiams and VonHerzen, 1983). Given the following boundary conditions:
T=T0 at z=0 (11)
T=T at z=z (12)
F.24
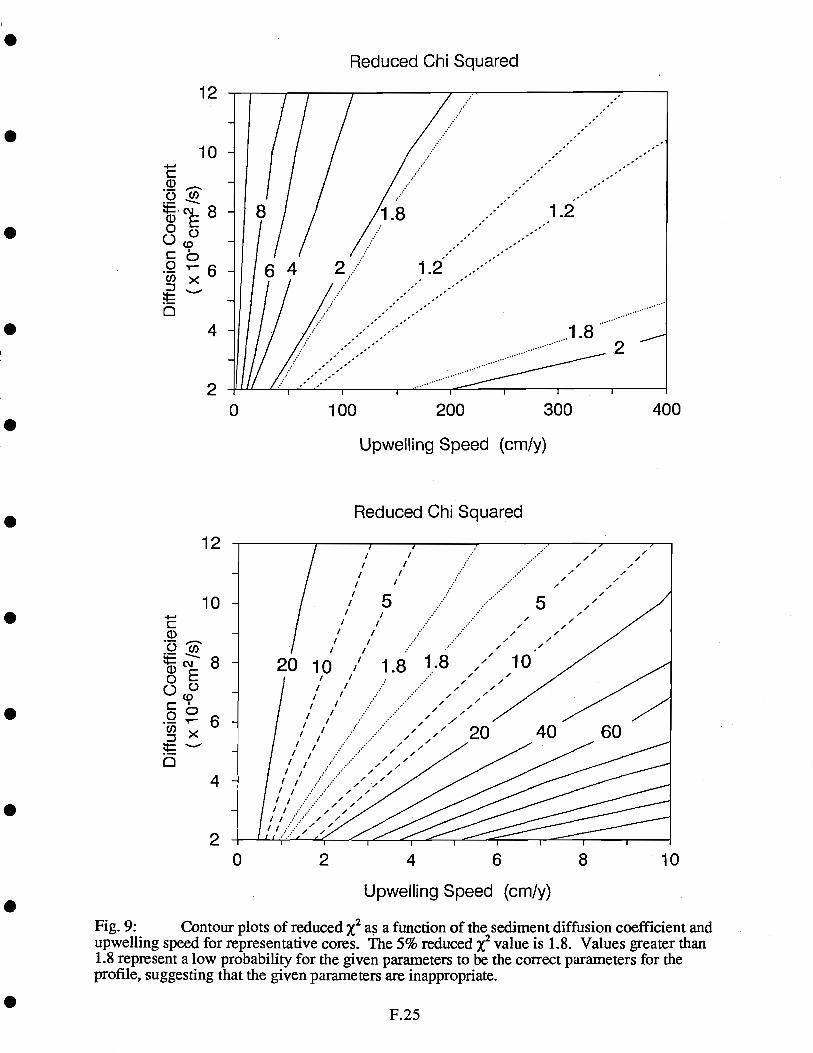
12
10:C
0(0cbOTcnX
0
12
10Ca)Oj
.Q6U,
0
Reduced Chi Squared
F.25
/ / // ,/ /
/ I , // / /5 .../ //
Upwelling Speed (cm/y)
Fig. 9: Contour plots of reduced x2 as a function of the sediment diffusion coefficient andupwelling speed for representative cores. The 5% reduced f value is 1.8. Values greater than1.8 represent a low probability for the given parameters to be the correct parameters for theprofile, suggesting that the given parameters are inappropriate.
0 100 200 300 400
Upwelllng Speed (cmly)
Reduced Chi Squared
1082 4 60
the solution to equation (10) is:
T - T0 1 - exp(vzfDT)Tbot - T0 - 1 - exp(vz/DT)
Fluid velocities are estimated from the temperature data by minimizing the squared deviation of thedata to calculations of equation (13) employing various fluid velocities (Fig. 10, Table 3). Fluidvelocities listed in Table 3 are calculated with a temperature of 3.74° C in the bottom water. Thistemperature differs by at most 0.2°C over the area of study, as determined from temperaturemeasurements that were made with a CTD mounted on the submersible (Appendix A). The rangeof fluid velocities calculated from the data is from less than several m/y to greater than 100 m/y.Uncertainties in the depth and angle of penetration, and uncertainties that result from lake waterseeping into the sediments during insertion of the probe limit the precision of fluid velocitiescalculated from the temperature data. For example, if the depth of penetration of CD222 or CD230is ±3 cm or the angle of penetration is 30°, the calculated fluid velocity is at most 25% differentthan the value listed in Table 3.
Twenty-eight temperature profiles have only one thermistor in the specific target. The highesttemperature that was recorded is 18.9°C and was measured in a bacterial mat. Of the twenty-eighttemperature profiles with a single measurement, eighteen were made in bacterial mats. Six of theeighteen measurements recorded temperatures greater than 10°C at a depth of less than 20 cm.Nine of the twenty-eight temperature profiles with only one temperature measurement were madein iron-manganese rich sediments. Three of these measurements are in the range of 10.5° to11.2°C. A measurement of 6.45°C was made in a pool.
The other temperature probe was deployed for a week. An abbreviated time series record of thedata is presented in Fig. 11 and listed in Table 6. For the first three days of deployment,fluctuations in the temperature of bottom water are less than 0.2° C, as recorded by the probe 5 cmabove the sediment-water interface, and temperature measurements within the sediments areuniform. On the third day of deployment, higher temperature readings were recorded by the twothermistors near the sediment-water interface. These temperature changes reflect either a change inthe upwelling speed or a change in the depth of penetration produced by settling of the probe.
After three days, the TIT probe was moved 30 m away to an area where higher temperatures wererecorded in bottom waters and in the sediments. Temperatures were recorded at the second site forfour days, during which time the three thermistors recorded temperatures that are about 0.8° Cgreater than temperatures recorded at the first site. The almost uniform increase in temperature of0.8°C is not an instrument offset, because all of the thermistors measured 3.56°C in bottom waterafter retrieval of the instrument. Instead, the difference in the recorded temperatures is a product ofthe probe penetrating deeper into the sediment than planned. Assuming that the temperature ofbottom waters above the probe is about 3.9°C, Table 6 lists fluid velocities that are estimated fromthe data by minimizing the least squared deviation to modeled profiles for various depths ofpenetration and fluid velocities.
4. Fluid Flow at the Sediment-Water Interface
Fluid flow at the sediment-water interface in Crater Lake is characterized by small areas with highheat flow and focused upflow, and by much larger areas with low heat flow and fluid velocitiesthat are orders of magnitude less than velocities estimated in zones of focused upflow. Zones of
(13)
F.26
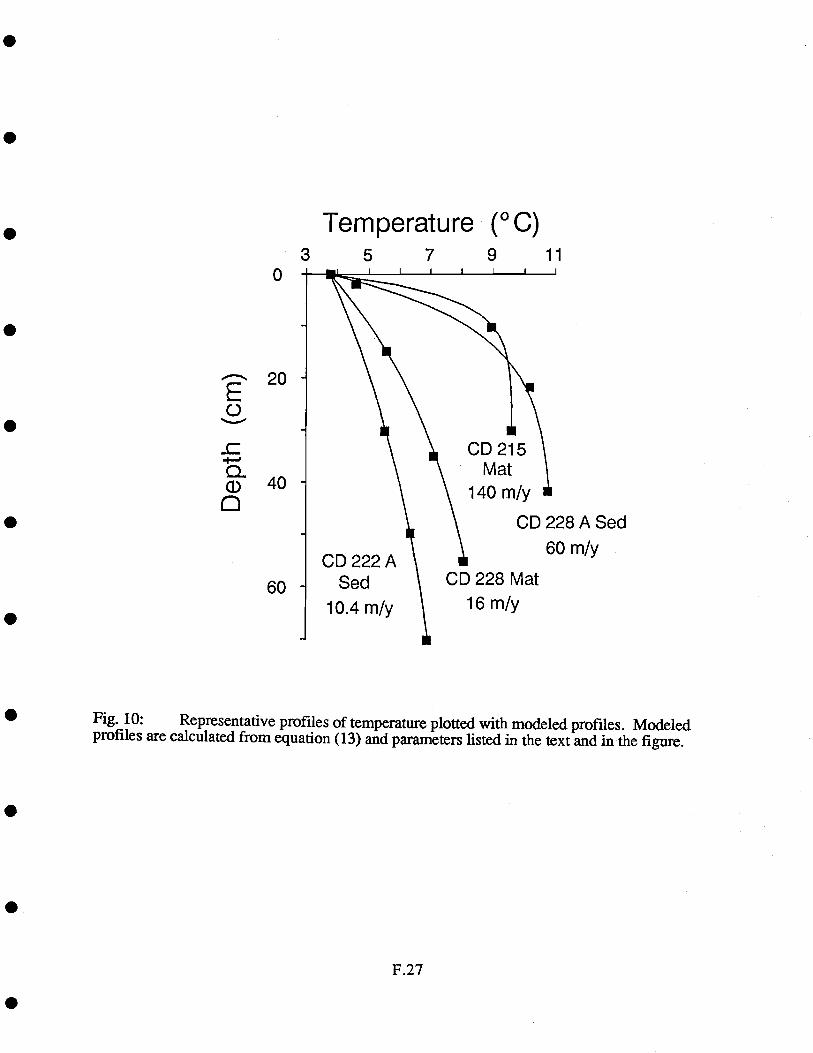
0
0
20 -
-cI.a-G) 40 -0
Temperature (°C)3 5 7 9 11
60 -
CD 222 ASed
10.4 mly
Fig. 10: Representative profiles of temperature plotted with modeled profiles. Modeledprofiles are calculated from equation (13) and parameters listed in the text and in the figure.
F.27
CD 215Mat
140 m/y
CD228ASed60 m/y
CD 228 Mat16 m/y

00
Cl)C)
4-CsI-C)
EC)I-C).00I-0
T T T Sediment Temperature Probe
AREA #1Dive CD222
'I1100 0000 0000
24 Aug 25 Aug 27 Aug0000 0000
28 Aug 30 Aug
TOP THEP1MISTORabove sediment in water)
AREA #2Dive CD226
F.28
I I
0000 171031 Aug 31 Aug
Deployment Time Scale - 4 Hour Increments( some data omitted for clarity )
Fig. 11: Seven day time series record of the T'IT temperature probe is shown. For clarity,we omitted data from 25-26 Aug. and from 28-29 Aug. 1989.
DEEP THERMISTOR(35 cm into the sediment)
MIDDLETHERMISTOR(5 cm into the sediment)
focused upflow occupy areas several m2 to several hundreds of m2 and are identified by iron-manganese rich crusts or by bacterial mats. Temperatures measured in zones with focused upflowand in areas with low heat flow differ by more than two times over a distance of less than 50 m.Fluid velocities also differ from less than 1 mm/y to greater than lOOm/y over a distance of 50 m.These differences are evident in velocities estimated from gravity cores, box cores, peepers, andtemperature measurements that are within '10 m of one another. For example, GC1 3 and BC6 arelocated within 30 m of TTT- 1, but the calculated fluid velocities differ by three orders of magnitude(Tables 3,5, and 6). Differences between BC6 and 'ITF-1 may in part be due to continueddiffusion and the absence of advection after BC6 was taken and before squeezing was commenced(Wheat, 1990). BC8, PD, two gravity cores (GC1O and GC14) and three heat flow measurements(CD216 sediment, CD230 mat, and CD230 pool) provide another example of a range in fluidvelocities that are estimated from measurements within a radius of 50 m.
The temporal variability of fluid velocities in areas with fluid flow is evaluated from the time seriesdata recorded by the TTT probe. The only other time series of this nature was recorded by Leinenet aL, (submitted) in the Mariana Mounds, a ridge-flank hydrothermal system. Both data setssuggest that flow through the sediments is uniform for a period of at least several days. Longerdeployments are required to defme the time span over which variability occurs. Zones of focusedupflow may be maintained for at least several years, as suggested by thriving bacterial matsobserved in the same location during successive years.
The temporal variability of fluid velocities is also constrained by the chemical composition of porefluids. Based on a 5 m sediment thickness, at least several tens of years are required for a fluidthat is upwelling at a speed of 10 cm/y to establish a profile at steady state. More time is requiredto maintain profiles at steady state if upweffing speeds are slower than 10 cm/y or if the sedimentcolumn is deeper than 5 m. Because of the lack of data pertaining to the sediment thickness wheresamples were taken, the temporal variability of flow through the sediments is uncertain, but mustpersist for decades in areas with fluid velocities on the order of mm/y to several cm/y.
Redmond (1990) has identified the lake seepage rate to average 1.3 m/y over the lake bottom. Ofthe numerous temperature profiles and cores taken in Crater Lake, only one core (GC6) hasprofiles of the tracer ions that are concave down, implying that lake fluids downwell in this area, ora time dependent process influences the shape of the profile. If downwelling occurs, a speed ofabout 1 cm/y is required for the data to fit modeled profiles. Because this core is located near othercores taken from a region with focused upflow, if fluids downwell in GC6, then these fluids arepart of a local circulation cell and do not represent a pathway for mass seepage. Local circulationcells may develop from heterogeneities in lateral pressure gradients which are evident frommeasurements of surface heat flow (Wheat and McDuff, submitted A and B). If downwelling doesnot occur, then these profiles are influenced by a time dependent process that has recentlyincreasedthe concentrations of dissolved species near the base of the core, presumably a result of openingand closing pathways for fluid flow.
5. CONCLUSIONS
Based on systematic variations in pore water chemical and thermal properties, evidence has beenpresented that supports the presence of fluid inputs to Crater Lake. These fluids issue from thelake floor at speeds of mm/y to hundreds of m/y in areas associated with iron-manganese richcrusts, bacterial mats, and pools. From extensive submersible and ROY surveys of the southernsection of the south basin, most of the fluid flow from the sediments can be accounted for.
F.29

Acknowledgements
Many individuals contributed their time and effort during the field and laboratory portions of thiswork. The author is particularly appreciative of the generous help provided by Mark Buktenica,Jim Milestone, and the rest of the lake crew at Crater Lake National Park. Galen Whipple and ChiMeredith provided analytical assistance. The author is indebted to Russ McDuff for financialsupport during the field portion of this program This research was funded by the U.S. NationalPark Service under cooperative agreement No. CA 9000-3-0003, CPSU, College of Forestry,Oregon State University.
6. REFLRENCES
Bacon, C.R., Eruptive history of Mount Mazama and Crater Lake Caldera, Cascade Range,U.S.A., J. Volcan. Geotherm. Res., 18, 57-115, 1983.
Bacon, C.R., and M.A. Lamphere, The geologic setting of Crater Lake, Oregon, in Crater Lake:An Ecosystem Study, edited by E.T. Drake, G.L. Larson, J. Dymond, and R.W. Collier,pp. 19-27, American Association for the Advancement of Science, Pacific Division, 1990.
Barber, J.H., and C.H. Nelson, Sedimentary history of Crater Lake Caldera, Oregon, in CraterLake: An Ecosystem Study, edited by E.T. Drake, G.L. Larson, J. Dymond, and R.W.Collier, pp. 29-39, American Association for the Advancement of Science, Pacific Division,1990.
Bender, M., W. Martin, I. Hess, F. Sayles, and L. Ball, A whole core squeezer for interfacialpore water sampling, Limnol. Oceanogr., 32, 1214-1225, 1987.
Bemer, R.A., Early Dia genesis, 241 pp., Princeton University Press, Princeton, NJ, 1980.Boudreau, B.P., Asymptotic forms and solutions of the model for silica-opal dliagenesis in
bioturbated sediments, J. Geophys. Res., 95, 7367-7369, 1990.Bredehoeft, J.D., and I.S. Papadopulos, Rates of vertical groundwater movement estimated from
the earth's thermal profile, Water Resources Research, 1, 325-328, 1965.Collier, R., J. Dymond, J. McManus, R. Conard, C. Meredith, and G. Wheat, Mass balances and
geochemical fluxes derived from hydrothermal activity in Crater Lake, OR, EOS Trans.AGU, 71, 1674, 1990a.
Collier, R., J. Dymond, J. McManus, and J. Lupton, Chemical and physical properties of thewater column at Crater Lake, Oregon, in Crater Lake: An Ecosystem Study, edited by E.T.Drake, G.L. Larson, J. Dymond, and R.W. Collier, pp. 69-79, American Association forthe Advancement of Science, Pacific Division, 1990b.
Dymond J., R.W. Collier, and M.E. Watwood, Bacterial mats from Crater Lake, Oregon and theirrelationship to possible deep-lake hydrothermal venting, Nature, 342, 673-675, 1989.
Dymond, J., and R.W. Collier, The chemistry of Crater Lake sediments: Definition of sourcesand implications for hydrothermal activity, in Crater Lake: An Ecosystem Study, edited byE.T. Drake, G.L. Larson, J. Dymond, and R.W. Collier, pp. 41-60, American Associationfor the Advancement of Science, Pacific Division, 1990.
Leinen, M.L., R.E. McDuff, K. Becker, P. Schuitheiss, K. Dadey, M. Yamano, H. Fujii, J.R.Delaney, C.G. Wheat, M. Robotham, B. Holmen, and A.E. Isley, Off-axis hydrothermalactivity near the Manana Trough spreading center, Earth Planet. Sd. Letters, submitted.
Li, Y.-H., and S. Gregory, Diffusion of ions in seawater and in deep-sea sediments, Geochim.Cosmochim. Acta, 38, 703-7 14, 1974.
McBirney, A.R., Compositional variations of the climatic eruption of Mount Mazama, in AndesiteConference Guide Book, edited by H.M. Dole, pp. 53-56, Oregon Dep. Geo. Mineral. md.Bull., 62, 1968.
McManus, J., R. Collier, and J. Dymond, Heat and salt flux in Crater Lake, OR as deduced fromwater column CTD measurements, EOS Trans. AGU, 71, 1674, 1990.
Nathenson, M., Chemical balance for the major elements in water in Crater Lake, Oregon, in
F.30
Crater Lake. An Ecosystem Study, edited by E.T. Drake, G.L. Larson, J. Dymond, andR.W. Collier, pp. 103-114, American Association for the Advancement of Science, PacificDivision, 1990.
Parsons, T.R., Y. Maita, and C.M. Lalli, A Manual of Chemical and Biological Methods forSeawater Analysis, 173 pp., Pergamon Press, New York, 1984.
Phillips, K.N., Hydroiogy of Crater, East, and Davis Lakes, Oregon, U.S. Geol. Surv. Water-Supply Pap., 1859-E, 66 pp., 1968.
Reilly, J., A chemical mass balance of Crater Lake, Oregon, Masters Thesis, Oregon StateUniversity, 1989.
Redmond, K.T., Crater Lake climate and lake level variability, in Crater Lake: An EcosystemStudy, edited by E.T. Drake, G.L. Larson, J. Dymond, and R.W. Coffier, PP. 127-141,American Association for the Advancement of Science, Pacific Division, 1990.
Schink, D.R., N.L. Guinasso, and K.A. Fanning, Processes affecting the concentration of silicaat the sediment-water interface of the Atlantic Ocean, J. Geophys. Res., 80, 3013-3031,1975.
Simpson, H.J., Closed basin lakes as a tool in geochemistry, 325 pp., Ph.D. Dissertation,Columbia University, 1970a.
Simpson, H.J., Tridium in Crater Lake, Oregon, J. Geophys. Res, 75, 5195-5207, 1970b.Van Denburg, A.S., Chemistry of the lakes, in Hydrology of Crater, East, and Davis Lakes,
Oregon, edited by K.N. Phillips, pp. 41-45, U.S. Geological Survey, 1968.Wheat, C.G., Fluid circulation and diagenesis in an off-aris hydrothennal system: The Mariana
Mounds, 204 pp., Ph.D. Thesis, University of Washington, Seattle, WA, 1990.Wheat, C.G., and R.E. McDuff, Mapping the fluid flow of the Mañana Mounds off-axis
hydrothermal system: Power water chemical tracers, Earth Planet. Sci. Lett., submitted A.Wheat, C.G., and R.E. McDuff, Hydrothermal flow through the Mañana Mounds: Dissolution of
amorphous silica and degradation of organic matter on a mid-ocean ridge flank, Geochim.Cosmochim. Acta, submitted B.
Williams, D.L., and R.P. Von Herzen, On the terrestrial heat flow and physical limnology ofCrater Lake, Oregon, .1. Geophys. Res., 88, 1094-1104, 1983.
F.3 1
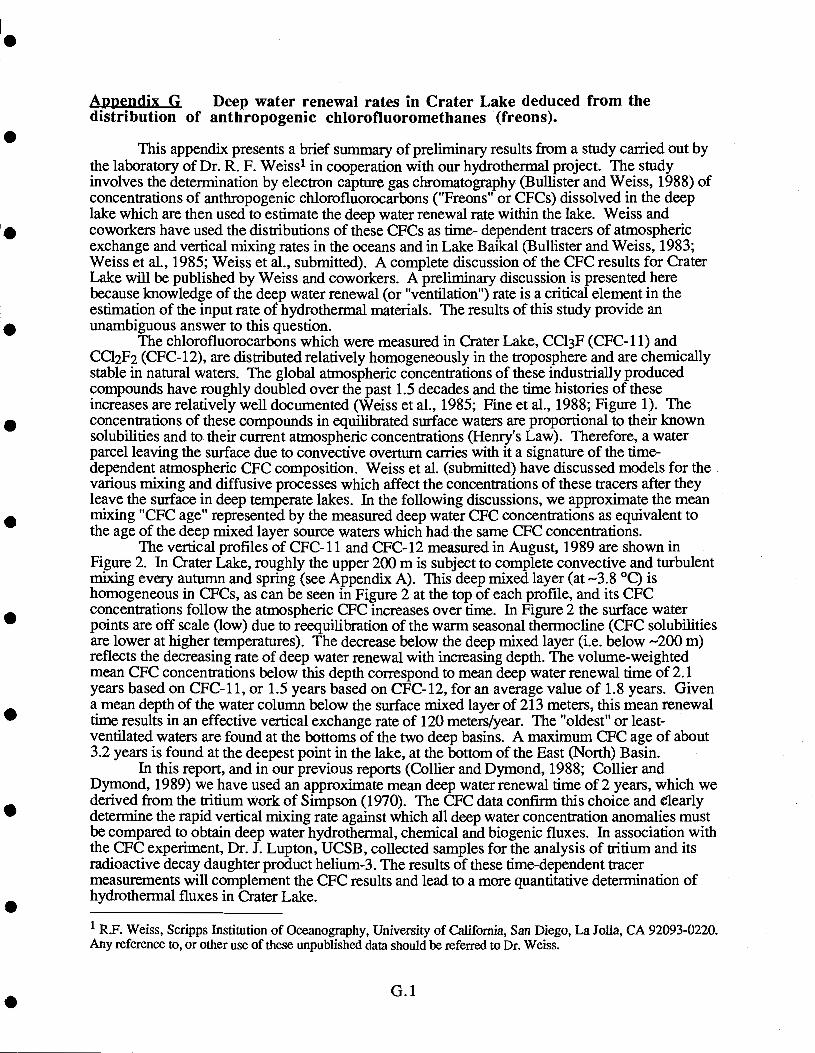
Appendix G Deep water renewal rates in Crater Lake deduced from thedistribution of anthropogenic chiorofluoromethanes (freons).
This appendix presents a brief summary of preliminary results from a study canied out bythe laboratory of Dr. R. F. Weiss1 in cooperation with our hydrothermal project. The studyinvolves the determination by electron capture gas chromatography (Bullister and Weiss, 1988) ofconcentrations of anthropogenic chiorofluorocarbons ("Freons" or CFCs) dissolved in the deeplake which are then used to estimate the deep water renewal rate within the lake. Weiss andcoworkers have used the distributions of these CFCs as time- dependent tracers of atmosphericexchange and vertical mixing rates in the oceans and in Lake Baikal (Buffister and Weiss, 1983;Weiss et al., 1985; Weiss et al., submitted). A complete discussion of the CFC results for CraterLake will be published by Weiss and coworkers. A preliminary discussion is presented herebecause knowledge of the deep water renewal (or "ventilation") rate is a critical element in theestimation of the input rate of hydrothermal materials. The results of this study provide anunambiguous answer to this question.
The chlorofluorocarbons which were measured in Crater Lake, CC13F (CFC-11) andCC12F2 (CFC-12), are distributed relatively homogeneously in the troposphere and are chemicallystable in natural waters. The global atmospheric concentrations of these industrially producedcompounds have roughly doubled over the past 1.5 decades and the time histories of theseincreases are relatively well documented (Weiss et al., 1985; Fine et al., 1988; Figure 1). Theconcentrations of these compounds in equilibrated surface waters are proportional to their knownsolubilities and to their current atmospheric concentrations (Henry's Law). Therefore, a waterparcel leaving the surface due to convective overturn carries with it a signature of the time-dependent atmospheric CFC composition. Weiss et al. (submitted) have discussed models for thevarious mixing and diffusive processes which affect the concentrations of these tracers after theyleave the surface in deep temperate lakes. In the following discussions, we approximate the meanmixing "CFC age" represented by the measured deep water CFC concentrations as equivalent tothe age of the deep mixed layer source waters which had the same CFC concentrations.
The vertical profiles of CFC-11 and CFC-12 measured in August, 1989 are shown inFigure 2. In Crater Lake, roughly the upper 200 m is subject to complete convective and turbulentmixing every autumn and spring (see Appendix A). This deep mixed layer (at 3.8 °C) ishomogeneous in CFCs, as can be seen in Figure 2 at the top of each profile, and its CFCconcentrations follow the atmospheric CFC increases over time. In Figure 2 the surface waterpoints are off scale (low) due to reequilibration of the warm seasonal thermodine (CFC solubiitiesare lower at higher temperatures). The decrease below the deep mixed layer (i.e. below 200 m)reflects the decreasing rate of deep water renewal with increasing depth. The volume-weightedmean CFC concentrations below this depth correspond to mean deep water renewal time of 2.1years based on CFC-1 1, or 1.5 years based on CFC-12, for an average value of 1.8 years. Givena mean depth of the water colunm below the surface mixed layer of 213 meters, this mean renewaltime results in an effective vertical exchange rate of 120 meters/year. The "oldest" or least-ventilated waters are found at the bottoms of the two deep basins. A maximum CFC age of about3.2 years is found at the deepest point in the lake, at the bottom of the East (North) Basin.
In this report, and in our previous reports (Collier and Dymond, 1988; Collier andDymond, 1989) we have used an approximate mean deep water renewal time of 2 years, which wederived from the tritium work of Simpson (1970). The CFC data confirm this choice and clearlydetermine the rapid vertical mixing rate against which all deep water concentration anomalies mustbe compared to obtain deep water hydrothermal, chemical and biogenic fluxes. In association withthe CFC experiment, Dr. J. Lupton, UCSB, collected samples for the analysis of iritium and itsradioactive decay daughter product helium-3. The results of these time-dependent tracermeasurements will complement the CFC results and lead to a more quantitative determination ofhydrothermal fluxes in Crater Lake.
1 R.F. Weiss, Scripps Institution of Oceanography, University of California, San Diego, La Jolla, CA 92093-0220.Any reference to, or other use of these unpublished data should be referred to Dr. Weiss.
G.1
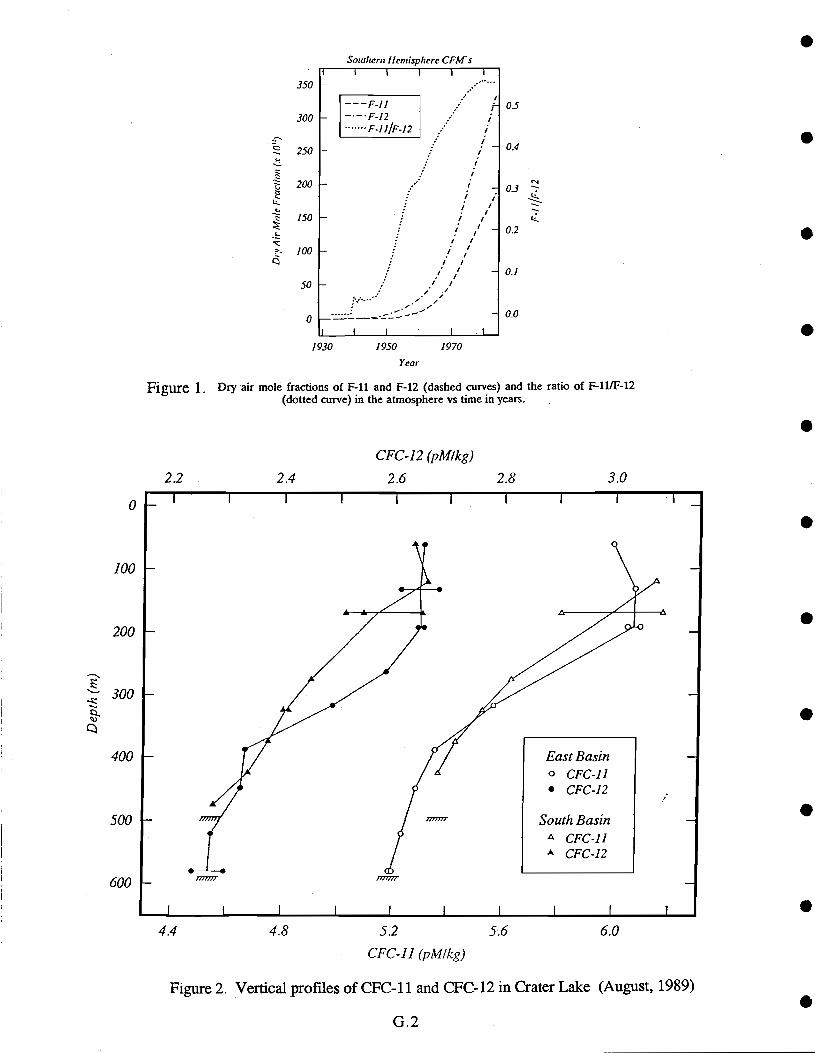
0
100
200
300
400
500
600
Figure 1.
Southern Hemisphere CFMs
G.2
Dry air mole fractions of F-il and F-12 (dashed curves) and the ratio of F-1JJF-12(dotted curve) in the atmosphere vs time in years.
?.
350
300
250
200
150
/00
50
0
I I I 1 I
r
I
/ -i I
i/I-/ I
F I/ I
./II
//I
I .1
0.5
0.4
03
0.2
0.l
0.0
L.
---F-Il
F-I l/F-12
CFC-12 (pM/kg)
22 2.4 2.6 2.8 3.0
4.4 4.8 5.2 5.6 6.0
CFC-11 (pM/kg)
Figure 2. Vertical profiles of CFC- 11 and CFC- 12 in Crater Lake (August, 1989)
1930 1950 1970
Year
Appendix H. Submersible Locations and Dive Summaries
Table Hi. 1987 ROY and 1988, 1989 Crater Lake Submersible Dive Summary H.2
1989 Hydrothermal Dive Tracks and Summaries H.3
i989 USGS Dive Tracks and Summaries H.16
1989 Biology Dive Tracks and Summaries H.i8
H.i
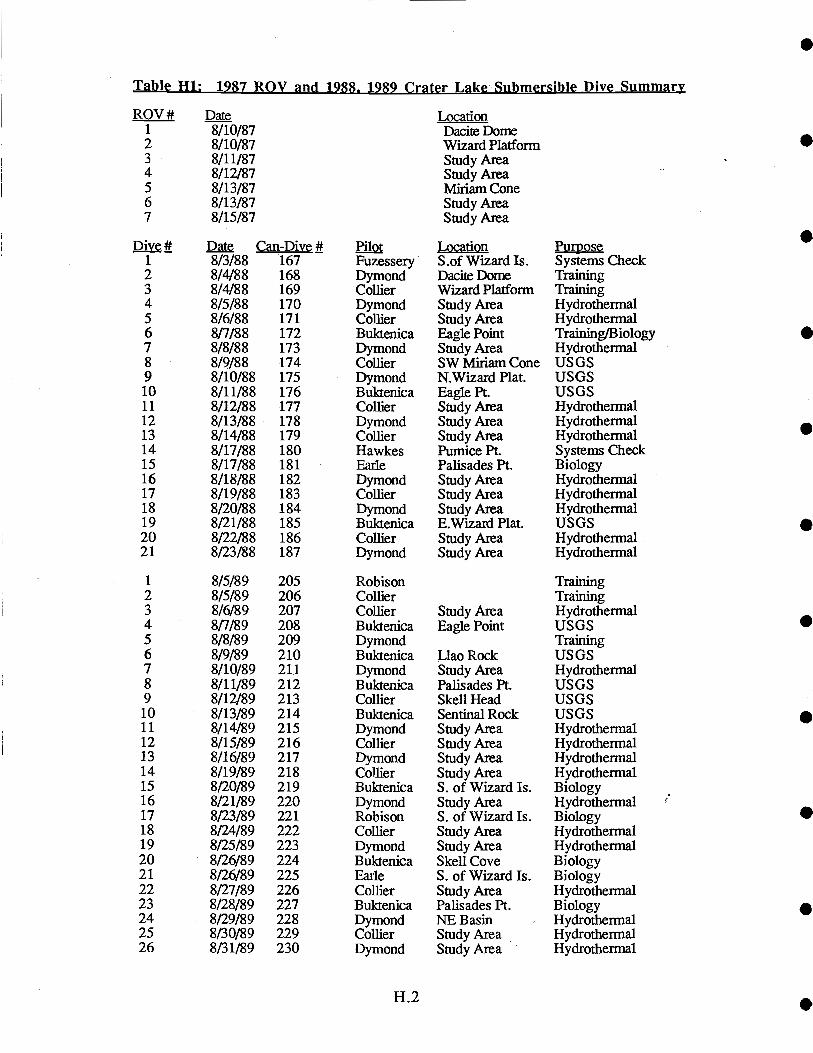
H.2
T.1 H S.1 5,. S. II, L.k umr iiI Ii mmrROV # Date Location
1 8/10/87 Dacite I)ome2 8/10/87 Wizard Platform3 8/11/87 Study Area4 8/12/87 Study Area5 8/13/87 Miriam Cone6 8/ 13/87 Study Area7 8/15/87 Study Area
Can-Dive # Pilot Location Purpose1 8/3/88 167 Fuzessery S.of Wizard Is. Systems Check2 8/4/88 168 Dymond Dacite Dome Training3 8/4/88 169 Coffler Wizard Platform Training4 8/5/88 170 Dymond Study Area Hydrothermal5 8/6/88 171 Collier Study Area Hydrothermal6 8/7/88 172 Buktenica Eagle Point Training/Biology7 8/8/88 173 Dymond Study Area Hydrothermal8 8/9/88 174 Collier SW Miriam Cone USGS9 8/10/88 175 Dymond N.Wizard Plat. USGS
10 8/11/88 176 Buktenica Eagle Pt. USGS11 8/12/88 177 Collier Study Area Hydrothermal12 8/13/88 178 Dymond Study Area Hydrothermal13 8/14/88 179 Collier Study Area Hydrothermal14 8/17/88 180 Hawkes Pumice Pt. Systems Check15 8/17/88 181 Earle Palisades Pt. Biology16 8/18/88 182 Dymond Study Area Hydrothennal17 8/19/88 183 Collier Study Area Hydrothermal18 8/20/88 184 Dymond Study Area Hydrothermal19 8/21/88 185 Buktenica E.Wizard Plat. USGS20 8/22/88 186 Collier Study Area Hydrothermal21 8/23/88 187 Dymond Study Area Hydrothennal
1 8/5/89 205 Robison Training2 8/5/89 206 Collier Training3 8/6/89 207 Collier Study Area Hydrothermal4 8/7/89 208 Buktenica Eagle Point USGS5 8/8/89 209 Dymond Training6 8/9/89 210 Buktenica Uao Rock USGS7 8/10/89 211 Dymond Study Area Hydrothermal8 8/11/89 212 Buktenica Palisades Pt. USGS9 8/12/89 213 Collier Skell Head USGS10 8/13/89 214 Buktenica Sentinal Rock USGS11 8/14/89 215 Dymond Study Area Hydrothermal12 8/15/89 216 Coffier Study Area Hydrothermal13 8/! 6/89 217 Dymond Study Area Hydrothermal14 8/19/89 218 Coffier Study Area Hydrothermal1516
8/20/89 2198/21/89 220
BukienicaDymond
S. of Wizard Is. BiologyStudy Area Hydrothermal
17 8/23/89 221 Robison S. of Wizard Is. Biology18 8/24/89 222 Collier Study Area Hydrothermal19 8/25/89 223 Dymond Study Area Hydrothermal202122
8/26/89 2248/26/89 2258/27/89 226
BuktenicaEarleCollier
Skell Cove BiologyS. of Wizard Is. BiologyStudy Area Hydrothermal
2324
8/28/89 2278/29/89 228
BuktenicaDymond
Palisades Pt. BiologyNE Basin Hydrothermal
25 8/30/89 229 Collier Study Area Hydrothermal26 8/31/89 230 Dymond Study Area Hydrothermal
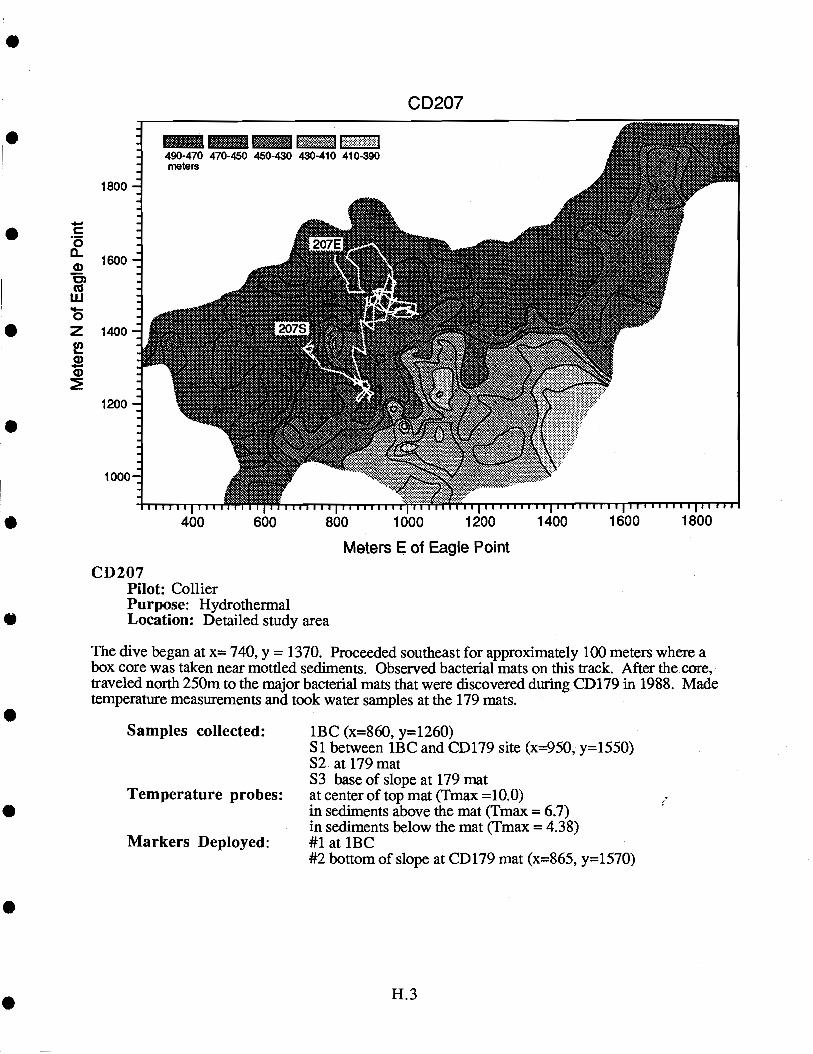
C00a)C)('SUi
0za)4-a)
1800
1600
1400
1200
1000
490-470 470-450 450-430 430-410 410-390meters
400 600 800 1000 1200 1400 1600 1800
Meters E of Eagle Point
CD207Pilot: CollierPurpose: HydrothermalLocation: Detailed study area
The dive began at x= 740, y = 1370. Proceeded southeast for approximately 100 meters where abox core was taken near mottled sediments. Observed bacterial mats on this track. After the core,traveled north 250m to the major bacterial mats that were discovered during CD 179 in 1988. Madetemperature measurements and took water samples at the 179 mats.
Samples collected:
Temperature probes:
Markers Deployed:
207S
207E
CD207
H.3
1BC (x=860, y=l26O)Si between 1BC and CD179 site (x=950, y=i55O)S2 atl79matS3 base of slope at 179 matat center of top mat (Tmax =10.0)in sediments above the mat (Tmax = 6.7)in sediments below the mat (Tmax = 4.38)#1 at 1BC#2 bottom of slope at CD 179 mat (x=865, y=l570)
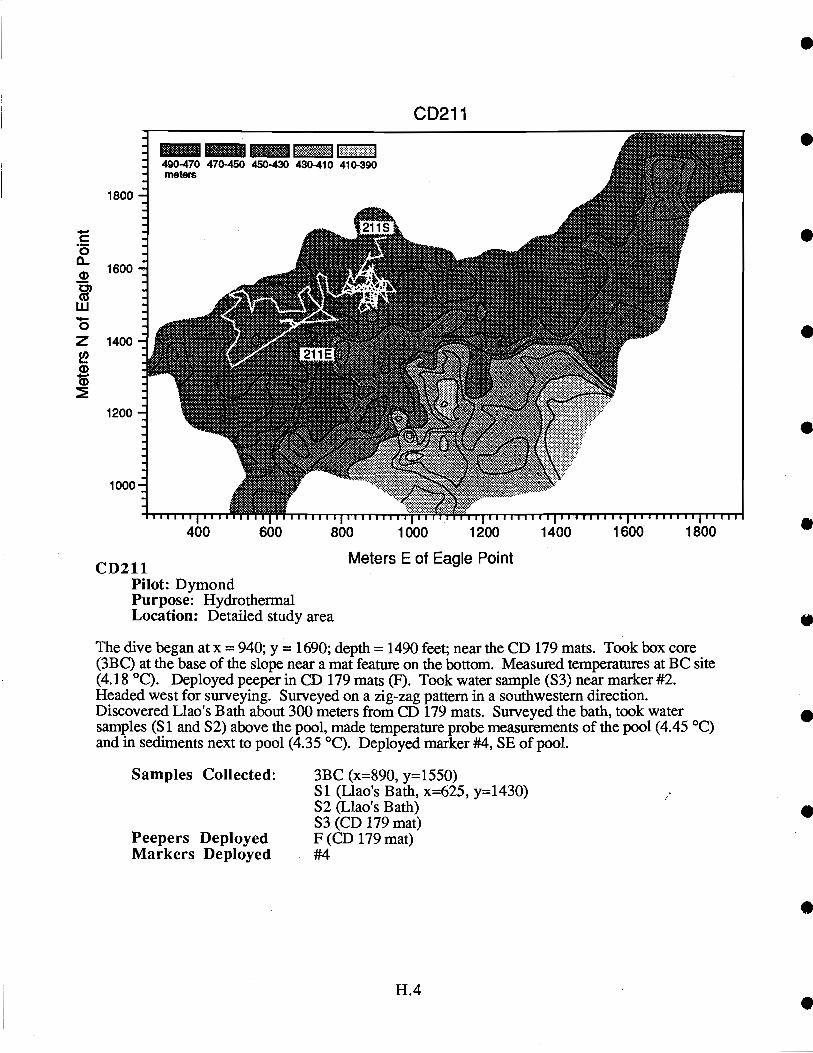
1800
4-C
1600
w.4-0Z 1400
0)
1000
490-470 470-450 450-430 430-410 410-390meters
211 E
211S
400 600 800 1000 1200 1400 1600 1800
CD211 Meters E of Eagle Point
Pilot: DymondPurpose: HydrothermalLocation: Detailed study area
The dive began at x = 940; y = 1690; depth 1490 feet; near the CD 179 mats. Took box core(3BC) at the base of the slope near a mat feature on the bottom. Measured temperatures at BC site(4.18 °C). Depioyed peeper in CD 179 mats (F). Took water sample (S3) near marker #2.Headed west for surveying. Surveyed on a zig-zag pattern in a southwestern direction.Discovered Llao's Bath about 300 meters from CD 179 mats. Surveyed the bath, took watersamples (Si and S2) above the pool, made temperature probe measurements of the pool (4.45 °C)and in sediments next to pool (4.35 °C). Deployed marker #4, SE of pool.
Samples Collected: 3BC (x=890, y=i55O)51 (Llao's Bath, x=625, y=l43O)S2 (Llao's Bath)S3 (CD 179 mat)
Peepers Deployed F (CD 179 mat)Markers Deployed #4
H.4
CD211
1200b k:* :'-
O
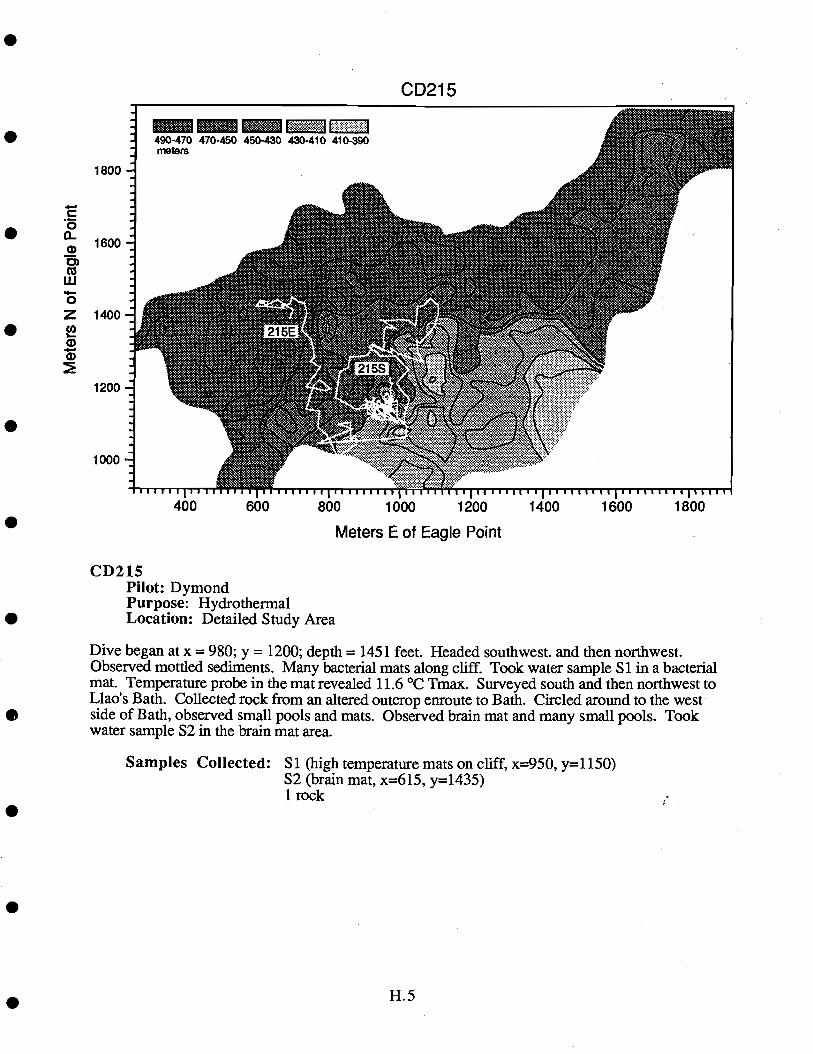
490-470 470-450 450-430 430-410 410-390meters
CD215
400 600 800 1000 1200 1400 1600 1800
Meters E of Eagle Point
CD215Pilot: DymondPurpose: HydrothermalLocation: Detailed Study Area
Dive began at x = 980; y = 1200; depth = 1451 feet. Headed southwest, and then northwest.Observed mottled sediments. Many bacterial mats along cifL Took water sample Si in a bacterialmat. Temperature probe in the mat revealed 11.6 °C Tmax. Surveyed south and then northwest toLlao's Bath. Collected rock from an altered outcrop enroute to Bath. Circled around to the westside of Bath, observed small pools and mats. Observed brain mat and many small pools. Tookwater sample S2 in the brain mat area.
Samples Collected: Si (high temperature mats on cliff, x=950, y=1 150)S2 (brain mat, x=615, yl435)irock
1800
'I-C
1600
Z 140021 5E
1200
1000
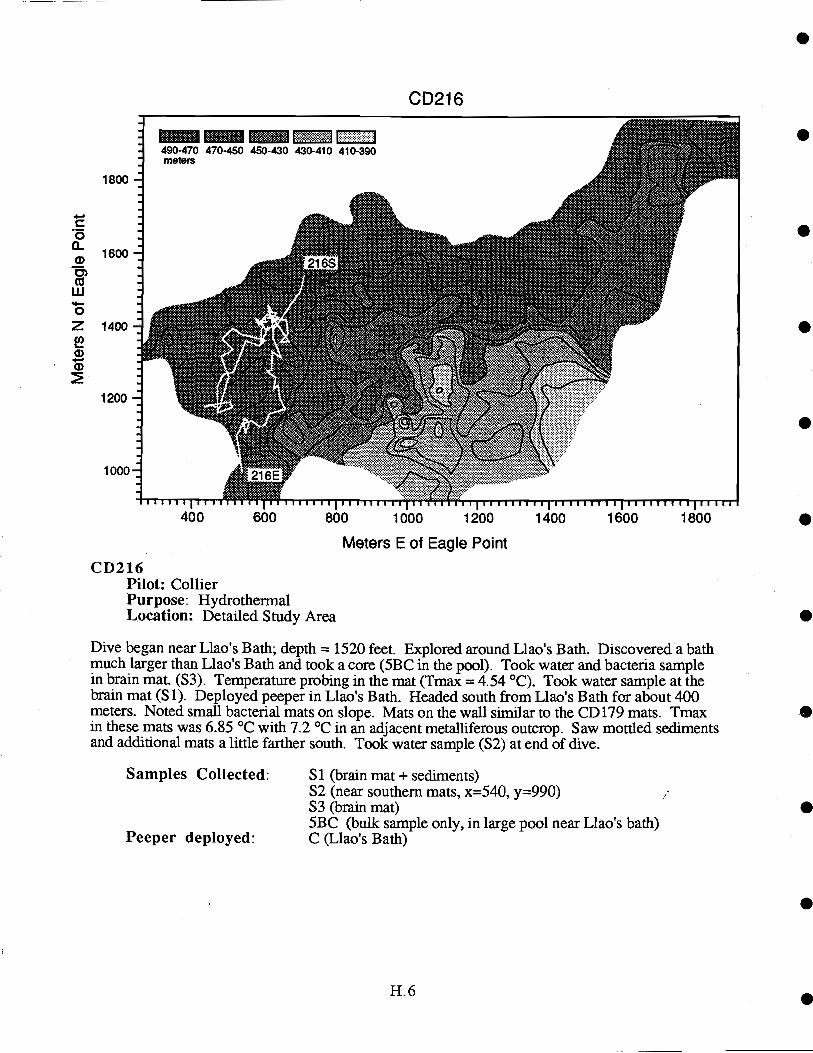
1800
C00a)0)w'I-0Z 1400
I-.
1600
1200
1000
L.490-470 470-450 450-430 430-410 410-390meters
I21 6E
Samples Collected:
Peeper deployed:
21 6S
H. 6
CD216
Si (brain mat + sediments)S2 (near southern mats, x=540, y=99O)S3 (brain mat)5BC (bulk sample only, in large pool near Llao's bath)C (Llao's Bath)
400 600 800 1000 1200 1400 1600 1800
Meters E of Eagle Point
CD216Pilot: CollierPurpose: HydrothermalLocation: Detailed Study Area
Dive began near Llao's Bath; depth 1520 feet. Explored around Llao's Bath. Discovered a bathmuch larger than Llao's Bath and took a core (5BC in the pool). Took water and bacteria samplein brain mat. (S3). Temperature probing in the mat (Tmax = 4.54 °C). Took water sample at thebrain mat (Si). Deployed peeper in Llao's Bath. Headed south from Llao's Bath for about 400meters. Noted small bacterial mats on slope. Mats on the wall similar to the CD 179 mats. Tmaxin these mats was 6.85 °C with 7.2 °C in an adjacent metalliferous outcrop. Saw mottled sedimentsand additional mats a little farther south. Took water sample (S2) at end of dive.
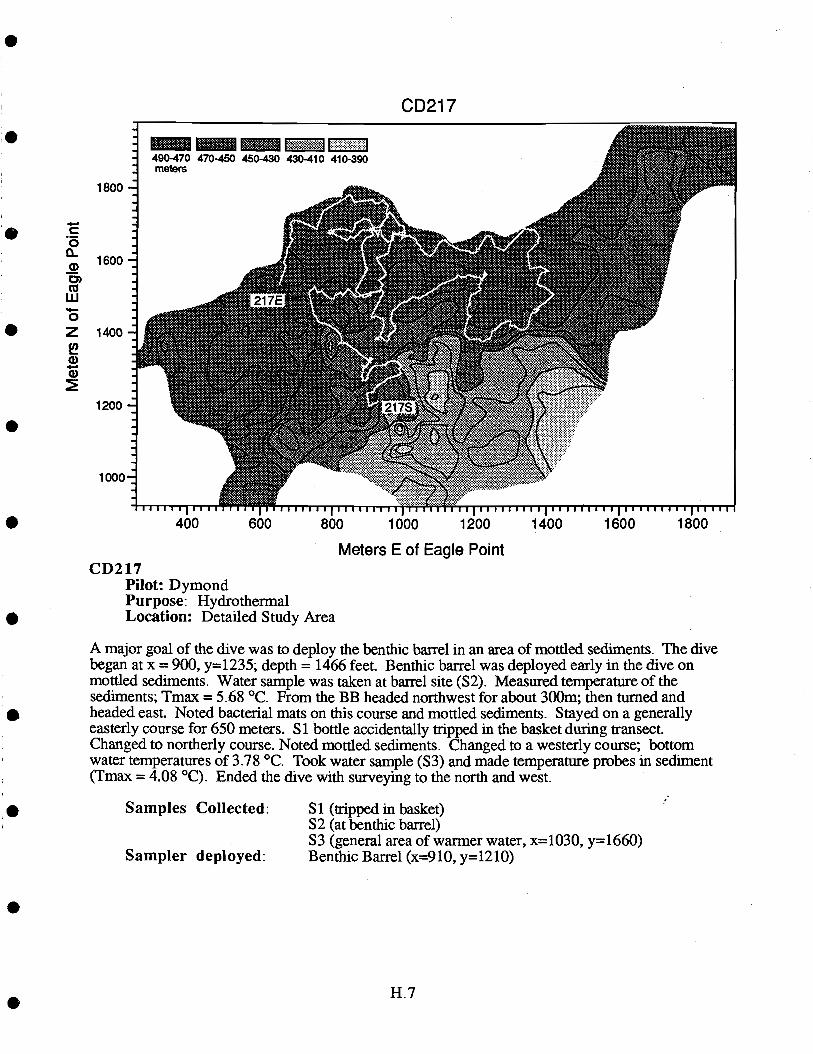
1800
C00a)0)Cow0Z 1400a)4-.a)
1600
1200
1000
Samples Collected:
Sampler deployed:
21 7E
490-470 470-450 450-430 430-410 410-390meters
CD217
H.7
400 600 800 1000 1200 1400 1600 1800
Meters E of Eagle PointCD217
Pilot: DymondPurpose: HydrothermalLocation: Detailed Study Area
A major goal of the dive was to deploy the benthic barrel in an area of mottled sediments. The divebegan at x = 900, y=l235; depth = 1466 feet. Benthic barrel was deployed early in the dive onmottled sediments. Water sample was taken at barrel site (S2). Measured temperature of thesediments; Tmax = 5.68 °C. From the BB headed northwest for about 300m; then turned andheaded east. Noted bacterial mats on this course and mottled sediments. Stayed on a generallyeasterly course for 650 meters. Si bottle accidentally tripped in the basket during transectChanged to northerly course. Noted mottled sediments. Changed to a westerly course; bottomwater temperatures of 3.78 °C. Took water sample (S3) and made temperature probes in sediment(Tmax = 4.08 °C). Ended the dive with surveying to the north and west.
Si (tripped in basket)S2 (at benthic barrel)S3 (general area of warmer water, x=1030, y=l660)Benthic Barrel (x=910, y=1210)
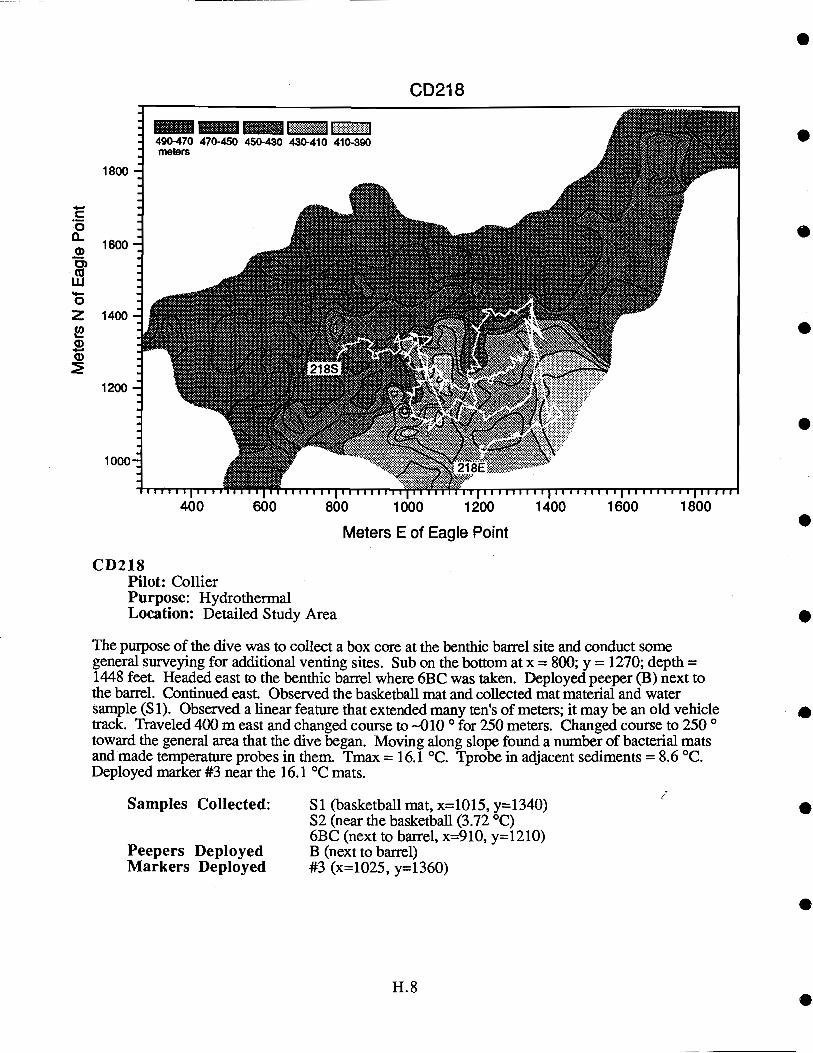
490-470 470-450 450-430 430-410 410-390meters
Samples Collected:
Peepers DeployedMarkers Deployed
H. 8
CD218
400 600 800 1000 1200 1400 1600 1800
Meters E of Eagle Point
CD218Pilot: CollierPurpose: HydrothermalLocation: Detailed Study Area
The puipose of the dive was to collect a box core at the benthic barrel site and conduct somegeneral surveying for additional venting sites. Sub on the bottom at x = 800; y = 1270; depth =1448 feet. Headed east to the benthic barrel where 6BC was taken. Deployed peeper (B) next tothe barrel. Continued east. Observed the basketball mat and collected mat material and watersample (Si). Observed a linear feature that extended many ten's of meters; it may be an old vehicletrack. Traveled 400 m east and changed course to 010 °for 250 meters. Changed course to 2500toward the general area that the dive began. Moving along slope found a number of bacterial matsand made temperature probes in them. Tmax 16.1 °C. Tprobe in adjacent sediments = 8.6 °C.Deployed marker #3 near the 16.1 °C mats.
Si (basketball mat, x=1015, y=1340)S2 (near the basketball (3.72 °C)6BC (next to barrel, x=910, y=1210)B (next to barrel)#3 (x=1025, y=1360)
1800
1600
Zww
1400
21 8S
1200
1000
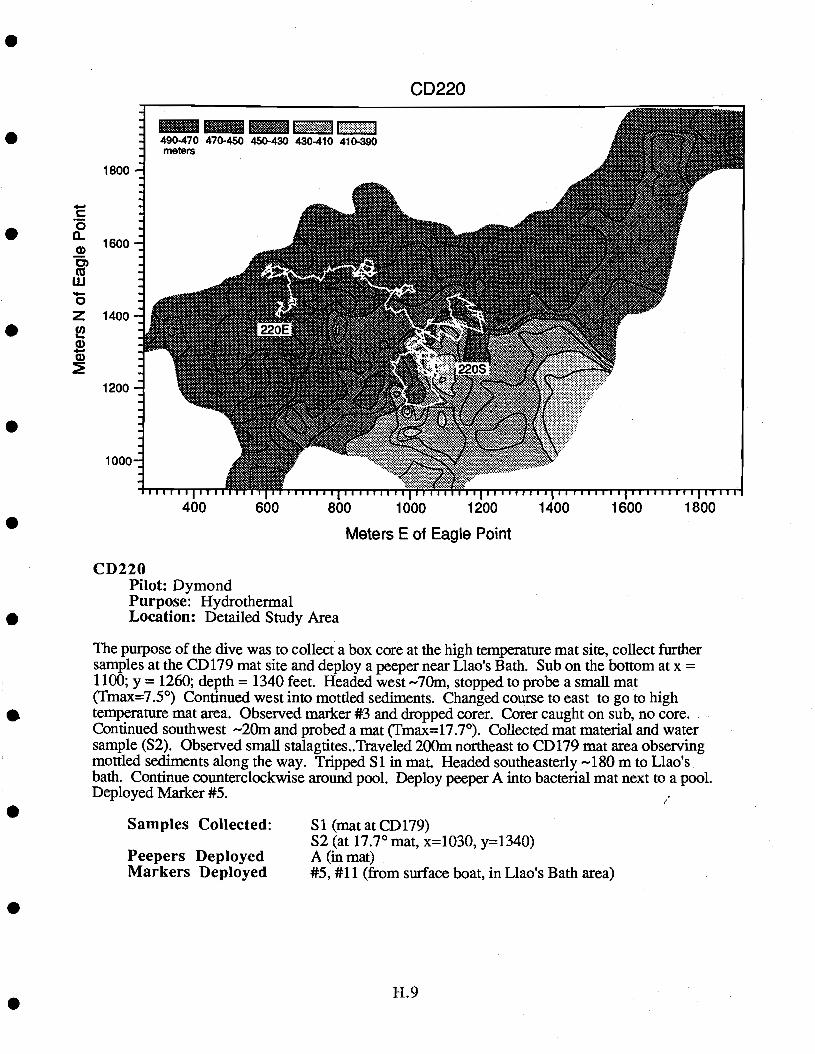
490-470 470-450 450-430 430-410 410-390meters
Samples Collected:
Peepers DeployedMarkers Deployed
I........... 111
CD220
Si (mat at CD 179)S2 (at 17.7° mat, x=1030, y=l34O)A (in mat)#5, #11 (from surface boat, in Llao's Bath area)
C
Za)4.-a)
1800
1600
1400
1200
1000
220E
400 600 800 1000 1200 1400 1600 1800
Meters E of Eagle Point
CD220Pilot: DymondPurpose: HydrothermalLocation: Detailed Study Area
The purpose of the dive was to collect a box core at the high temperature mat site, collect furthersamples at the CD 179 mat site and deploy a peeper near Lla&s Bath. Sub on the bottom at x =1100; y = 1260; depth = 1340 feet. Headed west 70m, stopped to probe a small mat(Tmax=7.5°) Continued west into mottled sediments. Changed course to east to go to hightemperature mat area. Observed marker #3 and dropped corer. Corer caught on sub, no core.Continued southwest 20m and probed a mat (Tmax=17.7°). Collected mat material and watersample (S2). Observed small stalagtites..Traveled 200m northeast to CD 179 mat area observingmottled sediments along the way. Tripped Si in mat. Headed southeasterly 180 m to Llao'sbath. Continue counterclockwise around pool. Deploy peeper A into bacterial mat next to a pool.Deployed Marker #5.
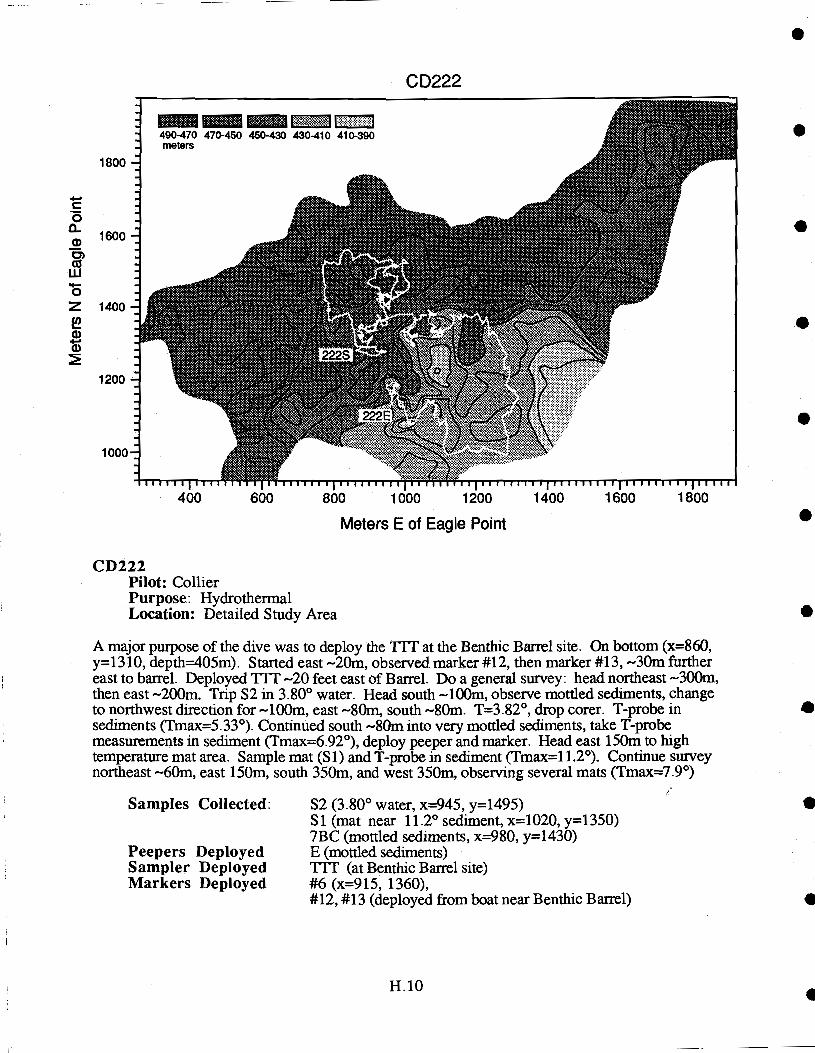
1800
C0a-a)0)Cuw0Z 1400
a)4-a)
1600
1200
1000
-" I490-470 470-450 450-430 430-410 410-390meters
Samples Collected:
Peepers DeployedSampler DeployedMarkers Deployed
CD222
H. 10
S2 (3.80° water, x:=945, y=i495)Si (mat near 11.2° sediment, x=i020, y=1350)7BC (mottled sediments, x=980, y=1430)E (mottled sediments)TTT (at Benthic Barrel site)#6 (x=915, 1360),#12, #13 (deployed from boat near Benthic Barrel)
400 600 800 1000 1200 1400 1600 1800
Meters E of Eagle Point
CD222Pilot: CollierPurpose: HydrothermalLocation: Detailed Study Area
A major purpose of the dive was to deploy the iTT at the Benthic Barrel site. On bottom (x=860,y=1310, depth-405m). Started east -20m, observed marker #12, then marker #13, -30m furthereast to barrel. Deployed TTT -20 feet east of Barrel. Do a general survey: head northeast -300m,then east -200m. Trip S2 in 3.80° water. Head south -lOOm, observe mottled sediments, changeto northwest direction for -lOOm, east -80m, south -80m. T=3.82°, drop corer. T-probe insediments (Tmax=5.33°). Continued south -80m into very mottled sediments, take T-probemeasurements in sediment (Tmax=6.92°), deploy peeper and marker. Head east 150m to hightemperature mat area. Sample mat (Si) and T-probe in sediment (Tmax=1 1.2°). Continue surveynortheast -60m, east 150m, south 350m, and west 350m, observing several mats (Tmax=7.9°)
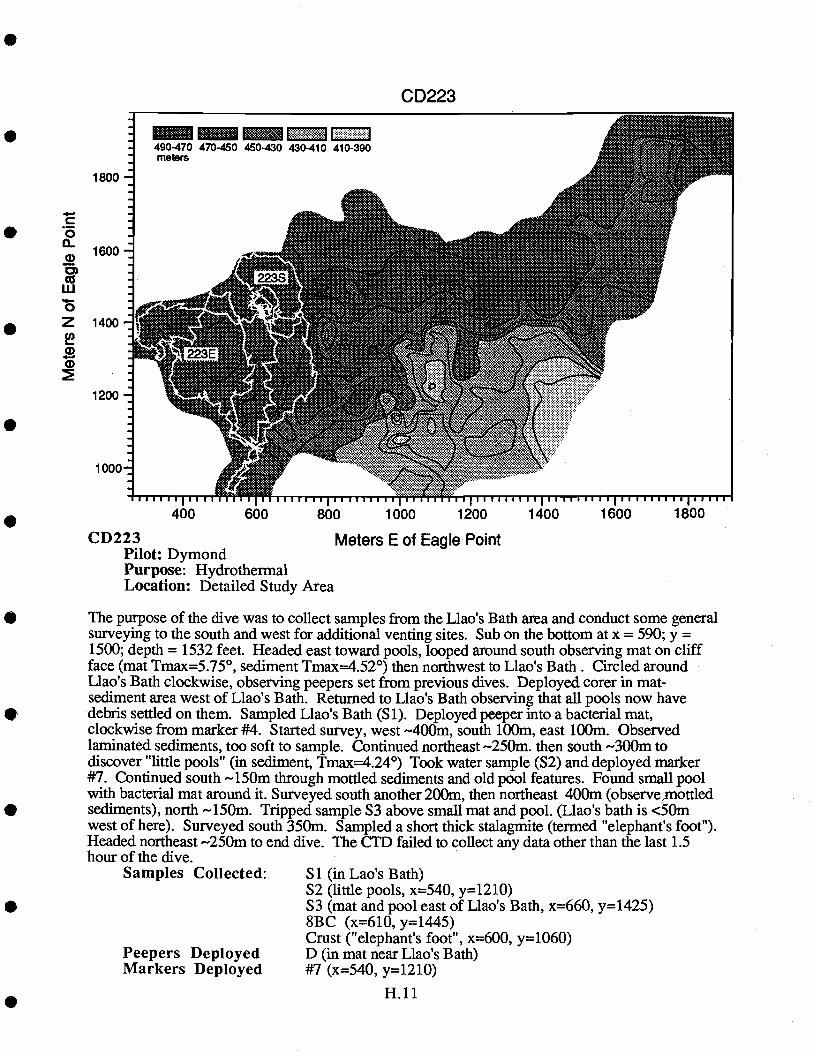
."223E
1000 /
490-470 470-450 450-430 430-410 410-390meters
223S
F........
CD223
Ca
1800
01600
wo
1400
1200
400 600 800 1000 1200 1400 1600 1800
CD223 Meters E of Eagle PointPilot: DymondPurpose: HydrothermalLocation: Detailed Study Area
The purpose of the dive was to collect samples from the Llao's Bath area and conduct some generalsurveying to the south and west for additional venting sites. Sub on the bottom at x = 590; y =1500; depth = 1532 feet. Headed east toward pools, looped around south observing mat on cliffface (mat Tmax=5.75°, sediment Tmax=4.52°) then northwest to Llao's Bath. Circled aroundLlao's Bath clockwise, observing peepers set from previous dives. Deployed corer in mat-sediment area west of Llao's Bath. Returned to Llao's Bath observing that all pools now havedebris settled on them. Sampled Llao's Bath (Si). Deployed peeper into a bacterial mat,clockwise from marker #4. Started survey, west 400m, south lOOm, east lOOm. Observedlaminated sediments, too soft to sample. Continued northeast 250m. then south 300m todiscover "little pools" (in sediment, Tmax=4.24°) Took water sample (S2) and deployed marker#7. Continued south i5Om through mottled sediments and old pool features. Found small poolwith bacterial mat around it. Surveyed south another 200m, then northeast 400m (observe,mottledsediments), north 150m. Tripped sample S3 above small mat and pool. (Llao's bath is <50mwest of here). Surveyed south 350m. Sampled a short thick stalagmite (termed "elephant's foot").Headed northeast 250m to end dive. The CTD failed to collect any data other than the last 1.5hour of the dive.
Samples Collected: Si (in Lao's Bath)S2 (little pools, x=540, y=l2iO)S3 (mat and pool east of Llao's Bath, x=660, y=l425)8BC (x=6i0, y=l445)Crust ("elephant's foot", x=600, y=1060)
Peepers Deployed D (in mat near Llao's Bath)Markers Deployed #7 (x=540, y=l2lO)
H.11
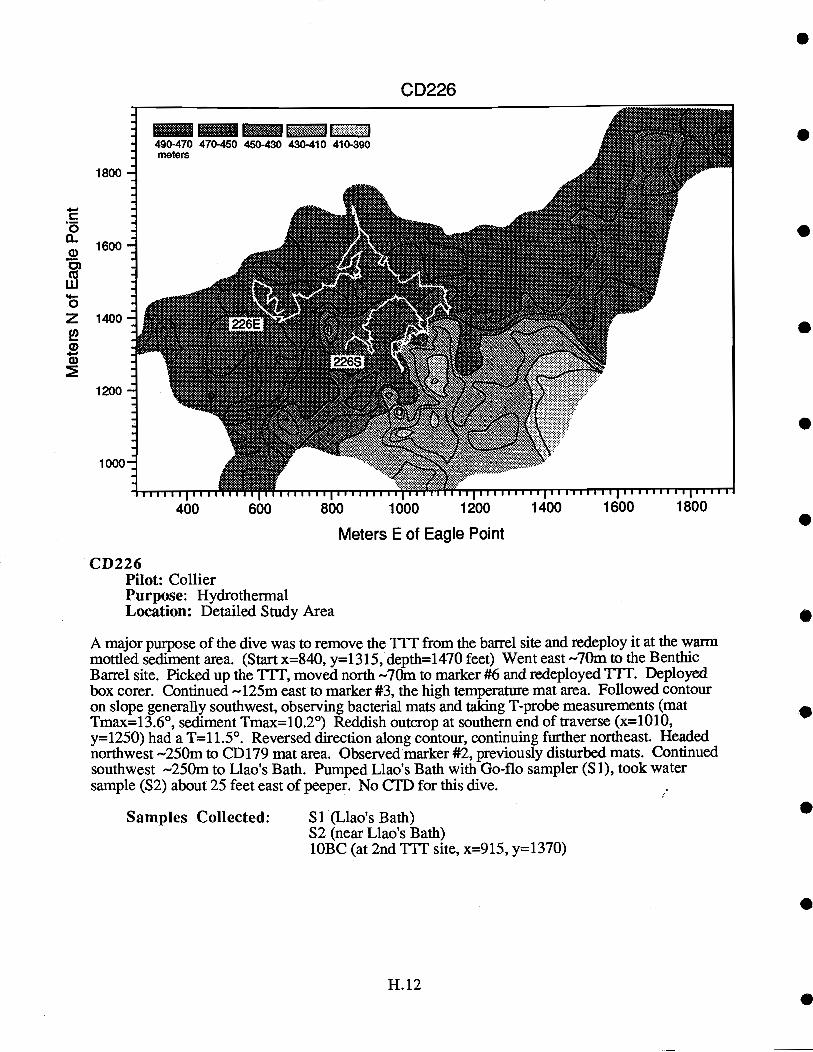
i..:: .1
490-470 470-450 450-430 430-410 410-390meters
Vs. ....'*
226SS%
* -
400 600 800 1000 1200 1400 1600 1800
Meters E of Eagle Point
CD226Pilot: CollierPurpose: HydrothermalLocation: Detailed Study Area
A major purpose of the dive was to remove the TTT from the barrel site and redeploy it at the warmmottled sediment area. (Start x=840, y=l3l5, depth=1470 feet) Went east 70m to the BenthicBarrel site. Picked up the TIT, moved north 70m to marker #6 and redeployed TTL Deployedbox corer. Continued 125m east to marker #3, the high temperature mat area. Followed contouron slope generally southwest, observing bacterial mats and taking T-probe measurements (matTmax=i3.6°, sediment Tmax=10.2°) Reddish outcrop at southern end of traverse (x=10l0,y=l25O) had a T=l 1.50. Reversed direction along contour, continuing further northeast. Headednorthwest -250m to CD 179 mat area. Observed marker #2, previously disturbed mats. Continuedsouthwest 250m to Llao's Bath. Pumped Llao's Bath with Go-fib sampler (Si), took watersample (S2) about 25 feet east of peeper. No CTD for this dive.
Samples Collected: Si (Llao's Bath)S2 (near Llao's Bath)1OBC (at 2ndTTT site, x=9i5, y=1370)
H. 12
CD226
C
Z
a,4-
1800
1600
1400
1200
1000
226E
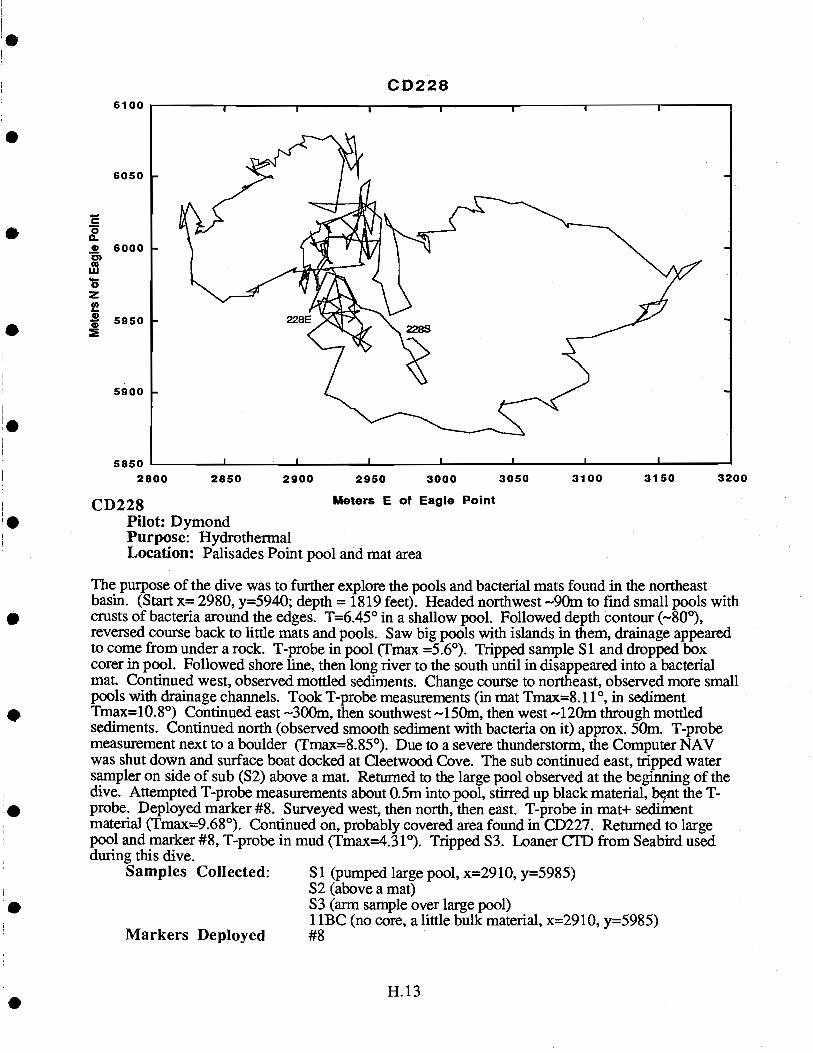
C00.. 6000C)
z5950
CD228
H.13
2850 2900 2950 3000 3050 3100 3150 3200
CD228 Meters E of Eagle PointPilot: DymondPurpose: HydrotheimalLocation: Palisades Point pool and mat area
The purpose of the dive was to further explore the pools and bacterial mats found in the northeastbasin. (Start x= 2980, y=5940; depth = 1819 feet). Headed northwest 90m to find small pools withcrusts of bacteria around the edges. T=6.45° in a shallow pool. Followed depth contour (_800),reversed course back to little mats and pools. Saw big pools with islands in them, drainage appearedto come from under a rock. T-probe in pool (Tmax 5.6°). Tripped sample Si and dropped boxcorer in pool. Followed shore line, then long river to the south until in disappeared into a bacterialmat. Continued west, observed mottled sediments. Change course to northeast, observed more smallpools with drainage channels. Took T-probe measurements (in mat Tmax=8. 110, in sedimentTmax=1O.8°) Continued east --300m, then southwest 150m, then west 120m through mottledsediments. Continued north (observed smooth sediment with bacteria on it) approx. 50m. T-probemeasurement next to a boulder (Tmax=8.85°). Due to a severe thunderstorm, the Computer NAYwas shut down and surface boat docked at Cleetwood Cove. The sub continued east, tripped watersampler on side of sub (S2) above a mat. Returned to the large pool observed at the beginning of thedive. Attempted T-probe measurements about 0.5m into pool, stirred up black material, bent the T-probe. Deployed marker #8. Surveyed west, then north, then east. 'F-probe in mat+ sedimentmaterial (Tmax=9.68°). Continued on, probably covered area found in CD227. Returned to largepool and marker #8, T-probe in mud (Tmax=4.31°). Tripped S3. Loaner CTh from Seabird usedduring this dive.
Samples Collected: Si (pumped large pool, x=2910, y=5985)S2 (above a mat)S3 (arm sample over large pool)I 1BC (no core, a little bulk material, x=2910, y=5985)
Markers Deployed #8
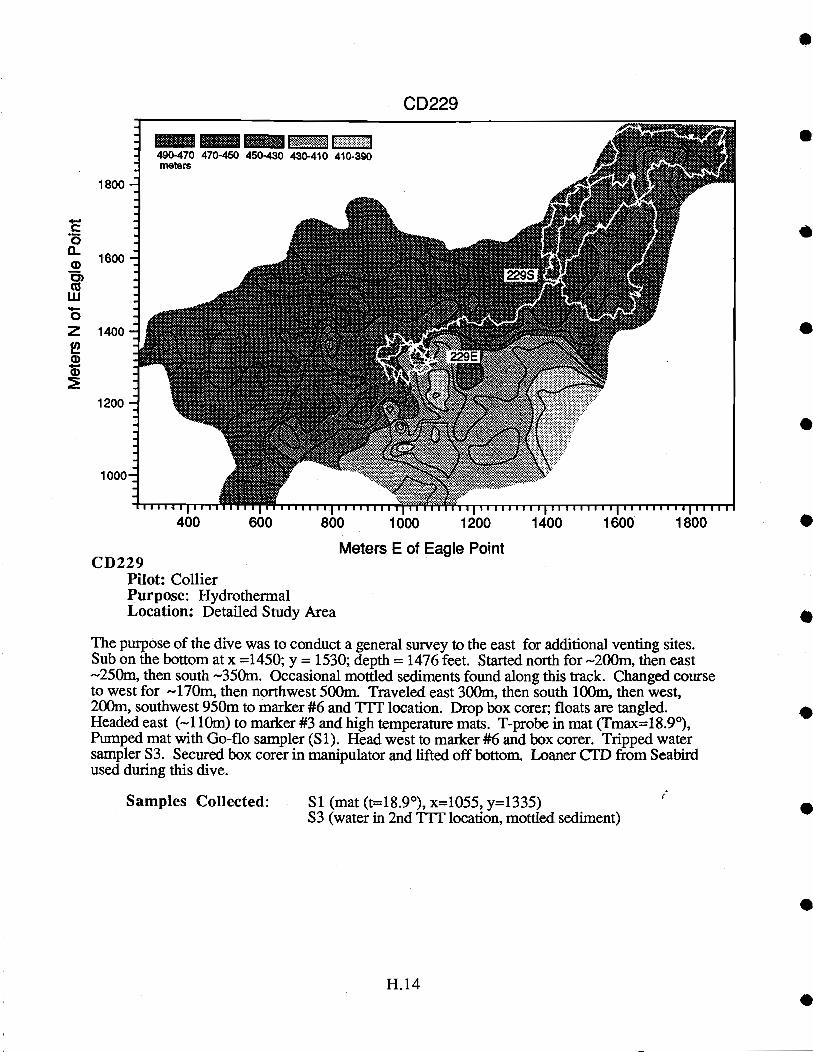
1
490-470 470-450 450-430 430-410 410-390meters
CD229
H.14
1800
4-
1600
Za)
1400
4-w
1200
1000
400 600 800 1000 1200 1400 1600 1800
CD229Meters E of Eagle Point
Pilot: CollierPurpose: HydrothermalLocation: Detailed Study Area
The purpose of the dive was to conduct a general survey to the east for additional venting sites.Sub on the bottom at x =1450; y = 1530; depth = 1476 feet. Started north for 200m, then east250m, then south 350m. Occasional mottled sediments found along this track. Changed courseto west for -170m, then northwest 500m. Traveled east 300m, then south lOOm, then west,200m, southwest 950m to marker #6 and TTT location. Drop box corer, floats are tangled.Headed east (-.1 lOm) to marker #3 and high temperature mats. T-probe in mat (Tmax=l 8.9°),Pumped mat with Go-fib sampler (Si). Head west to marker #6 and box corer. Tripped watersampler S3. Secured box corer in manipulator and lifted off bottom. Loaner CTD from Seabirdused during this dive.
Samples Collected: Si (mat (t=18.9°), x=1055, y=l335)S3 (water in 2nd TIT location, mottled sediment)
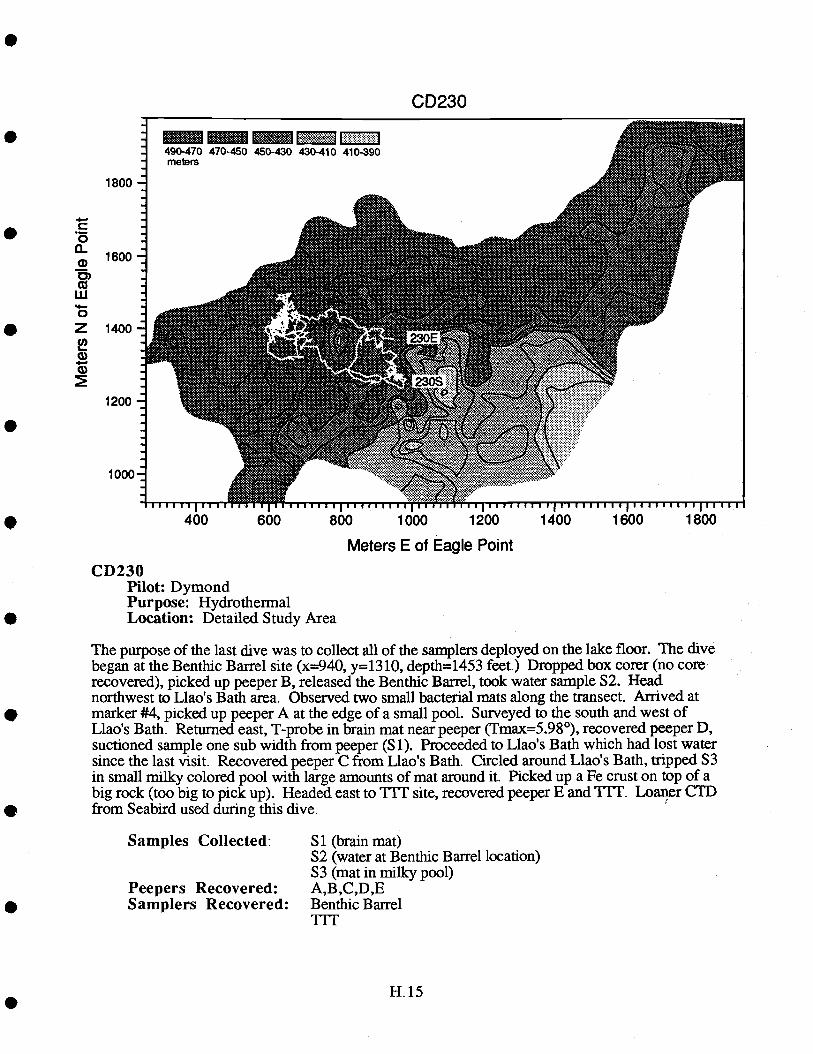
I
I
1000
Ii490-470 470-450 450-430 430-410 410-390
CO230
400 600 800 1000 1200 1400 1600 1800
Meters E of Eagle Point
CD230Pilot: DymondPurpose: HydrothermalLocation: Detailed Study Area
The purpose of the last dive was to collect all of the samplers deployed on the lake floor. The divebegan at the Benthic Barrel site (x=940, y=l3 10, depth= 1453 feet.) Dropped box corer (no corerecovered), picked up peeper B, released the Benthic Barrel, took water sample S2. Headnorthwest to Llao's Bath area. Observed two small bacterial mats along the transect. Arrived atmarker #4, picked up peeper A at the edge of a small pool. Surveyed to the south and west ofLlao's Bath. Returned east, T-probe in brain mat near peeper (Tmax=5.98°), recovered peeper D,suctioned sample one sub width from peeper (Si). Proceeded to Llao's Bath which had lost watersince the last visit. Recovered peeper C from Llao's Bath. Circled around Llao's Bath, tripped S3in small milky colored pool with large amounts of mat around it. Picked up a Fe crust on top of abig rock (too big to pick up). Headed east to ITT site, recovered peeper E and T1T. Loaner CTDfrom Seabird used during this dive.
Samples Collected: Si (brain mat)S2 (water at Benthic Barrel location)S3 (mat in milky pool)
Peepers Recovered: A,B,C,D,ESamplers Recovered: Benthic Barrelm
meters
1800
.1-iC
1600
Z 1400
.1-a
1200
230E 'i'.' ..
'.. ";Z* .-'\'230S
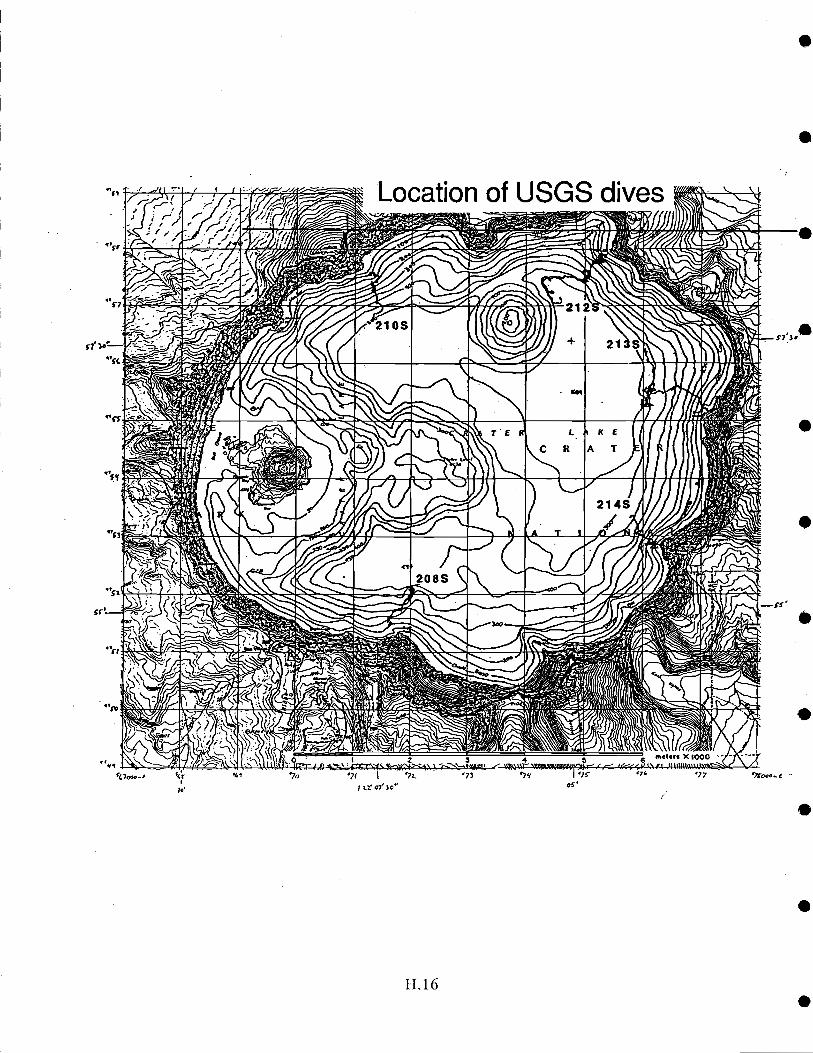

1989 Summary USGS Dives
CD208Pilot: Buktenica Location: Eagle Point
The dive began at x = 100; y = 850; depth 1550 feet. Took a core in sediments at descentlocation. Moved upslope on a southwest heading, picking up rocks along the way. Totaldistance traveled was about 700 meters. Left the bottom at 350 feet depth.
Samples collected: 2BCfour rocks
CD21OPilot: Buktenica Location: Llao Rock
The dive began at x = -550; y = 5440; depth = 1733. Traveled upsiope and on a northerlycourse for approximately 1000 meters. Picked up rocks on this course. Saw periphyton at500 feet. Collected moss between 300 and 200 feet depths. Dive ended at 50 foot depth.
Samples collected: 10 rocksone moss sample
CD212Pilot: Buktenica Location: Palisades Point
The dive began at x = 2750; y = 5840; depth = 1869 feet. This location is just to the east ofMiriam Cone. Dropped a core at descent location. Traveled northwest for 450 meters andthen east for 800 meters, looking for turbidite and channel features for Hans Nelson. Fromthere the dive proceeded upslope in a northeast direction toward Palisades Point, collectingrocks along the way.
Samples Collected: 4BC8 rocksmoss sample at 280 feet.
CD213Pilot: Collier Location: Skell Head
The dive began at x =4200; y =4900; depth = 1782. Moved south from descent location800 meters. Near the end of this traverse encountered siliceous spires. Took two sampleswithin 35 meters from different spires. The dive continued upslope on an easterly directionfor 1000 meters. The dive ended 550 feet.
Samples Collected: 2 spire samples1 rock
CD214Pilot: Buktenica Location: Sentinel Point
The dive began at x = 4000; y = 2050; depth = 1589 feet. Proceeded upslope on a generalsoutheast direction, sampling rocks, along the way. Saw moss at 790 feet. Collected mossat 732 feet. Popped to the surface 3.5 hours into the dive to drop off moss. Traversedalong a debris chute. Collected more moss. Generator failure resulted in a loss ofnavigation for the last two hours of the dive.
Samples Collected: 10 rocks3 moss samples
H. 17
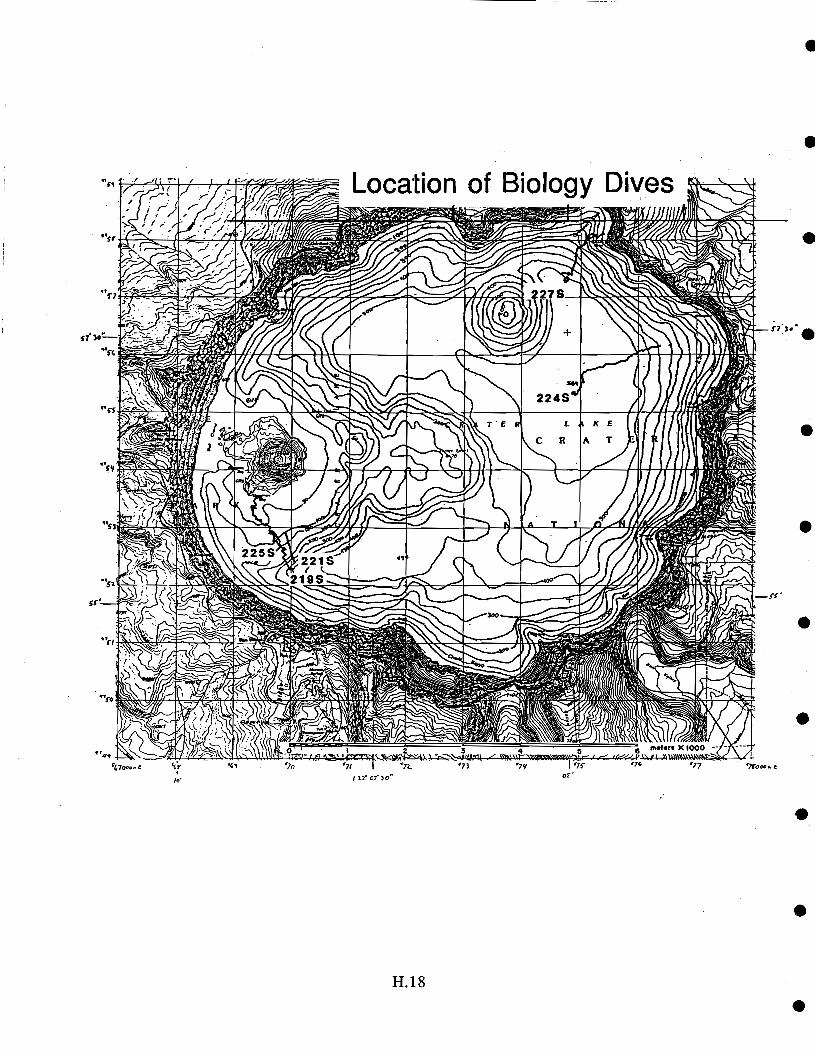
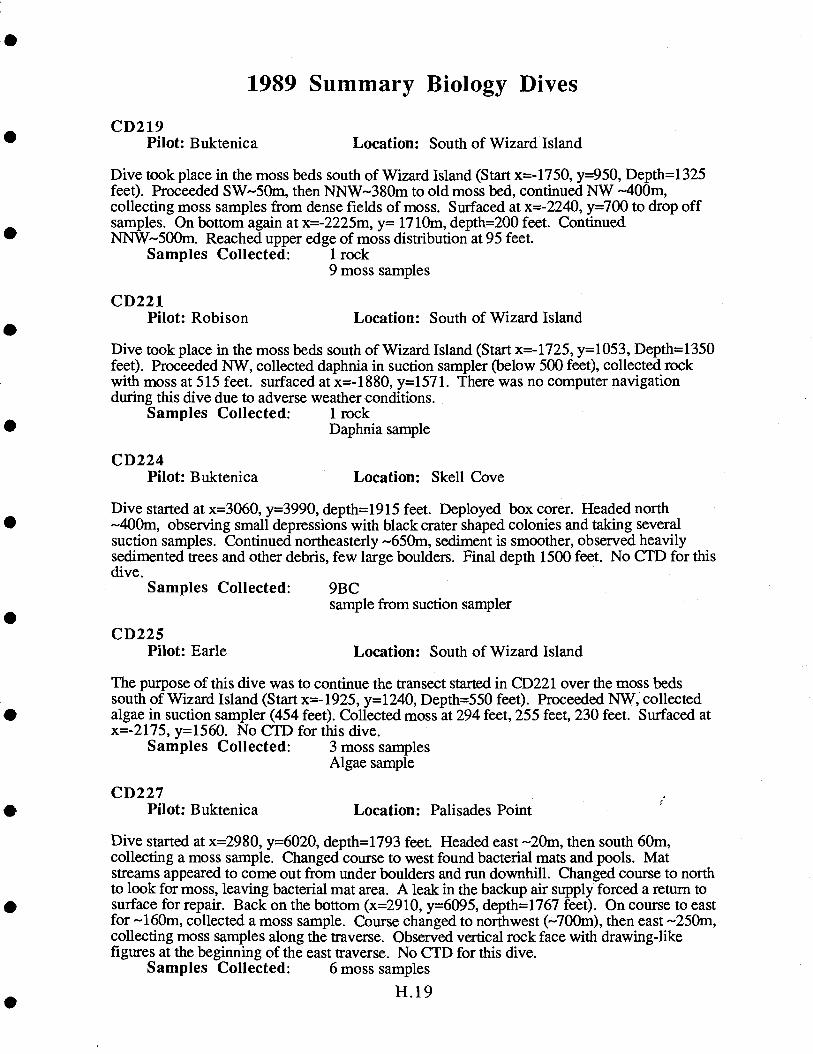
1989 Summary Biology Dives
CD219Pilot: Buktenica Location: South of Wizard Island
Dive took place in the moss beds south of Wizard Island (Start x=-1750, y=95O, Depth1325feet). Proceeded SW-50m, then NNW-380m to old moss bed, continued NW -400m,collecting moss samples from dense fields of moss. Surfaced at x=-2240, y=700 to drop offsamples. On bottom again at x=-2225m, y= 17 lOm, depth=200 feet. ContinuedNNW-'500m. Reached upper edge of moss distribution at 95 feet.
Samples Collected: 1 rock9 moss samples
CD221Pilot: Robison Location: South of Wizard Island
Dive took place in the moss beds south of Wizard Island (Start x=-1725, yl053, Depthl35Ofeet). Proceeded NW, collected daphnia in suction sampler (below 500 feet), collected rockwith moss at 515 feet. surfaced at x=-1880, y=l57l. There was no computer navigationduring this dive due to adverse weather conditions.
Samples Collected: I rockDaphnia sample
CD224Pilot: Buktenica Location: Skell Cove
Dive started at x=3060, y=399O, depth=1915 feet. Deployed box corer. Headed north-400m, observing small depressions with black crater shaped colonies and taking severalsuction samples. Continued northeasterly -650m, sediment is smoother, observed heavilysedimented trees and other debris, few large boulders. Final depth 1500 feet. No CTD for thisdive.
Samples Collected: 9BCsample from suction sampler
CD225Pilot: Earle Location: South of Wizard Island
The purpose of this dive was to continue the transect started in CD221 over the moss bedssouth of Wizard Island (Start x=-1925, y=l240, Depth=550 feet). Proceeded NW, collectedalgae in suction sampler (454 feet). Collected moss at 294 feet, 255 feet, 230 feet. Surfaced atx=-2175, y=1560. No CTD for this dive.
Samples Collected: 3 moss samplesAlgae sample
CD227Pilot: Buktenica Location: Palisades Point
Dive started at x=2980, y=6O2O, depth=1793 feet. Headed east -20m, then south 60m,collecting a moss sample. Changed course to west found bacterial mats and pools. Matstreams appeared to come out from under boulders and run downhill. Changed course to northto look for moss, leaving bacterial mat area. A leak in the backup air supply forced a return tosurface for repair. Back on the bottom (x=2910, y=6095, depth=1767 feet). On course to eastfor --160m, collected a moss sample. Course changed to northwest (--700m), then east -250m,collecting moss samples along the traverse. Observed vertical rock face with drawing-likefigures at the beginning of the east traverse. No CTD for this dive.
Samples Collected: 6 moss samples
11.19
1.1
Appendix I. Data Tables
1989 Water Data 1.2
1988 Hydrocast Data 1.5
1988 Dive Data 1.6
1988 SpringData 1.6
1987 Hydrocast Data 1.7
1985-1989 He Data 1.8
1985-1989 Rn Data 1.10
1988 Dive Program Sediment, Crust, and Mat Sample Data 1.12
1989 Dive Program Sediment, Crust, and Mat Sample Data 1.15
Temperature Probe Stations 1.18
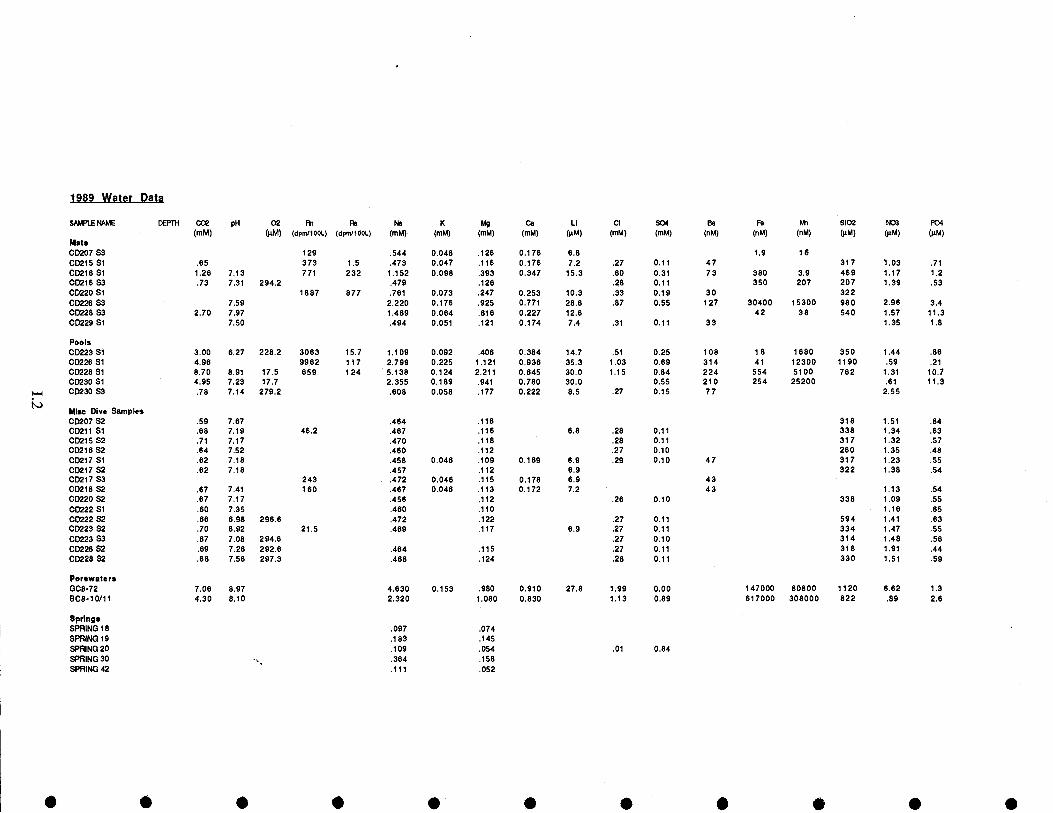
1989 Water Data
0 0 0
SM4PLE NAME DEPTh CO2 pH 02 Ri Ri K Mg Ca LI CI SO4 Ba Fe Mi SIO2 NDE PO4
(mM) (jiM) (dpmIIOOL) (dpmIlOOL) (mM) (mM) (mM) (mM) (tiM) (mM) (mM) (nM) (nM) (nM) (aiM) (M) (tM)MatsCD207 S3 129 .544 0.048 .126 0.176 6.8 1.9 16CO215 Si .65 373 1.5 .473 0.041 .116 0.176 7.2 .27 0.11 47 317 1.03 .71
CD216 SI 1.26 7.13 771 232 1.152 0.098 .393 0.347 15.3 .60 0.31 73 380 3.9 469 1.17 1.200216 S3 .73 7.31 294.2 .479 .126 .28 0.11 350 207 207 1.39 .5300220 Si 1887 877 .761 0.073 .247 0.253 10.3 .33 0.19 30 322CO226 53 7.59 2,220 0.176 .925 0.771 28.6 .87 0.55 127 30400 15300 980 2.96 3.4CD228 S3 2.70 7.97 1.469 0,064 .616 0.227 12.6 42 38 540 1.57 11.3CD229 SI 7.50 .494 0.051 .121 0.174 7.4 .31 0.11 33 1.35 1.8
PoolsCD223 Si 3.00 6,27 228.2 3063 15.7 1.109 0.092 .406 0.384 14.7 .51 0.25 108 18 1680 350 1.44 .86
CD226 SI 4.96 9982 117 2.799 0.225 1.121 0.936 35.3 1.03 0.69 314 41 12300 1190 .59 .21
0022851 8.70 8.91 17.5 659 124 5.138 0.124 2.211 0.645 30.0 1.15 0.84 224 554 5100 762 1.31 10.7CD230 51 4.95 7.23 17.7 2.355 0,189 .941 0,780 30.0 0.55 210 254 25200 .61 11,3CO230 S3 .78 7.14 279,2 .808 0.058 .177 0.222 8.5 .27 0.15 77 2.55
Misc Dive SamplesCO207 S2 .59 7.67 .464 .116 318 1.51 .8400211 SI .68 7.19 46.2 .467 .116 6.8 .28 0.11 338 1.34 .6300215 S2 .71 7.17 .470 .118 .28 0.11 317 1.32 .57
CD2I6 S2 .64 7.52 .460 .112 .27 0.10 260 1.35 .4800217 Si .62 7.18 .458 0.046 .109 0,169 6.9 .29 0.10 47 317 1.23 .5500217 S2 .62 7.18 .457 .112 6.9 322 1.38 .54CD217 S3 243 .472 0,046 .115 0.178 6.9 430D218 S2 .67 7.41 160 .467 0.046 .113 0.172 7.2 43 1,13 .5400220 S2 .67 7.17 .456 .112 .26 0.10 338 1.09 .55
00222 Si .60 7.35 .460 .110 1.16 .8500222 S2 .68 6.98 296.6 .472 .122 .27 0.11 594 1.41 .6300223 S2 .70 6.92 21.5 .489 .117 6.9 .27 0.11 334 1.47 .550D223 53 .67 7.08 294.6 .27 0.10 314 1.48 .560022682 .69 7.28 292.6 .464 .115 .27 0.11 318 1.91 .4400228 S2 .68 7.56 297.3 .468 .124 .28 0.11 330 1.51 .59
PorewatersGC8-72 7,06 8.97 4.630 0.153 .980 0.910 27.8 1.99 0.00 147000 80800 1120 6.62 1.3
8C8-10111 4.30 8.10 2.320 1.080 0.830 1.13 0.89 617000 308000 822 .89 2.8
SpringsSPRING 18 .097 .074SPRiNG 19 .183 .145SPRING 20 .109 .054 .01 0.84SPRING 30 .364 .158SPRING 42 .111 .052
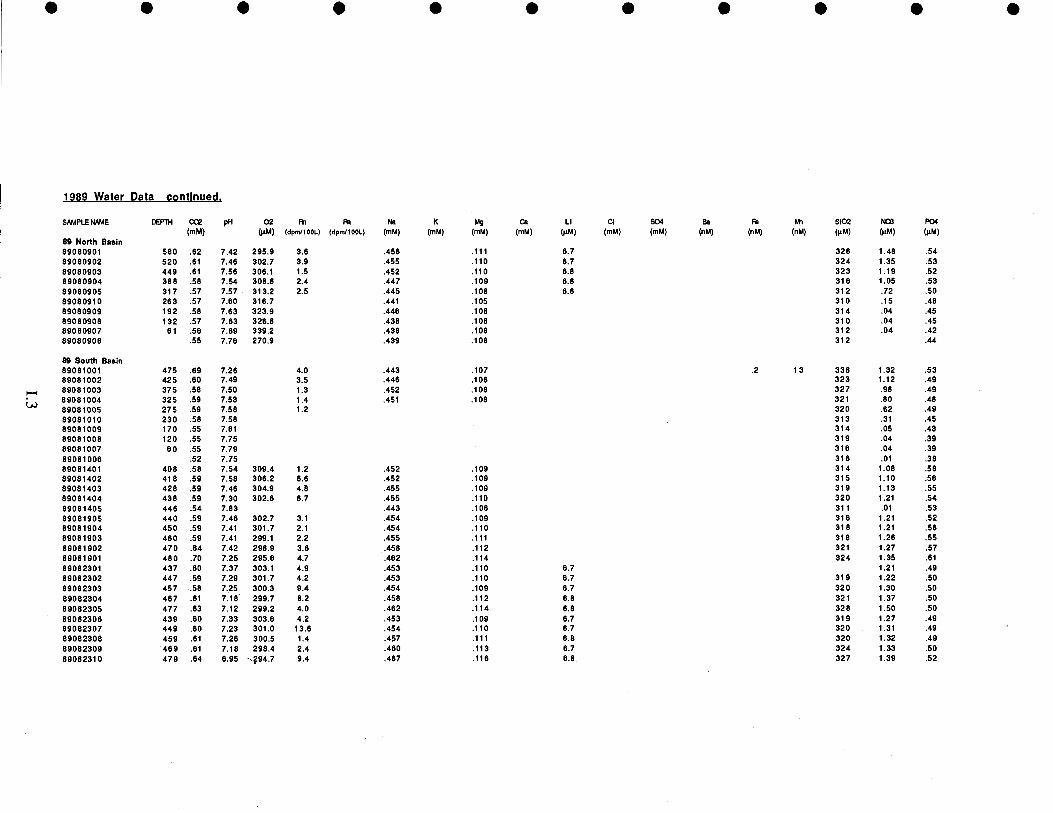
1989 Water Data continued.
SAMPLE 4ME DEPTh CC2 pH 02 Ri Na K Mg Ca Li 0 504 Ba Fe Mi S102 NDE PO4
(mM) (ii88) (dpmIlOOL) (dpmfIOOL) (mM) (mM) (mM) (mM) (M) (mM) (mM) (nM) (nM) (nM) (pM) (tM) (iLM)
89 North Basin89080901 580 .62 7.42 295.9 3.6 .456 .111 6.7 326 1.48 .54
89080902 520 .61 7.46 302.7 3.9 .455 .110 6.7 324 1.35 .53
89080903 449 .61 7.56 306.1 1.5 .452 .110 6.8 323 1.19 .52
89080904 388 .58 7.54 308.8 2.4 .447 .109 6.6 31 6 1.05 .53
89080905 317 .57 7.57 313.2 2.5 .445 .108 6.6 312 .72 .50
89080910 263 .57 7.60 316.7 .441 .105 310 .15 .48
89080909 192 .58 7.63 323.9 .446 .108 314 .04 .45
89080908 132 .57 7.83 326.8 .438 .108 310 .04 .45
89080907 61 .56 7.69 339.2 .438 .108 312 .04 .42
89080906 .55 7.76 270.9 .439 .108 312 .44
89 South Basin89081001 475 .89 7.28 4.0 .443 .107 .2 13 338 1.32 .53
89081002 425 .60 7.49 3.5 .446 .106 323 1.12 .49
89081003 375 .58 7.50 1.3 .452 .108 327 .98 .49
89081004 325 .59 7.53 1.4 .451 .108 321 .80 .48
89081005 275 .59 7.58 1.2 320 .62 .49
89081010 230 .58 7.58 313 .31 .45
89081009 170 .55 7.61 314 .05 .43
89081008 120 .55 7.75 319 .04 .39
89081007 60 .55 7.79 316 .04 .39
89081006 .52 7.75 316 .01 .38
89081401 408 .58 7.54 309.4 1.2 .452 .109 314 1.08 .5889081402 418 .59 7.58 306.2 6.6 .452 .109 315 1.10 .56
89081403 428 .59 7.46 304.9 4.8 .455 .109 319 1.13 .55
89081404 438 .59 7.30 302.6 6.7 .455 .110 320 1.21 .54
89081405 446 .54 7.83 .443 .106 311 .01 .53
89081905 440 .59 7.46 302.7 3.1 .454 .109 316 1.21 .52
89081904 450 .59 7.41 301.7 2.1 .454 .110 318 1.21 .56
89081903 460 .59 7.41 299.1 2.2 .455 .111 318 1.26 .55
89081902 470 .64 7.42 298.9 3.6 .458 .112 321 1.27 .57
89081901 480 .70 7.25 295.6 4.7 .462 .114 324 1.35 .61
89082301 437 .60 7.37 303.1 4.9 .453 .110 6.7 1.21 .49
89082302 447 .59 7.29 301.7 4.2 .453 .110 6.7 319 1.22 .50
89082303 457 .58 7.25 300.3 9.4 .454 .109 6.7 320 1.30 .50
89082304 467 .61 7.18 299.1 8.2 .458 .112 6.8 321 1.37 .50
89082305 477 .83 7.12 299.2 4.0 .462 .114 6.8 328 1.50 .50
89082306 439 .60 7.33 303.6 4.2 .453 .109 6.7 31 9 1.27 .49
89082307 449 .60 7.23 301.0 13.6 .454 .110 6.7 320 1.31 .49
89082308 459 .61 7.26 300.5 1.4 .457 .111 6.8 320 1.32 .49
89082309 469 .61 7.18 298.4 2.4 .480 .113 6.7 324 1.33 .50
89082310 479 .64 6.95 9.4 .467 .116 6.8 327 1.39 .52
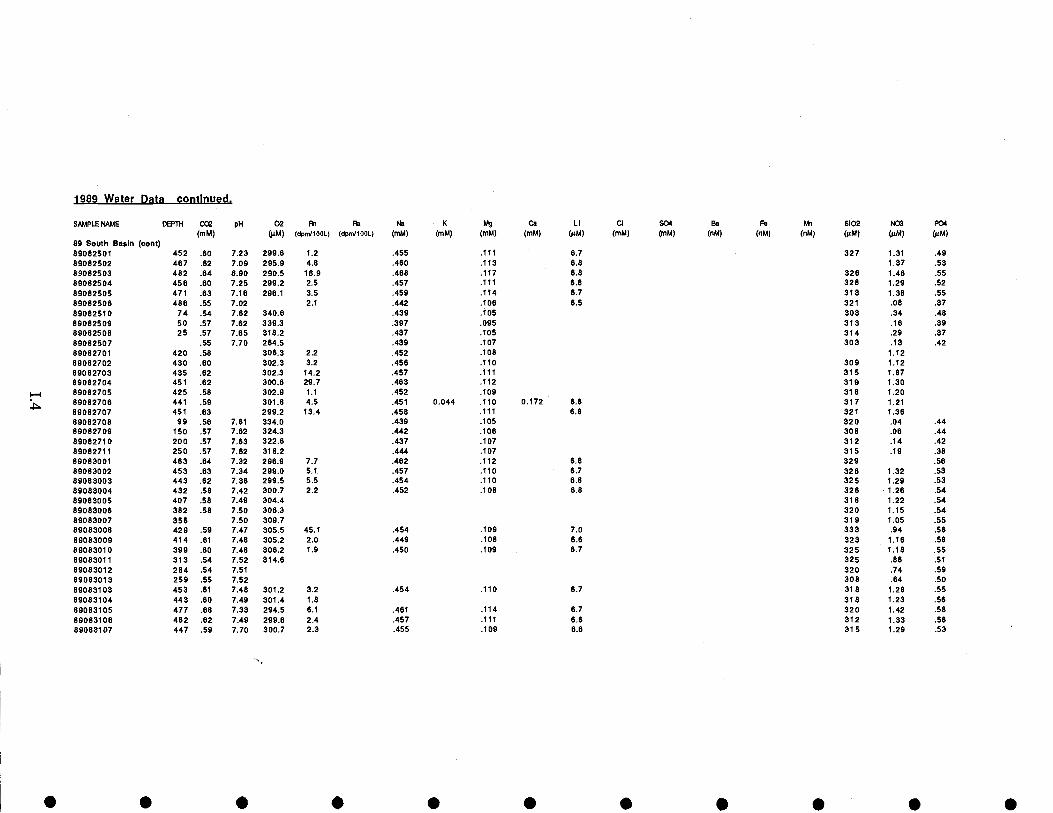
1989 Water Data contInued
SAMPLE NAME DEPTh aa pH 02 FN K Mg Ca LI CI SO4 Ba F. I4 S102 P103 PO4
(mM) 4LM) (dpin(tOoL) (dpm(IOOL) (mM) (mM) (mM) (mM) (jIM) (mM) (mM) (nM) (nM) (nM) (MM) (jzMJ (MM)
89 South BasIn (cont)89082501 452 .60 1.23 299.6 1.2 .455 .111 6.7 327 1.31 .4989082502 467 .62 7.09 295.9 4.8 .460 .113 6.8 1.37 .53
89082503 482 .64 6.90 290.5 16.9 .468 .117 6.8 326 1.46 .55
89082504 458 .60 7.25 299.2 2.5 .457 .111 6.8 328 1.29 .52
89082505 471 .63 7.16 296.1 3.5 .459 .114 6.7 313 1.38 .5589082506 486 .55 7.02 2.1 .442 .106 6.5 321 .08 .37
89082510 74 .54 7.62 340.8 .439 .105 303 .34 .48
89082509 50 .57 7.62 339.3 .397 .095 313 .16 .39
89082508 25 .57 7.65 318.2 .437 .105 314 .29 .37
89082507 .55 7.70 284.5 .439 .107 303 .13 .4289082701 420 .58 306.3 2.2 .452 .108 1.1289082702 430 .80 302.3 3.2 .456 .110 309 1.1289082703 435 .62 302.3 14.2 .457 .111 315 1.8789082704 451 .62 300.6 29.7 .463 .112 319 1.3089082705 425 .58 302.9 1.1 .452 .109 318 1.2089082706 441 .59 301.8 4.5 .451 0.044 .110 0.172 6.6 317 1.21
89082707 451 .63 299.2 13.4 .458 .111 6.8 321 1.3689082708 99 .56 7.61 334.0 .439 .105 320 .04 .4489082709 150 .57 7.62 324.3 .442 .108 308 .06 .44
89082710 200 .57 7.63 322.6 .437 .107 312 .14 .42
89082711 250 .57 7.62 318.2 .444 .107 315 .19 .38
89083001 463 .84 7.32 296.9 7.7 .462 .112 6.8 329 .56
89083002 453 .63 7.34 299.0 5.1 .457 .110 6.7 328 1.32 .5389083003 443 .62 7.36 299.5 5.5 .454 .110 6.8 325 1.29 .53
89083004 432 .58 7.42 300.7 2.2 .452 .108 6.8 328 1.26 .54
89083005 407 .58 1.49 304.4 318 1.22 .54
89083006 382 .58 7.50 306.3 320 1.15 .54
89083007 358 7.50 309.7 319 1.05 .5589083008 429 .59 7.47 305.5 45.1 .454 .109 7.0 333 .94 .5889083009 414 .61 7.48 305.2 2.0 .449 .108 6.6 323 1.16 .58
89083010 399 .60 7.48 306.2 1.9 .450 .109 6.7 325 1.18 .55
89083011 313 .54 7.52 314.6 325 .86 .51
89083012 284 .54 7.51 320 .74 .5989083013 259 .55 7.52 308 .64 .50
89083103 453 .61 7.48 301.2 3.2 .454 ItO 6.7 318 1.28 .55
89083104 443 .60 7.49 301.4 1.8 31 8 1.23 .5689083105 477 .68 7.33 294.5 8.1 .461 .114 6.7 320 1.42 .58
89083106 462 .62 7.49 299.6 2.4 .457 .111 6.6 312 1.33 .56
89083107 447 .59 7.70 300.7 2.3 .455 .109 8.6 315 1.29 .53
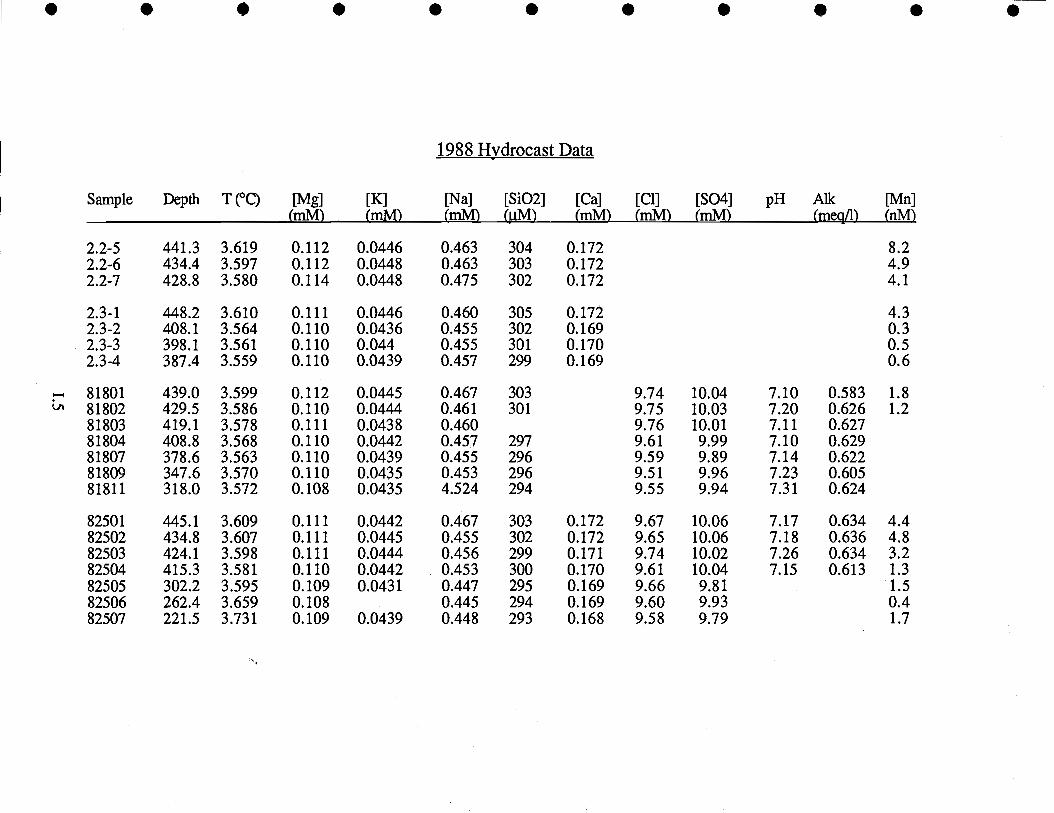
1988 Hydrocast Data
--'
Sample Depth T (°C) 1Mg](mM')
[K](mM)
[Na](mlvi)
[Si02](jiM')
[Ca](mM)
[Cl](mlvi)
[SO4](mlvi')
pH Alk(meq/1')
[Mn](nM')
2.2-5 441.3 3.619 0.112 0.0446 0.463 304 0.172 8.22.2-6 434.4 3.597 0.112 0.0448 0.463 303 0.172 4.92.2-7 428.8 3.580 0.114 0.0448 0.475 302 0.172 4.1
2.3-1 448.2 3.610 0.111 0.0446 0.460 305 0.172 4.32.3-2 408.1 3.564 0.110 0.0436 0.455 302 0.169 0.32.3-3 398.1 3.561 0.110 0.044 0.455 301 0.170 0.52.3-4 387.4 3.559 0.110 0.0439 0.457 299 0.169 0.6
81801 439.0 3.599 0.112 0.0445 0.467 303 9.74 10.04 7.10 0.583 1.881802 429.5 3.586 0.110 0.0444 0.461 301 9.75 10.03 7.20 0.626 1.281803 419.1 3.578 0.111 0.0438 0.460 9.76 10.01 7.11 0.62781804 408.8 3.568 0.110 0.0442 0.457 297 9.61 9.99 7.10 0.62981807 378.6 3.563 0.110 0.0439 0.455 296 9.59 9.89 7.14 0.62281809 347.6 3.570 0.110 0.0435 0.453 296 9.51 9.96 7.23 0.60581811 318.0 3.572 0.108 0.0435 4.524 294 9.55 9.94 7.31 0.624
82501 445.1 3.609 0.111 0.0442 0.467 303 0.172 9.67 10.06 7.17 0.634 4.482502 434.8 3.607 0.111 0.0445 0.455 302 0.172 9.65 10.06 7.18 0.636 4.882503 424.1 3.598 0.111 0.0444 0.456 299 0.171 9.74 10.02 7.26 0.634 3.282504 415.3 3.581 0.110 0.0442 0.453 300 0.170 9.61 10.04 7.15 0.613 1.382505 302.2 3.595 0.109 0.0431 0.447 295 0.169 9.66 9.81 1.582506 262.4 3.659 0.108 0.445 294 0.169 9.60 9.93 0.482507 221.5 3.731 0.109 0.0439 0.448 293 0.168 9.58 9.79 1.7
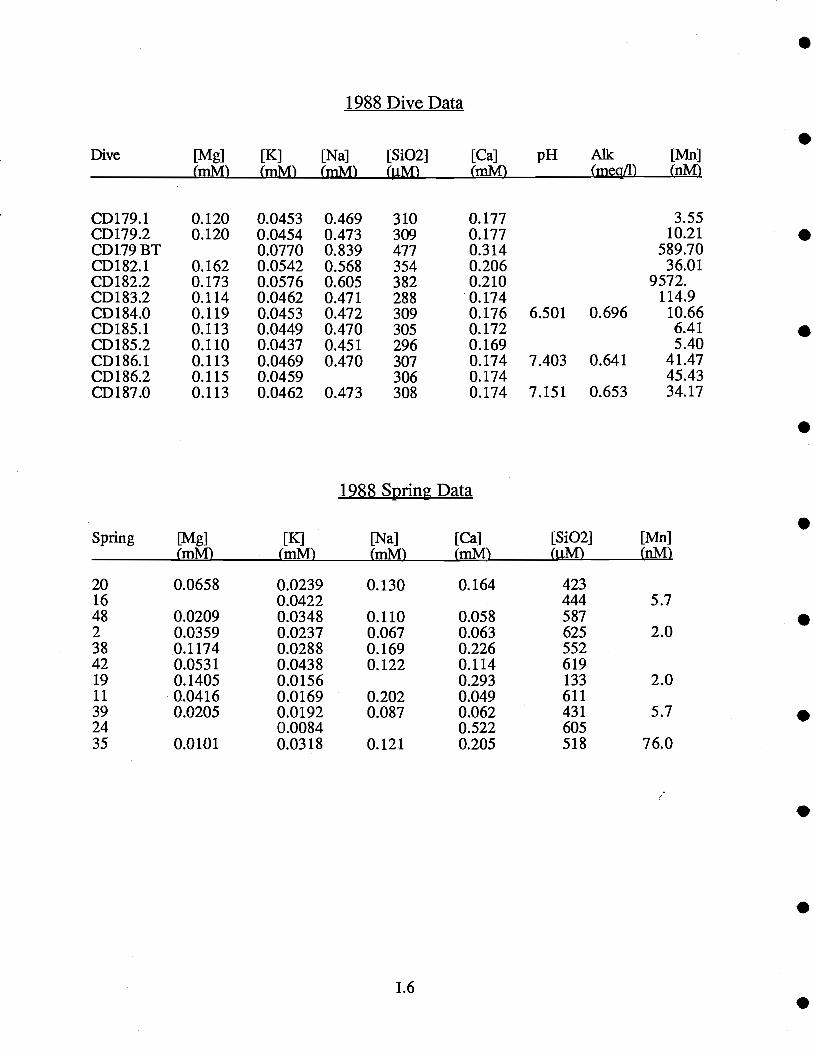
1988 Dive Data
1.6
Dive [Mg] [K] [Na] [Si02] [Ca] pH Alk [Mn]mM mM mM M mM m-.
CD179.1 0.120 0.0453 0.469 310 0.177 3.55CD179.2 0.120 0.0454 0.473 309 0.177 10.21CD179BT 0.0770 0.839 477 0.314 589.70CD182.1 0.162 0.0542 0.568 354 0.206 36.01CD182.2 0.173 0.0576 0.605 382 0.210 9572.CD183.2 0.114 0.0462 0.471 288 0.174 114.9CD184.0 0.119 0.0453 0.472 309 0.176 6.501 0.696 10.66CD185.1 0.113 0.0449 0.470 305 0.172 6.41CD185.2 0.110 0.0437 0.451 296 0.169 5.40CD186.1 0.113 0.0469 0.470 307 0.174 7.403 0.641 41.47CD186.2 0.115 0.0459 306 0.174 45.43CD187.0 0.113 0.0462 0.473 308 0.174 7.151 0.653 34.17
Spring [Mg](mM)
[K](mM'
1988 Spring Data
[Si02](pM')
[Mn](nM')
[Na] [Ca](mM (mM)
20 0.0658 0.0239 0.130 0.164 42316 0.0422 444 5.748 0.0209 0.0348 0.110 0.058 5872 0.0359 0.0237 0.067 0.063 625 2.038 0.1174 0.0288 0.169 0.226 55242 0.0531 0.0438 0.122 0.114 61919 0.1405 0.0156 0.293 133 2.011 0.0416 0.0169 0.202 0.049 61139 0.0205 0.0192 0.087 0.062 431 5.724 0.0084 0.522 60535 0.0101 0.0318 0.121 0.205 518 76.0
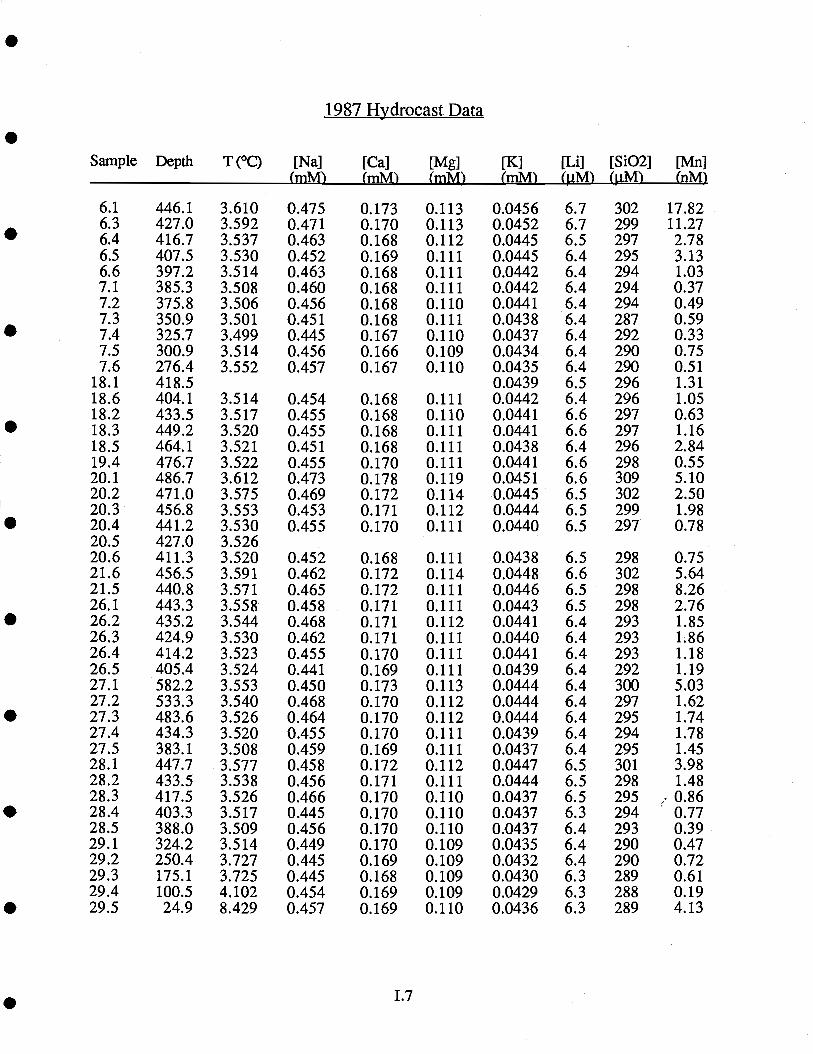
Sample Depth T (°C)
1987 Hydrocast Data
[K]mM
[Li]-
[Si02]M
[Mn][Na] [Ca] [Mg]mM mM
6.1 446.1 3.610 0.475 0.173 0.113 0.0456 6.7 302 17.826.3 427.0 3.592 0.471 0.170 0.113 0.0452 6.7 299 11.276.4 416.7 3.537 0.463 0.168 0.112 0.0445 6.5 297 2.786.5 407.5 3.530 0.452 0.169 0.111 0.0445 6.4 295 3.136.6 397.2 3.514 0.463 0.168 0.111 0.0442 6.4 294 1.037.1 385.3 3.508 0.460 0.168 0.111 0.0442 6.4 294 0.377.2 375.8 3.506 0.456 0.168 0.110 0.0441 6.4 294 0.497.3 350.9 3.501 0.451 0.168 0.111 0.0438 6.4 287 0.597.4 325.7 3.499 0.445 0.167 0.110 0.0437 6.4 292 0.337.5 300.9 3.514 0.456 0.166 0.109 0.0434 6.4 290 0.757.6 276.4 3.552 0.457 0.167 0.110 0.0435 6.4 290 0.51
18.1 418.5 0.0439 6.5 296 1.3118.6 404.1 3.514 0.454 0.168 0.111 0.0442 6.4 296 1.0518.2 433.5 3.517 0.455 0.168 0.110 0.0441 6.6 297 0.6318.3 449.2 3.520 0.455 0.168 0.111 0.0441 6.6 297 1.1618.5 464.1 3.521 0.451 0.168 0.111 0.0438 6.4 296 2.8419.4 476.7 3.522 0.455 0.170 0.111 0.0441 6.6 298 0.5520.1 486.7 3.612 0.473 0.178 0.119 0.0451 6.6 309 5.1020.2 471.0 3.575 0.469 0.172 0.114 0.0445 6.5 302 2.5020.3 456.8 3.553 0.453 0.171 0.112 0.0444 6.5 299 1.9820.4 441.2 3.530 0.455 0.170 0.111 0.0440 6.5 297 0.7820.5 427.0 3.52620.6 411.3 3.520 0.452 0.168 0.111 0.0438 6.5 298 0.7521.6 456.5 3.591 0.462 0.172 0.114 0.0448 6.6 302 5.6421.5 440.8 3.571 0.465 0.172 0.111 0.0446 6.5 298 8.2626.1 443.3 3.558 0.458 0.171 0.111 0.0443 6.5 298 2.7626.2 435.2 3.544 0.468 0.171 0.112 0.0441 6.4 293 1.8526.3 424.9 3.530 0.462 0.171 0.111 0.0440 6.4 293 1.8626.4 414.2 3.523 0.455 0.170 0.111 0.0441 6.4 293 1.1826.5 405.4 3.524 0.441 0.169 0.111 0.0439 6.4 292 1.1927.1 582.2 3.553 0.450 0.173 0.113 0.0444 6.4 300 5.0327.2 533.3 3.540 0.468 0.170 0.112 0.0444 6.4 297 1.6227.3 483.6 3.526 0.464 0.170 0.112 0.0444 6.4 295 1.7427.4 434.3 3.520 0.455 0.170 0.111 0.0439 6.4 294 1.7827.5 383.1 3.508 0.459 0.169 0.111 0.0437 6.4 295 1.4528.1 447.7 3.577 0.458 0.172 0.112 0.0447 6.5 301 3.9828.2 433.5 3.538 0.456 0.171 0.111 0.0444 6.5 298 1.4828.3 417.5 3.526 0.466 0.170 0.110 0.0437 6.5 295 ,. 0.8628.4 403.3 3.517 0.445 0.170 0.110 0.0437 6.3 294 0.7728.5 388.0 3.509 0.456 0.170 0.110 0.0437 6.4 293 0.3929.1 324.2 3.514 0.449 0.170 0.109 0.0435 6.4 290 0.4729.2 250.4 3.727 0.445 0.169 0.109 0.0432 6.4 290 0.7229.3 175.1 3.725 0.445 0.168 0.109 0.0430 6.3 289 0.6129.4 100.5 4.102 0.454 0.169 0.109 0.0429 6.3 288 0.1929.5 24.9 8.429 0.457 0.169 0.110 0.0436 6.3 289 4.13
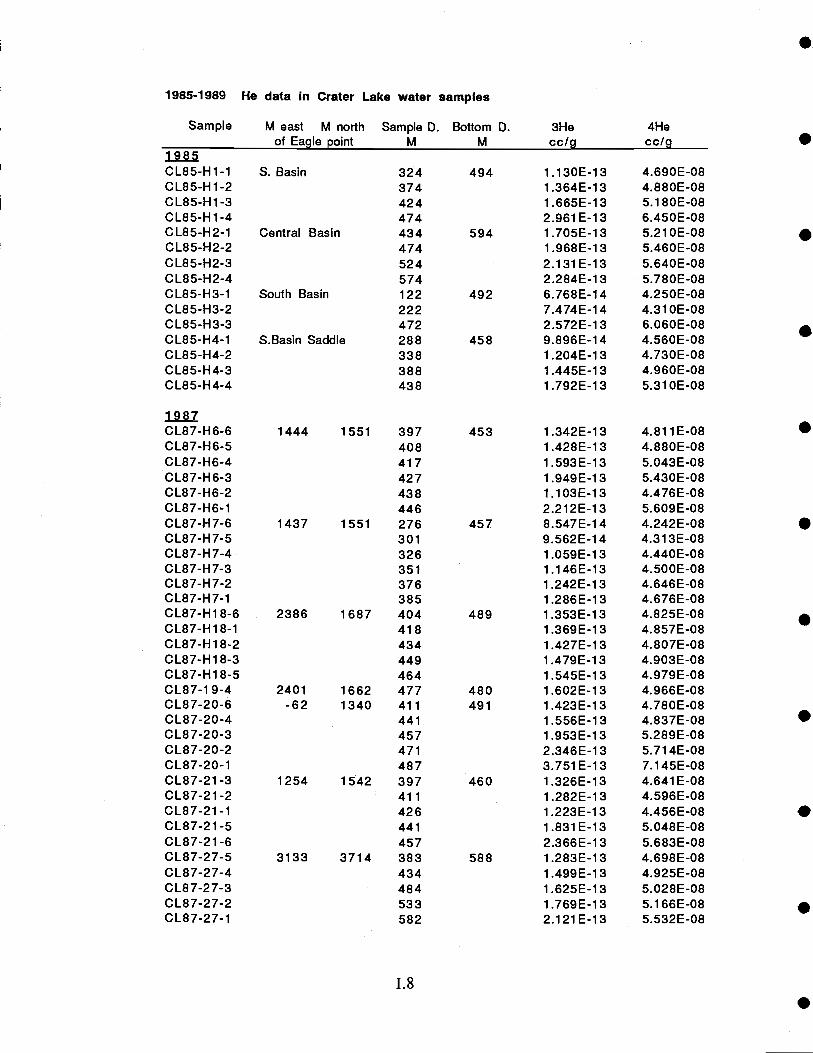
1.8
1985-1989
Sample
He data In Crater Lake water samples
M east M north Sample 0. Bottom 0.of Ea.le oint M M
3Heccl.
4Hecc!
1985CL85-H1-1 S. Basin 324 494 1.130E-13 4.690E-08CL8S-H 1-2 374 1.364E-13 4.880E-08CL85-H 1-3 424 1.665E-13 5.180E-08CL85-H1 -4 474 2.961E-13 6.450E-08C L8 5-H 2-1 Central Basin 434 594 1.705E-13 5.210E-08CL85-H2-2 474 1.968E-13 5.460E-08CL85-H2-3 524 2.131E-13 5.640E-08CL85-H2-4 574 2.284E-13 5.780E-08CL85-H3-1 South Basin 122 492 6.768E-14 4.250E-08C185-H3-2 222 7.474E-14 4.310E-08CL85-H3-3 472 2.572E-13 6.060E-08CL85-H4-1 S.Basin Saddle 288 458 9.896E-14 4.560E-08CL85-H4-2 338 1.204E-13 4.730E-08CL85-H4-3 388 1.445E-13 4.960E-08CL85-H4-4 438 1.792E-13 5.310E-08
1987C187-H6-6 1444 1551 397 453 1.342E-13 4.811E-08CL87-H6-5 408 1.428E-13 4.880E-08CL87-H6-4 417 1.593E-13 5.043E-08CL87-H6-3 427 1.949E-13 5.430E-08CL87-H6-2 438 1.103E-13 4.476E-08CL87-H6-1 446 2.212E-13 5.609E-08CL87-H7-6 1437 1551 276 457 8.547E-14 4.242E-08CL87-H7-5 301 9.562E-14 4.313E-08CL87-H7-4 326 1.059E-13 4.440E-08CL87-H7-3 351 1.146E-13 4.500E-08CL87-H7-2 376 1.242E-13 4.646E-08CL87-H7-1 385 1 .286E-1 3 4.676E-08CL87-H18-6 2386 1687 404 489 1.353E-13 4.825E-08CL87-H 18-1 418 1 .369E-1 3 4.857E-08CL87-H 18-2 434 1 .427E-1 3 4.807E-08CL87-H 18-3 449 1 .479E-1 3 4.903E-08CL87-H18-5 464 1.545E-13 4.979E-08CL87-19-4 2401 1662 477 480 1.602E-13 4.966E-08C187-20-6 -62 1340 411 491 1.423E-13 4.780E-08CL87-20-4 441 1.556E-13 4.837E-08CL87-20-3 457 1 .953E-1 3 5.289E-08CL87-20-2 471 2.346E-13 5.714E-08CL87-20-1 487 3.751E-13 7.145E-08CL87-21-3 1254 1542 397 460 1.326E-13 4.641E-08CL87-21-2 411 1.282E-13 4.596E-08CL87-21-1 426 1.223E-13 4.456E-08CL87-21-5 441 1.831E-13 5.048E-08CL87-21 -6 457 2.366E-1 3 5.683E-08CL87-27-5 3133 3714 383 588 1.283E-13 4.698E-08CL87-27-4 434 1.499E-13 4.925E-08CL87-27-3 484 1 .625E-13 5.028E-08CL87-27-2 1.769E-13 5.166E-08CL87-27-1 582 2.121E-13 5.532E-08
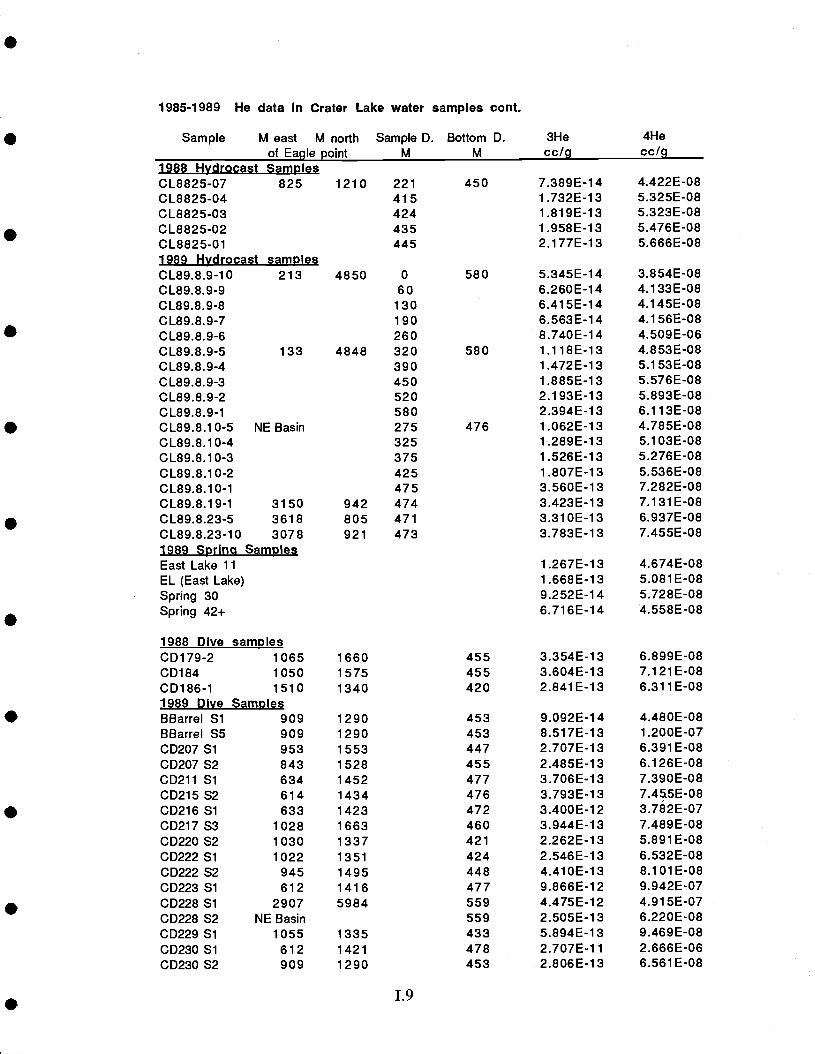
'.9
1985-1 989 He data In Crater Lake water samples cont.
Sample M east M north Sample D. Bottom D.of Ea.le .int M M
3Hecc/I
4Hecc/I
1988 Hydrocast SamplesCL8825-07 825 1210 221 450 7.389E-14 4.422E-08CL8825-04 415 1.732E-13 5.325E-08CL8825-03 424 i.819E-13 5.323E-08CL8825-02 435 1.958E-13 5.476E-08CL8825-0 1 445 2.177E-13 5.666E-081989 Hydrocast samolesCL89.8.9-i0 213 4850 0 580 5.345E-14 3.854E-08CL89.8.9-9 60 6.260E-14 4.133E-08CL89.8.9-8 130 6.41 5E-1 4 4.1 45E-08CL89.8.9-7 1 90 6.563E-1 4 4.1 56E-08CL89.8.9-6 260 8.740E-1 4 4.509E-06CL89.8.9-5 133 4848 320 580 1.118E-13 4.853E-08CL89.8.9-4 390 1 .472E-1 3 5.1 53E-08CL89.8.9-3 450 1 .885E-1 3 5.576E-080L89.8.9-2 520 2.1 93E-1 3 5.893E-08CL89.8.9-i 580 2.394E-1 3 6.11 3E-08CL89.8.10.5 NE Basin 275 476 1.062E-13 4.785E-08CL89.8.10-4 325 1.289E-13 5.103E-08CL89.8.1 0-3 375 1 .526E-1 3 5.276E-08CL89.8.1 0-2 425 1 .807E-13 5.536E-08CL89.8.1 0-1 475 3.560E-i 3 7.282E-08CL89.8.19-i 3150 942 474 3.423E-13 7.131E-08CL89.8.23-5 3618 805 471 3.310E-13 6.937E-08CL89.8.23-10 3078 921 473 3.783E-13 7.455E-081989 SprIng SamplesEast Lake 11 1.267E-13 4.674E-08EL (East Lake) 1.668E-13 5.081E-08Spring 30 9.252E-14 5.728E-08Spring 42+ 6.716E-14 4.558E-08
1988 Dive samplesCD179-2 1065 1660 455 3.354E-13 6.899E-08CD184 1050 1575 455 3.604E-13 7.121E-08CD186-1 1510 1340 420 2.841E-13 6.311E-083989 Dive SamplesBBarrel Si 909 1290 453 9.092E-14 4.480E-08BBarrel S5 909 1290 453 8.517E-13 1.200E-07CD207 Si 953 1553 447 2.707E-13 6.391E-08CD207 S2 843 1528 455 2.485E-13 6.126E-08CD211 Si 634 1452 477 3.706E-13 7.390E-08CD215 S2 614 1434 476 3.793E-13 7.455E-08CD216 Si 633 1423 472 3.400E-12 3.782E-07CD217 S3 1028 1663 460 3.944E-13 7.489E-08CD220S2 1030 1337 421 2.262E-13 5.891E-08CD222 Si 1022 1351 424 2.546E-13 6.532E-08CO222 S2 945 1495 448 4.410E-13 8.iOiE-08CD223 Si 612 1416 477 9.866E-12 9.942E-07CD228 Si 2907 5984 559 4.475E-i2 4.915E-07CD228 S2 NE Basin 559 2.505E-13 6.220E-08CD229 Si 1055 1335 433 5.894E-i3 9.469E-08CD230 Si 6i2 1421 478 2.707E-11 2.666E-06CD230 S2 909 1290 453 2.806E-13 6.561E-08
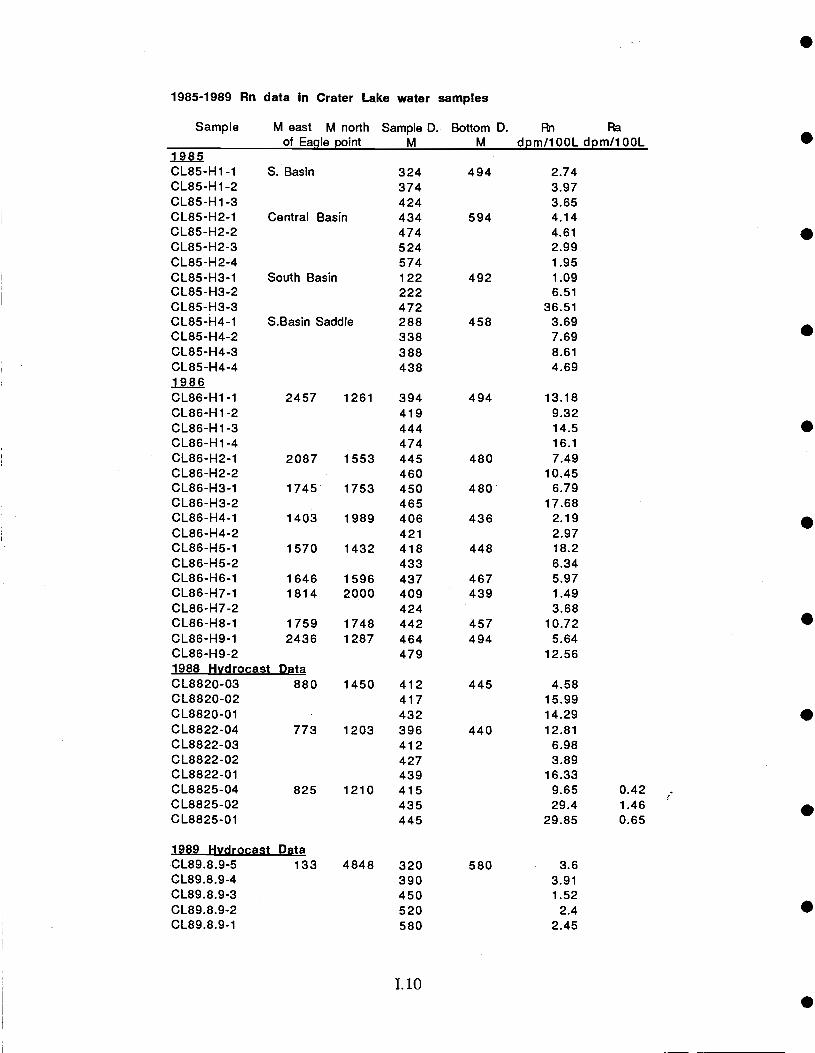
1985-1989 Rn data in Crater Lake water samples
1.10
Sample M east M northof Eagle point
Sample 0.M
Bottom D. Rn Ra
M dpmflOOL dpm/100L1985CL85-H1-1 S. Basin 324 494 2.74CL85-H1-2 374 3.97CL85-H1-3 424 3.65CL85-H2-1 Central Basin 434 594 4.14CL85-k2-2 474 4.61CL85-H2-3 524 2.99CL85-H2-4 574 1.95CL85-H3-1 South Basin 122 492 1.09CL85-H3-2 222 6.51CL85-H3-3 472 36.51CL85-H4-1 S.Basin Saddle 288 458 3.69CL85-H4-2 338 7.69CL85-H4-3 388 8.61CL85-t-14-4 438 4.691986CL86-H1-1 2457 1261 394 494 13.18CL86-H1-2 419 9.32CL86-H1-3 444 14.5CL86-H1-4 474 16.1CL86-H2-1 2087 1553 445 480 7.49CL86-H2-2 460 10.45CL86-H3-1 1745 1753 450 480 6.79CL86-H3-2 465 17.68CL86-H4-1 1403 1989 406 436 2.19CL86-H4-2 421 2.97CL86-H5-1 1570 1432 418 448 18.2CL86-H5-2 433 6.34CL86-H6-1 1646 1596 437 467 5.97CL86-H7-1 1814 2000 409 439 1.49CL86.H7-2 424 3.68CL86-H8-1 1759 1748 442 457 10.72CL86-H9-1 2436 1287 464 494 5.64CL86-H9-2 479 12.561988 Hydrocast DataCL8820-03 880 1450 412 445 4.58CL8820-02 417 15.99CL8820-01 432 14.29CL8822-04 773 1203 396 440 12.81CL8822-o3 412 6.98CL8822-02 427 3.89CL8822-01 439 16.33CL8825-04 825 1210 415 9.65 0.42CL8825-02 435 29.4 1.46CL8825-01 445 29.85 0.65
1989 Hydrocast DataCL89.8.9-5 133 4848 320 580 3.6CL89.8.9-4 390 3.91CL89.8.9.3 450 1.52CL89.8.9-2 520 2.4CL89.8.9-1 580 2.45
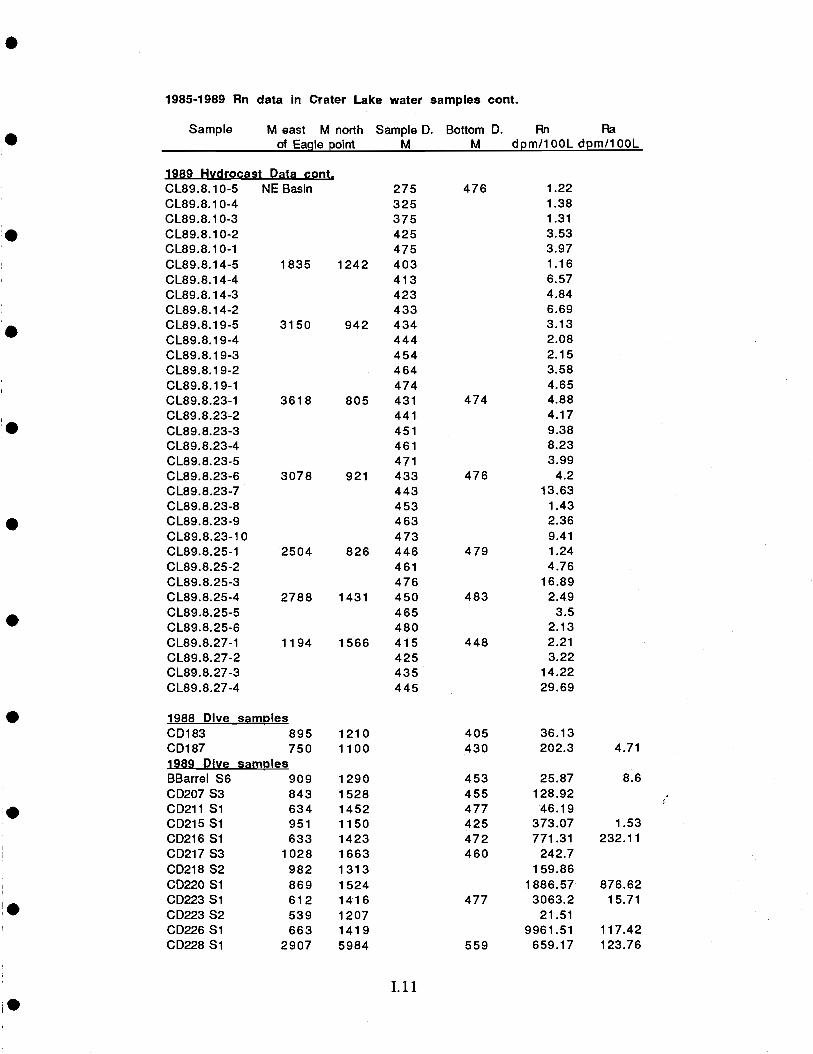
1985-1989 Rn data in Crater Lake water samples coat.
Sample M east M northof Eagle point
Sample D.M
Bottom 0. Rn RaM dpm/100L dpm/100L
1989 Hydrocast Data coat.CL89.8.10-5 NE Basin 275 476 1.22CL89.8.10-4 325 1.38CL89.8.10-3 375 1.31CL89.8.i0-2 425 3.53CL89.8.10-1 475 3.97CL89.8.14-5 1835 1242 403 1.16CL89.8.14-4 413 6.57CL89.8.14-3 423 4.84CL89.8.14-2 433 6.69CL89.8.19-5 3150 942 434 3.13CL89.8.19-4 444 2.08CL89.8.19-3 454 2.15CL89.8.19-2 464 3.58CL89.8.19-1 474 4.65CL89.8.23-1 3618 805 431 474 4.88CL89.8.23-2 441 4.17CL89.8.23-3 451 9.38CL89.8.23-4 461 8.23CL89.8.23-5 471 3.99CL89.8.23-6 3078 921 433 476 4.2CL89.8.23-7 443 13.63CL89.8.23-8 453 1.43CL89.8.23-9 463 2.36CL89.8.23-10 473 9.41CL89.8.25-1 2504 826 446 479 1.24CL89.8.25-2 461 4.76CL89.8.25-3 476 16.89CL89.8.25-4 2788 1431 450 483 2.49CL89.8.25-5 465 3.5CL89.8.25-6 480 2.13CL89.8.27-1 1194 1566 415 448 2.21CL89.8.27-2 425 3.22CL89.8.27-3 435 14.22CL89.8.27-4 445 29.69
1988 Dive samplesCD183 895 1210 405 36.13C0187 750 1100 430 202.3 4.711989 Dive samplesBBarrel S6 909 1290 453 25.87 8.6CD207S3 843 1528 455 128.92CD211 Si 634 1452 477 46.19CD215S1 951 1150 425 373.07 1.53CD216 Si 633 1423 472 771.31 232.11CD217S3 1028 1663 460 242.7CD218S2 982 1313 159.86CD22OS1 869 1524 1886.57 876.62CO223S1 612 1416 477 3063.2 15.71CD223S2 539 1207 21.51CD226S1 663 1419 9961.51 117.42CD228 Si 2907 5984 559 659.17 123.76
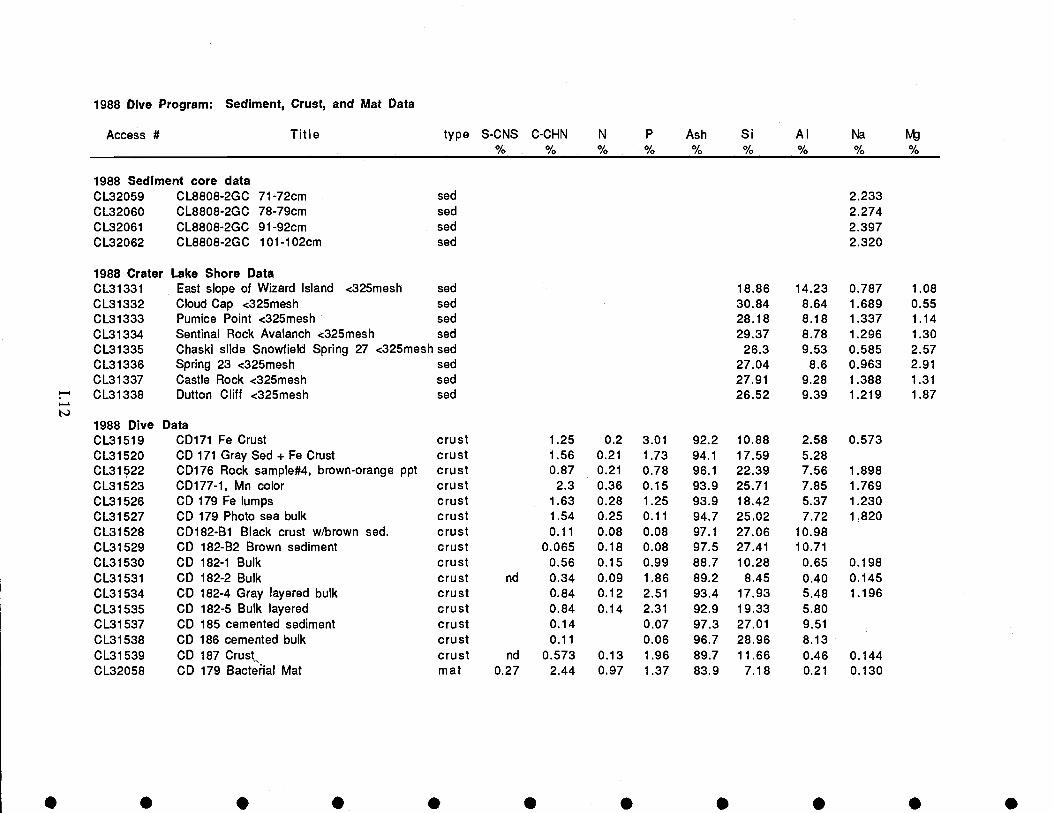
1988 Dive Program: Sediment, Crust, and Mat Data
Access # Title type S-CNS C-CHN N P
%Ash Si Al
%Na
% %
1988 Sediment core dataCL32059 CL8808-2GC 71-72cm sod 2.233CL32060 CL8808-2GC 78-79cm sed 2.274CL32061 CL8808-2GC 91-92cm sod 2,397CL32062 CL8808-2GC 101-102cm sod 2.320
1988 Crater Lake Shore DataCL31331 East slope of Wizard Island <325mesh sod 18.86 14.23 0.787 1.08CL31 332 Cloud Cap <325mesh sed 30.84 8.64 1.689 0.55CL31333 Pumice Point <325mesh sod 28.18 8.18 1.337 1.14CL31334 Sentinal Rock Avalanch <325mesh sed 29.37 8.78 1.296 1.30CL31335 Chaski slide Snowfield Spring 27 <325mesh sod 26.3 9.53 0.585 2.57CL31336 Spring 23 <325mesh sod 27.04 8.6 0.963 2.91CL31337 Castle Rock <325mesh sod 27.91 9.28 1.388 1.31CL31338 Dutton Cliff <325mesh sod 26.52 9.39 1.219 1.87
1988 Dive DataCL3 1519 CD171 Fe Crust crust 1.25 0.2 3.01 92.2 10.88 2.58 0.573CL31 520 CD 171 Gray Sed + Fe Crust crust 1.56 0.21 1.73 94.1 17.59 5.28CL31 522 CD176 Rock sample#4, brown-orange ppt crust 0.87 0.21 0.78 96.1 22.39 7.56 1.898CL31 523 CD177-1, Mn color crust 2.3 0.36 0.15 93.9 25.71 7.85 1.769CL31 526 CD 179 Fe lumps crust 1.63 0.28 1.25 93.9 18.42 5.37 1.230CL31 527 CD 179 Photo sea bulk crust 1.54 0.25 0.11 94.7 25.02 7.72 1.820CL31 528 CD182-B1 Black crust w/brown sed. crust 0.11 0.08 0.08 97.1 27.06 10.98CL31 529 CD 182-B2 Brown sediment crust 0.065 0.18 0.08 97.5 27.41 10.71CL31 530 CD 182-1 Bulk crust 0.56 0.15 0.99 88.7 10.28 0.65 0.198CL31 531 CD 182-2 Bulk crust nd 0.34 0.09 1.86 89.2 8.45 0.40 0.145CL31 534 CD 182-4 Gray layered bulk crust 0.84 0.12 2.51 93.4 17.93 5.48 1.196CL31 535 CD 182-5 Bulk layered crust 0.84 0.14 2.31 92.9 19.33 5.80CL31 537 CD 185 cemented sediment crust 0.14 0.07 97.3 27.01 9.51CL31 538 CD 186 cemented bulk crust 0.11 0.06 96.7 28.96 8.13CL31 539 CD 187 Crust crust nd 0.573 0.13 1.96 89.7 11.66 0.46 0.144CL32058 CD 179 Bacteial Mat mat 0.27 2.44 0.97 1.37 83.9 7.18 0.21 0.130
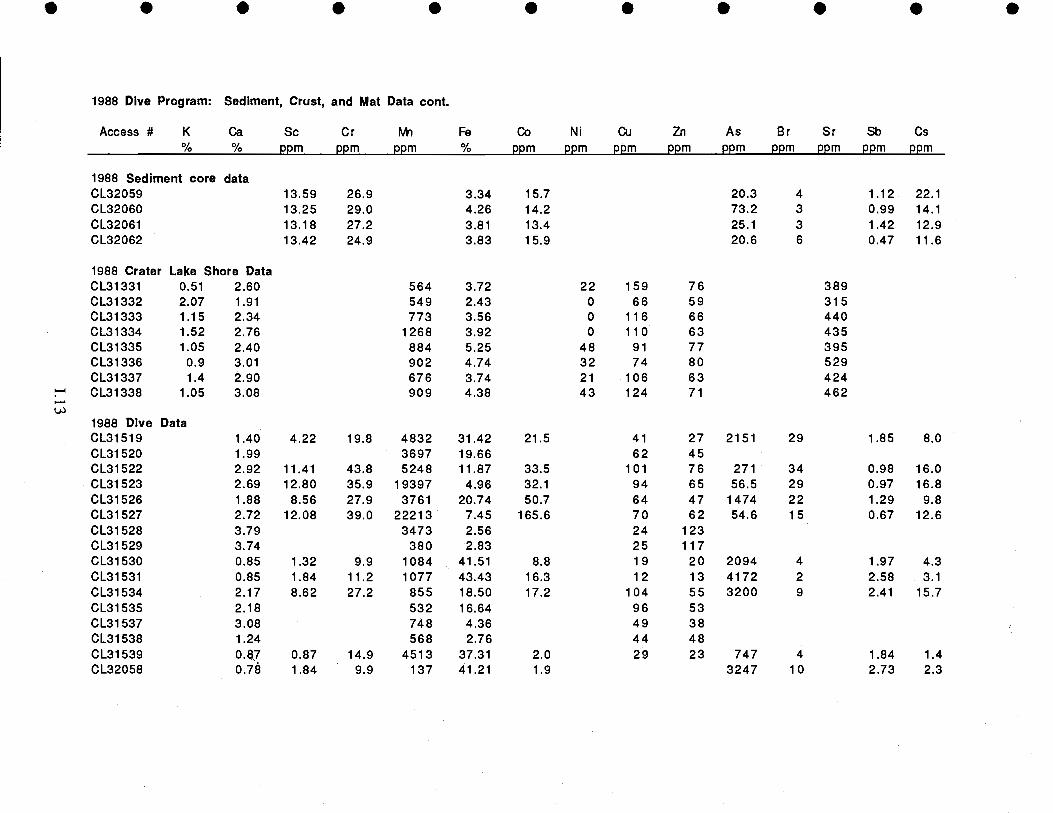
0 . 0
1988 Dive Program: Sediment, Crust, and Mat Data cont.
Access # K Ca
%Sc
ppmCr
ppmMn
ppmFe Co
ppm
Nippm
Cu
ppmZn
ppmAs
ppmBr
ppmSr
ppmSb
ppmCs
ppm
1988 Sediment core dataCL32059 13.59 26.9 3.34 15.7 20.3 4 1.12 22.1CL32060 13.25 29.0 4.26 14.2 73.2 3 0.99 14.1
CL32061 13.18 27.2 3.81 13.4 25.1 3 1.42 12.9CL32062 13.42 24.9 3.83 15.9 20.6 6 0.47 11.6
1988 Crater Lake Shore DataCL31331 0.51 2.60 564 3.72 22 159 76 389CL31332 2.07 1.91 549 2.43 0 66 59 315CL31333 1.15 2.34 773 3.56 0 116 66 440CL31334 1.52 2.76 1268 3.92 0 110 63 435CL31335 1.05 2.40 884 5.25 48 91 77 395CL31336 0.9 3.01 902 4.74 32 74 80 529CL31337 1.4 2.90 676 3.74 21 106 63 424CL31338 1.05 3.08 909 4.38 43 124 71 462
1988 DIve DataCL31519 1.40 4.22 19.8 4832 31.42 21.5 41 27 2151 29 1.85 8.0CL31520 1.99 3697 19.66 62 45CL31522 2.92 11.41 43.8 5248 11.87 33.5 101 76 271 34 0.98 16.0CL31523 2.69 12.80 35.9 19397 4.96 32.1 94 65 56.5 29 0.97 16.8CL31526 1.88 8.56 27.9 3761 20.74 50.7 64 47 1474 22 1.29 9.8CL31527 2.72 12.08 39.0 22213 7.45 165.6 70 62 54.6 15 0.67 12.6CL31528 3.79 3473 2.56 24 123CL31529 3.74 380 2.83 25 117CL31530 0.85 1.32 9.9 1084 41.51 8.8 19 20 2094 4 1.97 4.3CL31531 0.85 1.84 11.2 1077 43.43 16.3 12 13 4172 2 2.58 3.1CL31534 2.17 8.62 27.2 855 18.50 17.2 104 55 3200 9 2.41 15.7CL31535 2.18 532 16.64 96 53CL31537 3.08 748 4.36 49 38CL31538 1.24 568 2.76 44 48CL31539 0.87 0.87 14.9 4513 37.31 2.0 29 23 747 4 1.84 1.4CL32058 0.78 1.84 9.9 137 41.21 1.9 3247 10 2.73 2.3
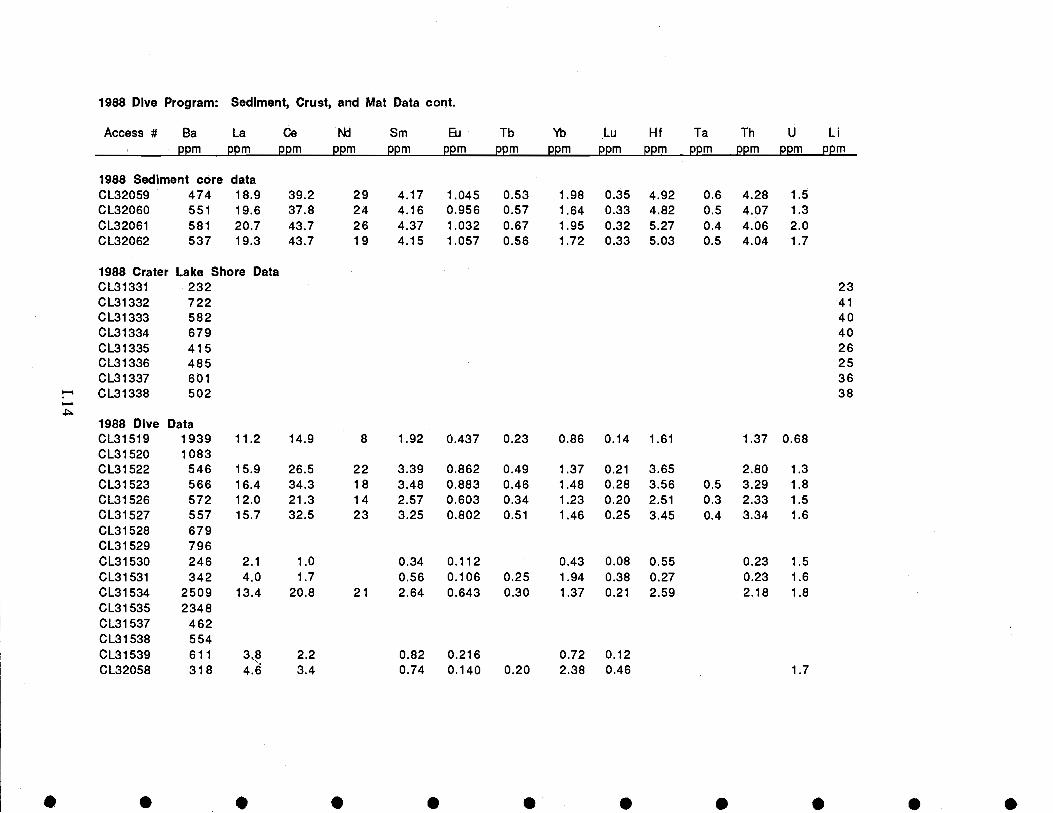
I
1988 Dive Program: Sediment, Crust, and Mat Data cont.
Access # Ba La Ce Nki Sm Bi Tb Lu Hf Ta Th U Lippm ppm ppm ppm ppm ppm ppm ppm ppm ppm ppm ppm ppm ppm
1988 Sediment core data
1988 Crater Lake Shore Data
1988 Dive DataCL31519 1939 11.2 14.9 8 1.92 0.437 0.23 0.86 0.14 1.61 1.37 0.68CL31520 1083CL31522 546 15.9 26.5 22 3.39 0.862 0.49 1.37 0.21 3.65 2.80 1.3CL31523 566 16.4 34.3 18 3.48 0.883 0.46 1.48 0.28 3.56 0.5 3.29 1.8CL31526 572 12.0 21.3 14 2.57 0.603 0.34 1.23 0.20 2.51 0.3 2.33 1.5CL31527 557 15.7 32.5 23 3.25 0.802 0.51 1.46 0.25 3.45 0.4 3.34 1.6CL31528 679CL31 529 796CL31530 246 2.1 1.0 0.34 0.112 0.43 0.08 0.55 0.23 1.5CL31531 342 4.0 1.7 0.56 0.106 0.25 1.94 0.38 0.27 0.23 1.6CL31534 2509 13.4 20.8 21 2.64 0.643 0.30 1.37 0.21 2.59 2.18 1.8CL31 535 2348CL31 537 462CL31538 554CL31539 611 3. 2.2 0.82 0.216 0.72 0.12CL32058 318 4. 3.4 0.74 0.140 0.20 2.38 0.46 1.7
CL32059 474 18.9 39.2 29 4.17 1.045 0.53 1.98 0.35 4.92 0.6 4.28 1.5CL32060 551 19.6 37.8 24 4.16 0.956 0.57 1.64 0.33 4.82 0.5 4.07 1.3CL32061 581 20.7 43.7 26 4.37 1.032 0.67 1.95 0.32 5.27 0.4 4.06 2.0CL32062 537 19.3 43.7 19 4.15 1.057 0.56 1.72 0.33 5.03 0.5 4.04 1.7
CL31331 232 23CL31332 722 41CL31333 582 40CL31334 679 40CL31335 415 26CL31336 485 25CL31337 601 36CL31338 502 38
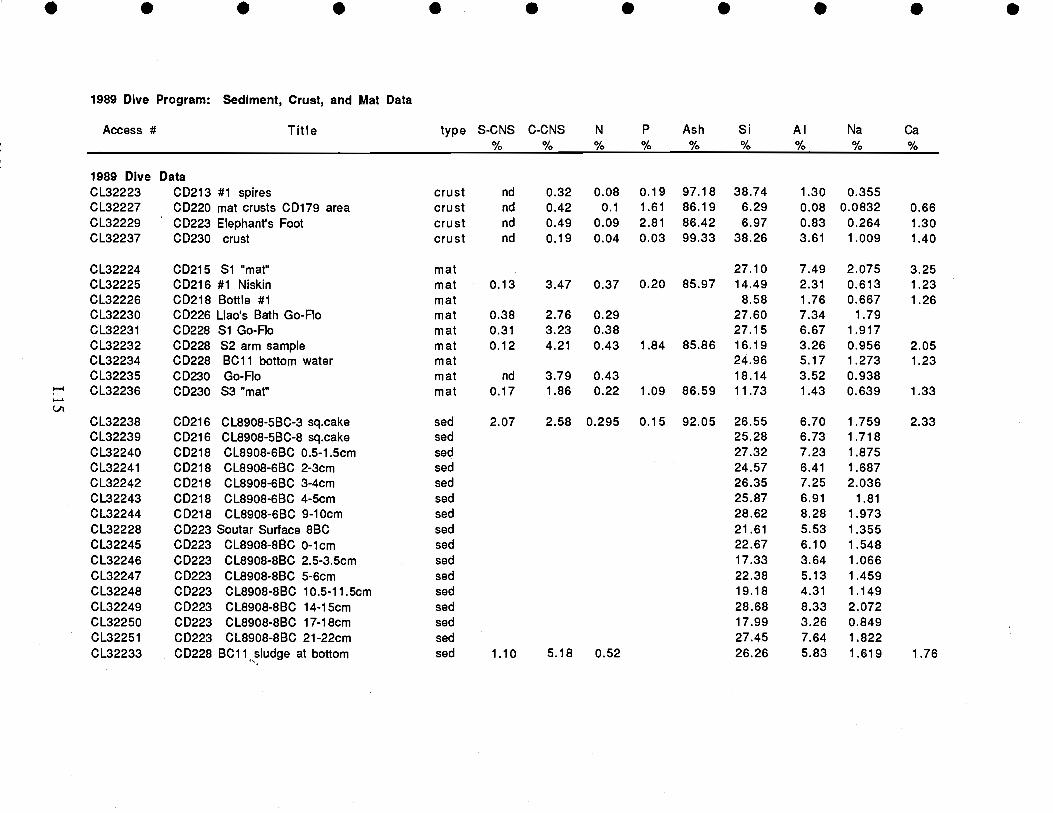
1989 Dive Program: Sediment, Crust, and Mat Data
Access # Title type S-CNS%
C-CNS N P Ash Si%
Al Na Ca%
1989 Dive DataCL32223 CD213 #1 spires crust nd 0.32 0.08 0.19 97.18 38.74 1.30 0.355CL32227 CD220 mat crusts CD179 area crust nd 0.42 0.1 1.61 86.19 6.29 0.08 0.0832 0.66CL32229 CD223 Elephanvs Foot crust nd 0.49 0.09 2.81 86.42 6.97 0.83 0.264 1.30CL32237 CD230 crust crust nd 0.19 0.04 0.03 99.33 38.26 3.61 1.009 1.40
CL32224 CD215 Si "mat" mat 27.10 7.49 2.075 3.25CL32225 CD216 #1 Niskin mat 0.13 3.47 0.37 0.20 85.97 14.49 2.31 0.613 1.23CL32226 CD218 Bottle #1 mat 8.58 1.76 0.667 1.26CL32230 CO226 Llaos Bath Go-Flo mat 0.38 2.76 0.29 27.60 7.34 1.79CL32231 CD228 Si Go-Flo mat 0.31 3.23 0.38 27.15 6.67 1.917CL32232 CD228 S2 arm sample mat 0.12 4.21 0.43 1.84 85.86 16.19 3.26 0.956 2.05CL32234 CD228 BC11 bottom water mat 24.96 5.17 1.273 1.23CL32235 CD230 Go-Flo mat nd 3.79 0.43 18.14 3.52 0.938CL32236 CD230 S3 "mat" mat 0.17 1.86 0.22 1.09 86.59 11.73 1.43 0.639 1.33
CL32238 CD216 CL8908-5BC-3 sq.cake sed 2.07 2.58 0.295 0.15 92.05 26.55 6.70 1.759 2.33CL32239 CD216 CL8908-5BC-8 sq.cake sed 25.28 6.73 1.718CL32240 CD218 CL8908-6BC 0.5-1.5cm sed 27.32 7.23 1.875CL32241 CD218 CL8908-6BC 2-3cm sed 24.57 6.41 1.687CL32242 CD218 CL8908-6BC 3-4cm sed 26.35 7.25 2.036CL32243 CD218 CL8908-6BC 4-5cm sed 25.87 6.91 1.81
CL32244 CD218 CL8908-6BC 9-10cm sed 28.62 8.28 1.973CL32228 CD223 Soutar Surface 8BC sed 21 .61 5.53 1 .355
CL32245 CD223 CL8908-8BC 0-1cm sed 22.67 6.10 1.548CL32246 CD223 CL8908-8BC 2.5-3.5cm sed 17.33 3.64 1.066CL32247 CD223 CL8908-8BC 5-6cm sed 22.38 5.13 1.459CL32248 CD223 CL8908-8BC 10.5-11.5cm sed 19.18 4.31 1.149CL32249 CD223 CL8908-8BC 14-15cm sed 28.68 8.33 2.072CL32250 CD223 CL8908-8BC 17-18cm sed 17.99 3.26 0.849CL32251 CD223 CL8908-8BC 21-22cm sed 27.45 7.64 1.822CL32233 CD228 BC11 sludge at bottom sed 1.10 5.18 0.52 26.26 5.83 1.619 1.76

1989 DIve Program: Sediment, Crust, and Mat Data cont.
. S S S S S
Access # Scppm
Vppm
Crppm
Mippm
Fe Coppm
Nippm
Cu
ppmZn
ppmAs
ppmBr
ppmSb
ppmCs
ppmBa
ppm
1989 DIve DataCL32223 2.351 9.307 259 7.52 3.08 17 44.6 31.9 1180.8 60.50 4.5 145CL32227 1.574 9.052 1844 41.73 23.41 18 16.7 9.9 4104 2.68 2.6 305CL32229 3.644 11.35 1732 36.97 32.85 35 21.5 26.9 9277.3 11.60 6.1 537CL32237 6.197 19.04 229 2.33 5.52 28 50.8 31.6 30.3 2 0.34 12.9 225
CL32224 11.23 133 43.93 3775 5.10 44.22 75 48.2 75.6 347.5 1.10 15.4 509CL32225 4.721 18.13 3272 28.22 24.54 37 47.8 35.2 354.5 21 0.62 8.3 378CL32226 5.334 225 28.97 1471 28.72 8.63 24 51.5 33.3 9604.1 32 21.20 6.5 569CL32230 11.54 37.56 459 3.45 12.42 61 88.2 70.1 67.2 19 0.52 20.1 386CL32231 11.53 31.27 1687 4.24 14.74 55 114.4 73.8 60 56 0.73 14.8 429CL32232 6.686 21.89 6190 18.25 66.78 146 87.3 58.5 6139 45 1.12 6.8 716CL32234 10.52 82.2 27.96 608 4.90 18.43 50 122.4 90.7 277.7 71 1.39 13.1 360CL32235 7.538 25.2 2751 18.57 14.63 45 68.0 43.5 1053.7 24 0.77 13.6 852CL32236 3.305 14 150.30 34.12 3.15 20 26.2 18.5 1710.4 14 0.63 7.6 376
CL32238 12.14 38.73 457 6.00 17.78 62 89.2 82.1 176.6 15 0.61 16.1 487CL32239 11.48 33.26 466 5.68 16.47 66 89.2 73.6 175.4 16 0.52 15.2 438CL32240 12.07 40 13165 3.55 16.88 78 76.1 68.4 26.1 23 0.60 17.1 486CL32241 11.52 39.92 3946 9.07 31.31 56 72.0 61.1 354.3 24 0.60 17.8 409CL32242 12.62 41.89 1135 5.37 15.23 56 69.3 64.4 161.2 17 0.70 17.2 416CL32243 12.27 39.28 1969 7.68 20.63 56 79.1 64.7 406.8 18 0.73 17.4 556CL32244 13.96 45.42 1234 3.95 19.83 64 92.0 69.7 21.6 19 0.98 20.5 468CL32228 9.922 30.34 103083 4.48 124.64 138 77.2 76.5 97.8 19 0.75 15.3 830CL32245 10.74 39.24 70927 4.23 79.73 116 70.2 64.6 74.1 18 0.97 15.6 838CL32246 7.011 28.85 4215 23.97 78.93 49 58.2 42.0 75.7 17 0.81 8.6 724CL32247 9.631 34.23 3256 15.52 60.01 55 69.5 54.2 119.7 19 0.73 10.9 697CL32248 7.748 29.27 3125 19.74 51.52 47 60.3 46.7 220 12 0.83 9.9 695CL32249 13.49 44.86 670 4.57 35.57 64 72.4 71.3 8.65 17 0.65 16.1 482CL32250 6.544 23.46 2380 23.71 53.40 43 60.5 40.5 383.5 1 4 0.49 9.3 687CL32251 13.15 39.24 895 6.35 34.05 59 82.0 66.7 84.2 10 0.63 17.2 503CL32233 10.81 809 28.18 465 4.01 15.32 63 123.8 101.6 133.7 68 1.23 13.2 392
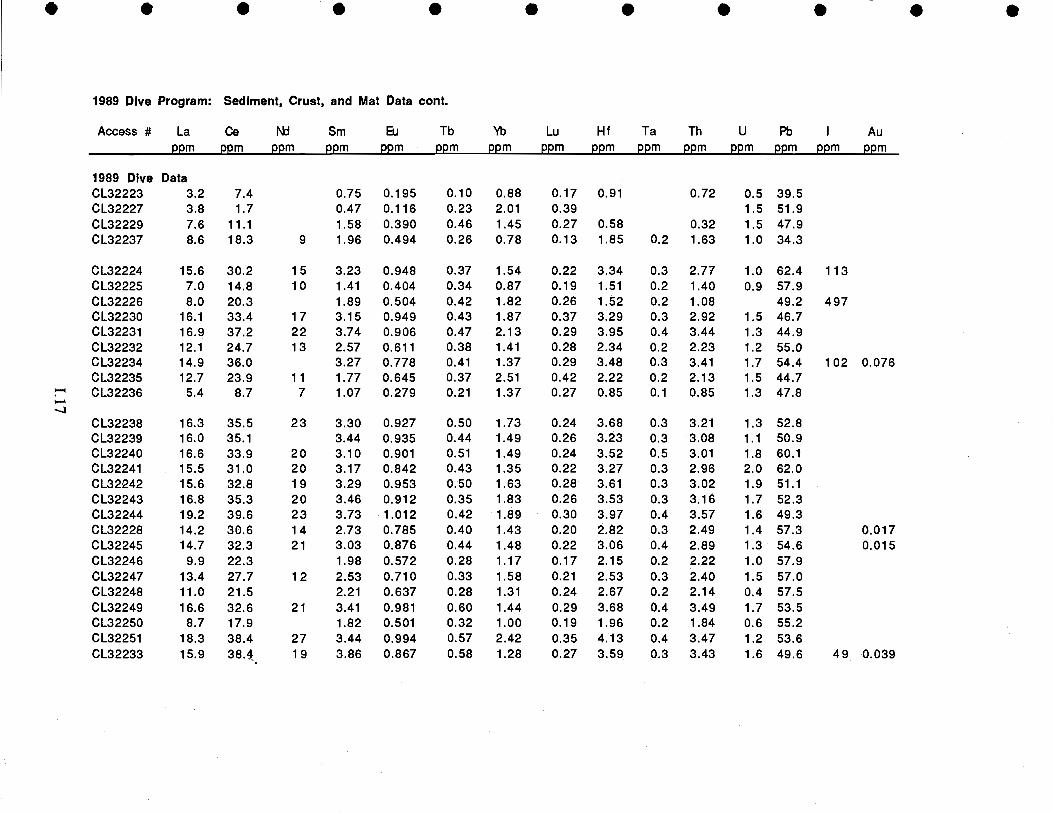
1989 Dive Program: Sediment, Crust, and Mat Data cont.
Access # Lappm
Ceppm ppm
Sm
ppmB.i
ppmTb
ppm ppmLu
ppmHf
ppmTa
ppmTh
ppmU
ppmPb
ppm
I
ppmAu
ppm
1989 DIve DataCL32223 3.2 7.4 0.75 0.195 0.10 0.88 0.17 0.91 0.72 0.5 39.5CL32227 3.8 1.7 0.47 0.116 0.23 2.01 0.39 1.5 51.9CL32229 7.6 11.1 1.58 0.390 0.46 1.45 0.27 0.58 0.32 1.5 47.9CL32237 8.6 18.3 9 1.96 0.494 0.26 0.78 0.13 1.85 0.2 1.63 1.0 34.3
CL32224 15.6 30.2 15 3.23 0.948 0.37 1.54 0.22 3.34 0.3 2.77 1.0 62.4 113CL32225 7.0 14.8 10 1.41 0.404 0.34 0.87 0.19 1.51 0.2 1.40 0.9 57.9CL32226 8.0 20.3 1.89 0.504 0.42 1.82 0.26 1.52 0.2 1.08 49.2 497CL32230 16.1 33.4 17 3.15 0.949 0.43 1.87 0.37 3.29 0.3 2.92 1.5 46.7CL32231 16.9 37.2 22 3.74 0.906 0.47 2.13 0.29 3.95 0.4 3.44 1.3 44.9CL32232 12.1 24.7 13 2.57 0.611 0.38 1.41 0.28 2.34 0.2 2.23 1.2 55.0CL32234 14.9 36.0 3.27 0.778 0.41 1.37 0.29 3.48 0.3 3.41 1.7 54.4 102 0.076CL32235 12.7 23.9 11 1.77 0.645 0.37 2.51 0.42 2.22 0.2 2.13 1.5 44.7CL32236 5.4 8.7 7 1.07 0.279 0.21 1.37 0.27 0.85 0.1 0.85 1.3 47.8
CL32238 16.3 35.5 23 3.30 0.927 0.50 1.73 0.24 3.68 0.3 3.21 1.3 52.8CL32239 16.0 35.1 3.44 0.935 0.44 1.49 0.26 3.23 0.3 3.08 1.1 50.9CL32240 16.6 33.9 20 3.10 0.901 0.51 1.49 0.24 3.52 0.5 3.01 1.8 60.1
CL32241 15.5 31.0 20 3.17 0.842 0.43 1.35 0.22 3.27 0.3 2.96 2.0 62.0CL32242 15.6 32.8 19 3.29 0.953 0.50 1.63 0.28 3.61 0.3 3.02 1.9 51.1
CL32243 16.8 35.3 20 3.46 0.912 0.35 1.83 0.26 3.53 0.3 3.16 1.7 52.3CL32244 19.2 39.6 23 3.73 1.012 0.42 1.89 0.30 3.97 0.4 3.57 1.6 49.3CL32228 14.2 30.6 14 2.73 0.785 0.40 1.43 0.20 2.82 0.3 2.49 1.4 57.3 0.017CL32245 14.7 32.3 21 3.03 0.876 0.44 1.48 0.22 3.06 0.4 2.89 1.3 54.6 0.015CL32246 9.9 22.3 1.98 0.572 0.28 1.17 0.17 2.15 0.2 2.22 1.0 57.9CL32247 13.4 27.7 12 2.53 0.710 0.33 1.58 0.21 2.53 0.3 2.40 1.5 57.0CL32248 11.0 21.5 2.21 0.637 0.28 1.31 0.24 2.67 0.2 2.14 0.4 57.5CL32249 16.6 32.6 21 3.41 0.981 0.60 1.44 0.29 3.68 0.4 3.49 1.7 53.5CL32250 8.7 17.9 1.82 0.501 0.32 1.00 0.19 1.96 0.2 1.84 0.6 55.2CL32251 18.3 38.4 27 3.44 0.994 0.57 2.42 0.35 4.13 0.4 3.47 1.2 53.6CL32233 15.9 38.4 19 3.86 0.867 0.58 1.28 0.27 3.59 0.3 3.43 1.6 49.6 49 0.039
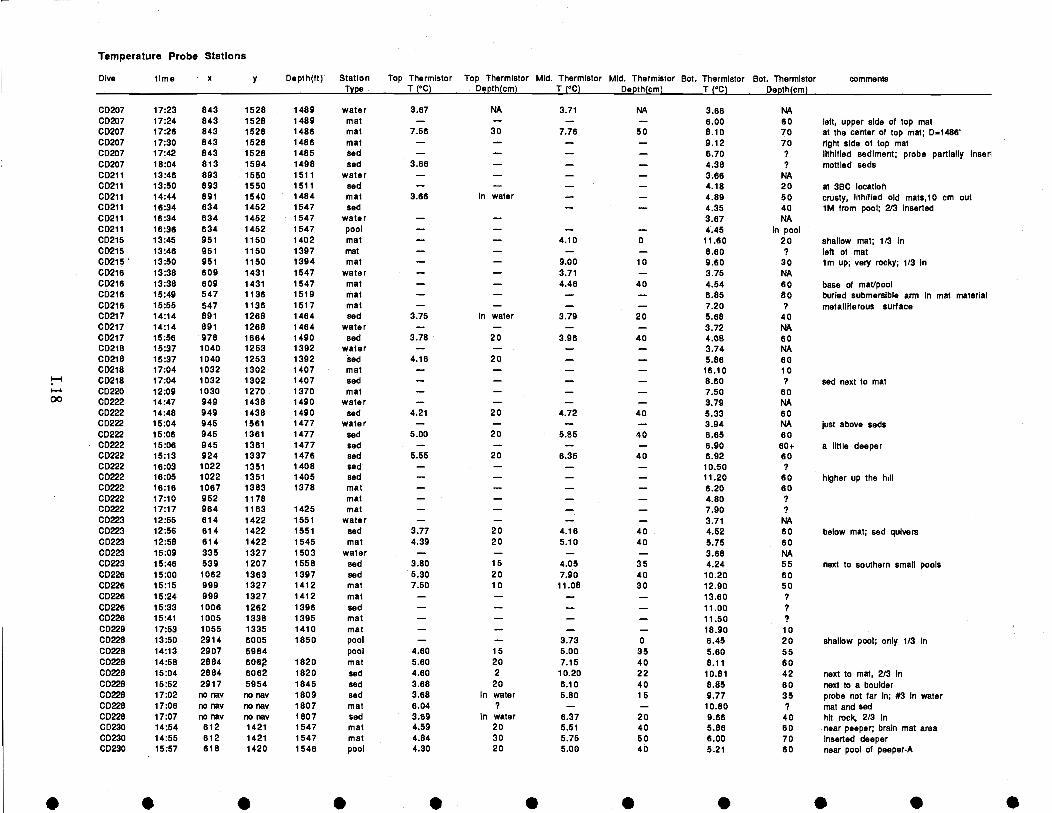
Temperature Probe Stations
00
Top Thermistor Top Thermistor Mid. Thermistor Mid. Thermistor Bot. Thermistor Bot. Thermistor commentsT (IC) Dopth(cm) I (CC) Depth(cm I (C) Depth(cm)
left, upper side of top matat the center of top mat; D-1486'rIght side of top matllthified sediment; probe partially insertmottied seds
at 3BC locatIoncrusty, Ilthlfled old mats,10 cm Out1M from pool; 2/3 inserted
shaflow mat; 1/3 Inleft of matim up; very rocky; 1/3 In
base of mat/poolburied submersIble arm In mat materialmatalllferous surface
sad next to mat
just above seds
a little deeper
higher up the hUi
below mat; sed quIvers
next to southern small poois
shallow pool; only 1/3 In
next to mat, 2/3 innext to a boulderprobe not far in; #3 In watermat and sodhIt rock, 2/3 Innear peeper; brain mat areaInserted deepernear pool of peeper.A
S S S S S S
3.67 NA 3.71 NA 3.66 NA- - - - 6.00 607.56 30 7.76 50 8.10 70- - - - 9.12 70- - - - 6.70 73.66 - - - 4.38 ?- - - - 3.66 NA- - - - 4.18 203.66 In water - - 4.89 50- - 4.35 40- 3.67 NA- - - - 4.45 in pool- - 4.10 0 11.60 20- - - - 8.60 7- - 9.00 10 9.60 30- - 3.71 - 3.75 NA- - 4.46 40 4.54 60- - - - 6.85 80- - - .- 7.20 73.75 In water 3.79 20 5.68 40- - - - 3.72 MA3.78 20 3.96 40 4.08 60- - - - 3.74 NA4.16 20 - - 5.86 60- - - - 16.10 10- - - - 8.60 7- - - - 7.50 60- - - - 3.79 NA4.21 20 4.72 40 5.33 60- - - - 3.94 NA5.00 20 5.85 40 6.65 60- - - - 6.90 60+5.55 20 6.35 40 6.92 60- - - - 10.50 7- - - - 11.20 60- - - - 6.20 60- - - - 4.80 7- - - - 7.90 7- - - - 3.71 NA3.77 20 4.16 40 4.52 604.39 20 5.10 40 5.75 60- - - - 3.68 NA3.80 15 4.05 35 4.24 555.30 20 7.90 40 10.20 607.50 10 11.08 30 12.90 50- - - - 13.60 7- - - - 11.00 7- - - - 11.50 7- - - - 18.90 10- - 3.73 0 6.45 204.60 15 5.00 35 5.60 555.60 20 7.15 40 8.11 604.60 2 10.20 22 10.81 423.68 20 6.10 40 8.85 603.68 in water 5.80 16 9.77 356.04 7 - - 10.80 93.69 in water 6.37 20 9.66 404.59 20 5.51 40 5.86 604.84 30 5.75 50 6.00 704.30 20 5.00 40 5.21 60
Dive time x y Depth(ft) StationType
CD207 17:23 843 1528 1489 waterCD207 17:24 843 1528 1489 matCD207 17:26 843 1528 1486 mat00207 17:30 843 1528 1486 matCD207 17:42 843 1528 1485 sadCD207 18:04 813 1594 1498 sadCO211 13:46 893 1550 1511 waterCD211 13:50 893 1550 1511 sed00211 14:44 891 1540 1484 mat00211 16:34 634 1452 1547 sedCD211 16:34 634 1452 1547 water00211 16:36 634 1452 1547 pool00215 13:45 951 1150 1402 mat00215 13:46 951 1150 1397 matCD215 13:50 951 1150 1394 matCD216 13:38 609 1431 1547 waterCO216 13:38 609 1431 1547 matCO216 15:49 547 1136 1519 mat00216 15:55 547 1136 1517 matCO217 14:14 891 1268 1464 sadCO217 14:14 891 1268 1464 waterCO217 15:56 978 1664 1490 eed00218 15:37 1040 1253 1392 waterCO218 15:37 1040 1253 1392 sedCO218 17:04 1032 1302 1407 mat00218 17:04 1032 1302 1407 sadCO220 12:09 1030 1270 1370 mat00222 14:47 949 1438 1490 waterCD222 14:48 949 1438 1490 sad00222 15:04 945 1561 1477 water00222 15:06 945 1361 1477 sedCO222 15:06 945 1361 1477 sadCD222 15:13 924 1337 1476 sad00222 16:03 1022 1351 1408 sadCO222 16:05 1022 1351 1405 sad00222 16:16 1067 1383 1378 matCO222 17:10 952 1178 matCD222 17:17 964 1163 1425 matCO223 12:55 614 1422 1551 water00223 12:56 614 1422 1551 sadCD223 12:58 614 1422 1545 matCO223 15:09 335 1327 1503 water00223 15:46 539 1207 1558 sad00226 15:00 1062 1363 1397 sad00226 15:15 999 1327 1412 mat00226 15:24 999 1327 1412 mat00226 15:33 1006 1262 1396 sad00226 15:41 1005 1338 1395 mat00229 17:53 1055 1335 1410 matCO228 13:50 2914 6005 1850 poolCO228 14:13 2907 5984 pool00228 14:58 2884 6062 1820 matCD228 15:04 2884 6062 1820 sadCO228 15:52 2917 5954 1845 sad00228 17:02 no nay no nay 1809 sadCD228 17:06 no nay no nay 1807 matCO228 17:07 no nay no nay 1807 sad00230 14:54 612 1421 1547 mat00230 14:55 612 1421 1547 matCO230 15:57 618 1420 1546 pooi