CHALLENGES TO EFFECTIVE FISHING AND PREFERRED FISHING GEAR IN A HYDRODYNAMIC FRESHWATER SYSTEM
Upload
independentCategory
view
4download
0
Ecological Modelling 172 (2004) 283–306
Contribution of ecosystem analysis to investigating the effectsof changes in fishing strategies in the South Brazil
Bight coastal ecosystem�
M.A. Gasallaa,b,∗, C.L.D.B. Rossi-Wongtschowskib
a Instituto de Pesca, Av. Bartolomeu de Gusmão, 192. Ponta da Praia, Santos 11030-906, SP, Brazilb Instituto Oceanográfico, University of São Paulo, P.O. Box 66149, São Paulo 05389-900, SP, Brazil
Abstract
Ecosystem effects of recent changes in fishing strategies in the South Brazil Bight (SBB) area, including increasing squidcatches by shrimp bottom trawlers and fishing for young sardines as bait, for the skipjack tuna pole-and-line fishery wereinvestigated by modelling the SBB coastal ecosystem for the 1998–1999 fisheries period, using the mass-balance modellingsoftware, Ecopath with Ecosim. Based on fisheries information and on previous models, 25 species groups were defined. Themean trophic level of all fisheries was 2.99 with small trawlers and the live baitfish fleet occupying the lowest trophic levels.
The change in squid fishing rate and the most important squid predators fishing rate were simulated by increasing fishingmortality (F) from 0 to 1 per year, while maintainingF constant for other exploited groups. Also, the impact of fishing pressureby trawlers on squids and by the live baitfish fleet on young sardines were simulated. Different hypotheses of flow control weretested by setting the maximum instantaneous mortality rate that consumers could exert on food resources by (a) “top-down”control by predators (predator control); (b) all interactions of mixed control type; and (c) “bottom-up” control of predatorsby their prey (donor control). For squid, predicted biomass changes were more pronounced under top-down control that underbottom-up. Biomass of the weakfish, which are important squid predators, were the most affected under all hypotheses. A similarpattern of decrease in other squid predators was seen. The ecosystem consequence of overexploiting weakfish and large pelagicfish biomass was speculated regarding the increasing squid catches.
Simulations of increasing live-baitfish fleet did not show prominent impact in the inner shelf, where presentF values arelow. Given young sardines concentrate in shallow waters, where the conflicts converge, a complementary model of the adjacentcoastal system and artisanal fisheries could better address fleet’s impact. Nevertheless, it was noted a decrease of sharks and raysreflecting their vulnerability in the system.
A precautionary measure for fisheries management in the region would be to assume that top-down control is a dominantforce in energy flows, differing from the custom emphasis placed only in environmental forces and productivity. The ecosystemapproach will require the integration of information from a wide range of disciplines, levels of ecological organization andtemporal and spatial scales, as well as concrete management measures.© 2003 Elsevier B.V. All rights reserved.
Keywords:Ecosystem impact of fishing: Brazil; Ecosystem analysis; Ecopath; Fisheries management; Ecosystem approach
� Manuscript PFITEC-11 (EMECS 7) for Ecological Modelling, May 2003.∗ Corresponding author. Tel.:+55-11-3816-8031; fax:+55-13-3261-1900.E-mail addresses:[email protected], [email protected] (M.A. Gasalla), [email protected] (C.L.D.B. Rossi-Wongtschowski).
0304-3800/$ – see front matter © 2003 Elsevier B.V. All rights reserved.doi:10.1016/j.ecolmodel.2003.09.012
284 M.A. Gasalla, C.L.D.B. Rossi-Wongtschowski / Ecological Modelling 172 (2004) 283–306
1. Introduction
Ecosystem analysis has proved to be a usefultool to investigate the direct and indirect effects offishing (Christensen and Walters, 2002, this vol.;Shannon et al., 2000; Vasconcellos and Gasalla,2001). Nevertheless, ecosystems are extremely com-plex, as well as the relationships between fisheriesand biological productivity changes, which makesthem impossible to treat comprehensively (Jorgensen,1992). Ecosystem analysis gives a description and as-sessment of the whole system in terms of interactionbetween species, productivity and major functionalprocesses (Field et al., 1989; Heymans and Baird,2000). The first step is to construct a comprehensivefood web of the system based on quantitative data onbiomass and flows between compartments. Then, adynamic approach to modelling energy flow can beused to address ecosystem responses to changes infishing strategies (Walters et al., 1997).
Previous modelling has already been carried out forspecific areas and time periods for South Brazil, suchas both the Ubatuba region (Rocha et al., 1998; Rocha,1998) and the Southeastern shelf (Vasconcellos, 2000)in the 1980s, and the extreme South area (Vasconcellosand Gasalla, 2001). However, this modelling has sug-gested the need for a new model that focuses on themost intense fishery area of the South Brazil Bight(SBB)—the inner shelf system as a whole—and that(a) uses more complete, local, up-to-date data; (b) em-phasizes the exploited part of the food-web; (c) re-fines the interactions between industrial fisheries, fish-ery stocks, bycatches and the biological componentsof the system, and (d) elaborates further the effect ofdifferent exploitation patterns in the productivity, in-tegrity and catches of the SBB.
Several changes in fishing strategies have been re-cently noted as a result of the overexploitation of targetspecies and oceanographic anomalies. Purse-seinersfishing for demersal fish, shifts in catch composition,and other evidences stressed the present multispeciesnature of major regional coastal fisheries (Gasallaet al., 2003; Tomás et al., 2003).
The increasing squids catches by bottom trawlersis just an example. It was reported both an increasein the volume of squids caught as bycatch in shrimpfisheries off Santos (Tomás et al., 2000) and a minorpair-trawlers fleet recently targeting squids in the sum-
mer season off Santa Catarina (Pérez, 2002). It raisesthe question of whether this is due to oceanographicanomalies or whether it can be caused by the overex-ploitation of higher trophic level species.
Also, skipjack tuna pole-and-line boats enter thecoast for young sardines as bait, conflicting with otherusers of that environment, i.e. artisanal fishers and sar-dine purse-seiners. The effects of these new practiceson the whole system and on the fisheries are importantissues that need to be addressed.
In this paper, we present a new mass-balancemodel of the SBB coastal ecosystem for the period1998–1999, and the use of Ecopath with Ecosim(Christensen and Pauly, 1992) to investigate theecosystem effect of altered fishing rates on squidmortality by trawlers, and on sardine mortality by thelive-baitfish fleet.
2. Study site
The crescent-shape SBB lies between two promi-nent capes, Cabo Frio (23◦S) and Cabo de SantaMarta (28◦S) on the Southeastern coast of Brazil(Fig. 1), with a coastal length of about 1100 km cut bycliffs, small bays and many islands, and with isobathsapproximately parallel to the coastline (Castro andMiranda, 1998). The northern and southern boundariesrespectively limit the biogeographic distribution ofmany tropical coastaltaxa, and the mangrove systemsalong the Brazilian coastline (Lamardo et al., 2000).
Circulation, waters interaction and meteorologi-cal regime determine major enrichment processesand productive interfaces in the South Brazil Bight,such as seasonal, locally wind-driven upwellingregimes (Valentin et al., 1987) or sparse cool intru-sions that create subsurface chlorophyll maximumlayers (Brandini, 1990a; Matsuura, 1989; Gaeta andBrandini, 2002). Fertilization, phytoplankton biomassaccumulation and enhanced new production are de-pendent on the duration of physical events, such ascyclonic vortexes, summer upwellings (Pires-Vanin,1993; Castro and Miranda, 1998), winter wind-induced sub Antarctic lateral intrusions (Campos et al.,1996), and inner waves (Gaeta and Brandini, 2002).
In the inner shelf, major oceanographic interac-tions occur among warm, saline, oligotrophic surfacewater (so-called Tropical Water); a low salinity, more
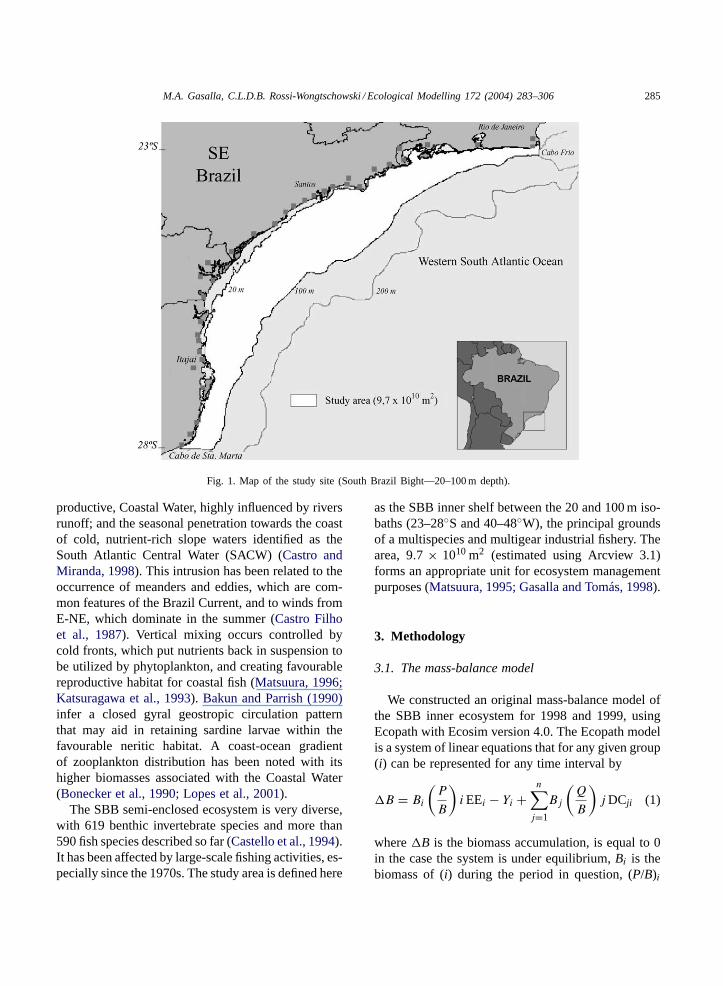
M.A. Gasalla, C.L.D.B. Rossi-Wongtschowski / Ecological Modelling 172 (2004) 283–306 285
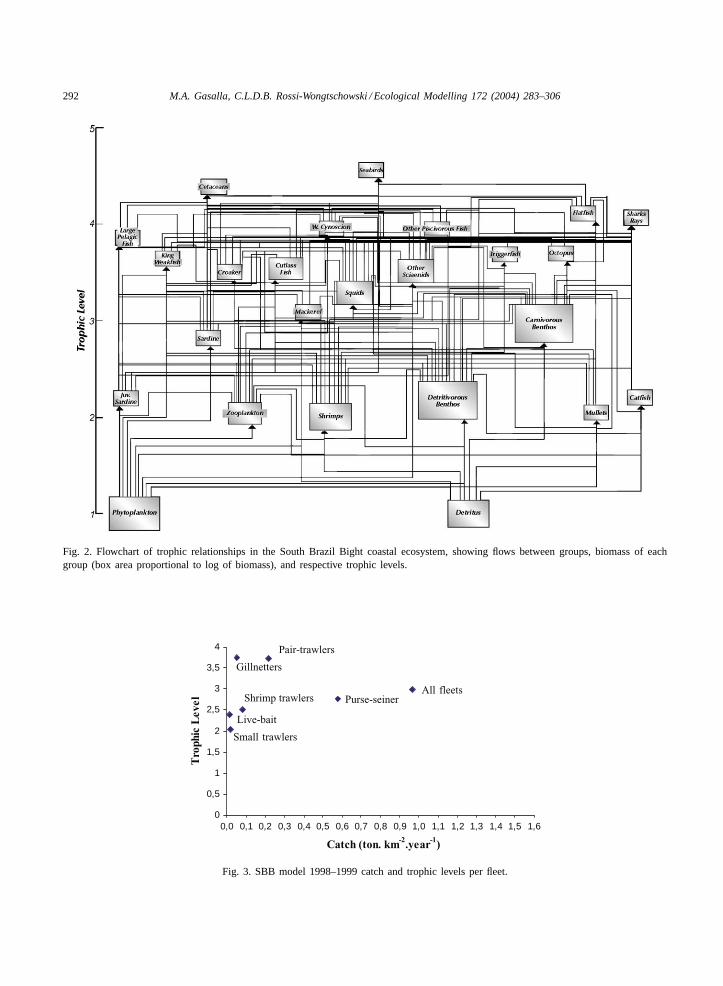
Fig. 1. Map of the study site (South Brazil Bight—20–100 m depth).
productive, Coastal Water, highly influenced by riversrunoff; and the seasonal penetration towards the coastof cold, nutrient-rich slope waters identified as theSouth Atlantic Central Water (SACW) (Castro andMiranda, 1998). This intrusion has been related to theoccurrence of meanders and eddies, which are com-mon features of the Brazil Current, and to winds fromE-NE, which dominate in the summer (Castro Filhoet al., 1987). Vertical mixing occurs controlled bycold fronts, which put nutrients back in suspension tobe utilized by phytoplankton, and creating favourablereproductive habitat for coastal fish (Matsuura, 1996;Katsuragawa et al., 1993). Bakun and Parrish (1990)infer a closed gyral geostropic circulation patternthat may aid in retaining sardine larvae within thefavourable neritic habitat. A coast-ocean gradientof zooplankton distribution has been noted with itshigher biomasses associated with the Coastal Water(Bonecker et al., 1990; Lopes et al., 2001).
The SBB semi-enclosed ecosystem is very diverse,with 619 benthic invertebrate species and more than590 fish species described so far (Castello et al., 1994).It has been affected by large-scale fishing activities, es-pecially since the 1970s. The study area is defined here
as the SBB inner shelf between the 20 and 100 m iso-baths (23–28◦S and 40–48◦W), the principal groundsof a multispecies and multigear industrial fishery. Thearea, 9.7 × 10¹⁰ m2 (estimated using Arcview 3.1)forms an appropriate unit for ecosystem managementpurposes (Matsuura, 1995; Gasalla and Tomás, 1998).
3. Methodology
3.1. The mass-balance model
We constructed an original mass-balance model ofthe SBB inner ecosystem for 1998 and 1999, usingEcopath with Ecosim version 4.0. The Ecopath modelis a system of linear equations that for any given group(i) can be represented for any time interval by
�B = Bi
(P
B
)i EEi − Yi +
n∑j=1
Bj
(Q
B
)j DCji (1)
where�B is the biomass accumulation, is equal to 0in the case the system is under equilibrium,Bi is thebiomass of (i) during the period in question, (P/B)i
286 M.A. Gasalla, C.L.D.B. Rossi-Wongtschowski / Ecological Modelling 172 (2004) 283–306
is the production/biomass ratio, EEi is the ecotrophicefficiency, i.e. the fraction of the production of (i) thatis consumed within the system or harvested,Yi is theyield [with Yi = FiBi, andF as the fishing mortality],Bj is the biomass of consumers or predators, (Q/B)i isthe food consumption per unit of biomass of (j), andDCji is the fraction of (i) in the diet of (j).
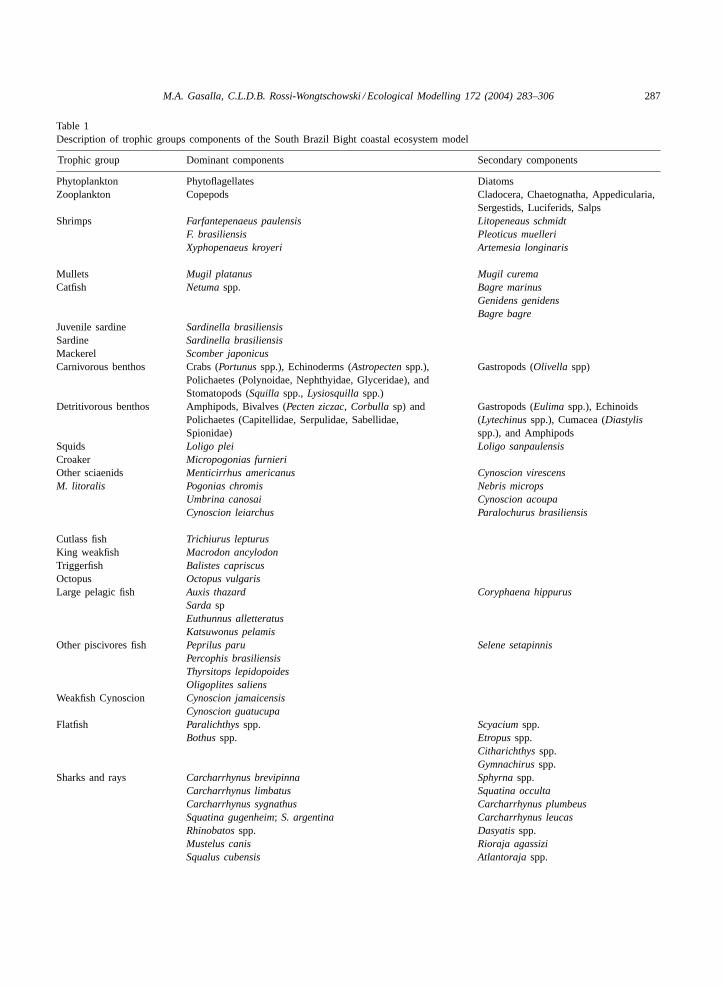
The model was constructed to reflect annual con-ditions in the SBB firstly by assessing the mostimportant fisheries resources in 1998–1999 landingscalculated for the whole area. Data were obtainedfrom São Paulo, Rio de Janeiro, Paraná and SantaCatarina State’s official catch statistics reported bythe Instituto de Pesca and IBAMA. Based mainlyon fisheries information and on previous models, wedefined 25 species groups as described inTable 1.
Some species groups reported in other modelsof Southeastern Brazil (Rocha, 1998; Vasconcellos,2000) were not included here due to: (1) the specificstudy area is different and we focused on the wholeinner shelf, (2) species could now be rare in presentstudy area and did not occur in the 1998–1999 catches,(e.g. jack mackerel), or (3) species could be dominantonly in the outer shelf or shelf break (e.g. anchovy,Myctophidae). By the other hand, we add severalimportant biological groups for the area (seabirds,mammals, octopus, flatfish, catfish, large pelagics)and put emphasis in catches dominant groups duringthe study period.
Annual primary productivity was obtained fromBrandini (1990b), Gianesella-Galvão and Saldanha-Correia (1995), Gaeta (1999), and Gaeta andBrandini (2002). An average phytoplankton produc-tion of about 0.5 g C m−2 per day was suggested tothe inner shelf (Gaeta and Brandini, 2002), rangingfrom 0.99 g C m−2 per day (generally in summer)to 0.11–0.17 g C m−2 per day. The conversion fac-tor of 0.06 g C = 1 g wet weight (Walsh, 1981) wasadopted, considering an average carbon/biomass ra-tio of 30% dry weight, according to phytoplanktonspecies composition (Parsons and Takahashi, 1973;Brandini et al., 1997).
Phytoplankton biomass was adjusted from chloro-phyll a abundance values estimated inGaeta (1999)for the main waters within the inner shelf area, byusing a 1:25 ratio to convert to unit carbon. Detritusbiomass was estimated using Pauly’s empirical rela-tionship (Pauly et al., 1993a).
Zooplankton biomass was calculated followingwet weight obtained byMuxagata (1999)for win-ter conditions, and volumetric values fromMatsuuraet al. (1980) (Matsuura Prof. Yasunobu, InstitutoOceanográfico, University of São Paulo, personalcommunication), for autumn, spring and summer con-ditions, andResgalla et al. (2001)estimates. Copepodsdominate zooplankton samples in this area (Vega-Perez, 1993; Muxagata, 1999), and conversion ofbiovolume data to wet weight followedPearre (1980).
Sardine biomass andP/B for sardines were obtainedfrom VPA analysis byCergole et al. (2001). The sar-dine group was split between young and adult pools,using the spawning stock biomass (SSB)/total biomassratio of 0.75. Parameters used for the delay differencemodel in Ecosim were the von Bertalanffy growth pa-rameter(k) = 0.5; andwk = 44, tk = 1.5, wherewk is the weight at agetk of sardine graduates to theadult pool (Cergole, 1995; Vasconcellos, 2000). Theage-structured population dynamics model embeddedin the trophic model allows capturing ecosystem link-ages such as changes in predation and consumptionrates by juvenile and adult pools (Vasconcellos, 2000).
Benthic invertebrates were divided into “detritivo-rous benthos,” “carnivorous benthos” and “shrimps.”Estimates on the former groups were based on pre-vious modelling (Rocha, 1998; Rocha et al., 1998;Vasconcellos, 2000) and on recent field data obtainedfrom surveys by using box-corer samplers in the EEZ(Amaral, 1999).
The biomass of cetaceans was obtained from av-erage population sizes (Alexandre Zerbini, School ofAquatic and Fisheries Science, University of Washing-ton, personal communication) and average weight foreach species, afterCruz (1982), Lichter and Hooper(1983)and Siciliano (Salvatore Siciliano, Museu Na-cional, UFRJ, Federal University of Rio de Janeiro,personal communication). TheP/B value was calcu-lated as average mortality estimates for each speciesfrom S = (w − 1)/w = exp(−M), whereS is sur-vival, M is mortality, andw is longevity. Q/B wasobtained from the daily consumption equation (Triteset al., 1997), based onInnes et al. (1987)daily rationestimateR = 0.1 × W0.8, whereR is the daily rationandW is the mean body weight (kg).
For seabirds, species composition was based onSick (1977)andVooren and Brusque (1999). Biomasscalculation followed three steps: (1) population size,
M.A. Gasalla, C.L.D.B. Rossi-Wongtschowski / Ecological Modelling 172 (2004) 283–306 287
Table 1Description of trophic groups components of the South Brazil Bight coastal ecosystem model
Trophic group Dominant components Secondary components
Phytoplankton Phytoflagellates DiatomsZooplankton Copepods Cladocera, Chaetognatha, Appedicularia,
Sergestids, Luciferids, SalpsShrimps Farfantepenaeus paulensis Litopeneaus schmidt
F. brasiliensis Pleoticus muelleriXyphopenaeus kroyeri Artemesia longinaris
Mullets Mugil platanus Mugil curemaCatfish Netumaspp. Bagre marinus
Genidens genidensBagre bagre
Juvenile sardine Sardinella brasiliensisSardine Sardinella brasiliensisMackerel Scomber japonicusCarnivorous benthos Crabs (Portunusspp.), Echinoderms (Astropectenspp.),
Polichaetes (Polynoidae, Nephthyidae, Glyceridae), andStomatopods (Squilla spp.,Lysiosquillaspp.)
Gastropods (Olivella spp)
Detritivorous benthos Amphipods, Bivalves (Pecten ziczac, Corbulla sp) andPolichaetes (Capitellidae, Serpulidae, Sabellidae,Spionidae)
Gastropods (Eulima spp.), Echinoids(Lytechinusspp.), Cumacea (Diastylisspp.), and Amphipods
Squids Loligo plei Loligo sanpaulensisCroaker Micropogonias furnieriOther sciaenids Menticirrhus americanus Cynoscion virescensM. litoralis Pogonias chromis Nebris microps
Umbrina canosai Cynoscion acoupaCynoscion leiarchus Paralochurus brasiliensis
Cutlass fish Trichiurus lepturusKing weakfish Macrodon ancylodonTriggerfish Balistes capriscusOctopus Octopus vulgarisLarge pelagic fish Auxis thazard Coryphaena hippurus
SardaspEuthunnus alletteratusKatsuwonus pelamis
Other piscivores fish Peprilus paru Selene setapinnisPercophis brasiliensisThyrsitops lepidopoidesOligoplites saliens
Weakfish Cynoscion Cynoscion jamaicensisCynoscion guatucupa
Flatfish Paralichthysspp. Scyaciumspp.Bothusspp. Etropusspp.
Citharichthysspp.Gymnachirusspp.
Sharks and rays Carcharrhynus brevipinna Sphyrnaspp.Carcharrhynus limbatus Squatina occultaCarcharrhynus sygnathus Carcharrhynus plumbeusSquatina gugenheim; S. argentina Carcharrhynus leucasRhinobatosspp. Dasyatisspp.Mustelus canis Rioraja agassiziSqualus cubensis Atlantorajaspp.
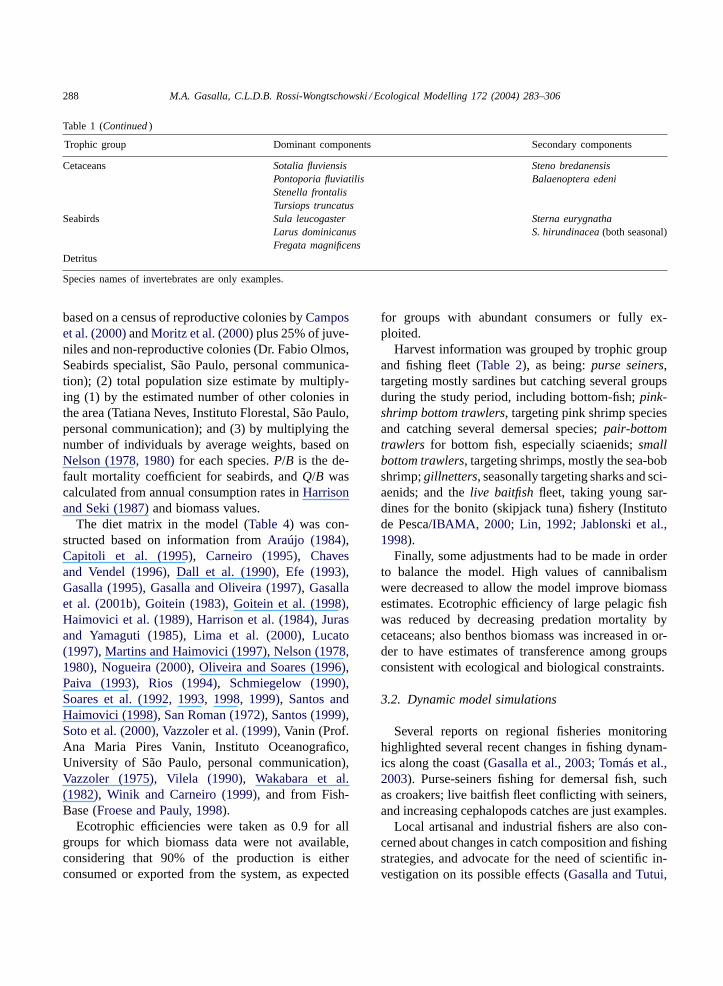
288 M.A. Gasalla, C.L.D.B. Rossi-Wongtschowski / Ecological Modelling 172 (2004) 283–306
Table 1 (Continued)
Trophic group Dominant components Secondary components
Cetaceans Sotalia fluviensis Steno bredanensisPontoporia fluviatilis Balaenoptera edeniStenella frontalisTursiops truncatus
Seabirds Sula leucogaster Sterna eurygnathaLarus dominicanus S. hirundinacea(both seasonal)Fregata magnificens
Detritus
Species names of invertebrates are only examples.
based on a census of reproductive colonies byCamposet al. (2000)andMoritz et al. (2000)plus 25% of juve-niles and non-reproductive colonies (Dr. Fabio Olmos,Seabirds specialist, São Paulo, personal communica-tion); (2) total population size estimate by multiply-ing (1) by the estimated number of other colonies inthe area (Tatiana Neves, Instituto Florestal, São Paulo,personal communication); and (3) by multiplying thenumber of individuals by average weights, based onNelson (1978, 1980)for each species.P/B is the de-fault mortality coefficient for seabirds, andQ/B wascalculated from annual consumption rates inHarrisonand Seki (1987)and biomass values.
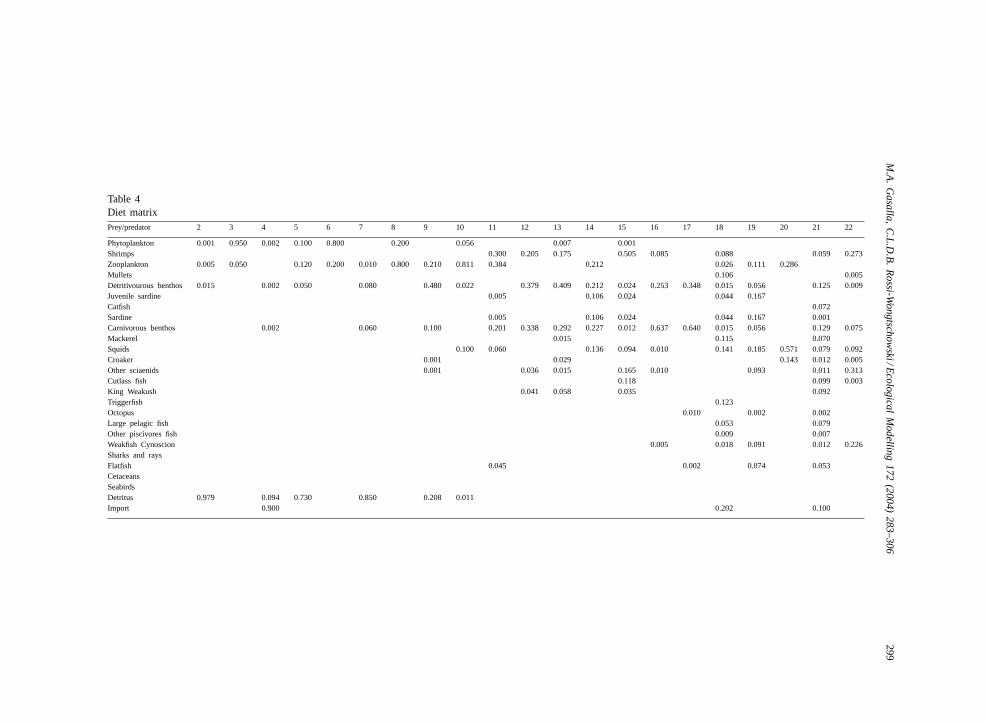
The diet matrix in the model (Table 4) was con-structed based on information fromAraújo (1984),Capitoli et al. (1995), Carneiro (1995), Chavesand Vendel (1996), Dall et al. (1990), Efe (1993),Gasalla (1995), Gasalla and Oliveira (1997), Gasallaet al. (2001b), Goitein (1983), Goitein et al. (1998),Haimovici et al. (1989), Harrison et al. (1984), Jurasand Yamaguti (1985), Lima et al. (2000), Lucato(1997), Martins and Haimovici (1997), Nelson (1978,1980), Nogueira (2000), Oliveira and Soares (1996),Paiva (1993), Rios (1994), Schmiegelow (1990),Soares et al. (1992, 1993, 1998, 1999), Santos andHaimovici (1998), San Roman (1972), Santos (1999),Soto et al. (2000), Vazzoler et al. (1999), Vanin (Prof.Ana Maria Pires Vanin, Instituto Oceanografico,University of São Paulo, personal communication),Vazzoler (1975), Vilela (1990), Wakabara et al.(1982), Winik and Carneiro (1999), and from Fish-Base (Froese and Pauly, 1998).
Ecotrophic efficiencies were taken as 0.9 for allgroups for which biomass data were not available,considering that 90% of the production is eitherconsumed or exported from the system, as expected
for groups with abundant consumers or fully ex-ploited.
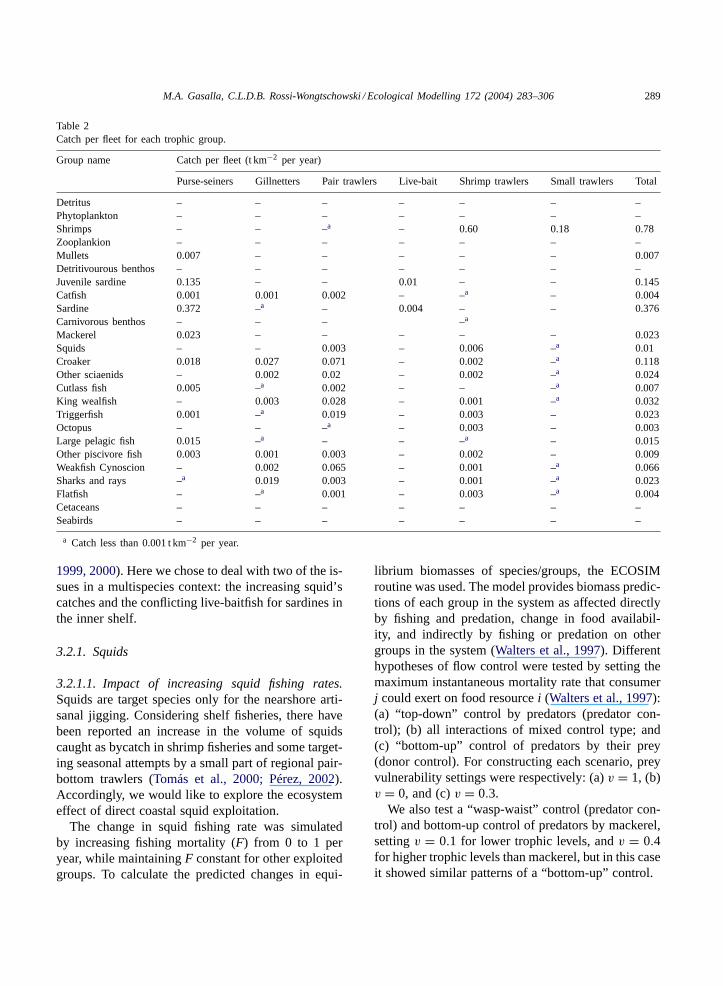
Harvest information was grouped by trophic groupand fishing fleet (Table 2), as being:purse seiners,targeting mostly sardines but catching several groupsduring the study period, including bottom-fish;pink-shrimp bottom trawlers, targeting pink shrimp speciesand catching several demersal species;pair-bottomtrawlers for bottom fish, especially sciaenids;smallbottom trawlers, targeting shrimps, mostly the sea-bobshrimp;gillnetters, seasonally targeting sharks and sci-aenids; and thelive baitfishfleet, taking young sar-dines for the bonito (skipjack tuna) fishery (Institutode Pesca/IBAMA, 2000; Lin, 1992; Jablonski et al.,1998).
Finally, some adjustments had to be made in orderto balance the model. High values of cannibalismwere decreased to allow the model improve biomassestimates. Ecotrophic efficiency of large pelagic fishwas reduced by decreasing predation mortality bycetaceans; also benthos biomass was increased in or-der to have estimates of transference among groupsconsistent with ecological and biological constraints.
3.2. Dynamic model simulations
Several reports on regional fisheries monitoringhighlighted several recent changes in fishing dynam-ics along the coast (Gasalla et al., 2003; Tomás et al.,2003). Purse-seiners fishing for demersal fish, suchas croakers; live baitfish fleet conflicting with seiners,and increasing cephalopods catches are just examples.
Local artisanal and industrial fishers are also con-cerned about changes in catch composition and fishingstrategies, and advocate for the need of scientific in-vestigation on its possible effects (Gasalla and Tutui,
M.A. Gasalla, C.L.D.B. Rossi-Wongtschowski / Ecological Modelling 172 (2004) 283–306 289
Table 2Catch per fleet for each trophic group.
Group name Catch per fleet (t km−2 per year)
Purse-seiners Gillnetters Pair trawlers Live-bait Shrimp trawlers Small trawlers Total
Detritus – – – – – – –Phytoplankton – – – – – – –Shrimps – – –a – 0.60 0.18 0.78Zooplankion – – – – – – –Mullets 0.007 – – – – – 0.007Detritivourous benthos – – – – – – –Juvenile sardine 0.135 – – 0.01 – – 0.145Catfish 0.001 0.001 0.002 – –a – 0.004Sardine 0.372 –a – 0.004 – – 0.376Carnivorous benthos – – – –a
Mackerel 0.023 – – – – – 0.023Squids – – 0.003 – 0.006 –a 0.01Croaker 0.018 0.027 0.071 – 0.002 –a 0.118Other sciaenids – 0.002 0.02 – 0.002 –a 0.024Cutlass fish 0.005 –a 0.002 – – –a 0.007King wealfish – 0.003 0.028 – 0.001 –a 0.032Triggerfish 0.001 –a 0.019 – 0.003 – 0.023Octopus – – –a – 0.003 – 0.003Large pelagic fish 0.015 –a – – –a – 0.015Other piscivore fish 0.003 0.001 0.003 – 0.002 – 0.009Weakfish Cynoscion – 0.002 0.065 – 0.001 –a 0.066Sharks and rays –a 0.019 0.003 – 0.001 –a 0.023Flatfish – –a 0.001 – 0.003 –a 0.004Cetaceans – – – – – – –Seabirds – – – – – – –
a Catch less than 0.001 t km−2 per year.
1999, 2000). Here we chose to deal with two of the is-sues in a multispecies context: the increasing squid’scatches and the conflicting live-baitfish for sardines inthe inner shelf.
3.2.1. Squids
3.2.1.1. Impact of increasing squid fishing rates.Squids are target species only for the nearshore arti-sanal jigging. Considering shelf fisheries, there havebeen reported an increase in the volume of squidscaught as bycatch in shrimp fisheries and some target-ing seasonal attempts by a small part of regional pair-bottom trawlers (Tomás et al., 2000; Pérez, 2002).Accordingly, we would like to explore the ecosystemeffect of direct coastal squid exploitation.
The change in squid fishing rate was simulatedby increasing fishing mortality (F) from 0 to 1 peryear, while maintainingF constant for other exploitedgroups. To calculate the predicted changes in equi-
librium biomasses of species/groups, the ECOSIMroutine was used. The model provides biomass predic-tions of each group in the system as affected directlyby fishing and predation, change in food availabil-ity, and indirectly by fishing or predation on othergroups in the system (Walters et al., 1997). Differenthypotheses of flow control were tested by setting themaximum instantaneous mortality rate that consumerj could exert on food resourcei (Walters et al., 1997):(a) “top-down” control by predators (predator con-trol); (b) all interactions of mixed control type; and(c) “bottom-up” control of predators by their prey(donor control). For constructing each scenario, preyvulnerability settings were respectively: (a)v = 1, (b)v = 0, and (c)v = 0.3.
We also test a “wasp-waist” control (predator con-trol) and bottom-up control of predators by mackerel,settingv = 0.1 for lower trophic levels, andv = 0.4for higher trophic levels than mackerel, but in this caseit showed similar patterns of a “bottom-up” control.
290 M.A. Gasalla, C.L.D.B. Rossi-Wongtschowski / Ecological Modelling 172 (2004) 283–306
3.2.1.2. Impact of trawlers fishing rate in squidbiomass. We constructed five fishing scenarios topredict relative change in squid biomass after a 10years period. Simulations of different effort increaseof shrimp trawlers and bottom-trawlers effort weretested also under “top-down” and “bottom-up” con-trols, following the settings above.
3.2.1.3. Decreasing squid predator’s biomass.Inorder to evaluate the impact of decreasing the biomassof squids predators, we test several scenarios by in-creasing predators fishing rates, under a mixed trophiccontrol (v = 0.3).
3.2.2. Live-baitfish fleet impactHere we considered different scenarios of flow con-
trol to explore the impact of fishing pressure by thelive baitfish fleet on young sardines by simulatinga situation of permanent four-fold increase of fish-ing rate from year 2 on in a 10-year period. Testedhypothesis here were: (a) “top-down” scenario, (b)“bottom-up”, and (c) “mixed control”, as describedabove.
Prey vulnerability settings for each scenario wererespectively: (a)v = 1, (b) v = 0, and (c)v = 0.3.
4. Results
4.1. Mass-balance model
The multispecies, multigear complexity of the SBBcoastal industrial fishery can be appreciated throughTables 1 and 2, where trophic groups and the main bi-ological components as well as their catches per fish-ing fleets are listed.
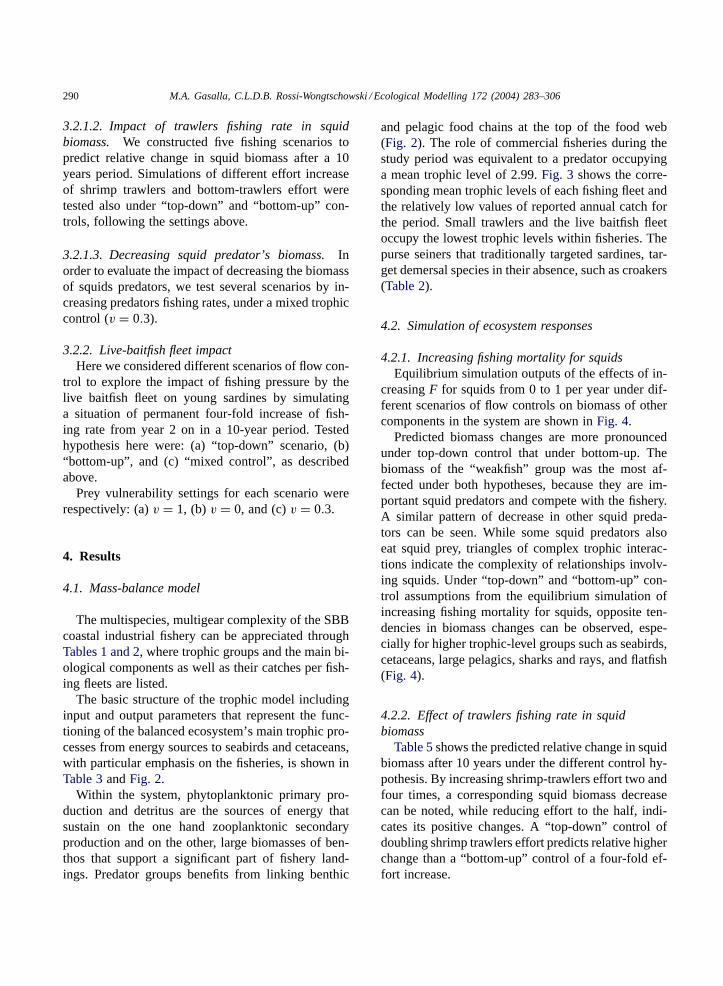
The basic structure of the trophic model includinginput and output parameters that represent the func-tioning of the balanced ecosystem’s main trophic pro-cesses from energy sources to seabirds and cetaceans,with particular emphasis on the fisheries, is shown inTable 3andFig. 2.
Within the system, phytoplanktonic primary pro-duction and detritus are the sources of energy thatsustain on the one hand zooplanktonic secondaryproduction and on the other, large biomasses of ben-thos that support a significant part of fishery land-ings. Predator groups benefits from linking benthic
and pelagic food chains at the top of the food web(Fig. 2). The role of commercial fisheries during thestudy period was equivalent to a predator occupyinga mean trophic level of 2.99.Fig. 3 shows the corre-sponding mean trophic levels of each fishing fleet andthe relatively low values of reported annual catch forthe period. Small trawlers and the live baitfish fleetoccupy the lowest trophic levels within fisheries. Thepurse seiners that traditionally targeted sardines, tar-get demersal species in their absence, such as croakers(Table 2).
4.2. Simulation of ecosystem responses
4.2.1. Increasing fishing mortality for squidsEquilibrium simulation outputs of the effects of in-
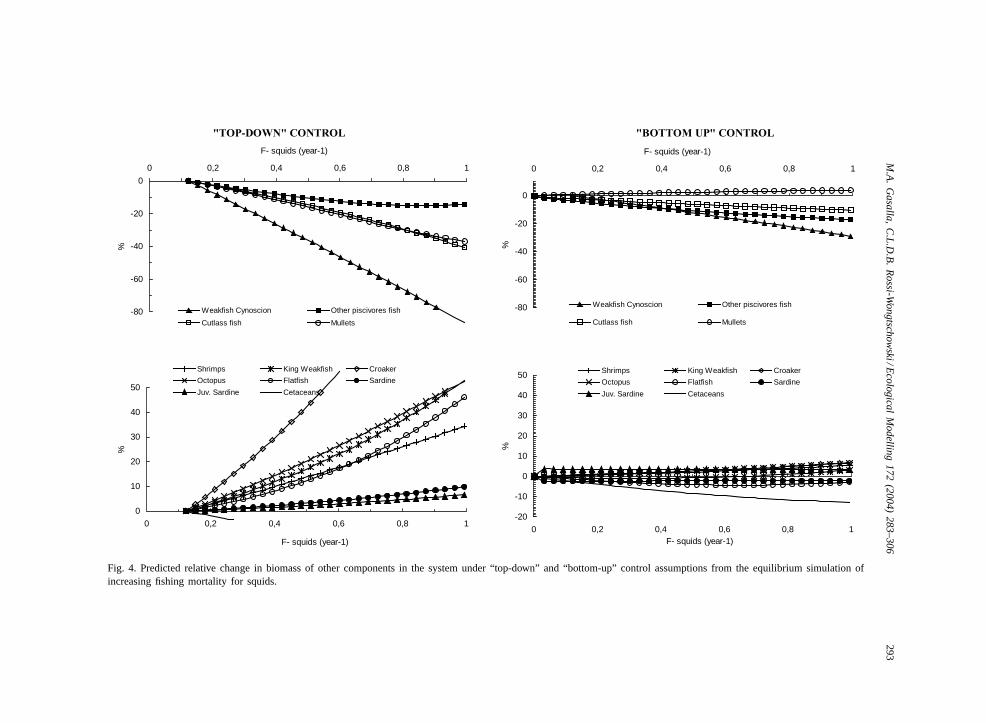
creasingF for squids from 0 to 1 per year under dif-ferent scenarios of flow controls on biomass of othercomponents in the system are shown inFig. 4.
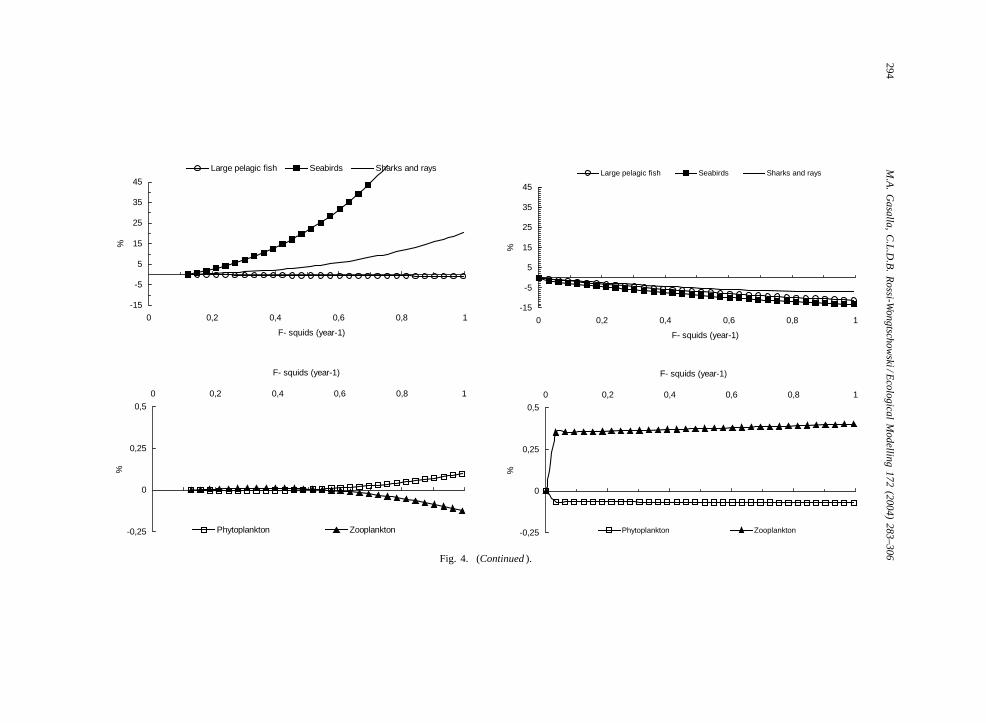
Predicted biomass changes are more pronouncedunder top-down control that under bottom-up. Thebiomass of the “weakfish” group was the most af-fected under both hypotheses, because they are im-portant squid predators and compete with the fishery.A similar pattern of decrease in other squid preda-tors can be seen. While some squid predators alsoeat squid prey, triangles of complex trophic interac-tions indicate the complexity of relationships involv-ing squids. Under “top-down” and “bottom-up” con-trol assumptions from the equilibrium simulation ofincreasing fishing mortality for squids, opposite ten-dencies in biomass changes can be observed, espe-cially for higher trophic-level groups such as seabirds,cetaceans, large pelagics, sharks and rays, and flatfish(Fig. 4).
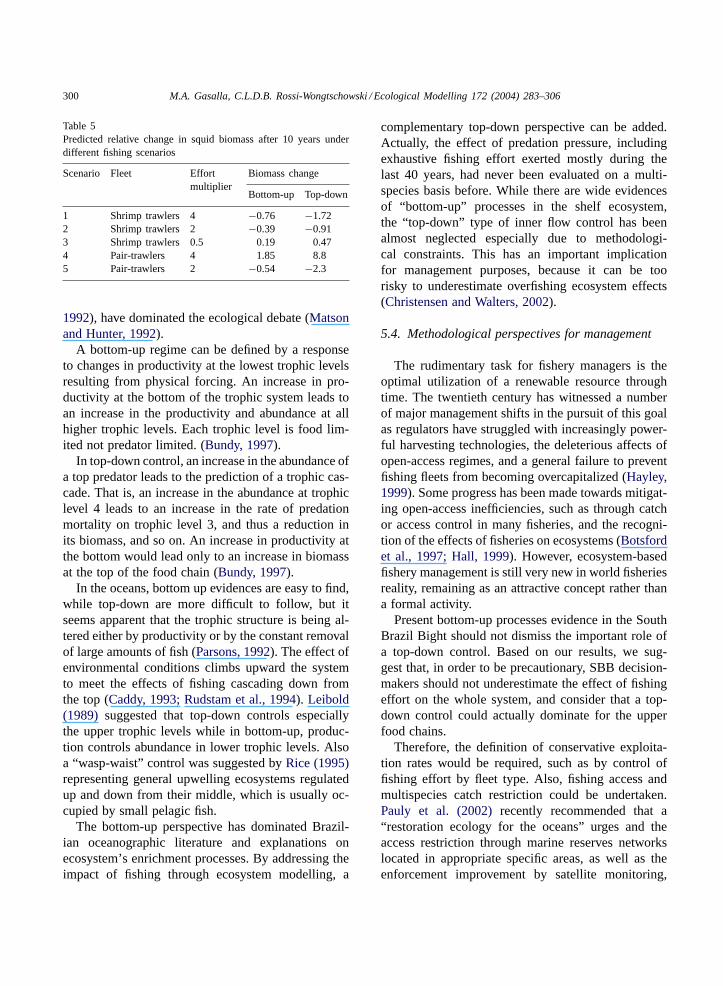
4.2.2. Effect of trawlers fishing rate in squidbiomass
Table 5shows the predicted relative change in squidbiomass after 10 years under the different control hy-pothesis. By increasing shrimp-trawlers effort two andfour times, a corresponding squid biomass decreasecan be noted, while reducing effort to the half, indi-cates its positive changes. A “top-down” control ofdoubling shrimp trawlers effort predicts relative higherchange than a “bottom-up” control of a four-fold ef-fort increase.
M.A. Gasalla, C.L.D.B. Rossi-Wongtschowski / Ecological Modelling 172 (2004) 283–306 291
Table 3Parameters of the trophic model of the South Brazil Bight inner ecosystem
Groupname
Trophiclevel
Omnivoryindex
Biomass(t km−2)
Prod./biom.(per year)
Cons./biom.(per year)
Ecotrophicefficiency
Detritus 1.0 0.16 10.000∗ – – 0.629Phytoplankton 1.0 0.00 18.000∗ 166.00∗ – 0.954Shrimps 2.0 0.03 3.387 6.50r 18.00d 0.900Zooplankton 2.1 0.05 10.500∗ 90.000a 270.00a 0.402Mullets 2.1 0.10 0.661 1.00e 11.03e 0.900Detritivourous benthos 2.2 0.17 47.000∗ 3.00∗ 27.30∗ 0.974Juvenile sardine 2.2 0.18 1.050∗ 7.00d 23.33d 0.228Catfish 2.2 0.31 0.055 0.45f 7.20f 0.900Sardine 2.8 0.18 3.976∗ 3.00∗ 11.20d 0.161Carnivorous benthos 3.0 0.33 34.000∗ 0.96∗ 3.28∗ 0.984Mackerel 3.1 0.26 4.082 0.34h 2.71h 0.900Squids 3.4 0.36 5.283 1.95i 3.90h 0.900Croaker 3.5 0.26 1.813 1.16j 3.38k 0.900Other sciaenids 3.5 0.30 5.762 1.04m,n 5.30m,n 0.900Cutlass fish 3.6 0.25 4.638 0.41o 2.05o,p 0.850King Weakfish 3.7 0.54 1.260 2.10j 6.16q 0.900Triggerfish 3.7 0.18 0.699 0.90d 6.13d 0.900Octopus 3.7 0.16 0.030s 4.50s 10.70l 0.691Large pelagic fish 3.9 0.69 0.710t 1.50q,t 6.20q,t 0.811Other piscivore fish 4.0 0.51 0.050 1.65q,u 5.00v 0.900Weakflsh Cynoscion 4.0 0.39 0.858 2.34n 5.40x 0.900Sharks and rays 4.1 0.51 0.064 0.40z,m,d 400h 0.900Flatfish 4.2 0.60 1.638 0.83y 4.10m,n 0.900Cetaceans 4.4 0.62 0.160∗ 0.05∗ 35.50∗ 0.000Seabirds 4.6 0.21 0.001∗ 0.10∗ 94.33∗ 0.000
Underlined values, trophic levels and omnivory index were estimated by the model. a and b:LeBorgne (1982); c: D’Incao (1991); d:Vasconcellos (2000); e: Vasconcellos (Marcelo Vasconcellos, University of Rio Grande, personal communication); f:Mendoza (1993); g:Cergole et al. (2000); h:Vasconcellos and Gasalla (2001); i: Perez (2002), Perez (Dr. Angel Perez, University of Vale do Itajai, SantaCatarina, personal communication); j: Castro (2000); k:Vazzoler (1991); l: based onBuchan and Smale (1981); m: Rocha (1998); n:Godinho-Peria (1995); o: Martins and Haimovici (1997); Peterson and Wroblewski (1984); p: Palomares and Pauly (1989); q: Froese andPauly (1998); r: Leite (2001); s: Tomas (2003); t: Chatwin (1997), Jablonski and Matsuura (1985); u: Pauly (1980); Pauly et al. (1993b);v: Aliño et al. (1993); x: Vieira (1990); y: Araujo and Haimovici (2000), z: Waring, 1984; ∗: seeSection 3.
However, a four-fold increase in pair-bottomtrawlers resulted in a considerable increase in squidbiomass, associated with indirect relationships andthe important effect of decreasing squid predatorsbiomass.
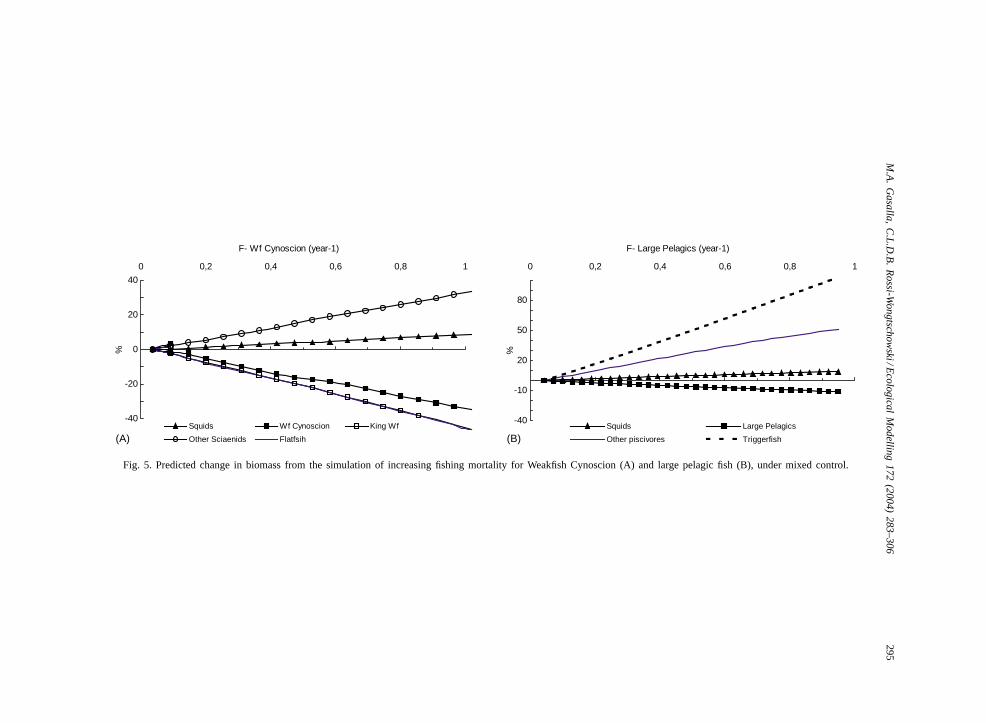
4.2.3. Decreasing squid predators’ biomassEcosim predicted percentual changes in biomass af-
ter increasingF for weakfish and large pelagic fishfrom 0 to 1 per year are shown inFig. 5. As expected,after an increase of weakfish and large pelagic fishfishing rate, an increase in squids biomass and otherlower trophic levels was predicted, as well as the de-crease of predator groups, such as flatfish.
4.2.4. Increasing fishing rate for the live baitfish fleetTen-year simulation outputs of the effects of in-
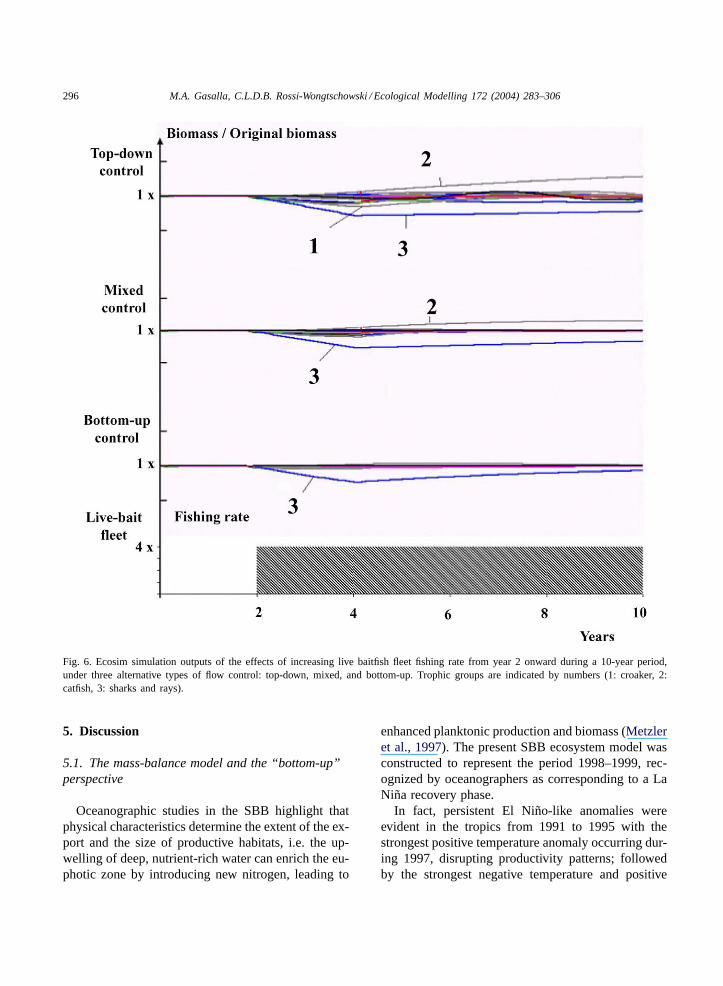
creasing the live baitfish fleet’s fishing rate perma-nently from year 2 onward under three alternativetypes of flow control (top-down, mixed, and bottom-up control) are shown inFig. 6. As presentF valuesare low, the simulations do not show prominent im-pact on the shelf trophic groups.
The simulations all show a similar pattern of de-crease of chondrichthyans biomass from year 2 to4, when biomass recovery begins, being faster underbottom-up control. Under top-down control, perturba-tions propagate and show more pronounced responses,with also a longer recovery time for sharks and rays.
292 M.A. Gasalla, C.L.D.B. Rossi-Wongtschowski / Ecological Modelling 172 (2004) 283–306
Fig. 2. Flowchart of trophic relationships in the South Brazil Bight coastal ecosystem, showing flows between groups, biomass of eachgroup (box area proportional to log of biomass), and respective trophic levels.
Pair-trawlers
Purse-seiner
Gillnetters
Small trawlers
Live-bait
Shrimp trawlersAll fleets
0
0,5
1
1,5
2
2,5
3
3,5
4
0,0 0,1 0,2 0,3 0,4 0,5 0,6 0,7 0,8 0,9 1,0 1,1 1,2 1,3 1,4 1,5 1,6
Catch (ton. km-2.year-1)
Tro
phic
Lev
el
Fig. 3. SBB model 1998–1999 catch and trophic levels per fleet.
M.A
.G
asa
lla,
C.L
.D.B
.R
ossi-W
on
gtsch
ow
ski/Eco
logica
lM
od
ellin
g1
72
(20
04
)2
83
–3
06
293
"TOP-DOWN" CONTROL "BOTTOM UP" CONTROL
0
10
20
30
40
50
0 0,2 0,4 0,6 0,8 1
F- squids (year-1)
%
Shrimps King Weakfish Croaker
Octopus Flatfish Sardine
Juv. Sardine Cetaceans
-80
-60
-40
-20
0
0 0,2 0,4 0,6 0,8 1
F- squids (year-1)
%
Weakfish Cynoscion Other piscivores fish
Cutlass fish Mullets
-80
-60
-40
-20
0
0 0,2 0,4 0,6 0,8 1
F- squids (year-1)
%
Weakfish Cynoscion Other piscivores fish
Cutlass fish Mullets
-20
-10
0
10
20
30
40
50
0 0,2 0,4 0,6 0,8 1F- squids (year-1)
%
Shrimps King Weakfish Croaker
Octopus Flatfish Sardine
Juv. Sardine Cetaceans
Fig. 4. Predicted relative change in biomass of other components in the system under “top-down” and “bottom-up” control assumptions from the equilibrium simulation ofincreasing fishing mortality for squids.
294M
.A.
Ga
salla
,C
.L.D
.B.
Ro
ssi-Wo
ng
tscho
wski/E
colog
ical
Mo
de
lling
17
2(2
00
4)
28
3–
30
6
-15
-5
5
15
25
35
45
0 0,2 0,4 0,6 0,8 1
F- squids (year-1)
%
Large pelagic fish Seabirds Sharks and rays
-0,25
0
0,25
0,5
0 0,2 0,4 0,6 0,8 1
F- squids (year-1)
%
Phytoplankton Zooplankton
-15
-5
5
15
25
35
45
0 0,2 0,4 0,6 0,8 1
F- squids (year-1)
%
Large pelagic fish Seabirds Sharks and rays
-0,25
0
0,25
0,5
0 0,2 0,4 0,6 0,8 1
F- squids (year-1)
%
Phytoplankton Zooplankton
Fig. 4. (Continued).
M.A
.G
asa
lla,
C.L
.D.B
.R
ossi-W
on
gtsch
ow
ski/Eco
logica
lM
od
ellin
g1
72
(20
04
)2
83
–3
06
295
-40
-20
0
20
40
0 0,2 0,4 0,6 0,8 1
F- Wf Cynoscion (year-1)
%
Squids Wf Cynoscion King Wf
Other Sciaenids Flatfsih
-40
-10
20
50
80
0 0,2 0,4 0,6 0,8 1
F- Large Pelagics (year-1)
%
Squids Large Pelagics
Other piscivores Triggerfish(A) (B)
Fig. 5. Predicted change in biomass from the simulation of increasing fishing mortality for Weakfish Cynoscion (A) and large pelagic fish (B), under mixed control.
296 M.A. Gasalla, C.L.D.B. Rossi-Wongtschowski / Ecological Modelling 172 (2004) 283–306
Fig. 6. Ecosim simulation outputs of the effects of increasing live baitfish fleet fishing rate from year 2 onward during a 10-year period,under three alternative types of flow control: top-down, mixed, and bottom-up. Trophic groups are indicated by numbers (1: croaker, 2:catfish, 3: sharks and rays).
5. Discussion
5.1. The mass-balance model and the “bottom-up”perspective
Oceanographic studies in the SBB highlight thatphysical characteristics determine the extent of the ex-port and the size of productive habitats, i.e. the up-welling of deep, nutrient-rich water can enrich the eu-photic zone by introducing new nitrogen, leading to
enhanced planktonic production and biomass (Metzleret al., 1997). The present SBB ecosystem model wasconstructed to represent the period 1998–1999, rec-ognized by oceanographers as corresponding to a LaNiña recovery phase.
In fact, persistent El Niño-like anomalies wereevident in the tropics from 1991 to 1995 with thestrongest positive temperature anomaly occurring dur-ing 1997, disrupting productivity patterns; followedby the strongest negative temperature and positive
M.A. Gasalla, C.L.D.B. Rossi-Wongtschowski / Ecological Modelling 172 (2004) 283–306 297
nitrate anomalies in 1999, leading for example to thePeruvian anchoveta recovery (Chavez et al., 2002).Studies revealed that the Pacific Decadal Oscillation(PDO) changed sign in late 1990s apparently amelio-rating the biogeochemical and ecological impacts of1997 El Niño. The La Niña event began in 1998 whenocean productivity rebounded to higher than normallevels (Behrenfeld et al., 2001; Chavez et al., 2002).Therefore, fisheries catches considered in this model,may somehow be influenced by the ENSO transition,as speculated byTomás et al. (2000)for cephalopods.
Physical complexity of the SBB increases fertiliza-tion possibilities into the sunlight zone during enoughtime to allow phytoplankton growth and biomass accu-mulation (Gaeta and Brandini, 2002). Its neritic zoneis considered one of the most productive areas ofthe Brazilian shelf, also reaching high values of pri-mary productivity in shallow waters and bays (Sevrin-Reyssac et al., 1979) due to coastal degradation, andinfluencing organic material flow through the pelagicand benthic food webs. Isotopic nitrogen experimentsindicated the mesotrophic conditions of the SSB innershelf (Gaeta, 1999), although predominated in aver-age by regenerated production (Metzler et al., 1997).Zooplankton metabolic activity represents an organicand inorganic compounds cycling mechanism in thewater column. Pelagic species recruitment is depen-dent on the proper availability of planktonic food, andcoast-ocean zooplanktonic biomass gradient empha-sises the inner shelf higher productivity comparingwith its outer shelf and oceanic zone (Resgalla et al.,2001; Lopes et al., 2001).
The importance of detritus in the system is higherthan in upwelling areas and represents a vital basefor the benthic pathway. Also, the run-off contributionmay have an important role bringing aloctonous par-ticulate organic carbon to the shelf. Relevant organicsinking processes contribute to the benthos food sup-ply, although new production is considered its mainsource (Pires-Vanin, 1993). Benthic groups were ex-tremely important in terms of biomass.Rocha et al.(1998)estimated that the important amount of benthosbiomass in summer (76.9 g m−2) should have been un-derestimated due to sampling limitations. Therefore,although present model total benthic biomass esti-mates seem to be high, it is to be found between rangevalues fromRocha (1998)(57–101.2 g m−2) and thosecalculated fromAmaral (1999)database (73 g m−2).
In terms of model evaluation, the present modelcould be improved in several aspects, such as by com-paring isolated estimates of biomass and instantaneousmortality rates by other methods not presently avail-able. Also, several groups could be split between adultand juvenile pools, and others be added in order toobtain a more complete picture of the system.
The introduction of mammals and seabirds interac-tion with the fisheries and within the system seems tohave an important additional input to present model.Although estimates on these groups are reasonablypreliminary it may not underestimate their importantpredation role in the ecosystem. By the other hand, theimportance that the fisheries, especially the sea-bobshrimp fisheries have on seabirds survival by promot-ing food availability was not yet quantified.
Another important aspect of the model that couldaffect simulations of the effect of fishering on theecosystem is the uncertainty about regional feedinghabits of several key species. Although presentlyglobal literature and databases can help to fulfill gapsin models construction (i.e. FishBase) it is importantto emphasize the need for further local feeding studiesexpressed as a percentage of weight. For example, therole of cephalopods is a key factor in this ecosystemfunctioning. The present modelling has shown highmodel susceptibility to changes in the input diet ofcephalopods groups based on different data sources(piscivory or zooplanktivory different degrees).
Nevertheless, and when comparing other shelf mod-els of southern Brazil, the present model seems to rep-resent so far the most up-to-date arrange of selectedtrophic groups and present fisheries locally-gatheredinformation for the area.
5.2. Simulation of ecosystem responses and the“top-down” perspective
Model simulations allowed the exploration on theeffects of different trophic control assumptions inpredicting the changes in the food web. The pre-dicted biomass changes are more pronounced undertop-down control that under bottom-up, as was alsoobtained byMackinson et al. (1997), Shannon etal. (2000), and Vasconcellos and Gasalla (2001).The marked increase in the biomass of a competitorspecies due to a cascade effect in the food web wasnot observed under bottom-up, when competition for
298 M.A. Gasalla, C.L.D.B. Rossi-Wongtschowski / Ecological Modelling 172 (2004) 283–306
food resources were limiting interactions.Walterset al. (1997)stated that bottom-up control generallypredicts that stocks can sustain much higher fishingpressure before it begins to decline. This occurs be-cause predation mortality rate tends to remain morestable while the consumption rate of lower trophiclevels increases with the decrease in biomass, tomake them more productive per biomass due to donorcontrol of total food eaten.
In this case, ecosystem responses show quantita-tively different results under both hypothesis, andtherefore the SBB simulations appear to be verysensitive depending on the assumption.
For example, when increasing fishing mortality forsquids, opposite tendencies in biomass changes canbe observed especially for the upper food-web groups(Fig. 4).
Squids are important prey of fish and vertebratespecies, and predators seems to be affected by theirreduction, such as for instance the weakfish (Fig. 4).
Also, triangles of meshed trophic interactions mayimpact biomass dynamics within all simulations(Figs. 4 and 6; Table 5). Several triangles of tem-perate food webs have been exemplified as beingeither symmetrical or asymmetrical (Ursin, 1982;Beverton, 1985). Although there are some sim-ple triangles (i.e. weakfish-squids-cutlass fish), thepresent model triangles are not always straightforward(Table 4).
Also, the complexity of SBB species interac-tions can be observed by the number of “beneficialpredation” interactions in the model (more than 40).This occurs when a predator may have a direct negativeimpact on its prey but also an indirect positive effect,by consuming other predators and competitors of theirprey (Ulanowicz and Puccia, 1990; Pauly et al., 2002).Examples of beneficial predation of squids are bylarge pelagic fish, shark and rays, flatfish and seabirds.
Overfished tropical marine ecosystems often showan increase in squid catches while the fisheries in-tensifies (Pauly, 1985; Christensen, 1998). Could theincrease in squids catches in the SBB be an ecosystemconsequence of overexploiting higher trophic levelspecies, such as weakfish?Fig. 5 shows this possibil-ity, where the decrease of the most important squidpredator (weakfish) and another important predatorin the system (Large pelagic fish) was simulated byincreasing their fishing rates.
In fact it would not be surprising that the over-fishing of higher order consumers can benefit small,widespread and rapidly growing groups, given thatreducing all predators in the system is expected toincrease the abundance of preys. Also, the squids’high turnover rate can allow them to withstandhigher exploitation rates than slower growing species(Christensen, 1998; Hall, 1999).
Actually, the heavy exploitation of weakfish bythe bottom-trawlers (Castro, 2000), could benefitthe increment in squid biomass, when its effort isstrongly increased (Table 5). Bottom-trawlers have aheavy impact on various squid predators, and couldtry to take advantage from the increasing summersquid catches, as reported byPérez (2002). Also,other speculations can be made about the effect ofshrimp-trawlers effort reduction on squids (Table 5).The extent to which a seasonal shrimp closure couldaffect a seasonal biomass pulse, such as the squid’s,is rather questionable.
Simulations of increasing live-baitfish fleet didnot show prominent impact in the inner shelf, wherepresentF values are low. Given that young sardinesconcentrate in shallow waters, where the conflictswith seiners and artisanal sector converge, a comple-mentary model of the adjacent coastal system andartisanal fisheries could better address the fleet’s im-pact. Nevertheless, the decrease of sharks and raysreflect both their vulnerability and the indirect trian-gles of trophic interactions surprisingly linking themwith the harvesting of young sardines (Fig. 6). Theirslow recovery time, being on slow-growing with lowreproductive rates, make them a vulnerable group, asalready reported (Walker, 1996; Quero and Cendrero,1996).
5.3. Flow controls
Top-down and bottom-up controls are both likelyto act on ecological communities (Hunter and Price,1992). Questions are being posed instead as to thenature of the links between bottom-up and top-downinfluences. The variation in flow types observed inecosystems can be a consequence of heterogeneity ofcommunities and species interactions. Both theories,top-down control with trophic cascades (predator con-trol) (Carpenter et al., 1985; Carpenter and Kitchell,1993) and bottom-up, donor control (Hunter and Price,
M.A
.G
asa
lla,
C.L
.D.B
.R
ossi-W
on
gtsch
ow
ski/Eco
logica
lM
od
ellin
g1
72
(20
04
)2
83
–3
06
299
Table 4Diet matrixPrey/predator 2 3 4 5 6 7 8 9 10 11 12 13 14 15 16 17 18 19 20 21 22
Phytoplankton 0.001 0.950 0.002 0.100 0.800 0.200 0.056 0.007 0.001Shrimps 0.300 0.205 0.175 0.505 0.085 0.088 0.059 0.273Zooplankton 0.005 0.050 0.120 0.200 0.010 0.800 0.210 0.811 0.384 0.212 0.026 0.111 0.286Mullets 0.106 0.005Detritivourous benthos 0.015 0.002 0.050 0.080 0.480 0.022 0.379 0.409 0.212 0.024 0.253 0.348 0.015 0.056 0.125 0.009Juvenile sardine 0.005 0.106 0.024 0.044 0.167Catfish 0.072Sardine 0.005 0.106 0.024 0.044 0.167 0.001Carnivorous benthos 0.002 0.060 0.100 0.201 0.338 0.292 0.227 0.012 0.637 0.640 0.015 0.056 0.129 0.075Mackerel 0.015 0.115 0.070Squids 0.100 0.060 0.136 0.094 0.010 0.141 0.185 0.571 0.079 0.092Croaker 0.001 0.029 0.143 0.012 0.005Other sciaenids 0.001 0.036 0.015 0.165 0.010 0.093 0.011 0.313Cutlass fish 0.118 0.099 0.003King Weakush 0.041 0.058 0.035 0.092Triggerfish 0.123Octopus 0.010 0.002 0.002Large pelagic fish 0.053 0.079Other piscivores fish 0.009 0.007Weakfish Cynoscion 0.005 0.018 0.091 0.012 0.226Sharks and raysFlatfish 0.045 0.002 0.074 0.053CetaceansSeabirdsDetritus 0.979 0.094 0.730 0.850 0.208 0.011Import 0.900 0.202 0.100
300 M.A. Gasalla, C.L.D.B. Rossi-Wongtschowski / Ecological Modelling 172 (2004) 283–306
Table 5Predicted relative change in squid biomass after 10 years underdifferent fishing scenarios
Scenario Fleet Effortmultiplier
Biomass change
Bottom-up Top-down
1 Shrimp trawlers 4 −0.76 −1.722 Shrimp trawlers 2 −0.39 −0.913 Shrimp trawlers 0.5 0.19 0.474 Pair-trawlers 4 1.85 8.85 Pair-trawlers 2 −0.54 −2.3
1992), have dominated the ecological debate (Matsonand Hunter, 1992).
A bottom-up regime can be defined by a responseto changes in productivity at the lowest trophic levelsresulting from physical forcing. An increase in pro-ductivity at the bottom of the trophic system leads toan increase in the productivity and abundance at allhigher trophic levels. Each trophic level is food lim-ited not predator limited. (Bundy, 1997).
In top-down control, an increase in the abundance ofa top predator leads to the prediction of a trophic cas-cade. That is, an increase in the abundance at trophiclevel 4 leads to an increase in the rate of predationmortality on trophic level 3, and thus a reduction inits biomass, and so on. An increase in productivity atthe bottom would lead only to an increase in biomassat the top of the food chain (Bundy, 1997).
In the oceans, bottom up evidences are easy to find,while top-down are more difficult to follow, but itseems apparent that the trophic structure is being al-tered either by productivity or by the constant removalof large amounts of fish (Parsons, 1992). The effect ofenvironmental conditions climbs upward the systemto meet the effects of fishing cascading down fromthe top (Caddy, 1993; Rudstam et al., 1994). Leibold(1989) suggested that top-down controls especiallythe upper trophic levels while in bottom-up, produc-tion controls abundance in lower trophic levels. Alsoa “wasp-waist” control was suggested byRice (1995)representing general upwelling ecosystems regulatedup and down from their middle, which is usually oc-cupied by small pelagic fish.
The bottom-up perspective has dominated Brazil-ian oceanographic literature and explanations onecosystem’s enrichment processes. By addressing theimpact of fishing through ecosystem modelling, a
complementary top-down perspective can be added.Actually, the effect of predation pressure, includingexhaustive fishing effort exerted mostly during thelast 40 years, had never been evaluated on a multi-species basis before. While there are wide evidencesof “bottom-up” processes in the shelf ecosystem,the “top-down” type of inner flow control has beenalmost neglected especially due to methodologi-cal constraints. This has an important implicationfor management purposes, because it can be toorisky to underestimate overfishing ecosystem effects(Christensen and Walters, 2002).
5.4. Methodological perspectives for management
The rudimentary task for fishery managers is theoptimal utilization of a renewable resource throughtime. The twentieth century has witnessed a numberof major management shifts in the pursuit of this goalas regulators have struggled with increasingly power-ful harvesting technologies, the deleterious affects ofopen-access regimes, and a general failure to preventfishing fleets from becoming overcapitalized (Hayley,1999). Some progress has been made towards mitigat-ing open-access inefficiencies, such as through catchor access control in many fisheries, and the recogni-tion of the effects of fisheries on ecosystems (Botsfordet al., 1997; Hall, 1999). However, ecosystem-basedfishery management is still very new in world fisheriesreality, remaining as an attractive concept rather thana formal activity.
Present bottom-up processes evidence in the SouthBrazil Bight should not dismiss the important role ofa top-down control. Based on our results, we sug-gest that, in order to be precautionary, SBB decision-makers should not underestimate the effect of fishingeffort on the whole system, and consider that a top-down control could actually dominate for the upperfood chains.
Therefore, the definition of conservative exploita-tion rates would be required, such as by control offishing effort by fleet type. Also, fishing access andmultispecies catch restriction could be undertaken.Pauly et al. (2002)recently recommended that a“restoration ecology for the oceans” urges and theaccess restriction through marine reserves networkslocated in appropriate specific areas, as well as theenforcement improvement by satellite monitoring,
M.A. Gasalla, C.L.D.B. Rossi-Wongtschowski / Ecological Modelling 172 (2004) 283–306 301
could be more effective mechanisms. Socio-economicevaluations, community involvement, ecolabellingand public education could benefit measures im-plementation. Further work on exploratory Ecosimmanagement scenarios on the effect of different fleetscould contribute by incorporating both interespecificinteractions and physical environmental influences.
6. Conclusions
In order to improve management decisions by pre-dicting the effect of fishing, it would be recommendedto better understand the way the ecosystem functionsin terms of internal control between components, es-pecially from upper trophic levels. Nevertheless, a pre-cautionary measure would be to assume that top-downcontrol is the dominant force in energy flows. In or-der to implement such an assumption in an ecosys-tem approach to fisheries management, fishing effortreduction mechanisms should be evaluated and imple-mented.
This paper shows the importance of integrated fish-ery management, because the effect of a single changein fishing strategies can have consequences through-out the food web.
Methodologies, experiments and approaches thatcould put the management of fisheries on an ecosystembasis must be encouraged as useful scientific progress.They could, in the near future, allow the managementof human uses of the ocean in a manner consistentwith the existence of ecological interactions.
Acknowledgements
We are grateful to Francisco Arreguin-Sanchez andMarcelo Vasconcellos for helpful comments duringmodelling; and Villy Christensen and Daniel Paulyfor bringing instruments through the INCO-DC con-certed action “Placing fisheries in their ecosystemcontext”. Special thanks are given to Yasunobu Mat-suura, Koichi Ara, Charles Gorri, Marcia. R. Oliveira,Nilamon Leite Jr., Acacio Tomás, Angel Pérez,Cristina Cergole, Otto Gadig, Tatiana Neves, FabioOlmos, Alexandre Zerbini and Salvatore Siciliano, forproviding useful and even unpublished informationon zooplankton, shrimps, octopus, squids, sardines,
sharks, seabirds and cetaceans, respectively. Also, wewould like to thank all the people who produced dataon which the model was based, and three anonymousreferees for allowing the improvement of the article.
This is part of a project sponsored by the IFS (Inter-national Foundation for Science) and USAID (UnitedStates Agency for International Development) throughWWF/Brazil. CNPq/Brazil provided sponsorship tothe author. This publication was partly funded by theEuropean Commission’s INCO-DC program thoughcontract no. ERBIC18CT97175.
References
Aliño, P.M., McManus, L.T., McManus, J.W., Nañola, C.L.,Fortes, M.D., Trono, G.C., Jacinto, G.S., 1993. Initial parameterestimations of a coral reef flat ecosystem in Bolinao,Pangasinan, Northwestern Philippines. In: Christensen, V.,Pauly, D. (Eds.), Trophic Models of Aquatic Ecosystems.ICLARM Conf. Proc. 26, 252–267.
Amaral, A.C.Z., 1999. Biodiversidade bentica da região Sul-Sudeste da costa brasileira. Report to the REVIZEE Program(Sustainable Potential Evaluation of Brazilian EEZ LivingResources). Ministério do Meio Ambiente, 232 pp.
Araújo, F.G., 1984. Hábitos Alimentares de Tres Bagres Marinhos(Ariidae) no Estuário da Lagoa dos Patos (RS), Brasil. Atlantica,Rio Grande 7, 47–63.
Araujo, J.N., Haimovici, M., 2000. Estrutura etaria e mortalidadedo linguado-brancoParalichthys patagonicus(Jordan, 1889) nosul do Brasil. Rev. Bras. Oceanogr. 48 (1), 71–79.
Bakun, A., Parrish, R.H., 1990. Comparative studies of coastalpelagic fish reproductive habitats: the Brazilian sardine(Sardinella aurita). J. Cons. Int. Expl. Mer. 46, 269–283.
Behrenfeld, M.J., Randerson, J.T., McClain, C.R., Feldman, G.C.,Los, S.O., Tucker, C.G., Falkowski, P.G., Field, C.B., Frouin,R., Esalas, W.E., Koler, D., Pollack, N.H., 2001. Biosphericprimary production during ENSO transition. Science 291, 2594–2597.
Beverton, R.J.H., 1985. Analysis of marine mammal–fisheriesinteractions. In: Beddington, J.R., Beverton, R.J.H., Lavigne,D.M. (Eds.), Marine Mammals and Fisheries. George Allen &Unwin, London, pp. 3–33.
Bonecker, A.C.T., Nogueira, C.R., Bonecker, S.L.C., Santos,L.H.S., Dias, C.O., Reis, J.M.L., Dias, A.S., 1990. Distributionand diversity of zooplankton off Rio de Janeiro (RJ-Brazil).In: Watanabe, S. (Ed.), II Simpósio de Ecossistemas da CostaSul e Sudeste Brasileira: Estrutrura, Função e manejo. Publ.ACIESP, S. Paulo, p. 171–178.
Brandini, F.P., 1990a. Hydrography and characteristics of thephytoplankton in shelf and oceanic waters off SoutheasternBrazil during winter (July/August 1982) and summer(February/March 1984). Hydrobiologia 196, 111–148.
Brandini, F.P., 1990b. Produção primária e caracterısticasfotossintéticas do fitoplancton na região sueste do Brasil. Bolm.Inst. Oceanogr. S. Paulo 38 (2), 147–159.
302 M.A. Gasalla, C.L.D.B. Rossi-Wongtschowski / Ecological Modelling 172 (2004) 283–306
Brandini, F., Lopes, R.M., Gutseit, K.S., Spach, H.L., Sassi,R., 1997. Planctonologia na plataforma continental do Brasil.Diagnose e revisão bibliográfica. Avaliação do PotencialSustentável de Recursos Vivos na Zona Economica Exclusiva-REVIZEE. MMA, CIRM, FEMAR, 196 pp.
Botsford, L.W., Castilla, J.C., Peterson, C.H., 1997. Themanagement of fisheries and marine ecosystems. Science 277,509–515.
Buchan, P.R., Smale, M.J., 1981. Estimates of biomass,consumption and production ofOcopus vulgarisCuvier off theeast coast of South Africa. Invest. Rep. Oceanogr. Res. Inst.Durban 50, 1–9.
Bundy, A., 1997. Assessment and management of multispecies,multigear fisheries: a case study from San Miguel Bay, thePhilippines. Resource Management and Environmental Studies.Ph.D. Thesis, University of British Columbia, Vancouver,Canada.
Caddy, J.F., 1993. Toward a comparative evaluation of humanimpacts on fisheries ecosystems of enclosed and semi-enclosesseas. Rev. Fish. Sci. 1, 57–95.
Campos, E.J.D., Lorenzetti, J.A., Stevenson, M.R., Stech, J.L.,Souza, R.B., 1996. Penetration of waters from the Brazil-Malvinas confluence region along the South Americancontinental shelf up to 23S. Anais da Academia Brasileira deCiencias 68 (1), 49–58.
Campos, F., Silva, R., Buitrón, L., Campanhã, R., Matuschelli,P., Oliveira, H., Paludo, D., 2000. Levantamento e censo desıtios de reprodução de aves marinhos no estado de São Paulo.Abstracts of the Congresso Brasileiro de Ornitologia.
Capitoli, R.R., Ruffino, M.L., Vooren, C.M., 1995. Alimentaçãodo tubarãoMustelus schmittiSpringer na plataforma costeirado estado do Rio Grande do Sul, Brasil. Atlantica, Rio Grande17, 109–122.
Carneiro, M.H., 1995. Reprodução e alimentação dos linguadosParalichthys patagonicuse P. orbignyanus(Pleuronectifornes:Bothidae), no Rio Grande do Sul, Brasil, MSc Dissertation.University of Rio Grande, 80 pp.
Carpenter, S.C., Kitchell, J.F., 1993. The Trophic Cascades inLakes. Cambridge University Press, New York, 385 pp.
Carpenter, S.C., Kitchell, J.F., Hodgson., , 1985. Cascading trophicinteractions and lake productivity. Bioscience 35, 634–639.
Castello, J.P., Yamaguti, N., Correa, M.F.M., Sierra de Ledo,B., 1994. Oceanografia biológica: Nécton. In: Petrobrás (Ed.),Diagnóstico Ambiental Oceanico e Costeiro das Regiões Sul eSudeste do Brasil, vol. V. Fundespa, 472 pp.
Castro, P.M.G., 2000. Estrutura e Dinamica da Frota deParelhas do Estado de São Paulo e Aspectos Biológicosdos Principais Recursos Pesqueiros Demersais Costeiros daRegião Sudeste/Sul do Brasil (23–29S). Ph.D. Thesis, InstitutoOceanográfico, Universidade de São Paulo, São Paulo (SP),Brasil.
Castro, B.M., Miranda, L.B., 1998. Physical oceanography of theWestern Atlantic continental shelf located between 4◦N and34◦S coastal segment (4, W). In: Robinson, A.R., Brink, K.H.(Eds.), The Sea, vol. 11. Wiley, pp. 209–251.
Castro Filho, B.M., Miranda, L.B., Miyao, S.Y., 1987. Condiçõeshidrográficas na plataforma continental ao largo de Ubatuba:
variações sazonais e em média escala. Bolm. Inst. Oceanogr.,S. Paulo 32 (2), 135–151.
Cergole, M.C., 1995. Stock assessment of the Brazilian sardine,Sardinella brasiliensis, of the Southeastern coast of Brazil. Sci.Mar. 59 (3/4), 597–610.
Cergole, M.C., Saccardo, S.A., Rossi-Wongtschowski, C.L.D.B.,2001. Flutuações na biomassa do estoque desovante e norecrutamento da sardinha brasileira (Sardinella brasiliensis):1977–1997. Rev. Bras. Oceanogr., in press.
Chatwin, A.C., 1997. Estimativa da Abundancia do BonitoPintado,Euthynnus alletteratus, e do Bonito Cachorro,Auxisspp. (Teleotei: Scombridae) na Costa Sudeste Brasileira. Ph.D.Thesis, Universidade de São Paulo, São Paulo (SP), Brasil, 240pp.
Chaves, P.T.C., Vendel, A.L., 1996. Aspectos da alimentação deGenidens genidensna Baia de Guaratuba. Rev. Bras. Zool. 13,669–675.
Chavez, F.P., Pennington, J.T., Castro, C.G., Ryan, J.P., Michisaki,R.P., Schlining, B., Walz, P., Buck, K.R., McFadyen, A.,Collins, C.A., 2002. Biological and chemical consequences ofthe 1997–1998 El Niño in central California waters. Prog.Oceanogr. 54, 205–232.
Christensen, V., 1998. Fishery-induced changes in a marineecosystem: insight from models of the Gulf of Thailand. J. FishBiol. 53 (Suppl. A), 128–142.
Christensen, V., Pauly, D., 1992. ECOPATH II—a softwarefor balancing steady-state models and calculating networkcharacteristics. Ecol. Model. 61, 169–185.
Christensen, V., Walters, C., 2002. Ecopath with Ecosim: anoverview. In: Christensen, V., Reck, G., Maclean, J.L. (Eds.),Proceedings of the INCO-DC Conference Placing Fisheriesin their Ecosystem Context, Galápagos Islands, Ecuador, 4–8December 2000. ACP-EU Fish. Res. Rep. 12, 36–38.
Christensen, V., Walters, C. Ecopath with Ecosim: methods,capabilities and limitations. Ecol. Model., this vol.
Cruz, H., 1982. Guia de los Grandes Cetáceos y ActividadBallenera. Miraguano Ediciones, Madrid, 158 pp.
Dall, W., Hill, B.J., Rothlisberg, P.C., Sharples, D.J., 1990. Thebiology of Penaeidae. In: Blaxter, J.H.S., Southward, A.J.(Eds.), Advances in Marine Biology, pp. 127–157.
D’Incao, F., 1991. Pesca e Biologia dePenaeus paulensisna Lagoados Patos, RS. Atlantica, Rio Grande 13 (1), 159–169.
Efe, M.A., 1993. Dinamica Alimentar do Atobá-Marrom,Sulaleucogaster (Aves: Sulidae), Nas Regiões de Cabo Frio eAbrolhos. Graduation Dissertation, Universidade Federal do Riode Janeiro, Rio de Janeiro (RJ), Brasil, 43 pp.
Field, J.G., Wulff, F., Mann, K.H., 1989. The need to analyzeecological networks. In: Wulff, F., Field, J.G., Mann, K.H.(Eds.), Network Analysis in Marine Ecology: Methods andApplications, Coastal and Estuarine Studies. Springer-Verlag,Berlin, pp. 3–12.
Froese, R., Pauly, D., 1998. FishBase 98: Concepts, Design andData Sources. ICLARM, Manila, Philippines, 293 pp.
Gaeta, S.A., 1999. Produção Primária na Região Oeste do AtlanticoSul. Livre-Docencia Thesis, Instituto Oceanografico, Universityof São Paulo, 140 pp.
Gaeta, S.A., Brandini, F.P., 2002. Oceanografia Biológica—Produção do Fitoplancton. REVIZEE Program (Sustainable
M.A. Gasalla, C.L.D.B. Rossi-Wongtschowski / Ecological Modelling 172 (2004) 283–306 303
Potential Evaluation of Brazilian EEZ Living Resources).Ministério do Meio Ambiente, 89 pp.
Gasalla, M.A., 1995. Organização Trófica da Ictiofauna do Sacode Mamanguá, Paraty, Estado do Rio de Janeiro. MSc Thesis,Instituto Oceanográfico, Universidade de São Paulo, São Paulo(SP), Brasil, 145 pp.
Gasalla, M.A., Oliveira, M.R., 1997. Papel Trófico de Clupeıdeosda Costa Sudeste e Sul do Papel Trófico de Clupeıdeos daCosta Sudeste do Brasil.XII Encontro Brasileiro de Ictiologia.Abstracts, Instituto Oceanográfico, University of São Paulo, SãoPaulo.
Gasalla, M.A., Tomás, A.R.G., 1998. Evaluation of the status offisheries data collection and stock assessment problems in SãoPaulo, Southeastern Brazil. In: Funk, F., et al. (Eds.), FisheryStock Assessment Models, Alaska Sea Grant College ProgramAK-SG-98-01, University of Alaska Fairbanks, pp. 41–60.
Gasalla, M.A., Tutui, S.L.S., 1999. Critical Constraints toRegulate Fishing Capacity in Southeastern Brazil: Notes fromthe Brazilian Sardine Fishery Experience. FAO TechnicalConsultation on the Measurement of Fishing Capacity, MexicoCity, 29 November/3 December 1999. FI-MFC/99 BackgroudDocument 15, 10 pp.
Gasalla, M.A., Tutui, S.L.S., 2000. Pesca responsável econservação dos estoques pesqueiros costeiros: principaisproblemas no Sudeste do Brasil. Anais do V SimpósioBrasileiros sobre Ecossistemas. Publ. ACIESP 109 (1), 148–159.
Gasalla, M.A., Servo, G.J., Tomás, A.R.G., 2003. Dinamica dafrota de traineiras da região de Santos, SP. In: Cergole, M.C.,Rossi-Wongtschowski, C.L.D.B. (Eds.), Dinamica das frotaspesqueiras. Análise das principais pescarias comerciais doSudeste-Sul do Brasil. FEMAR/MMA/REVIZEE. Ed. Evoluir,p. 227–249.
Gasalla, M.A., Soares, L.S.H., Carvalho, M.R., Almeida, C.R.T.,Oliveira, M.R., 2001b. Trophic Role of Small and Medium-SizePelagic Fish of the South Brazil Bight Ecosystem (manuscript).
Gianesella-Galvão, S.M.F., Saldanha-Correia, F.M.P., 1995. Aconceptual model for primary production in the Ubatuba region.Abstracts of the XII International Symposium on EnvironmentalBiogeochemistry, Rio de Janeiro, Brazil, 125 pp.
Godinho-Peria, C., 1995. Estimativa da Taxa de Produção e daRelação Produção/Biomassa Média (P/B) de Peixes Demersaisdo Ecossistema Costeiro de Ubatuba, SP, Brasil. MSc Thesis,Instituto Oceanográfico, Universidade de São Paulo, São Paulo(SP), Brasil, 147 pp.
Goitein, R., 1983.Sardinella brasiliensis(Steindachner 1879):estudos sobre alimentação nas regiões de Ubatuba (23◦26′S),Santos (24◦00′S) e Cananéia 25◦01′S. Naturalia 8, 197–209.
Goitein, R., Torres, F.S., Signorini, C.E., 1998. Morphologicalaspects related to feeding of two marine skatesNarcinebrasiliensis Olfers andRhinobatos horkelliMüller & Henle.Acta Sci. 20 (2), 165–169.
Haimovici, M., Teixeira, R.L., Arruda, M.C., 1989. Alimentaçãoda castanhaUmbrina canosai(Pisces: Sciaenidae) no sul doBrasil. Rev. Bras. Biol. 49 (2), 511–522.
Hall, S.J., 1999. The Effect of Fishing on Marine Ecosystem andCommunities. Blackwell Science, Oxford, 274 pp.
Harrison, C.S., Seki, M.P., 1987. Trophic relationships amongtropical seabirds at the Hawaiian Islands. In: Croxall, J.P. (Ed.),Seabirds Feeding Ecology and Role in Marine Ecosystems.Cambridge University Press, Cambridge, 406 pp.
Harrison, C.S., Hida, T.S., Seki, M.P., 1984. The diet of the BrownBooby Sula leucogasterand Masked BoobySula dactylatrainRose Atoll, Samoa. Ibis 126, 588–590.
Hayley, E., 1999. Fishery Vessel Buyback Programs—The GlobalExperience with Particular Respect to the New EnglandGroundfish Fishery. Masters Thesis, University of Delaware.
Heymans, J.J., Baird, D., 2000. Network analysis of the northernBenguela ecosystem by means of NETWRK and ECOPATH.Ecol. Model. 131, 97–119.
Hunter, M.D., Price, P.W., 1992. Placing chutes and ladders:heterogeneity and the relative roles of bottom-up and top-downforces in natural communities. Ecology 73 (3), 724–732.
IBAMA, 2000. Relatório da Reunião Técnica Sobre Estado daArte e Ordenamento da Sardinha-Verdadeira no Sudeste doBrasil. Instituto Brasileiro do Meio Ambiente e dos RecursosRenováveis (IBAMA), 31 pp.
Innes, S., Lavigne, D.M., Earle, W.M., Kovacs, K.M., 1987.Feeding rates of seals and whales. J. Anim. Ecol. 56, 115–130.
Jablonski, S., Matsuura, Y., 1985. Estimate of exploitation rateand population size of skipjack tuna of the Southeastern coastof Brazil. Bolm. Inst. Oceanogr. S. Paulo 33 (1), 29–38.
Jablonski, S., Menezes, A.A.S., Frota, S.A., 1998. A Pesca doBonito Listrado (Katsuwonus pelamis) Com Isca Viva noSudeste-Sul: Análise das Estatısticas de Desembarque, Áreas dePesca e Consumo de Isca Viva (1985–1996). Fundação Institutode Pesca do Estado do Rio de Janeiro, Rio de Janeiro (RJ),Brasil, Informe 98.1.
Jorgensen, S.E., 1992. Exergy and ecology. Ecol. Model. 63, 185–214.
Juras, A.A., Yamaguti, N., 1985. Food and feeding habits of kingweakfish,Macrodon ancylodon(Bloch & Scheider 1801) caughtin the southern coast of Brazil (29–32S). Bolm. Inst. Oceanogr.S. Paulo 33 (2), 149–157.
Katsuragawa, M., Matsuura, Y., Suzuki, X., Dias, J.F., Spach, H.,1993. O ictioplancton ao largo de Ubatuba, SP: composição,distribuição e ocorrencia sazonal (1985–1988). Publ. EspecialBol. Inst. Oceanogr. S. Paulo 10, 85–121.
Lamardo, E.Z., Bıcego, M.C., Castro Filho, B.M., Miranda, L.B.,Prósperi, V.A., 2000. Southern Brazil. In: Sheppard, C. (Ed.),Seas at the Millenium: An Environmental Evaluation, Chapter47. Elsevier, Amsterdam pp. 731–747.
LeBorgne, R., 1982. Zooplankton production in the eastern tropicalAtlantic Ocean: net growth efficiency and P:B in terms of carbonnitrogen and phosphorus. Limnol. Oceanogr. 27 (4), 681–698.
Leibold, M.A., 1989. Resource edibility and the effects of predatorsand productivity on the outcome of trophic interactions. Am.Nat. 134, 922–949.
Leite Jr., N., 2001. Dinamica Populacional do Camarão-rosaFarfantepenaeus brasiliensise Farfantepenaeus paulensisdaRegião Sudeste/Sul do Brasil (23◦ a 28◦ S). MSc Thesis,Instituto Oceanográfico, Universidade de São Paulo, São Paulo(SP), Brasil, 130 pp.
Lichter, A., Hooper, A., 1983. Guia Para el Reconocimientode Cetáceos del Mar Argentino. Fundación Vida SilvestreArgentina, 96 pp.
304 M.A. Gasalla, C.L.D.B. Rossi-Wongtschowski / Ecological Modelling 172 (2004) 283–306
Lima, G.H.F., Hostim-Silva, M., Mazzoleni, R.C., 2000Aspectos da alimentação natural deRhizoprionodon lalandi(Elasmobranchi, Carcharhinidae) no municıpio de Barra Velha,Santa Catarina. Anais of the XIII Semana Nacional deOceanografia. Itajaı, November 2000, pp. 592–594.
Lin, C.F., 1992. Atuns e afins: estimativa da quantidade de iscaviva utilizada pela frota atuneira. Coleção Meio Ambiente: SérieEstudos—Pesca, 6, IBAMA, Brasılia (DF), Brasil, 80 pp.
Lopes, R., Montú, M., Gorri, C., 2001. Produção secundária—zooplancton. Report to the REVIZEE Program (SustainablePotential Evaluation of Brazilian EEZ Living Resources).Ministério do Meio Ambiente, 123 pp.
Lucato, S.H.B., 1997. Trofodinamica dos Peixes Pleuronectiformesdo Canal de São Sebastião, São Paulo, São Paulo, Brasil.Dissertação de Mestrado. Universidade de São Paulo, InstitutoOceanográfico, 110 pp.
Mackinson, S., Vasconcellos, M., Sloman, K., Pitcher, T.J., Walters,C.J., 1997. Ecosystem impacts of harvesting small pelagic fishin upwelling systems: using a dynamic mass-balance model.In: Proceedings of the Forage Fishes in Marine Ecosystems,Alaska Sea Grant College Program, pp. 731–749.
Martins, A.S., Haimovici, M., 1997. Distribution, abundance andbiological interactions of the cutlassfishTrichiurus lepturusinthe southern Brazil subtropical convergence ecosystem. Fish.Res. 30, 217–227.
Matson, P., Hunter, M.D., 1992. The relative contributions oftop-down and bottom-up forces in population and communityecology. Ecology 73 (3), 723.
Matsuura, Y., 1989. Synopsis on the reproductive biology and earlylife history of the Brazilian sardine,Sardinella brasiliensis,and related environmental conditions. Second IOC Workshopon Sardine Anchovy Recruitment Project (SARP) in theSouthwestern Atlantic. IOC Workshop Rep. 33. Annex VIII.Intergovernmental Oceanographic Comission, Unesco, Paris, 8pp.
Matsuura, Y., 1995. Os ecossistemas brasileiros e os principaismacrovetores de desenvolvimento. Subsıdio ao Planejamentoda Gestão Ambiental. Projeto Cenários para o Planejamento daGestão Ambiental (MMA/PNMA), Brasılia (DF), pp. 39–104.
Matsuura, Y., 1996. A probable cause of recruitment failure ofthe Brazilian sardineSardinella auritapopulation during the1974–1975 spawning season. S. Afr. J. Mar. Sci. 17, 29–35.
Matsuura, Y., Nakatani, K., Tamassia, S.T.J., 1980. Distribuiçãosazonal de zooplancton, ovos e larvas de peixes na regiãocentro-sul do Brasil 1975–1977. Bolm. Inst. Oceanogr. SãoPaulo 29 (2), 231–235.
Mendoza, J.J., 1993. A preliminary biomass budget for theNortheastern Venezuela shelf ecosystem. In: Christensen, V.,Pauly, D. (Eds.), Trophic Models of Aquatic Ecosystems.ICLARM Conf. Proc. 26, 285–297.
Metzler, P.M., Glibert, P.M., Gaeta, S.A., Ludlam, J.M., 1997. Newand regenerated production in the South Atlantic off Brazil.Deep-Sea Research I 44 (3), 363–384.
Moritz Junior, H.C., Fracasso, H.A.A., Branco, J.O., 2000.Aspectos ecológicos das aves marinhas no arquipélago doArvoredo, SC. Anais of XIII Semana Nacional de Oceanografia.Itajaı, November 2000, pp. 527–529.
Muxagata, E., 1999. Avaliação da Biomassa e DistribuiçãoZooplanctonica na Plataforma Continental Sudeste BrasileiraDurante o Inverno de 1995, MSc Dissertation. University ofRio Grande, 175 pp.
Nelson, J.B., 1978. The Sulidae, Gannets and Boobies. OxfordUniversity Press.
Nelson, J.B., 1980. Seabirds, Their Biology and Ecology. Hamlyn,London.
Nogueira, R.S., 2000. Análise quantitativa da dieta alimentar dopeixe-porco Balistes capriscus (Gmelin, 1788) coletados nosdesembarques da frota comercial de arrasteiros do porto de RioGrande, RS. Anais da XIII Semana Nacional de Oceanografia,Itajaı, October 2000, pp. 597–600.
Oliveira, I.R., Soares, L.S.H., 1996. Alimentação da tainhaMugilplatanusGünther 1880 (Pisces: Mugilidae) da região estuarino-lagunar de Cananéia, São Paulo, Brasil. B. Inst. Pesca 23, 95–104.
Paiva, P.C., 1993. Trophic structure of a shelf polychaetetaxocoenosis in southern Brazil. Cah. Biol. Mar. 35, 39–55.
Palomares, M.L.D., Pauly, D., 1989. A multiple regression modelfor predicting the food consumption of marine fish populations.Aust. J. Mar. Freshwater Res. 40, 259–273.
Parsons, T.R., 1992. The removal of marine predators by fisheriesand the impact of trophic structure. Mar. Pollut. Bull. 25, 1–4.
Parsons, T., Takahashi, M., 1973. Biological OceanographicProcesses. Pergamon Press, Oxford, 186 pp.
Pauly, D., 1980. On the relationships between natural mortality,growth parameters and mean environmental temperature in 175fish stocks. J. Cons. CIEM 39 (2), 175–192.
Pauly, D., 1985. The population dynamics of short-lived species,with emphasis on squids. NAFO Sci. Council Stud. 9, 143–154.
Pauly, D., Soriano-Bartz, M.L., Palomares, M.L.D., 1993a.Improved construction, parametrization and interpretation ofsteady-state ecosystem models. In: Chistensen, V. Pauly, D.(Eds.), Trophic Models of Aquatic Ecosystems, ICLARM Conf.Proc. 26, 1–13.
Pauly, D., Sambilay, V., Opitz, S., 1993b. Estimates of relative foodconsumption by fish and invertebrates populations, requiredfor modeling the Bolinao Reef Ecosystem, Philippines. In:Chistensen, V., Pauly, D. (Eds.), Trophic Models of AquaticEcosystems, ICLARM Conf. Proc. 26, 236–251.
Pauly, D., Christensen, V., Guénette, S., Pitcher, T.J., Sumaila,R.U., Walters, C.J., Watson, R., Zeller, D., 2002. Towardssustainability in world fisheries. Nature 418, 689–695.
Pearre Jr., S., 1980. The copepod width-weight relation and itsutility in food chain research. Can. J. Zool. 58, 1884–1891.
Pérez, J.A.A., 2002. Biomass dynamics of the squidLoligo pleiandthe development of a small-scale seasonal fishery off SouthernBrazil. J. Mar. Sci. 71 (2), 633–651.
Peterson, I., Wroblewski, J.S., 1984. Mortality rate of fishes in thepelagic ecosystem. Can. J. Fish. Aquat. Sci. 41 (7), 1117–1120.
Pires-Vanin, A.M.S., 1993. Estrutura e função do ecossistemade plataforma continental do Atlantico Sul brasileiro. PublçãoEsp. Inst. Oceanogr. S. Paulo 10, 245 pp.
Quero, J.C., Cendrero., , 1996. Incidence de la peche sur labiodiversité ichthyologique marine: le basin d’arcachon et leplateau continental sud Gascogne. Cybium 204, 323–356.
M.A. Gasalla, C.L.D.B. Rossi-Wongtschowski / Ecological Modelling 172 (2004) 283–306 305
Resgalla Jr., C., Rocha, C., de la Montú, M.A., 2001. The influenceof Ekman transport on zooplankton biomass variability offsouthern Brazil. J. Plank. Res. 23 (6), 641–650.
Rice, J., 1995. Food web theory, marine food webs and climatechanges may do to northern marine fish populations. In:Beamish, R.J. (Ed.), Climate Change and Northern FishPopulations. Can. Spec. Publ. Fish. Aquat. Sci. 121, 561–568.
Rios, M.A.T., 1994. Alimentação dos ScianidaeCtenosciaennagracilicirrhus, Cynoscion jamaicensis, Cynoscion guatucupa, eParalonchurus brasiliensisda Região Costeira de Ubatuba, SP,Brasil, MSc Dissertation. Instituto Oceanográfico, Universidadede São Paulo, São Paulo (SP), Brasil.
Rocha, G.R.A., 1998. Modelo Quantitativo das Interações Tróficasda Plataforma Continental de Ubatuba (SP), Brasil. Ph.D.Thesis, Instituto Oceanográfico, Universidade de São Paulo,São Paulo (SP), Brasil, 99 pp.
Rocha, G.R.A., Gasalla, M.A., Pires-Vanin, A.M., Soares, L.S.H.,Rossi-Wongtschowski, C.L.D.B., Muto, E.Y., Cergole, M.C.,Mesquita, H.S.L., Gianesella-Galvão, S.M.F., Vega-Pérez, L.A.,1998. Quantitative analysis of trophic interactions in theUbatuba shelf ecosystem (Southeastern Brazil) in Summer/85.NAGA, ICLARM Q. 21 (4), 25–32.
Rudstam, L.G., Aneer, G., Hildén, M., 1994. Top-down control inthe pelagics Baltic ecosystem. Dana 10, 105–129.
San Roman, N.A., 1972. Alimentacion del “pez palo”PercophisbrasiliensisQuoy y Gaimard, 1824. Physis 31 (83), 605–612.
Santos, M.C.O., 1999. Novas Informações Sobre Cetáceos noLitoral Sul de São Paulo e Norte de Paraná, Com Baseem Estudos Sobre Encalhes e na Aplicações das Técnicasde Foto-Identificação. MSc Thesis, Instituto de Biociencias,Universidade de São Paulo, São Paulo (SP), Brasil, 114 pp.
Santos, R.A., Haimovici, M., 1998. Trophic relationships of thelong-finned squid Loligo sanpaulensis on the Southern BrazilianShelf. S. Afr. J. Mar. Sci. 20, 81–91.
Schmiegelow, J.M.M., 1990. Estudos Sobre Cetáceos OdontocetesEncontrados em Praias da Região Entre Iguape (S) e Baia deParanaguá (PR) Com Especial Referencia aSotalia fluviatilis.MSc Thesis, Instituto Oceanográfico, Universidade de SãoPaulo, São Paulo (SP), Brasil, 149 pp.
Sevrin-Reyssac, J., Machado, M.C.S., Schutze, M.L.M., Bibas,S.G., Lima, C.A., Esteves, C.P., 1979. Biomasse et productiondu phytoplancton de la baie de Guanabara (État de Rio deJaneiro, Brésil) et du secteur océanique adjacent. Variations demai a juillet 1978. Bull. Mus. Natl. Hist. Nat. 4, 329–354.
Shannon, L.H., Cury, P.M., Jarre, A., 2000. Modelling effects offishing in the Southern Benguela ecosystem. ICES J. Mar. Sci.57, 720–722.
Sick, H., 1977. Ornitologia Brasileira. Editora Nova Fronteira, Riode Janeiro, 862 pp.
Soares, L.S.H., Rossi-Wongtschowski, C.L.D.B., Alvares, L.M.C.,Muto, E.Y., Gasalla, M.A., 1992. Grupos tróficos de peixesdemersais da plataforma continental interna de Ubatuba, Brasil.I. Chondrichthyes. Bolm. Inst. Oceanogr. S. Paulo 40 (1/2),79–85.
Soares, L.S.H., Gasalla, M.A., Rios, M.A.T., Arrasa, M.V.,Rossi-Wongtschowski, C.L.D.B., 1993. Grupos tróficos deonze espécies dominantes de peixes demersais da plataforma
continental interna de Ubatuba Brasil. Publção Esp. Inst.Oceanogr. S. Paulo 10, 189–198.
Soares, L.S.H., Jarre-Teichman, A., Rossi-Wongtschowski,C.L.D.B., 1998. Field estimates of food consumption of thesearobinPrionotus punctatus(Bloch 1797) on the continentalshelf off Ubatuba, Southeastern Brazil. Rev. Bras. Oceanogr.46 (1), 45–60.
Soares, L.S.H., Vazzoler, A.E.A.M., Correia, A.R., 1999. Dielfeeding chronology of the skateRaja agassizi(Muller & Henle)(Pisces, Elasmobranchii) on the continental shelf off Ubatuba,Southeastern Brazil. Revta Bras. Zool. 16 (1), 201–212.
Soto, J.M.R., Silva-Ribiero, C.C., Santos, R.A., Montibeler, A.,2000. Análise de Conteúdos Estomacais deStenella frontalis(Cuvier, 1829) (Cetacea, Delphinidae), Coletados no Litoralde Santa Catarina, Brasil. Anais da XIII Semana Nacional deOceanografia, Itajaı, October 2000, pp. 739–741.
Tomás, A.R.G., 2003. Dinamica Populacional e Pesca do Polvo-Comum Octopus vulgarisno Sudeste e Sul do Brasil. Ph.D.Thesis, São Paulo State University, UNESP, Rio Claro, 480 pp.
Tomás, A.R.G., Carneiro, M.H., Gasalla, M.A., 2000. Cephalopodsin the fishery of the Southeastern Brazil versus environmentalconditions during last decade: are there relationships to ENSOphenomena? Proceedings of CIAC 2000, Cephalopod Biomassand Production. Aberdeen, July 2000.
Tomás, A.R.G., Gasalla, M.A., Carneiro, M.H., 2003. Dinamicada frota de arrasto de Santos. In: Cergole, M.C., Rossi-Wongtschowski, C.L.D.B. (Eds.), Dinamica das frotaspesqueiras. Análise das principais pescarias comerciais doSudeste-Sul do Brasil. FEMAR/MMA/REVIZEE. Ed. Evoluir,p. 39–63.
Trites, A.W., Christensen, V., Pauly, D., 1997. Competition betweenfisheries and marine mammals for prey and primary productionin the Pacific Ocean. J. Northwestern Atl. Fish. Sci. 22, 173–187.
Ulanowicz, R.E., Puccia, C.J., 1990. Mixed trophic impacts inecosystems. Coenoses 5, 7–16.
Ursin, E., 1982. Stability and variability in the marine ecosystem.Dana 2, 51–67.
Valentin, J.L., André, D.L., Jacob, S.A., 1987. Hydrobiology inthe Cabo Frio (Brazil) upwelling: two dimensional structureand variability during a wind cycle. Continental Shelf Res. 7,77–88.
Vasconcellos, M., 2000. Ecosystems impacts of fishing foragefishes: an analysis of harvest strategies for the Braziliansardine. Resource Management and Environmental Studies.Ph.D. Thesis, University of British Columbia, Vancouver,Canada.
Vasconcellos, M., Gasalla, M.A., 2001. Fisheries catches and thecarrying capacity of marine ecosystems of South Brazil. Fish.Res. 50, 279–295.
Vazzoler, G., 1975. Distribuição da fauna de peixes demersais eecologia dos Sciaenedae da plataforma continental brasileiraentre as latitudes 29◦21′S (Torres) e 34◦44′S Chui. Bolm. Inst.Oceanogr. São Paulo 24, 85–169.
Vazzoler, A.E.A de M., 1991. Sıntese-dos conhecimentos sobre abiologia da corvina, Micropogonias furnieri (Desmarest, 1823),da costa do Brasil. Atlantica, Rio Grande 13 (1):55–74.
306 M.A. Gasalla, C.L.D.B. Rossi-Wongtschowski / Ecological Modelling 172 (2004) 283–306
Vazzoler, A.E.M., Soares, L.S.H., Cunningham, P.T.M., 1999.Ictiofauna da costa brasileira. In: Lowe-McConnell, R.H. (Ed.),Estudos Ecológicos de Comunidades de Peixes Tropicais,Editora da Universidade de São Paulo, São Paulo, Brasil,pp. 424–521.
Vieira, P.J.C., 1990. Biologia Populacional deCynoscion striatus(Pisces: Sciaenidae) no Litoral sul do Brasil. MSc Thesis,University of Rio Grande, Brazil.
Vega-Perez, L.A., 1993. Estudo do zooplancton da região deUbatuba, Estado de São Paulo. Publção Esp. Inst. Oceanogr.S. Paulo 10, 65–84.
Vilela, M.J., 1990. Idade, Crescimento, Alimentação e Avaliação doEstoque de Bonito ListadoKatsuwonus pelamis(Scombridae:Thunnini) Explotado na Região Sudeste-Sul do Brasil. MScThesis, University of Rio Grande, Brazil.
Vooren, C.M., Brusque, L.F., 1999. As aves do ambiente costeirodo Brasil: biodiversidade e conservação. Programa Nacional daDiversidade Biológica/Laboratório de Elasmobranquios e AvesMarinhas, Fundação Universidade do Rio Grande, Rio Grande(RS), Brasil, 139 pp.
Wakabara, Y., Kawakami de Resende, E., Tararan, A.S., 1982.Amphipods as one of main food components of threePleuronectiformes from the continental shelf of south Braziland North Uruguay. Mar. Biol. 68, 67–70.
Walker, P.A., 1996. Sensitive skates or resilient rays? Spatial andtemporal shifts in ray species composition in the Central andNW North Sea. ICES C.M. 1996/Mini 4, 1–11.
Walsh, J.J., 1981. A carbon budget for overfishing off Peru. Nature290, 300–304.
Walters, C., Christensen, V., Pauly, D., 1997. Structuring dynamicmodels of exploited ecosystems from trophic mass-balancemodels of marine ecosystems. Rev. Fish. Biol. Fish. 7 (2),139–172.
Waring, G.T., 1984. Age, growth and mortality of skates off thenortheast coast of the United States. Trans. Am. Fish. Soc. 113,314–321.
Winik, S., Carneiro, M.H., 1999. Hábitos alimentares deOligoplites saliensna região de Cananéia. Abstracts of the XIIIEncontro Brasileiro de Ictiologia, Universidade Federal de SãoCarlos.
Copyright © 2022 FDOKUMEN