Factors Controlling Sediment and Phosphorus Export from Two Belgian Agricultural Catchments
Upload
independentCategory
view
0download
0
Estuarine, Coastal and Shelf Science (2000) 51, 637–649doi.10.1006/ecss.2000.0703, available online at http://www.idealibrary.com on
The Meiobenthos of Subtidal Sandbanks on theBelgian Continental Shelf (Southern Bight of theNorth Sea)
J. Vanaverbekea, T. Gheskiere and M. Vincx
Marine Biology Section, Department of Biology, University of Gent, K.L. Ledeganckstraat 35, B-9000 Gent,Belgium
Received 18 April 2000 and accepted in revised form 28 August 2000
The Belgian Continental Shelf (BCS) is characterized by a set of isolated subtidal sandbank systems, which greatlyincrease the habitat heterogeneity of the area. The meiobenthos of these sandbanks was investigated during 1997 and1998. In total, 10 sandbanks have been sampled, belonging to three different geographically isolated systems: the FlemishBanks, the Hinder Banks and the Zeeland Banks. No obvious differences in sedimentological characteristics between thesandbanks were found, but biologically some differences could be detected. The more offshore Hinder Banks had themost diverse meiobenthos, while the Flemish Banks harboured the lowest number of meiobenthic taxa. Seasonal andregional differences in terms of densities are a result of a coupling with the primary production in the water column, withOctober showing highest densities and the offshore Hinder Banks harbouring lowest densities. The meiobenthos on thesandbanks was less dense (450–500 ind. 10 cm�2) than that in the deeper channels between the sandbanks(1250–1600 ind. 10 cm�2). These differences were attributed to high hydrodynamic stress around the sandbanks,preventing phytoplankton from reaching the sandbanks. Moreover, higher current speed above the sediment increases therisk for the meiobenthos of being eroded or suspended during storms.
Four different communities could be identified. These did not reflect the geographical position on the BCS but seemto be influenced by local differences in sedimentological characteristics within sandbanks and sandbank systems. Thesesedimentological differences influenced the taxon diversity as well. Sediment preferences for less abundant taxa wereinvestigated in several ways, and results indicated that sediments with a median grain-size were poor in terms of densitiesand number of taxa, while coarser sediments were richer in taxon diversity. Sediments with a median grain-size between300–450 �m were rich both in terms of diversity and density, while sediments with a median grain-size of >450 �m stillshowed high diversity, but lower densities. � 2000 Academic Press
Keywords: meiobenthos; sandbanks; North Sea; sediment
aCorresponding author: E-mail: [email protected]
Introduction
The Belgian Continental Shelf (BCS), situated in theSouthern Bight of the North Sea is characterized bythe presence of four sandbank systems: the CoastalBanks, the Flemish Banks, the Zeeland Banks and theHinder Banks. These sandbanks form a geologicallyunique area and they are important for both marineand seabird life since they act as internationallyimportant resting and foraging areas for variousseabird species (Skov et al., 1995), feeding onsmall pelagic fish and macrobenthos (Degraer et al.1999; Skov et al., 1995). The rich marine and birdlife makes them suitable for designation as marineprotected areas, as already recognized in otherareas (e.g. the Baltic Sea; Andrulewicz & Wielgat,1999).
0272–7714/00/110637+13 $35.00/0
The sandbanks on the BCS are built up recentlyand therefore a continuous interaction between watermovement, sediment transport and sediment mor-phology is required to keep the sandbanks in position(Van de Meene & Stolk, 1993). Indeed, the positionof the sandbanks does not change on a human timescale (Van Cauwenberghe, 1971; Vannieuwenborgh,1982), but regular changes in the topography of thecrest of the sandbanks do occur (Seys et al., 1993).Superimposed bedforms, ranging from small to largedunes, migrate over the sandbank, and the directionof migration changes over relatively short timeintervals (Trenteseaux, 1993; Houthuys et al., 1994;Lanckneus et al., 1994). From a study on theMiddelkerkebank (Houthuys et al., 1994), it hasbecome clear that even storm events and high wind-speeds affect the presence, size and shape of thedunes, even if the depth of the tops of the large dunesexceeds 15 m. The same study indicated a much less
� 2000 Academic Press
638 J. Vanaverbeke et al.
regular distribution of sand grains along the sandbankafter a storm passed by.
These geological settings indicate that life on asandbank is different from life in ‘ regular ’ seabeds,especially for organisms living in the sediment. Sur-prisingly, the benthos of the sandbanks is poorly inves-tigated, and for the meiobenthos only three studies areavailable (Willems et al., 1982; Vincx, 1990; Vincxet al., 1990), and all of them addressed the samesandbank (Kwintebank). This study was thereforedesigned in order to get information about the meio-benthos inhabiting these highly dynamic sandbanksediments. It aims at: (1) presenting the first data ondensities and composition of meiobenthic communi-
ties on subtidal sandbanks: (2) explaining differencesin densities of the meiobenthos and dominant taxaand diversity patterns between different sandbank sys-tems; and (3) comparing meiobenthic densities withsurrounding sediments in deeper channels.
Materials and methods
51.18
3.09
51.63N
2.64
51.27
51.36
51.45
51.54
32.912.822.73
NoordhinderOosthinder
Bligh Bank
Zeeland Banks
Thornton Bank
Hinder Banks
WesthinderGootebank
Flemish Banks
Middelkerkebank
Oostendebank
Oostende
Zeebrugge
Nieuwpoort
Kwintebank
Oostdijck
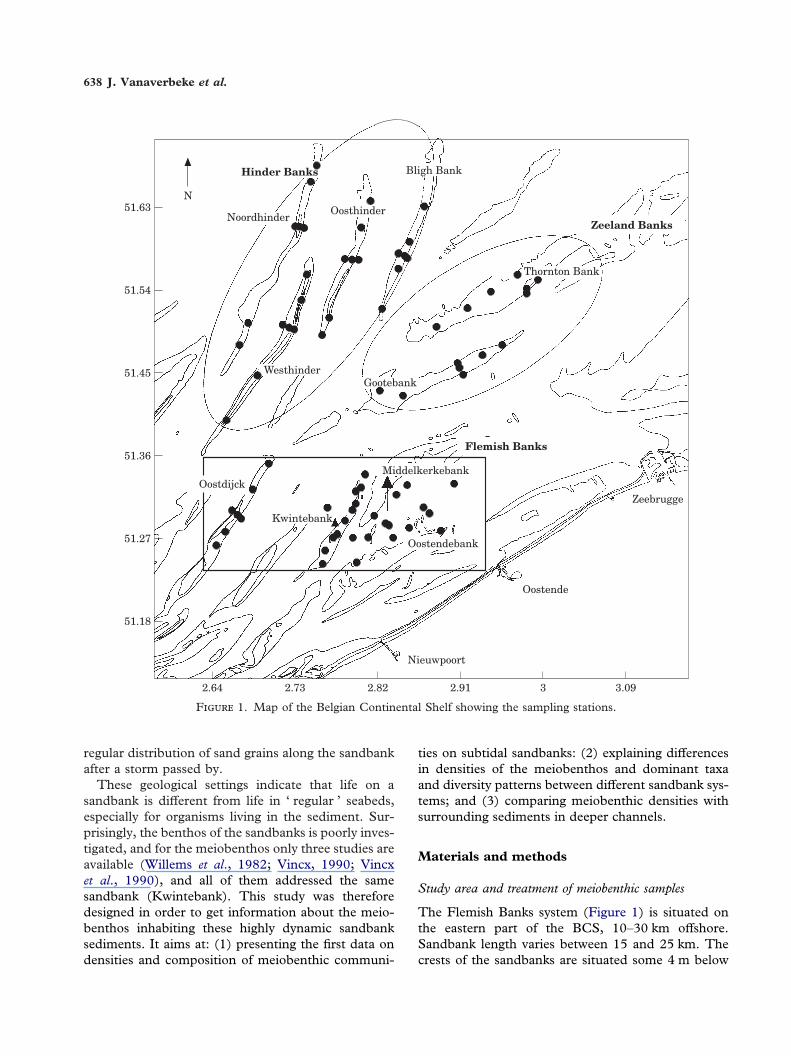
F 1. Map of the Belgian Continental Shelf showing the sampling stations.
Study area and treatment of meiobenthic samples
The Flemish Banks system (Figure 1) is situated onthe eastern part of the BCS, 10–30 km offshore.Sandbank length varies between 15 and 25 km. Thecrests of the sandbanks are situated some 4 m below
Meiobenthos of subtidal sandbanks 639
MLLWS (Maes et al., 2000). Four sandbanks weresampled: the Kwintebank (February 1997), theMiddelkerkebank, the Oostendebank (October 1997)and the Oostdijck (February 1998).
The Zeeland Banks are situated further offshore(15–30 km) and are orientated parallel to the coast-line. Almost all of the sandbanks have crests belowthe 10-m depth line (Maes et al., 2000). Here, theThornton Bank and the Gootebank were sampled inboth February and October 1998.
The Hinder Banks are situated in the deepest partof the BCS. Distance to the coastline is 35–60 km.Again, the crests of the sandbanks are situated wellbelow the 10-m depth line (Maes et al., 2000). TheWesthinder and Oosthinder were visited in October1997, while samples from the Noordhinder and BlighBank were obtained in both February and October1998.
On most of the sandbanks, seven stations weresampled, using a modified Reineck boxcorer. Fivestations were situated at regular distances along thecrest of the sandbank, while two additional stationswere situated on the sides of the bank. Onthe Kwintebank, 10 stations along the top of thesandbank were sampled, corresponding with thestations listed in Willems et al. (1982). Sincethe Oostendebank is a rather small sandbank, only sixstations were sampled (four along the crest and two onthe flanks of the bank). The Reineck boxcorer wasdeployed three times per station. From each boxcorer,one subsample for the meiobenthos was taken with aplastic core (10 cm2), and fixed with a hot (70 �C),neutral formaldehyde tap-water solution (4%).Another core was used to collect sediment forsediment analysis. Metazoan meiobenthic organismswere extracted from the sediment by centrifugationwith Ludox (Heip et al., 1985). Macrofauna wasexcluded by means of a 1-mm sieve. All animalsretained on a 38 �m sieve were stained with RoseBengal, counted and identified to the taxon level(Phylum, Class, Subclass or Order).
Sediment analysis was performed using a CoulterLS100 Particle Size Analyser. Sediment fractions upto 1000 �m are expressed as volume percentages,while the fractions between 1000–2000 �m and>2000 �m are mass percentages. Sediment fractionsare defined according to the Wentworth scale(Buchanan, 1984).
Multivariate analysis
In order to compare the densities of all meiobenthosand the dominant taxa (Nematoda, Harpacticoida,Polychaeta and Turbellaria) between sandbanks,
ANOVAs were performed on log (x+l) transformeddata in order to meet the assumptions for ANOVA.Since not all sandbanks were sampled twice in thesame year or in the same season, different datasetswere subjected to the analyses. The sandbankswhich were visited twice in one year (Bligh Bank,Noordhinder, Thornton Bank and Gootebank), wereincluded in a first analysis to test the effect of bothtime and geographical position. Differences betweenthe other sandbanks were tested within one samplingperiod. When overall significant differences weredetected, sandbanks were compared pairwise usingthe planned comparison option in STATISTICA.
The meiobenthic community composition wasanalysed by means of TWINSPAN (Hill, 1979a).Only meiobenthic groups occurring in all stations(Nematoda, Harpacticoida, Polychaeta, Turbellaria,Ostracoda, Tardigrada, Acari, Gastrotricha and nau-plii) were included in the dataset (cutlevels: 0, 1, 3,10, 35, 200). A Detrended Correspondence Analysis(DCA, Hill, 1979b) on fourth root transformed datawas applied in order to confirm the patterns detectedby the TWINSPAN analysis.
Sediment preferences
For all organism groups, occurrence within a possiblylimited sediment grain size range was investigated byplotting the abundance data originating from all sand-banks vs median grain-size. Densities and number ofobservations within a certain median grain size rangethen give a first indication of possible sedimentprefences. Differences in densities were tested usingANOVA on log (x+l) transformed data. When trans-formation was not sufficient to meet the assumptionsfor ANOVA, the non-parametric Kruskal-Wallis testwas applied. When densities were significantly differ-ent, pairwise comparisons between sediment classeswere made using the planned comparison option inANOVA (parametric data), or multiple comparisonswere made (non-parametric data) (Conover, 1971).However, since most of the stations had a mediangrain-size range of about 350 �m, the highest numberof observations for all taxa falls close to this value.Therefore, the sediment fraction between 200 and550 �m was divided in 7 classes with a width of 50 �m(e.g. class 1: 200–250 �m, class 2: 250–300 �m, . . .;class 7: 500–550 �m). In order to exclude the fact thatmost stations have sediments with a median grain-sizearound 350 �m, the data were transformed accordingto Vanreusel (1991):
640 J. Vanaverbeke et al.
T
1.S
umm
ary
ofm
ain
vari
able
spe
rsa
ndba
nk:
mea
nva
lues
per
sand
bank
,ra
nge
betw
een
brac
kets
San
dban
kS
ampl
ing
mon
thM
edia
ngr
ain
size
(�m
)M
eiob
enth
os(i
nd10
cm�
2)
Nem
atod
a(i
nd10
cm�
2)
Har
pact
icoi
da(i
nd10
cm�
2)
Pol
ycha
eta
(ind
10cm
�2)
Tur
bella
ria
(ind
10cm
�2)
Kw
inte
bank
Feb
ruar
y21
4–52
742
7(1
06–2
244)
357
(84–
2232
)42
(0–4
57)
3(0
–10)
16(3
–60)
Mid
delk
erke
bank
Oct
ober
204–
425
856
(161
–270
7)78
5(1
21–2
663)
41(1
3–88
)1
(0–3
)23
(9–5
5)O
oste
ndeb
ank
Oct
ober
215–
340
215
(97–
442)
165
(79–
386)
10(1
–15)
1(0
–2)
37(1
5–62
)O
ostd
ijck
Oct
ober
323–
486
333
(151
–467
)13
8(5
5–31
1)13
9(4
4–24
5)4
(2–1
3)15
(0–2
6)B
ligh
Ban
kF
ebru
ary
127
(318
–407
)27
1(1
48–4
34)
127
(72–
246)
87(4
5–10
1)3
(0–1
0)15
(7–3
1)B
ligh
Ban
kO
ctob
er33
0–43
054
9(4
01–9
68)
209
(154
–509
)20
5(1
19–5
62)
7(1
–6)
16(9
–19)
Noo
rdhi
nder
Feb
ruar
y32
0–41
237
9(2
46–4
71)
210
(92–
290)
106
(68–
177)
11(8
–16)
12(4
–28)
Noo
rdhi
nder
Oct
ober
338–
381
606
(446
–729
)28
5(1
98–4
36)
224
(125
–340
)18
(6–3
0)24
(15–
28)
Oos
thin
der
Oct
ober
316–
531
629
(453
–787
)39
6(2
33–6
66)
150
(78–
253)
12(7
–17)
43(2
0–89
)W
esth
inde
rO
ctob
er30
5–54
550
8(2
66–7
27)
227
(87–
348)
187
(109
–356
)11
(5–2
4)32
(20–
49)
Tho
rnto
nB
ank
Feb
ruar
y31
3–47
836
1(2
79–5
86)
187
(107
–354
)10
4(6
3–14
6)9
(3–1
8)27
(15–
38)
Tho
rnto
nB
ank
Oct
ober
291–
400
523
(332
–932
)26
6(1
52–4
92)
160
(72–
356)
9(3
–21)
52(2
8–89
)G
oote
bank
Feb
ruar
y30
1–40
040
1(1
53–1
192)
243
(90–
472)
178
(24–
602)
3(0
–5)
36(9
–98)
Goo
teba
nkO
ctob
er29
8–36
253
7(4
10–6
86)
315
(211
–389
)14
7(8
0–23
6)4
(0–5
)51
(34–
70)
Meiobenthos of subtidal sandbanks 641
5
15
Mea
n n
o. t
axa
per
stat
ion
14131211109876
BBO BBF NHO NHF OH WH
5
15
Mea
n n
o. t
axa
per
stat
ion
14131211109876
GOO GOF ThO ThF
5
15
Mea
n n
o. t
axa
per
stat
ion
14131211109876
KW MID OD Oost
(c)
(b)
(a)
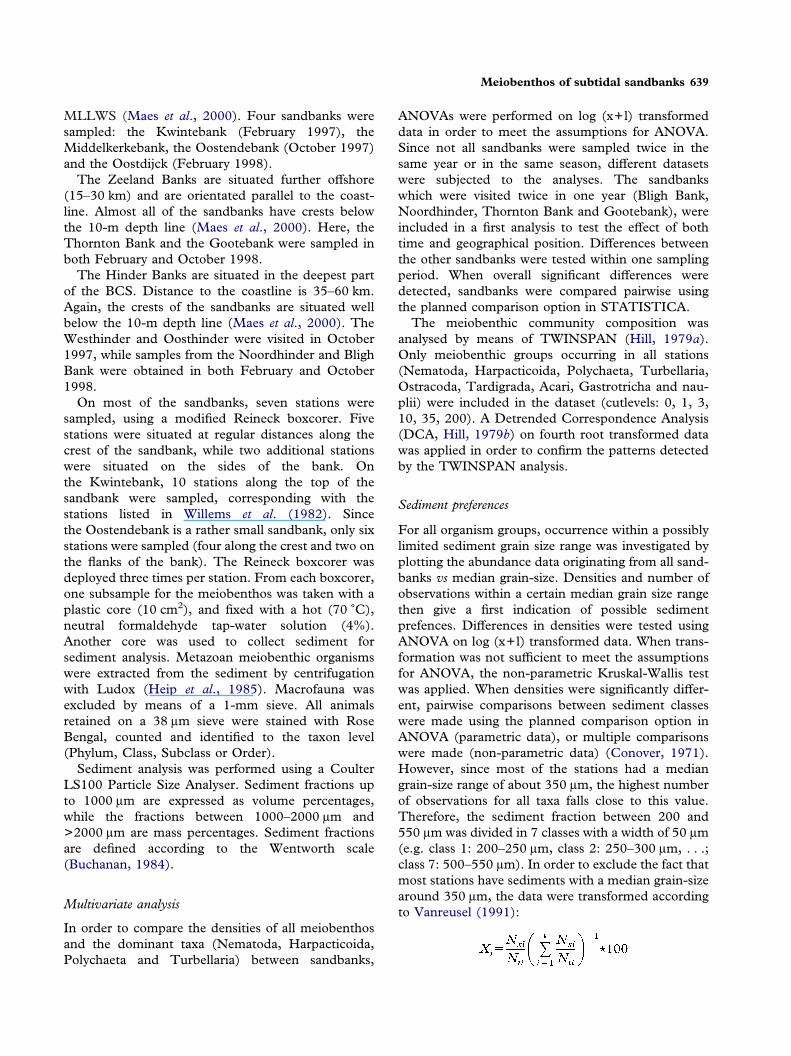
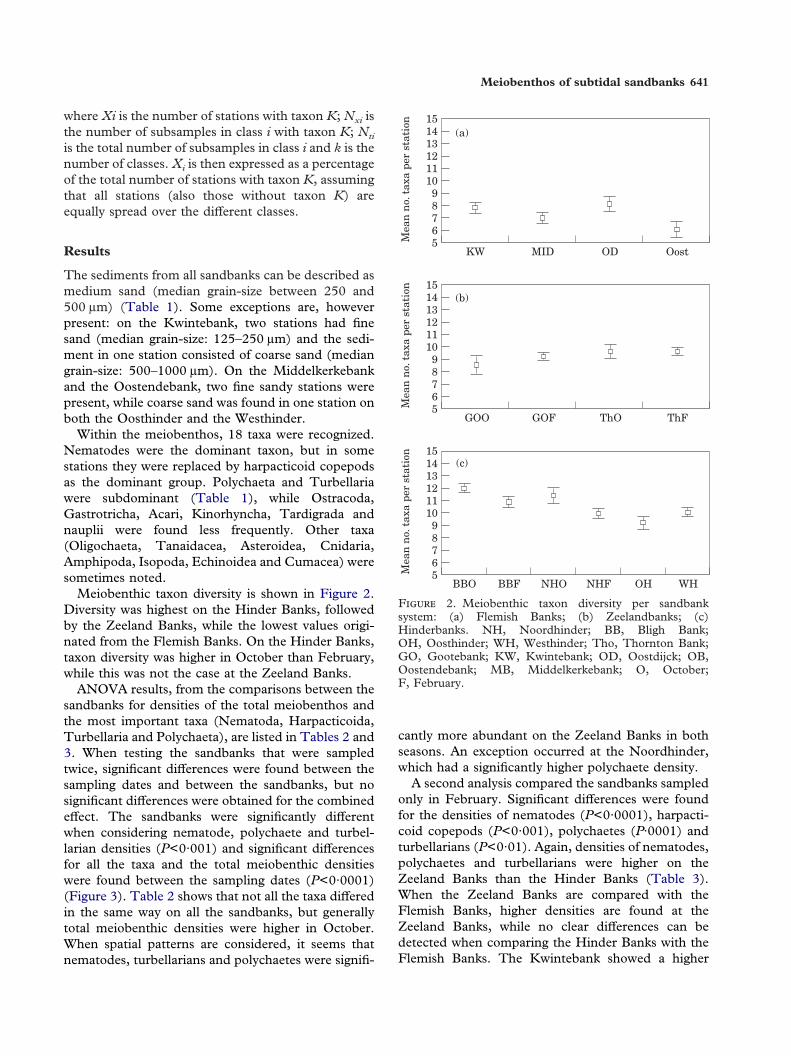
F 2. Meiobenthic taxon diversity per sandbanksystem: (a) Flemish Banks; (b) Zeelandbanks; (c)Hinderbanks. NH, Noordhinder; BB, Bligh Bank;OH, Oosthinder; WH, Westhinder; Tho, Thornton Bank;GO, Gootebank; KW, Kwintebank; OD, Oostdijck; OB,Oostendebank; MB, Middelkerkebank; O, October;F, February.
where Xi is the number of stations with taxon K; Nxi isthe number of subsamples in class i with taxon K; Nti
is the total number of subsamples in class i and k is thenumber of classes. Xi is then expressed as a percentageof the total number of stations with taxon K, assumingthat all stations (also those without taxon K) areequally spread over the different classes.
Results
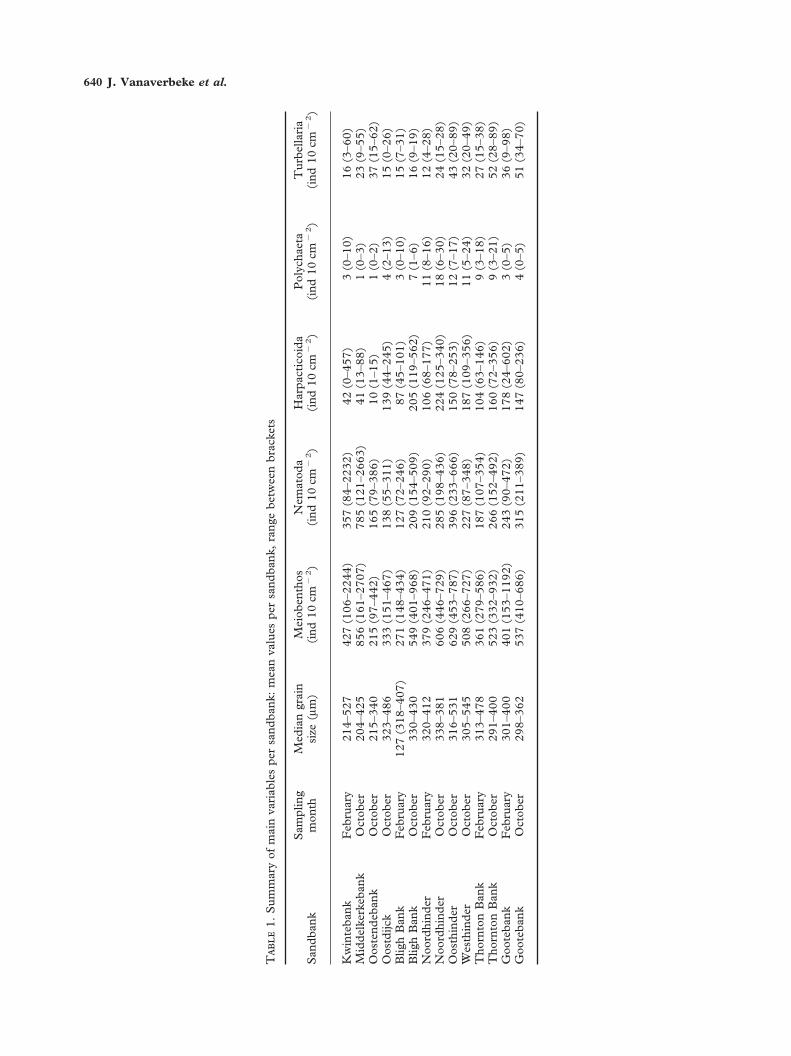
The sediments from all sandbanks can be described asmedium sand (median grain-size between 250 and500 �m) (Table 1). Some exceptions are, howeverpresent: on the Kwintebank, two stations had finesand (median grain-size: 125–250 �m) and the sedi-ment in one station consisted of coarse sand (mediangrain-size: 500–1000 �m). On the Middelkerkebankand the Oostendebank, two fine sandy stations werepresent, while coarse sand was found in one station onboth the Oosthinder and the Westhinder.
Within the meiobenthos, 18 taxa were recognized.Nematodes were the dominant taxon, but in somestations they were replaced by harpacticoid copepodsas the dominant group. Polychaeta and Turbellariawere subdominant (Table 1), while Ostracoda,Gastrotricha, Acari, Kinorhyncha, Tardigrada andnauplii were found less frequently. Other taxa(Oligochaeta, Tanaidacea, Asteroidea, Cnidaria,Amphipoda, Isopoda, Echinoidea and Cumacea) weresometimes noted.
Meiobenthic taxon diversity is shown in Figure 2.Diversity was highest on the Hinder Banks, followedby the Zeeland Banks, while the lowest values origi-nated from the Flemish Banks. On the Hinder Banks,taxon diversity was higher in October than February,while this was not the case at the Zeeland Banks.
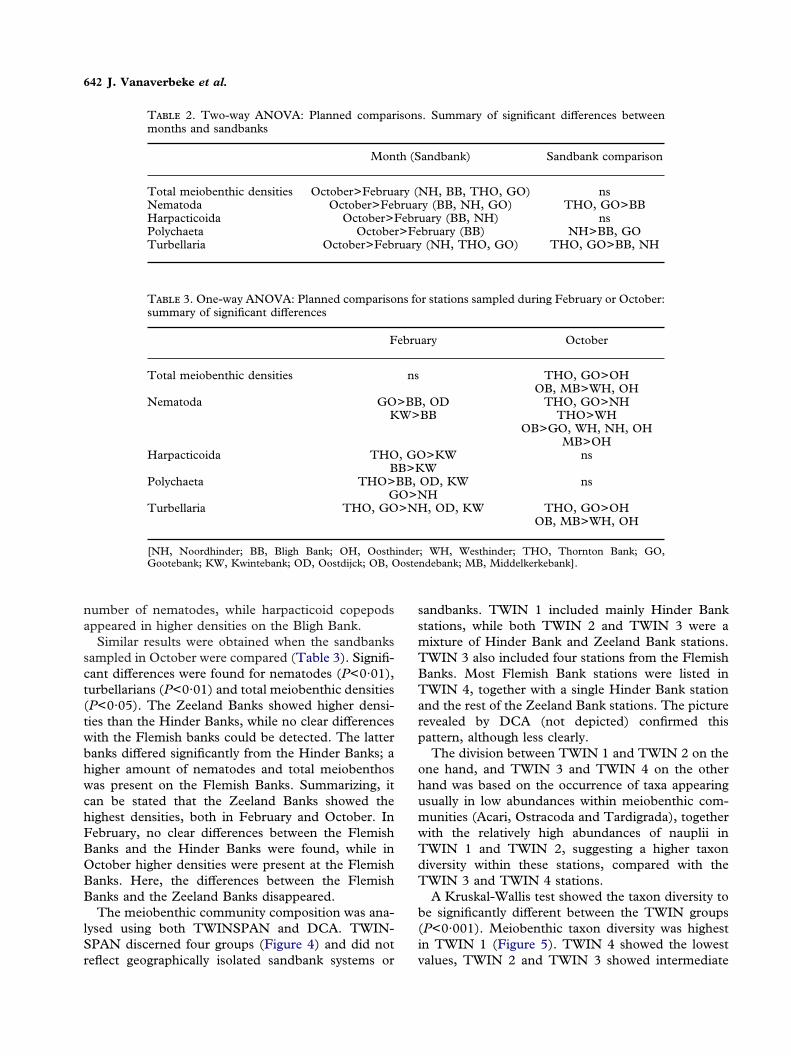
ANOVA results, from the comparisons between thesandbanks for densities of the total meiobenthos andthe most important taxa (Nematoda, Harpacticoida,Turbellaria and Polychaeta), are listed in Tables 2 and3. When testing the sandbanks that were sampledtwice, significant differences were found between thesampling dates and between the sandbanks, but nosignificant differences were obtained for the combinedeffect. The sandbanks were significantly differentwhen considering nematode, polychaete and turbel-larian densities (P<0·001) and significant differencesfor all the taxa and the total meiobenthic densitieswere found between the sampling dates (P<0·0001)(Figure 3). Table 2 shows that not all the taxa differedin the same way on all the sandbanks, but generallytotal meiobenthic densities were higher in October.When spatial patterns are considered, it seems thatnematodes, turbellarians and polychaetes were signifi-
cantly more abundant on the Zeeland Banks in bothseasons. An exception occurred at the Noordhinder,which had a significantly higher polychaete density.
A second analysis compared the sandbanks sampledonly in February. Significant differences were foundfor the densities of nematodes (P<0·0001), harpacti-coid copepods (P<0·001), polychaetes (P·0001) andturbellarians (P<0·01). Again, densities of nematodes,polychaetes and turbellarians were higher on theZeeland Banks than the Hinder Banks (Table 3).When the Zeeland Banks are compared with theFlemish Banks, higher densities are found at theZeeland Banks, while no clear differences can bedetected when comparing the Hinder Banks with theFlemish Banks. The Kwintebank showed a higher
642 J. Vanaverbeke et al.
T 2. Two-way ANOVA: Planned comparisons. Summary of significant differences betweenmonths and sandbanks
Month (Sandbank) Sandbank comparison
Total meiobenthic densities October>February (NH, BB, THO, GO) nsNematoda October>February (BB, NH, GO) THO, GO>BBHarpacticoida October>February (BB, NH) nsPolychaeta October>February (BB) NH>BB, GOTurbellaria October>February (NH, THO, GO) THO, GO>BB, NH
T 3. One-way ANOVA: Planned comparisons for stations sampled during February or October:summary of significant differences
February October
Total meiobenthic densities ns THO, GO>OHOB, MB>WH, OH
Nematoda GO>BB, OD THO, GO>NHKW>BB THO>WH
OB>GO, WH, NH, OHMB>OH
Harpacticoida THO, GO>KW nsBB>KW
Polychaeta THO>BB, OD, KW nsGO>NH
Turbellaria THO, GO>NH, OD, KW THO, GO>OHOB, MB>WH, OH
[NH, Noordhinder; BB, Bligh Bank; OH, Oosthinder; WH, Westhinder; THO, Thornton Bank; GO,Gootebank; KW, Kwintebank; OD, Oostdijck; OB, Oostendebank; MB, Middelkerkebank].
number of nematodes, while harpacticoid copepodsappeared in higher densities on the Bligh Bank.
Similar results were obtained when the sandbankssampled in October were compared (Table 3). Signifi-cant differences were found for nematodes (P<0·01),turbellarians (P<0·01) and total meiobenthic densities(P<0·05). The Zeeland Banks showed higher densi-ties than the Hinder Banks, while no clear differenceswith the Flemish banks could be detected. The latterbanks differed significantly from the Hinder Banks; ahigher amount of nematodes and total meiobenthoswas present on the Flemish Banks. Summarizing, itcan be stated that the Zeeland Banks showed thehighest densities, both in February and October. InFebruary, no clear differences between the FlemishBanks and the Hinder Banks were found, while inOctober higher densities were present at the FlemishBanks. Here, the differences between the FlemishBanks and the Zeeland Banks disappeared.
The meiobenthic community composition was ana-lysed using both TWINSPAN and DCA. TWIN-SPAN discerned four groups (Figure 4) and did notreflect geographically isolated sandbank systems or
sandbanks. TWIN 1 included mainly Hinder Bankstations, while both TWIN 2 and TWIN 3 were amixture of Hinder Bank and Zeeland Bank stations.TWIN 3 also included four stations from the FlemishBanks. Most Flemish Bank stations were listed inTWIN 4, together with a single Hinder Bank stationand the rest of the Zeeland Bank stations. The picturerevealed by DCA (not depicted) confirmed thispattern, although less clearly.
The division between TWIN 1 and TWIN 2 on theone hand, and TWIN 3 and TWIN 4 on the otherhand was based on the occurrence of taxa appearingusually in low abundances within meiobenthic com-munities (Acari, Ostracoda and Tardigrada), togetherwith the relatively high abundances of nauplii inTWIN 1 and TWIN 2, suggesting a higher taxondiversity within these stations, compared with theTWIN 3 and TWIN 4 stations.
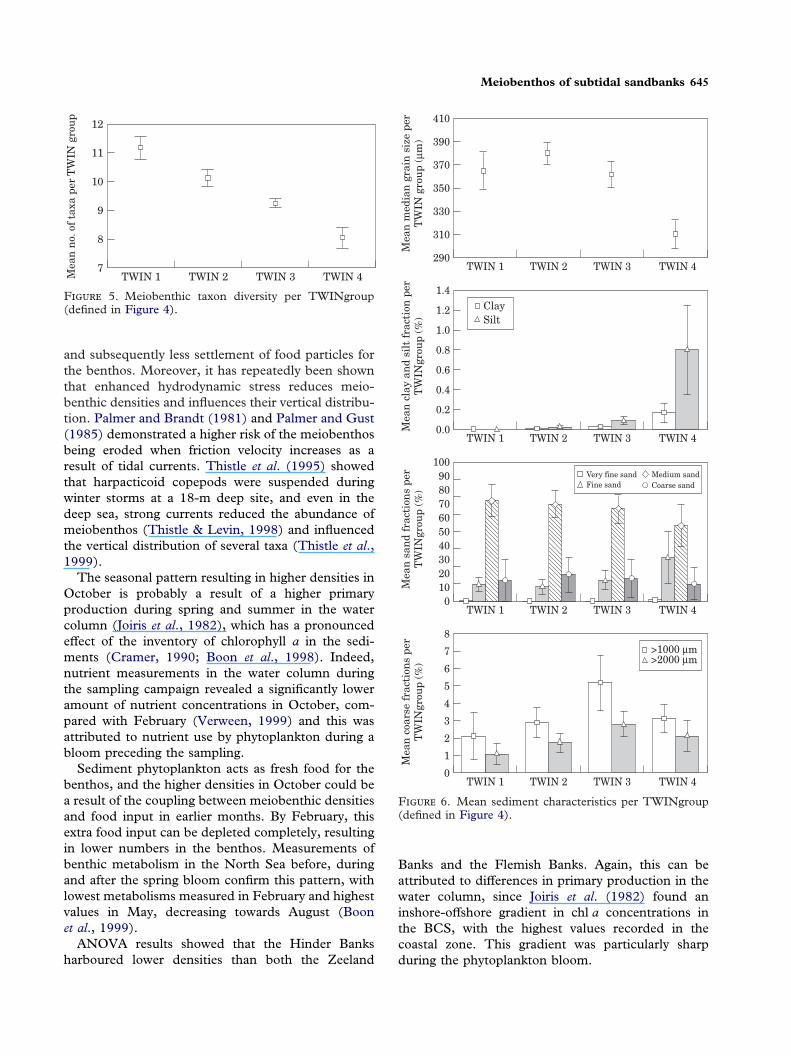
A Kruskal-Wallis test showed the taxon diversity tobe significantly different between the TWIN groups(P<0·001). Meiobenthic taxon diversity was highestin TWIN 1 (Figure 5). TWIN 4 showed the lowestvalues, TWIN 2 and TWIN 3 showed intermediate
Meiobenthos of subtidal sandbanks 643
Discussion
0BlbaO
70
Sandbank
(b)
Mea
n d
ensi
ty (
ind
10 c
m–2
)
BlbaFNHONHFGOOGOFThoOThoF
0BlbaO
800
Sandbank
(a)
Mea
n d
ensi
ty (
ind
10 c
m–2
)
BlbaFNHONHFGOOGOFThoOThoF
60
50
40
30
20
10
100
200
300
400
500
600
700
F 3. Mean densities per sandbank and per samplingperiod. ThoF, Thornton Bank February; ThoO, ThorntonBank October; GOF, Gootebank February; GOO,Gootebank October; NHF, Noordhinder February; NHO,Noordhinder October; BlbaF, Bligh Bank February;BlbaO, Bligh Bank October. (a) Total meiobenthos, ( );Nematoda ( ); and Harpacticoida ( ). (b) Polychaeta( ); and Turbellaria ( ).
Meiobenthic densities
Based on sedimentological characteristics, no obviousdifferences between the sandbank systems can befound. However, these systems are different from abiological point of view. Taxon diversity was clearlyhigher on the Hinder Banks followed by the ZeelandBanks, and lowest diversity was found on the FlemishBanks. The higher diversity on the offshore banks wasdue to regular findings of taxa such as Kinorhyncha,Acari, Gastrotricha, Asteroidea, Echinoidea, Tardi-grada and Hydrozoa. These taxa were not found onthe Flemish Banks and only sporadically on theZeeland Banks. The macrobenthic fauna from thesame area showed a completely different picture(Coenjaerts, 1997). The highest diversity was foundon the Gootebank, followed by a Flemish Bank(Buiten Ratel), and lowest diversity values wereobtained on the Westhinder. Coenjaerts (1997) how-ever, doubted the reliability of these results. Sampleswere sieved alive, on board the research vessel, using a1-mm sieve and interstitial polychaetes escaped
values. Mean median grain-size per TWIN group waslowest in TWIN 4 (Figure 6) and highest in TWIN 2,while TWIN 1 and 3 had comparable intermediatevalues. Although the amount of clay and silt wasalways lower than 1%, it was clear that the amount offine particles was higher in the stations belonging toTWIN 4. Differences in sand fractions between theTWIN groups are less obvious. Medium sand domi-nated the sand fraction in all the TWIN groups, withcomparable values in TWIN 1 to 3, and lower per-centages at TWIN 4. Here, the amount of fine sandwas higher compared with the other groups. Therelative amount of coarse sand fractions increasedfrom TWIN 1 to TWIN 3, while in TWIN 4 stationsthese sediment fractions appear in comparableamounts to TWIN 2.
Since the division of the TWIN groups was merelybased on the occurrence of less abundant taxa, poss-
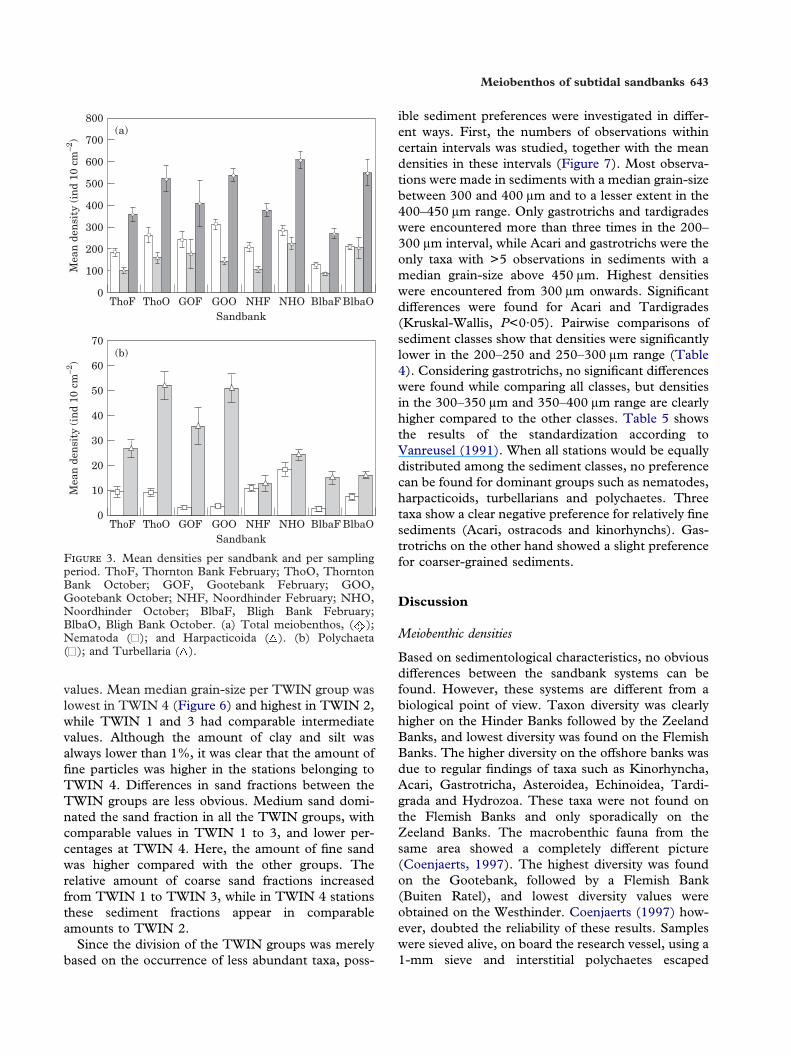
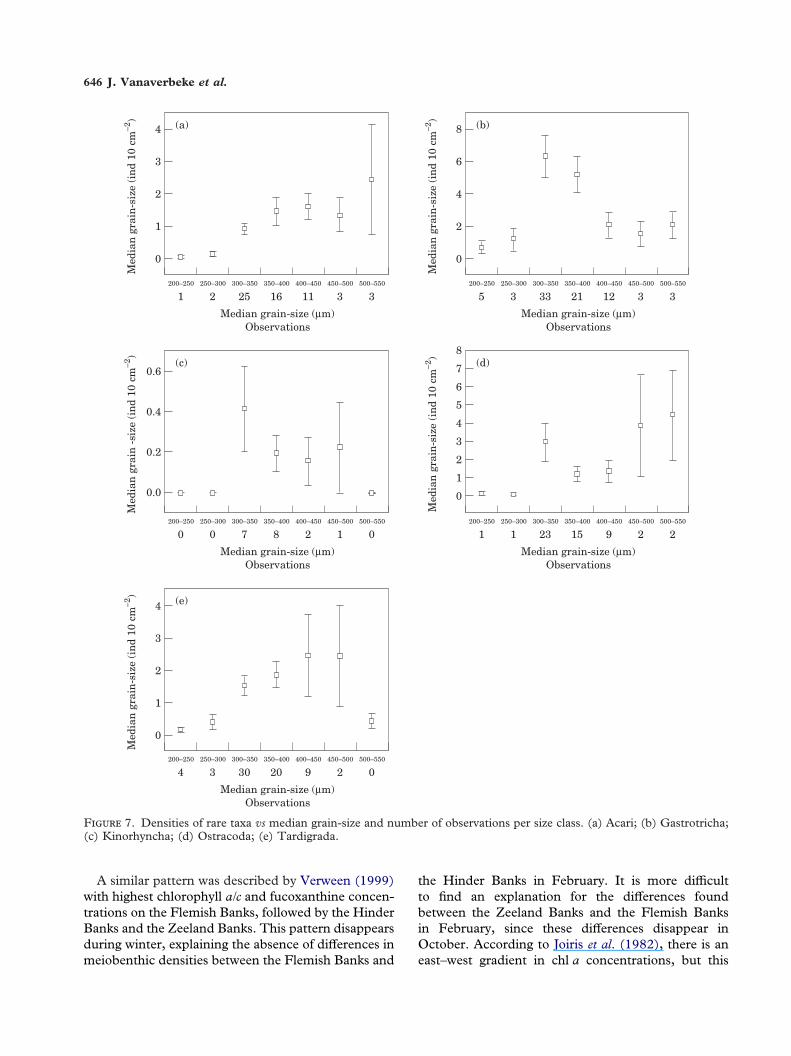
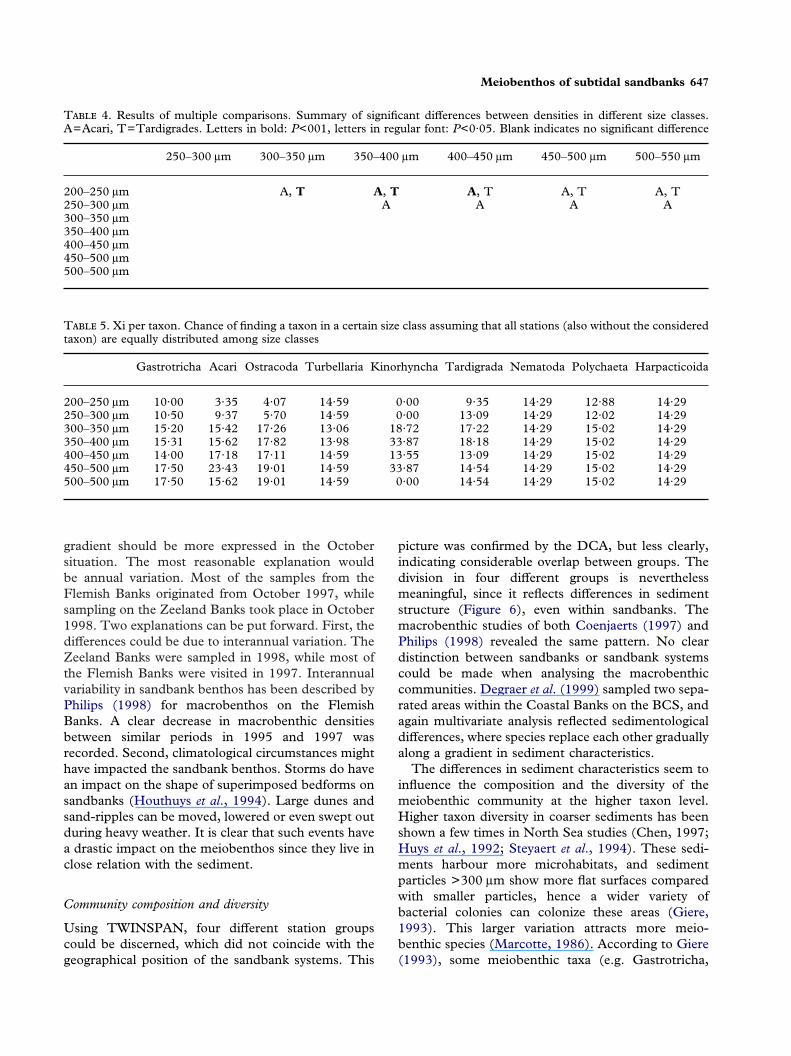
ible sediment preferences were investigated in differ-ent ways. First, the numbers of observations withincertain intervals was studied, together with the meandensities in these intervals (Figure 7). Most observa-tions were made in sediments with a median grain-sizebetween 300 and 400 �m and to a lesser extent in the400–450 �m range. Only gastrotrichs and tardigradeswere encountered more than three times in the 200–300 �m interval, while Acari and gastrotrichs were theonly taxa with >5 observations in sediments with amedian grain-size above 450 �m. Highest densitieswere encountered from 300 �m onwards. Significantdifferences were found for Acari and Tardigrades(Kruskal-Wallis, P<0·05). Pairwise comparisons ofsediment classes show that densities were significantlylower in the 200–250 and 250–300 �m range (Table4). Considering gastrotrichs, no significant differenceswere found while comparing all classes, but densitiesin the 300–350 �m and 350–400 �m range are clearlyhigher compared to the other classes. Table 5 showsthe results of the standardization according toVanreusel (1991). When all stations would be equallydistributed among the sediment classes, no preferencecan be found for dominant groups such as nematodes,harpacticoids, turbellarians and polychaetes. Threetaxa show a clear negative preference for relatively finesediments (Acari, ostracods and kinorhynchs). Gas-trotrichs on the other hand showed a slight preferencefor coarser-grained sediments.

644 J. Vanaverbeke et al.
Bligh Bank October: 1 stationBligh Bank February: 5 stationsNoordhinder October: 3 stationsNoordhinder February: 5 stationsOosthinder: 3 stationsWesthinder: 2 stations
TWIN 2
Thornton Bank February:5 stationsThornton Bank October:2 stationsGootebank Febraury: 1 station
Kwintebank: 1 stationOostdijck: 3 stations
Bligh Bank October: 5 stationsNoordhinder October: 3 stationsOosthinder: 1 stationWesthinder: 1 station
TWIN 1
Thornton Bank February:1 station
Oostdijck: 1 station
Bligh Bank February: 2 stationsNoordhinder October: 1 stationNoordhinder February: 2 stationsOosthinder: 3 stationsWesthinder: 4 stations
TWIN 3
Thornton Bank February:1 stationThornton Bank October:4 stationsGootebank Febraury: 4 stationsGootebank October: 4 stations
Kwintebank: 4 stationsOostdijck: 2 stations
Oosthinder: 1 station
TWIN 4
Thornton Bank February:1 stationThornton Bank October:4 stationsGootebank Febraury: 2 stationsGootebank October: 3 stations
Kwintebank: 7 stationsOostdijck: 1 stationOostendebank: 6 stationsMiddelkerkebank: 7 stations
Polychaeta (3)Acari (1)nauplii (4)
nauplii (3)Gastrotricha (4)Acari (3)Ostracoda (3)
Acari (4)Ostracoda (2)nauplii (4)Tardigrada (4)
F 4. Dendrogram with TWINSPAN results.
through the sieve, resulting in an underestimation ofthe diversity. Studies on species diversity of themeiobenthos of sandbank systems are not availableyet. Ongoing research (Vanaverbeke, unpubl. data) onnematode communities indicates that nematodediversity is highest at the Hinder Banks (Noordhinderand Bligh Bank), intermediate at the Zeeland Banks(Gootebank) and lowest on the Flemish Banks(Kwintebank). This is in agreement with the generalpicture that both nematode and copepod speciesdiversity increases when distance to the coastincreases (Vanaverbeke et al., in press).
Comparing the meiobenthic densities and commu-nity composition with other studies on sandbanks orsurrounding areas is quite difficult, since most of theinformation is buried in grey literature. Vanaverbekeet al. (in press) summarized the available literature forthe BCS. A mean meiobenthic density of �500 ind.10 cm�2 is given for the Flemish Bank area, basedon two studies (Chen, 1987; Willems et al., 1982).Values found in the present study were comparable.The extremely high values of 2244 ind. 10 cm�2 onthe Kwintebank and 2707 ind. 10 cm�2 on theMiddelkerkebank come from stations in deeper chan-nels between the sandbanks (Kwintebank) or from theside of the bank (Middelkerkebank). When these
values were excluded, a mean meiobenthic density of262 ind. 10 cm�2 on the Kwintebank and 547 ind.10 cm�2 on the Middelkerkebank can be recognized.Lower mean densities were also found on theOostendebank and the Oostdijck. No data are so faravailable from the Hinder Banks and the ZeelandBanks. Mean meiobenthic densities (calculated overall stations and both sampling periods) for theZeeland Bank are 457 ind. 10 cm�2, while for theHinder Banks this amounts to 490 ind. 10 cm�2.Similar values (200–495 ind. 10 cm�2) in coarsesands have been found by Coull (1970), Gerlach(1971) and Soyer (1971). The sandbank systems donot show much difference, but the difference from thedeeper channels between the sandbanks is striking.Mean meiobenthic densities in the channels at theFlemish Bank area are about 1250 ind. 10 cm�2, atthe Zeeland Bank area this is about 1600 ind.10 cm�2, and around the Hinder Banks some1420 ind. 10 cm�2 are reported (Vanaverbeke et al.,in press).
Although these figures are based on a limitednumber of stations, it is clear that meiobenthic densi-ties at the sandbanks are much lower. This could beexplained by sandbanks forming a highly dynamicenvironment, with relatively high hydrodynamic stress
Meiobenthos of subtidal sandbanks 645
7
12
Mea
n n
o. o
f ta
xa p
er T
WIN
gro
up
11
10
9
8
TWIN 1 TWIN 2 TWIN 3 TWIN 4
F 5. Meiobenthic taxon diversity per TWINgroup(defined in Figure 4).
Mea
n c
oars
e fr
acti
ons
per
TW
INgr
oup
(%)
Mea
n s
and
frac
tion
s pe
rT
WIN
grou
p (%
)M
ean
cla
y an
d si
lt f
ract
ion
per
TW
INgr
oup
(%)
Mea
n m
edia
n g
rain
siz
e pe
rT
WIN
gro
up
(µm
)
0
8
5
6
4
3
2
1
TWIN 3
>1000 µm
TWIN 2TWIN 1
7>2000 µm
TWIN 4
0
100
5060
40302010
TWIN 3
Very fine sand
TWIN 2TWIN 1
80 Fine sand
TWIN 4
0.0
1.4
0.8
1.0
0.6
0.4
0.2
TWIN 3
Clay
TWIN 2TWIN 1
1.2Silt
TWIN 4
290
410
350
370
330
310
TWIN 3TWIN 2TWIN 1
390
TWIN 4
90
70
Medium sandCoarse sand
F 6. Mean sediment characteristics per TWINgroup(defined in Figure 4).
and subsequently less settlement of food particles forthe benthos. Moreover, it has repeatedly been shownthat enhanced hydrodynamic stress reduces meio-benthic densities and influences their vertical distribu-tion. Palmer and Brandt (1981) and Palmer and Gust(1985) demonstrated a higher risk of the meiobenthosbeing eroded when friction velocity increases as aresult of tidal currents. Thistle et al. (1995) showedthat harpacticoid copepods were suspended duringwinter storms at a 18-m deep site, and even in thedeep sea, strong currents reduced the abundance ofmeiobenthos (Thistle & Levin, 1998) and influencedthe vertical distribution of several taxa (Thistle et al.,1999).
The seasonal pattern resulting in higher densities inOctober is probably a result of a higher primaryproduction during spring and summer in the watercolumn (Joiris et al., 1982), which has a pronouncedeffect of the inventory of chlorophyll a in the sedi-ments (Cramer, 1990; Boon et al., 1998). Indeed,nutrient measurements in the water column duringthe sampling campaign revealed a significantly loweramount of nutrient concentrations in October, com-pared with February (Verween, 1999) and this wasattributed to nutrient use by phytoplankton during abloom preceding the sampling.
Sediment phytoplankton acts as fresh food for thebenthos, and the higher densities in October could bea result of the coupling between meiobenthic densitiesand food input in earlier months. By February, thisextra food input can be depleted completely, resultingin lower numbers in the benthos. Measurements ofbenthic metabolism in the North Sea before, duringand after the spring bloom confirm this pattern, withlowest metabolisms measured in February and highestvalues in May, decreasing towards August (Boonet al., 1999).
ANOVA results showed that the Hinder Banksharboured lower densities than both the Zeeland
Banks and the Flemish Banks. Again, this can beattributed to differences in primary production in thewater column, since Joiris et al. (1982) found aninshore-offshore gradient in chl a concentrations inthe BCS, with the highest values recorded in thecoastal zone. This gradient was particularly sharpduring the phytoplankton bloom.
646 J. Vanaverbeke et al.
0
4
Median grain-size (µm)
(e)
Med
ian
gra
in-s
ize
(in
d 10
cm
–2)
2
3
200–250
4250–300
3300–350
30350–400
20400–450
9450–500
2500–550
0
Observations
0.0
0.6
Median grain-size (µm)
(c)
Med
ian
gra
in-s
ize
(in
d 10
cm
–2)
0.2
0.4
200–250
0250–300
0300–350
7350–400
8400–450
2450–500
1500–550
0
Observations
0
8
Median grain-size (µm)
(d)
Med
ian
gra
in-s
ize
(in
d 10
cm
–2)
2
5
200–250
1250–300
1300–350
23350–400
15400–450
9450–500
2500–550
2
Observations
0
4
Median grain-size (µm)
(a)M
edia
n g
rain
-siz
e (i
nd
10 c
m–2
)
1
2
200–250
1250–300
2300–350
25350–400
16400–450
11450–500
3500–550
3
Observations
0
8
Median grain-size (µm)
(b)
Med
ian
gra
in-s
ize
(in
d 10
cm
–2)
2
4
200–250
5250–300
3300–350
33350–400
21400–450
12450–500
3500–550
3
Observations
1
7
6
4
3
1
63
F 7. Densities of rare taxa vs median grain-size and number of observations per size class. (a) Acari; (b) Gastrotricha;(c) Kinorhyncha; (d) Ostracoda; (e) Tardigrada.
A similar pattern was described by Verween (1999)with highest chlorophyll a/c and fucoxanthine concen-trations on the Flemish Banks, followed by the HinderBanks and the Zeeland Banks. This pattern disappearsduring winter, explaining the absence of differences inmeiobenthic densities between the Flemish Banks and
the Hinder Banks in February. It is more difficultto find an explanation for the differences foundbetween the Zeeland Banks and the Flemish Banksin February, since these differences disappear inOctober. According to Joiris et al. (1982), there is aneast–west gradient in chl a concentrations, but this
Meiobenthos of subtidal sandbanks 647
T 4. Results of multiple comparisons. Summary of significant differences between densities in different size classes.A=Acari, T=Tardigrades. Letters in bold: P<001, letters in regular font: P<0·05. Blank indicates no significant difference
250–300 �m 300–350 �m 350–400 �m 400–450 �m 450–500 �m 500–550 �m
200–250 �m A, T A, T A, T A, T A, T250–300 �m A A A A300–350 �m350–400 �m400–450 �m450–500 �m500–500 �m
T 5. Xi per taxon. Chance of finding a taxon in a certain size class assuming that all stations (also without the consideredtaxon) are equally distributed among size classes
Gastrotricha Acari Ostracoda Turbellaria Kinorhyncha Tardigrada Nematoda Polychaeta Harpacticoida
200–250 �m 10·00 3·35 4·07 14·59 0·00 9·35 14·29 12·88 14·29250–300 �m 10·50 9·37 5·70 14·59 0·00 13·09 14·29 12·02 14·29300–350 �m 15·20 15·42 17·26 13·06 18·72 17·22 14·29 15·02 14·29350–400 �m 15·31 15·62 17·82 13·98 33·87 18·18 14·29 15·02 14·29400–450 �m 14·00 17·18 17·11 14·59 13·55 13·09 14·29 15·02 14·29450–500 �m 17·50 23·43 19·01 14·59 33·87 14·54 14·29 15·02 14·29500–500 �m 17·50 15·62 19·01 14·59 0·00 14·54 14·29 15·02 14·29
Community composition and diversity
Using TWINSPAN, four different station groupscould be discerned, which did not coincide with thegeographical position of the sandbank systems. This
picture was confirmed by the DCA, but less clearly,indicating considerable overlap between groups. Thedivision in four different groups is neverthelessmeaningful, since it reflects differences in sedimentstructure (Figure 6), even within sandbanks. Themacrobenthic studies of both Coenjaerts (1997) andPhilips (1998) revealed the same pattern. No cleardistinction between sandbanks or sandbank systemscould be made when analysing the macrobenthiccommunities. Degraer et al. (1999) sampled two sepa-rated areas within the Coastal Banks on the BCS, andagain multivariate analysis reflected sedimentologicaldifferences, where species replace each other graduallyalong a gradient in sediment characteristics.
The differences in sediment characteristics seem toinfluence the composition and the diversity of themeiobenthic community at the higher taxon level.Higher taxon diversity in coarser sediments has beenshown a few times in North Sea studies (Chen, 1997;Huys et al., 1992; Steyaert et al., 1994). These sedi-ments harbour more microhabitats, and sedimentparticles >300 �m show more flat surfaces comparedwith smaller particles, hence a wider variety ofbacterial colonies can colonize these areas (Giere,1993). This larger variation attracts more meio-benthic species (Marcotte, 1986). According to Giere(1993), some meiobenthic taxa (e.g. Gastrotricha,
gradient should be more expressed in the Octobersituation. The most reasonable explanation wouldbe annual variation. Most of the samples from theFlemish Banks originated from October 1997, whilesampling on the Zeeland Banks took place in October1998. Two explanations can be put forward. First, thedifferences could be due to interannual variation. TheZeeland Banks were sampled in 1998, while most ofthe Flemish Banks were visited in 1997. Interannualvariability in sandbank benthos has been described byPhilips (1998) for macrobenthos on the FlemishBanks. A clear decrease in macrobenthic densitiesbetween similar periods in 1995 and 1997 wasrecorded. Second, climatological circumstances mighthave impacted the sandbank benthos. Storms do havean impact on the shape of superimposed bedforms onsandbanks (Houthuys et al., 1994). Large dunes andsand-ripples can be moved, lowered or even swept outduring heavy weather. It is clear that such events havea drastic impact on the meiobenthos since they live inclose relation with the sediment.

648 J. Vanaverbeke et al.
Oligochaeta, Ostracoda and Kinorhyncha) prefercoarser sediments. This was confirmed by the presentstudy, since densities, number of observations andstandardized occurrence was low in sediments with amedian grain-size below 300 �m. The relationshipbetween meiobenthic diversity and density on sand-banks can be summarized as follows: sediment with amedian grain-size below 300 �m seemed to be low intaxon diversity, sediments with a median grain-sizebetween 300 and 400 �m showed both high densitiesand diversity, while coarser sediments contained asimilar amount of taxa but in lower densities.
This explains the low taxon diversity in TWIN 4,since median grain-size here was about 310 �m. Notonly the median grain-size affects the meiobenthicdiversity, however, since highest taxon diversity wasfound within TWIN 1, while highest median grain-size was found in TWIN 2. Moreover, TWIN 1 andTWIN 3 have comparable median grain-size values,but quite different taxon diversity. The main factorexplaining the taxon diversity on the sandbanks is thesorting of the sediment: although minor differencesbetween the distribution of the various sediment frac-tions exist, clear differences in taxon diversity dooccur. The main difference in sediment characteristicsbetween TWIN 1 and TWIN 3 is the relative amountof particles larger than 1 mm. In TWIN 1-stations,this is about 3%, while in TWIN 3, some 8% of theparticles are within this size range. This indicates thatthe general rule predicting higher taxon diversity incoarser sediments should be treated with caution.This also explains why the four TWIN groups fail toreflect the geographical position of the sandbank sys-tems: within a sandbank, minor differences betweenthe stations are very likely to exist, resulting in aclassification within another TWIN group. The distri-bution of the stations originating from one sandbankor sandbank system over the different TWIN groupstherefore reflects the sedimentological diversity of thesandbanks.
Acknowledgements
We would like to thank the master and crew from theRV Belgica for their skillful help during the sampling.Almost everybody in the Marine Biology Section ofthe University of Gent helped during the differentsampling campaigns, together with the teams from theInstitute of Nature Conservancy (Jan Seys, Jeroen VanWaeyenberge, Henk Offringa) and the KULeuven (ElGysels). Danielle Schram and Myriam Beghyn did alot of the sediment analysis. Dr Ann Vanreusel andBregje Beyst provided constructive comments onearlier versions of the manuscript. This research was
funded by Gent University (BOF, 1998-2003) andSSTC (Belgium-Sustainable Development-North SeaProject MN/DD[40-41-42]).
References
Andrulewicz, E. & Wielgat, M. 1999 Selection of southern Balticbanks—future marine protection area. Hydrobiologia 393, 271–277.
Boon, A. R., Duineveld, G. C. A., Berghuis, E. M. & van derWeele, J. A. 1998 Relationships between benthic activity and theannual phytopigment cycle in near-bottom waters and sedimentsin the southern North Sea. Estuarine, Coastal and Shelf Science 46,1–13.
Boon, A. R., Duineveld, G. C. A. & Kok, A. 1999 Benthic organicmatter supply and metabolism at depositional and non-depositional areas in the North Sea. Estuarine, Coastal and ShelfScience 49, 747–761.
Buchanan, J. B. 1984 Sediment analysis. In Methods for the study ofmarine benthos (Holme, N. A. & McIntyre, A. D., eds). BlackwellScientific Publications, Oxford and Edinburgh, pp. 41–65.
Chen, G. 1987 Study of the meiobenthos in the Southern Bight of theNorth Sea and its use in ecological monitoring. M.Sc. Thesis, FreeUniversity of Brussels, 172 pp.
Coenjaerts, J. 1997 Het macrobenthos van de Vlaamse Banken enomliggende zandbankecosystemem. M.Sc. Thesis, University ofGent, 112 pp.
Coull, B. 1970 Shallow water meiobenthos of the BermudaPlatform. Oecologia 4, 325–357.
Conover, W. J. 1971 Practical non parametric statistics. John Wiley &Sons, New York, 462 pp.
Cramer, A. 1990 Seasonal variation in benthic metabolic activity ina frontal system in the North Sea. Proceedings of the 24th EuropeanMarine Biology Symposium (Gibson, M. B. R., ed.). AberdeenAcademic Press, Aberdeen, pp. 54–76.
Degraer, S., Vincx, M, Meire, P. & Offringa, H. 1999 Themacrozoobenthos of an important wintering area of the CommonScoter (Melanitta nigra). Journal of the Marine Biology Associationof the U.K. 79, 243–251.
Gerlach, S. A. 1971 On the importance of marine meiofauna forbenthos communities. Oecologia (Berlin) 6, 176–190.
Giere, O. 1993 Meiobenthology: the microscopic fauna in aquaticsediments. Springer Verlag, Berlin, 273 pp.
Heip, C., Vincx, M. & Vranken, G. 1985 The ecology of marinenematodes. Oceanography and Marine Biology Annual Review 23,399–489.
Hill, H. 1979a TWINSPAN-A FORTRAN program for arrangingmultivariate data in an ordered two-way table by classification of theindividuals and the attributes. Ecology and Systematics, CornellUniversity, Ithaca, New York.
1979b DECORANA-A FORTRAN program for detrended correspon-dence analysis and reciprocal averaging. Ecology and Systematics,Cornell University, Ithaca, New York.
Houthuys, R., Trentesaux, A. & de Wolf, P. 1994 Storm influenceson a tidal sandbank’s surface (Middelkerke Bank, southern NorthSea). Marine Geology 123, 23–41.
Huys, R., Herman, P. M. J., Heip, C. & Soetaert, K. 1992 Themeiobenthos of the North Sea: density, biomass, trends anddistribution of copepod communities. ICES Journal of MarineScience 49, 23–44.
Joiris, C., Billen, G., Lancelot, C., Daro, M. H., Mommaerts, J. P.,Bertels, A., Bossicart, M., Nijs, J. & Hecq, J. H. 1982 A budgetof carbon cycling in the Belgian coastal zone: relative roles ofzooplankton, bacterioplankton and benthos in the utilization ofprimary production. Netherlands Journal of Sea Research 16,260–275.
Lanckneus, J., De Moor, G. & Stolk, A. 1994 Environmentalsetting, morphology and volumetric evolution of the MiddelkerkeBank (southern North Sea). Marine Geology 121, 1–21.

Meiobenthos of subtidal sandbanks 649
Maes, F., Cliquet, A., Seys, J., Meire, P. & Offringa, H. 2000Limited Atlas of the Belgian Part of the North Sea. Brussels, 31 pp.
Marcotte, B. M. 1986 Sedimentary particle sizes and the ecologicalgrain of food resources for meiobenthic copepods. Estuarine,Coastal and Shelf Science 23, 423–427.
Palmer, M. A. & Brandt, R. R. 1981 Tidal variation in sedimentdensities of marine benthic copepods. Marine Ecology ProgressSeries 4, 207–212.
Palmer, M. A. & Gust, G. 1985 Dispersal of meiofauna in aturbulent creek. Journal of Marine Research 43, 179–210.
Philips, F. 1998 Het macrobenthos van de Vlaamse Banken:temporele variabiliteit. M.Sc. Thesis, University of Gent, 102 pp.
Skov, H., Durinck, J., Leopold, M. F. & Tasker, M. L. 1995Important Bird Areas for Seabirds in the North Sea. BirdlifeInternational, Cambridge, 156 pp.
Soyer, J. 1971 Bionomie benthique du plateau continental de lacote catalane francaise. V. Densites et biomasses du meio-benthos. Vie Milieu 22, 351–424.
Steyaert, M., Van Gansbeke, D. & Vincx, M. 1994 Meiobenthos eninterstitiele processen in eutrofe mariene sedimenten. In Rol vanhet benthos in mariene ecosystemen en effecten van milieuverontrein-iging (Vincx, M. & Coomans, A., eds). GOA 92/98-08 ProgressReport: Januari 1996–December 1996, University of Gent,1–24.
Thistle, D. & Levin, L. A. 1998 The effect of experimentallyincreased near-bottom flow on metazoan meiofauna at a deep-seasite, with comparison data on macrofauna. Deep-Sea Research I45, 625–638.
Thistle, D., Weatherly, G. L., Ertman, S. C. 1995 Shelf harpacti-coid copepods do not escape into the seabed during winterstorms. Journal of Marine Research 53, 847–863.
Thistle, D., Levin, L. A., Gooday, A. J., Pfannkuche, O. &Lambshead, P. J. D. 1999 Physical reworking by near-bottom
flow alters the metazoan meiofauna of Fieberling Fuyot (north-east Pacific). Deep Sea Research I 46, 2041–2052.
Trentesaux, A. 1993 Sedimentary structure and dynamics of theMiddelkerke Bank, southern North Sea. Unpublished Ph.D. Thesis,Universite de Lille, 229 pp.
Vanaverbeke, J., Steyaert, M., Bonne, W., Vincx, M. Three decadesof meiobenthos research on the Belgian continental shelf: anoverview. In Biodiversity of the benthos and the avifauna of theBelgian coastal waters (Cattrijsse, A. & Vincx, M., eds). In press.
Van Cauwenberghe, C. 1971 Hydrographische analyse van devlaamse Banken langs de Belgische-Franse kust. Ingenieurstijdin-gen Blatt 20, 141–149.
Van de Meene, J. & Stolk, A. 1993 Zandbanken in de Noordzee.Questa 8, 4–7.
Vannieuwenborgh, K. 1982 Bijdrage tot de kennis van de zeebodem enzijn recent evolutie voor de Belgische Westkust. M.Sc. Thesis,University of Gent, 80 pp.
Vanreusel, A. 1991 Ecology of free-living marine nematodes in theVoordelta (Southern Bight of the North Sea). II. Habitat prefer-ences of the dominant species. Nematologica 37, 343–359.
Verween, A. 1999 Habitatkarakterisering van de Vlaamse Banken, deZeelandbanken en de Hinderbanken aan de hand van de hyper-benthosgemeenschappen. M.Sc. Thesis, University of Gent, 74 pp.
Vincx, M. 1990 Diversity of the nematode communities in theSouthern Bight of the North Sea. Netherlands Journal of SeaResearch 25, 181–188.
Vincx, M., Meire, P. & Heip, C. 1990 The distribution of nema-tode communities in the southern Bight of the North sea. Cahiersde Biologie Marine de Roscoff 31, 107–129.
Willems, K., Vincx, M., Claeys, D., Vanosmael, C & Heip, C. 1982Meiobenthos of sublittoral sandbank in the southern Bight of theNorth Sea. Journal of the Marine Biology Association of the U.K. 62,535–548.
Copyright © 2022 FDOKUMEN