Diversity and abundance of invertebrate epifaunal assemblages associated with gorgonians are driven...
14
REPORT Diversity and abundance of invertebrate epifaunal assemblages associated with gorgonians are driven by colony attributes Joa ˜o Cu ´rdia 1,2,3 • Susana Carvalho 1,3 • Fa ´bio Pereira 1 • Jose ´ Manuel Guerra-Garcı ´a 4 • Miguel N. Santos 1 • Marina R. Cunha 2 Received: 15 August 2013 / Accepted: 12 March 2015 / Published online: 20 March 2015 Ó Springer-Verlag Berlin Heidelberg 2015 Abstract The present study aimed to explicitly quantify the link between the attributes of shallow-water gorgonian colonies (Octocorallia: Alcyonacea) and the ecological patterns of associated non-colonial epifaunal invertebrates. Based on multiple regression analysis, we tested the con- tribution of several attributes (colony height, width, and area, fractal dimension as a measure of colony complexity, lacunarity as a measure of the heterogeneity, and ‘‘colo- nial’’ epibiont cover) to abundance and taxonomic richness of associated assemblages. The results highlight the var- iation in the response of epifaunal assemblages to the gorgonian colony characteristics. The nature and intensity of the relationships were gorgonian species-dependent and varied from one taxonomic group to another. For both gorgonian species analyzed, the strongest predictor of species richness and abundance of the epifaunal assem- blages was ‘‘colonial’’ epibiont cover, possibly due to a trophic effect (direct or indirect enhancement of food availability) combined with the surface available for colonization (species–area effect). Although structural complexity is usually indicated as the main driver for rich and abundant coral-associated assemblages, no significant relationship was observed between fractal dimension and the community descriptors; lacunarity, which reflects the sizes of the inter-branch spaces, was only linked to taxo- nomic richness in the assemblages associated with Lepto- gorgia lusitanica. The validity of the paradigm that structural complexity enhances biodiversity may be scale- dependent. In the case of gorgonians, the effect of com- plexity at the ‘‘garden’’ level may be more relevant than at the individual colony level. This reinforces the need for the conservation of gorgonian aggregation areas as a whole in order to preserve host diversity and size structure. Keywords Gorgonians Invertebrate biodiversity Structural complexity Fractal dimension Lacunarity Multiple regressions Introduction A likely mechanism by which marine habitats might influ- ence associated animal assemblages is through provision of complex habitats; in general, structurally complex marine habitats (e.g., sponge and octocoral aggregations, coral reefs) support a greater number of species than simple ones (e.g., Gratwicke and Speight 2005a). A previous study car- ried out to characterize the biodiversity patterns of epifaunal assemblages associated with gorgonians in southern Portu- gal. Carvalho et al. (2014) showed high diversity values compared to those reported for some scleractinian corals around Lizard Island (Great Barrier Reef, Australia) (Stella et al. 2010) and much larger than those reported by Goh et al. (1999) and Kumagai and Aoki (2003) in shallow-water gorgonians from Singapore and Japan. Potential Communicated by Biology Editor Dr. Stephen Swearer & Susana Carvalho [email protected] 1 IPMA, Instituto Portugue ˆs do Mar e da Atmosfera, Av. 5 de Outubro, s/n, 8700-305 Olha ˜o, Portugal 2 Departamento de Biologia and CESAM, Universidade de Aveiro, Campus de Santiago, 3810-193 Aveiro, Portugal 3 Red Sea Research Center, KAUST- King Abdullah University of Science and Technology, Thuwal 23955-6900, Saudi Arabia 4 Departamento de Zoologı ´a, Facultad de Biologı ´a, Universidad de Sevilla, Avda Reina Mercedes 6, 41012 Seville, Spain 123 Coral Reefs (2015) 34:611–624 DOI 10.1007/s00338-015-1283-1
Transcript of Diversity and abundance of invertebrate epifaunal assemblages associated with gorgonians are driven...

REPORT
Diversity and abundance of invertebrate epifaunal assemblagesassociated with gorgonians are driven by colony attributes
Joao Curdia1,2,3• Susana Carvalho1,3
• Fabio Pereira1• Jose Manuel Guerra-Garcıa4
•
Miguel N. Santos1• Marina R. Cunha2
Received: 15 August 2013 / Accepted: 12 March 2015 / Published online: 20 March 2015
� Springer-Verlag Berlin Heidelberg 2015
Abstract The present study aimed to explicitly quantify
the link between the attributes of shallow-water gorgonian
colonies (Octocorallia: Alcyonacea) and the ecological
patterns of associated non-colonial epifaunal invertebrates.
Based on multiple regression analysis, we tested the con-
tribution of several attributes (colony height, width, and
area, fractal dimension as a measure of colony complexity,
lacunarity as a measure of the heterogeneity, and ‘‘colo-
nial’’ epibiont cover) to abundance and taxonomic richness
of associated assemblages. The results highlight the var-
iation in the response of epifaunal assemblages to the
gorgonian colony characteristics. The nature and intensity
of the relationships were gorgonian species-dependent and
varied from one taxonomic group to another. For both
gorgonian species analyzed, the strongest predictor of
species richness and abundance of the epifaunal assem-
blages was ‘‘colonial’’ epibiont cover, possibly due to a
trophic effect (direct or indirect enhancement of food
availability) combined with the surface available for
colonization (species–area effect). Although structural
complexity is usually indicated as the main driver for rich
and abundant coral-associated assemblages, no significant
relationship was observed between fractal dimension and
the community descriptors; lacunarity, which reflects the
sizes of the inter-branch spaces, was only linked to taxo-
nomic richness in the assemblages associated with Lepto-
gorgia lusitanica. The validity of the paradigm that
structural complexity enhances biodiversity may be scale-
dependent. In the case of gorgonians, the effect of com-
plexity at the ‘‘garden’’ level may be more relevant than at
the individual colony level. This reinforces the need for the
conservation of gorgonian aggregation areas as a whole in
order to preserve host diversity and size structure.
Keywords Gorgonians � Invertebrate biodiversity �Structural complexity � Fractal dimension � Lacunarity �Multiple regressions
Introduction
A likely mechanism by which marine habitats might influ-
ence associated animal assemblages is through provision of
complex habitats; in general, structurally complex marine
habitats (e.g., sponge and octocoral aggregations, coral
reefs) support a greater number of species than simple ones
(e.g., Gratwicke and Speight 2005a). A previous study car-
ried out to characterize the biodiversity patterns of epifaunal
assemblages associated with gorgonians in southern Portu-
gal. Carvalho et al. (2014) showed high diversity values
compared to those reported for some scleractinian corals
around Lizard Island (Great Barrier Reef, Australia) (Stella
et al. 2010) and much larger than those reported by Goh et al.
(1999) and Kumagai and Aoki (2003) in shallow-water
gorgonians from Singapore and Japan. Potential
Communicated by Biology Editor Dr. Stephen Swearer
& Susana Carvalho
1 IPMA, Instituto Portugues do Mar e da Atmosfera, Av. 5 de
Outubro, s/n, 8700-305 Olhao, Portugal
2 Departamento de Biologia and CESAM, Universidade de
Aveiro, Campus de Santiago, 3810-193 Aveiro, Portugal
3 Red Sea Research Center, KAUST- King Abdullah
University of Science and Technology, Thuwal 23955-6900,
Saudi Arabia
4 Departamento de Zoologıa, Facultad de Biologıa,
Universidad de Sevilla, Avda Reina Mercedes 6,
41012 Seville, Spain
123
Coral Reefs (2015) 34:611–624
DOI 10.1007/s00338-015-1283-1

explanations for the high diversity of complex systems in-
clude a wider range of niche availability (Attrill et al. 1996;
Kovalenko et al. 2012), refuge against predators (Jordan
et al. 1996; Vytopil and Willis 2001; Gratwicke and Speight
2005b; Lingo and Szedlmayer 2006), and increased
availability of the colonizable surface translated into a
species–area relationship (Dean and Connell 1987; Attrill
et al. 2000; but see Matias et al. 2010). Rigorously testing the
role of habitat complexity is difficult because of the lack of
widely accepted and objective measures of habitat com-
plexity (Parker et al. 2001). Nevertheless, several proxies
have been applied to coral reef areas: surface topography of
the bottom (Ohman and Rajasuriya 1998), visual estimation
of habitat topography (encompassing reef topography, reef
height, rugosity, and number of refuge cavities; Wilson et al.
2007), cover of branching coral colonies (Chabanet et al.
1997), acoustic roughness (Bejarano et al. 2011), habitat
assessment score (integrating rugosity, variety of growth
forms, height, refuge size categories, percentage live cover,
and percentage hard substratum; Gratwicke and Speight
2005a), and fractal dimension (Bradbury and Reichelt 1983;
Knudby and LeDrew 2007; Zawada et al. 2010). At the scale
of the individual colony, fractal dimension has also been
applied to quantify coral shape (Martin-Garin et al. 2007),
morphological variability (Kruszynski et al. 2007), or even
for modeling coral growth (Merks et al. 2003). Measurement
of fractal dimension (D) allows a formal estimate of a
habitat’s physical complexity to be obtained, regardless of
the specific structural components (Beck 2000).
Invertebrates that rely on corals for food, shelter, or
settlement cues dominate the biodiversity of coral habitats
(reviewed by Stella et al. 2011). Small invertebrates are
expected to have stronger relationships with habitat char-
acteristics (shape, niche availability, complexity) compared
to fish because of their reduced mobility and predominantly
sedentary behavior. Consequently, small invertebrates are
potentially more susceptible to alterations in habitat (Stella
et al. 2010). The role of coral host attributes in structuring
the assemblages of associated invertebrates has been
assessed for the hexacorals Pocillopora and Acropora
(Vytopil and Willis 2001; Stella et al. 2010 and references
therein) but not for octocoral species, such as gorgonians.
Although most studies indicate a relationship between
epifaunal abundance and species richness with the habitat
structure of coral colonies (Abele and Patton 1976; Coles
1980; Caley et al. 2001; Vytopil and Willis 2001; Stella
et al. 2010), results were not consistent. A few studies
focusing on invertebrate fauna associated with gorgonians
(Octocorallia: Alcyonacea) have already been undertaken;
however, limited information is available, especially in
shallow temperate Atlantic waters, on the effect and extent
that the attributes of gorgonians have on the levels of local
biodiversity. Along with other corals, gorgonians have
been pointed out as foundational species in the sense that at
both individual colony and aggregation levels, high bio-
diversity values of the associated assemblages are main-
tained. This is achieved by providing a great variety of
niches ranging from sheltered cavities to high water-flow
areas with little sedimentation (Buhl-Mortensen and Mor-
tensen 2005).
Gorgonian aggregations are frequent in the Northeast
Atlantic and Mediterranean Sea (Gori et al. 2011; Curdia
2012) and were recently proposed for the OSPAR (Con-
vention for the Protection of the marine Environment of the
Northeast Atlantic) list of protected habitats (Anonymous
2011), because of their vulnerability and high conservation
value. In a previous study, we demonstrated the high bio-
diversity associated with shallow gorgonian gardens on the
south coast of Portugal (Curdia 2012). Herein, we provide
the first quantitative data on the relationship and consis-
tency between the abundance and biodiversity of the as-
sociated epifaunal assemblages and a set of gorgonian
colony attributes. The colony attributes are intended to
represent the effects of the surface available for coloniza-
tion, the structural complexity and heterogeneity, and the
functional (trophic) intricacy. In previous studies, namely
on epifaunal assemblages associated with seagrasses and
macroalgae, epiphytes were found to have a relevant role in
structuring associated mobile epifaunal assemblages (Ca-
cabelos et al. 2010). On the other hand, among octocorals,
aggregations of epibionts (mainly hydrozoans and bry-
ozoans) are known to develop on branches showing signs
of tissue damage (Bavestrello et al. 1997). Therefore, they
were also considered in the present study. Specifically, we
assessed the following hypotheses: (1) higher surface area
will result in increasing diversity and abundance of asso-
ciated epifaunal organisms (i.e., solitary organisms able to
be quantified in terms of abundance); (2) higher structural
complexity of gorgonians will result in increasing diversity
and abundance of associated epifaunal organisms; (3)
‘‘colonial’’ epibiont cover (i.e., sessile organisms unable to
be quantified in terms of abundance; e.g., bryozoans, hy-
drozoans, sponges, and macroalgae) of gorgonians has a
relevant role in structuring associated epifaunal assem-
blages; and (4) different taxonomic and/or functional
groups will respond differently to gorgonian attributes as
they have different habitat requisites.
Materials and methods
Gorgonian species selected and their attributes
The genera Eunicella and Leptogorgia have a worldwide
distribution. For the purposes of the present study, we se-
lected Eunicella gazella and Leptogorgia lusitanica, which
612 Coral Reefs (2015) 34:611–624
123

are widely distributed and among the most abundant gor-
gonians on the southern Portuguese coast (Curdia et al.
2013). Although both species belong to the family Gor-
goniidae, morphologically they are different: L. lusitanica
colonies are generally larger in width than in height, while
E. gazella colonies are more evenly shaped (i.e., display
similar width and height). Leptogorgia lusitanica colonies
may reach up to 80 cm in width, while E. gazella is a small
species reaching a maximum of 30 cm in height. Branches
of L. lusitanica may have different colors, while E. gazella
branches are generally white and thicker (Table 1).
In order to assess the effect of surface available for
colonization, we measured the height and maximum width
of each colony and estimated the total surface area. Both,
maximum height and width were measured in the labora-
tory. Using a tripod to keep a fixed linear distance to the
gorgonian (and thus maintaining scale), each colony was
photographed with a digital camera at right angles (90�).Analysis of the photographs, using the IMAGE J software,
gave an estimation of the total surface area of the colony.
Due to the relative bi-dimensional structure of the gor-
gonians, the estimation of the total surface area was de-
termined instead of the volume. Structural complexity was
inferred by measuring fractal dimension (D), while lacu-
narity was calculated as a proxy for heterogeneity based on
the analysis of the photographs with the IMAGE J software
(Table 1). Specifically, for fractal analysis, the box-
counting method was used, which involves laying a square
mesh grid of various sizes (r), over the gorgonian image
(fractal) to count how many boxes (N) are required to cover
it completely. To implement the box-counting Method, the
plugin FracLac for Image J (Karperien 1999) was used.
The sizes of the square boxes forming the grid varied from
2 to 200 pixels using the following custom sizes (2, 4, 8,
10, 20, 50, 100, and 200 pixels). The number of boxes (N)
that contain any part of the fractal object (gorgonian) was
automatically counted for each iteration with different box
sizes. The fractal dimension, which is characteristic of the
morphology (i.e., the overall structure of the gorgonian
colony), is defined as the structural fractal dimension (D)
D ¼ logN
log r
and it was calculated by the software as the mean fractal
dimension over 50 scans of differing grid positions. This
fractal dimension is meaningful for objects with complex
outlines such as gorgonians (Martin-Garin et al. 2007).
Lacunarity describes the texture of a fractal, using the
size distribution of holes of that fractal. If a fractal has
large gaps or holes, it has high lacunarity (Karperien 1999).
Lacunarity was calculated as:
Ekr ¼ 1 þ rrlr
� �2
where r is the standard deviation of the number of pixels
and l is the average number of pixels in squares of size
r. During the calculation of Ek, the pixels of the image
background were considered together with the object pix-
els. The mean lacunarity value was calculated for 50 grids
of different origin.
Besides these morphological attributes, the abundance of
macroscopic algae, cnidarians, bryozoans, sponges, and hy-
drozoans was scored by a semiquantitative index ranging
from 0 to 4 (0—absent, 1—rare, 2—common, 3—abundant,
and 4—very abundant). In order to minimize bias, scoring was
always carried out by the same observer. For simplicity, this
relative index will be hereafter designated as CEC, ‘‘colonial’’
epibiont cover, where the term colonial is used loosely to
represent modular organisms (Carvalho et al. 2014). CEC will
be used to infer the enhancement of functional intricacy of the
gorgonian colonies derived from the presence of sessile or-
ganisms, which may provide additional ecological niches and/
or a greater variety of food resources for the associated in-
vertebrate assemblages. For each colony, CEC will be the sum
of the scores of each epibiont observed (Table 2).
Study areas and sampling design
Sampling was undertaken in two consecutive summers (July
2010 and August 2011), at Pedra da Greta (PG), the main
rocky subtidal area in the central part of the Algarve coast.
The area is located at a depth of approximately 15 m and is
roughly 3.6 km in length and ranges from 20 to 90 m in
width. It presents high heterogeneity with a wide range of
features that encompass flat surfaces with high sedimenta-
tion and large blocks that can reach a height of 4 m. How-
ever, the area is characterized by numerous, small canyon-
like ridges that cut large, solidified, ancient belts of sand
dunes creating a ‘‘giant’s causeway’’ like scenery. These
channels can be up to 2 m wide, but they are more com-
monly 1–1.5 m wide. Gorgonians are present all over the
Table 1 Minimum (min) and maximum (max) values for the gor-
gonian attributes considered in the analyses: area (mm2); width (mm);
height (mm); D, fractal dimension; L, lacunarity; CEC, ‘‘colonial’’
epibiont cover
Attributes Eunicella gazella Leptogorgia lusitanica
Min Max Min Max
Area 507.28 12,851.13 496.85 24,316.12
Width 29.91 236.35 70.03 441
Height 53.51 223.64 51.27 445
D 1.52 1.81 1.58 1.79
L 0.93 2.99 0.81 4.84
CEC 0 28 0 30
See text for further details
Coral Reefs (2015) 34:611–624 613
123
area, but their density varies considerably, with an average
number of 5.83 colonies m-2 (maximum of 31 colonies
m-2; unpublished data). In the shallow continental shelf of
the Algarve, the most common gorgonian species are E.
gazella, L. lusitanica, E. labiata, E. verrucosa, and Lepto-
gorgia sarmentosa (Curdia 2012), although low abundances
of some other rare species are observed. This study focuses
on the two most common species, E. gazella (average 2.65
colonies m-2, max 18 colonies m-2) and L. lusitanica (av-
erage 1.81 colonies m-2, maximum 18 colonies m-2). It is
very common that in shallow continental shelf areas (down
to 30 m) these two species coexist. This is especially true
either in sloped areas or in the ridges that cut the large
blocks, which are present in the upper parts of the rocky
formations. However, L. lusitanica is less common in areas
with high sedimentation, such as the bottom parts of the
ridges where another Leptogorgia species, L. sarmentosa,
becomes more frequent and abundant (Curdia et al. 2013).
The size distribution of E. gazella ranges from 1 to
22 cm in height (mean: 9 cm) and is skewed toward small
sizes, but with a broad range of sizes that are well repre-
sented (Curdia 2012). Leptogorgia lusitanica also presents
a skewed distribution toward small colony sizes (2–40 cm
height, mean: 7.9 cm), but with a clear dominance of small
sizes (Curdia 2012). In the study area, a large percentage of
gorgonian colonies were damaged ([90 %, unpublished
data), especially Eunicella species (40 % of E. gazella
colonies had more than 25 % of their colony damaged).
Underwater observations indicated that algae, barnacles,
bryozoans, and zoanthids mostly colonized the damaged
areas. For the purpose of this study, the colonies that were
highly damaged were not collected.
The summer period was chosen because it generally
corresponds to the peak of invertebrates’ diversity and
abundance in this region. In each sampling period, 18
colonies of each species were collected with different
lengths totaling 72 colonies. Each colony was enclosed in a
plastic bag to prevent faunal loss and to assure only or-
ganisms on the colony were being collected and then
carefully detached from the hard substrate. Extra care was
taken to prevent the collection of any extra material, such
as sediment, surrounding the base of the colony. All gor-
gonians were transported to the laboratory for processing.
Biodiversity of associated epifaunal assemblages
In the laboratory, the colonies were preserved in 96 %
ethanol. All samples were washed through a 100-lm mesh
sieve, and colonies were observed under a magnifying
glass to ensure that all fauna and flora had been removed.
All specimens associated with each colony were preserved
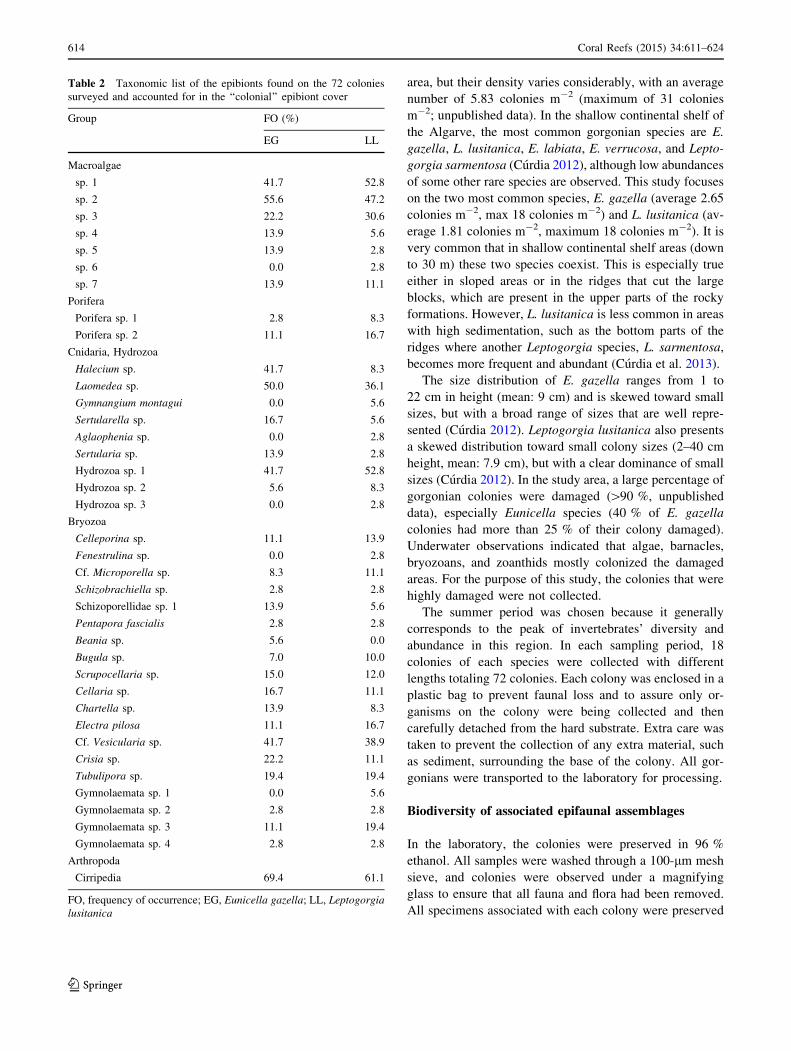
Table 2 Taxonomic list of the epibionts found on the 72 colonies
surveyed and accounted for in the ‘‘colonial’’ epibiont cover
Group FO (%)
EG LL
Macroalgae
sp. 1 41.7 52.8
sp. 2 55.6 47.2
sp. 3 22.2 30.6
sp. 4 13.9 5.6
sp. 5 13.9 2.8
sp. 6 0.0 2.8
sp. 7 13.9 11.1
Porifera
Porifera sp. 1 2.8 8.3
Porifera sp. 2 11.1 16.7
Cnidaria, Hydrozoa
Halecium sp. 41.7 8.3
Laomedea sp. 50.0 36.1
Gymnangium montagui 0.0 5.6
Sertularella sp. 16.7 5.6
Aglaophenia sp. 0.0 2.8
Sertularia sp. 13.9 2.8
Hydrozoa sp. 1 41.7 52.8
Hydrozoa sp. 2 5.6 8.3
Hydrozoa sp. 3 0.0 2.8
Bryozoa
Celleporina sp. 11.1 13.9
Fenestrulina sp. 0.0 2.8
Cf. Microporella sp. 8.3 11.1
Schizobrachiella sp. 2.8 2.8
Schizoporellidae sp. 1 13.9 5.6
Pentapora fascialis 2.8 2.8
Beania sp. 5.6 0.0
Bugula sp. 7.0 10.0
Scrupocellaria sp. 15.0 12.0
Cellaria sp. 16.7 11.1
Chartella sp. 13.9 8.3
Electra pilosa 11.1 16.7
Cf. Vesicularia sp. 41.7 38.9
Crisia sp. 22.2 11.1
Tubulipora sp. 19.4 19.4
Gymnolaemata sp. 1 0.0 5.6
Gymnolaemata sp. 2 2.8 2.8
Gymnolaemata sp. 3 11.1 19.4
Gymnolaemata sp. 4 2.8 2.8
Arthropoda
Cirripedia 69.4 61.1
FO, frequency of occurrence; EG, Eunicella gazella; LL, Leptogorgia
lusitanica
614 Coral Reefs (2015) 34:611–624
123

in 96 % ethanol and afterward identified to the lowest
practical taxonomic level. To estimate species richness
(i.e., the number of species per colony), unidentifiable or-
ganisms were, whenever possible, differentiated into dif-
ferent operational taxonomic units (OTUs). If animals were
juveniles and/or were extremely damaged and it was not
possible to recognize whether they were different entities
or belong to any of the already identified species, they were
not used in the analyses. The number of taxa and indi-
viduals per colony, as well as the Hurlbert (1971) expected
number of species [ES(n)], was calculated both for the
whole assemblage and for the main taxonomic groups
separately (Arthropoda, Mollusca, Polychaeta). Feeding
habits were also ascribed for all OTUs with more than ten
individuals, based on the literature available.
Data analysis
In order to assess the relationship between gorgonian at-
tributes and the biodiversity and abundance of the associated
epifaunal assemblages, Spearman rank correlations were
performed. The best combination of gorgonian attributes
explaining the diversity and abundance patterns of the as-
sociated epifaunal assemblages was determined using a
backwards stepwise multiple generalized linear regression.
This approach, recommended whenever colinearity between
independent variables is suspected (Haedrich et al. 2008),
begins with a full model, including all independent variables.
Then, based on standard criteria, the variables failing at
contributing to the explanation of the dependent variable
(number of species or abundance) are systematically
eliminated (Younger 1979). The relationship between epi-
faunal feeding habits and CEC was investigated using re-
gression analysis. Differences in epifaunal assemblage
structure between gorgonian species, as well as the rela-
tionship between assemblage structure and the CEC, were
analyzed by a distance-based redundancy analysis (dbRDA;
McArdle and Anderson 2001). In the present study, dbRDA
was performed to order biological samples from each colony
as a function of the attendant epifaunal composition and
structure, using the CEC value for the most common colonial
taxa as explanatory variables. For the present analysis, the
modified Gower dissimilarity measure (Anderson et al.
2006) was used after removing singletons (i.e., taxon rep-
resented by a single organism or found on a single colony)
from the community data matrix.
Results
Associated epifaunal assemblages were numerically
dominated by arthropods, accounting for 48 and 65 % of
total abundance in E. gazella and L. lusitanica, respectively
(Fig. 1a). Mollusks were also abundant in both gorgonians
(18 % in E. gazella and 22 % in L. lusitanica). Platy-
helminthes, which were exclusive of E. gazella epifaunal
assemblages, were the second most abundant group. In terms
of species richness (i.e., the number of different OTUs),
polychaetes were highly diverse, accounting for more than
30 % of total number of species on both gorgonians
(Fig. 1b). Indeed, in E. gazella assemblages, polychaetes
were the richest group (34 %), followed by arthropods
(31 %) and mollusks (29 %). In L. lusitanica colonies,
arthropods were dominant not only in abundance but also in
number of species (35 % of total number of species), fol-
lowed by annelids (33 %) and mollusks (27 %; Fig. 1b).
Regarding the feeding guilds of the associated epifaunal
assemblages, in E. gazella colonies, carnivores/omnivores
and suspension-feeders/deposit-feeders were the dominant
feeding modes (Fig. 1c). Epifaunal assemblages associated
with L. lusitanica colonies presented a more even distri-
bution of the main feeding guilds. Besides the trophic
guilds above mentioned, the contribution of deposit-feed-
ers, deposit-feeders/herbivores, and suspension-feeders was
also relevant.
Hurlbert’s expected number of species can be rarefied to
the same number of individuals (equal or lower than the
maximal common number of individuals). This allows
comparisons of the assemblages sampled from colonies
with different sizes, different surfaces available for
colonization, or different gorgonian species. Most of the
rarefaction curves showed relatively steep slopes and were
far from reaching the asymptotic values (species saturation;
Fig. 2). By comparing the patterns of the rarefaction curves
constructed for the three main taxonomic groups, it is ap-
parent that polychaeta contributed the most to biodiversity
for both gorgonians, while arthropods were the most
abundant (Fig. 2).
Correlations between gorgonian attributes and the
number of taxa and abundance were performed for the
whole epifaunal assemblage and the main taxonomic
groups separately. Consistently highly significant correla-
tions were obtained for the relationships between both
abundance and species richness of the associated assem-
blages and functional intricacy (CEC index) in both gor-
gonian species. The correlation between species richness
and indicators of colonizable surface also showed sig-
nificant values in most cases, with the highest values for
height in L. lusitanica and for area in E. gazella. Abun-
dance showed consistently lower correlation with the
indicators of colonizable area, and most values were not
significant in L. lusitanica (Tables 3, 4). Except for the
relationship between species richness and lacunarity in L.
lusitanica, measures of complexity and heterogeneity
showed no significant correlations with the associated
assemblages (Tables 3, 4).
Coral Reefs (2015) 34:611–624 615
123

These trends were incorporated into multiple linear re-
gression models to analyze the relationships between the
associated assemblage variables and gorgonian attributes
(Tables 5, 6). Again, CEC was always the variable that
contributed the most to the total variability. It is also
noteworthy that more variables were generally kept in the
final model concerning L. lusitanica assemblages, com-
pared with those of E. gazella, for which the best fits were
obtained for CEC alone or combinations of CEC and area
(Tables 5, 6). Also, the significant contribution of com-
plexity measures (D and lacunarity) was only detected for
L. lusitanica assemblages.
Organisms considered for the CEC analysis (Table 2)
were present in 67 of the analyzed colonies. Thus, only
6.9 % of the colonies were completely devoid of those
epibionts (8.3 % in E. gazella and 5.6 % in L. lusitanica).
Epibiont coverage was, however, low (always \20 %). A
high similarity in taxonomical composition was observed
in both gorgonians in terms of both taxonomic richness
and abundance (Table 2). Bryozoans, hydrozoans, and
macroalgae dominated in terms of diversity, while cirripeds
showed the highest frequency of occurrence in both gor-
gonians (69.4 and 61.1 %, in E. gazella and L. lusitanica,
respectively). These organisms could be found attached to
the branches of the gorgonians or on their base.
Considering the relevance of the CEC explaining the
composition and structure of associated fauna, the rela-
tionship between the frequency of occurrence and richness
of ‘‘colonial’’ epizoans was also analyzed. No correlation
between colony size and the frequency of occurrence (E.
gazella: r2 = 0.0001, p = 0.988; L. lusitanica: r2 =
0.0271, p = 0.376) or richness of CEC (E. gazella:
Num
ber
of ta
xa0
10
20
30
40
50
Annelida Arthropoda Echinodermata Mollusca Platyhelminthes OtherN
umbe
r of
indi
vidu
als
500
1000
1500
2000
2500
3000
Annelida Arthropoda Echinodermata Mollusca Platyhelminthes Other
Num
ber
of in
divi
dual
s
0
200
400
600
800
1000
C/O H DF DF/H SF SF/DF
EG LL
a
b
c
Fig. 1 a Number of taxa,
b individuals, and c feeding
guilds of the dominant phyla
observed in both gorgonian
species. ‘‘Other’’ includes data
from Chordata, Cnidaria,
Nematoda, Phoronida, Porifera,
and Sipuncula. C/O, carnivores/
omnivores; H, herbivores; DF,
deposit-feeders; DF/H, deposit-
feeders/herbivores; SF,
suspension-feeders; SF/DF,
suspension-feeders/deposit-
feeders; EG, Eunicella gazella,
LL, Leptogorgia lusitanica
616 Coral Reefs (2015) 34:611–624
123

0 1000 2000 3000 40000
20
40
60
80
100
120
140
0 1000 2000 3000 40000
20
40
60
80
100
120
140
Mollusca Polychaeta Arthropoda Total
Exp
ecte
d N
umbe
r of
Spe
cies
(E
S)
Number of individuals
Eunicella gazella Leptogorgia lusitanicaFig. 2 Comparison of
rarefaction curves (Hurlbert’s
expected number of species) for
the whole assemblage (total)
and the main taxonomic groups
(Arthropoda, Mollusca and
Polychaeta) in Eunicella gazella
and Leptogorgia lusitanica
Table 3 Eunicella gazella.
Relationships between
gorgonian attributes and species
richness (number of taxa per
colony) and abundance (number
of individuals per colony) for all
of the taxa and the main
taxonomic groups separately
Area Width Height D L CEC
Number of taxa
All assemblage 0.51** 0.47** 0.40* 0.26ns -0.15ns 0.79***
Polychaeta 0.43** 0.37* 0.31ns 0.12ns -0.05ns 0.67***
Arthropoda 0.55*** 0.47** 0.44** 0.26ns -0.12ns 0.77***
Mollusca 0.39* 0.38* 0.28ns 0.32ns -0.22ns 0.64***
Number of individuals
All assemblage 0.41* 0.40* 0.32ns 0.28ns -0.19ns 0.75***
Polychaeta 0.47** 0.38* 0.31ns 0.13ns -0.05ns 0.62***
Arthropoda 0.18ns 0.15ns 0.16ns 0.17ns -0.12ns 0.59***
Mollusca 0.44** 0.43** 0.28ns 0.29ns -0.20ns 0.65***
D fractal dimension, L lacunarity, CEC ‘‘colonial’’ epibiont cover, ns not significant
* p\ 0.05; ** p\ 0.01; *** p\ 0.001
Bold values indicate significant values
Table 4 Leptogorgia
lusitanica. Relationships
between gorgonian attributes
and species richness (number of
taxa per colony) and abundance
(number of individuals per
colony) for all taxa and the main
taxonomic groups separately
Area Width Height D L CEC
Number of taxa
All assemblage 0.47** 0.45** 0.56*** -0.23ns 0.47** 0.76***
Polychaeta 0.29ns 0.27ns 0.37* -0.11ns 0.37* 0.69***
Arthropoda 0.51** 0.52** 0.62*** -0.31ns 0.43** 0.65***
Mollusca 0.48** 0.37* 0.50* -0.15ns 0.38* 0.63***
Number of individuals
All assemblage 0.35* 0.32ns 0.40* -0.12ns 0.27ns 0.77***
Polychaeta 0.25ns 0.23ns 0.32ns -0.06ns 0.31ns 0.69***
Arthropoda 0.34* 0.34* 0.36* -0.11ns 0.21ns 0.50**
Mollusca 0.28ns 0.23ns 0.32ns -0.04ns 0.19ns 0.55***
D fractal dimension, L lacunarity, CEC ‘‘colonial’’ epibiont cover, ns not significant
* p\ 0.05; ** p\ 0.01; *** p\ 0.001
Bold values indicate significant values
Coral Reefs (2015) 34:611–624 617
123

r2 = 0.0027, p = 0.762; L. lusitanica: r2 = 0.0483,
p = 0.235) was observed. However, when the macrofauna
patterns are related to the CEC data (most frequent taxa)
through the dbRDA, it is clear that some colonial taxa are
important to explain the differences in the macrofauna in
both gorgonian species (Fig. 3). Some bryozoans (cf.
Vesicularia sp. and Crisia sp.), hydrozoans (Halecium sp.,
Laomedea sp.), and barnacles (Cirripedia) seemed to be
more associated with E. gazella than with L. lusitanica. No
clear pattern regarding colony size was perceptible though.
On the other hand, L. lusitanica samples show a gradient
separating small size colonies from medium and large
colonies. Macroalgae (sp. 3 and sp. 7), a bryozoan (Gym-
nolaemata sp. 1), and a hydrozoan (Hydrozoa sp. 1) relate
well to that pattern, as they tend to show higher occurrence
and abundance at medium and large gorgonian colonies.
Significant relationships between the abundance of in-
dividuals of the main trophic groups and CEC were found
in the epifaunal assemblages associated with both gor-
gonians, except for the deposit-feeders in L. lusitanica
(Fig. 4).
Discussion
The use of different measures of habitat complexity to-
gether with different sampling methods hampers direct
comparisons of results gathered on the relationships be-
tween habitat complexity and associated animal assem-
blages. Besides, measures of structural complexity can
change unpredictably across spatial scales, and typical
coral habitats are too complex for any single measure of
Table 5 Eunicella gazella.
Subset of gorgonian attributes
that explain the most variability
in the number of species and in
the number of individuals
(backwards stepwise regression)
Adj. R2 Variables
Number of taxa
All groups 0.649*** CEC (0.0323), area (0.2035)
Polychaeta 0.453*** CEC (0.000), area (0.161)
Arthropoda 0.683*** CEC (0.000), area (0.004), -width (0.047)
Mollusca 0.397*** CEC (0.000)
Number of individuals
All groups 0.555*** CEC (0.000)
Polychaeta 0.473*** CEC (0.000), area (0.006), -D (0.1191), -height (0.1277), -width (0.1573)
Arthropoda 0.335*** CEC (0.000)
Mollusca 0.422*** CEC (0.000), area (0.126)
Models for all faunal assemblages and those for the main taxonomic groups have been derived separately.
The variables comprising the best model are listed in order of decreasing significance (p values in
parentheses). (-) indicates a negative relationship for a variable in the model
D fractal dimension, L lacunarity, CEC ‘‘colonial’’ epibiont cover
* p\ 0.05; ** p\ 0.01; *** p\ 0.001
Table 6 Leptogorgia
lusitanica. Subset of gorgonian
attributes that explain the most
variability in the number of
species and in the number of
individuals (backwards stepwise
regression)
Adj. R2 Variables
Number of taxa
All assemblage 0.652*** CEC (0.000), area (0.022), -L (0.0482), -width (0.0549), D (0.1084)
Polychaeta 0.589*** CEC (0.000), L (0.004), D (0.007), width (0.0612), area (0.1254)
Arthropoda 0.518*** CEC (0.002), height (0.004)
Mollusca 0.594*** CEC (0.000), area (0.001), -width (0.003), L (0.042), D (0.1116)
Number of individuals
All assemblage 0.333*** CEC (0.000)
Polychaeta 0.531*** CEC (0.000), D (0.011), L (0.030)
Arthropoda 0.228** CEC (0.002)
Mollusca 0.374*** CEC (0.000), area (0.056), -width (0.062)
Models for all faunal assemblages and those for the main taxonomic groups have been derived separately.
The variables comprising the best model are listed in order of decreasing significance (p values in
parentheses). (-) indicates a negative relationship for a variable in the model
D fractal dimension, L lacunarity, CEC ‘‘colonial’’ epibiont cover
* p\ 0.05; ** p\ 0.01; *** p\ 0.001
618 Coral Reefs (2015) 34:611–624
123

complexity (Knudby and LeDrew 2007). In coral reef
systems, species diversity of fish (Nagelkerken et al. 2000;
Gratwicke and Speight 2005b; Lingo and Szedlmayer
2006; Wilson et al. 2007) and epifaunal invertebrate
assemblages (Vytopil and Willis 2001; Idjadi and Edmunds
2006) has been positively correlated with habitat com-
plexity. In some studies, results differed with the nature of
the reef (Ohman and Rajasuriya 1998) or were inconsistent
in studied areas (Luckhurst and Luckhurst 1978; Bejarano
et al. 2011). Other studies also reported no relationship
between species diversity and habitat complexity (Ca-
ballero and Schmitter-Soto 2001). This inconsistency may
be related to the use of different measures of complexity or
the scales at which complexity was assessed. These scales
should preferably match the typical body size of the or-
ganisms whose habitat is being investigated (e.g., Knudby
and LeDrew 2007).
A positive relationship between habitat complexity and
the enhancement of the biodiversity of its associated
assemblages was not unequivocal in the present study, even
though habitat complexity, as assessed by fractals, was
measured at the scale of the gorgonian colony. The fractal
nature of the analyzed gorgonians, similarly to other self-
similar organisms (e.g., trees, algae), may be related to
physical and metabolical limitations (West et al. 1999),
suggesting that the architecture of the organisms is defined
by a set of branching rules (Bentley et al. 2013). This
explains why fractal dimension does not vary significantly
between species and sizes, generally indicating that even
small-sized colonies present the characteristic structure of a
gorgonian. In cases where a fractal analysis does not show
simple scaling properties, the observed complexity can be
due to fundamentally different processes operating on
different scales (Lam and Quattrochi 1992; Sievanen et al.
2000). The processes determining the abundance and di-
versity patterns of the associated fauna may occur at a
smaller scale (i.e., at the same scale as CEC) than the one
that can be analyzed with the methodology adopted in the
present paper. A differential response of different taxo-
nomic groups to gorgonian attributes, most likely as a re-
sult of their different environmental and/or biological
requisites, was also observed. Structural complexity and
heterogeneity measures in the multiple regression analyses
were, in general, not relevant for the ecological patterns.
Fig. 3 Distance-based
redundancy analysis (dbRDA)
ordination biplot for epifaunal
assemblages associated with
Eunicella gazella, EG (circles;
different shades represent
colony size) and Leptogorgia
lusitanica, LL (squares;
different shades represent
colony size). Samples are
plotted as points using weighted
averages of species scores in
each constrained axis. The
vector lines reflect the
relationship of colonial
epibionts (most common; 18
taxa) to the ordination axes;
their length is proportional to
their relative significance.
S small (\9 cm for EG;\10 cm
for LL), M medium (9–17 cm
for EG; 10–30 cm for LL),
L large ([17 cm for EG;
[30 cm for LL), following
Carvalho et al. (2014)
Coral Reefs (2015) 34:611–624 619
123

Only lacunarity, used here as a measure of the colony
heterogeneity, was found to have a positive correlation
with the number of taxa of the assemblages inhabiting L.
lusitanica colonies. The higher values of lacunarity found
in those colonies reflect the differences in morphology of
the colonies of both gorgonian species: L. lusitanica
colonies have more inter-branch spaces and higher vari-
ability and consequently will have higher number and di-
versity of niches compared with E. gazella. The
combination of both will promote the colonization of
species with a wider range of body sizes, enhancing taxo-
nomic richness (Tokeshi and Arakaki 2012). Pierre and
Fig. 4 Relationship between the abundance of individuals (square
root-transformed) belonging to the main trophic groups and the
‘‘colonial’’ epibiont cover (CEC). The regressions are presented in
black for Eunicella gazella (solid line) and gray for Leptogorgia
lusitanica (dashed line). ns not significant. *p\ 0.05; **p\ 0.01;
***p\ 0.001
620 Coral Reefs (2015) 34:611–624
123

Kovalenko (2014) also found that species richness in
macrophyte-associated assemblages in freshwater systems
was more influenced by space-size heterogeneity than
overall complexity. As pointed out by the authors, this
heterogeneity of sizes may also reflect heterogeneity of
niches available to be colonized by species with a wider
size range. Also, as observed before, fractal measures do
not always provide a comprehensive characterization of
habitat complexity (Tokeshi and Arakaki 2012). These
authors even hypothesized that the highest levels of bio-
diversity will be most likely linked to intermediate levels
of fractal dimension when an entire range of values is
considered.
Epifaunal abundance and diversity were, however,
strongly related to gorgonian attributes representing the
surface available for colonization, although not consis-
tently between gorgonian species or across faunal groups.
This relationship varied for each host, as well as on the
faunal group analyzed. In the present study, regardless of
the measure used, the correlations between animal abun-
dance and habitat attributes were always weaker than those
found for diversity, which corroborates the findings of
earlier studies (Ohman and Rajasuriya 1998; Idjadi and
Edmunds 2006).
Taking into consideration the studies highlighting the
relationship between structural complexity and diversity in
marine environments both for fish and invertebrates, the
nonsignificant correlations found between the fractal mea-
sure of complexity, and both the number of species and
abundance of invertebrate assemblages could be surprising.
Although this is the first attempt to apply fractal dimensions
in estimating habitat complexity in coral colonies and then to
assess its relationship with associated epifaunal assem-
blages, it is a common approach in studies of plants and
algae (Morse et al. 1985; Gee and Warwick 1994; Davenport
et al. 1999; Attrill et al. 2000). Attrill et al. (2000), while
assessing the relationship between seagrass structural com-
plexity and the associated macroinvertebrate community,
found that seagrass biomass, rather than complexity, was the
crucial factor for the enhancement of the number of indi-
viduals and species. As no significant positive relationship
was detected between biomass and complexity, the authors
linked the increase in species diversity with increasing
seagrass biomass to a species–area relationship effect (larger
surface area available for colonization). These authors pro-
posed that the relationship between seagrass biomass and
macroinvertebrate diversity was a sampling artifact result-
ing from the probability of collecting more of the rare spe-
cies as the area sampled increases.
The most striking pattern emerging from the results is
that, from the parameters analyzed, the ‘‘colonial’’ epibiont
cover of gorgonians was the most relevant attribute of the
gorgonian habitat driving biodiversity and abundance
patterns of their associated assemblages. Although multiple
factors are expected to influence epifaunal assemblage
patterns associated with gorgonians, the abundance of
‘‘colonial’’ epibionts in each colony consistently enhanced
diversity and abundance of all non-colonial species,
although size measures (area, width, and/or height) were
also relevant. Despite the generally low level of ‘‘colonial’’
epibiont coverage (\20 %), the biological, structural
component of the habitat was always the most relevant.
This suggests that the enhancement of local diversity pro-
moted by gorgonians may be also indirectly supported by
‘‘colonial’’ epibionts that settle and grow up on the external
surface of their skeletons. Furthermore, the lack of sig-
nificance between the fractal dimension and the biodiver-
sity patterns may be related to the lack of resolution at the
scale of these epibionts.
Associations between marine invertebrates and colonial
animals, such as hydrozoans and bryozoans (Lindberg and
Stanton 1988; Conradi et al. 2000; Bradshaw et al. 2003),
or even algae (Hall and Bell 1988; Bologna and Heck
1999; Cacabelos et al. 2010), have been frequently re-
ported. In the past few years, the importance of interactions
between organisms for structuring communities has been
reemphasized, suggesting that the coexistence of species is
of primary importance for the biodiversity of ecosystems
(e.g., Chesson 2000; Bruno et al. 2003; HilleRisLambers
et al. 2012). Therefore, it is suggested that gorgonians can
function as facilitators for several species using different
processes (e.g., niche availability and trophic cascades) to
increase the abundance and diversity of local macrofaunal
communities. Previous studies on the relationships between
macroalgae/seagrasses and associated epifaunal assem-
blages reported that epiphytes (mainly algae) play an im-
portant role in structuring the patterns of distribution and
abundance of mobile organisms (Schneider and Mann
1991; Martin-Smith 1993; Attrill et al. 2000; Cacabelos
et al. 2010). These organisms can increase structural
complexity (Hall and Bell 1988; Schneider and Mann
1991; Martin-Smith 1993) and/or provide additional food
resources (Kitting et al. 1984; Orth and Van Montfrans
1984; Bologna and Heck 1999; Jones and Thornber 2010),
which will probably contribute to the maintenance of more
diverse and abundant epifaunal assemblages. However,
some epibionts can also compete with suspension-feeders
for food, leading to growth and reproductive costs, espe-
cially when the distribution of trophic resources is deter-
mined by flow (Kim and Lasker 1997). Indeed, some
epibionts can invade a gorgonian colony extensively, ulti-
mately resulting in partial or complete colony death due to
either feeding constraints or its collapse to the ground. For
example, hydrozoans are known as pioneer epibiont spe-
cies that take advantage of minor injuries but in the case of
extensive and/or repeated injuries, tissues are colonized by
Coral Reefs (2015) 34:611–624 621
123

stronger competitors, like bryozoans, which are the starting
point for a permanent and varied epibiont community
(Riegl and Riegl 1996; Bavestrello et al. 1997; Cerrano
et al. 2005). Both bryozoans and hydrozoans were ran-
domly found on the gorgonian colony branches or base,
which is in agreement with their opportunistic behavior of
preferentially colonizing areas that have been damaged.
However, in the study area, heavily colonized gorgonians
are not very abundant. According to Rotjan and Lewis
(2008), concerning scleractinian fauna, the 51 invertebrate
corallivore species are in fact a small proportion of the total
number of invertebrate fauna described as being associated
with coral species (Stella et al. 2011). For octocorals,
namely gorgonians, it is also known that some gastropods
feed on their hosts’ living tissue (Patton 1972; Burkepile
and Hay 2007; Garcıa-Matucheski and Muniain 2010), but
most of the other invertebrate-associated fauna does not
(Patton 1972; Kumagai 2008). Also, several amphipods,
which were numerically dominant here, have been reported
to feed on algae, bryozoans, and hydrozoans (Duffy and
Hay 2000; Dauby et al. 2001). During a manipulative ex-
periment testing the relative importance of trophic and
structural characteristics of seagrass epiphytes on macro-
faunal associated organisms, Bologna and Heck (1999)
found that mobile seagrass fauna responded positively to
the presence of new trophic resources, rather than the in-
creases in secondary structure. Only caprellids (Crustacea:
Amphipoda) appeared to be associated with both the
structure and trophic resources of epiphytes. Other authors,
however, observed that both epiphyte cover and substratum
shape were relevant in determining the distribution of
epifaunal invertebrates in seagrass beds, but responses
were species-dependent (Schneider and Mann 1991). In the
present study, significant, yet sometimes weak, linear re-
lationships between the abundance of the main trophic
groups and the colonial epibiont cover were detected in
both gorgonians. These results may indicate either their
role as direct food resources, or their contribution to the
enhancement of food resources (e.g., animals for carni-
vores or organically rich particles for suspension/deposit-
feeders). Regardless of the role epibionts play in structur-
ing the epifaunal assemblages associated with gorgonians
(i.e., food resource or additional habitat), the current results
support the hypothesis that gorgonians’ epibiont cover
(both flora and fauna) affects the patterns of abundance and
diversity of their associated assemblages.
In summary, the results of the present, quantitative,
statistically based study suggest that the patterns of diver-
sity and abundance of epifaunal assemblages are better
explained by the presence of other colonial animals and
algae and thus a greater surface area for colonization and
increased ecological niches and food resources, than the
complexity of the colony itself (measured as fractal di-
mension). The lack of significance between fractal di-
mension and biodiversity may be biased by the scale at
which the study was conducted as well as the measure
itself. Indeed, relevant aspects of the habitat structure that
are determinant for the colonizing organisms are not
adequately covered by the fractal concept (Tokeshi and
Arakaki 2012). The paradigm that structural complexity
enhances species diversity may still be valid if tested at a
broader range of habitat complexity (e.g., by comparison
with more complex coral species like scleractinians) or at a
broader spatial scale (e.g., by comparison with the reef
environment or gorgonian aggregation to other less com-
plex habitats), as suggested for seagrass beds (Attrill et al.
2000). That is to say that this paradigm may be scale-
dependent. This is supported by some studies that analyzed
coral reefs as a whole, instead of focusing on the colonies
themselves (Luckhurst and Luckhurst 1978; Chabanet et al.
1997; Gratwicke and Speight 2005a; Wilson et al. 2007).
Manipulative experiments on structural complexity using
artificial reef blocks to create habitats with different levels
of complexity also provided evidence, supporting the hy-
pothesis that habitat complexity increased the diversity of
reef-fish species (Lingo and Szedlmayer 2006). In the case
of gorgonians, apparently their importance relies in part on
the overall environment at the aggregation scale instead of
the scale of individual colonies, which reinforces the need
for the conservation of gorgonian aggregation areas as a
whole, including their size structure and taxonomical di-
versity. Benthic communities in areas where gorgonians
are common seem to be affected by cascade effects that are
related to gorgonians directly (scale/area in both gorgonian
species and increased heterogeneity in medium and large
colonies in L. lusitanica) and indirectly (facilitation due to
colonial epibionts). What is more, the indirect effects seem
to be more important for explaining the patterns in a patchy
environment where multiple factors shape the community.
The apparent random distribution of facilitators (colonial
epibionts) further emphasizes the complex and unpre-
dictable nature of the biotic relationships typical of a
metapopulation. Furthermore, possible interactions that
could not be addressed in the present study, such as pos-
sible cascade effects in fish species (Bozec et al. 2013), can
lead to ecological shifts related to the loss of gorgonians as
recently suggested by Ponti et al. (2014) for the coral-
ligenous assemblages in the Mediterranean. Nevertheless,
future research should attempt to compare corals of con-
trasting structural complexities (e.g., gorgonians vs.
scleractinian) and to separate the effects of habitat com-
plexity, food availability, and shelter in order to better
assess the relationship between host attributes and associ-
ated epifaunal assemblages.
622 Coral Reefs (2015) 34:611–624
123

Acknowledgments J. Curdia (SFRH/BD/29491/2006) and S. Car-
valho (SFRH/BPD/26986/2006) benefit from Ph.D. and postdoctoral
grants, respectively, awarded by ‘‘Fundacao para a Ciencia e a Tec-
nologia’’ (FCT). The authors would like to acknowledge John Pear-
man for proofreading the manuscript and two anonymous reviewers
for the invaluable comments that helped improving a previous version
of the manuscript. This work was partially supported by European
Funds through COMPETE and by National Funds through the Por-
tuguese Science Foundation (FCT) within project PEst-C/MAR/
LA0017/2013.
References
Abele LG, Patton WK (1976) The size of coral heads and the
community biology of associated decapod crustaceans. J Bio-
geography 3:35–47
Anderson MJ, Ellingsen KE, McArdle BH (2006) Multivariate
dispersion as a measure of beta diversity. Ecol Lett 9:683–693
Anonymous (2011) OSPAR Workshop on the improvement of the
definitions of habitats on the OSPAR List. Background
document for discussion: ‘‘Coral Gardens’’, ‘‘Deep Sea Sponge
Aggregations’’ and ‘‘Seapen and Burrowing Megafauna Com-
munities’’. OCEANA. http://eu.oceana.org/en/eu/media-reports/
publications/ospar-workshop-on-the-improvement-of-the-defini
tions-of-habitats-on-the-ospar-list
Attrill MJ, Strong JA, Rowden AA (2000) Are macroinvertebrate
communities influenced by seagrass structural complexity?
Ecography 23:114–121
Attrill MJ, Ramsay PM, Thomas RM, Trett MW (1996) An estuarine
biodiversity hot-spot. J Mar Biol Assoc UK 76:161–175
Bavestrello G, Cerrano C, Zanzi D, Cattaneo-Vietti R (1997) Damage
by fishing activities to the Gorgonian coral Paramuricea clavata
in the Ligurian Sea. Aquat Conserv 7:253–262
Beck MW (2000) Separating the elements of habitat structure: indepen-
dent effects of habitat complexity and structural components on
rocky intertidal gastropods. J Exp Mar Bio Ecol 249:29–49
Bejarano S, Mumby P, Sotheran I (2011) Predicting structural
complexity of reefs and fish abundance using acoustic remote
sensing (RoxAnn). Mar Biol 158:489–504
Bentley LP, Stegen JC, Savage VM, Smith DD, von Allmen EI,
Sperry JS, Reich PB, Enquist BJ (2013) An empirical assessment
of tree branching networks and implications for plant allometric
scaling models. Ecol Lett 16:1069–1078
Bologna PAX, Heck KL Jr (1999) Macrofaunal associations with
seagrass epiphytes: Relative importance of trophic and structural
characteristics. J Exp Mar Bio Ecol 242:21–39
Bozec Y-M, Yakob L, Bejarano S, Mumby PJ (2013) Reciprocal
facilitation and non-linearity maintain habitat engineering on
coral reefs. Oikos 122:428–440
Bradbury RH, Reichelt RE (1983) Fractal dimension of a coral reef at
ecological scales. Mar Ecol Prog Ser 10:169–171
Bradshaw C, Collins P, Brand AR (2003) To what extent does upright
sessile epifauna affect benthic biodiversity and community
composition? Mar Biol 143:783–791
Bruno JF, Stachowicz JJ, Bertness MD (2003) Inclusion of facilitation
into ecological theory. Trends Ecol Evol 18:119–125
Buhl-Mortensen L, Mortensen PB (2005) Cold-water corals and
ecosystems. In: Freiwald A, Roberts JM (eds) Cold-water corals
and ecosystems. Springer-Verlag, Berlin/Heidelberg, pp 849–879
Burkepile D, Hay M (2007) Predator release of the gastropod
Cyphoma gibbosum increases predation on gorgonian corals.
Oecologia 154:167–173
Caballero JA, Schmitter-Soto JJ (2001) Diversity of fishes in small
coral patches of the Mexican Caribbean. Bull Mar Sci 68:337–342
Cacabelos E, Olabarria C, Incera M, Troncoso JS (2010) Effects of
habitat structure and tidal height on epifaunal assemblages
associated with macroalgae. Estuar Coast Shelf Sci 89:43–52
Caley MJ, Buckley KA, Jones GP (2001) Separating ecological
effects of habitat fragmentation, degradation, and loss on coral
commensals. Ecology 82:3435–3448
Carvalho S, Curdia J, Pereira F, Guerra-Garcia JM, Santos MN,
Cunha MR (2014) Biodiversity patterns of epifaunal assem-
blages associated with the gorgonians Eunicella gazella and
Leptogorgia lusitanica in response to host, space and time. J Sea
Res 85:37–47
Cerrano C, Arillo A, Azzini F, Calcinai B, Castellano L, Muti C, Zega
G, Bavestrello G (2005) Gorgonian population recovery after a
mass mortality event. Aquat Conserv 15:147–157
Chabanet P, Ralambondrainy H, Amanieu M, Faure G, Galzin R
(1997) Relationships between coral reef substrata and fish. Coral
Reefs 16:93–102
Chesson P (2000) Mechanisms of maintenance of species diversity.
Annu Rev Ecol Syst 31:343–366
Coles SL (1980) Species diversity of decapods associated with living
and dead reef coral Pocillopora meandrina. Mar Ecol Prog Ser
2:281–291
Conradi M, Lopez-Gonzalez PJ, Cervera JL, Garcıa-Gomez JC (2000)
Seasonality and spatial distribution of peracarids associated with
the bryozoan Bugula neritina in Algeciras Bay, Spain. J Crus-
tacean Biol 20:334–349
Curdia JLS (2012) Gorgonians of the south of Portugal: biology,
ecology and conservation. Ph.D. dissertation, Universidade de
Aveiro, Aveiro
Curdia J, Monteiro P, Afonso CML, Santos MN, Cunha MR,Goncalves JMS (2013) Spatial and depth-associated distribution
patterns of shallow gorgonians in the Algarve coast (Portugal,
NE Atlantic). Helgol Mar Res 67:521–534
Dauby P, Scailteur Y, De Broyer C (2001) Trophic diversity within
the eastern Weddell Sea amphipod community. Hydrobiologia
443:69–86
Davenport J, Butler A, Cheshire A (1999) Epifaunal composition and
fractal dimensions of marine plants in relation to emersion. J Mar
Biol Assoc UK 79:351–355
Dean RL, Connell JH (1987) Marine invertebrates in an algal
succession. III. Mechanisms linking habitat complexity with
diversity. J Exp Mar Bio Ecol 109:249–273
Duffy JE, Hay ME (2000) Strong impacts of grazing amphipods on the
organization of a benthic community. Ecol Monogr 70:237–263
Garcıa-Matucheski S, Muniain C (2010) Predation by the nudibranch
Tritonia odhneri (Opisthobranchia: tritoniidae) on octocorals
from the South Atlantic Ocean. Mar Biodivers 41:287–297
Gee JM, Warwick RM (1994) Metazoan community structure in
relation to the fractal dimensions of marine macroalgae. Mar
Ecol Prog Ser 104:141–150
Goh NK, Ng PK, Chou L (1999) Notes on the shallow water
gorgonian-associated fauna on coral reefs in Singapore. Bull Mar
Sci 65:259–282
Gori A, Rossi S, Berganzo E, Pretus J, Dale M, Gili J-M (2011) Spatial
distribution patterns of the gorgonians Eunicella singularis,
Paramuricea clavata, and Leptogorgia sarmentosa (Cape of
Creus, Northwestern Mediterranean Sea). Mar Biol 158:143–158
Gratwicke B, Speight MR (2005a) The relationship between fish
species richness, abundance and habitat complexity in a range of
shallow tropical marine habitats. J Fish Biol 66:650–667
Gratwicke B, Speight MR (2005b) Effects of habitat complexity on
Caribbean marine fish assemblages. Mar Ecol Prog Ser
292:301–310
Haedrich RL, Devine JA, Kendall VJ (2008) Predictors of species
richness in the deep-benthic fauna of the northern Gulf of
Mexico. Deep Sea Res Part 2(55):2650–2656
Coral Reefs (2015) 34:611–624 623
123

Hall MO, Bell SS (1988) Response of small motile epifauna to
complexity of epiphytic algae on seagrass blades. J Mar Res
46:613–630
HilleRisLambers J, Adler PB, Harpole WS, Levine JM, Mayfield MM
(2012) Rethinking community assembly through the lens of
coexistence theory. Annu Rev Ecol Evol Syst 43:227–248
Hurlbert SH (1971) The nonconcept of species diversity: a critique
and alternative parameters. Ecology 52:577–586
Idjadi JA, Edmunds PJ (2006) Scleractinian corals as facilitators for
other invertebrates on a Caribbean reef. Mar Ecol Prog Ser
319:117–127
Jones E, Thornber CS (2010) Effects of habitat-modifying invasive
macroalgae on epiphytic algal communities. Mar Ecol Prog Ser
400:87–100
Jordan F, DeLeon C, McCreary A (1996) Predation, habitat
complexity, and distribution of the crayfish Procambarus alleni
within a wetland habitat mosaic. Wetlands 16:452–457
Karperien A (1999) FracLac for ImageJ, Version 2.5. http://rsb.info.
nih.gov/ij/plugins/fraclac/FLHelp/Introduction.htm
Kim K, Lasker HR (1997) Flow-mediated resource competition in the
suspension feeding gorgonian Plexaura homomalla (Esper).
J Exp Mar Bio Ecol 215:49–64
Kitting CL, Fry B, Morgan MD (1984) Detection of inconspicuous
epiphytic algae supporting food webs in seagrass meadows.
Oecologia 62:145–149
Knudby A, LeDrew E (2007) Measuring structural complexity on
coral reefs. Proceedings of the American Academy of Under-
water Sciences 26th. Dauphin Island, Alabama, USA, pp 33–43
Kovalenko K, Thomaz S, Warfe D (2012) Habitat complexity:
approaches and future directions. Hydrobiologia 685:1–17
Kruszynski K, Kaandorp J, van Liere R (2007) A computational
method for quantifying morphological variation in scleractinian
corals. Coral Reefs 26:831–840
Kumagai NH (2008) Role of food source and predator avoidance in
habitat specialization by an octocoral-associated amphipod.
Oecologia 155:739–749
Kumagai NH, Aoki MN (2003) Seasonal changes in the epifaunal
community on the shallow-water gorgonian Melithaea flabellif-
era. J Mar Biol Assoc UK 83:1221–1222
Lam NS-N, Quattrochi DA (1992) On the issues of scale, resolution,
and fractal analysis in the mapping sciences. Prof Geogr
44:88–98
Lindberg WJ, Stanton G (1988) Bryozoan-associated decapod
crustaceans: community patterns and a case of cleaning
symbiosis between a shrimp and crab. Bull Mar Sci 42:411–423
Lingo ME, Szedlmayer ST (2006) The influence of habitat com-
plexity on reef fish communities in the northeastern Gulf of
Mexico. Environ Biol Fish 76:71–80
Luckhurst BE, Luckhurst K (1978) Analysis of the influence of
substrate variables on coral reef fish communities. Mar Biol
49:317–323
Martin-Garin B, Lathuiliere B, Verrecchia E, Geister J (2007) Use of
fractal dimensions to quantify coral shape. Coral Reefs
26:541–550
Martin-Smith KM (1993) Abundance of mobile epifauna: The role of
habitat complexity and predation by fishes. J Exp Mar Bio Ecol
174:243–260
Matias MG, Underwood AJ, Hochuli DF, Coleman RA (2010)
Independent effects of patch size and structural complexity on
diversity of benthic macroinvertebrates. Ecology 91:1908–1915
McArdle BH, Anderson MJ (2001) Fitting multivariate models to
community data: a comment on distance-based redundancy
analysis. Ecology 82:290–297
Merks R, Hoekstra A, Kaandorp J, Sloot P (2003) Models of coral
growth: spontaneous branching, compactification and the Lapla-
cian growth assumption. J Theor Biol 224:153–166
Morse DR, Lawton JH, Dodson MM, Williamson MH (1985) Fractal
dimension of vegetation and the distribution of arthropod body
lengths. Nature 314:731–733
Nagelkerken I, Dorenbosch M, Verberk W, de la Moriniere EC, van
Der Velde G (2000) Importance of shallow-water biotopes of a
Caribbean bay for juvenile coral reef fishes: patterns in biotope
association, community structure and spatial distribution. Mar
Ecol Prog Ser 202:175–192
Ohman MC, Rajasuriya A (1998) Relationships between habitat
structure and fish communities on coral. Environ Biol Fish
53:19–31
Orth RJ, Van Montfrans J (1984) Epiphyte–seagrass relationships
with an emphasis on the role of micrograzing: A review. Aquat
Bot 18:43–69
Parker JD, Duffy JE, Orth RJ (2001) Plant species diversity and
composition: experimental effects on marine epifaunal assem-
blages. Mar Ecol Prog Ser 224:55–67
Patton WK (1972) Studies on the animal symbionts of the gorgonian
coral, Leptogorgia virgulata (Lamarck). Bull Mar Sci 22:419–431
Pierre JI, Kovalenko KE (2014) Effect of habitat complexity
attributes on species richness. Ecosphere 5:1–10
Ponti M, Perlini RA, Ventra V, Grech D, Abbiati M, Cerrano C
(2014) Ecological shifts in Mediterranean coralligenous assem-
blages related to gorgonian forest loss. PLoS One 9:e102782
Riegl B, Riegl A (1996) Studies on coral community structure and
damage as a basis for zoning marine reserves. Biol Conserv
77:269–277
Rotjan RD, Lewis SM (2008) Impact of coral predators on tropical
reefs. Mar Ecol Prog Ser 367:73–91
Schneider FI, Mann KH (1991) Species–specific relationships of
invertebrates to vegetation in a seagrass bed. II. Experiments onthe importance of macrophyte shape, epiphyte cover and
predation. J Exp Mar Bio Ecol 145:119–139
Stella JS, Jones GP, Pratchett MS (2010) Variation in the structure of
epifaunal invertebrate assemblages among coral hosts. Coral
Reefs 29:957–973
Stella JS, Pratchett MS, Hutchings PA, Jones GP (2011) Coral-
associated invertebrates: diversity, ecological importance and
vulnerability to disturbance. Oceanogr Mar Biol 49:43–104
Sievanen R, Nikinmaa E, Nygren P, Ozier-Lafontaine H, Perttunen J,
Hakula H (2000) Components of functional–structural tree
models. Ann Forest Sci 57:14
Tokeshi M, Arakaki S (2012) Habitat complexity in aquatic systems:
fractals and beyond. Hydrobiologia 685:27–47
Vytopil E, Willis B (2001) Epifaunal community structure in
Acropora spp. (Scleractinia) on the Great Barrier Reef: impli-
cations of coral morphology and habitat complexity. Coral Reefs
20:281–288
West GB, Brown JH, Enquist BJ (1999) The fourth dimension of life:
Fractal geometry and allometric scaling of organisms. Science
284:1677–1679
Wilson S, Graham N, Polunin N (2007) Appraisal of visual
assessments of habitat complexity and benthic composition on
coral reefs. Mar Biol 151:1069–1076
Younger MS (1979) A handbook for linear regression. Duxbury Press,
North Scituate, MA
Zawada DG, Piniak GA, Hearn CJ (2010) Topographic complexity
and roughness of a tropical benthic seascape. Geophys Res Lett
37:L14604
624 Coral Reefs (2015) 34:611–624
123