How children perceive fractals: Hierarchical self-similarity and cognitive development
MARINE ECOLOGY PROGRESS SERIES Mar Ecol Prog Ser Published June 6
-
Mixed fractals and anisotropy in subantarctic marine macroalgae from South Georgia:
implications for epifaunal biomass and abundance
'University Marine Biological Station Millport, Isle of Cumbrae, Scotland KA28 OEG, United Kingdom 'British Antarctic Survey, High Cross, Madingley, Cambridge CB3 OET, United Kingdom
ABSTRACT- Fractal dimensions (D) of image perimeters of 4 macroalgae (Macrocystis pyrifera, Des- marestia menziesii, Schizoseris condensata, Palmaria georgica) collected a t South Georgia, Southern Ocean were established over a wide scale range For 3 species (M, pynfera, S, condensata, F! georgica) cross-frond D was also estimated. At large scale all species showed complex perimeters ( D 1.26 to 1.83, depending on species), but showed reduced complexity (loxv D) at small scale, and so have mixed frac- tal characteristics. Cross-frond D was low in the 3 species studied, indicating anisotropy, and was markedly low in P. georglca which has extensive, smooth, flat fronds. Epifaunal community analysis demonstrated that epifaunal abundance and biomass were related more to the scale at which com- plexity occurs than degree of complexity itself. S condensata and D. menzjesji (part~cularly complex, high D) show high epifaunal abundance and biomass and a predominance of large animals, M. pyrlfera and P. georgica (simpler, lower D) have low abundances and biomasses and the epifauna is dominated by small animals. M pyrifera is fairly complex (D ca 1.3) at scales above 50 mm; its complexity will impinge on flsh, birds and mammals, not epifauna M. pyrifera beds have a perimeter D (ca 1.4) similar to those of convoluted coastlines.
KEY WORDS: Mixed fractals . Anisotropy . Macroalgae . Epifauna
INTRODUCTION
The first scientific application of fractal dimension (D) was that of Mandlebrot (1967), using the geograph- ical data of Richardson (1961) Mandlebrot demon- strated that, if one attempted to measure the length of a coastline by using dividers and a map, the length depended upon the 'step length' setting of the dividers; the smaller the step length, the longer the measured coastline. The relative complexity of the perimeter of a 2-dimensional structure can be described by its fractal dimension (D). D can most eas- ily be estimated by plotting ('Richardson plot') step length (X) against number of steps needed to 'walk' the perimeter [N(X)] on double logarithmic log paper (Mark 1984). This results in a straight line of slope -D.
D ranges between 1 (perfectly Euclidian differentiable line) and 2 (completely self-similar line, complex at all scales, non-differentiable). In ecological systems mea- surement of D allows formal estimate of a habitat's physical complexity over a wide range of scales. Early applications included est~mates of coral reef fractal dimension (Bradbury & Reichelt 1983, Bradbury et al. 1984, Mark 1984) and the relationship between bald eagle nesting frequency and coastline complexity (Pennycuik & Kline 1986). The major ecological appli- cation of fractal geometry has centred on the links between plant fractal geometry and associated fauna1 community structure (e.g. Morse et al. 1985, Lawton 1986, Shorrocks et al. 1991, Gunnarsson 1992, Gee & Warwick 1994a. b). In general terms, such studies have shown an association between high fractal dimensions of vegetation and greater diversity of animal commu- nity (e.g. Gee & Warwick 1994a), and/or greater rela- tive abundance of smaller animals (Morse et al. 1985,
0 lnter-Research 1996 Resale of full article not permitted

246 Mar Ecol Prog Ser 136: 245-255, 1996
Shorrocks et al. 1991, Gunnarsson 1992, Gee & War- wick 199413).
Measurement of D not only describes self-similarity of structure over many spatial scales, but may also identify scales where distinct changes in complexity occur (Mandlebrot 1977, Burrough 1981). Structures characterized by different D values at different scale ranges are described as 'mixed fractals' (Russ 1994). Investigations on plants have largely ignored mixed fractals, but concentrated instead on comparing simi- larly sized plants with different growth forms (different D), at similar scales, though a lower D at smaller scales was identified in several species by Gee & Warwick (1994a).
Measurement of true surface fractal dimension of objects is difficult and measuring techniques currently rely heavily on assessment of boundary complexity of 2-dimensional images extracted from 3-dimensional objects (Russ 1994). Thus measured, D is a good esti- mate of overall complexity if an object is isotropic, i.e. similarly complex in 3 dimensions as in 2, but not if it is anisotropic, i.e. its complexity in the third dimension is different from that in the other two.
Samples of near-shore brown (Phaeophyceae) and red (Rhodophyceae) subtidal algae of a great range of sizes and growth forms were collected from the sub- antarctic island of South Georgia (54-55" S; 36-38' W) . South Georgia offers a pristine environment, where en- crusting, colonial epifaunal forms (which would compli- cate measurement of epifaunal abundance/biomass of algae) are rare on the fronds of algae.
Subtidal algae were studied, rather than intertidal species, for 2 reasons. Firstly, intertidal macroalgae tend to collapse when emersed, thus altering effective complexity. Secondly, sampling of littoral epifauna at low water may bias samples in favour of small, physio- logically tolerant animals that remain in contact with the emersed macroalgae. Larger or less tolerant ani- mals might only exploit immersed algae and migrate to submerged habitats on the ebb tide. The studies conducted so far that have involved consideration of macroalgal fractal dimension and epifaunal com- munity characteristics (Gee & Warwick 1994a, b) were conducted on intertidal plants sampled during emersion.
The primary objective of the study was to test the fol- lowing hypotheses: (1) That macroalgae have smooth, simple surfaces (and low D) at smaller scales. (2) That the abundance and biomass of epifauna associated with macroalgae are controlled by the scale(s) at which complexity (and high D) emerges, as well as by the complexity itself.
Because fronds of some macroalgal species appear to be smooth and flat to the naked eye, yet have complex perimeters, the second objective of the study was to
test the hypothesis: (3) That algae with flat fronds would be anisotroplc and therefore have lower epifau- nal abundances and biomasses than species with com- plexity in 3 dimensions, even if measured D values were comparable.
This last hypothesis may appear trivial, or even tau- tological, but no previous study of fractals and vegeta- tion appears to have dealt with it, though the freshwa- ter study of Jeffries (1993) includes an elegant attempt to measure 3-dimensional weed fractal dimension.
METHODS
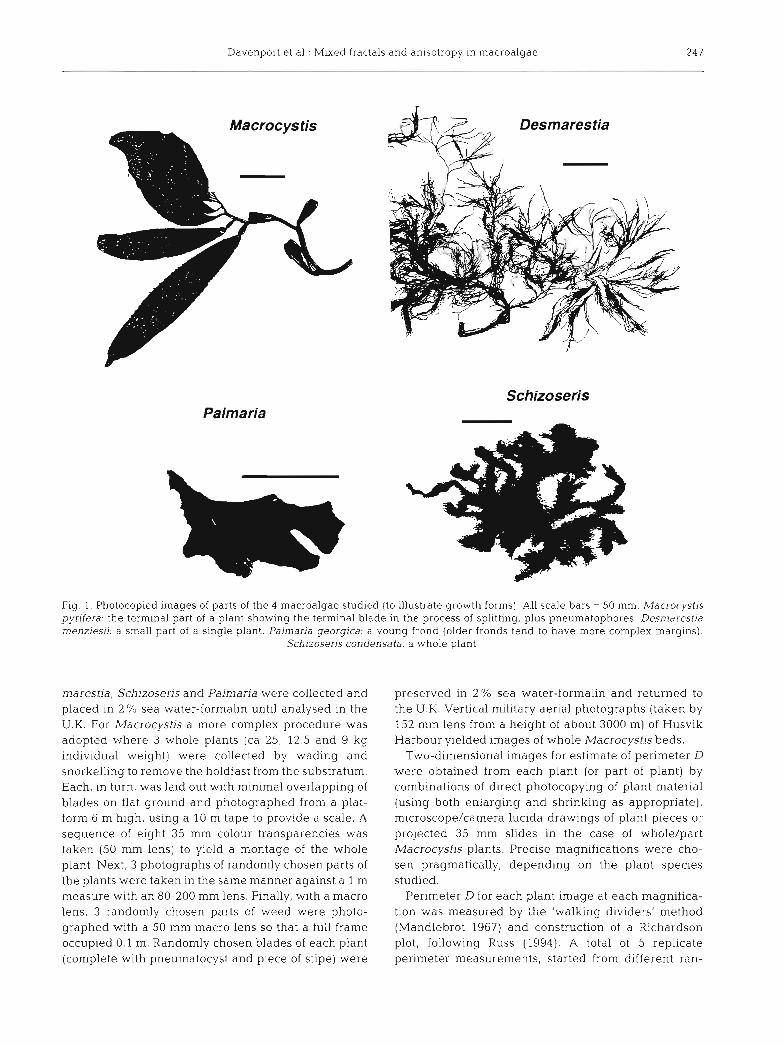
Four species of macroalgae were collected at Husvik Harbour (54" 11' S, 36" 40' W on the sheltered north-east coast of South Georgia) on 11 and 12 March 1994 Collection sites were wave-sheltered and ca 4 km from the open ocean. For distribution of spe- cies see John et al. (1994). Images of all 4 species are shown in Fig. 1.
Macrocystis pyrifera (L . ) C . Aghardh (Phaeophy- ceae). The largest marine alga in the world (Womers- ley 1954). Each plant consists of a number of single cylindrical stipes (ca 4-5 mm diameter, c60 m long) attached to a complex, basket-like holdfast. Long (<0.5 m), flat, pointed fronds (0.29 * 0.05 mm thick- ness) and small gas bladders (pneumatocysts) are attached to the stlpe at regular intervals. Beds of M. pyrifera extend for 50 to 200 m offshore at Husvik (cf. 1000 m in the Falklands, Strange 1992). Hereafter referred to as Macrocystis.
Desmarestia menziesii J. Aghardh (Phaeophyceae). Forms branched, bush-like thickets up to 1 m high. The stipe has an elliptical section (ca 3.5-5 mm diame- ter), and is dichotomously branched 4 to 5 times (first branches 2.5 mm thick, second 1.1 mm, third 0.6 mm, fourth 0.4 mm, with tips of fronds 0.25-0.35 mm thick). Hereafter referred to as Desmarestia.
Schizoseris condensata (Reinsch) R. W . Ricker (Rhodo- phyceae). A complex red alga which, when immersed, appears bushy, conical and <0.3 m high. A dense array of tiny elliptical/circular fronds (2-4 mm long, 0.034 i 0.001 mm thick) are attached to a repeatedly branched stipe. Hereafter referred to as Schizoseris.
Palmaria georgica (Reinsch) R. W . Ricker (Rhodo- phyceae). This species has no stipe; the extremely smooth, flat fronds (0.12 * 0.01 mm thick) have irregu- lar margins, while the thallus is gradually attenuated towards the basal attachment disc. Hereafter referred to as Palmaria.
Collection of algae and images for measurement of fractal dimensions. There were separate collections for fractal and epifaunal analyses, since removal of epi- fauna damages plants. Three specimens each of Des-
Davenport et al.: Mixed fractals and anisotropy in macroalgae 247
Schizoseris Palmaria
Fig. 1. Photocopied images of parts of the 4 macroalgae studied (to illustrate growth forms). All scale bars = 50 mm. Macrocystis pyr~fera the term~nal part of a plant showing the terminal blade in the process of splitting, plus pneumatophores. Desrntlrestia rnenzies~i: a small part of a single plant. Pal~naria georgica: a young frond (older fronds tend to have more complex margins).
Schizoseris condensata- a whole plant
rnarestia, Schizoseris and Palmaria were collected and placed in 2 O/o sea water-formalin until analysed in the U.K. For Macrocystis a more complex procedure was adopted where 3 whole plants (ca 25, 12.5 and 9 kg individual weight) were collected by wading and snorkelling to remove the holdfast from the substratum. Each, in turn, was laid out with minimal overlapping of blades on flat ground and photographed from a plat- form 6 m high, using a 10 m tape to provide a scale. A sequence of eight 35 mm colour transparencies was taken (50 mm lens) to yield a montage of the whole plant. Next, 3 photographs of randomly chosen parts of the plants were taken in the same manner against a 1 m measure with an 80-200 mm lens. Finally, with a macro lens, 3 randomly chosen parts of weed were photo- graphed with a 50 mm macro lens so that a full frame occupied 0.1 m. Randomly chosen blades of each plant (complete with pneumatocyst and piece of stipe) were
preserved in 2 % sea water-formalin and returned to the U.K. Vertical military aerial photographs (taken by 152 mm lens from a height of about 3000 m) of Husvik Harbour ylelded images of whole Macrocystis beds.
Two-dimensional images for estimate of perimeter D were obtained from each plant (or part of plant) by combinations of direct photocopying of plant material (using both enlarging and shrinking as appropriate), microscope/camera lucida drawings of plant pieces or projected 35 mm slides in the case of whole/part Macrocystis plants. Precise magnifications were cho- sen pragmatically, depending on the plant species studied.
Perimeter D for each plant image at each magnifica- tion was measured by the 'walking dividers' method (Mandlebrot 1967) and construction of a Richardson plot, following Russ (1994). A total of 5 replicate perimeter measurements, started from different ran-
Mar Ecol Prog Ser 136: 245-255, 1996
domly selected points, were made from each magnifi- cation; and, for a given image, at least 5 points in the straight line region of the Richardson plot for each of 3 plants of each species were regressed to calculate D.
For Macrocystis, Schizoseris and Palmaria, cross- frond D was calculated from 3 fronds of each species cut transversely with a metal ruler and sharp scalpel. Profile images of the cut edges were obtained by photocopying, photomicrography and scanning elec- tron microscopy (the last after air-drying and gold- coating) as appropriate to the scale investigated. D was subsequently estimated by dividers and Richardson plot as described above. Cross-frond measurements of D for Desmarestia were inappropriate because its twig-like fronds have a circular/elliptical cross section and so would yield spuriously high D values (Mandle- brot 1967).
Assessment of epifaunal samples. To prevent loss of mobile epifauna, samples of macroalgae for epifaunal analysis were collected in the following manner. Whole plants, or individual stipes of Macrocystis, were each encased under water by a polythene bag suffi- ciently large to enclose the whole plant sample without disturbance of the mobile epifauna. Portions of 3 Macrocystis stipes as well as complete Desmarestla (3 plants), Schizoseris (5) and Palmaria (4) were col- lected in this fashion.
Macrocystis stipes, because of their size, had to be treated in a different fashion from the rest of the mate- rial. These were removed (in their polythene bags) from the shore, and fronds of each sample were pro- gressively broken off and scrubbed into a bucket of sea water to remove all epifauna. The resulting suspension was filtered through a 125 pm bronze mesh screen from which any material (fauna or debris) was col- lected and retained for sorting. It should be noted that 125 pm was not the effect~ve pore size of the bronze mesh; Macrocystis continually exudes viscous shme, especially when cut. Pilot trials showed that the slime totally blocked a 64 pm sieve, and water flow was slow even with the 125 pm screen. Each holding bag was washed out onto the same screen and any material col- lected. Extracted fauna1 samples were fixed in 2 % sea water-formalin for 3 d, washed in fresh water, filtered through a dual 2 mm/125 pm set of screens and the fauna picked off, counted and fixed in 5% sea water- formalin for transportation to the U.K. The pieces of each stipe were blotted dry, bundled and weighed on a Salter spring balance (accuracy + l 0 g) and discarded.
For all, of the other macroalgae collected, each plant, complete with any fauna in its surrounding polythene bag, was placed in a bucket of 2% sea water-formalin and agitated for 5 min to detach most mobile animals. After 3 d in fixative all epifauna was picked off the algae and sieved and sorted as described for Macro-
cystis. Each plant was blotted dry and weighed (accu- racy -10.01 g).
On return to the U.K., all epifaunal samples were identified as far as possible and numbers and/or bio- mass established for each taxon. If there were less than 30 animals in a given taxon, the maximum linear dimension ('length'] of each was measured via a micro- scope and eyepiece graticule, and mean, minimum and maximum lengths established. Where more than 50 animals per taxon were collected, a random sub- sample of 30 were measured to yield a mean length, but the whole sample was inspected for thc largest and smallest animals.
RESULTS
Fractal dimensions
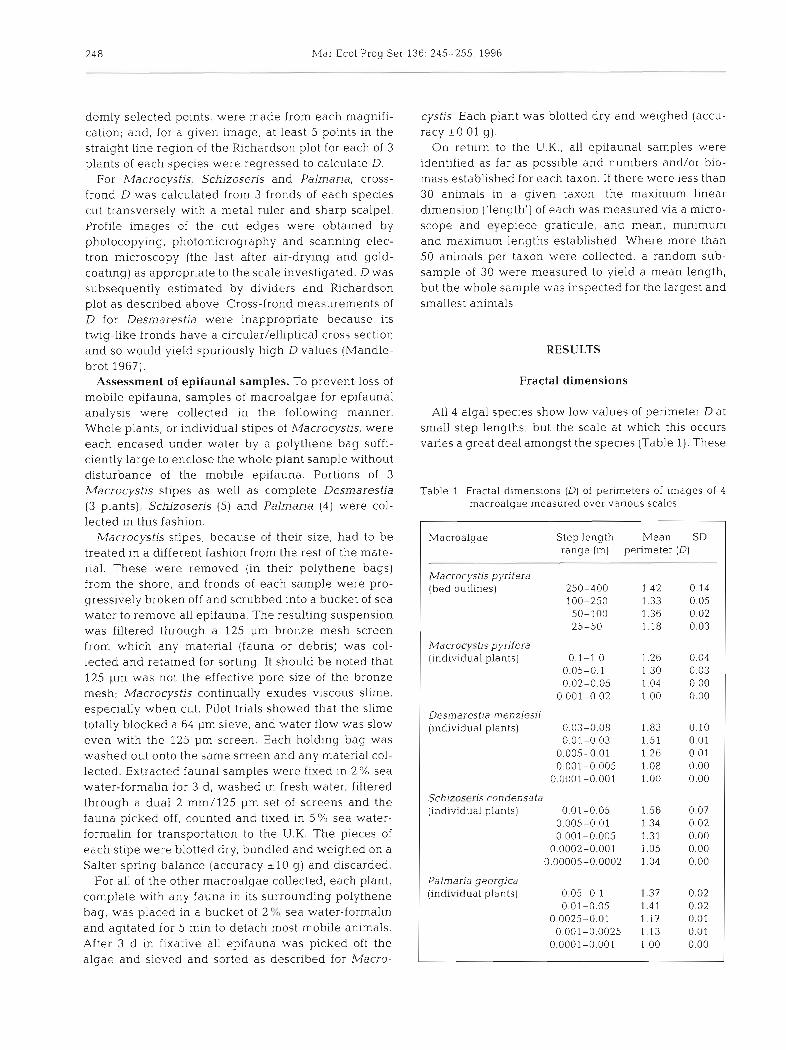
All 4 algal species show low values of penmeter D at small step lengths, but the scale at which this occurs varies a great deal amongst the species (Table 1). These
Table 1 Fractal dimensions (D) of perimeters of images ol r
macroalgae measured over various scales
Macroalgae Step length Mean SD range (m) perimeter (D)
Macrocyst~s pyrifera (bed outlines) 250-400 1.42 0.14
100-250 1.33 0.05 50-100 1 36 0.02 25-50 1.18 0.03
Macrocystis pyrifera (individual plants) 0.1-1.0 1.26 0.04
0.05-0.1 1.30 0.03 0.02-0.05 1..04 0.00
0.001-0.02 1-00 0.00
Desmarestia menziesii (individual plants) 0.03-0.08 1.83 0.10
0.01-0.03 1.51 0.01 0.005-0.01 1.26 0.01 0.001-0.005 1.08 0.00
0.0001-0.001 1-00 0.00
Schizoseris condensa ta (individual plants) 0.01-0.05 1 56 0.07
0.005-0.01 1.34 0.02 0.001-0.005 1.31 0.00
0.0002-0.001 1.05 0.00 0.00005-0.0002 1.04 0.00
Palmaria georgica (individual plants) 0.05-0 1 1 37 0.02
0.01-0.05 1.41 0.02 0.0025-0.01 1.17 0.01
0.001-0.0025 1.13 0.01 0.0001-0.001 1 0 0 0.00
Davenport et al.. Mlxed fractals and anlsotropy In macroalgae 249
data show that it is by no means easy to identify relative conlplexity amongst the algal species from perimeter D Visual con~parison suggests that complexity is in the following sequence: Palmaria < Macrocystis < Des- marestia < Schizoseris. Although Desmarestia and Schizoseris do show the highest D values (1.83 and 1.56 respectively), such values are only recorded for a lim- ited part of the whole step length range.
The D values for Macrocystis beds in the step length range 25-50 m are s d a r to the values recorded for single plants in the range 0.1-1 m, but at greater step lengths, particularly 250-400 m, Dis slightly hgher (ca 1.4).
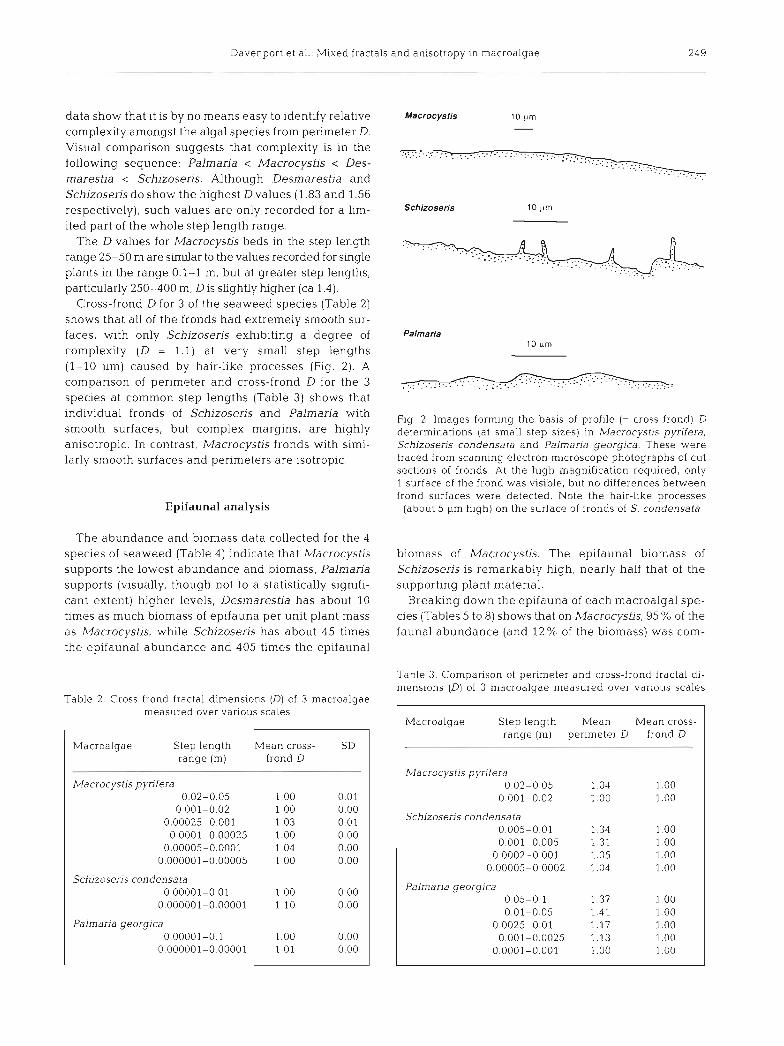
Cross-frond D for 3 of the seaweed species (Table 2) shows that all of the fronds had extremely smooth sur- faces, with only Schizoseris exhibiting a degree of complexity (D = 1.1) at very small step lengths (1-10 pm) caused by hair-like processes (Fig. 2 ) . A comparison of perimeter and cross-frond D for the 3 species at common step lengths (Table 3) shows that individual fronds of Schizoseris and Palmaria with smooth surfaces, but complex margins, are highly anisotropic. In contrast, Macrocystis fronds with simi- larly smooth surfaces and perimeters are isotropic.
Epifaunal analysis
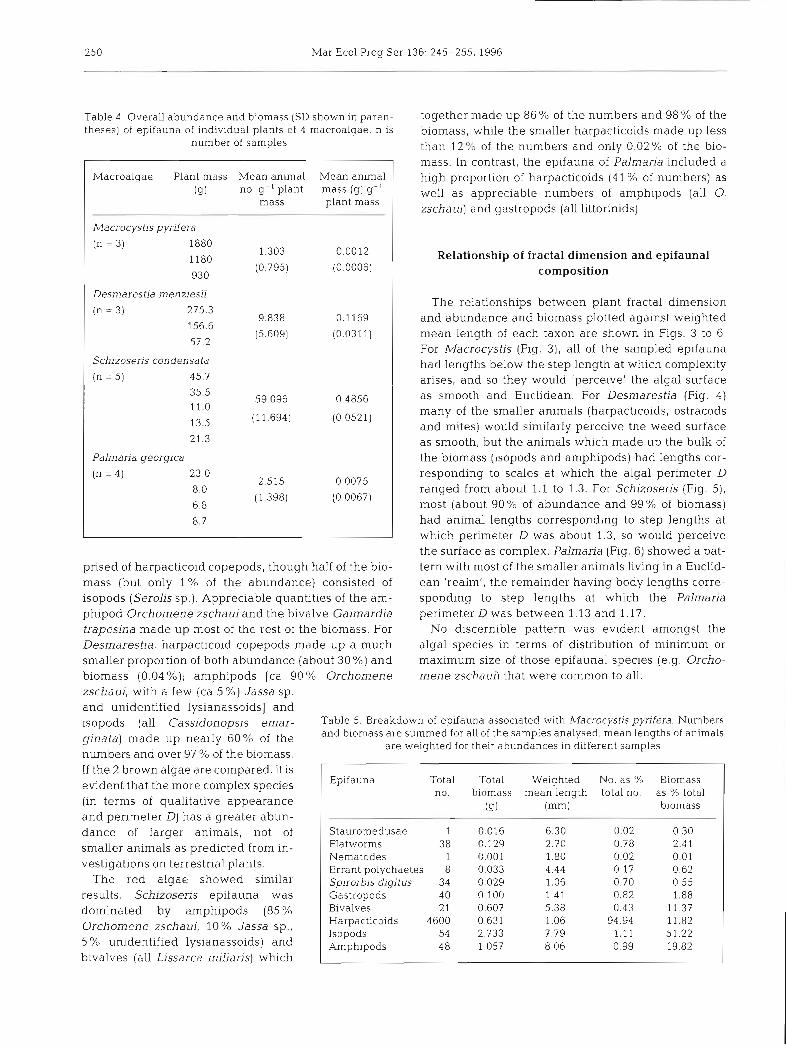
The abundance and biomass data collected for the 4 species of seaweed (Table 4) indicate that Mac]-ocystis supports the lowest abundance and biomass, Palmaria supports (visually, though not to a statistically signlfi- cant extent) higher levels, Desn~arestia has about 10 times as much biomass of epifauna per unit plant mass as Macrocystis, while Schizoseris has about 45 times the epifaunal abundance and 405 times the epifaunal
Table 2 Cross-frond fractal dimensions (D) of 3 macroalgae measured over varlous scales
Macroalgae Step length Mean cross- SD range (m) frond D
Macrocyst~s pynfera 0 02-0 05 1 00 0 01
0 001-0 02 1 00 0 00 0 00025-0 001 1 03 0 01
00001-000025 1 0 0 0 00 0 00005-0 0001 1 04 0 00
0 000001-0 00005 1 00 0 00
Sch~zoseris condensata 0 00001-0 01 1 00 0 00
0000001-000001 1 1 0 0 00
Palmar~a geo rg~ca 0 00001-0 1 1 00 0 00
0000001-000001 1 0 1 0 00
Macrocysrls 10 ,um
Schlzoseris 10 pm
Palmarla 10 pm
Fig. 2 . Images forming the basis of profile (= cross frond) D determinations (at small step sizes) in Macrocystis pynfera, Sch~zoseris condensata and Pa lmar~a georglca. These were traced from scanning electron microscope photographs of cut sections of fronds. At the high magnification required, only 1 surface of the frond was visible, but no differences between frond surfaces were detected. Note the hair-like processes
(about 5 pm high) on the surface of fronds of S. condensata
biomass of Macrocystis. The epifaunal biomass of Schizoseris is remarkably high, nearly half that of the supporting plant material.
Breaking down the epifauna of each macroalgal spe- cies (Tables 5 to 8) shows that on Macrocystis, 95 % of the fauna1 abundance (and 12% of the biomass) was conl-
Table 3 Companson of perimeter and cross-frond fractal dl- mensions (D) of 3 macroalgae measured over varlous scales
Macroalgae Step length Mean Mean cross- range (m) perlmeter D frond D
Macrocystis pyr~fera 0 02-0 05 1 04 1 00
0 001-0 02 1 00 1 00
Schizoseris condensata 0 005-0 01 1 34 1 00 0 001-0 005 1 3 1 1 00
0 0002-0 001 1 05 1 00 0 00005-0 0002 1 04 1 00
Palmana georgica 0 05-0 1 1 37 1 00 0 01-0 05 1 4 1 1 00
0 0025-0 01 1 1 7 1 00 0 001-0 0025 1 13 l 00
00001-0001 1 00 1 00
250 Mar Ecol Prog Ser 136: 245-255. 1996
( Macrocystis pyrifera I
Table 4 . Overall abundance and biomass (SD shown in paren- together made up 86% of the numbers and 98% of the theses) of ep~fauna of individual plants of 4 macroalgae. n is biomass, while the smaller harpacticoids made up less
number of samples than 1 2 % of the numbers and only 0 .02% of the bio- mass. In contrast, the eplfauna of Palmaria included a
Desmarestia menziesii (n = 3) 275.3
156.6
57.2
Schizoseris condensa ta
(n = 5) 45.7
Macroalgae Plant mass Mean animal Mean animal (g) no. g-' plant mass (g) g - '
mass plant mass
l l 35.5
11.0
13.5
21.3
Palmaria georgica (n = 4) 23.0
8.0
6.8
8.7
high proportion of harpacticoids (41 % of numbers) as well as appreciable numbers of amphipods (all 0. zschaui] and gastropods (all littorinids).
prised of harpacticoid copepods, though half of the bio- mass (but only 1 % of the abundance) consisted of isopods (Serolis sp.). Appreciable quantities of the am- phipod Orchomene zschaui and the bivalve Gaimardia trapesina made up most of the rest of the biomass. For Desmarestia, harpacticoid copepods made up a much smaller proportion of both abundance (about 30%) and biomass (0.04 %); amphipods [ca 90 % Orchomene zschaui, with a few (ca 5 74) Jassa sp. and uni.dentified lysianassoidsl and
Relationship of fractal dimension and epifaunal composition
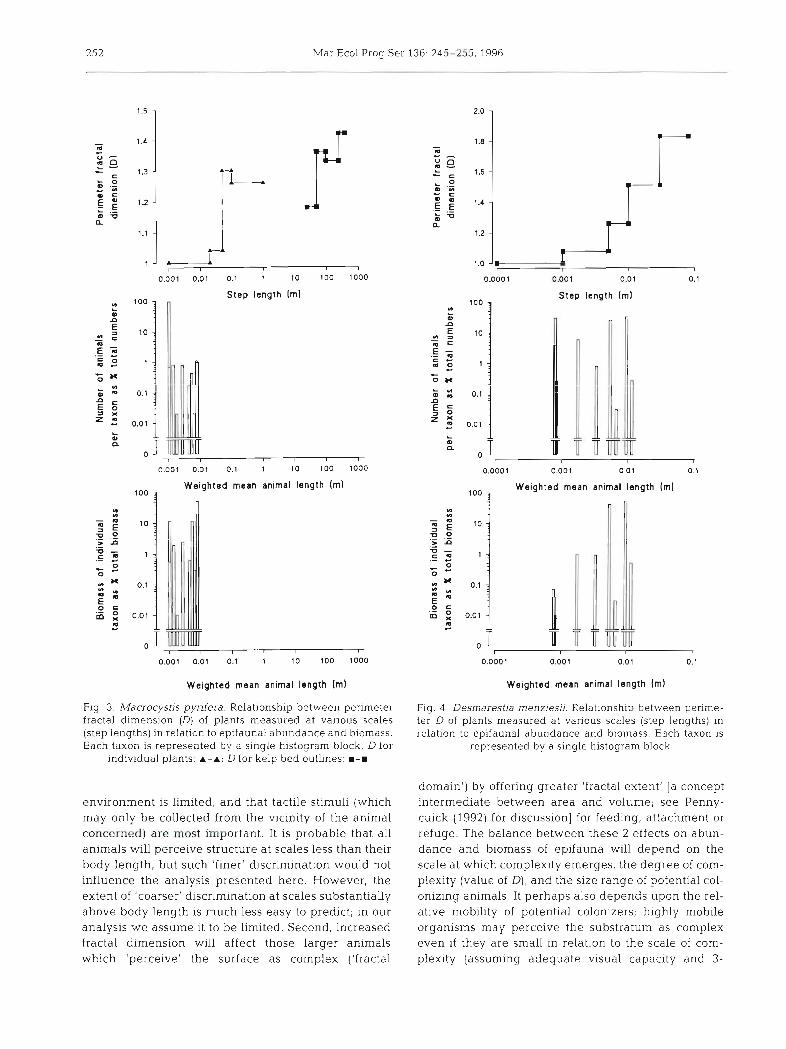
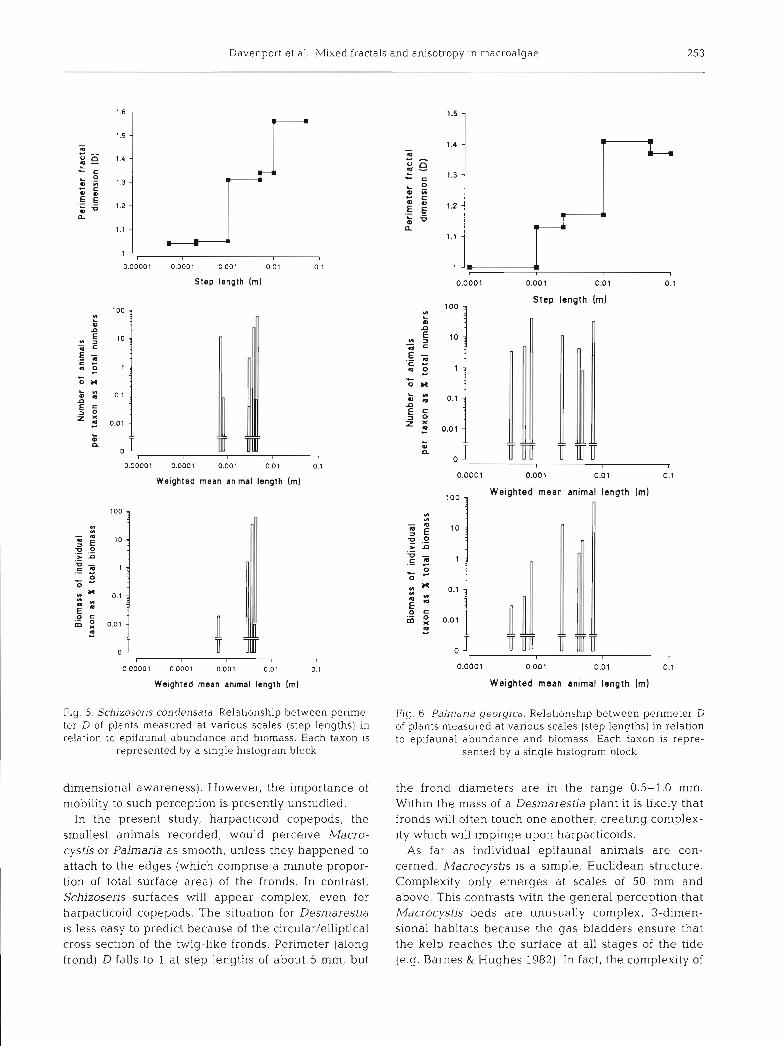
The relationships between plant fractal dimension and abundance and biomass plotted against weighted mean length of each taxon are shown in Figs. 3 to 6. For Macrocystis (Fig. 3), all of the sampled epifauna had lengths below the step length at which complexity arises, and so they would 'perceive' the algal surface as smooth and Euclidean. For Desmarestia (Fig. 4 ) many of the smaller animals (harpacticoids, ostracods and mites) would similarly perceive the weed surface as smooth, but the animals which made up the bulk of the biomass (isopods and amphipods) had lengths cor- responding to scales at which the algal perimeter D ranged from about 1.1 to 1.3. For Schizoseris (Fig. 5), most (about 90 % of abundance and 99 % of biomass) had animal lengths corresponding to step lengths at which perimeter D was about 1.3, so would perceive the surface as complex. Palmaria (Fig. 6) showed a pat- tern with most of the smaller animals living in a Euclid- ean 'realm', the remainder having body lengths corre- sponding to step lengths at which the Palmaria perimeter D was between 1.13 and 1.17.
No discernible pattern was evident amongst the algal species in terms of distribution of minimum or maximum size of those epifaunal species (e.g. Orcho- mene zschaui] that were common to all.
isopods (all Cassjdonopsjs emar- Table 5. Breakdown of epifauna associated wlth Macrocystis pyrifera. Numbers
gins made up nearly of the and biomass are summed for all of the samples analysed; mean lengths of animals are weighted for their abundances in different samples
numbers and over 97 % of the biomass. If the 2 brown algae are compared, it is evident that the more complex species (in terms of qualitative appearance and perimeter D) has a greater abun- dance of larger animals, not of smaller animals as predicted from in- vestigations on terrestrial plants.
The red algae showed similar results. Schizoseris epifauna was dominated by amphipods (85 % Orchomene zschaui, 10% Jassa sp., 5 % unidentified lysianassoids) and bivalves (all Lissarca miliaris) which
Epifauna Total Total Weighted No, as % Biomass no. biomass mean length total no as O/o total
(9) (mm) biomass
Stauromedusae Flatworms Nematodes Errant polychaetes Spirorbis digitus Gastropods Bivalves Harpacticoids Isopods Amphipods
Davenport et al.: Mixed fractals and anisotropy in macroalgae
DISCUSSION
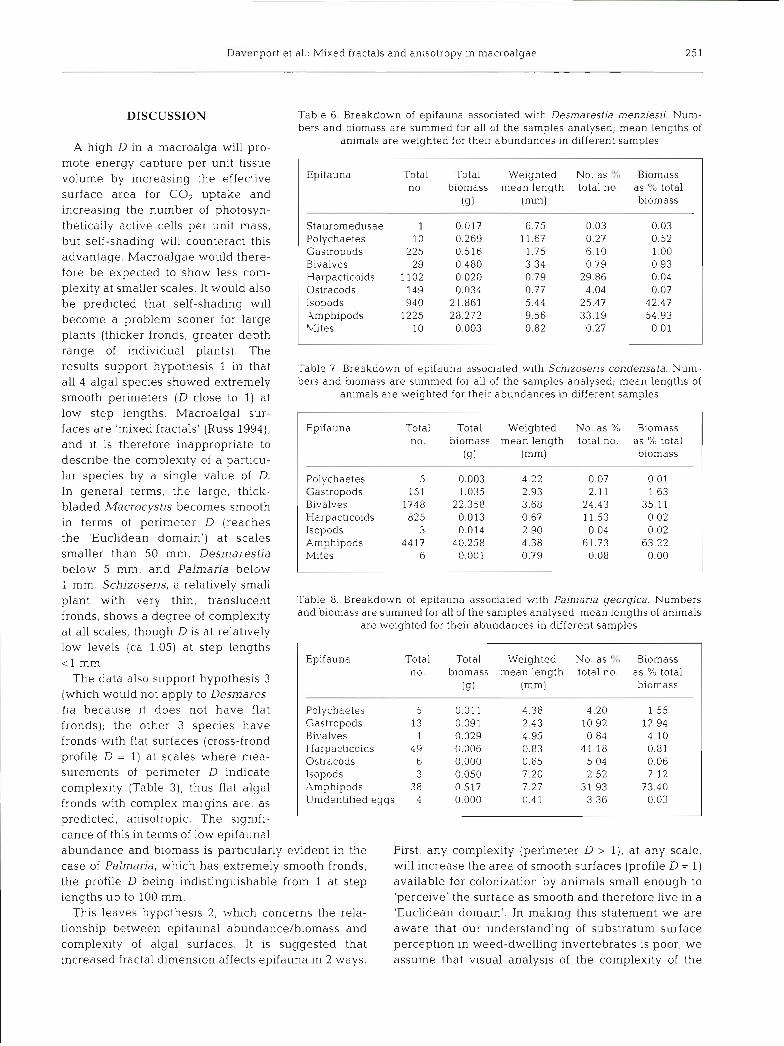
A high D in a macroalga will pro- mote energy capture per unit tissue volume by increasing the effective surface area for CO2 uptake and increasing the number of photosyn- thetically active cells per unit mass, but self-shading will counteract this advantage. Macroalgae would there- fore be expected to show less com- plexity at smaller scales. It would also be predicted that self-shading will become a problem sooner for large plants (thicker fronds, greater depth range of individual plants). The results support hypothesis 1 in that all 4 algal species showed extremely smooth perimeters (D close to 1) at low step lengths. Macroalgal sur- faces are 'mixed fractals' (Russ 1994), and it is therefore inappropriate to describe the complexity of a particu- lar species by a single value of D. In general terms, the large, thick- bladed Macrocystis becomes smooth in terms of perimeter D (reaches the 'Euclidean domain') at scales smaller than 50 mm, Desrnarestia below 5 mm, and Palmaria below 1 mm. Schizoseris, a relatively small plant with very thin, translucent fronds, shows a degree of complexity at all scales, though D is at relatively low levels (ca 1.05) at step lengths < l mm.
The data also support hypothesis 3 (which would not apply to Desmares-
Tablle 6. Breakdown of epifauna associated with Desmarestja rnenziesij. Num- bers and biomass are summed for all of the samples analysed; mean lengths of
animals are welghted for their abundances in different samples
Epifauna Total no
Total blomass
(91
Weighted mean length
(mm)
No. as % total no.
Biomass as X total biomass
Stauromedusae 1 Polychaetes 10 Gastropods 225 Bivalves 29 Harpacticoids 1102 Ostracods 149 Isopods 940 Amphipods 1225 Mites 10
Table 7. Breakdown of epifauna associated with Schizoseris condensata. Num- bers and biomass are summed for all of the samples analysed; mean lengths of
animals are weighted for their abundances in different samples
Epifauna Total Total Weighted No. as % Biomass no. biomass mean length total no. as % total
(9) (mm) biomass
Polychaetes 5 0.003 4.22 0.07 0.01 Gastropods 151 1.035 2.93 2.11 1.63 Bivalves 1748 22.358 3.68 24.43 35.11 Harpacticoids 825 0.013 0.67 11.53 0.02 Isopods 3 0.014 2.90 0.04 0.02 Amphipods 4417 40.258 4.38 61.73 63.22 Mites 6 0.001 0.79 0.08 0.00
Table 8. Breakdown of epifauna associated with Palnlaria georyica. Numbers and biomass are summed for all of the san~ples analysed; mean lengths of animals
are weighted for their abundances in different samples
Epifauna Total Total Weighted No. as % Biomass no. biomass mean length total no. as % total
(g) (mm) biomass
tia because it does not have flat I Pol~chaetes 5 0.011 4.38 4.20 1.55 1 fronds); the other 3 species have I ~ a s t r o ~ o d s
surements of perimeter D indicate I I S O ~ O ~ S
fronds'with flat surfaces(cross-frond profile D = 1) at scales where mea-
Bi"dlves Harpacticoids Ostracods
First, any complexity (perimeter D > l), at any scale, will increase the area of smooth surfaces (profile D = 1) available for colonization by animals small enough to 'perceive' the surface as smooth and therefore live in a 'Euclidean domain'. In making this statement we are aware that our understanding of substratum surface perception in weed-dwelling invertebrates is poor; we assume that visual analysis of the complexity of the
complexity (Table 3), thus flat algal fronds with complex margins are, as
Amphipods 38 0.517 7.27 31.93 73.40 hidentified eggs 0.000 0.41 3.36 0.03
predicted, anisotropic. The signifi- cance of this in terms of low epifaunal abundance and biomass is particularly evident in the case of Palmaria, which has extremely smooth fronds, the profile D being indistinguishable from 1 at step lengths up to 100 mm.
This leaves hypothesis 2, which concerns the rela- tionship between epifaunal abundance/biomass and complexity of algal surfaces. It is suggested that increased fractal dimension affects epifauna in 2 ways.
Mar Ecol Prog Ser 136: 245-255, 1996
1 .o I
0.0001 OAOl 0.01 0.1
Step length (m1 Step length (m1
0.001 0.01 0.1 1 10 l00 1000
Weighted mean animal length (m] l00 3 100 3
Weighted mean animal length (m)
Weighted mean animal length ( m ) Weighted mean animal length (m]
Fig. 3. Macrocystis pyrifera. Relationship between perimeter fractal dimension (D) of plants measured at vanous scales (step lengths) in relation to epifaunal abundance and biomass. Each taxon is represented by a slngle histogram block D for
individual plants: A-A; D for kelp bed outlines: =-m
Fig. 4. Desmarestia menziesii. Relationship between perime- ter D of plants measured at various scales (step lengths) in relation to epifaunal abundance and biomass. Each taxon is
represented by a single histogram block
domain') by offering greater 'fractal extent' [a concept intermediate between area and volume; see Penny- cuick (1992) for discussion] for feeding, attachment or refuge. The balance between these 2 effects on abun- dance and biomass of epifauna will depend on the scale at which complexity emerges, the degree of com- plexity (value of D), and the size range of potential col- onizing animals. It perhaps also depends upon the rel- ative mobility of potential colonizers; highly mobile organisms may perceive the substratum as complex even if they are small in relation to the scale of com- plexity (assuming adequate visual capacity and 3-
environment is limited, and that tactile stimu1.i (which may only be collected from the vicinity of the animal concerned) are most important. It is probable that all animals will perceive structure at scales less than their body length, but such 'finer' discrimination would not influence the analysis presented here. However, the extent of 'coarser' discrimination at scales substantially above body length is much less easy to predict; in our analysis we assume it to be limited. Second, increased fractal dimension will affect those larger animals which 'perceive' the surface as complex ('fractal
Davenport et a l . . Mixed fractals and anisotropy in macroalgae
1
0.00001 0.0001 0.001 0.01 0.1
Step length (m)
Weighted mean animal length (m)
Wsightad mean animal length [m)
Step length (m)
0.0001 0.001 0.0 1 0.1
Weighted mean animal length (m)
n
Weighted mean animal length (m1
Fig. 5. Schizoseris condensata. Relationship between perime- Flg 6 . Paln7dria georgjca. Relationship between perimeter D ter D of plants measured at various scales (step lengths) in of plants measured at various scales (step lengths) In relation relation to epifaunal abundance and biomass. Each taxon is to epifaunal abundance and biomass Each taxon is repre-
represented by a single histogram block sented by a single histogram block
dimensional awareness). However, the importance of mobility to such perception is presently unstudied.
In the present study, harpacticoid copepods, the smallest animals recorded, would perceive Macro- cystis or Palmaria as smooth, unless they happened to attach to the edges (which comprise a minute propor- tion of total surface area) of the fronds. In contrast, Schizoseris surfaces will appear complex, even for harpacticoid copepods. The situation for Desn~arestia is less easy to predict because of the circular/elliptical cross section of the twig-like fronds. Perimeter (along frond) D falls to 1 at step lengths of about 5 mm, but
the frond diameters are in the range 0.5-1.0 mm. Within the mass of a Desmarestia plant it is likely that fronds will often touch one another, creating complex- ity which will impinge upon harpacticoids.
As far as individual epifaunal animals are con- cerned, Macrocystis is a simple, Euclidean structure. Complexity only emerges at scales of 50 mm and above. This contrasts with the general perception that Macrocystis beds are unusually complex, 3-dimen- sional habitats because the gas bladders ensure that the kelp reaches the surface at all stages of the tide (e.g. Barnes & Hughes 1982). In fact, the complexity of
Mar Ecol Prog Ser 136: 245-255, 1996
Macrocystis does impact upon animals, but only larger ones not collectable in the present study. At Husvik it is known that fish (particularly Notothenia rossi) move through the kelp forest, preying on epifauna (Burchett 1983, Burchett et al. 1983); they are preyed upon in turn by South Georgia fur seals (Arctocephalus tropi- calis gazella). Davenport (1995) has recently reported that kelp gulls (Larus dominicanus) at Husvik spend many hours each day feeding on epifauna of Macro- cystis fronds floating at the surface, while moulting southern elephant seals (Mirounga leonina) are often seen resting in beds of baskel kelp, sometimes for sev- eral days. All of these animals (ranging from about 0.3 to 6 m in body length, and from about 0.2 to 3500 kg) are as much inhabitants of Macrocystis as the epifauna studled here - but they will perceive a complex 3- dimensional habitat with a D of about 1.3.
At even larger scales, Macrocystis beds have a perimeter D of ca 1.4, similar to some published values for particularly convoluted coastlines (e.g. Pennycuik & Kline 1986). South Georgia was recently heavily glaciated, and it seems probable that the high D shown by Macrocystis beds at step lengths of 250-400 m is likely to be partly due to the nature of the coastline around which the beds are distributed.
A particularly important finding of the study con- cerned the relationship between algal fractal dirnen- sion and epifaunal size distribution. Both Schizoseris and Desmarestia exhibited complexity in 3 dimen- sions, exhibited high values of D and showed epifaunal dominance (in terms of abundance as well as biomass) by relatively large animals (amphipods, isopods, bivalves), while the epifauna of Macrocystis and Pal- maria, with values of D ca l , was dominated by smaller species; this was part~cularly marked in the case of Macrocystis in which 95 O/o of the epifaunal abundance consisted of harpacticoid copepods. This contrasts completely with findings for terrestrial plants in which high fractal dimension is associated with dominance by smaller forms (e.g. Morse et al. 1985). It also con- flicts with the recent study of Gee & Warwick (1994b) which demonstrated a similar (but much weaker) dom- inance of smaller forms (mainly harpacticoids) in inter- tidal algae. Our study, like that of Gee & Warwick (1994b), relied considerably on sampling harpacticoid copepods. It may be argued (following Hicks 1980, 1985) that the 125 pm sieving method employed might have overestimated harpacticoid abundance on flat algae such as Macrocystis, in comparison with a bushy species such as Schizosens, because of morphological differences between copepod types (broad and flat- tened on flat-fronded algae, long and thin on fine algae). We believe that this is less of a problem on South Georgia than on the U.K. coasts studied by Hicks (1980, 1985) for 4 reasons: flrst, the harpacticoid
fauna at South Georgia appeared relatively depauper- ate and there was no obvious species prevalence on individual macroalgal species; second, there was no significant size difference between copepods collected from different macroalgal species; third, there was no obvious preponderence of stouter harpacticoid species m the Macrocystis samples or slimmer ones in those collected from Schizosens; fourth, none of the macro- algae studied were of the fine, filamentous type (e.g. Cladophora spp.) that features particularly slim harpacticoids.
Morse et al. (1985) worked in a terrestrial environ- ment where the fluid surrounding the vegetation was air; Gee & Warwick (1994a, b) studied macroalgae liv- ing in the harsh intertidal environment where they were also exposed to aerial ~nfluences. We believe that our divergent findings for the epifaunal composition of subtidal macroalgae probably reflect the very different physical characteristics of the fully aquatic medium. Rates of gaseous exchange are rarely diffusion limited In the terrestrial environment, but such l~mitation can be of profound significance in water (see Alexander 1971 for discussion). Complexity in algae is likely to result in low rates of water movement around the plant structure and hence thicker unstirred layers. Only ani- mals capable of powerful ventilation of the respiratory/ excretory surfaces would be able to take full advan- tage of complexity (though their presence would also benefit smaller epifaunal neighbours). Amphipods, isopods and bivalves all have such mechanisms; harpacticoid copepods are in the size range of animals which do not have specialized respiratory and circula- tory systems, so rely on simple diffusion. We strongly suspect that the macroalgae studied by Gee & War- wick (1994a, b) are also colonized by numbers of mobile amphipods - but only when the tide is in.
Another contributory factor to the unexpected size distribution of epifauna in Schizoseris and Desmarestia was the dominant presence of amphipods, particularly Orchornene zschaui. 0. zschaui is a nocturnal scav- enger (Moore 1994); during the day (when algal collec- tions were made) they were effectively 'roosting' on the macroalgae, which provided support and refuge. Nocturnal algal sampling might thus have resulted in a very different epifaunal composition, wlth lower bio- mass and dominance of 'resident' species such as bivalves, Jassa sp. and isopods.
Acknowledgements The authors thank the Bntlsh Antarctic Survey (BAS) for loglstlc backup and access to facllltles on South Georgla They thank Commander A Massey, officers and crew of HMS 'Newcastle' and Captain J Cole, offlcers and crew of RRS 'James Clark Ross' for hospltal~ty en route to and from South Georgla J D thanks the Royal Soclety and the Transantarctlc Assoc~at~on for travel fundlng that allowed him to work at Husvik He IS also grateful to Drs D W H Wal- ton and W Block of BAS for lnvltlng hlm to work at South
Davenport et a1 . h4ixed fractals and anisotropy in macroalgae 255
Georgla lVr H. h4acAlister is thanked for his invaluable local experience and advice. Prof. P. G Moore (UMBSM) and Dr J . Taylor (Natural History Museum) a re thanked for identifica- tion of matenal The authors are grateful for the constructlve comments of 3 anonymous referees
LlTERATURE CITED
Alexander RMcN (1971) Size and shape Edward Arnold Ltd London
Barnes RSK, Hughes RN (1982) An introduction to manne ecology Black\.vell Scient~fic Publications Oxford
Bradbury RH, Reichelt RE (1983) Fractal dlmension of a coral reef at ecological scales Mar Ecol Prog Ser 10 169-171
Bradbury RH, Relchelt RE, Green DG (1984) Fractals in ecol- ogy methods and Interpretation Mar Ecol Prog Ser 14 295-296
Burchett MS (1983) Food and feeding behaviour of Notothenla rossl from South Georgia Br Antarct Surv Bull 61 45-51
Burchett MS, Sayers PJ, North AW, White MG (1983) Some biological aspects of the nearshore flsh populat~ons at South Georgia Br Antarct Surv Bull 59 63-74
Burrough PA (1981) Fractal dimensions of landscapes and other environmental data Nature 294 240-242
Davenport J (1995) Upwelling-generated plankton strand- llnes important predictable food sources for shore birds at Husvik, South Georgla Mar B101 123 207-217
Gee JM, Warwlck RM (1994a) Metazoan communlty structure in relation to the fractal dimensions of manne macroalgae Mar Ecol Prog Ser 103 141-150
Gee JM, Warwick RM (1994b) Body-size distnbutlon in a manne metazoan communlty and the fractal dimensions of macroalgae J Exp Mar B101 Ecol 178 247-259
Gunnarsson B (1992) Fractal dimension of plants and body size distnbution in spiders Funct Ecol 6 636-641
Hicks GR (1980) Structure of phytal harpactlcoid copepod assemblages and the Influence of habltat complexity and turbidity J Eup Mar Biol Ecol44 157-192
Hicks GR (1985) Metofauna associated w ~ t h rocky shore algae In Moore PG, Seed R (eds) The ecology of rocky coasts Hodder & Stoughton, London, p 36-56
T h ~ s article was submitted to the editor
Jeffries M (1993) Invertebrate colonization of art~ficial pond- weeds of dlffer~ng fractal dimension. Oikos 67:142-148
John DM, Pugh PJA, T~t t ley 1 (1994) Observations on the ben- thic marine algal flora of South Georgia. a floristic and ecological analysis. Bull Br Nat Hist Mus Lond (Bot) 24: 101-114
Lawton J H (1986) Surface availability and insect commun~ty structure. the effects of architecture and fractal dimension of plants. In. Jumper BE, Southwood TRE (eds) Insects and the plant surface Edward Arnold, London, p 317-331
Mandlebrot BB (1967) How long is the coast of Britain? Statis- tical self-similarity and fractional diinension. Science 156:636-638
Mandlebrot BB (1977) Fractal form, chance and dimension. Freeman, San Francisco
Mark DM (1984) Fractal dimension of a coral reef a t ecologi- cal scales a discussion. Mar Ecol Prog Ser 14:293-294
Moore PG (1994) Observations on the behaviour of the scav- enging lysianassoid Orcho~nene zschaui (Crustacea Amphipoda) from South Georgia (South Atlantic). Mar Ecol Prog Ser 113:29-38
Morse DK, Lawton JH , Dodson MM, Williamson MH (1985) Fractal dimension of vegetation and the distribution of arthropod body lengths. Nature 314.731 -733
Pennycuik CJ (1992) Newton rules blology. Oxford University Press. Oxford
Pennycuik CJ , Kline NC (1986) Units of measurement for fractal extent, applied to the coastal distribution of bald eagle nests in the Aleutian Islands, Alaska. Oecologia (Berl) 68.254-258
Richardson LF (1961) The problem of contiguity. an appendix of statistics of deadly quarrels. Gen Syst Yearbook 6: 139-187
Russ J C (1994) Fractal surfaces Plenum Press, New York Shorrocks B, Marsters J , Ward I , Evennett PJ (1991) The frac-
tal dimension of llchens and the distribution of arthropod body lengths. Funct Ecol 5:457-460
Strange IJ (1992) A fleld guide to the wildllfe of the Falkland Islands. HarperCollins Publishers, London
Womersley HBS (1954) The species of Macrocystis with spe- cial reference to those on southern Australian coasts. Univ Cahf Pub Bot 27:109-132
Manuscr~pt first received: October 17, 1995 Revised verslon accepted: December 11, 1995
Copyright © 2022 FDOKUMEN