Fluorine18 deoxyglucose uptake in sarcoidosis measured with positron emission tomography
Upload
independentCategory
view
1download
0
Chapter 3
Spatial Relationships of MR Imaging and PositronEmission Tomography with Phenotype, Genotype andTumor Stem Cell Generation in Glioblastoma Multiforme
Davide Schiffer, Consuelo Valentini, Antonio Melcarne, Marta Mellai,Elena Prodi, Giovanna Carrara, Tetyana Denysenko, Carola Junemann,Cristina Casalone, Cristiano Corona, Valentina Caldera, Laura Annovazzi,Angela Piazzi, Paola Cassoni, Rebecca Senetta, Piercarlo Fania andAngelina Cistaro
Additional information is available at the end of the chapter
http://dx.doi.org/10.5772/58391
1. Introduction
Glioblastoma multiforme (GBM), the most malignant and frequent glioma, is a heterogene‐ous tumor in which areas of different histological aspect, aggressiveness, genetic expres‐sion and regressive events coexist so that one region of the tumor is not representative ofthe entire neoplasia. The consequences of the heterogeneity reflect on the diagnostics,prognostics and therapies. As a matter of fact, unguided surgical biopsies can lead tosampling error and to undergrade the tumor up to 30% of cases [1]. From the surgical, butalso prognostic and therapeutic point of view, it is of great importance to know in advancethe composition of the tumor and the biological significance of the different imaging aspects.Neuro-imaging is the only and fundamental source of information for the neurosurgeonand it has progressed today from the simple anatomic recognition of the tumor to that offunctional and metabolic significance of its different regions, contributing greatly to a betterapproach to tumor surgery, prognosis and therapy. The detection of highly malignantregions and the definition of the tumor extent are crucial before the operation, when theyare the main concern of neurosurgeons.
GBM is composed, as it is universally known, of three zones: central necrosis, proliferationand infiltration zones (Figures 1,2). Proliferation region is characterized by high indices of cell
© 2014 The Author(s). Licensee InTech. This chapter is distributed under the terms of the Creative CommonsAttribution License (http://creativecommons.org/licenses/by/3.0), which permits unrestricted use,distribution, and reproduction in any medium, provided the original work is properly cited.

density, proliferation, mitoses, vessel density or angiogenesis and circumscribed necroses. Inthe spectrum of the many aspects of the tumor, with the term disruption one indicates thepassage from the uniform and quiescent appearance of an astrocytoma to the rupture of thestructure, forms and dimensions of GBM (Figure 3A). Circumscribed necroses and angiogen‐esis are the absolute features of GBM and their occurrence is needed for its recognition, becausethey are direct signs of malignancy (Figures 3B,4A-C). Angiogenesis in gliomas represents theintervened transformation, whereas it depends on the imbalance between the high prolifera‐tion potential of tumor cells and the low reproduction capacity of endothelial cells [2]. Whenthe diagnosis has to be carried out on small tumor samples, as for example in stereotacticbiopsies, the diagnosis cannot be of certainty. When close to central necrosis, circumscribednecroses merge with it. Infiltration zone represents the invasion into the brain of tumor cellsthat acquire a particular phenotypic and molecular signature. It is not uniform along the tumorborders and often it is so mild that it is hardly detectable, also histologically. Frequently, it isdiscovered in histological sections only after counting the cells and this happens either whenit affects the white matter or the cortex, where tumor cells must be distinguished from normalcells. In the latter, perineuronal satellitosis may be of help. Isolated tumor cells (ITCs) in thenormal nervous tissue make the problem of the tumor delimitation very hard. They cannot bedetected, of course, in the samples removed during intervention, but only in the study of thebrain at autopsy and they can be found very far from the tumor borders; the classic exampleis the passage of normally looking corpus callosum by ITCs [3,4]. Regressive events arefrequent and include haemorrhages, large necroses, vascular thrombosis, etc and they con‐tribute to the so-called disruption of the tissue.
Figure 1. Coronal section of a brain with GBM. The borders of the tumor show different nervous structures. H&E.
Tumors of the Central Nervous System – Primary and Secondary64

Figure 2. Three zones can be recognized: central necrosis, proliferation, and infiltration zone. H&E, 25x.
Figure 3. A – Area of disrupture with high cell density, vessels of different size and edema dissociation of the tissue; B– Circumscribed necrosis with pseudo-palisading in an area with high cell density (H&E, 100x) and area with a highKi-67/MIB.1 proliferation index (DAB, 100x).
Beside the classic T1 and T2 imaging of GBM, supplied by the anatomy based magneticresonance (MR), physiology-based MR imaging methods, namely diffusion-weighted imaging(DWI), perfusion-weighted imaging (PWI) and proton MR spectroscopy imaging (MRSI),together with the positron emission tomography (PET), which is highly correlated with thedegree of malignancy [5,6], improved the tumor characterization. Today, the advancement ofthe knowledge in molecular biology and cell biology, associated with new surgical procedures,radiation techniques and therapeutic possibilities ask the neuro-imaging to answer three mainquestions: the identification in vivo of the tumor sites with the highest malignancy grade, the
Spatial Relationships of MR Imaging and Positron Emission Tomography with Phenotype, Genotype and...http://dx.doi.org/10.5772/58391
65

extension of tumor invasion and the sites where the capacity of the tumor to reproduce, torecur and to resist therapies resides, i.e. where the so-called glioblastoma stem cells (GSCs) arelocated.
Figure 4. A – High vessel density. Laminin, DAB, 100x; B – Neoformed vessels and endothelial buds. PAS, 200x; C –Glomeruloid structure. α-sm-actin, DAB, 200x.
2. Physiology based MRI and PET
DWI rationale is to quantify the brownian movement of water protons within tissues thatdepends on the complex interaction between the intracellular and extracellular compartments,but also on cell density, cell membrane permeability and tissue structure. Water diffusivitywithin the extracellular compartment is inversely related to cell size and cell number. Thegreater the volume of the intracellular space and also the higher the cell density, the lower isthe water diffusivity in the extracellular space, resulting in a low apparent diffusion coefficient(ADC), a measure of water diffusion. Diffusivity within tumors is heterogeneous due todifferent tumor components, being reduced in areas with high cellular density and increasedin necrotic regions. Restricted ADC values in a tumor can also be related to ischemic changes,haemorragic or calcific components.
Tumors of the Central Nervous System – Primary and Secondary66

Although several reports have shown that glioma grade inversely correlates with intra-tumorminimum ADC [7], reflecting the presence of areas with high cell density in high grade tumors[8,9], the clinical significance of ADC measurement is limited as a consequence of the tissueheterogeneity within a tumor and because of substantial overlap in ADC values amongdifferent grades of glioma [10,11]. The range of ADC values within a given glioma, therefore,can vary markedly [11] and there is no final confirmation that minimum ADC always correlateswith cell density.
PWI is used to measure vascularization and perfusion of brain lesions. Different PWItechniques are available, namely dynamic susceptibility contrast (DSC) and dynamiccontrast-enhanced (DCE), widely used in the clinical setting. DSC perfusion measures T2-weighted signal-intensity loss occurring dynamically over a bolus injection of contrastmedium, from which relative cerebral blood volume (rCBV), a marker of tumor angiogen‐esis, can be computed. DCE is a T1-weighted sequence that measures vascular permeabili‐ty in tumors during a bolus injection of contrast medium; rCBV values are then calculatedfrom DCE data. rCBV values have shown good correlation with the World HealthOrganization (WHO) tumor grading [12,13]; exceptions are represented by low-grade glialneoplasms with oligodendroglial features and grade I pilocytic astrocytoma, that may havemarkedly elevated rCBV (Figure 5).
Figure 5. A –T1C MRI; B – T2 MRI; C – Diffusion MRI; D – Perfusion MRI.
Spatial Relationships of MR Imaging and Positron Emission Tomography with Phenotype, Genotype and...http://dx.doi.org/10.5772/58391
67

Arterial spin-labeling (ASL) is a more recent perfusion technique that uses water of the bloodentering the brain as an endogenous tracer to evaluate perfusion. ASL is emerging as analternative to gadolinium based techniques in the evaluation of tumor perfusion.
MRSI is another advanced technique that provides metabolic information of the brain tissue.The predominant metabolites are choline (Cho), N-acetylaspartate (NAA), creatine (Cr),glutamate and glutamine (Glx), myo-inositol (MI) and lactate/lipids (LL). The Cho peakcontains contributions from several different choline-containing compounds, which areinvolved in membrane synthesis and degradation; NAA is marker of neuronal integrity; Cr isa marker of cellular energetics; MI is considered a glial cell marker; LL are markers of tissuebreakdown and anaerobic glycolysis. Glx is a complex peak from glutamate (Glu), glutamine(Gln) and gamma-aminobutyric acid (GABA). Glu is an important excitatory neurotransmitterand it also plays a role in the redox cycle. In brain tumors, as malignancy increases, NAA signaldecreases, as a consequence of loss, dysfunction or displacement of normal neurons, whileCho levels increase as a consequence of rapid cell membrane turnover. Malignant tumors alsohave reduced Cr due to high metabolic activity that depletes the energy stores; this is associatedto anaerobic glycolysis leading to the appearance of lactate. Necrotic portions of tumor showthe presence of lipid peaks. Elevated concentration of Gln can be found in high grade tumors.
Metabolite concentrations are usually expressed as ratios (i.e. Cho/Cr, Cho/NAA, NAA/Cr)rather than as absolute concentrations.
Such spectra can be obtained using single voxel or multi-voxel 2D or 3D technique. Multi-voxelspectroscopy is the best to detect infiltration of malignant cells beyond the enhancing marginsof tumors [14,15] (Figures 6,7).
Figure 6. Case CTO3. Correlation among histopathology, Ki-67/MIB.1 proliferation marker, MRSI, physiologic MRI andPET values. Column 1 – ROIs on T1C MRI; Column 2 – Histopathology of a hyper-proliferating area and two areas dif‐ferently infiltrated. H&E, 200x; Column 3 – Ki-67/MIB.1 proliferation index, DAB, 200x; Column 4 – MRSI values; Col‐umn 5 – PET values.
Tumors of the Central Nervous System – Primary and Secondary68

Figure 7. Case CTO5. Correlation among histopathology, Ki-67/MIB.1 proliferation marker, MRSI, physiologic MRI andPET values. Column 1 – ROIs on T1C MRI; Column 2 – Histopathology of a hyper-proliferating area and two areas dif‐ferently infiltrated. H&E, 200x; Column 3 – Ki-67/MIB.1 proliferation index, DAB, 200x; Column 4 – MRSI values; Col‐umn 5 – PET values.
Diffusion tensor imaging (DTI) is an advanced MRI technique that describes the movement ofwater molecules using two metrics, mean diffusivity (MD) and fractional anisotropy (FA), thatrepresent the magnitude and directionality of water diffusion, respectively. FA techniquemeasures the preferential direction of proton movement and varies among values between 0(isotropic diffusion, i.e. random diffusion such as in brain gray matter) and 1 (anisotropicdiffusion, such as in brain white matter where proton diffusion is constrained along myelinfibres). MD technique gives information on the whole diffusivity in the brain; the reduction ofnervous fibres results in an increased MD because of a higher degree of freedom of movementof water molecules. The degree of anisotropy depends on many factors, such as fibre densityand diameter, myelin sheath integrity and the intercellular space characteristics. In thepresence of a structural alteration of the nervous fibre tract, the anisotropic value reduces.
Anisotropy is reduced in cerebral lesions due to the loss of structural organisation. Themeasurement of FA allows prediction of histological characteristics such as cellularity,vascularity, or fibre structure. This technique is useful to differentiate normal white matterfrom edematous brain tissue and occult white matter invasion around the enhancing portionof the tumor.
DTI may help to determine the white matter fibre displacement by tumor. This technique, incombination with functional neuro-imaging methods, permits to map the individual anatomo-functional connectivity and represents a useful tool for surgical planning [16-18].
PET is currently the most powerful method of molecular imaging, as it has been emphasizedin a recent review [19] (Figure 8). Depending on the radiotracer, various molecular processescan be visualized by PET, most of them relating to an increased cell proliferation within
Spatial Relationships of MR Imaging and Positron Emission Tomography with Phenotype, Genotype and...http://dx.doi.org/10.5772/58391
69
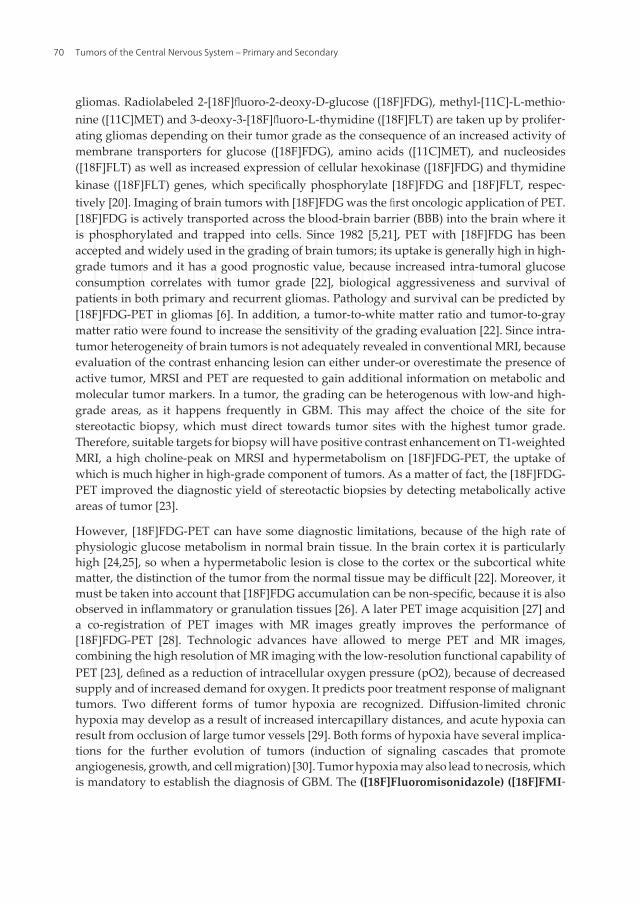
gliomas. Radiolabeled 2-[18F]fluoro-2-deoxy-D-glucose ([18F]FDG), methyl-[11C]-L-methio‐nine ([11C]MET) and 3-deoxy-3-[18F]fluoro-L-thymidine ([18F]FLT) are taken up by prolifer‐ating gliomas depending on their tumor grade as the consequence of an increased activity ofmembrane transporters for glucose ([18F]FDG), amino acids ([11C]MET), and nucleosides([18F]FLT) as well as increased expression of cellular hexokinase ([18F]FDG) and thymidinekinase ([18F]FLT) genes, which specifically phosphorylate [18F]FDG and [18F]FLT, respec‐tively [20]. Imaging of brain tumors with [18F]FDG was the first oncologic application of PET.[18F]FDG is actively transported across the blood-brain barrier (BBB) into the brain where itis phosphorylated and trapped into cells. Since 1982 [5,21], PET with [18F]FDG has beenaccepted and widely used in the grading of brain tumors; its uptake is generally high in high-grade tumors and it has a good prognostic value, because increased intra-tumoral glucoseconsumption correlates with tumor grade [22], biological aggressiveness and survival ofpatients in both primary and recurrent gliomas. Pathology and survival can be predicted by[18F]FDG-PET in gliomas [6]. In addition, a tumor-to-white matter ratio and tumor-to-graymatter ratio were found to increase the sensitivity of the grading evaluation [22]. Since intra-tumor heterogeneity of brain tumors is not adequately revealed in conventional MRI, becauseevaluation of the contrast enhancing lesion can either under-or overestimate the presence ofactive tumor, MRSI and PET are requested to gain additional information on metabolic andmolecular tumor markers. In a tumor, the grading can be heterogenous with low-and high-grade areas, as it happens frequently in GBM. This may affect the choice of the site forstereotactic biopsy, which must direct towards tumor sites with the highest tumor grade.Therefore, suitable targets for biopsy will have positive contrast enhancement on T1-weightedMRI, a high choline-peak on MRSI and hypermetabolism on [18F]FDG-PET, the uptake ofwhich is much higher in high-grade component of tumors. As a matter of fact, the [18F]FDG-PET improved the diagnostic yield of stereotactic biopsies by detecting metabolically activeareas of tumor [23].
However, [18F]FDG-PET can have some diagnostic limitations, because of the high rate ofphysiologic glucose metabolism in normal brain tissue. In the brain cortex it is particularlyhigh [24,25], so when a hypermetabolic lesion is close to the cortex or the subcortical whitematter, the distinction of the tumor from the normal tissue may be difficult [22]. Moreover, itmust be taken into account that [18F]FDG accumulation can be non-specific, because it is alsoobserved in inflammatory or granulation tissues [26]. A later PET image acquisition [27] anda co-registration of PET images with MR images greatly improves the performance of[18F]FDG-PET [28]. Technologic advances have allowed to merge PET and MR images,combining the high resolution of MR imaging with the low-resolution functional capability ofPET [23], defined as a reduction of intracellular oxygen pressure (pO2), because of decreasedsupply and of increased demand for oxygen. It predicts poor treatment response of malignanttumors. Two different forms of tumor hypoxia are recognized. Diffusion-limited chronichypoxia may develop as a result of increased intercapillary distances, and acute hypoxia canresult from occlusion of large tumor vessels [29]. Both forms of hypoxia have several implica‐tions for the further evolution of tumors (induction of signaling cascades that promoteangiogenesis, growth, and cell migration) [30]. Tumor hypoxia may also lead to necrosis, whichis mandatory to establish the diagnosis of GBM. The ([18F]Fluoromisonidazole) ([18F]FMI‐
Tumors of the Central Nervous System – Primary and Secondary70

SO) is a nitroimidazole derivative, a PET agent used for hypoxia detection. [18F]FMISO-PETcan image tumor hypoxia by increased [18F]FMISO tumor uptake, because [18F]FMISOmetabolites are trapped exclusively in hypoxic cells. It accumulates in both hypo-and hyper-perfused tumor regions, suggesting that hypoxia in GBM may develop irrespective of themagnitude of perfusion [31].
3. Biological significance of MRI variables in GBM
Basically, three conditions can be detected with anatomy-based MRI: iso-hypo-intensity in TC1(tumor, edema), hyper-intensity in TC2 (edema) and contrast enhancement (malignancy). Thecontrast enhancing regions (CERs) of untreated GBM correspond to the most histologicallymalignant areas of the tumor with architectural disruption, high cell density, proliferation,vessel density and angiogenesis with circumscribed necroses. Many other properties arerevealed by physiology-based MRI. In CERs, in comparison with non-enhancing regions(NERs), physiologic MRI variables show higher values of rT1C, relative fast spin echo (rFSE),rCBV, relative peak height (rPH) and relative recovery factor (rRF), whereas rADC, relativefractional anisotropy (rFA) and fluid attenuated inversion recovery (rFLAIR) do not differfrom NERs. All these observations have been shown and confirmed in recent studies of manycases of GBM planning pre-operatively tissue sampling sites and marking them on theanatomic images used by the surgical navigation work station. A comparison between MRIvariables and histology of the samples corresponding to the MRI regions of interest (ROIs) in
Figure 8. Female 22-year-old affected by GBM. Maximum intensity projection (MIP) fusion PET/3D spgr MRI imageshowing extensive lesion involving the right parietal-temporal lobe with heterogeneous increased [18F]FDG uptake,due to the lesion heterogeneity: high-grade component presenting elevated [18F]FDG activity with standardized up‐take value (SUV)max=17 (yellow arrow), intermediate-grade component presenting SUVmax=12 (white arrow), low-gradecomponent SUVmax=4 (red arrow).
Spatial Relationships of MR Imaging and Positron Emission Tomography with Phenotype, Genotype and...http://dx.doi.org/10.5772/58391
71

CERs and NERs has been made [32,33]. A correlation of histopathologic features and DWI andDSC variables prevailed in enhancing areas and rCBV and Cho/NAA index (CNI) above andrADC below a certain value could indicate the occurrence of tumor cells. Neoangiogenesiscould be recognized and distinguished from simple endothelial hyperplasia, even though thepermeability of the region is limited. Interestingly, also T2 rFSE and rFLAIR hyperintensityareas could show histopathologic features of malignancy. On the whole, it was demonstratedby gene microarray that the genetic expression patterns between CERs and NERs weredifferent, with genes associated with mitosis, angiogenesis and apoptosis clustered in CERsurgical samples [32].
The values of MRSI variables such as Cho/Cr and Cho/NAA showed a parallel variation asthose of DWI and PWI. In spite of the possibility of a misregistration between biopsy sites andMRI uploaded to the neuronavigation device if a brain shift occurs, GBM histologic featurescould be usefully identified by physiology-based MRI [33].
Using the same technique, i.e. combining physiology-based MRI, MRSI and [18F]FDG-PETimaging with neuronavigation work station in a series of gliomas, mainly GBMs, we observedthat the values of rCBV, ADC, Cho/Cr, CNI were useful for recognizing tumor areas and theirphenotypic variations, as for both the number of cells and vascular pathologic structures(Figures 6,7). A possible source of error was the mismatch between the MRI registration andthe sampling by the navigator, so that a dissociation between the variable values of the ROIsand histopathology occurred. For example, a ROI on central necrosis could erroneouslycorrespond to a high rCBV value and histologically to the occurrence of tumor tissue in thesample. However, this was a rare event and it did not prevent from recognizing the biologicalsignificance of the imaging values contained in the ROIs, also by extrapolation among all thesamples.
Malignant gliomas are hypermetabolic in comparison with normal brain. The glycolyticmetabolism is increased as well as protein and membrane synthesis to maintain the rapidlydividing tumor cells. MRSI in spite of an intra-or inter-subject variability can identify thetumor. There are two patterns clearly distinct: one is that corresponding to the ROIs on necroticregions and the other that on the enhancing ring. In the first one, two patterns have been inturn described: “necrosis” and “cystic necrosis” with variable Ch and high LL peak and withno peaks and variable LL, respectively. The ROIs on the ring show a high Cho and Cho/NAAratio, whereas very variable are those on regions around the ring [34]. In our series Cho, Cho/Cr and Cho/NAA values were constantly high in CERs in comparison with NERs.
Fusing MRI and [11C]MET-PET it was shown that the volume of the radio-compounduptake is greater than that of gadolinium enhancement on T1, even though smaller thanT2 volume; it extends beyond in most cases [35,36] correlating with the proliferation markers[37,38], increased Cho/NAA and DTI abnormalities in the white matter [28,39]. However,there could be an underestimation of the tumor extension, because infiltrating cells do notproliferate [3,40].
The number of genetic alterations decreased from the most malignant areas of the tumor tothe peripheral areas, correlating fairly well with the MRI variable values and indicating the
Tumors of the Central Nervous System – Primary and Secondary72

occurrence or not of tumor cells. In particular, Epidermal Growth Factor Receptor (EGFR)amplification, the occurrence of EGFRvIII and Tumor Protein p53 (TP53) mutations were morefrequent in CERs than in NERs, corresponding to a malignant histology. The genetic variabilityin the different samples was interpreted as due to polyclonality and not only to a geneticheterogeneity supported by the occurrence in the same tumor of different non-tumor cells ofvarious species. Polyclonality means cell complexity, formed by tumor cells that differ amongthemselves for a series of phenotypic and molecular characteristics of cell proliferation,invasion, etc. [41,42]. This observation can be a warning against the use of small tumor samplesto characterize the genotype of the entire tumor. Heterogeneity has been explained either bythe hierarchic model mechanism [43] or by the stochastic mechanism [44] of tumor develop‐ment. The two models, however, cannot be mutually exclusive, because their cells shouldderive from a common ancestor [45]. As for EGFR amplification, the possibility that itsvariation could depend on an asymmetrical distribution during mitoses must be mentioned[46,47], even if it is already included in the clone formation. The neurosphere assay producesneurospheres (NS), characterized by stemness antigens (Figure 9A,C,E), and adherent cells(AC), characterized by differentiation antigens (Figure 9B,D,F).
However, their phenotype is not the same in the different tumor sites, differing for the quotaof the two types of antigens. There must be a different capacity of the tumor areas to host orto generate GSCs and this is in line with the concept that a GSCs hierarchy exists for theirpotential [48-52]. GSCs have been interpreted as the top of a hierarchy of tumor cells forstemness and, therefore, for self-renewing, clonogenicity, etc. They occur in tumor niches andare under the control of microenviroments with their intrinsic and extrinsic signaling [53,54].The niches can be perivascular or perinecrotic [53] and for a series of observations andconsiderations they must develop in the most malignant sites of the tumor [51,55]. Stemnessand differentiation are the opposite poles of a spectrum in which a hierarchy exists of GSCs asfor their potential [48-52]. Going from areas of the highest malignancy, such those of CERs, todifferentiated ones, the stem-cell potential decreases [55]. In this way the distribution of GCSin GBM could be explained. The NS and AC degree of differentiation or stemness, demon‐strated by the relevant antigens, represents an interesting subject of study that has beenpursued by us by confocal microscopy (unpublished data).
Confocal microscopy is an advanced technique of optical imaging used to obtain highresolution images [56,57]. In tissue and cells derived from GBM, it is possible to distinguishthe emission signal of different markers and to perform study of both co-localization andquantification of the luminous signal related to the protein marker expression. The cellularheterogeneity is a hallmark of GBM. Using differentiation and stemness markers it is possibleto identify hypothetical immature or dedifferentiated elements in the whole tumor cellpopulation, as well as in NS or AC by the neurosphere assay. Confocal images of glioma cellsby double immunofluorescence allow to distinguish the expression pattern of the markersabove mentioned. Their expression levels, related to the intensity of the emitted signal, showvariable Nestin and glial fibrillary acidic protein (GFAP) positivity, depending on the tumorsite. The method has a paramount importance in the study of the spectrum from stemness todifferentiation.
Spatial Relationships of MR Imaging and Positron Emission Tomography with Phenotype, Genotype and...http://dx.doi.org/10.5772/58391
73

4. The tissue around the tumor — Cell invasion and edema
Beside resistance to chemo-and radiotherapy, the failure of a local control of GBM by therapiesis due to the modalities of tumor cell invasion into the brain. Surgical resection cannot preventrecurrence because of the occurrence of infiltrating cells; recurrence usually starts from theresection margin. The target volume for radiotherapy, therefore, conventionally includes thetissue within 2 cm from the MRI border of the tumor. This is for sparing normal nervous tissuefrom irradiation damage, but also for including in it infiltrating cells. Nevertheless, 80% of
Figure 9. Immunofluorescence (IF) for stemness antigens in NS. A – Nestin, 200x; C – CD133, 200x; E – Musashi1, 200x.IF for differentiation antigens in AC. B – GFAP, 400x; D – GalC, 400x; F – β-III Tubulin, 400x. Nuclei are counterstainedwith DAPI.
Tumors of the Central Nervous System – Primary and Secondary74

tumors relapses within 2-cm margin around the enhanced region [58]; another adversecharacteristic of infiltrating cells is that they do not proliferate [3,40], escaping thus detectionand being less sensitive to treatments.
Tumor invasion is not uniform along its borders. It can be non-existent where the tumorsharply abuts against the normal nervous tissue (Figure 10A), as it may happen with the whitematter, or it gradually progresses from the tumor outwards (Figure 10B). Typical is theinvasion of the cortex from a tumor located in the white matter, even with the typical pictureof perineuronal satellitosis (Figure 10C). The different invasion modalities have been codified[59] and a distinction between diffuse and local tumors has even been proposed [60], but itwas not confirmed by the observation of substantially different outcomes.
Figure 10. A – Sharp tumor border. Ki-67/MIB.1, DAB, 100x; B – Invasion gradient toward the cortex. H&E, 100x; C –Perineuronal satellitosis. H&E, 400x; D – Infiltration along corpus callosum. H&E, 200x.
Letting aside the mechanisms of tumor cell migration and invasion of which there is today agood knowledge [61-63], some information about neuropathologic findings on peritumortissue are relevant. First of all, it has been demonstrated that patients with absence of tumorcells in the adjacent normal nervous tissue had better survival than those with tumor cells [64].This is not in contrast with the observation that the removal of edematous peritumor tissue
Spatial Relationships of MR Imaging and Positron Emission Tomography with Phenotype, Genotype and...http://dx.doi.org/10.5772/58391
75
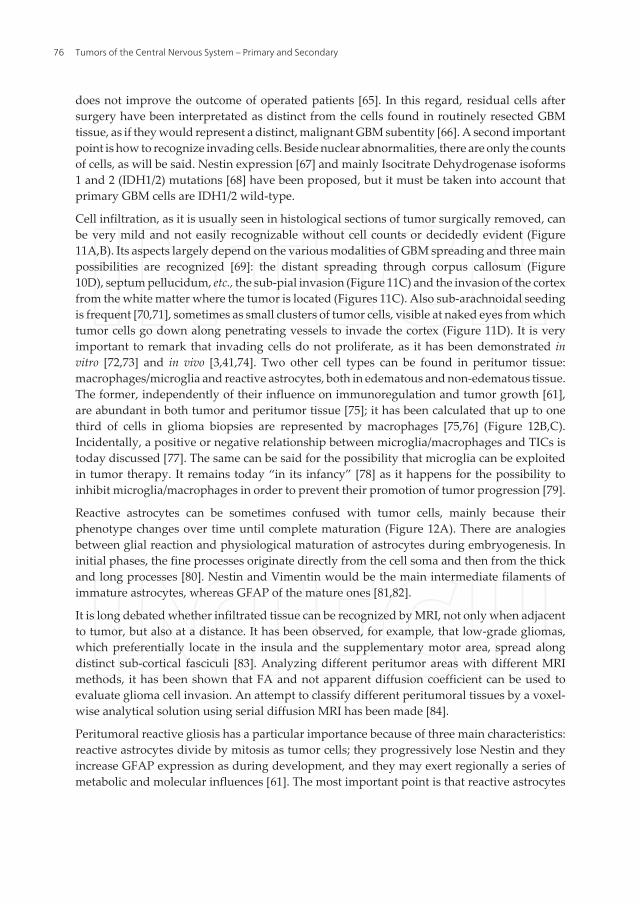
does not improve the outcome of operated patients [65]. In this regard, residual cells aftersurgery have been interpretated as distinct from the cells found in routinely resected GBMtissue, as if they would represent a distinct, malignant GBM subentity [66]. A second importantpoint is how to recognize invading cells. Beside nuclear abnormalities, there are only the countsof cells, as will be said. Nestin expression [67] and mainly Isocitrate Dehydrogenase isoforms1 and 2 (IDH1/2) mutations [68] have been proposed, but it must be taken into account thatprimary GBM cells are IDH1/2 wild-type.
Cell infiltration, as it is usually seen in histological sections of tumor surgically removed, canbe very mild and not easily recognizable without cell counts or decidedly evident (Figure11A,B). Its aspects largely depend on the various modalities of GBM spreading and three mainpossibilities are recognized [69]: the distant spreading through corpus callosum (Figure10D), septum pellucidum, etc., the sub-pial invasion (Figure 11C) and the invasion of the cortexfrom the white matter where the tumor is located (Figures 11C). Also sub-arachnoidal seedingis frequent [70,71], sometimes as small clusters of tumor cells, visible at naked eyes from whichtumor cells go down along penetrating vessels to invade the cortex (Figure 11D). It is veryimportant to remark that invading cells do not proliferate, as it has been demonstrated invitro [72,73] and in vivo [3,41,74]. Two other cell types can be found in peritumor tissue:macrophages/microglia and reactive astrocytes, both in edematous and non-edematous tissue.The former, independently of their influence on immunoregulation and tumor growth [61],are abundant in both tumor and peritumor tissue [75]; it has been calculated that up to onethird of cells in glioma biopsies are represented by macrophages [75,76] (Figure 12B,C).Incidentally, a positive or negative relationship between microglia/macrophages and TICs istoday discussed [77]. The same can be said for the possibility that microglia can be exploitedin tumor therapy. It remains today “in its infancy” [78] as it happens for the possibility toinhibit microglia/macrophages in order to prevent their promotion of tumor progression [79].
Reactive astrocytes can be sometimes confused with tumor cells, mainly because theirphenotype changes over time until complete maturation (Figure 12A). There are analogiesbetween glial reaction and physiological maturation of astrocytes during embryogenesis. Ininitial phases, the fine processes originate directly from the cell soma and then from the thickand long processes [80]. Nestin and Vimentin would be the main intermediate filaments ofimmature astrocytes, whereas GFAP of the mature ones [81,82].
It is long debated whether infiltrated tissue can be recognized by MRI, not only when adjacentto tumor, but also at a distance. It has been observed, for example, that low-grade gliomas,which preferentially locate in the insula and the supplementary motor area, spread alongdistinct sub-cortical fasciculi [83]. Analyzing different peritumor areas with different MRImethods, it has been shown that FA and not apparent diffusion coefficient can be used toevaluate glioma cell invasion. An attempt to classify different peritumoral tissues by a voxel-wise analytical solution using serial diffusion MRI has been made [84].
Peritumoral reactive gliosis has a particular importance because of three main characteristics:reactive astrocytes divide by mitosis as tumor cells; they progressively lose Nestin and theyincrease GFAP expression as during development, and they may exert regionally a series ofmetabolic and molecular influences [61]. The most important point is that reactive astrocytes
Tumors of the Central Nervous System – Primary and Secondary76

may be included in the advancing tumor in which they progressively become no morerecognizable from tumor cells. The question is whether they disappear suffocated by the highdensity of tumor cells or if they remain, unrecognizable from tumor cells, contributing to thepleomorphic aspect of gliomas, or if they are transformed into tumor cells [85].
Practically, two important points are that the tumor extends beyond the area of enhancementand that tumor cells can be found in peritumor edema [86]. In 20% of stereotactic biopsiestumor cells have been found in normal areas [87]. With the MRI era, detection of tumorinfiltrating cells did not improve and it was shown that they can occur either in the T2-hyperintense areas or beyond them [88] or even in areas apparently normal in T1 or edematousin T2.
GBM spreads frequently along white matter tracts and their disruption can be detected by DTI.Observations have been made, but without any histological control. For example, infiltratedwhite matter shows a decrease of FA and an increase of ADC as when it is edematous.Displacement of white matter tracts with decreased FA can be recognized [89]. Many studieshave been dedicated to FA reduction, but it did not appear to be sensitive enough to detect
Figure 11. A – Mild infiltration. H&E, 200x; B – Strong infiltration. H&E, 200x; C – Sub-pial infiltration and growth. H&E,100x; D – Infiltration along penetrating vessels from a tumor seeding in sub-arachnoidal space. PCNA, DAB, 100x.
Spatial Relationships of MR Imaging and Positron Emission Tomography with Phenotype, Genotype and...http://dx.doi.org/10.5772/58391
77

infiltration [90]. The problem has not yet been resolved and it is still under discussion, becausenew techniques have been proposed [91,92], even though ADC values, lower in the tumor thanin peritumor tissue, were not interpreted by others as significant [93]. Nevertheless, DTI isgoing to be accepted in the evaluation of tumor margins and invasiveness [94].
Figure 12. A – Reactive astrocytes at regular inter-distance. GFAP; B – Macrophages/microglia in the tumor. CD68; C –id. in peritumor area. CD68. All DAB, 200x.
Edema on T2-weighted imaging may have a high Cho/NAA ratio as in tumors [95] and thiswould indicate the occurrence of tumor cell infiltration [96] (Figure 13). It can be demonstratedby Aquaporin-4 antibody method (Figure 14A), but in the tissue this is not suitable forquantitative assessments. However, the real problem is how to detect mild infiltration, eitheralone or with edema. Some observations were supported by histological examination ofperitumor edematous areas with or without cell infiltration. Three spectral patterns in peri-enhancing apparently edematous ROIs have been described: high Cho and abnormalCho/NAA ratio in presumed tumor areas, normal Cho/NAA ratio in presumed edematousareas and Cho levels similar to normal, but with abnormal Cho/NAA ratio in tumor edema.In ROIs on peri-enhancing normal tissue, the patterns therefore could be: presumed infiltrationwith high Cho and abnormal Cho/NAA ratio and presumed normality with normal values.
Tumors of the Central Nervous System – Primary and Secondary78

These findings are in agreement with those indicating that tumor cells could be detectedbeyond the margin of the tumor by MRSI [97] and this has been substantiated by histopathol‐ogy studies [88,96].
Figure 13. Axial contrast enhanced T1-weighted image, T2-weighted image, ADC and rCBV maps showing a lesion inthe left frontal lobe with heterogeneous signal and diffusion properties, peripheral and irregular contrast enhance‐ment. Perfusion is increased in the peripheral portion of the lesion.
Figure 14. A – Aquaporin-4 in a peritumor area with astrocyte and vessel positive staining. DAB, 200x; B – Aspect of agemistocytic astrocytoma found in a T2 hyper-intense area. H&E, 200x.
Spatial Relationships of MR Imaging and Positron Emission Tomography with Phenotype, Genotype and...http://dx.doi.org/10.5772/58391
79

The overlapping of tumor cell infiltration and edema remains a major problem in the brainadjacent to tumor (BAT), because of the difficulty of their distinction [98,99], even thoughsomebody supports that white matter fibre tract infiltration can be recognized [97]. In exper‐imental tumors transplanted into mice, it has been observed by superimposing immunohis‐tochemistry to MRI that in edema districts around the tumor, reactive astrocytes and activatedmicroglia increased Aquaporin-4 expression and invasive tumor cells coexist [100]. Aquapor‐in-4 has been observed to correlate in peritumor tissue with edema and in the tumor withHypoxia-Inducible Factor-1 (HIF-1), Vascular Endothelial Growth Factor (VEGF) and thegrade of malignancy [101], whereas NAA seemed to be more suitable to detect low tumorinfiltration in peritumor edema [102]. Of course, in the latter a damage to myelin sheaths takesplace and it is detectable by MRSI [103].
In the recognition of tumor cell infiltration in edematous areas by MRI, histological examina‐tion of the surgical samples corresponding to the ROIs on rFSE or rFLAIR areas, is of greatimportance, in spite of the demonstration that removing T2 hyperintense non-enhancing areasand areas possibly containing ITCs, survival did not change [65]. It must be known that a T2hyper-intense area may well correspond to a tumor (Figure 14B). A distinction would bepossible, provided that there is no mismatch between the ROIs and sample removal. Usually,the cells composing edematous areas can be: tumor, normal or endothelial cells, macrophagesor inflammatory cells and mainly reactive astrocytes. In our experience, the cell count is ofparamount importance, especially when the number of non-tumor cells largely exceeds thatof tumor cells, including in the former reactive astrocytes, microglia and endothelial cells. Bycomparing the number of cells in H&E stained sections and of GFAP+and CD68+cells withMRI variables, it has been found that normal cells, reactive astrocytes and microglia cellsrepresent a rather stable quota of cells, so that variations of the total number of cells of a givenarea could be attributed to tumor cells. Reactive astrocytes, once no more proliferating, becomefibrillogenetic and mature; usually, they do not exceed a certain number per field (Figure12A). Therefore, they may influence the total number of cells only when tumor cell infiltrationis mild. When the number of infiltrating cells is high, the astrocytic quota becomes insignificant.The same can be said for microglia/macrophages. Inside the tumor these cells are often foundin perivascular or perinecrotic masses, but in peritumor tissue they are more regularlydistributed and they too do not exceed a certain number per field (Figure 12B,C). CBV or Cho/NAA values will be influenced by macrophages/microglia only when the total number of cellsis very low, i.e. when tumor cell infiltration will be really mild, below a certain percentage ofthe total number of cells, taking into account that the number of reactive astrocytes plus thatof microglia/macrophages usually corresponds to the half of that of normal cells (unpublisheddata).
ITCs can be detected only after a systemic study of the brain at autopsy, as in the wholemounting preparation technique (Figure 15); they cannot be detected in surgical materialbecause this usually cannot include them [4]. ITCs remain as a sword of Damocles in regardto tumor recurrence.
Tumors of the Central Nervous System – Primary and Secondary80

Figure 15. Isolate tumor cells in a white matter bundle. PCNA, DAB, 400x.
5. GSCs in the tumor: Target of therapies?
In the last decades, the aphorism is that the eradication of the tumor cannot be obtained bydirecting chemo-and radiotherapies to the entire tumor mass, composed of non-proliferating,differentiated and insensitive cells; on the contrary, such therapies would be successful ifaddressed to the cells responsible for growth, recurrence and resistance, i.e. GSCs. Therefore,the question is whether these cells can be in vivo detected by neuro-imaging and where arethey located or generated in the tumor. To answer this question, a short discussion on the originand nature of GSCs is necessary.
The hypothesis of GSCs is based on the concept that a rare subset of cells within GBM mayhave significant expansion capacity and the ability to generate new tumors. The remainder oftumor cells, which predominantly make up GBM, may represent partially differentiated cellswith limited progenitor capacity or terminally differentiated cells that cannot form newtumors. Following the model of glioma origin from sub-ventricular zone (SVZ) after nitro‐sourea derivatives [104], the most important hypothesis on gliomagenesis is today that GSCsderive by the transformation of Normal Stem Cells (NSCs) or progenitors, i.e. from B or C cellsof the SVZ niche [105]. There is a great similarity between SVZ NSCs or progenitors and TICsand malignant gliomas most probably originate from the SVZ [106,107]. The concept issupported by the observation that GBM is almost always in contact with lateral ventricles [108].This hypothesis cannot be applied to benign gliomas that should derive from mature glia.According to other hypotheses, also GBMs could derive from mature glial cells by acquiringstemness properties through a dedifferentiation process [109] or from stem cells of the whitematter, NG2 cells. This origin would fit better with tumors far from the ventricles or withsecondary GBM [110]. Also reactive astrocytes can be candidate for glioma origin [111,112],considering that they can acquire a stem-like phenotype [113].
GSCs develop in niches that can be perivascular or perinecrotic [114]. In perivascular nichesthere is a close contact between endothelial cells and Nestin+and CD133+cells [115]; the formerwould favor the self-renewal of the latter, mainly by Notch, and the opposite would happen
Spatial Relationships of MR Imaging and Positron Emission Tomography with Phenotype, Genotype and...http://dx.doi.org/10.5772/58391
81
for angiogenesis through VEGF and hypoxia/HIF-1 [115-120]. In perinecrotic niches, GSCs aregenerated by hypoxia through HIF-1. Really, in the niches there can be a complicated rela‐tionship among different cell types, such as macrophages, pericytes, astrocytes, etc. with amultiple signalling [54,121,122]. In our experience, perinecrotic GSCs could be the remnantsof GSCs that populated hyper-proliferating areas before the development of circumscribednecroses within them; this would take place because of the imbalance between the highproliferation capacity of tumor cells and the low one of endothelial cells [2,123]. GSCs, eitheras NS or AC, are heterogeneous as for stemness properties, clonogenicity and tumorigenicityand they have been regarded as at the top of a cell hierarchy for some molecular signs [49,50].Stemness among tumor cells could be distributed in a spectrum with a crescendo from quiescenthighly differentiated cells, where it is nil, to those in which it reaches the highest degree ofexpression. Stemness would be regulated by the microenvironment [53] and it could be thefeature of a functional status rather than of a subset of cells [124,125]. As it is lost duringdifferentiation of normal cytogenesis beyond the stage of progenitors, in the opposite way itis gained by dedifferentiating tumor cells when they reach the stage of progenitors.
The heterogeneity of GBM, before discussed, conditions different genetic assets of the cells inthe different clones; going from the samples of the most malignant areas of the tumor to thoseof tumor periphery, the potential of generating NS or AC decreases. The conclusion is thatstem cells are kept as such by microenvironments and these are realized in the most malignantsites of the tumor [51,55].
6. Location of GSCs in the tumor and their detection by neuro-imaging
If GSCs were considered as a subset of special cells, they should be located somewhere inthe tumor and therefore their search in vivo could be justified. According to the hypothe‐sis that they represent a functional status, they should appear in the tumor when and where,as the consequence of the transformation process, tumor cells reach the threshold ofstemness. In some experience, NS would be generated from whatever part of GBM [126],whereas in some other experiences [48], different subsets of GSCs arise from regions ofGBM with different malignancy potential, showing different tumorigenic potential andgenetic abnormalities, even though originating from the same ancestor cell. Since GSCsreside in niches, their distribution in the tumor should follow that of niches which in turnwith their microenvironments develop where malignancy occurs [52]. On the other hand,it has been observed that GSCs occur in the hypoxic area between the central necrosis andthe proliferating zone of GBM [127].
Until today, the only mean to detect GSCs is to apply the neurosphere assay to the surgicalsamples removed from different parts of the tumor. Their recognition can be therefore achievedonly after surgery. It would be highly useful to know in advance where in tumor GSCs arelocated or generated in order to try to annihilate them without surgery and to cure the patient.Can they be detected by MRI or other procedures in vivo?
Animal in vivo imaging techniques have been applied to some stem cell populations – hema‐topoietic and leukemic stem cells – but the application to solid tissues has been limited [41].
Tumors of the Central Nervous System – Primary and Secondary82
Using intravital microscopy, labelled GSCs could be followed in their propagation andresponsibility in producing glioma heterogeneity [41], but data are not available by MRItechniques. Bone marrow-derived endothelial precursors, labelled by super-paramagneticiron oxide nanoparticles, could be demonstrated in glioma-bearing immunodeficient SCIDmice by MRI [128], but no similar procedure has been adopted for GSCs. The only possibilityis to use the spatial relationship between MRI variables and tumor phenotypes [33] includinginto the phenotype the expression of GSC stemness status.
Acknowledgements
This work was supported by Grant n. 4011 SD/cv 2011-0438 from Compagnia di San Paolo,Turin, Italy.
Author details
Davide Schiffer1, Consuelo Valentini2, Antonio Melcarne3, Marta Mellai1, Elena Prodi2,Giovanna Carrara2, Tetyana Denysenko1,3, Carola Junemann3, Cristina Casalone4,Cristiano Corona4, Valentina Caldera1, Laura Annovazzi1, Angela Piazzi1, Paola Cassoni5,Rebecca Senetta5, Piercarlo Fania6 and Angelina Cistaro6,7
1 Neuro-bio-oncology Center of Policlinico di Monza Foundation, Vercelli, Italy
2 Neuroradiology Unit, CTO Hospital, Turin, Italy
3 Neurosurgery Unit, CTO Hospital, Turin, Italy
4 Istituto Zooprofilattico, Turin, Italy
5 Department Medical Sciences, University of Turin, Turin, Italy
6 Positron Emission Tomography Center IRMET S.p.A, Euromedic inc., Turin, Italy
7 Institute of Cognitive Sciences and Technologies, National Research Council, Rome, Italy
References
[1] Coons SW, Johnson PC, Scheithauer BW, Ytes AJ, Pearl DK. Improving diagnostic ac‐curacy and interobserver concordance in the classification and grading of primarygliomas. Cancer 1997; 79(7): 1381-1393.
Spatial Relationships of MR Imaging and Positron Emission Tomography with Phenotype, Genotype and...http://dx.doi.org/10.5772/58391
83

[2] Schiffer D, Chiò A, Giordana MT, Mauro A, Migheli A, et al. The vascular responseto tumor infiltration in malignant gliomas. Morphometric and reconstruction study.Acta Neuropathologica 1989; 77(4): 369-378.
[3] Schiffer D. Brain tumors: biology, pathology and clinical references. Berlin, Heidel‐berg, New York: Springer; 1997.
[4] Schiffer D. Brain tumor pathology. Current diagnostic hotspots and pitfalls. Dor‐drecht: Springer; 2006.
[5] Alavi JB, Alavi A, Chawluk J, Kushner M, Powe J, et al. Positron emission tomogra‐phy in patients with glioma. A predictor of prognosis. Cancer 1988; 62(6): 1074-1078.
[6] Padma MV, Said S, Jacobs M, Hwang DR, Dunigan K, et al. Prediction of pathologyand survival by FDG PET in gliomas. Journal of Neuro-Oncology 2003: 64(3):227-237.
[7] Kitis O, Altay H, Calli C, Yunten N, Akalin T, et al. Minimum apparent diffusion co‐efficients in the evaluation of brain tumors. European Journal of Radiology 2005;55(3): 393-400.
[8] Murakami R, Hirai T, Sugahara T, Fukuoka H, Toya R, at al. Grading astrocytic tu‐mors by using apparent diffusion coefficient parameters: superiority of a one-versustwo-parameter pilot method. Radiology 2009; 251(3): 838-845.
[9] Kang Y, Choi SH, Kim YJ, Kim KG, Sohn CH, et al. Gliomas: histogram analysis ofapparent diffusion coefficient maps with standard-or high-b-value diffusion-weight‐ed MR imaging-correlation with tumor grade. Radiology 2011; 261(3): 882-890.
[10] Castillo M, Smith JK, Kwock L, Wilber K. Apparent diffusion coefficients in the eval‐uation of high-grade cerebral gliomas. AJNR American Journal of Neuroradiology2001; 22(1): 60-64.
[11] Cha S. Update on brain tumor imaging: from anatomy to physiology. American Jour‐nal of Neuroradiology 2006; 27(3): 475-487.
[12] Law M, Cha S, Knopp EA, Johnson G, Arnett J, et al. High-grade gliomas and solitarymetastases: differentiation by using perfusion and proton spectroscopic MR imaging.Radiology 2002; 222(3): 715-721.
[13] Yang S, Zhang C, Zhu T, Cai L, Gao S, et al. Resection of gliomas using positronemission tomography/computer tomography neuronavigation. Neurologia Medico-Chirurgica (Tokyo) 2007; 47(9): 397-401.
[14] Howe FA, Barton SJ, Cudlip SA, Stubbs M, Saunders DE, et al. Metabolic profiles ofhuman brain tumors using quantitative in vivo 1H magnetic resonance spectroscopy.Magnetic Resonance in Medicine 2003; 49(2): 223-232.
Tumors of the Central Nervous System – Primary and Secondary84

[15] Al-Okaili RN, Krejza J, Wang S, Woo JH, Melhem ER. Advanced MR imaging techni‐ques in the diagnosis of intraaxial brain tumors in adults. Radiographics 2006;26(Suppl 1): S173-189.
[16] Jellison BJ, Field AS, Medow J, Lazar M, Salamat MS, et al. Diffusion tensor imagingof cerebral white matter: a pictorial review of physics, fiber tract anatomy, and tumorimaging patterns. American Journal of Neuroradiology 2004; 25(3): 356-369.
[17] Lu S, Ahn D, Johnson G, Law M, Zagzag D, et al. Diffusion-tensor MR imaging ofintracranial neoplasia and associated peritumoral edema: introduction of the tumorinfiltration index. Radiology 2004; 232(1): 221-228.
[18] White ML, Zhang Y, Yub F, Jaffar Kazmi SA. Diffusion tensor MR imaging of cere‐bral gliomas: evaluating fractional anisotropy characteristics. American Journal ofNeuroradiology 2011; 32(2): 374-381.
[19] Shuyuan Y, Chuan Z, Shuyuan Y, Li C, Shuo G, et al. Preoperative estimation andresection of gliomas using positron emission tomography/computed tomographyneuronavigation. In: Garami M. (ed.) Management of CNS tumors. Rijeka: InTech;2012. p179-196.
[20] Jacobs AH, Kracht LW, Gossmann A, Rüger MA, Thomas AV, et al. Imaging in neu‐rooncology. The Journal of the American Society of Experimental NeuroTherapeutics2005; 2(2): 333-347.
[21] Di Chiro G, DeLaPaz RL, Brooks RA, Sokoloff L, Kornblith PL, et al. Glucose utiliza‐tion of cerebral gliomas measured by [18F] fluorodeoxyglucose and positron emis‐sion tomography. Neurology 1982; 32(12): 1323-1329.
[22] Delbeke D, Meyerowitz C, Lapidus RL, Maciunas RJ, Jennings MT, et al. Optimalcutoff levels of F-18 fluorodeoxyglucose uptake in the differentiation of low-gradefrom high-grade brain tumors with PET. Radiology 1995; 195(1): 47-52.
[23] Stanescu L, Ishak GE, Khanna PC, Biyyam DR, Shaw DW, et al. FDG PET of the brainin pediatric patients: imaging spectrum with MR imaging correlation. Radiographics2013; 33(5): 1279-1303.
[24] Bénard F, Romsa J, Hustinx R. Imaging gliomas with positron emission tomographyand single-photon emission computed tomography. Seminars in Nuclear Medicine2003; 33(2): 148-162.
[25] Chen W. Clinical applications of PET in brain tumors. Journal of Nuclear Medicine2007; 48(9): 1468-1481.
[26] Kato T, Shinoda J, Oka N, Miwa K, Nakayama N, et al. Analysis of 11C-methionineuptake on low-grade gliomas and correlation with proliferative activity. AmericanJournal of Neuroradiology 2008; 29(10): 1867-1871.
[27] Cistaro A. Atlas of PET/CT in pediatric patients. Dordrecht: Springer; 2013.
Spatial Relationships of MR Imaging and Positron Emission Tomography with Phenotype, Genotype and...http://dx.doi.org/10.5772/58391
85

[28] Stadlbauer A, Prante O, Nimsky C, Salomonowitz E, Buchfelder M, et al. Metabolicimaging of cerebral gliomas: spatial correlation of changes in O-(2-18F-fluoroethyl)-L-tyrosine PET and proton magnetic resonance spectroscopic imaging. Journal ofNuclear Medicine 2008; 49(5): 721-729.
[29] Airley RE, Monaghan JE, Jane N. Hypoxia and disease: opportunities for novel diag‐nostic and therapeutic prodrug strategies. Pharmaceutical Journal 2000; 264(7094):666-673.
[30] Bernsen HJ, Rijken PF, Peters H, Raleigh JA, Jeuken JW, et al. Hypoxia in a humanintracerebral glioma model. Journal of Neurosurgery 2000; 93(3): 449-454.
[31] Bruehlmeier M, Roelcke U, Schubiger PA, Ametamey SM. Assessment of hypoxiaand perfusion in human brain tumors using PET with 18F-fluoromisonidazole and15O-H2O. Journal of Nuclear Medicine 2004; 45(11): 1851-1859.
[32] Barajas RF Jr, Hodgson JG, Chang JS, Vandenberg SR, Yeh RF, et al. Glioblastomamultiforme regional genetic and cellular expression patterns: influence on anatomicand physiologic MR imaging. Radiology 2010; 254(2): 564-576.
[33] Barajas RF Jr, Phillips JJ, Parvataneni R, Molinaro A, Essock-Burns E, et al. Regionalvariation in histopathologic features of tumor specimens from treatment-naive glio‐blastoma correlates with anatomic and physiologic MR Imaging. Journal of Neuro-Oncology 2012; 14(7): 942-954.
[34] Di Costanzo A, Scarabino T, Troisi F, Popolizio T, Catapano D, et al. Proton MR spec‐troscopy of cerebral gliomas at 3 T: spatial heterogeneity, and tumour grade and ex‐tent. European Radiology 2008; 18(8): 1727-1735.
[35] Miwa K, Shinoda J, Yano H, Okumura A, Iwama T, et al. Discrepancy between lesiondistribution on methionine PET and MR images in patients with glioblastoma multi‐forme: insight from a PET and MR fusion image study. Journal of Neurology, Neuro‐surgery and Psychiatry 2004; 75(10): 1457-1462.
[36] Jacobs AH, Thomas A, Kracht LW, Li H, Dittmar C, et al. 18F-fluoro-L-thymidineand 11C-methylmethionine as markers of increased transport and proliferation inbrain tumors. Journal of Nuclear Medicine 2005; 46(12): 1948-1958.
[37] Chen W, Cloughesy T, Kamdar N, Satyamurthy N, Bergsneider M, et al. Imagingproliferation in brain tumors with 18F-FELT PET: comparison with 18F-FDG. Journalof Nuclear Medicine 2005; 46(6): 945-952.
[38] Price SJ, Fryer TD, Cleij MC, Dean AF, Joseph J, et al. Imaging regional variation ofcellular proliferation in gliomas using 3’-deoxy-3’-[18F]fluorothymidine positronemission tomography: an image-guided biopsy study. Clinical Radiology 2008; 64(1):52-63.
[39] Stadlbauer A, Pölking E, Prante O, Nimsky C, Buchfelder M, et al. Detection of tu‐mour invasion into the pyramidal tract in glioma patients with sensorimotor deficits
Tumors of the Central Nervous System – Primary and Secondary86

by correlation of (18)F-fluoroethyl-L-tyrosine PET and magnetic resonance diffusiontensor imaging. Acta Neurochirurgica (Wien) 2009; 151(9): 1061-1069.
[40] Giese A, Loo MA, Tran N, Haskett D, Coons SW, et al. Dichotomy of astrocytoma mi‐gration and proliferation. International Journal of Cancer 1996; 67(2): 275-282.
[41] Lathia JD, Gallagher J, Myers JT, Li M, Vasanji A, et al. Direct in vivo evidence fortumor propagation by glioblastoma cancer stem cells. Public Library of Science One2011; 6(9): e24807.
[42] Mazzoleni S, Galli R. Gliomagenesis: a game played by few players or a team effects?Frontiers in Neuroscience 2012; 4(1): 205-213.
[43] Reya T, Morrison SJ, Clarke MF, Weissman IL. Stem cells, cancer, and cancer stemcells. Nature 2001; 414(6859): 105-108.
[44] Adams JM, Strasser A. Is tumor growth sustained by rare cancer stem cells or domi‐nant clones? Cancer Res 2008; 68(11): 4018-4021.
[45] de Almeida Sassi F, Lunardi Brunetto A, Schwartsmann G, Roesler R, Abujamra AL.Glioma revisited: from neurogenesis and cancer stem cells to the epigenetic regula‐tion of the niche. Journal of Oncology 2012; 2012: 537861.
[46] Sun Y, Goderie SK, Temple S. Asymmetric distribution of EGFR receptor during mi‐tosis generates diverse CNS progenitor cells. Neuron 2005; 45(6): 873-886.
[47] De Bacco F, Casanova E, Medico E, Pellegatta S, Orzan F, et al. The MET oncogene isa functional marker of a glioblastoma stem cell subtype. Cancer Research 2012;72(17): 4537-4550.
[48] Piccirillo SG, Combi R, Cajola L, Patrizi A, Redaelli S, et al. Distinct pools of cancerstem-like cells coexist within human glioblastomas and display different tumorige‐nicity and independent genomic evolution. Oncogene 2009; 28(15): 1807-1811.
[49] Chen R, Nishimura MC, Bumbaca SM, Kharbanda S, Forrest WF, et al. A hierarchy ofself-renewing tumor-initiating cell types in glioblastoma. Cancer Cell 2010; 17(4):362-375.
[50] Mazzoleni S, Politi LS, Pala, M. Cominelli M, Franzin A, et al. Epidermal growth fac‐tor receptor expression identifies functionally and molecularly distinct tumor-initiat‐ing cells in human glioblastoma multiforme and is required for gliomagenesis.Cancer Research 2010; 70(19): 7500-7513.
[51] Caldera V, Mellai M, Annovazzi L, Piazzi A, Lanotte M, et al. Antigenic and geno‐typic similarity between primary glioblastomas and their derived neurospheres.Journal of Oncology 2011; 2011: 314962.
[52] Schiffer D, Mellai M, Annovazzi L, Piazzi A, Monzeglio O, et al. Glioblastoma cancerstem cells: basis for a functional hypothesis. Stem Cell Discovery 2012; 2(3): 122-131.
Spatial Relationships of MR Imaging and Positron Emission Tomography with Phenotype, Genotype and...http://dx.doi.org/10.5772/58391
87

[53] Charles NA, Holland EC, Gilbertson R, Glass R, Kettenmann H. The brain tumor mi‐croenvironment. Glia 2012; 60(3): 502-514.
[54] Filatova A, Acker T, Garvalov BK. The cancer stem cell niche(s): the crosstalk be‐tween glioma stem cells and their microenvironment. Biochimica et Biophysica Acta2013; 1830(2): 2496-2508.
[55] Schiffer D, Mellai M, Annovazzi L, Caldera V, Piazzi A, et al. Stem cell niches in glio‐blastoma. A neuropathological view. Submitted.
[56] Dunn KW, Kamocka MM, McDonald JH. A practical guide to evaluating colocaliza‐tion in biological microscopy. American Journal of Physiology. Cell Physiology 2011;300(4): C723-742.
[57] Adler J, Parmryd I. Quantifying colocalization by correlation: the Pearson correlationcoefficient is superior to the Mander's overlap coefficient. Cytometry 2010; 77(8):733-742.
[58] Górska-Chrzastek M, Grzelak P, Bieńkiewicz M, Tybor K, Zakrzewska E, et al. As‐sessment of clinical usefulness of 131I alpha-methyl-tyrosine and fused SPECT/MRIimaging for diagnostics of recurrent cerebral gliomas. Nuclear Medicine Review.Central & Eastern Europe 2004; 7(2): 135-141.
[59] Burger PC, Heinz ER, Shibata T, Kleihues P. Topographic anatomy and CT correla‐tions in untreated glioblastoma multiforme. Journal of Neurosurgery 1988; 68(5):698-704.
[60] Shapiro WE. Current therapy for brain tumors: back to the future. Archives of Neu‐rology 1999; 56(4): 429-432.
[61] Schiffer D, Annovazzi L, Caldera V, Mellai M. The brain adjacent to tumor (BAT). In:Garami M. (ed.) Management of CNS tumors. Rijeka, InTech; 2011. p197-224.
[62] Caffo M, Barresi V, Caruso G, La Fata G, Pino MA, et al. Gliomas biology: angiogene‐sis and invasion. In: Lichtor T. (ed.) Evolution of the molecular biology of brain tu‐mors and the therapeutic implications. Rijeka, InTech; 2013. p37-103.
[63] Province P, Griguer CE, Han X, Louis NB, Shaykh HF. Hypoxia, angiogenesis andmechanisms for invasion of malignant gliomas. In: Lichtor T. (ed.) Evolution of themolecular biology of brain tumors and the therapeutic implications. Rijeka, InTech;2013. p105-123.
[64] Mangiola A, de Bonis P, Maira G, Balducci M, Sica G, et al. Invasive tumor cells andprognosis in a selected population of patients with glioblastoma multiforme. Cancer2008; 113(4): 841-846.
[65] Ramakrishna R, Barber J, Kennedy G, Rizvi A, Goodkin R, et al. Imaging features ofinvasion and preoperative and postoperative tumor burden in previously untreated
Tumors of the Central Nervous System – Primary and Secondary88

glioblastoma: correlation with survival. Surgical Neurology International 2010; 1(1):40-51.
[66] Glas M, Rath BH, Simon M, Reinartz R, Schramme A, et al. Residual tumor cells areunique cellular targets in glioblastoma. Annals of Neurology 2010; 68(2): 264-269.
[67] Kitai R, Horita R, Sato K, Yoshida K, Arishima H, et al. Nestin expression in astrocyt‐ic tumors delineates tumor infiltration. Brain Tumor Pathology 2010; 27(1): 17-21.
[68] Capper D, Weissert S, Balss J, Habel A, Meyer J, et al. Characterization of R132H mu‐tation-specific IDH1 antibody binding in brain tumors. Brain Pathology 2010; 20(1):245-254.
[69] Schiffer D. Neuropathology and imaging: the ways in which gliomas spreads andvaries in its histological aspects, In: Walker and DGT Thomas (ed.) Biology of braintumors. Boston, Nijhoff: 1986. p286-290.
[70] Nishio S, Korosue K, Tateishi J, Fukui M, Kitamura K. Ventricular and subarachnoidseeding of intracranial tumors of neuroectodermal origin-a study of 26 consecutiveautopsy cases with reference to focal ependymal defect. Clinical Neuropathology1982; 1(2): 83-91.
[71] Rosenblum ML. Factors influencing tumor cell traffic in the central nervous system.Surgical Neurology 1995; 43(6): 595.
[72] Pilkington GJ. Glioma heterogeneity in vitro: the significance of growth factor andgangliosides. Neuropathology and Applied Neurobiology 1992; 18(5): 434-432.
[73] Merzak A, Koochekpour S, Dkhissi F, Raynal S, Lawrence D, et al. Synergism be‐tween growth-factors in the control of glioma cell-proliferation, migration and inva‐sion in-vitro. International Journal of Oncology 1995; 6(5): 1079-1085.
[74] Dalrymple SJ, Parisi JE, Roche PC, Ziesmer SC, Scheithauer BW, et al. Changes inproliferating cell nuclear antigen expression in glioblastoma multiforme cells along astereotactic biopsy trajectory. Neurosurgery 1994; 35(6): 1036-1044.
[75] Roggendorf W, Strupp S, Paulus W. Distribution and characterization of microglia/macrophages in human brain tumors. Acta Neuropathologica 1996; 92(3): 288-293.
[76] Morimura T, Neuchrist C, Kitz K, Budka H, Scheiner O, et al. Monocyte subpopula‐tions in human gliomas: expression of Fc and complement receptors and correlationwith tumor proliferation. Acta Neuropathologica 1990; 80(3): 287-294.
[77] Yi L, Xiao H, Xu M, Ye X, Hu J, et al. Glioma-initiating cells: A predominant role inmicroglia/macrophages tropism to glioma. Journal of Neuroimmunology 2011;232(1-2): 75-82.
[78] Graeber MB, Scheithauer BW, Kreutzberg GW. Microglia in brain tumors. Glia 2002;40(2): 252-259.
Spatial Relationships of MR Imaging and Positron Emission Tomography with Phenotype, Genotype and...http://dx.doi.org/10.5772/58391
89

[79] Zhai H, Heppner FL, Tsirka SE. Microglia/macrophages promote glioma progression.Glia 2011; 59(3): 472-485.
[80] Bushong EA, Martone ME, Ellisman MH. Maturation of astrocyte morphology andthe establishment of astrocyte domains during postnatal hippocampal development.International Journal of Developmental Neuroscience 2004; 22(2): 73-86.
[81] Clarke SR, Shetty AK, Bradley JL, Turner DA. Reactive astrocytes express the embry‐onic intermediate neurofilament nestin. Neuroreport 1994; 5(15): 1885-1888.
[82] Eliasson C, Sahlgren C, Berthold CH, Stakeberg J, Celis JE, et al. Intermediate fila‐ment protein partnership in astrocytes. The Journal Biological Chemistry 1999;274(34): 23996-24006.
[83] Mandonnet E, Capelle L, Duffau H. Extension of paralimbic low grade gliomas: to‐ward an anatomical classification based on white matter invasion patterns. Journal ofNeuro-Oncology 2006; 78(2): 179-185.
[84] Ellingson BM, LaViolette PS, Rand SD, Malkin MG, Connelly JM, Mueller, et al. Spa‐tially quantifying microscopic tumor invasion and proliferation using a voxel-wisesolution to a glioma growth model and serial diffusion MRI. Magnetic Resonance inMedicine 2011; 65(4): 1131-1143.
[85] Tamagno I, Schiffer D. Nestin expression in reactive astrocytes of human pathology. JNeuro-Oncology 2006; 80(3): 227-233.
[86] Selker RG, Mendelow H, Walker M, Sheptak PE, Phillips JG. Pathological correlationof CT ring in recurrent previously treated gliomas. Surgical Neurology 1982; 17(4):251-254.
[87] Kelly PJ, Daumas-Duport C, Kispert DB, Kall BA, Scheithauer BW, et al. Imaging-based stereotaxic serial biopsies in untreated intracranial glial neoplasms. Journal ofNeurosurgery 1987; 66(6): 865-874.
[88] Watanabe M, Tanaka R, Takeda N. Magnetic resonance imaging and histopathologyof cerebral gliomas. Neuroradiology 1992; 34(6): 463-469.
[89] Witwer BP, Moftakhar R, Hasan KM, Deshmukh P, Haughton V, et al. Diffusion-ten‐sor imaging of white matter tracts in patients with cerebral neoplasm. Journal ofNeurosurgery 2002; 97(3): 568-575.
[90] Price SJ, Gillard JH. Imaging biomarkers of brain tumour margin and tumour inva‐sion. The British Journal of Radiology 2011; 84(Spec No 2): S159-167.
[91] Zhou XJ, Leeds NE, Poonawalla AH, Weinberg J. Assessment of tumor cell infiltra‐tion along white matter fiber using diffusion tensor imaging. Proceedings of the In‐ternational Society for Magnetic Resonance in Medicine 2003; 11: 2238.
Tumors of the Central Nervous System – Primary and Secondary90

[92] Price SJ, Peña A, Burnet NG, Pickard JD, Gillard JH. Detecting glioma invasion of thecorpus callosum using diffusion tensor imaging. The British Journal of Neurosurgery2004; 18(4): 391-395.
[93] Pauleit D, Langen KJ, Floeth F, Hautzel H, Riemenschneider MJ, et al. Can the appa‐rent diffusion coefficient be used as a non invasive parameter to distinguish tumortissue from peritumoral tissue in cerebral gliomas? Journal of Magnetic ResonanceImaging 2004; 20(5): 758-764.
[94] Price SJ, Jena R, Burnet NG, Carpenter TA, Pickard JD, et al. Predicting patterns ofglioma recurrence using diffusion tensor imaging. European Radiology 2007; 17(7):1675-1684.
[95] McKnight TR, von dem Bussche MH, Vigneron DB, Lu Y, Berger MS, et al. Histopa‐thological validation of three-dimensional magnetic resonance spectroscopy index asa prediction of tumor presence. Journal of Neurosurgery 2002; 97(4): 794-802.
[96] Croteau D, Scarpace L, Hearshen D, Gutierrez J, Fisher JL, et al. Correlation betweenmagnetic resonance spectroscopy imaging and image-guided biopsies: semiquantita‐tive and qualitative histopathological analyses of patients with untreated glioma.Neurosurgery 2001; 49(4): 823-829.
[97] Pirzkall A, Li X, Oh J, Chang S, Berger MS, et al. 3D MRSI fro resected high-gradegliomas before RT: tumor extent according to metabolic activity in relation to MRI.International Journal of Radiation Oncology, Biology, Physics 2004; 59(1): 126-137.
[98] Law M, Cha S, Knopp EA, Johnson G, Arnett J, et al. High-grade gliomas and solitarymetastases: differentiation by using perfusion and proton spectroscopy MR imaging.Radiology 2002; 222(3): 715-722.
[99] Nelson SJ. Multivoxel magnetic resonance spectroscopy of brain tumors. MolecularCancer Therapeutics 2003; 2(5): 497-507.
[100] Engelhorn T, Savaskan NE, Schwarz MA, Kreutzer J, Meyer EP, et al. Cellular charac‐terization of the peritumoral edema zone in malignant brain tumors. Cancer Science2009; 100(10): 1856-1862.
[101] Mou K, Chen M, Mao Q, Wang p, Ni R, et al. APQ-4 in peritumoral edematous tissueis correlated with the degree of glioma and with expression of VEGF and HIF-alpha.Journal of Neuro-Oncology 2010; 100(3): 375-383.
[102] Stadlbauer A, Nimsky C, Buslei R, Pinker K, Gruber S, et al. Proton magnetic reso‐nance spectroscopic imaging in the borderzone of gliomas. Correlation of metabolicand histological changes at low tumor infiltration-initial results. Investigative Radiol‐ogy 2007; 42(4): 218-223.
[103] Ricci R, Bacci A, Tugnoli V, Battaglia S, Maffei M, et al. Metabolic findings on 3T 1H-MR spectroscopy in peritumoral brain edema. AJNR American Journal of Neuroradi‐ology 2007; 28(7): 1287-1291.
Spatial Relationships of MR Imaging and Positron Emission Tomography with Phenotype, Genotype and...http://dx.doi.org/10.5772/58391
91

[104] Schiffer D, Annovazzi L, Caldera V, Mellai M. On the origin and growth of gliomas.Anticancer Research 2010; 30(6): 1977-1998.
[105] Holland EC. Progenitor cells and glioma formation. Current Opinion in Neurology2001; 14(6): 683-688.
[106] Alcantara Llaguno S, Chen J, Kwon CH, Jackson EL, Li Y, et al. Malignant astrocyto‐mas originate from neural stem/progenitor cells in a somatic tumor suppressormouse model. Cancer Cell 2009; 15(1): 45-56.
[107] Jaques TS, Swales A, Brzozowski MJ, Henriquez MV, Linehan JN, et al. Combina‐tions of genetic mutations in the adult neural stem cell compartment determine braintumour phenotypes. The EMBO Journal 2010; 29(1): 222-235.
[108] Barami K, Sloan AE, Rojiani A, Schell MJ, Staller A, et al. Relationship of gliomas tothe ventricular walls. Journal of Clinical Neuroscience 2009; 16(2): 195-201.
[109] Sanai N, Alvarez-Buylla, Berger MS. Neural stem cells and the origin of gliomas. TheNew England Journal of Medicine 2005; 353(8): 811-822.
[110] Siebzehnrubl FA, Reynolds BA, Vescovi A, Steindler DA, Deleyrolle LP. The originsof glioma: e pluribus unum? Glia 2011; 59(8): 1135-1147.
[111] Dufour C, Cadusseau J, Varlet P, Surena AL, de Faira GP, et al. Astrocytes revertedto a neural progenitor-like state with transforming growth factor alpha are sensitizedto cancerous transformation. Stem Cells 2009; 27(10): 2373-2382.
[112] Silver DJ, Steindler DA. Common astrocytic programs during brain development, in‐jury and cancer. Trends in Neurosciences 2009; 32(6): 303-311.
[113] Buffo A, Rite I, Tripathi P, Lepier A, Colak D, et al. Origin and progeny of reactivegliosis: a source of multipotent cells in the injured brain. Proceedings of the NaturalAcademy of Sciences USA 2008; 105(9): 3581-3586.
[114] Li L, Neaves WB. Normal stem cells and cancer stem cells: the niche matters. CancerResearch 2006; 66(9): 4553-4557.
[115] Calabrese C, Poppleton H, Kokac M, Hogg TL, Fuller C, et al. A perivascular nichefor brain tumor stem cells. Cancer Cell 2007; 11(1): 69-82.
[116] Bao S, Wu S, Sathornsumetee S, Hao Y, Li Z, et al. Stem cell-like glioma cells promotetumor angiogenesis through vascular endothelial growth factor. Cancer Research2006; 66(16): 7843-7848.
[117] Jensen RL, Ragel BT, Whang K, Gillespie D. Inhibition of hypoxia inducible factor-1alpha (HIF-1 alpha) decreases vascular endothelial growth factor (VEGF) secretionand tumor growth in malignant gliomas. Journal of Neuro-Oncology 2006; 78(3):233-247.
Tumors of the Central Nervous System – Primary and Secondary92

[118] Folkins C, Shaked Y, Man S, Tang T, Lee CR, et al. Glioma tumor stem-like cells pro‐mote tumor angiogenesis and vasculogenesis via vascular endothelial growth factorand stromal-derived factor 1. Cancer Research 2009; 69(18): 7243-7251.
[119] Bar EE, Lin A, Mahairaki V, Matsui W, Eberhart CG. Hypoxia increases the expres‐sion of stem-cell markers and promotes clonogenicity in glioblastoma neurospheres.The American Journal of Pathology 2010; 177(3): 1491-1502.
[120] Charles N, Holland EC. The perivascular niche microenvironment in brain tumorprogression. Cell Cycle 2010; 9(15): 3012-3021.
[121] Christensen K, Schrøder HD, Kristensen BW. CD133 identifies perivascular niches ingrade II-IV astrocytomas. Journal of Neuro-Oncology 2008; 90(2): 157-170.
[122] Seidel S, Garvalov BK, Wirta V, von Stechow L, Schänzer A, et al. A hypoxic nicheregulates glioblastoma stem cells through hypoxia inducible factor 2 alpha. Brain2010; 133(Pt4): 983-995.
[123] Kargiotis O, Rao JS, Kyritsis AP. Mechanisms of angiogenesis in gliomas. Journal ofNeuro-Oncology 2006; 78(3): 281-293.
[124] Zipori D. The nature of stem cells: state rather than entity. Nature Review Genetics2004; 5(11): 873-878.
[125] Reynolds BA, Vescovi AL. Brain cancer stem cells: think twice before going flat. CellStem Cell 2009; 5(5): 466-467.
[126] Pallini R, Ricci-Vitiani L, Banna GL, Signore M, Lombardi D, et al. Cancer stem cellanalysis and clinical outcome in patients with glioblastoma multiforme. Clinical Can‐cer Research 2008; 14(24): 8205-8212.
[127] Persano L, Rampazzo E, Della Puppa A, Pistollato F, Basso G. The three-layer con‐centric model of glioblastoma: cancer stem cells, microenvironmental regulation, andtherapeutic implications. TheScientificWorldJournal 2011; 11: 1829-1841.
[128] Anderson S, Glod J, Arbab AS, Noel M, Ashari P, et al. Noninvasive MR imaging ofmagnetically labelled stem cells in directly identify neovasculature in a glioma mod‐el. Blood 2005; 105(1): 420-425.
Spatial Relationships of MR Imaging and Positron Emission Tomography with Phenotype, Genotype and...http://dx.doi.org/10.5772/58391
93

Copyright © 2022 FDOKUMEN