Spatial Low Frequency Pattern Analysis in Positron Emission Tomography: A Study Between Normals and...
9
Spatial Low Frequency Pattern Analysis in Positron Emission Tomography: A Study Between Normals and Schizophrenics Alejandro V. Levy, Francisco Gomez-Mont, Nora D. Volkow, Juan F. Corona, Jonathan D. Brodie, Robert Cancro Nathan S. Kline Institute for Psychiatric Research, Orangeburg, New York, Department of Psychiatry, New York University School of Medicine, New York, New York, Unidad Informatica, Instituto Mexicano de PsiquiatrÃ-a,Mexico City, Mexico, Medical Department, Brookhaven National Laboratory, Upton, Long Island, New York, Centro CientÃ-fico,I.B.M. de Mexico, Mexico City, Mexico Using the two-dimensional Fourier transform and the brain's centroidal principal axis, a method is developed for the analy sis of PET metabolic brain images without the use of prede fined anatomic regions of interest. We applied the method to images from a group of 11 normal and 12 medicated schizo phrenics tested under resting conditions and under a visual task. A cortical/subcortical spatial pattern was found to be significant in two directions; anterior/posterior and chiasmatic (left-anterior/right-posterior). The best individual clinical clas sification (Jackknife classification) occurred under visual task at two axial brain levels: at the basal ganglia with correct classification rates of 91% and 84%, while the cerebellum had rates of 82% and 92%. These high classification rates were obtained using only the four coefficients of the lowest spatial frequency. These results point to the generalized brain dysfunction of regional glucose metabolism in chronic medi cated schizophrenics both at rest and at a visual image- tracking task. JNucÃ-Med 1991; 33:287-295 uring the last 10 years, several methodologies have been proposed to analyze brain metabolic images obtained with positron emission tomography (PET). All of the methods developed to evaluate metabolic differences be tween brain task conditions or between patient groups can be classified into two global strategies; the traditional re gion of interest (ROI) and the new function of interest (FOI) strategy. The ROI Strategy One version of this strategy has been to compare brain regional metabolic differences between groups (1-9); an other version has been to compare the pattern of metabolic Received February 26, 1991; revision accepted September 19, 1991. For reprints contact: A. V. Levy, PhD, Brookhaven National Laboratories, Upton, NY 11973. interactions among brain areas between groups (10-16). Although these versions have been very useful in demon strating metabolic changes in disease, they are limited by the fact that they require anatomical predefmition of the ROIs to be analyzed. For some research hypotheses, such as questions regarding a particular known pathway, this is the most appropriate protocol. However, if a pathway is not known a priori and only a few ROIs are selected, then these strategies might introduce a large source of error, since it has been shown that anatomical regions are func tionally heterogeneous (17) and the PET metabolic images represent functional information. The FOI Strategy Recently, a second strategy has been developed by two research groups (18-22,23-25) that overcomes these lim itations and analyzes the PET image of the whole brain without the need to define anatomical ROIs a priori. In this strategy, once the functional image has been analyzed and significant neural patterns have been de tected automatically by the method, then, a posteriori, these significant neural patterns are projected into an anatomical image and their anatomical ROI identification is obtained. We have called this functional image-driven strategy the FOI strategy (25), to contrast its basic properties from those of the anatomical image driven ROI strategy. In the FOI strategy the use of a stereotactic anatomical atlas or a magnetic resonance brain image (MRI) comes at the end of the method, while in the ROI strategy the anatomical information is used in the first step of the method. The FOI methods developed in (18-22) have used as a function of interest the PET difference image obtained by subtracting the resting brain image from a task-activated brain image of the same subject; this produces a different image with a small well defined focal region that was activated by the task. The projection of the activated region into a stereotactic anatomical brain atlas is obtained with the help of an additional lateral skull x-ray. Fourier Analysis of Schizophrenic Images • Levy 287
Transcript of Spatial Low Frequency Pattern Analysis in Positron Emission Tomography: A Study Between Normals and...
Spatial Low Frequency Pattern Analysis inPositron Emission Tomography: A StudyBetween Normals and SchizophrenicsAlejandro V. Levy, Francisco Gomez-Mont, Nora D. Volkow, Juan F. Corona, Jonathan D. Brodie,Robert Cancro
Nathan S. Kline Institute for Psychiatric Research, Orangeburg, New York, Department of Psychiatry, New York UniversitySchool of Medicine, New York, New York, Unidad Informatica, Instituto Mexicano de PsiquiatrÃa,Mexico City, Mexico,Medical Department, Brookhaven National Laboratory, Upton, Long Island, New York, Centro CientÃfico,I.B.M. de Mexico,Mexico City, Mexico
Using the two-dimensional Fourier transform and the brain's
centroidal principal axis, a method is developed for the analysis of PET metabolic brain images without the use of predefined anatomic regions of interest. We applied the method toimages from a group of 11 normal and 12 medicated schizophrenics tested under resting conditions and under a visualtask. A cortical/subcortical spatial pattern was found to besignificant in two directions; anterior/posterior and chiasmatic(left-anterior/right-posterior). The best individual clinical clas
sification (Jackknife classification) occurred under visual taskat two axial brain levels: at the basal ganglia with correctclassification rates of 91% and 84%, while the cerebellumhad rates of 82% and 92%. These high classification rateswere obtained using only the four coefficients of the lowestspatial frequency. These results point to the generalized braindysfunction of regional glucose metabolism in chronic medicated schizophrenics both at rest and at a visual image-
tracking task.
J NucÃMed 1991; 33:287-295
uring the last 10 years, several methodologies havebeen proposed to analyze brain metabolic images obtainedwith positron emission tomography (PET). All of themethods developed to evaluate metabolic differences between brain task conditions or between patient groups canbe classified into two global strategies; the traditional region of interest (ROI) and the new function of interest(FOI) strategy.
The ROI StrategyOne version of this strategy has been to compare brain
regional metabolic differences between groups (1-9); another version has been to compare the pattern of metabolic
Received February 26, 1991; revision accepted September 19, 1991.For reprints contact: A. V. Levy, PhD, Brookhaven National Laboratories,
Upton, NY 11973.
interactions among brain areas between groups (10-16).Although these versions have been very useful in demonstrating metabolic changes in disease, they are limited bythe fact that they require anatomical predefmition of theROIs to be analyzed. For some research hypotheses, suchas questions regarding a particular known pathway, this isthe most appropriate protocol. However, if a pathway isnot known a priori and only a few ROIs are selected, thenthese strategies might introduce a large source of error,since it has been shown that anatomical regions are functionally heterogeneous (17) and the PET metabolic imagesrepresent functional information.
The FOI StrategyRecently, a second strategy has been developed by two
research groups (18-22,23-25) that overcomes these limitations and analyzes the PET image of the whole brainwithout the need to define anatomical ROIs a priori.
In this strategy, once the functional image has beenanalyzed and significant neural patterns have been detected automatically by the method, then, a posteriori,these significant neural patterns are projected into ananatomical image and their anatomical ROI identificationis obtained.
We have called this functional image-driven strategy theFOI strategy (25), to contrast its basic properties fromthose of the anatomical image driven ROI strategy. In theFOI strategy the use of a stereotactic anatomical atlas or amagnetic resonance brain image (MRI) comes at the endof the method, while in the ROI strategy the anatomicalinformation is used in the first step of the method.
The FOI methods developed in (18-22) have used as afunction of interest the PET difference image obtained bysubtracting the resting brain image from a task-activatedbrain image of the same subject; this produces a differentimage with a small well defined focal region that wasactivated by the task. The projection of the activated regioninto a stereotactic anatomical brain atlas is obtained withthe help of an additional lateral skull x-ray.
Fourier Analysis of Schizophrenic Images •Levy 287

The work done in (23-25) has used as a function ofinterest the PET image differences between clinical groupsof normal and schizophrenic subjects; this produces adifference image with large complex patterns that extendthroughout the brain pointing to those anatomical areasassociated with the mental illness. These complex patternsare projected into a stereotactic anatomic atlas without theneed of additional x-ray images; instead the brain's cen-
troidal principal axis is extracted directly from the PETimage.
Strategy of the Present WorkIn this paper a method is presented for data synthesis
and feature extraction of PET metabolic images fromseveral clinical groups following the FOI strategy. However, the present method is not intended for the identification of functional-anatomical relationships. Its objectiveis to attain reliable clinical classification of a single subjectin a practical way. This is done by achieving a large datacompression ratio while retaining the meaningful featuresof the PET metabolic image. In a sense it is an extremeexample of the FOI strategy since it only analyzes functional images; no anatomical data are ever used in theconclusions of the method.
In the present method, the original PET images are notused to compute a difference image as the FOI; instead amuch simpler PET brain image is first obtained for eachsubject. These simpler images are easier to analyze and inspite of their reduced amount of data still retain the salientfeatures that distinguish clinical groups and might even beused for clinical classification of a single subject. To obtainsimpler meaningful images, we shall use a well-knowntechnique for data compression whose geometric properties are now briefly presented.
A Geometric Interpretation of Two-Dimensional Four
ier Transform (TDFT)The TDFT is often used in image analyses (26-28) to
represent any two-dimensional image as the sum of a setof simpler spatial patterns each one weighted by a Fouriercoefficient. By applying TDFT, the thousands of numbersthat are contained in a digital metabolic image can berepresented by spatial patterns that retain the same basicgeometric shape while their spatial frequency increases.Those Fourier coefficients associated with low spatial frequencies represent gross properties of the image; thoseassociated with increasing spatial frequencies representincreasingly smaller image details (29).
A graphical representation of some of these simplermetabolic brain images is given in Figure 1, while some ofthe geometric patterns use by the TDFT are illustrated inFigure 2.
In this work, we are interested in comparing clinicalgroups of small size, with about 10 subjects per group.Therefore it is necessary to use a small number of variablesas descriptors of each group. We have selected as descriptorvariables the four coefficients related to the magnitude of
FIGURE 1. Simplified metabolic brain images obtained byTDFT by adding low spatial frequency (harmonic) patterns; (A) 0and 1st harmonic, (B) 0, + 1st + 2nd harmonic, (C) O up to 3rd,(D) 0 up to 4th, (E) Oup to 5th, (F) original PET VI brain metabolicimage. The close approximation to (F) obtained by TDFT in (E),even if the 6th and higher spatial frequencies are not used, ispossible because of the low spatial resolution in PET images;typically for a PET VI camera the FWHM is 11 mm. The originalimage has 5,184 numerical values, while (A) uses only 10 coefficient values, attaining a data compression ratio of 518.
the first spatial frequency normalized by the zero ordercoefficient, (the zero order Fourier coefficient is a singlenumber that denotes the total metabolic activity of theslice). As shown in the Appendix, the resulting mathematical expressions for these four descriptor variables can beinterpreted as feature descriptors for the brain's metabolic
spatial patterns which contrast cortical/subcortical areasof the brain in four different directions: front/back, left/right and two chiasmatic ones; left-front/right-back, andright-front/left-back.
Since each brain slice image analyzed by TDFT consistsof (72 x 72) pixels and each pixel represents 2.78 mm onits edge, then the first harmonic has a cycle of 2.78 mm x72 or 20 cm per cycle. This study is therefore looking atjust a few variables that represent the complex metabolicpatterns contained in a PET image as a single large smoothmetabolic pattern whose size is comparable to the size ofthe whole brain; this large smooth pattern is illustrated inFigure 3.
In the present method, we utilized TDFT for the characterization of the brain metabolic images because:
1. The geometrical shape and relative positions of thedifferent brain structures, as described by the deox-yglucose method, reflects brain activity (7,31,32).
2. The analysis of PET images from various psychiatricpopulations has shown abnormal patterns of metabolism (2,6,8,10,14).
3. Higher cognitive functions and their disruptions inpsychiatric disorders are not localized to a particularanatomical region but are widely distributed in thebrain (33-35).
288 The Journal of Nuclear Medicine •Vol. 33 •No. 2 •February 1992

*a) b)
FIGURE 2. A few of the geometrie patterns used by theTDFT to obtain the simplifiedbrain images shown in Figure1. Rows 2 to 5 illustrate theparticular patterns in the front/back, left/right and chiasmaticdirections as the spatial frequency increases from left toright. Figure 2A is obtained byadding the 0 and 1st harmonicpatterns shown in the left handcolumn. As suggested in themiddle column, Figure 2B isobtained as the second harmonic pattern is added to (A).As suggested in the right handcolumn, if all the patterns ofthe third and higher harmonicsare added to (B), the TDFTwould yield a better approximation to the original image,whose complex pattern isshown in Figure 2C.
4. All of the TDFT coefficients are computed using themetabolic information of the whole brain, thereforeany one of these coefficients might be capable tocharacterize whole brain differences in clinicalgroups.
To test the validity of this method, we used the firstharmonic (lowest frequency) coefficients from the TDFTof the metabolic images as a feature vector to discriminatebetween the metabolic patterns of images from controlsubjects and from schizophrenic patients.
Invariance of the Fourier CoefficientsIn order to avoid the errors introduced in the TDFT
coefficients because of positioning errors within the PETcamera, we abandon the use of the image coordinatesbased in the reference axis of the camera.
Instead, we compute for each subject its unique, individual centroidal principal axis based on the geometricshape of its brain (23,24,25) and represent the brain imagewith coordinates in this invariant reference system. Thesensitivity of the TDFT coefficients to intersubject headsize is removed by scaling each brain slice to the common
Fourier Analysis of Schizophrenic Images •Levy 289

FIGURE 3. Thesmall number of lowfrequency Fouriercoefficients used inthis study, representthe brain's metabolic
activity as thesmooth, large, spatial pattern shown in(A) and (B). The corresponding originalmetabolic PET brainimage is shown in(C). The presentstudy is able to identify a single subjectas normal or schizophrenic with over90% correct classification using onlyfour normalized lowfrequency Fouriercoefficients as feature descriptors of acomplex metabolicPET brain image.
dimensions provided by Schaltenbrand's anatomic atlas
(30).
MATERIALS AND METHODS
Scan MethodologyThe positron emission scan was obtained using the PET-VI
scanner at Brookhaven National Laboratory (FWHM resolutionof 12 mm). Metabolic images were obtained using "C-deoxyglu-
cose following a standard procedure as described elsewhere (36,37). The subjects were scanned twice on the same day, bothunder baseline conditions (eyes open, ears plugged) and uponactivation with a visual eye-tracking task (36). While performing
the studies, the room light was dim and noise kept to a minimum.A central sagittal and a canthomeatal line were used as referencesto align the laser beams. These same lines were used for repositioning of the subjects.
SubjectsThe control group consisted of 11 right-handed males who
were tested for absence of neurological or psychiatric abnormalities. The experimental group consisted of 12 right-handed malesubjects who fulfilled DSM-III diagnostic criteria for schizophre
nia. Clinical and demographic characteristics of the subjects havebeen described elsewhere (36).
Image AnalysisThe images were reconstructed following a standard procedure
(37). However, in order to make the Fourier coefficients insen
sitive to head size and head positioning within the PET camera,the following additional operations were performed on the PETimages:
1. Automatic centering of the TDFT reference system on thecentroidal and principal axis of the brain (23-25).
2. Rescaling the head size at each slice level by linear interpolation to that of Schaltenbrand's anatomic atlas (JO).
3. Receding of the image from the spatial domain to thespatial frequency domain by the TDFT.
The following statistical procedures were applied to the Fouriercoefficients:
1. To determine if the differences in the Fourier coefficientscharacterizing the brain images of the control baseline andpatient baseline groups are statistically significant, a oneway MANOVA was performed on the four TDFT coefficients of the two groups using procedure 4V from BMDPStatistical Software (38). The significance level, p, wastabulated for each of the 14 brain levels. Since 14 statisticaltests were done, (one for each of the 14 brain slices), thenaccording to Bonferroni's inequality the level that p must
reach to attain statistical significance is reduced to 0.05/14= 0.0035.
2. To determine if the differences in the Fourier coefficientscharacterizing the brain images of the two groups, controltask and patient task, are statistically significant, the sameprocedure as described above in item 1 was performed onthese groups.
3. Fourteen two-group linear discriminant analyses were per
formed using the procedure DISCRIM from the SAS Institute (39), 1 for each of the 14 slices using four variables.The two groups were: control baseline versus schizophreniabaseline. The percentile of the images correctly classified aseither control baseline or patient baseline were tabulated.This statistical procedure was done again using the controltask versus schizophrenia task groups. Also, in order to givean idea of the separation between the two groups, thegeneralized Mahalanobis distance was computed by theDISCRIM procedure (39) for each brain level.
4. To determine if a single individual, could be correctlyclassified by the four TDFT coefficients as either controlbaseline or patient baseline, 1 subject was removed from itsgroup and 14 2-group linear discriminant analyses were
performed (39), 1 for each of the 14 brain slices. Since thereare 23 subjects at baseline, a total of 23 x 14 = 322 two-
group discriminant analyses were performed. Once thediscriminant function coefficients have been computed, thesubject that was left out of the computations is classified ineither group. The percentile of true classifications achievedby each brain level was tabulated as a "Jackknife trueclassification rate" (40,41).
5. To determine if a single individual could be correctly classified by the four TDFT coefficients as either control taskor patient task, one subject was removed from its groupand a similar procedure as described in item 4 above wasperformed. The percentile of true classifications achievedby each brain level was tabulated as a "Jackknife trueclassification rate."
290 The Journal of Nuclear Medicine •Vol. 33 •No. 2 •February 1992
RESULTS
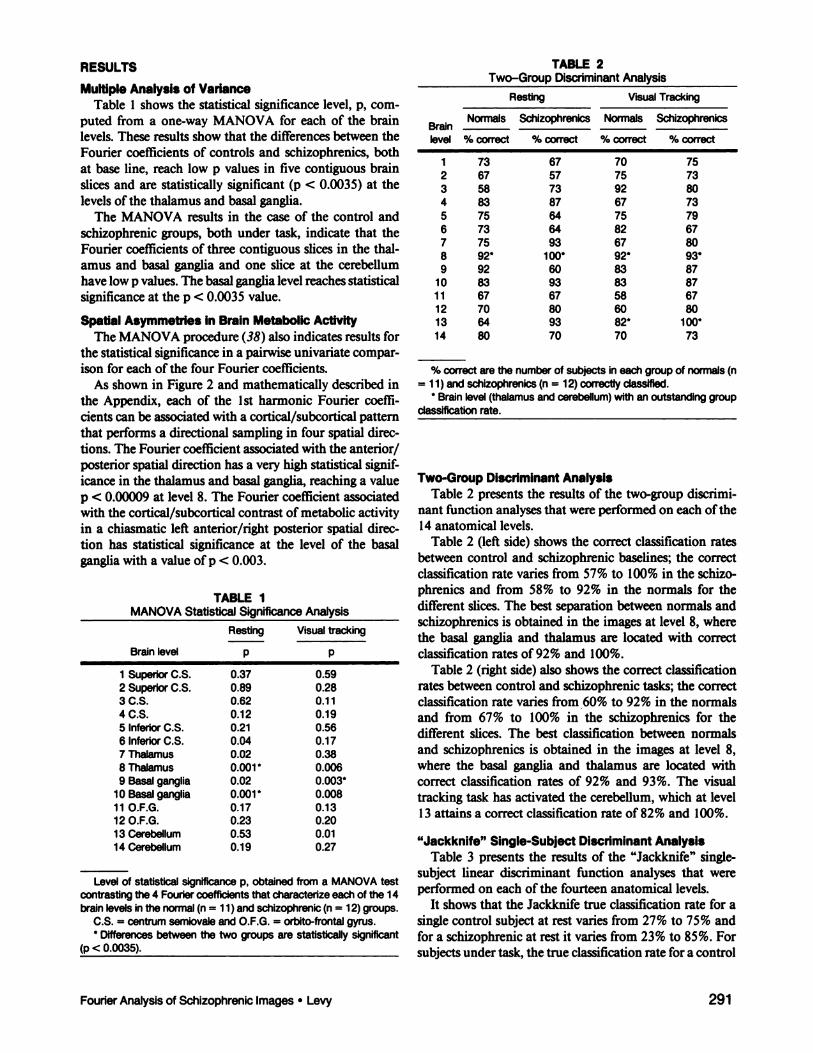
Multiple Analysis of VarianceTable 1 shows the statistical significance level, p, com
puted from a one-way MANOVA for each of the brainlevels. These results show that the differences between theFourier coefficients of controls and schizophrenics, bothat base line, reach low p values in five contiguous brainslices and are statistically significant (p < 0.0035) at thelevels of the thalamus and basal ganglia.
The MANOVA results in the case of the control andschizophrenic groups, both under task, indicate that theFourier coefficients of three contiguous slices in the thalamus and basal ganglia and one slice at the cerebellumhave low p values. The basal ganglia level reaches statisticalsignificance at the p < 0.0035 value.
Spatial Asymmetries in Brain Metabolic ActivityThe MANOVA procedure (38) also indicates results for
the statistical significance in a pairwise univariate comparison for each of the four Fourier coefficients.
As shown in Figure 2 and mathematically described inthe Appendix, each of the 1st harmonic Fourier coefficients can be associated with a cortical/subcortical patternthat performs a directional sampling in four spatial directions. The Fourier coefficient associated with the anterior/posterior spatial direction has a very high statistical significance in the thalamus and basal ganglia, reaching a valuep < 0.00009 at level 8. The Fourier coefficient associatedwith the cortical/subcortical contrast of metabolic activityin a chiasmatic left anterior/right posterior spatial direction has statistical significance at the level of the basalganglia with a value of p < 0.003.
TABLE 1MANOVA Statistical Significance Analysis
TABLE 2Two-Group Discriminant Analysis
Resting Visual Tracking
Brainlevel1
SuperiorO.S.2SuperiorC.S.3C.S.4
C.S.5InferiorC.S.6InferiorC.S.7
Thalamus8Thalamus9
Basalganglia10 Basalganglia11
O.F.G.12O.F.G.13
Cerebellum14 CerebellumRestingP0.370.890.620.120.210.040.020.001*0.020.001*0.170.230.530.19Visual
trackingP0.590.280.110.190.560.170.380.0060.003*0.0080.130.200.010.27
Level of statistical significance p, obtained from a MANOVA testcontrasting the 4 Fourier coefficients that characterize each of the 14brain levels in the normal (n = 11) and schizophrenic (n = 12) groups.
C.S. = centrum semiovale and O.F.G. = orbito-frontal gyrus.* Differencesbetweenthe two groupsare statisticallysignificant
(p< 0.0035).
Brainlevel1234567891011121314Normals%correct7367588375737592*928367706480Schizophrenics%correct67577387646493100*609367809370Normals%correct7075926775826792*8383586082*70Schizophrenics%correct7573807379678093«87876780100*73
% correct are the number of subjects in each group of normals (n= 11) and schizophrenics (n = 12) correctly classified.
* Brain level (thalamus and cerebellum) with an outstanding group
classification rate.
Two-Group Discriminant AnalysisTable 2 presents the results of the two-group discrimi
nant function analyses that were performed on each of the14 anatomical levels.
Table 2 (left side) shows the correct classification ratesbetween control and schizophrenic baselines; the correctclassification rate varies from 57% to 100% in the schizophrenics and from 58% to 92% in the normals for thedifferent slices. The best separation between normals andschizophrenics is obtained in the images at level 8, wherethe basal ganglia and thalamus are located with correctclassification rates of 92% and 100%.
Table 2 (right side) also shows the correct classificationrates between control and schizophrenic tasks; the correctclassification rate varies from 60% to 92% in the normalsand from 67% to 100% in the schizophrenics for thedifferent slices. The best classification between normalsand schizophrenics is obtained in the images at level 8,where the basal ganglia and thalamus are located withcorrect classification rates of 92% and 93%. The visualtracking task has activated the cerebellum, which at level13 attains a correct classification rate of 82% and 100%.
"Jackknife" Single-Subject Discriminant AnalysisTable 3 presents the results of the "Jackknife" single-
subject linear discriminant function analyses that wereperformed on each of the fourteen anatomical levels.
It shows that the Jackknife true classification rate for asingle control subject at rest varies from 27% to 75% andfor a schizophrenic at rest it varies from 23% to 85%. Forsubjects under task, the true classification rate for a control
Fourier Analysis of Schizophrenic Images •Levy 291

TABLE 3Single Subject Discriminant Analysis ("Jackknife")
Resting Visual Tracking
BrainLevel1234567891011121314Normals%correct4527456658545075*666650605854Schizophrenics%correct5023718557617185"717157647141Normals%correct4464645454506491"8291544482'70Schizophrenics%correct3357646454575784*6471646492*60
% correct is the number of times an individual subject removedfrom the group of normals (n = 11) or schizophrenics (n = 12) was
classified correctly.* Brain level (thalamus and cerebellum) with an outstanding subject
classification rate.
subject ranges from 44% to 91%, and for a schizophrenicsubject, it varies from 33% to 92%.
The best classification under resting conditions betweennormals and schizophrenics is obtained in the images atlevel 8, where the basal ganglia are located with correctclassification rates of 75% and 85%. Under the visualtracking task, the best classification is obtained at twolevels. Level 8 containing the basal ganglia has correctclassification rates of 91% and 84% and level 13 whichnow has an activated cerebellum that attains correct classification rates of 82% and 92%.
It is important to point out that according to Gray andSchucany and James (40,41) these classification rate results are non-parametric measures of the separability oftwo groups in feature space, since the Jackknife methoddoes not require normality or any other statistical conditions on the feature variables.
Mahalanobis DistanceTo geometrically illustrate the relative distance in fea
ture space between the normal and schizophrenic groups,the generalized Mahalanobis distance was also computedby the procedure DISCRIM (39).
This procedure computes the "generalized distance"
(Mahalanobis distance), between two groups using as"units of distance" a unit related to the spread of eachgroup, i.e., the group's covariance matrix. Let the feature
variables (in this study, the four normalized TDFT coefficients) in group 1 have a mean X,, let group 2 have amean X2, and denote the covariance matrix by [£].
The formula (D,.2)2= (X, - X2)'[2;]"'(X1 - X2) is used
by the procedure DISCRIM, yielding a "generalized distance" proportional to the distance between the meansand inversely proportional to the group's spread abouttheir means. Here (Xi - X2) denotes a four-dimensionalvector, ( )' denotes its transpose, and []"' denotes the
inverse of the matrix.As shown in Figure 4A, for resting conditions the Ma
halanobis distance increases from low values at the topand bottom of the brain, levels 1 and 14, at its maximumvalue for level 8, which contains the lower thalamus andupper basal ganglia. As shown in Figure 4B, for the groupsunder the visual tracking task, the cerebellum at level 13is activated in such a way that its Mahalanobis distancebecomes as large as that of the lower thalamus and thebasal ganglia at levels 8, 9, and 10.
It is important to point out that according to James (41 )these Mahalanobis distance results are a non-parametricmeasure of the separability of two groups in feature space,since this generalized distance (Di.2)does not require normality or any other statistical conditions on the featurevariables.
DISCUSSION
Quantitative image analysis aims to obtain a set ofnumbers that reflect in a parsimonious manner someimportant properties of the structure being studied. Usually, these numbers reflect lengths, areas, volumes or averages across sets of pixels within an anatomical ROI. The
FIGURE 4. Mahalanobis distance between the normaland schizophrenicgroups in featurespace, computedwith the four normalized first harmonicFourier coefficients:(A) both groups atrest and (B) bothgroups under a visual tracking task.Level 1 is at the topof the brain. Thebrain levels showingthe largest group differences are (A) brainlevels 8 and 10 containing the lower thalamus and basal ganglia and (B) brain levels 8, 9, and 10containing the thalamus and basal ganglia, plus the cerebellum at level 13 whichhas become activated by the visualtracking task.
luiBrain Level
a)
Brain Level
b)
292 The Journal of Nuclear Medicine •Vol. 33 •No. 2 •February 1992

TDFT can be seen as an alternative and complementarymethod for the automatic analysis of PET images, wherethe ROI is the entire image, and periodic structures andsymmetry patterns are quantified. By applying TDFT, theinformation from the metabolic image can be representedas a set of Fourier coefficients (29).
It is well known that the Fourier coefficients of an imageare sensitive to translations and rotations of the image. Toavoid this sensitivity to the positioning of the subject's
head within the PET camera, we abandon the PET cameracoordinate axis and define the PET brain image in termsof the brain's centroidal principal axis (23-25), which is
unique to each brain and insensitive to head positioningvariations. To avoid the sensitivity of the Fourier coefficients to the size of the PET brain images, they are scaledto a unique brain size (23,25) given by a stereotacticalanatomical atlas (30).
The good clinical group discrimination obtained withthe first harmonic of this analytical technique documentsits capacity to represent salient gross features of metabolicbrain images adequately. It also shows that the analyses ofglobal geometrical characteristics of an image, as opposedto its anatomical partitions, is of value in the detection offunctional patterns that can distinguish control from psychiatric groups. Furthermore, this procedure can obtainthe normal/schizophrenic classification of individual subjects from PET images in a highly significant fashion,without subjective decisions about which anatomical ROIare selected for the classification.
The results derived from the analysis of the globalproperties of the metabolic activity showed several characteristics that merit further interpretation. One is thewidespread nature of the discriminating power of theFourier variables in differentiating normal subjects frompsychiatric patients. This was shown by the good discrimination obtained across several anatomical levels whileusing only the global spatial coverage of the first harmonic.The anatomical level where the differences were mostmarked was at the level of the basal ganglia. This is anarea rich in dopamine receptors and has been implicatedin the pathophysiology of mental illness (42).
The physiological/anatomical representation of the normalized Fourier coefficients for the first harmonic as usedin this method is a contrast function between the cortical/subcortical metabolic activity along four directions: front/back, left/right and two chiasmatic (left anterior/rightposterior and right anterior/left posterior). Previous studiesusing the ROI approach have also documented abnormalfrontal activity in schizophrenic subjects using PET tomeasure glucose metabolism and using '"Xe to measure
cerebral blood flow (4,14,43). The replication of this finding across different techniques and groups of patientssuggests that the association between anterior/posteriorand cortical/subcortical brain areas represents a basic interaction pattern of brain activity.
The Fourier analysis also shows a chiasmatic (left-ante
rior/right-posterior) interaction that distinguishes normalsubjects from schizophrenic patients. This axis has beenrelated to psychopathology in anatomical studies doneboth in schizophrenia and in autism (45,46).
The activation of the cerebellum under the visual tracking task was an unexpected result that merits furtheranalysis. The preliminary results of this additional studyusing the traditional ROI approach is underway; preliminary results can be found in the Volkow et al. study (47).
In interpreting these results, one has to exclude theeffects of neuroleptics in brain glucose metabolism, sincethe schizophrenic patients studied here have all been underseveral years of treatment. Longitudinal prospective studies are needed in order to address this issue, and we cannotconclude that these observations are not due in part to theeffects that neuroleptics might have on brain organization.
Like other FOI methods, the analysis of the spatialfrequency pattern avoids the use of predefined anatomicalregions, eliminates the subjective drawing of anatomicalboundaries and avoids averaging metabolic rates withinan anatomical region. It has the advantage of reflectingglobal geometrical properties of each image with just a fewnumbers. This strategy also allows itself to three-dimensional Fourier analyses of PET metabolic images, thusproviding a method for investigating functional activity ofthe brain as a whole.
On the other hand, direct anatomical interpretation ofthe spatial patterns obtained by the present method is notpossible. Two FOI methods that have the capability toidentify automatically anatomical ROIs a posteriori canbe found in references (18-22) and (24,25).
In general, it is important to note the complementaryvalue of FOI methods to ROI methods: once a FOI methodhas determined the spatial location of the significant brainpatterns, a simpler practical computer implementationmight be possible by taking advantage of this spatial information using the detected significant ROIs in a traditionalROI strategy that might be already available to the user.
In particular, one can implement the present method ina simpler way, thus achieving a reduction in computationtime while avoiding the effort involved in drawing theROIs: since only the 0 and 1st harmonic coefficients areneeded by the method, the complete TDFT is not reallyrequired and as indicated by Dahlquist and Acton (48,49)these few coefficients can be obtained by simple summation formulas. This brings the computing effort to a levelsimilar to that of computing the weighted sum of metabolicactivity in one subcortical and four cortical areas, or tothe level of computing the brain's metabolic centroid (23)
which takes 0.3 sec on a main frame computer and a fewseconds on a smaller PC.
CONCLUSION
In conclusion, the data reported here indicate the utilityof the first spatial frequency of PET metabolic images asshown by its ability to discriminate adequately individual
Fourier Analysis of Schizophrenic Images •Levy 293

subjects across normals and schizophrenics. This, plus thesignificant discrimination observed between the clinicalgroups at the thalamus, basal ganglia, and cerebellum usingonly the large spatial brain pattern associated with the firstspatial frequency harmonic, point to the widespread natureof the differences between normals and schizophrenics andgive evidence for the nonlocalized nature of abnormalitiesin brain glucose metabolism of chronic medicated schizophrenic patients.
In a broader perspective, the unexpected emergence ofa functionally different cerebellum in the schizophrenicgroup when performing a visual tracking task points to asuccessful general strategy for exploring the differencesbetween normal and mentally ill brains; by imposing atask that stresses the system, the weakest link is extractedfrom a highly complex mechanism.
APPENDIX
TDFT can be used to represent an image F(x, y) containedinside a rectangle of dimensions —p/2< x < p/2 and —q/2 < y< q/2 as a sum of cosine functions. If only the zero and firstspatial frequency are used to approximately represent the imageF(x, y) as F'(x, y), then the image is given in terms of the
magnitude C¡.kand phase angle 0j.kof the cosine functions by thefollowing expression
F'(x, y) = Co.o
+ 2C,.o cos(2irUx + 0,,o) + 2Co.i cos(2irVy + 00,i) +
2CU 2irVy + e,,,)
2C,,-,cos(27rUx - 0,,-,)
where U = l/p and V = 1/q.The directional characteristic of each term of this equation is
graphically illustrated in the left hand column of Figure 2, by thespatial patterns of cos(x), cos(y), cos(x + y), and cos(x —y). These
functions attain positive values (0, 1) in the central areas of thebrain and mostly negative values (0, -1) at the brain's edge.
In the present method, we shall use the four TDFT normalizedFourier coefficients C,.0/Co.o,Co.i/Co.o,Ci.i/Co.o and Ci,_i/Co.o,which contrast the brain's central areas to its edge areas in the
four directions left/right, front/back, right frontal/left back andleft frontal/right back, respectively. By taking as a reference C0,o,which is the value of the total metabolic activity in the brainslice, the relative importance of each directional pattern is enhanced.
ACKNOWLEDGMENTS
The authors wish to thank J. Fowler, K. Karlstrom, and A.Farrell for preparation of the labeled deoxyglucose; D. Christmanfor data acquisition; J. Casillas and E. Gutierrez for data processing; L. Martinez-Negrete, M. Hernandez, M. Meisner, and H. B.Kushner for mathematical and statistical consultation; and P.van Gelder for performing the visual stimulation/motor activation task.
This work was supported in part by NIMH grant MH44832,the U.S. Department of Energy under contract no. DE-AO02-76CH00016, U.S. NIH grant NS 15638 from the NINCDS, theNathan S. Kline Institute for Psychiatric Research, the Mexican
Institute of Psychiatry, and the Scientific Center of I.B.M. inMexico City. A preliminary report of this work was presented atthe 37th Annual Meeting of Society of Nuclear Medicine, Washington DC, June 19-22, 1990.
REFERENCES
1. Phelps ME, Huang SC, Hoffman EJ, Selin C, Sokoloff L, KühlDE.Tomographie measurement of local cerebral glucose metabolic rate inhumans with ['8F]2-fluoro-2-deoxy-D-glucose. Validation of method. Ann
Mwo/1979;6:371-388.2. Buchsbaum MS, Wu JC, DeLisi LE, et al. Positron emission tomography
studies of basal ganglia and somatosensory cortex neuroleptic drug effects:differences between normal controls and schizophrenic patients. Biol Psychiatry 1987;22:479-494.
3. Mazziotta JC, Phelps ME, Carson RE, KühlDE. Tomography mapping ofhuman cerebral metabolism: auditory stimulation. Neurology1982;32:921-937.
4. Buchsbaum MS, Ingvar DH, Kessler R, et al. Cerebral glucography withpositron tomography. Arch Gen Psych 1982;39:251-259.
5. Patrañas NJ, DiChiro G, Brooks RA, et al. Work in progress: [18F]
fluorodeoxyglucose and positron emission tomography in the evaluationof radiation necrosis of the brain. Radiology 1982:144:885-889.
6. Duara R, Grady C, Haxby J, Sundaram M, et al. Positron emissiontomography in Alzheimer's disease. Neurology 1986;36:879-887.
7. Greenberg JH, Reivich M, Alan A, et al. Metabolic mapping of functionalactivity in human subjects with the ['8F]fluorodeoxyglucose technique.Science \981;212:678-680.
8. Haxby JV, Duara R, Grady CL, Cutler NR, Rapaport SI. Relations betweenneuropsychological and cerebral metabolic asymmetries in early Alzheimer's disease. J Cereb Blood Flow Metab 1985;5:193-200.
9. Young AB, Penney JB, Starosta-Rubinstein S, et al. PET scan investigationsof Huntington's disease: cerebral metabolic correlates of neurological fea
tures and functional decline. Ann Neural 1986;20:296-303.10. Clark CM, Kessler R, Buchsbaum MS, Margolin RA, Holcomb HH.
Correlational methods for determining regional coupling of cerebral glucosemetabolism: a pilot study. Biol Psych 1984;19:663-678.
11. Horwitz B, Duara R, Rapaport SI. Age differences in intercorrelationsbetween regional cerebral metabolic rates for glucose. Ann Neural1986;19:60-67.
12. Metter EJ, Reige WH, KühlDE, Phelps ME. Cerebral metabolic relationships for selected brain regions in healthy adults. J Cereb Blood Flow Metab1984;4:1_7.
13. Metter EJ, Reige WH, Kamayema M, KühlDE, Phelps ME. Cerebralmetabolic relationships for selected brain regions in Alzheimer's, Hunting-ton's, and Parkinson's disease. J Cereb Blood Flow Metab 1984;4:500-506.
14. Volkow ND, Brodie JD, Wolf AP, et al. Brain organization in schizophrenia. J Cereb Blood Flow Metab 1986;6:441 -446.
15. MoellerJR, StrotherSC, SidtisJJ, Rottenberg DA. Scaled subprofile model:a statistical approach to the analysis of functional patterns in positronemission tomographic data. J Cereb Blood Flow Metab 1987;7:649-658.
16. Volkow ND, Brodie JD, Wolf AP, Angrist B, RüsselJAG, Cancro R. Brainmetabolism in schizophrenics before and after acute neuroleptic administration. J Neural Neurosurg Psychiatry 1986;49:1199-1202.
17. Sheider JS. Basal ganglia role in behavior. Importance of sensory gatingand its relevance to psychiatry. Biol Psych 1984;29:1693-1710.
18. Fox PT, Perlmutter JS, Raichle ME. A stereotactic method of anatomicallocalization for positron emission tomography. J Camp Assist Tomogr1985;9:141-153.
19. Fox PT, Mintum MA, Raichle ME, Miezin FM, Allman JM, Van EssenDC. Mapping of human visual cortex with positron emission tomography.Nature 1986:332:806-809.
20. Fox PT, Mintum MA, Reiman EM, Raichle ME. Enhanced detection offocal brain responses using intersubject averaging and change distributionanalysis of substracted PET images. J Cereb Blood Flow Metab 1988;8:642-
653.21. Mintum MA, Fox PT, Raichle ME. A highly accurate method of localizing
regions of neuronal activation in the human brain with positron emissiontomography. J Cereb Blood Flow Metab I989;9:96-103.
22. Fox PT, Miezin FM, Allman JM, Van Essen DC, Raichle ME. Retinotopicorganization of human visual cortex mapped with positron emission tomography. J Neurosa 1987;7:913-922.
23. Levy AV, Brodie JD, RüsselJAG, Volkow ND, Laska E, Wolf AP. The
294 The Journal of Nuclear Medicine •Vol. 33 •No. 2 •February 1992

metabolic centroid method for PET brain image analysis. J Cereb BloodFlowMelab 1989;9:388-397.
24. Levy AV, Volkow ND, Brodie JD, Bertollo DN, Wolf AP. The spectralanalysis of brain glucose metabolism. Proc. I2lh Int. Conf. IEEE inMedicine and Biotogv Society, Philadelphia, PA, Nov 1-4. 1990;12:1299-
1302.25. Levy AV, Laska E, Brodie JD, Volkow ND, Wolf AP. The spectral signature
method for the analysis of PET brain images. J Cereb Blood Flava Melab1991;11:A103-A1I3.
26. Tallman OH. The classification of visual images by spatial filtering (dissertation). Air Force Institute of Technology, School of Engineering. June1969.
27. Granlund G. Recognition of letters with Fourier methods. IEEE Computing Group Repository Paper 1970;R-70-98.
28. Andrews HC. Multidimensional rotations in feature selection. IEEE TransComputers 1971;20:1045-1051.
29. Brigham EO. The fast Fourier transform. Englewood Cliffs, NJ: PrenticeHall, 1974.
30. Schaltenbrand G, Wharen W. Atlas for stereotaxy of the human brain.Chicago: Year Book Publishers; 1977: Plates 7, 11.
31. Schwartz EL. Anatomical and physiological correlates of visual computation from striate to infero-temporal cortex. IEEE Trans Systems ManCybern 1984;14:257-271.
32. Sokoloff L, Reivich M, Kennedy C. The ("FJfluorodeoxyglucose method
for the measurement of local cerebral glucose utilization: theory, procedureand normal values in the conscious and anesthetized albino rat. J Neuro-chem 1977;28:897-916.
33. LivanovMN. Spatial organizationof cerebralprocesses.New York, NY:Wiley;1977.
34. Luria AR. The working brain. Translated by Haigh B. New York, NY:Baru Books; 1961.
35. Volkow ND, Tancredi LR. Biological correlates of mental activity studied
with PET. Am J Psych 1991;4:439-443.36. Volkow N, Van Gelder P, Wolf AP, et al. Phenomenological correlates of
metabolic activity in chronic schizophrenics. Am J Psych 1987;144:151-
158.37. Reivich M, Alavi A, Wolf A, et al. Glucose metabolic rate kinetic model
parameter determination in man. The lumped constants and rate constantsfor "F-fluorodeoxyglucose and "C-deoxyglucose. J Cereb Blood FlowA/rtfl*1985;5:l79-192.
38. BMDP Statistical Software Inc. Los Angeles, CA 90025.39. SAS Institute Inc., Box 8000, Cary, NC 27512-8000, USA.40. Gray HL, Schucany WR. The generalized Jackknife statistic. New York,
NY: Marcel Dekker Inc. 1972:120-125.41. James M. Classification algorithms. New York, NY: John Wiley & Sons.
1985:56-57.42. Lidsky TI, Weinhold PM, Levine FM. Implications of basal ganglionic
dysfunction for schizophrenia. Biol Psych 1979;14:3-12.43. Farkas T, Wolf AP, Jaeger J, et al. Regional brain glucose metabolism in
chronic schizophrenia. Arch Gen Psych 1984;41:293-300.44. Ingvar DH, Franzen G. Distribution of cerebral activity in chronic schizo
phrenics. Lancet 1974;2:1484-1486.45. Hier DB, LeMay M, Rosenberger PB. Autism: association with reversed
cerebral symmetry. Neural 1978;28:348-349.46. Luchine DJ, Weinberger SR, Wyatt RJ. Schizophrenia: evidence of a
subgroup with reversed cerebral symmetry. Arch Gen Psych 1979;36:1309-
1311.47. Volkow ND, et al. Decreased cerebellar metabolism in chronic medicated
schizophrenics. Internal Report, Medical Department, Brookhaven National Laboratory, 1991.
48. Dahlquist G, Bjorck A. Numerical methods. Englewood Cliffs, NJ: PrenticeHall, 1974:405-412.
49. Acton FS. Numerical methods thai work. New York: Harper and Row,1970:228-233.
Fourier Analysis of Schizophrenic Images •Levy 295


![Molecular Imaging of Murine Intestinal Inflammation With 2-Deoxy-2-[ 18F]Fluoro- d-Glucose and Positron Emission Tomography](https://static.fdokumen.com/doc/165x107/6344fff26cfb3d4064097a1a/molecular-imaging-of-murine-intestinal-inflammation-with-2-deoxy-2-18ffluoro-.jpg)