Sonographic Evaluation of Amniotic Fluid Volume In Diabetic ...
108
The National Ribat University Faculty of Graduate Studies and Scientific Research Sonographic Evaluation of Amniotic Fluid Volume In Diabetic Pregnant women During 2 nd & 3 rd Trimesters In Khartoum State. A thesis submitted for partial fulfillment for the degree of master (M.Sc.) in medical diagnostic ultrasound. By: Faisal Abdelaziz Fadul Awad Supervisor:Dr. Elsir Ali Saeed (PhD Medical Diagnostic Ultrasound) March 2015
-
Upload
khangminh22 -
Category
Documents
-
view
0 -
download
0
Transcript of Sonographic Evaluation of Amniotic Fluid Volume In Diabetic ...
The National Ribat University
Faculty of Graduate Studies and Scientific Research
Sonographic Evaluation of Amniotic Fluid Volume In Diabetic
Pregnant women During 2nd
& 3rd
Trimesters In
Khartoum State.
A thesis submitted for partial fulfillment for the degree of master (M.Sc.) in medical
diagnostic ultrasound.
By: Faisal Abdelaziz Fadul Awad
Supervisor:Dr. Elsir Ali Saeed
(PhD Medical Diagnostic Ultrasound)
March 2015


اآليـة
لبي هللا رؼب :
} مزآ ثب ل رؼد حك ه ا ا فزؼبى هللاه أ لج
ب رة سد ػ ل ح ه {مضى إؼظـــــص ــــــــــ ذق هللاه ا
{ 111طرح ط ، اخ }

Dedication I dedicated this work to:
My Parents.
My Brothers and sisters.
My Teachers.
My Colleagues and friends.
ACKNOWLEDGEMENT

First and above all, thanks and praises to Allah, the almighty for
providing me this opportunity and granting me the capability to
proceed successfully, and the prayers and peace be upon the
merciful prophet Mohamed.
I want to express my sincere thanks and deep graduate to my
faithful supervisor Dr. Elsir Ali Saeed for his guidance
throughout this thesis and sharing his knowledge through the
entire study.
I would also like to pass my special thanks to my friends and
colleagues whom help me.
ملخص البحث

ف اظبء احا ثبد اذي حظاظبئ حد رم أخزذ ثغزض ذ دراطخ رح صفخ
رأثز زض اظىز ػ حد اظبئ ال رأثز ؼزف ثذاء اظىزي ف لخ اخزط اصبثبد
ػ اد.
اصبثبد ثذاء خبد فق اصرخ ظبء احااؼب ف ػ ا اطزخذذ ذ اذراطخ اجزروي
لذ ر 4115 برص حز 4111دظجز ف افززح خؼب ر اظىزي خالي الطزجببد از
. اإلحصبئ ازح ف SPSSاــ ثزبح ثبطزخذا ازبئح رحاصف خغ اجببد
خذد ثذاء اظىزي اح صبثخ خاثبث خاثب فززححب ف ا شذ ذ اذراطخ ئخ ازأح
ظزشفبد % حد اؼخ، ر خغ اجببد 51طخ ثظجخ 11-11اغبجخ رززاذ اػبر
اظزشف اظؼدي أ أ درب الد ب ظزشف اخزط لخ ف خزفخ زاوش رشخصخ
طف. وبذ األخشح از خذذ ثبحبج اجب اززو ثبىالوخ ، ظزشف اظزشف درب
طاطىت ص اصغ ، خبس صغ ،اخزذ ثب اخزجبراد اخبد فق اصرخ ذري ص ا
.وري اصغأج
ظجخ ثلبص األرثؼخ خة ، خذد اذراطخ اوجز خت ظبئ ال ذ اذراطخ لبص طزخذذ فا
ظبئ اظبئ ال ف اظبء احا اصبثبد ثذاء اظىزي وبذ اػ اؼذي اطجؼ
اصبثبد ثذاء ا ف اظبء اح اظبئ ال اطجؼ ظجخ ، اؼخ حد % 18 ال
. حد اؼخ %( 54اظىزي وبذ )
% ع اظىزي اؼزذ 14%، رب 51ظ ثظىزي اح ف ع اظىزي ب وبذ اػ ظجخ
اظىزي غز اؼزذ ػ الظ.% ع 15ػ الظ ، وب أل ظجخ
% حد اؼخ ذ حطب )صذي( ف اظبئ احظ ثبد أ 18خذد اذراطخ اضب" ا
% حد اؼخ ذ ػمخ اد ) اد وجز احد(.ض 49 ،% ب خبخ اصذي84
% سبدح اظبئ ال 54ذح زض اظىزي حث خذد بن ػاللخ ث سبدح اظبئ ال
أل طخ )ال ذح(.
اضحذ اذراطخ ثأ داء اظىزي ذ رأثز ػ وخ اظبئ ال ف اظبء احا اصبثبد ثذا
اذاء .
أصذ اذراطخ ثزػبخ خبصخ ظبء احا اصبثبد ثزض اظىز زبثؼز ثصرح درخ
زىزر اضب اصذ ثذراط اؼا الخزي از ثؤثز ف وخ اظبئ ال ثبلضبفخ ذاء اظىزي
رأثز اظىز ف حد اشخ ؼزفخ اؼاللخ ازذاخ ث.
اذراطخ ثزذرت اىادر اطجخ حث ػ لبص اظبئ ال ػذ اب زشخص وب اصذ
اجىز رفبدي الثبر ابرد ػ اشبد ا امصب اغز طجؼ ػالخب جىزا، وب اصذ ثزفز اخشح
اجىز زغزاد اغز ازشخص ثبخبد افق صرخ ف خغ اظزشفبد ازاوش اصحخ الوزشبف
طجؼخ ف اظبئ ال.
Abstract

This analytical and descriptive study was conducted in order to assess the
amniotic fluid in diabetic pregnant women in the Khartoum state to see the effect
of diabetes on the amniotic fluid volume and its effect on the fetus.
This study used the Universal Protocol in the work of ultrasound for pregnant
diabetic women through questionnaires that were collected in the period from
December 2014 until March 2015 has been disaggregated data collection and
analysis of the results using the SPSS program in statistical analysis.
This study included 100 diabetic pregnant women in the second and third
trimesters of pregnancy and found the majority between the ages of 31-40 years by
54% of the sample size, data were collected from hospitals and different diagnostic
centers in the Khartoum state, including Omdurman Maternity Hospital , Saudi
hospital Omdurman , Turkish hospital , and Alban jaded hospital. The equipments
by which ultrasound exams was done: Mindray Chinese-made, and Sonoscape
Chinese-made ،ALPINON (E-CUBE) Korean-made device.
This study measuring the amniotic fluid volume by using Single Deepest Pocket
(SDP) and AFI (4 Pockets), the study found abnormally increase in amniotic fluid
volume (AFV) polyhydramnios represent (48%) of sample size, and normal
amniotic fluid volume (AFV) represent (52%) of sample size.
The highest rate of diabetes from type called gestational diabetes 53%, followed
by 32% of the insulin-dependent type, and was less than 15% of diabetes type non-
insulin-dependent.
The study also found that "18% of the sample size have debris (echo) in the fluid
surrounding the fetus and that 82% of them are free from echo, and 29% of the
sample size have macrosomic fetus (large fetus size) .
The study recommended special care for diabetic pregnant women followed
periodically Frequently also recommended studying other factors that effect in the

amount of amniotic fluid as well as diabetes and the effect of diabetes in the size
of the placenta and see them overlapping relationships.
The study also recommended the training of medical staff and urged them to
measure amniotic fluid volume for early diagnosis to any abnormality
(polyhydrmnios or oligohydrmnios) that may affect either the fetus or the pregnant
diabetic women and to treat it early.
It is recommended to facilitate ultrasound machine in every hospital and medical
health centers.
List of Contents

NO subject Page No
I اــــخ
Dedication II
Acknowledgement III
IV خص اجحث
Abstract VI
List of contents VIII
List of tables XI
List of figures XIII
List of Abbreviation XV
Chapter one
1.1 Introduction 1
1.2 Objectives 3
1.2.1 General objectives 3
1.2.2 Specific objectives 3
1.3 Study problem 3
1.4 The importance of the study 4
Chapter two – Literature Review
2.1 Anatomy 5
2.1.1 The amnion 5
2.1.2 Amniotic fluid 7
2.1.2.1 Development of amniotic fluid 6
2.1.2.2 Components of amniotic fluid 8
2.2 Physiology 9
2.2.1 Functions of amniotic fluid 9
2.2.2 Production and absorption 10
2.2.3 Production of amniotic fluid 10
2.2.4 Fetal urine production 10
Topic Page No

2.2.5 Source and regulation amniotic fluid volume 11
2.2.6 Fetal circulation 12
2.3 Assessment of amniotic fluid volume 13
2.4 Consistency of Amniotic Fluid 15
2.5 Pathology 17
2.5.1 Polyhydramnios (hydramnios) 17
2.5.1.1 Polyhydramnios Classification 17
2.5.1.2 Causes of polyhydramnios 18
2.5.1.3 Complications of polyhydramnios 19
2.5.1.4 Symptoms of Polyhydramnios 20
2.5.1.5 Polyhydramnios Diagnostic Criteria 21
2.5.1.6 Amniocentesis 21
2.5.1.7 Treatment of polyhydramnios 22
2.5.2 Oligohydramnios(Anhydramnios) 22
2.5.2.1 Causes of Oligohydramnios: 23
2.5.3 Diabetes Mellitus 26
2.5.3.1 Types of diabetes mellitus 26
2.5.3.2 Risks of Diabetes On Pregnancy 27
2.5.4 Gestational diabetes 28
2.5.4.1 Causes OF Gestational Diabetes in Pregnancy 29
2.6 Previous studies 30
Chapter three - methodology
Methods 34
Sonographic technique 36
Ethical consideration 38
…………………….………………….…………………األخ
Dedication………………….………………….……………
i
ii
NO Subject Page No
Acknowledgement………………………………………… iii

Chapter four
The results 39
Chapter five
Discussion 61
Conclusion 65
Recommendations 66
References 67
Appendix
Ultrasound images of amniotic fluid
Data master sheet
Data collection sheet
iv ……….…………………………………………خص اجحث
Abstract …………………………………………………… v- vi
List of tables
List of tables………………………..…………………….. vii- viii
No of tables Subjects Page No
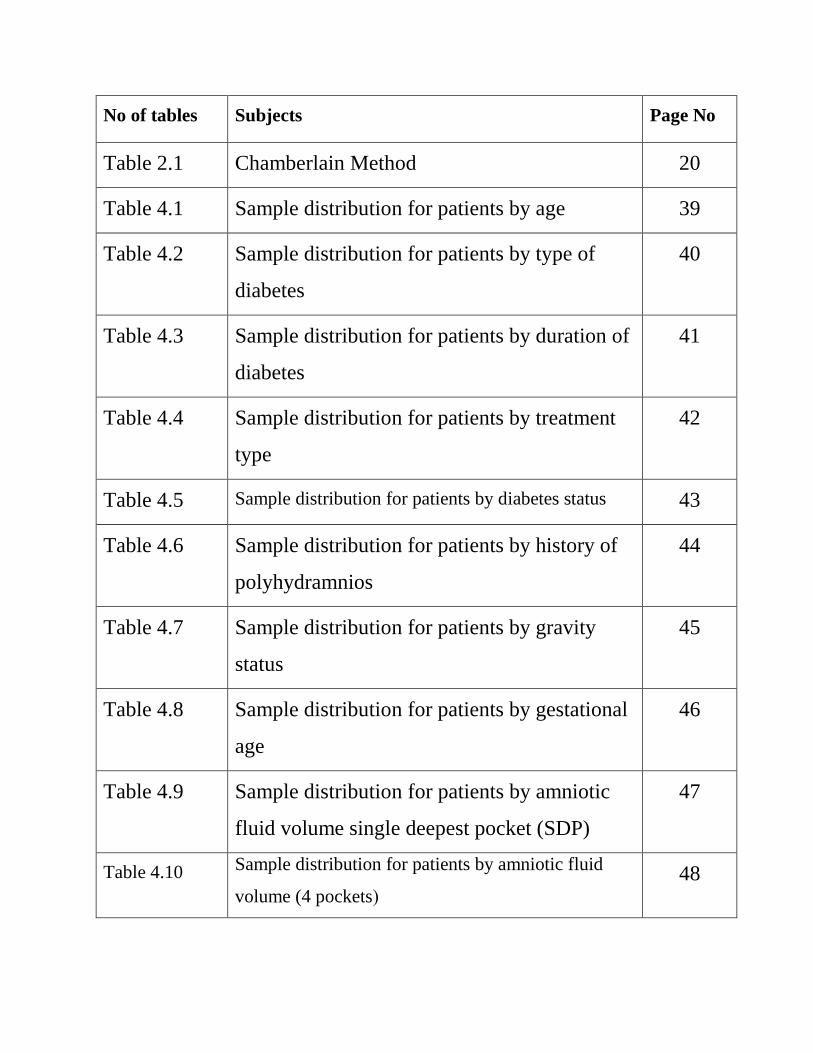
Table 2.1 Chamberlain Method 20
Table 4.1 Sample distribution for patients by age 39
Table 4.2 Sample distribution for patients by type of
diabetes
40
Table 4.3 Sample distribution for patients by duration of
diabetes
41
Table 4.4 Sample distribution for patients by treatment
type
42
Table 4.5 Sample distribution for patients by diabetes status 43
Table 4.6 Sample distribution for patients by history of
polyhydramnios
44
Table 4.7 Sample distribution for patients by gravity
status
45
Table 4.8 Sample distribution for patients by gestational
age
46
Table 4.9 Sample distribution for patients by amniotic
fluid volume single deepest pocket (SDP)
47
Table 4.10 Sample distribution for patients by amniotic fluid
volume (4 pockets(
48

Table 4.11 Sample distribution for patients by consistency of
amniotic fluid
49
Table 4.12 Sample distribution for patients by fetal macrosomia 50
Table 4.13 Sample distribution for patients by fetal anomalies 51
Table 4.14 Diabetes status * Amniotic fluid volume Cross
tabulation
52
Table 4.15 History of polyhydramnios * Amniotic fluid volume
(AFV) Cross tabulation
53
Table 4.16 Type of diabetes * Amniotic fluid volume Cross
tabulation
54
Table 4.17 Amniotic fluid volume (AFV) * Consistency of
amniotic fluid Cross tabulation
55
Table 4.18 Amniotic fluid volume (AFV) * Fetal macrosonia
Cross tabulation
56
Table 4.19 Diabetes status * Fetal macrosomia Cross tabulation 57
Table 4.21 Type of treatment and diabetes status Cross
tabulation
58
Table 4.21 Type of treatment and amniotic fluid volume Cross
tabulation
59
Table 4.24 Means, and Standard deviations for amniotic fluid
volume (4 pockets) and amniotic fluid volume (SDP)
by diabetes status
61
Objectives…………………………...……………………… 4

List of figures
No of figure subject No
Figure 2.1 show embryo within amniotic sac 4
Figure 2.2 embryo within the uterine cavity 5
Figure 2.3 show amniotic membrane 7
Figure 2.4 Single deepest pool (SDP) of amniotic fluid 13
Figure 2.5 polyhydramnios with debris 16
Figure 2.6 Oligohydramnios. 24
Figure 2.7 gestational diabetes 27
Figure 3.1 Single largest pocket 37
Figure 4.1 Sample distribution for patients by age 39
Figure 4.2 Sample distribution for patients by type of diabetes 40
Figure 4.3 Sample distribution for patients by duration of diabetes 41
Figure 4.4 Sample distribution for patients by treatment type 42
Figure 4.5 Sample distribution for patients by diabetes status 43
Figure 4.6 Sample distribution for patients by history of
polyhydraminos
44
Figure 4.7 Sample distribution for patients by gravity status 45
Figure 4.8 Sample distribution for patients by gestational age 46

Figure 4.9 Sample distribution for patients by amniotic fluid
volume single deepest pocket (SDP)
47
Figure 4.10 Sample distribution for patients by amniotic fluid
volume (4 pockets)
48
Figure 4.11 Sample distribution for patients by consistency of
amniotic fluid
49
Figure 4.12 Sample distribution for patients by fetal macrosomia 50
Figure 4.13 Sample distribution for patients by fetal anomalies 51
Figure 4.14 Diabetes status * Amniotic fluid volume tabulation 52
Figure 4.15 History of polyhydramnios * Amniotic fluid volume
Cross tabulation
53
Figure 4.16 Type of diabetes * Amniotic fluid volume Cross
tabulation
54
Figure 4.17 Amniotic fluid volume (AFV) * Consistency of
amniotic fluid Cross tabulation
55
Figure 4.18 Amniotic fluid volume (AFV) * Fetal macrosonia Cross
tabulation
56
Figure 4.19 Diabetes status * Fetal macrosomia Cross tabulation 57
Figure 4.21 Type of treatment and diabetes status Cross tabulation 58
Figure 4.21 Type of treatment and amniotic fluid volume Cross
tabulation
59
List of Abbreviations

AFI Amniotic fluid index
BW Birth Weight
SDP Single deepest pool
AF Amniotic fluid
AFV Amniotic fluid volume
GDM Gestational diabetes mellitus
G.A Gestational age
u/s ultrasound
IUGR Intrauterine growth retardation
PROM Premature rupture of membrane
SROM Spontaneous rupture of membrane
ARM Artificial rupture of membrane
DM Diabetes Mellitus
TAS Trans-abdominal sonography
CNS Central nervous system
IDDM Insulin dependent diabetes mellitus
NIDDM Non-Insulin dependent diabetes mellitus
EDD Estimated delivery date
WHO World health organization

CHAPTER ONE
CHAPTER ONE
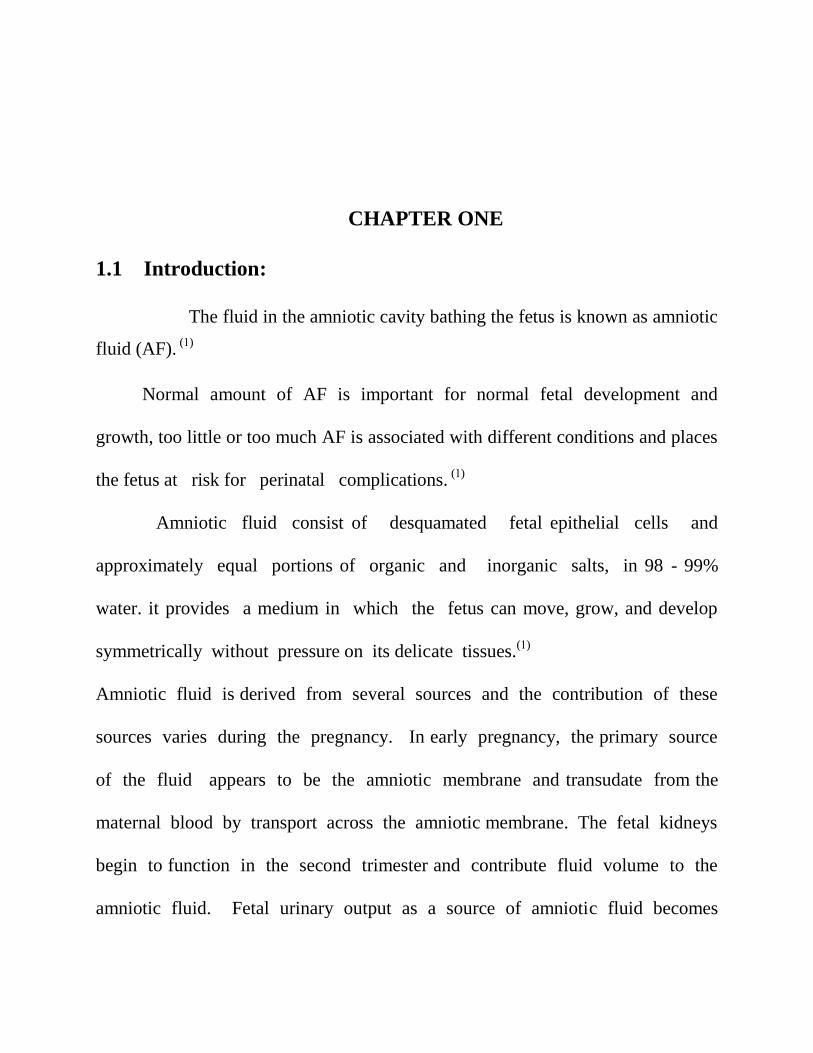
1.1 Introduction:
The fluid in the amniotic cavity bathing the fetus is known as amniotic
fluid (AF). (1)
Normal amount of AF is important for normal fetal development and
growth, too little or too much AF is associated with different conditions and places
the fetus at risk for perinatal complications. (1)
Amniotic fluid consist of desquamated fetal epithelial cells and
approximately equal portions of organic and inorganic salts, in 98 - 99%
water. it provides a medium in which the fetus can move, grow, and develop
symmetrically without pressure on its delicate tissues.(1)
Amniotic fluid is derived from several sources and the contribution of these
sources varies during the pregnancy. In early pregnancy, the primary source
of the fluid appears to be the amniotic membrane and transudate from the
maternal blood by transport across the amniotic membrane. The fetal kidneys
begin to function in the second trimester and contribute fluid volume to the
amniotic fluid. Fetal urinary output as a source of amniotic fluid becomes

increasingly important as pregnancy advances. It is estimated that about 500 ml of
fetal urine is added daily to the amniotic fluid. The fluid is constantly being
formed and reabsorbed with replacement about every 3 hours. Large volumes of
fluid move in both directions between the fetal and maternal circulations. (1)
The amniotic fluid volume increases from approximately 250 ml at 16
weeks to 1000 ml at 34 weeks, declining thereafter to approximately 800 ml at
term. The amniotic fluid volume reflects the status of both the mother and
the fetus and is altered in many physiological and patho –logical conditions.
Ultrasound has a potential role in the management of such conditions, by the
assessment of amniotic fluid volume. (2)
The subjective term used to describe amniotic fluid volume is Virtually
none (oligohydramnios), average (normal), excess (polyhydraminos). (1)
Oligohydramnios is defined as reduced of amniotic fluid volume for a given
gestational age. An amniotic fluid index less than 5 cm, is classified as
oligohydramnios, in early pregnancy is often associated with fetal
malformations. (4)
Polyhydramnios is described as a subjective increase of amniotic fluid volume,
i.e. single pocket with vertical measurement greater than 8 cm, or amniotic
fluid index greater than 20 cm. (5)

About 14% of cases of Polyhydramnios are due to maternal diabetes
mellitus which causes fetal hyperglycemias and resulting polyuria (fetal urine
is a major source of amniotic fluid) and also rh-isoimmunisation can cause it.(1)
1.2 Objectives:-
1.2.1 General objectives:-
To evaluate the amount of amniotic fluid volume and its consistency in diabetic
patient by ultrasound in second and third trimesters in Khartoum state.
1.2.2 Specific objective:-
To estimate and measure the amniotic fluid volume.
To determine the effect of diabetes on amniotic fluid volume.
To evaluate the consistency of amniotic fluid.
To estimate fetal weight (EFW).
To correlate between the amniotic fluid volume and EFW.
To correlate between the amniotic fluid volume and diabetes status.
To correlate between the amniotic fluid volume and its consistency.
To determine any congenital fetal abnormalities.
1.3 Study problem:

Diabetes is one of the common causes of polyhydramnios, pregnancies
complicated by polyhydramnios are at high risk and need optimal care and
management.
1.4 The importance of the study:
- Evaluate the amount of amniotic fluid so can select the best method to
determine AFV in the uterus.
- Determine diabetic effect on amniotic fluid and the pregnancy.

CHAPTER TWO
Literature review

Chapter two - Literature review
2.1Anatomy
2.1.1 The amnion
The amnion is a membranous sac which surrounds and protects the embryo. It is
the first of the three cavities (amnion, chorion and yolk sac) in the embryo and is
formed on 8 dpc. (6)
The amniotic cavity is roofed in by a single stratum of flattened, ectodermal cells,
the amniotic ectoderm, and its floor consists of the ectoderm of the embryonic disc.
A thin layer of mesoderm, continuous with that of the somatopleure, is located just
outside the amniotic ectoderm, and is connected to the mesodermal lining of the
chorion by the body stalk. (6)
Origin and early development of the amnion and amniotic cavity:-
Figure (2.1) show embryo within amniotic sac (cityimaging.com.au).

The amniotic cavity starts as a small space which soon expands to fill the whole
uterine cavity. This occurs in the following way. (6)
The amniotic cavity appears – during implantation of the blastocyst -as small
clefts between the ectoderm (of the inner cell mass) and trophoblast ; very early in
pregnancy the ectodermal cells are attached to the trophoblast. (6)
As the development proceeds (at about day (8)) small intracellular clefts appear
between the ectoderm and trophoblast. When these clefts join together they form a
small space called the amniotic cavity. (6)
As the amniotic cavity enlarges, layer of large flattened cells called amnioblasts
develops from the inner surface of the trophoblast and form the roof of the
amniotic cavity. (6)
Figure (2.2): Embryo within the uterine cavity. (1)

2.1.2 Amniotic fluid
2.1.2.1 Development of amniotic fluid
Amniotic fluid is water-like fluid originates from the maternal plasma, and passes
through the fetal membranes by osmotic and hydrostatic forces. As the Placental
and fetal vessels develop, the fluid passes through the fetal tissue, as the exsudatum
of the skin. (7)
The volume of amniotic fluid increases with linear regression to the growth
of fetus. From the 10th to the 20th week its, carbohydrate and lipid increases from
25ml to 400ml approximately. From the 8th week, when the fetal kidneys begin to
function, fetal urine is also present in the AF. Approximately in the 10th week the
breathing and swallowing of the fetus slightly decrease the amount of AF, but
neither urination nor swallowing contributes significantly to AF quantity changes,
up until the 25 week, when keratinisation of skin is complete. Then the linear
regression between AF and fetal growth cease to exist. It reaches the plateau of
800ml at the 28 week (gestational age) the amount of fluid declines to roughly 400
ml at 42 weeks. (8)
The fore waters are released when the amnion rupture. This is commonly known as
the time when a woman's "water breaks". When this occurs during labour at term,
it is known as "spontaneous rupture of membranes"(SROM). (9)

If the rupture precedes labour at term, however, it is referred to as "premature
rupture of membrane” (PROM).The majority of the hind waters remain inside the
womb until the baby is born. Artificial rupture of membrane (ARM), a manual
rupture of the amniotic sac can also be performed to release the fluid if the amnion
has not spontaneously ruptured. (9)
Figure (2.3) show amniotic membrane
2.1.2.2 Components of amniotic fluid:
Amniotic fluid is a solution in which undissolved material is suspended. It consists
of desquamated fetal epithelial cells and approximately equal portions of organic
and inorganic salts, in 98 - 99% water. Half of the organic constituents are protein;
and the other half consists of carbohydrates, fats, enzymes, hormones, and
pigments. As pregnancy advances, the composition of the amniotic fluid changes

as fetal excreta (fetal urine, meconium) are added. Because fetal urine is added to
amniotic fluid, studies of fetal enzyme systems, amino acids, hormones, and other
substances can be conducted on fluid obtained by amniocentesis.(1)
2.2 Physiology:-
Maintenance of normal amniotic fluid volume is essential for normal
fetal development. An excess or deficiency of amniotic fluid is associated with an
increased incidence of fetal and neonatal morbidity and mortality. (10)
2.2.1 Functions of amniotic fluid:
Amniotic fluid is "inhaled" and "exhaled" by the fetus. It is essential that fluid be
breathed into the lungs in order for them to develop normally. Swallowed amniotic
fluid also creates urine and contributes to the formation of meconium. As well,
amniotic fluid protects the developing baby by cushioning against blows to the
mother's abdomen, allows for easier fetal movement, promotes muscular/skeletal
development, and helps protect the fetus from heat loss. )9)
Analysis of amniotic fluid, drawn out of the mother's abdomen in an
amniocentesis procedure, can reveal many aspects of the baby's genetic health.
This is because the fluid also contains fetal cells, which can be examined for
genetic defects. (11)

2.2.2 Production and absorption:-
Under normal circumstances, the amniotic fluid is in a state of dynamic
equilibrium between production and absorption .Available exchange surfaces are
the amniotic epithelium. umbilical cord, fetal skin, gastrointestinal tract, and
urogenital tract. (10)
2.2.3 Production of amniotic fluid:-
Amniotic fluid production is attributed initially to the amniotic fluid
epithelium and later to fetal kidneys. (12)
The fetal membrane and umbilical cord are the most important structures for
continues exchange of water and electrolytes, while the swallowing of amniotic
fluid by the fetus and fetal urine output into the amniotic fluid are intermittent
process. (2)
2.2.4 Fetal urine production:-
Fetal urine production contributed to formation of the amniotic
fluid .hypotonic urine can be detected in fetal bladder as early as
12weeks gestation. The 24 hour fetal urinary output has been
calculated at 7-17 ml based on ultrasound studies at 18 weeks.the
daily urine output increases to 600-800ml by the end of
pregnancy. (13)

2.2.5 Source and regulation of amniotic fluid volume:-
Amniotic fluid is derived from several sources and the contribution of these
Sourcesvaries during the pregnancy. In early pregnancy, the primary source of the
fluid appears to be the amniotic membrane and transudate from the maternal blood
by transport across the amniotic membrane. (1)
After the first trimester the greatest contribution is from the fetal kidneys,
producing 800 to 1200 cc per day. Also, there is a positive flow across the
membranes of about 200 to 500 cc per day. Interestingly, although the fetal lungs
contribute about 360 cc to the amniotic cavity per day, about half of this moves
back into the lungs. Fluid is removed mostly through fetal swallowing (500 to
1000 cc per day). Inconsequential amounts leave the cavity through the
membranes. The amniotic fluid volume rises linearly to about 33 to34 weeks, when
the average is about 1000 cc, after which it generally drops slowly to about 800 cc
at 40 weeks of gestation and to 600 cc at 42 weeks. (14)
Fetal swallowing of amniotic fluid begins at about 11-13 weeks of gestation. Most
of the fluid passes into the fetal gastrointestinal tract, but some of it also passes
into the fetal lungs. In either case, the fluid is absorbed into the fetal circulation
and then passes into the maternal circulation via the placental membrane. In the
final stages of pregnancy, the fetus swallows up to 400 ml of amniotic fluid per
day. Some fluid also passes from the amniotic cavity into the maternal blood
across the chorioamniotic membrane. If the fetus is unable to swallow adequate
amounts of amniotic fluid or if the fetus swallows the fluid but it is not absorbed
properly because of an obstruction in the upper fetal GI tract, polyhydramnios will
occur. (1)
2.2.6 Fetal circulation:
Oxygen and nutrients from the mother's blood are transferred across the
placenta to the fetus. The enriched blood flows through the umbilical cord to the
liver and splits into three branches. The blood then reaches the inferior vena cava,
a major vein connected to the heart. Most of this blood is sent through the ductus
venosus. It is also a shunt that passes highly oxygenated blood through the liver to
the inferior vena cava and then to the right atrium of the heart. A small amount of
this blood goes directly to the liver to give it the oxygen and nutrients it needs.(9)
Waste products and carbon dioxide from the fetus are sent back through the
umbilical cord and placenta to the mother's circulation to be eliminated. (9)
2.3 ASSESSMENT OF AMNIOTIC FLUID VOLUME:-
The amniotic fluid volume Reflects the status of both the mother and the fetus and
is altered in many physiological and pathological conditions. Ultrasound has a
potential role in the management of such conditions, by the assessment of amniotic
fluid volume. (4)
There are three methods for assessing amniotic fluid volume:
1- Subjective assessment:
With experience, it is possible to classify amniotic fluid volume
into the broad categories absent, low, normal, Increased and excessive. Although
reliable in the hands of an experienced operator, this method has proved impossible
to standardize in clinical and research terms. (4)
2- Single deepest pool (SDP)– (largest pocket)
The size of the deepest, cord-free pool of amniotic fluid is assessed with the
ultrasound probe perpendicular to the maternal abdomen. The vertical depth of the
largest pool is measured. When this method was first introduced, a 1-cm pool was
considered acceptable in normal pregnancy, but subsequent studies have suggested
that minimum depth of 2–3 cm is a more appropriate threshold. (4)
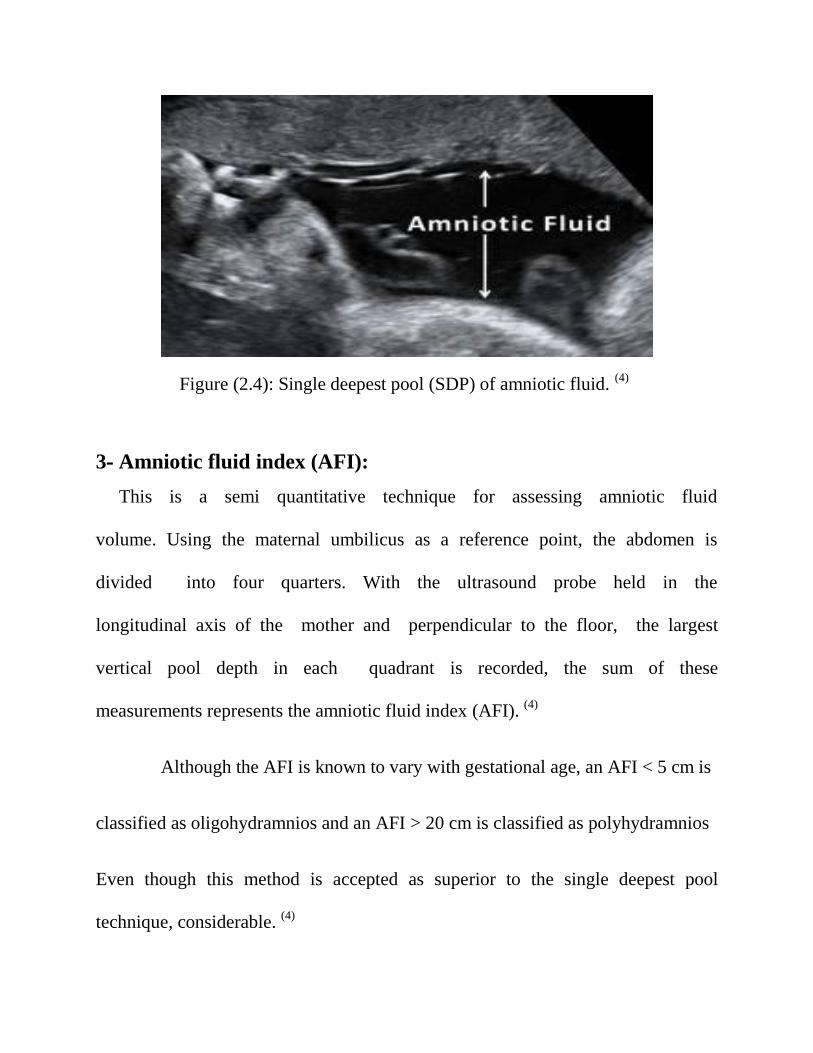
Figure (2.4): Single deepest pool (SDP) of amniotic fluid. (4)
3- Amniotic fluid index (AFI):
This is a semi quantitative technique for assessing amniotic fluid
volume. Using the maternal umbilicus as a reference point, the abdomen is
divided into four quarters. With the ultrasound probe held in the
longitudinal axis of the mother and perpendicular to the floor, the largest
vertical pool depth in each quadrant is recorded, the sum of these
measurements represents the amniotic fluid index (AFI). (4)
Although the AFI is known to vary with gestational age, an AFI < 5 cm is
classified as oligohydramnios and an AFI > 20 cm is classified as polyhydramnios
Even though this method is accepted as superior to the single deepest pool
technique, considerable. (4)

2.4 Consistency of Amniotic Fluid:
- In general, amniotic fluid appears anechoic throughout pregnancy in the majority
of patients at normal gain settings and transducer frequencies. Echogenic amniotic
fluid at different stages of gestation can occur and is associated with different
etiologies, some physiological and others pathological. (1)
In the first trimester of pregnancy, normal amniotic fluid should appear
echo free. In contrast, chorionic fluid frequently appears to have dispersed low
amplitude echoes which is especially evident at higher transducer frequencies and
gain settings. (1)
In the second and third trimesters of pregnancy, amniotic fluid echoes may
be seen in normal pregnancies or may be associated with underlying pathological
causes including anencephaly and intra-amniotic bleeding. The source of amniotic
fluid debris echoes in normal pregnancies is mainly related to desquamated or
exfoliated fetal skin cells and vernixcaseosa. Vernixcaseosa is the normal oily
substance produced by fetal skin and covering the fetal skin to protect it in its
aqueous environment. (1)
Near term, meconium released into the amniotic fluid by the fetus may be
another source of amniotic fluid debris echoes. Under ordinary circumstances,
meconium is usually not released in utero although it may be a normal event that
occurs with progressive fetal maturation, without evidence of fetal distress or poor
outcome. Other causes associated with meconium passage in utero include
hypoxia-induced peristalsis and sphincter relaxation, and umbilical cord
compression-induced vagal stimulation in mature fetuses. There appears to be a
link between gestational age and meconium passage after the 38th week.The cause
of the meconium passage may vary from patient to patient, and in some patients
may result from a combination of causes which may explain why there has not
been a clear relationship demonstrated between its passage in utero and fetal
outcome. (1)
Other potential causes of amniotic fluid debris echoes include fetal bleeding
associated with percutaneous umbilical cord sampling, rupture of an umbilical
vessel associated with velamentous insertion of the umbilical cord,
chorioamnionitis, and idiopathic causes.(1)
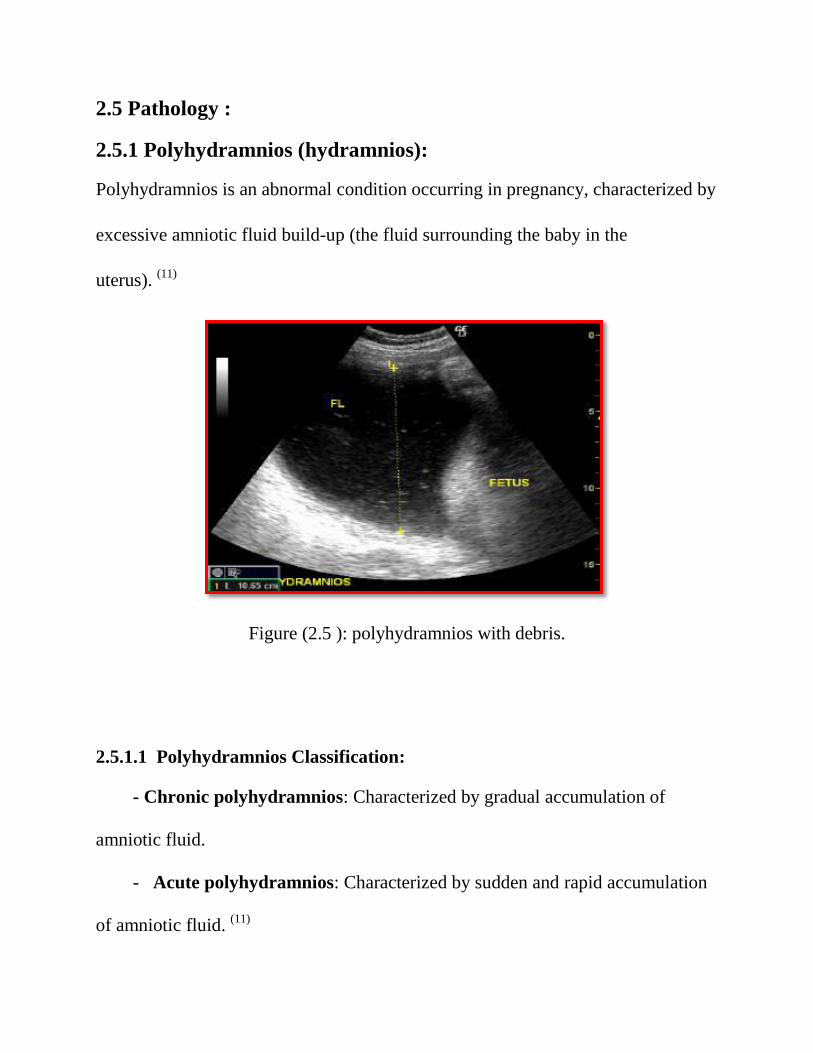
2.5 Pathology :
2.5.1 Polyhydramnios (hydramnios):
Polyhydramnios is an abnormal condition occurring in pregnancy, characterized by
excessive amniotic fluid build-up (the fluid surrounding the baby in the
uterus). (11)
Figure (2.5 ): polyhydramnios with debris.
2.5.1.1 Polyhydramnios Classification:
- Chronic polyhydramnios: Characterized by gradual accumulation of
amniotic fluid.
- Acute polyhydramnios: Characterized by sudden and rapid accumulation
of amniotic fluid. (11)

2.5.1.2 Causes of polyhydramnios:-
1- Maternal abnormalities :
a- Diabetes mellitus (15 to 25 percent).
b- Pre eclampsia (6 to 15 percent).
c- Erythroblast sis fetalis induced RH isoimmunisation.
d- Congestive heart failure.
e- Syphilis , Anaemia.
f- Pregnancy- induced hypertension .
g- Multiple gestations may associate with polyhydramnios. (11)
2- Fetal anomalies :
a- Anomalies of the C.N.S (anencephaly, meningocele, cephalocele,
hydroancephaly, hydrocephalus, and cebocephaly) .
b- Anomalies of G.I.T (esophageal and duodenal atresia).
c- abdominal wall defects.
d- fetal and placental tumor’s.
e- cardiovascular disorders(cardiac arrhythmias, coarctation and interruption of
fetal aorta , myocardial disorder , fetal Hydrops , fetal _fetal transfusion).
f- miscellaneous lesions such as true knot of the umbilical cord , hypo plastic lung,
cystic hygroma , thanatophoric dwarfism, and other short –limbed dwarfism. (11)
3- Idiopathic ( Other causes ) :-
Impaired amniotic fluid absorption:-
a- Cleft lip and palate .
b- Esophageal stenosis or atresia.
c- Duodenal stenosis or atresia.
d- Bowel obstruction. (11)
2.5.1.3 Complications of polyhydramnios:-
Premature labor , Premature rupture of membranes (PROM), Umbilical cord
prolapsed , Abruption placenta , Premature delivery , Increased prenatal mortality ,
Placenta previa. Polyhydramnios complicated by fetal C.N.S anomalies, isusually
diagnosed earlier than 30 weeks. Disorder is diagnosed later than 30 weeks in
pregnancies associated with G.I.T anomalies. Sever polyhydramni is associated
with a high incidence of fetal anomalies (75%). (11)

2.5.1.4 Symptoms of Polyhydramnios:
Mild cases of polyhydramnios may not cause any noticeable signs in the mother.
However, severe cases can lead to the following symptoms:
Difficulty breathing unless standing or sitting in an upright position.
Difficulty climbing stairs.
Decreased urine production.
Larger belly size for one’s gestational age.
Swelling of the abdominal wall, vulva and legs.
Indigestion.
Constipation a Stretch marks.
Abdominal pain and Heartburn.
Varicose veins (when the valves within the veins stop working, causing the
venous walls to become weak, leading to blood accumulation in the weak
spots). (11)
Polyhydramnios complicated by fetal C.N.S anomalies, is usually diagnosed
earlier than 30 weeks. Disorder is diagnosed later than 30 weeks in pregnancies
associated with G.I.T anomalies. Sever polyhydramni is associated with a high
incidence of fetal anomalies (75%). (11)

2.5.1.5 Polyhydramnios Diagnostic Criteria:-
The principal diagnostic criterion is an amniotic fluid index (AFI) over 20 cm or
largest pocket over 8 cm shown on ultrasound findings. (11)
A detailed ultrasound may be ordered to estimate the amniotic fluid levels by
assessing the deepest pockets in four particular regions of the uterus. These
measurements are then used for determining the AFI.(11)
Chamberlain Method
Single Vertical Pocket Measurement
< 1 cm severe oligohydramnios
1-2 cm significant oligohydramnios
2-8 cm Normal
8-12 cm mild polyhydramnios
12-16 cm moderate polyhydramnios
> 16 cm severe polyhydramnios
Table (2.1) quantitative determination of amniotic fluid volume by single vertical
pocket. (1)
2.5.1.6 Amniocentesis :
This diagnostic procedure involves collecting an amniotic fluid sample (containing
fetal cells and fetus produced chemicals) and testing it in a laboratory for evidences
of any infections or other abnormalities. (15)
2.5.1.7 Treatment of polyhydramnios:-
Definite clinical symptoms such as abdominal pain or dyspnea are indication for
the treatment of polyhydramnios. Serial amniotic fluid decompressions removing
2-4 litters of amniotic fluid are the treatment of choice in many cases.
Large fluid volume should not be removed in one sitting, as excessive
decompression can lead to placenta abruption. (11)
Indomethacin, a prostaglandin synthesise inhibitor, is available for the medical
treatment of polyhydrmnios. It acts by decreasing the fetal urine output.(11)
2.5.2 Oligohydramnios(Anhydramnios) :
Oligohydramnios is defined as diminished AFV. Anhydramniosis defined as
severe oligohydramnios and is indicated when there is no detectable amniotic fluid
pockets on ultrasound examination. There are no associated maternal risks.
Oligohydramnios may be suspected clinically if the measured uterine fundal height
is small-for-dates. With theChamberlain method, oligohyramnios is indicated if the
single largest pocket of amnioticfluid measured is less than 2 cm; with the Phelan
method, oligohydramnios is indicated if the sum of the four measured pockets of
amniotic fluid is 8 cm or less. (1)

Visual ultrasound features of oligohydramnios include:
A. lack of an amniotic fluid space between the anterior uterine wall and the fetal
Body.
B. relative crowding of fetal parts.
C. difficulty outlining the umbilical cord. (1)
2.5.2.1 Most Common Causes of Oligohydramnios:
1. premature rupture of membranes.
2. chronic fetal death.
3. postterm pregnancy.
4. advanced intrauterine growth retardation.
5. fetal genitourinary (GUT) tract anomalies associated with decreased renal
function and diminished urinary output or anomalies compromising the
flow of urine into the ureters, bladder, or urethra:
A. bilateral renal agenesis (Potter's syndrome).
B. bilateral ureteropelvic junction obstruction.
C. bilateral multicystic dysplastic kidneys.
D. infantile polycystic kidneys.
E. posterior urethral valves.

F. urethral agenesis.
6. chromosome defects (especially triploidy).(1)
Oligohydramnios related to fetal GU tract anomalies typically manifests early in
the 2nd trimester. The fetal bladder is a good place to start when assessing the
cause of oligohydramnios. Certain visualization of a normal-appearing fetal
bladder and fetal kidneys rules out bilateral renal agenesis and points to ruptured
membranes as the cause of oligohydramnios. Inability to visualize the fetal bladder
is suspicious of bilateral renal agenesis and should prompt careful evaluation of the
fetal kidneys. The diagnosis of bilateral renal agenesis is indicated if the fetal
kidneys cannot be visualized. (1)
Oligohydramnios due to a renal problem is alway bilateral therefore both kidneys
will be affected and appear abnormal. Demonstration of an abnormally enlarged
fetal bladder (megacystis) with evidence of bilateral hydronephrosis indicates a
bladder outlet level obstruction which is most commonly due to posterior urethral
valves. There is an increased risk of a chromosome abnormality when
oligohydramnios is associated with IUGR or renal abnormalities. In the early 2nd
trimester, the presence of severe oligohydramniosfavours the diagnosis of a serious
fetal abnormality with a poor prognosis (most often involving the GU tract)

whereas in the 3rd trimester, the etiology of severe oligohydramnios is more
commonly associated with ruptured membranes and placental insufficiency. (1)
The presence of an adequate volume of amniotic fluid is a factor in normal
fetal lung maturation, since in infants with prolonged reduction there is usually
severe pulmonary hypoplasia. (1)
Figure (2.6): Oligohydramnios.

2.5.3 Diabetes Mellitus:
Diabetes is a condition in which the body cannot change sugars and starches
(carbohydrates) into energy. This happens when the body cannot make enough
insulin or cannot use the insulin it makes. As a result, extra sugar in the blood can
lead to damage in the blood vessels, eyes, kidneys, heart, and nerves. (6)
2.5.3.1 Types of diabetes mellitus:
A- Gestational diabetes:
Is a type of diabetes that is first diagnosed in a pregnant woman. Out of every
100 pregnant women in the U.S, tow to ten will have gestational diabetes.
Gestational diabetes usually goes away after pregnancy, but if it does not go
away, it is known as type 2 diabetes. Many women who have had gestational
diabetes will develop type 2 diabetes later. (6)
B- Type 1 diabetes (Insulin dependent ) :
Is a condition in which the body makes no insulin or so little insulin that the
body cannot change blood sugar into energy. Type 1 diabetes usually develops
during childhood or adolescence, before a woman gets pregnant. (16)
C- Type 2 diabetes ( Non-insulin dependent ) :
Is a condition in which the body makes too little insulin or cannot use the
insulin it makes to change blood sugar into energy, Type2 diabetes often occurs
after childbearing age, although it is becoming more common for childbearing-
aged women to develop type2 diabetes. (16)
Approximately 87.5% of pregnancies complicated by diabetes are due to
gestational diabetes, 7.5% are due to type 1 diabetes and 5% are due to type 2
diabetes. (17)
2.5.3.2 Risks of Diabetes On Pregnancy :
1-Miscarriages:
Women with poor blood sugar control or many severe complications are at
greater risk for miscarriage. In otherwise healthy diabetic women, the risk of
miscarriage is no greater than that of the general population - approximately one
out of every nine or ten early-stage pregnancies. (17)
2-Large Babies (macrosomia):
Women with diabetes may have large babies because of their high blood
sugar levels. This effect can be reduced by keeping blood sugar levels as close
to normal as possible. Obviously, a big baby makes delivery more difficult and
for this reason, Caesarean sections are frequently performed. (17)
3- Polyhydramnios:
This condition - excessive amounts of amniotic fluid throughout pregnancy is
somewhat less common. Aside from the discomfort of an overly distended belly,

polyhydramnios rarely has harmful consequences. However, it is a sign that the
diabetes has not been under optimal control. The fluid builds up because the
baby is urinating large quantities due to elevated glucose levels. (17)
4- Toxaemia: -
Toxaemia is characterized by an increase in blood pressure, the presence of
protein in the urine, and the swelling of hands and feet. Toxaemia was once a
common complication of diabetic pregnancy, but with good blood sugar control,
this problem is no more common than in a non-diabetic pregnancy. (17)
2.5.4 Gestational Diabetes:
Gestational diabetes is a condition characterized by high blood sugar
(glucose) levels that is first recognized during pregnancy. The condition occurs in
approximately 4% of all pregnancies. (18)
Figure (2.7) gestational diabetes. (18)

2.5.4.1 Causes OF Gestational Diabetes in Pregnancy:
Almost all women have some degree of impaired glucose intolerance as a
result of hormonal changes that occur during pregnancy. That means that their
blood sugar may be higher than normal, but not high enough to have diabetes.
During the later part of pregnancy (the third trimester), these hormonal changes
place pregnant woman at risk for gestational diabetes. During pregnancy, increased
levels of certain hormones made in the placenta (the organ that connects the baby
by the umbilical cord to the uterus) help shift nutrients from the mother to the
developing fetus. Other hormones are produced by the placenta to help prevent the
mother from developing low blood sugar. They work by stopping the actions of
insulin. Over the course of the pregnancy, these hormones lead to progressive
impaired glucose intolerance (higher blood sugar levels). To try to decrease blood
sugar levels, the body makes more insulin to get glucose into cells to be used for
energy. Usually the mother's pancreas is able to produce more insulin (about three
times the normal amount) to overcome the effect of the pregnancy hormones on
blood sugar levels. If, however, the pancreas cannot produce enough insulin to
overcome the effect of the increased hormones during pregnancy, blood
sugar levels will rise, resulting in gestational diabetes. (18)

2.6 Previous studies:
Joy Y. Vink MD, Sarah H. Poggi MD, Alessandro Ghidini MD, Catherine
Y. Spong MD, 2007
Research name Amniotic fluid index and birth weight: Is there a
relationship in diabetics with poor glycaemia control
Result of research the poorly controlled diabetic population, a linear relationship
existed between AFI and BW centiles, with the largest BW centiles having the
highest AFI centiles (P< .0001) and he previously noted relationship between
elevated AFI and BW centiles in the general patient population is linear in diabetic
patients with poor glycemic control.
Department of Obstetrics and Gynecology, Kofinas Perinatal and Fertility
Institute, New York Methodist Hospital, Brooklyn, New York, 2006
Differences in amniotic fluid patterns and fetal biometric parameters in
third trimester pregnancies with and without diabetes. Reported that AFI in normal
pregnancies was less than that in diabetic pregnancies throughout the gestational
ages studied (27–42 weeks). In normal pregnancy, the mean AFI was 14.0 cm at 27
weeks and decreased to 11.4 cm at 42 weeks (r¼0.25, p¼0.0005), whereas in
diabetic pregnancies, the values remained stable throughout the gestational ages
studied. There exist significant differences in AFI, estimated fetal weight,
estimated fetal weight %, abdominal circumference. Abdominal circumference,

and head circumference to abdominal circumference ratio between the two groups.
In both Normal and diabetic pregnancies, there is a positive correlation between
the AFI and the percentile of abdominal Circumference (p50.0001), and between
the AFI and the percentile of estimated fetal weight (p50.0001).
Amniotic fluid volume reflects recent glycemic status in gestational diabetes
mellitus. Significantly higher mean blood glucose values 1 day (114.7 mg/dl vs
102.8 mg/dl, p < 0.01) and 1 week before (111.0 mg/dl vs. 102.0 mg/dl, p < 0.05)
were calculated for examinations resulting in elevated amniotic fluid index values
compared with normal amniotic fluid index values, respectively. Similarly,
significantly higher percents of hyperglycemia 1 day (32% vs. 16.5%, p < 0.05) but
not 1 week (30.8% vs. 21.7%, p > 0.05) before the elevated amniotic fluid index
were documented.
Perinatal Research Laboratory, Departments of Pediatrics and Obstetrics,
University of Alabama in Birmingham, University of Alabama in
Birmingham, University Station, Birmingham.2011
Reported that Amniotic fluid volume estimates were obtained in 37
diabetic women at 33½–38½ weeks of gestation. The technique employed, sodium
aminohippurate (PAH) dilution, allowed estimation of both volume and turnover’.
Hydramnios was common in the patients studied earlier in their third trimester;
fetal macrosomia and increased severity of maternal disease was also evident in

this group. Volumes comparable to those reported from normal patients were
observed in the women studied later in their third trimester. Amniotic fluid volume
appeared to be related to fetal growth with hydramnios accompanying macrosomia
and oligohydramnios in fetal growth retardation. A positive correlation of PAH
clearance and amniotic fluid volume was found.
Rian Omer Massaad Elbasheer, Sudan University of science and technology,
MS.c degree in medical Diagnostic Ultrasound, Khartoum, SUDAN.2012
The study was conducted to evaluate the amniotic fluid volume in diabetic
patient to show the effects of diabetes in pregnancy.
The study was conducted on 49 women with diabetes mellitus pregnant
women in the third trimester at period from December 2011 to April 2012.
Ultrasound was done by using mindray 6600, 2200 with 3.5 MHZ convex
probe .after measuring amniotic fluid volume by deepest pocket (large pocket) and
AFI (4 pocket) in the third trimesters .it was observed that the AFI in millimeters
in all patient with diabetes mellitus 26% of pt have increasing AFV. It is
concluded that the measurement of AFV by two measurement and compared with
type of diabetic and diabetic status is important to show the effect of diabetic in
pregnant women’s.

Moaz Saliman Hamad Adam, Alzaiem Alazhari University, M.Sc
degree in medical diagnostic ultrasound, Khartoum, sudan.2012
The study was conducted to evaluate the amniotic fluid volume in
diabetic pregnancy.
This study included 100 pregnant diabetic and data was collected from 18
March 2012 to 13 November 2012.
The study depends on the large single vertical deepest pocket and
found the majority of diabetic pregnant women are found to have
polyhydramnios (abnormal increase in amniotic fluid volume) which
represent (56%) of the sample size.
The majority of diabetic pregnant women are among type1 D.M
with (38%), and the age group (31 to 40) which represent (46%) of the
sample size, and treated by using insulin represent (54%) of the sample
size. The majority of diabetic pregnant women are well controlled from
DM represent (56%) of the sample size with (44%) of sample are
uncontrolled.

CHAPTER THREE
METHODOLOGY

Chapter three - Study Methods
3.1 Study design:
This study was analytical and descriptive study deal with the role of
ultrasound in evaluation of amniotic fluid volume and it’s consistency in
diabetic pregnant women among Sudanese population .
3.2 Study area: The study was conducted in:
- Alsuody hospital.
- Alturky hospital.
- Alban-jaded teaching hospital.
- Omdurman maternity hospital.
- Some other diagnostic health and private centers.
3.3 Study duration:
The study was carried out From 10 of December 2014 to 10 of May 2015.
3.4 Study population:
Sudanese pregnant women in second and third trimesters.
3.5Inclusion criteria:
All diabetic pregnant women in 2nd
and 3rd
trimesters.
3.6Exclusion criteria:
Non diabetic pregnant women.

3.7 Study variables:
- Maternal age.
- Type of diabetes mellitus.
- Amniotic fluid index.
- Gestational age.
- Consistency of amniotic fluid.
- Any anomalies seen.
3.8 Study sample:
The study done for 100 diabetic pregnant women.
3.9 Tool of data collection:
- The data was collected by using ultrasound machine.
- data collection sheet ( Questionnaire ).
3.10 Equipments:
Different types of ultrasound machines were used:
1-ALPINON ultrasound system, model: E-CUBE, Probe T.A convex 3.5 MHZ,
made of manufacturing: korea.
2- MINDRAY 1100 with TA 3.5MHZ , made of manufacturing : china.

3- Sonoscape portable ultrasound diagnostic system, model: A5, probe T.A 3.5
MHZ, made Of Manufacturing: china.
3.11Sonographic technique and guideline protocol:
Any diabetic patient comes to the obstetrics department:-
Firstly identify myself to patient, and explain about study in simple language then
clinical information was taken and data collection sheet filled.
3.11.1 Patient position:
All Trans Abdominal Sonography (TAS) study is generally performed with the
patient in Supine position.
3.11.2 Coupling gel:
A copious amount of scanning gel is applied to the transducer tip to ensure good
transducer skin contact and easy movement of the transducer.
3.11.3 Transducer Frequency:
Use 3.5 MHz trans abdominal transducers, 5 MHz for thin women.
3.11.4 Ultrasound procedure:
An ultrasound procedure used to assess the amount of amniotic fluid.
The single largest pocket measured the normal values range from 3 to 8cm
(figure3.1), then the amniotic fluid index is measured by dividing the uterus into
four imaginary quadrants. The linea nigra is used to divide the uterus into right
and left halves. The umbilicus serves as the dividing point for the upper and lower

halves.
The transducer is kept parallel to the patient longitudinal axis and perpendicular to
the floor. The deepest, unobstructed, vertical pocket of fluid is measured in each
quadrant in centimeters. The four pocket measurements are then added to calculate
the AFI. Normal AFI values range from 5to20cm.
Figure (3.1): Single largest pocket.
Each patient will be scanned twice, in an international scan guidelines and
protocols. Firstly by the researcher then by a qualified sinologist to confirm the
findings and diagnosis.
3.12 Data analysis:
- The data analyzed by statistically package for social sciences (SPSS).
3.13 data storage:
- The data was stored on personal computer and compact disk.

3.14 Ethical consideration:
- Data was collected from different patient with maintain privacy and
confidentiality.
- No patient information was published throughout this study.

Chapter four
The results
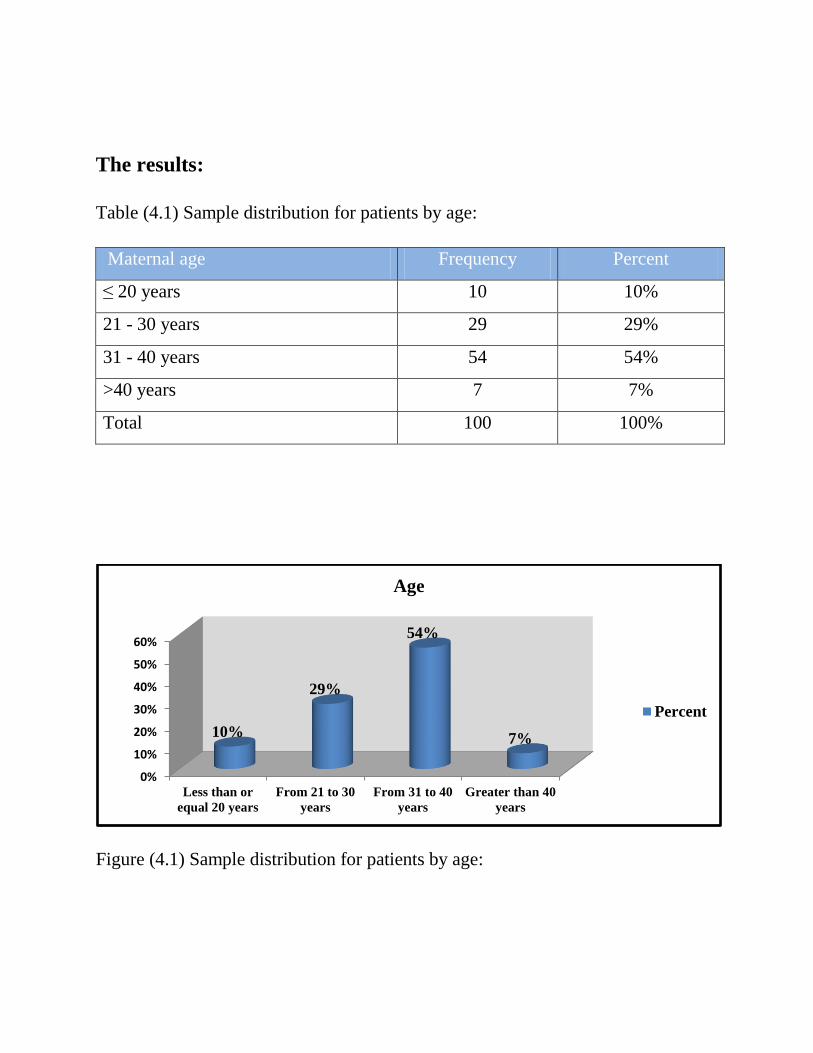
The results:
Table (4.1) Sample distribution for patients by age:
Maternal age Frequency Percent
≤ 20 years 10 10%
21 - 30 years 29 29%
31 - 40 years 54 54%
>40 years 7 7%
Total 100 100%
Figure (4.1) Sample distribution for patients by age:
0%
10%
20%
30%
40%
50%
60%
Less than or
equal 20 years
From 21 to 30
years
From 31 to 40
years
Greater than 40
years
10%
29%
54%
7%
Age
Percent

Table (4.2) Sample distribution for patients by type of diabetes:
Type of diabetes Frequency Percent
Insulin dependent 32 32%
Non insulin dependent 15 15%
Gestational diabetes 53 53%
Total 100 100%
Figure (4.2) Sample distribution for patients by type of diabetes:
0%
10%
20%
30%
40%
50%
60%
Insulin dependent Non insulin
dependent
Gestational diabetes
32%
15%
53%
Type of diabetes
Percent

Table (4.3) Sample distribution for patients by duration of diabetes:
Duration of diabetes Frequency Percent
Less than 1 year (GD) 53 53%
1 - 5 years 20 20%
6 - 10 years 21 21%
Greater than 10 years 6 6%
Total 100 100%
Figure (4.3) Sample distribution for patients by duration of diabetes:
0%
10%
20%
30%
40%
50%
60%
Less than one
year
From 1 to 5
years
From 6 to 10
years
Greater than 10
years
53%
20% 21%
6%
Duration of diabetes
Percent

Table (4.4) Sample distribution for patients by treatment type:
Treatment type Frequency Percent
Insulin 56 56%
Metformin 19 19%
Diet 25 25%
Total 100 100%
Figure (4.4) Sample distribution for patients by treatment type:
0%
10%
20%
30%
40%
50%
60%
Insulin Metformin Diet
56%
19% 25%
Treatment type
Percent

Table (4.5) Sample distribution for patients by diabetes status:
Diabetic status Frequency Percent
Controlled 76 76%
Uncontrolled 24 24%
Total 100 100%
Figure (4.5) Sample distribution for patients by diabetes status:
76%
24%
Diabetic status
Controlled
Uncontrolled

Table (4.6) Sample distribution for patients by history of polyhydramnios:
History of polyhydramnios Frequency Percent
Yes 17 17%
No 83 83%
Total 100 100%
Figure (4.6) Sample distribution for patients by history of polyhydraminos:
17%
83%
History of polyhydraminos
Yes
No

Table (4.7) Sample distribution for patients by gravity status:
Gravity status Frequency Percent
1 ( Primi-Gravida) 15 15%
2 17 17%
3 15 15%
4 17 17%
5 14 14%
6 9 9%
7 5 5%
8 4 4%
9 4 4%
Total 100 100%
0%2%4%6%8%
10%12%14%16%18% 15%
17% 15%
17%
14%
9%
5% 4% 4%
Gravity status
Percent

Figure (4.7) Sample distribution for patients by gravity status:
Table (4.8) Sample distribution for patients by gestational age:
Gestational Age (GA) Frequency Percent
From 20 to 21 weeks and 6 days 2 2%
From 22 to 23 weeks and 6 days 8 8%
From 24 to 25 weeks and 6 days 7 7%
From 26 to 27 weeks and 6 days 13 13%
From 28 to 29 weeks and 6 days 3 3%
From 30 to 31 weeks and 6 days 8 8%
From 32 to 33 weeks and 6 days 17 17%
From 34 to 35 weeks and 6 days 12 12%
From 36 to 37 weeks and 6 days 18 18%
From 38 to 39 weeks and 6 days 10 10%
Greater than or equal 40 weeks 2 2%
Total 100 100%
0%2%4%6%8%
10%12%14%16%18%
2%
8% 7%
13%
3%
8%
17%
12%
18%
10%
2%
Gestational age
Percent
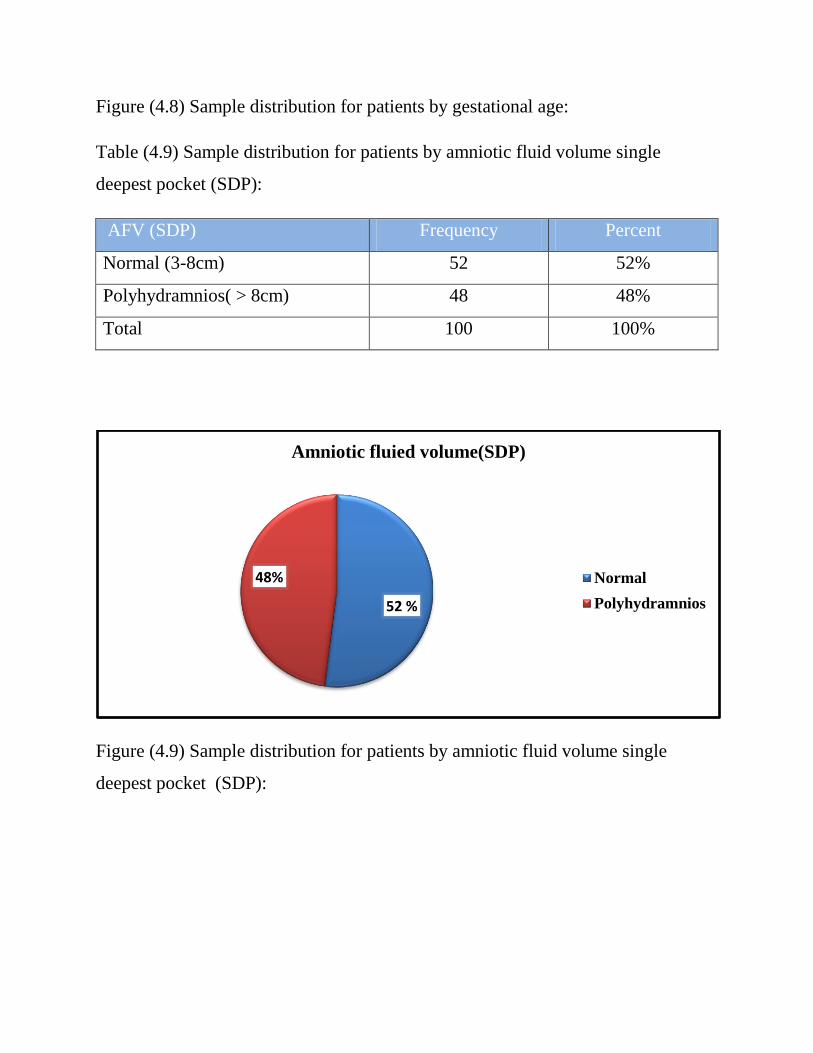
Figure (4.8) Sample distribution for patients by gestational age:
Table (4.9) Sample distribution for patients by amniotic fluid volume single
deepest pocket (SDP):
AFV (SDP) Frequency Percent
Normal (3-8cm) 52 52%
Polyhydramnios( > 8cm) 48 48%
Total 100 100%
Figure (4.9) Sample distribution for patients by amniotic fluid volume single
deepest pocket (SDP):
52 %
48%
Amniotic fluied volume(SDP)
Normal
Polyhydramnios

Table (4.10) Sample distribution for patients by amniotic fluid volume (4 pockets):
AFV (4pockets) Frequency Percent
Normal (5-20cm) 52 52%
Polyhydramnios ( > 20cm) 48 48%
Total 100 100%
Figure (4.10) Sample distribution for patients by amniotic fluid volume (4
pockets):
52%
48%
amniotic fluid volume (4 pockets)
Normal
Polyhydramnios
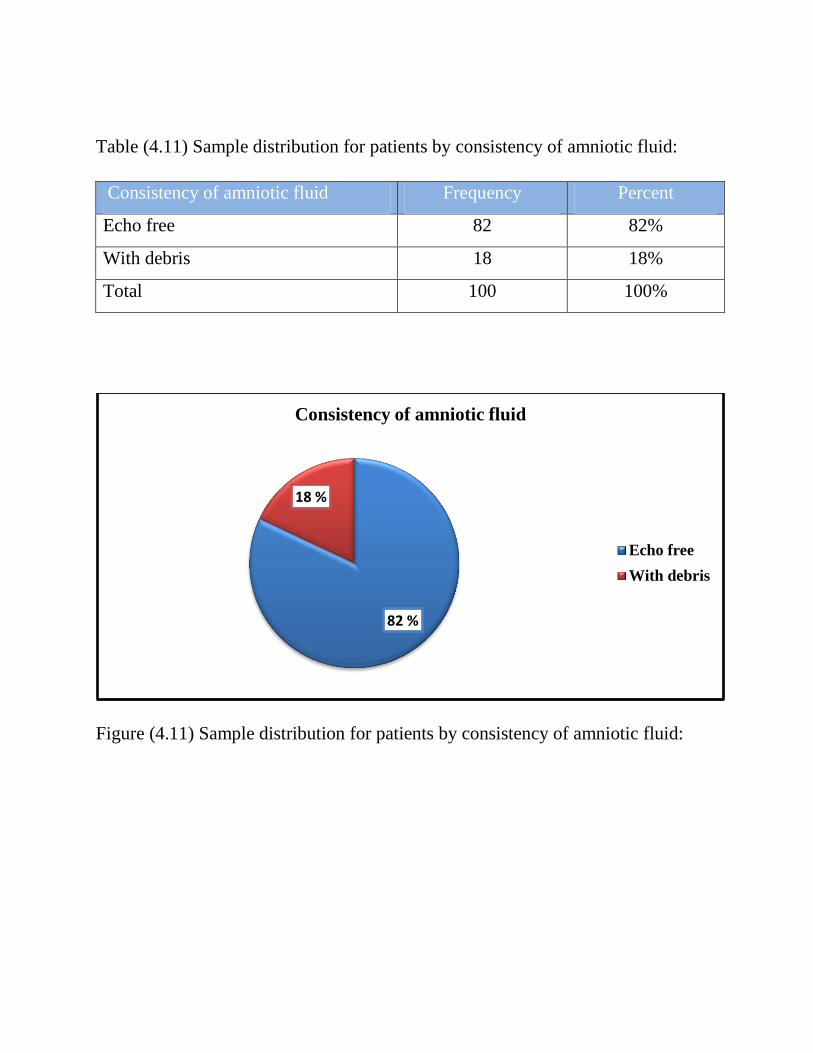
Table (4.11) Sample distribution for patients by consistency of amniotic fluid:
Consistency of amniotic fluid Frequency Percent
Echo free 82 82%
With debris 18 18%
Total 100 100%
Figure (4.11) Sample distribution for patients by consistency of amniotic fluid:
82 %
18 %
Consistency of amniotic fluid
Echo free
With debris

Table (4.12) Sample distribution for patients by fetal macrosomia:
Fetal macrosomia Frequency Percent
Yes 29 29%
No 71 71%
Total 100 100%
Figure (4.12) Sample distribution for patients by fetal macrosomia:
29 %
71%
by fetal macrosomia
Yes
No

Table (4.13) Sample distribution for patients by fetal anomalies:
Fetal anomalies Frequency Percent
Yes 1 1%
No 111 111%
Total 100 100%
Figure (4.13) Sample distribution for patients by fetal anomalies:
.
0%
20%
40%
60%
80%
100%
Yes No
0%
100%
Fetal anomalies
Percent
Chi-Square tests:
1- Chi-Square test for amniotic fluid volume:
o Chi-Square test for amniotic fluid volume and diabetes status:
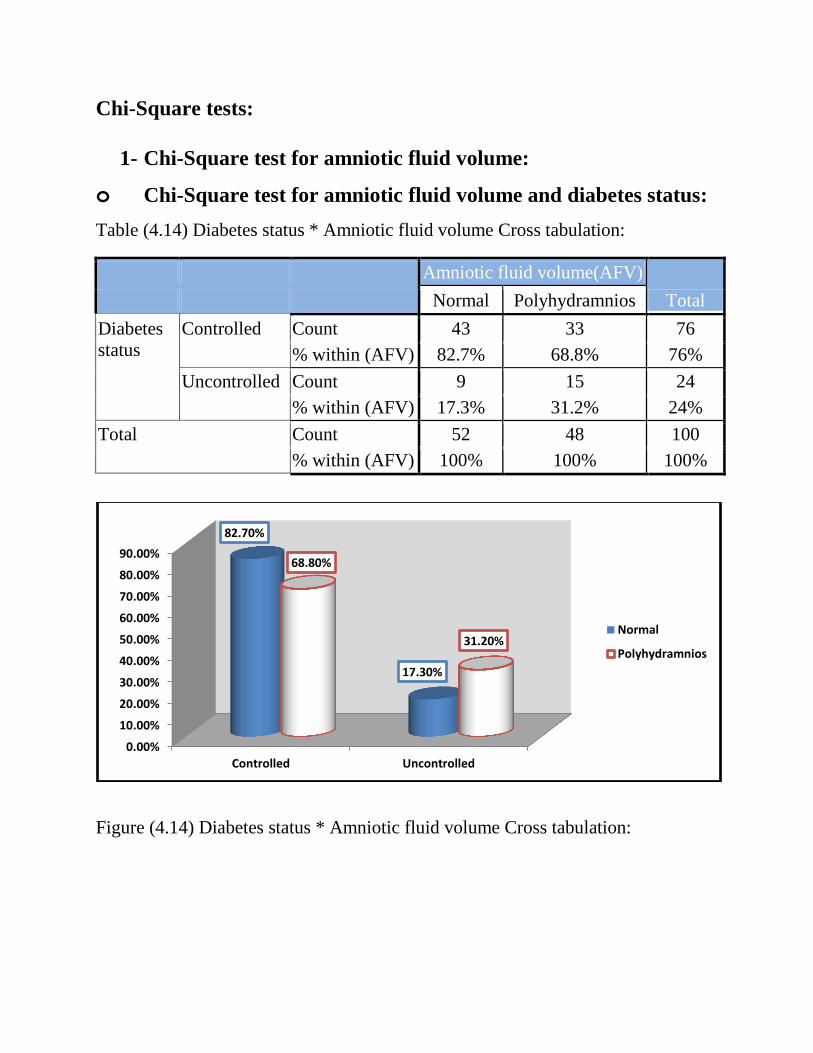
Table (4.14) Diabetes status * Amniotic fluid volume Cross tabulation:
Amniotic fluid volume(AFV)
Total Normal Polyhydramnios
Diabetes
status
Controlled Count 43 33 76
% within (AFV) 82.7% 68.8% 76%
Uncontrolled Count 9 15 24
% within (AFV) 17.3% 31.2% 24%
Total Count 52 48 100
% within (AFV) 100% 100% 100%
Figure (4.14) Diabetes status * Amniotic fluid volume Cross tabulation:
0.00%
10.00%
20.00%
30.00%
40.00%
50.00%
60.00%
70.00%
80.00%
90.00%
Controlled Uncontrolled
82.70%
17.30%
68.80%
31.20% Normal
Polyhydramnios

o Chi-Square test for amniotic fluid volume and history of
polyhydramnios:
Table (4.15) History of polyhydramnios * Amniotic fluid volume (AFV) Cross
tabulation:
Amniotic fluid
volume(AFV)
Total Normal Polyhydramnios
History of
polyhydramnios
Yes Count 8 9 17
% within (AFV) 15.4% 18.8% 17%
No Count 44 39 83
% within (AFV) 84.6% 81.2% 83%
Total Count 52 48 100
% within (AFV) 100% 100% 100%
Figure (4.15) History of polyhydramnios * Amniotic fluid volume Cross
tabulation:
0.00%
20.00%
40.00%
60.00%
80.00%
100.00%
Yes No
15.40%
84.60%
18.80%
81.20%
Normal
Polyhydramnios

o Chi-Square test for amniotic fluid volume and type of diabetes:
Table (4.16) Type of diabetes * Amniotic fluid volume Cross tabulation
Amniotic fluid volume(AFV)
Total Normal Polyhydramnios
Type of
diabetes
Insulin
dependent
Count 18 14 32
% within (AFV) 34.6% 29.2% 32%
Non insulin
dependent
Count 5 10 15
% within (AFV) 9.6% 20.8% 15%
Gestational
diabetes
Count 29 24 53
% within (AFV) 55.8% 50.0% 53%
Total Count 52 48 100
% within (AFV) 100% 100% 100%
Figure (4.16) Type of diabetes * Amniotic fluid volume Cross tabulation
0.00%
10.00%
20.00%
30.00%
40.00%
50.00%
60.00%
Insulin dependent Non insulindependent
Gestational diabetes
34.60%
9.60%
55.80%
29.20%
20.80%
50.00%
Normal
Polyhydramnios

2- Chi-Square test for consistency of amniotic fluid:
Chi-Square test for consistency of amniotic fluid and
amniotic fluid volume:
Table (4.17) Amniotic fluid volume (AFV) * Consistency of amniotic fluid Cross
tabulation
Consistency of amniotic
fluid
Total Echo free With debris
Amniotic
fluid volume
(AFV)
Normal Count 42 10 52
% within Consistency 51.2% 55.6% 52%
Polyhydra-
mnios
Count 40 8 48
% within Consistency 48.8% 44.4% 48%
Total Count 82 18 100
% within Consistency 100% 100% 100%
Figure (4.17) Amniotic fluid volume (AFV) * Consistency of amniotic fluid Cross
tabulation
0.00%
10.00%
20.00%
30.00%
40.00%
50.00%
60.00%
Normal Polyhydramnios
51.20% 48.80%
55.60%
44.40%
Echo free
With debris

3- Chi-Square Test for fetal macrosomia:
Chi-Square test for fetal macrosomia and amniotic fluid volume
(AFV):
Table (4.18) Amniotic fluid volume (AFV) * Fetal macrosonia Cross tabulation
Fetal macrosomia
Total Normal Macrosomia
Amniotic
fluid
volume
(AFV)
Normal Count 42 10 52
% within Fetal 59.2% 34.5% 52%
Polyhydramnios Count 29 19 48
% within Fetal 40.8% 65.5% 48%
Total Count 71 29 100
% within Fetal 100% 100% 100%
Figure (4.18) Amniotic fluid volume (AFV) * Fetal macrosonia Cross tabulation
0.00%
10.00%
20.00%
30.00%
40.00%
50.00%
60.00%
70.00%
Normal Polyhydramnios
59.20%
40.80%
34.50%
65.50%
Normal
Macrosomia

Chi-Square test for fetal macrosomia and diabetes status:
Table (4.19) Diabetes status * Fetal macrosomia Cross tabulation
Fetal macrosomia
Total Normal Macrosomia
Diabetes
status
Controlled Count 55 21 76
% within Fetal 77.5% 72.4% 76%
Uncontrolled Count 16 8 24
% within Fetal 22.5% 27.6% 24%
Total Count 71 29 100
% within Fetal 100% 100% 100%
Figure (4.19) Diabetes status * Fetal macrosomia Cross tabulation
0.00%
10.00%
20.00%
30.00%
40.00%
50.00%
60.00%
70.00%
80.00%
Controlled Uncontrolled
77.50%
22.50%
72.40%
27.60% Normal
Macrosomia
4- Chi-Square test Type of treatment:
o Chi-Square test for type of treatment and diabetes status:
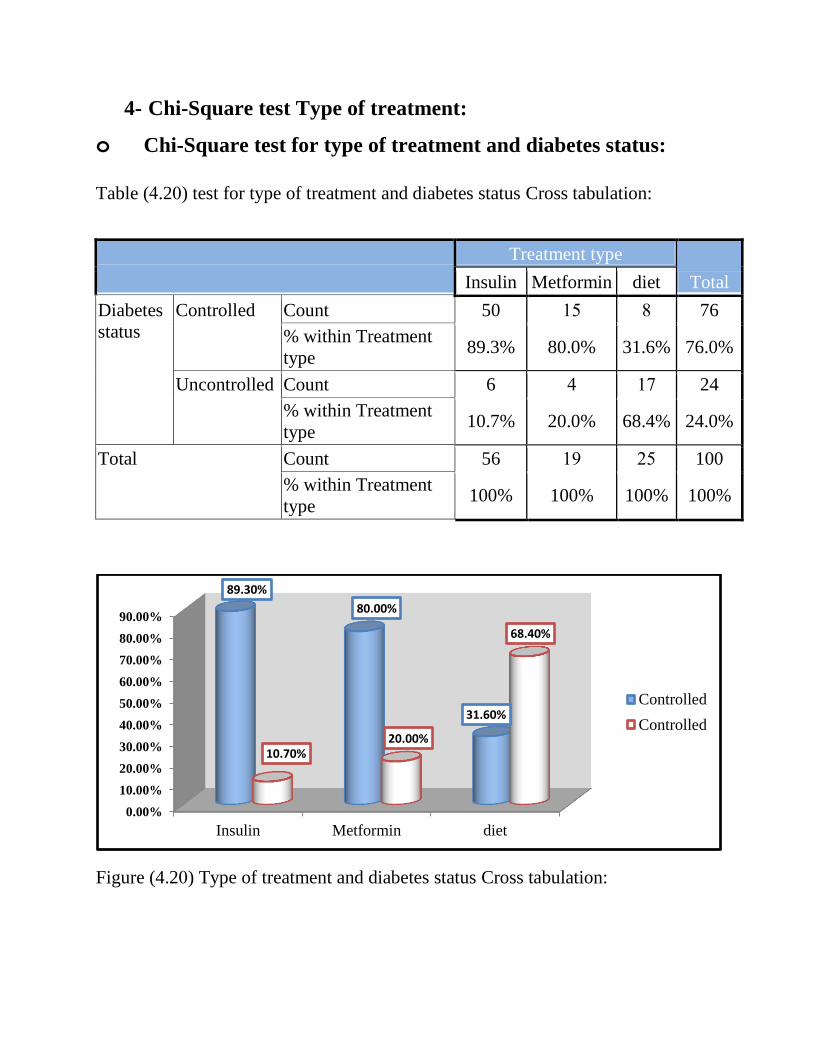
Table (1.21) test for type of treatment and diabetes status Cross tabulation:
Treatment type
Total Insulin Metformin diet
Diabetes
status
Controlled Count 50 15 8 76
% within Treatment
type 89.3% 80.0% 31.6% 76.0%
Uncontrolled Count 6 1 17 24
% within Treatment
type 10.7% 20.0% 68.4% 24.0%
Total Count 56 19 45 100
% within Treatment
type 100% 100% 100% 100%
Figure (4.21) Type of treatment and diabetes status Cross tabulation:
0.00%
10.00%
20.00%
30.00%
40.00%
50.00%
60.00%
70.00%
80.00%
90.00%
Insulin Metformin diet
89.30%
80.00%
31.60%
10.70% 20.00%
68.40%
Controlled
Controlled

o Chi-Square test for type of treatment and amniotic fluid
volume :
Table (4.21) test for type of treatment and amniotic fluid volume Cross tabulation:
Treatment type
Total Insulin Metformin diet
Amniotic
fluid
volume
Normal Count 33 11 8 52
% within Treatment type 58.9% 52.0% 31.6% 52.0%
Polyhydra
-mnios
Count 23 8 17 48
% within Treatment type 41.1% 48.0% 68.4% 48.0%
Total Count 56 19 45 100
% within Treatment type 100% 100% 100% 100%
Figure (4.21) Type of treatment and amniotic fluid volume Cross tabulation:
0.00%
10.00%
20.00%
30.00%
40.00%
50.00%
60.00%
70.00%
Insulin Metformin diet
58.90%
52.00%
31.60%
41.10%
48.00%
68.40%
Normal
Polyhydra-mnios

Independent samples t-test for equality of means:
Table (4.24) Means, and Standard deviations for amniotic fluid volume (4 pockets)
and amniotic fluid volume (SDP) by diabetes status:
Diabetes status N Mean Std.
Deviation
Std. Error
Mean
Amniotic fluid
volume(4 pockets)
Controlled 76 19.03 7.82 0.90
Uncontrolled 24 22.98 7.66 1.56
Amniotic fluid
volume(SDP)
Controlled 76 7.44 2.14 0.25
Uncontrolled 24 8.24 2.21 0.45

CHAPTER FIVE DISCUSSION,conclusion,recommendation
Chapter five
5.1 Discussion
5.1.1 Distribution of sample according to maternal factors (age, type
of diabetes, treatment type, diabetes status):
- From the result we observed the majority of diabetic pregnant
women were among the age group (31 to 40) years which represent 54%
of sample volume, this agree with research done by Rian Omer Massaad
Elbasheer, Sudan University, which was the common affected ages
between(30-34) is 24.5%, and also agree with that done by Moaz
Saliman Hamad Adam, Alzaiem Alazhari University, which was the
majority of diabetic pregnant women were among the age group (31to
40) represent (46%).
- The majority of patients among group of gestational diabetes represent
53% this result was not agree with that finding by both Rian Omer
Massaad Elbasheer, Sudan University, and Moaz Saliman Hamad Adam,
Alzaiem Alazhari University, which were the majority of patients among
the type 1 DM, this different for unknown cause.
- The majority of patients were using insulin for diabetes treatment,
which represent 56% , and this correlation with study conducted by
Moaz Saliman Hamad Adam, Alzaiem Alazhari University, which
represented 54% of patients under insulin treatment.
- Also study found that the majority of patients were well controlled for
DM, which represent 76%, and this agree with that finding by both Rian
Omer Massaad Elbasheer, Sudan University, the common of diabetic status
is control (71.4%), and Moaz Saliman Hamad Adam, Alzaiem Alazhari
University, The majority of diabetic pregnant women were well
controlled from D.M represent (56%) of the sample size.
5.1.2 Distribution and correlation according u/s findings:
study found that 48% of patients had polyhydramnios (abnormal
increase in amniotic fluid volume), and 52% of patients had normal
amniotic fluid volume, There was strong correlation with that result of
Rian Omer Massaad Elbasheer research, Sudan University of science and
technology, MS.c degree in medical Diagnostic Ultrasound, Khartoum,
SUDAN, which represented that the AFI in millimeters in all patients
with diabetes mellitus 26 out of 49 patients had increasing AFV. Also
this result agree with study of Department of Obstetrics and Gynecology,
Kofinas Perinatal and Fertility Institute, New York Methodist Hospital,
Brooklyn, New York, which reported that AFI in normal pregnancies was
less than that in diabetic pregnancies throughout the gestational ages
studied (27–42 weeks). In normal pregnancy, the mean AFI was 14.0 cm
at 27 weeks and decreased to 11.4 cm at 42 weeks (r¼0.25, p¼0.0005),
whereas in diabetic pregnancies, the values remained stable throughout
the gestational ages studied.
Also agree with result of Moaz Saliman Hamad Adam, Alzaiem Alazhari
University, M.Sc degree in medical diagnostic ultrasound, Khartoum,
sudan.2012 which reported that the majority of diabetic pregnant women
were found to had polyhydramnios (abnormal increase in amniotic fluid
volume) which represented (56%) of the sample size.
- From uncontrolled DM patients, the majority were polyhydramnios
which represented 62.5% of uncontrolled group , and 27.6% of these
group had macrosomic fetuses, this agree with Joy Y. Vink MD, Sarah
H. Poggi MD, Alessandro Ghidini MD, Catherine Y. Spong MD, 2007 Result of
research the poorly controlled diabetic population, a linear relationship
existed between AFI and BW centiles (elevated AFI and BW centiles is
linear in diabetic patients with poor glycemic control).
- The most fetuses with macromomia had polyhydramnios which
present 65.5% of macrosomic group, this correlation with Research
Laboratory, Departments of Pediatrics and Obstetrics, University of Alabama
in Birmingham, University of Alabama in Birmingham, University Station,
Birmingham.2011, which reported that amniotic fluid volume appeared to
be related to fetal growth with hydramnios accompanying macrosomia.

5.1.3 Discussion of T-Test:
The mean of amniotic fluid volume (4 pockets) for controlled
group is 19.43 that means the mean of amniotic fluid volume (4 pockets)
is normal for controlled group), and the mean of amniotic fluid volume
(4 pockets) for uncontrolled group is 22.98 (that means the mean of
amniotic fluid volume (4 pockets) is polyhydramnios for uncontrolled
group). And the mean of amniotic fluid volume (SDP) for controlled
group is 7.44 (that means the mean of amniotic fluid volume (SDP) is
normal for controlled group), and the mean of amniotic fluid volume
(SDP) for uncontrolled group is 8.24 (that means the mean of amniotic
fluid volume (SDP) is Polyhydramnios for uncontrolled group).

Conclusion
This study deals mainly with diabetic pregnancies to measure AFV the
concluded that:-
- The commonest type of diabetes in Sudanese pregnant women was type of
gestational diabetes (53%) of sample size. - Most Sudanese pregnant women have abnormally increased of amniotic
fluid volume (polyhydramnios).
- 48% of Sudanese pregnant women have polyhydramnios, while 52% of
sample size has normal amniotic fluid volume.
- 24% from patients they have uncontrolled diabetes status, and 76% from
patients they have controlled diabetes status.
- 17% from patients they have history of polyhydramnios.
- 29% of sample size has macrosomic fetuses (large EFW).
- The mean of amniotic fluid volume (4 pockets) for controlled group is 19.43
(that means the mean of amniotic fluid volume (4 pockets) is normal for
controlled group), and the mean of amniotic fluid volume (4 pockets) for
uncontrolled group is 22.98 (that means the mean of amniotic fluid volume
(4 pockets) is polyhydramnios for uncontrolled group). And the mean of
amniotic fluid volume (SDP) for controlled group is 7.44 (that means the
mean of amniotic fluid volume (SDP) is normal for controlled group), and
the mean of amniotic fluid volume (SDP) for uncontrolled group is 8.24
(that means the mean of amniotic fluid volume (SDP) is Polyhydramnios for
uncontrolled group).
- Diagnostic ultrasound is a good modality for assessing the AFV with high
accuracy and efficiency.
Recommendations With reference to the results and conclusion concerning this research, it’s to be
recommended that:
- Diabetes is a common causes of many maternal and fetal complications during
pregnancy so; special care with special diagnosis and treatment of this problem
should be available.
- Any diabetic pregnant lady should be assess by u/s several scans from 20weeks
up to delivery date (EDD).
- Primary health care centers should be with ultrasound machine.
- All doctors and sonologists should be well training in fetal well-bearing and
mother health , the assessment of fetal well-bearing to decrease the mortality and
morbidity.
- WHO and humanist associations must help for provide the health care centers by
u/s machines and support staff training courses.
- The operators should update their knowledge about techniques used and any
information regarding ultrasound.
- It is recommended that other factors which can effect on accuracy of amniotic
fluid volume and contribute to differences should evaluate in further studies.
- Further studies should be established for effect of diabetes in AFV, placenta,
fetal biometry and fetal weight, employing large samples to confirm these
findings.

References:
1-Devin Dean, Obstetric ultrasound.The Burwin Institute Of Diagnostic medical
Ultrasound; lunenburg,Canada 101 : 135.2005.
2- Phelan JP, Platt LD, Yeh S, Broussard P, Paul RH. The role of ultrasound
assessment of amniotic fluid volume in the management of the postdate pregnancy.
Am J Obstet Gynecol 2004;151(3):304-308.
[http://dx.doi.org/10.1016/0002-9378(85)90291-1].
3- Norman C.smith, A.PatM.smith. obstetric and gynaecological ultrasound.second
edition. 2006: pages 138:143.
4- Trish Chudleigh, BaskyThilagnAthan. obstetric ultrasound (how why and
when). third edition.endburgh London, 2004:pages 144-147.
5- Asim kurjak, Frank A Chervenak. Donald school textbook of ultrasound in
obstetric and gynecology.Second edition, jypee brothers, New York, 2008: pages
536:537.
6- El-Rakhawy. special and general EMBRYOLOGY. Printed in Arab republic of
Egypt. 2008.
7- Brian S Carter, MD, FAAP; Ted Rosenkrantz, MD Professor. Departments of
Pediatrics and Obstetrics/Gynecology, Division of Neonatal-Perinatal Medicine,
University of Connecticut School of Medicine. PediatricPolyhydramnios and
Oligohydramnios :Clinical Presentation. 2012.
8-http://www.ask.com/web?q=Amnion+Membrane&o=102140&qsrc.visit at 15
December 2014. 20:30 pm
9-Stem cells in amniotic fluid show promise. Los Angeles Times. 8 Jan 2007,
retrieved 27 July 2009.
https://en.wikipedia.org/?title=Amniotic_fluid
10- Wallenburg HCS, Wladimiroff JW: The amniotic fluid. II. Polyhydramnios
and oligohydramnios. J Perinat Med 6: 233, 1977 . 14-"Isolation of amniotic stem
cell lines with potential for therapy", Nature Biotechnology 25, 100 - 106 (2007),
Published online: 7 January 2007 | doi: 10.1038/nbt1274, retrieved 27 July 2009.
11- dinaael ,mowa Fe. obstetric simplified .third edition.London ,2004.
12-Magann EF, Isler CM, Chauhan SP, Martin JN Jr. Amniotic fluid volume
estimation and the biophysical profile: a confusion of criteria. Obstet Gynecol
2000; 96:640.
13- Anandakumar C, Biswas A, Arulkumaran S, Wong YC,Malarvishy G, Ratnam
SS. Should assessment of amniotic fluid volume form an integral part of antenatal
fetal surveillance of high risk pregnancy. Aust NZ J ObstetGynaecol 1993;33:272–
275.
14- john C HOBBINS. Obstetric Ultrasound Artistry in Practice. First edition.
Blackwell publishing, Colorado, 2008; pages 20-21.
15- www.pregmed.org/polyhydramnios.htm.visit at 2 January 2015. 10:20 am.
16- www.diabetes .org. visit at 5 January 2015. 11:50 am.
17- www.healthinsite.gov.au. visit at 10 January 2015. 08:50 am.
18-www.diabetes.webmd.com (DavidChelmow).visit at 2 February2015. 11:50
pm.

appendices
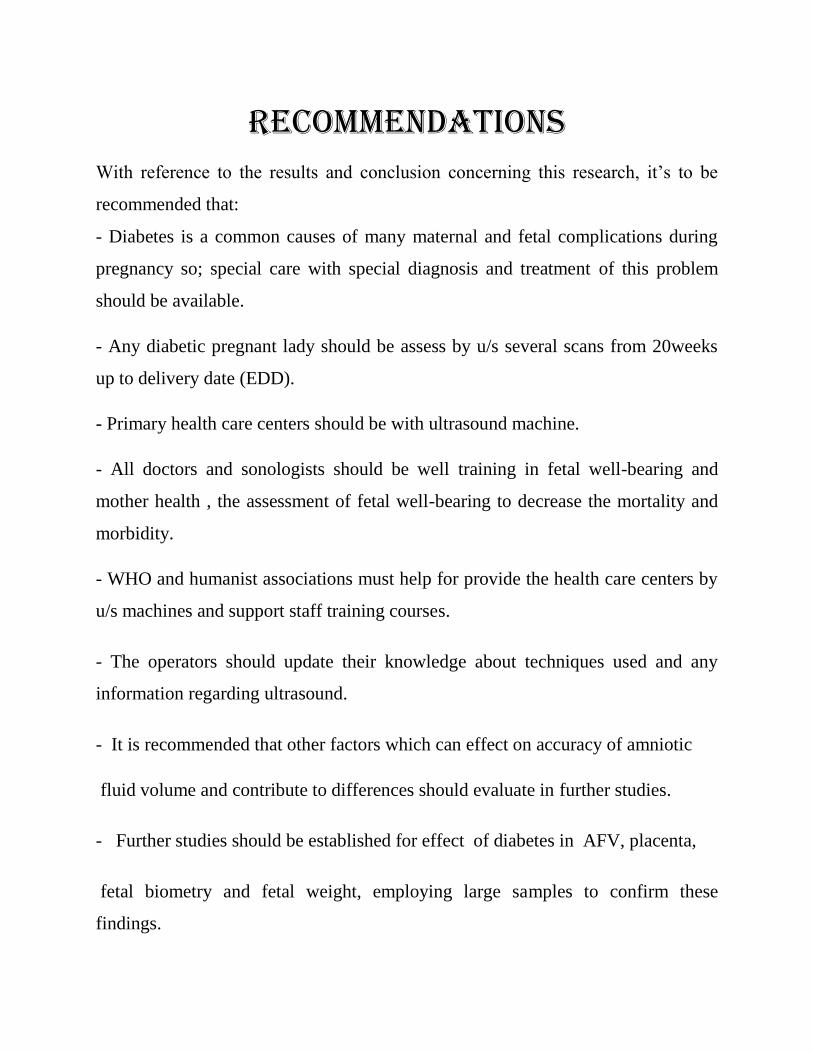
Ultrasound images for amniotic fluid volume:
Figure (1): 25 weeks gestation show polyhydramnios( largest pocket =10.4cm),
Controlled type2 DM.
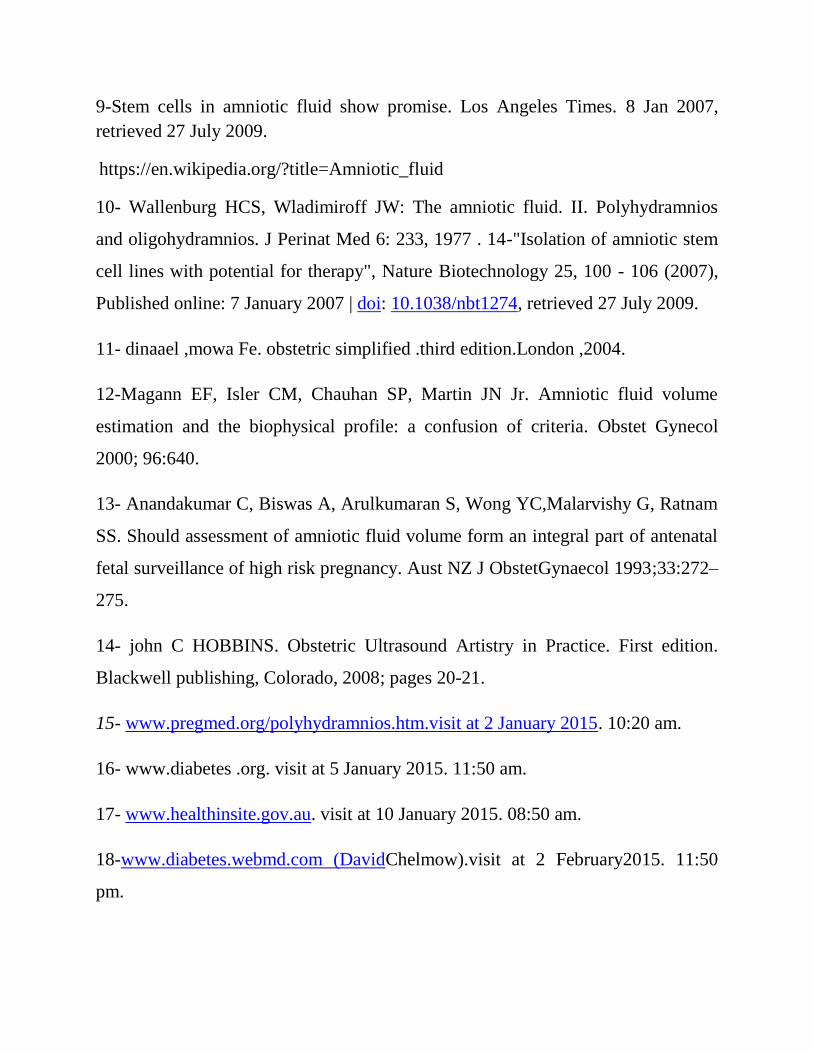
Figure (2): 46 weeks + 1 day gestation show normal amniotic fluid volume of
controlled type 1 DM.
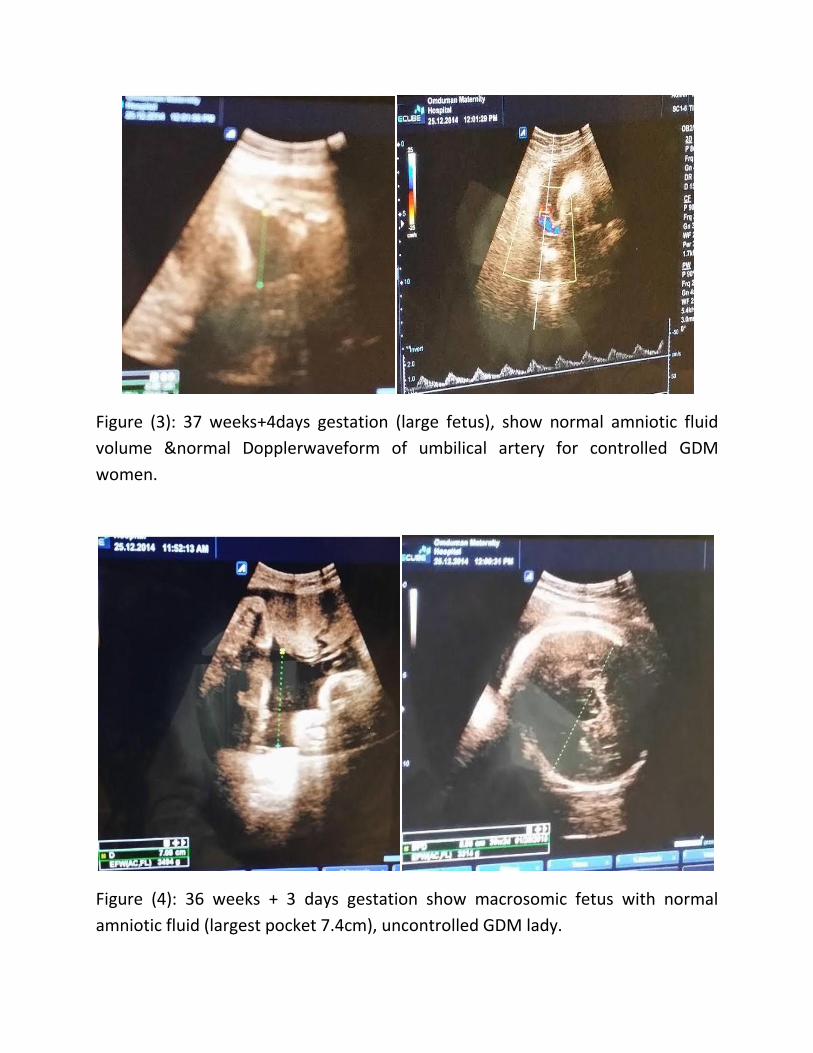
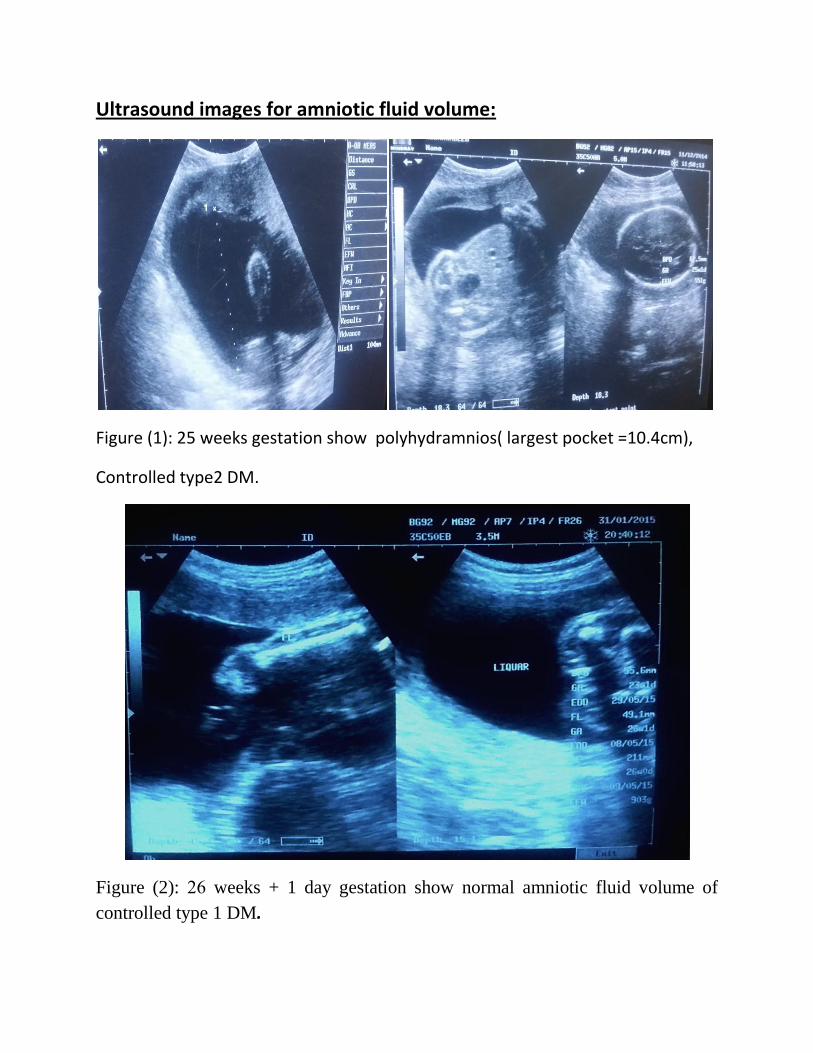
Figure (3): 37 weeks+4days gestation (large fetus), show normal amniotic fluid
volume &normal Dopplerwaveform of umbilical artery for controlled GDM
women.
Figure (4): 36 weeks + 3 days gestation show macrosomic fetus with normal
amniotic fluid (largest pocket 7.4cm), uncontrolled GDM lady.

Figure (5): 38weeks+2days gestation show polyhydramnios (SDP=9.5CM) ,
uncontrolled GDM lady.

Figure (6): 34 weeks gestation with normal amniotic fluid volume, (SDP= 4.6CM)
controlled type2 DM lady.
Figure (7): 35 weeks+5days gestation (male) show polyhydramnios with debris,
uncontrolled GDM lady.
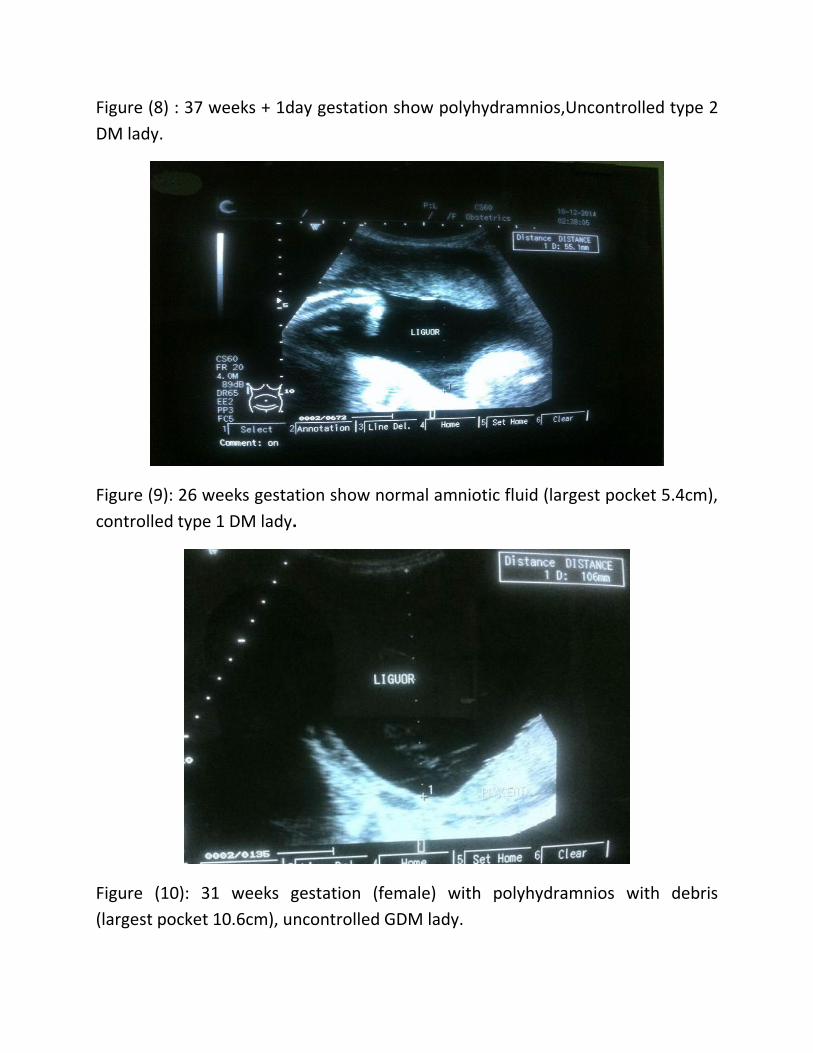
Figure (8) : 37 weeks + 1day gestation show polyhydramnios,Uncontrolled type 2
DM lady.
Figure (9): 26 weeks gestation show normal amniotic fluid (largest pocket 5.4cm),
controlled type 1 DM lady.
Figure (10): 31 weeks gestation (female) with polyhydramnios with debris
(largest pocket 10.6cm), uncontrolled GDM lady.

Figure (11): 25 weeks+2days gestation show normal amniotic fluid (SDP= 6.7CM)
of controlled type2 DM women.

Figure (12): 37 weeks+5days gestation show polyhydramnios )largest 11.4 cm),
uncontrolled type 2 DM Lady.
Figure (13): 33 weeks gestation show polyhydramnios( SDP=11.4cm), controlled
type 1 DM ( multiparous with history of polyhydramnios).
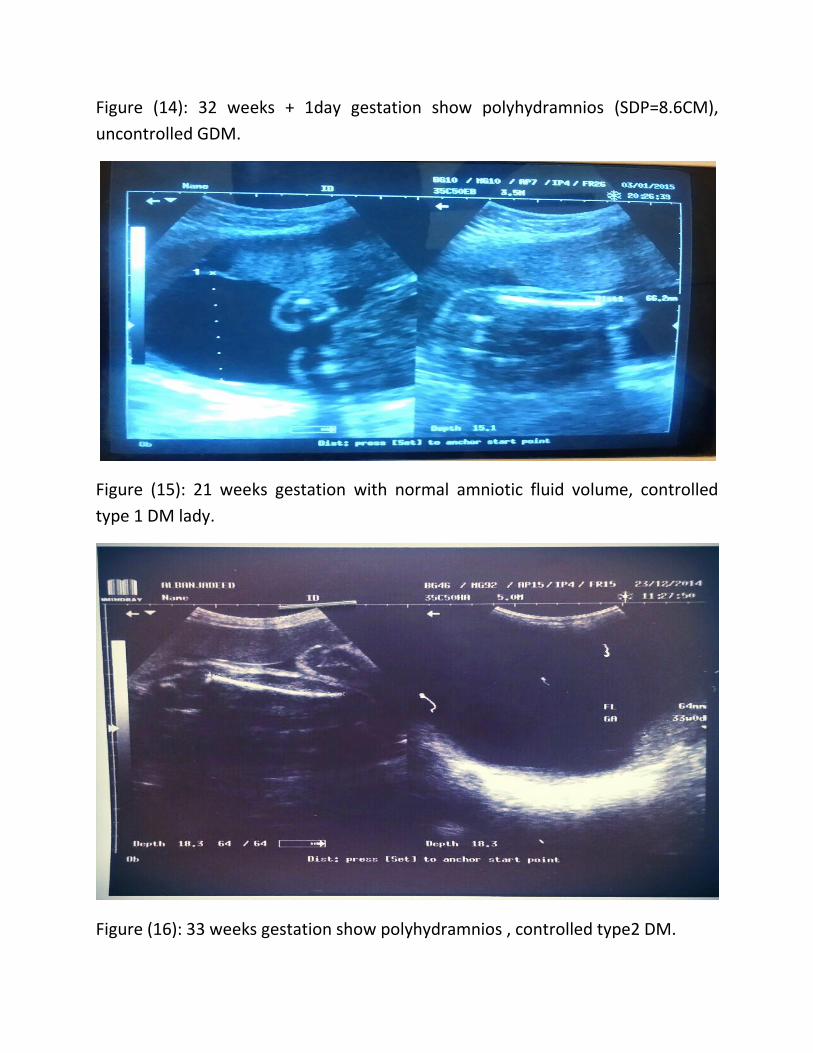
Figure (14): 32 weeks + 1day gestation show polyhydramnios (SDP=8.6CM),
uncontrolled GDM.
Figure (15): 21 weeks gestation with normal amniotic fluid volume, controlled
type 1 DM lady.
Figure (16): 33 weeks gestation show polyhydramnios , controlled type2 DM.

Figure (17): 37 weeks + 3daysgestation with normal amniotic fluid volume and
consistency of controlled type 1 DM.

Figure (18): 37 weeks + 3 days gestation show polyhydramnios of uncontrolled
GDM.
Figure (19): 41 weeks gestation with polyhydramnios (macrosomic fetus),
Controlled type 2 DM lady.
Figure (20): 32 weeks gestation show polyhydramnios (largest pocket=9.07cm),
Controlled GDM lady.

Figure (21): 29 weeks gestation (normal AFI) , controlled type 1 DM.
Figure (22): 31 weeks gestation show normal liquor volume and normal Doppler
flow, of controlled GDM.

Figure (23): 38 weeks + 6 days gestation with normal amniotic fluid volume and
normal Doppler flow, controlled type 1 DM lady.
Figure (24): 32 weeks gestation show polyhydramnios, uncontrolled GDM lady.

Figure (25): 27 weeks + 3 days gestation show polyhydramnios of uncontrolled GD
women.
Figure (26): 24 weeks gestation (polyhydramnios), uncontrolled type2 DM.

Figure (27): 41 weeks gestation show polyhydramnios of controlled type1 DM
lady.
Figure (28): 26 weeks gestation (male) show polyhydramnios, controlled GDM
lady .

Figure (29): 21 weeks+ 3 days gestation with polyhydramnios , controlled type1
DM.
Figure (30): 37 weeks gestation show polyhydramnios with debris, Controlled
Type 2 DM lady.

The National Ribat University
Faculty of Graduate Studies and Scientific Research
Data Collection Sheet
Sonographic Evaluation of Amniotic Fluid Volume in Diabetic Pregnant women
During 2nd & 3rd Trimesters in Khartoum State
Patient Number:(………). Date:......\......\2015.
1-Patient age: (………) Years.
2-Patient weight: (……….) Kg.
3-Type of DM:
Type 1(………..). Type 2(...……..)= medication (……………………..).
4-Duration of DM: (…………………...).
5-Diabetes status:
Controlled (……..). Uncontrolled (………).
6- History of polyhydramnios:
Yes (……………...). No (………………..).
7- Parity status: G (……...), P (…………).
8- Gestational Age :(…….………….) weeks. BPD (………...….), FL (………..……), AC (…….….……).
9- Amniotic fluid volume: SDP (………………). 4 pockets (…………….).
Normal (……….…) Polyhydramnios (……….).
10- Consistency of amniotic fluid:
Echo free (………..). With debris (………).
11- EFW :(………..…) kg.
Normal (……….) Macrosomia (………).
12- Congenital fetal anomalies:
Yes (……….) No (……………..)