Investigating the structural properties of hydrophobic solvent ...

Solvent effects on two-line atomicfluorescence of indium
Qing N. Chan,1,2,* Paul R. Medwell,1,3 Peter A. M. Kalt,1,3 Zeyad T. Alwahabi,1,2
Bassam B. Dally,1,3 and Graham J. Nathan1,3
1Centre for Energy Technology, The University of Adelaide, Adelaide, South Australia 5005, Australia2School of Chemical Engineering, The University of Adelaide, Adelaide, South Australia 5005, Australia
3School of Mechanical Engineering, The University of Adelaide, Adelaide, South Australia 5005, Australia
*Corresponding author: [email protected]
Received 19 August 2009; revised 18 January 2010; accepted 8 February 2010;posted 12 February 2010 (Doc. ID 115963); published 4 March 2010
We aim to investigate the potential of four different organic solvents, namely, acetone, ethanol, methanol,and isopropanol, and the organic-solvent–water mixtures as a seeding medium for the two-line atomicfluorescence technique. Water is used as the reference case. Indium, which has been previously shown tohave suitable spectroscopic attributes, is chosen as the thermometry species in the present study. Acetoneand methanol are shown to enhance the fluorescence signal intensity the most (approximately threefoldto fivefold at stoichiometric conditions) when used. Acetone andmethanol are shown to improve the fluor-escence emission over the entire stoichiometric envelope of flame, most significantly in the rich combus-tion region, as well as a twofold enhancement in the signal-to-noise ratio. © 2010 Optical Society ofAmerica
OCIS codes: 120.1740, 120.6780, 300.2530.
1. Introduction
While many parameters are of fundamental impor-tance to combustion systems, temperature remainsone of the most dominant factors. The temperatureof a flame characterizes the heat transfer processand controls many of the important chemical andphysical processes. Information on the temperaturefield distribution in combustion systems provides im-portant input for the improvement of theoreticalmod-els and the optimization of practical combustiondevices. This information is required at a temporal re-solution comparable with the time scales of the com-bustion processes under investigation. It is alsodesirable that the data be at least of a two-dimen-sional nature.Laser diagnostics can provide in situ instanta-
neous, nonintrusive, and temporally and spatiallyprecise quantitative temperature measurements un-
rivaled by alternative methods. A variety of laser-based thermometry techniques have been developed;however, most of these are limited to clean combus-tion environments and have not been optimized tooperate in the presence of particles, such as dust,coal, or biomass, with soot being one of the most chal-lenging. This limits the capacity to investigate andunderstand many systems of practical significance.Therefore, there is a need for development of laser-based thermometry techniques that are suitablefor application in particle-laden environments.
One of the most experimentally simple, yet useful,laser thermometry techniques is Rayleigh scattering[1]. However, due to the elastic nature of the process,Rayleigh scattering is limited to very clean, particle-free situations. Filtered Rayleigh scattering hasbeen developed to mitigate this interference, but re-mains impractical in highly particle-laden flows [2–4]. Raman-based thermometry has greater capacityto avoid interference from scattering, with coherentanti-Stokes Raman spectroscopy (CARS) being one of
0003-6935/10/081257-10$15.00/0© 2010 Optical Society of America
10 March 2010 / Vol. 49, No. 8 / APPLIED OPTICS 1257

the most widely used [5]. CARS is more applicable toluminous and particle-laden flow than most othertechniques. However, it has other limitations, suchas experimental complexity, and a lack of spatial fi-delity compared with other planar techniques [1,6].Among the laser spectroscopic techniques em-
ployed in combustion science, laser-induced fluores-cence (LIF) is probably the most widely applied [1].LIF can be used for temperature measurements, of-fering stronger signals than those from Raman sys-tems. The temperature is deduced from the speciespopulation according to Boltzmann distribution.LIF thermometry hasmost commonly been employedto probe in situ flame radical OH or seeded NO [7–9].However, the narrow range of temperature and mix-ture fraction overwhichOHexists in a flame limits itsgeneral application for thermometry [10]. Likewise,NO-LIF has limitations because it can suffer frombackground interferences in the presence of soot [9].A number of two-line techniques have been pro-
posed and used for different diagnostic purposes.For aqueous systems, the use of two different laserdyes has been proposed [11]. For simultaneous ther-mometry and velocimetry, the use of liquid crystalshas also been proposed [12]. Two-line phospho-rescence using ZnO:Zn and ZnO:Ga has also beenreported, with claims of short lifetimes enabling areduction in background interference [13]. Visualiza-tion of the gas temperature distribution aroundflames with the use of two-color LIF has also been re-cently suggested [14].However, the feasibility of thesetechniques in practical flame diagnostics is yet to bedemonstrated.Two-line atomic fluorescence (TLAF) is a two-line
technique that offers promise to be a high-quality toolfor temperature measurements in sooting and parti-cle-laden flames [1,15]. TLAF is a laser-based thermo-metry technique that has many similarities to otherLIF-based techniques, but utilizes a seeded atomicspecies. TLAF involves sequential shifted measure-ments of the Stokes and anti-Stokes direct-line fluor-escence produced from the optical excitation of athree-level system. The flame temperature is subse-quently deduced from the ratio of the two fluorescencesignals. The frequency shift of the TLAF techniqueenables filtering to minimize interference from spur-ious scattering, allowing measurements to be per-formed in sooty environments. To provide goodsensitivity over the temperature range encounteredin flames, indium atoms are typically used as theseeded atomic species for TLAF [16–18]. With somenotable exceptions [19], indium has previously beenseeded into the flame as indium chloride dissolvedin water.Despite the potential of the TLAF technique,
previous TLAF studies have been limited by poor sig-nal-to-noise ratio (SNR), thus preventing single-shotmeasurements. The limitation of measuring meantemperature is acceptable in the context of laminarpremixed flames; however, such average data are in-sufficient for study ofmore dynamic turbulent flames.
With a view to improving the SNR and, hence, the ac-curacy of the TLAF measurements, the possibility ofextending the technique into the nonlinear excitationregime has been examined by the authors [20]. Thenonlinear regime TLAF (NTLAF) was shown to pro-vide a superior signal relative to the conventional lin-ear TLAF, leading to a significant reduction of single-shot uncertainty. The present work aims to furtherimprove the signal quality of the NTLAF technique.
The use of organic solvents to enhance spectral lineemission in flame photometry was first reported byBerry et al. [21] and has since been widely appliedto various flame spectroscopic techniques involvingthe utilization of flames to convert dissolved samplesinto optically active entities. A number of previousstudies have investigated the effects of the variousphysical and chemical parameters involved in the en-hancement of the spectral line emission with the useof organic solvents in place of water as the seedingmedium [22–25]. The physical effects influence therelease rate of the solute into flame by factors suchas the rate of evaporation of the droplets and the dro-plet size distribution. The chemical effects of the or-ganic solvent influence the flame temperature andchemical kinetics directly through the combustionof the solvent in flame. The aim of these previous in-vestigations has been to optimize the spectroscopictechniques by the combined physical and chemicaleffects of the organic solvents. These previous studieshave focused on the improvement of the detection ofthe samples delivered to the flames, which are oftenonly available in micro quantities.
The present study aims to investigate the potentialto improve the signal quality of the NTLAF indiumfluorescence images by the use of an organic solventto replace water as seeding medium. It aims to ex-ploit the physical effects of the organic solvent, witha secondary benefit of providing a small positive che-mical influence of the solvent introduced on the prop-erties (in particular the temperature) of the flame.These influences are explored for acetone, isopropa-nol, methanol, and ethanol, following earlier work toenhance emission in flame photometry [25]. In addi-tion to the effect of the pure organic solvents, it aimsto investigate the influence of mixtures of the organicsolvent with water on the fluorescence signal. Thestudy then aims to assess the influence of flame stoi-chiometry on fluorescence signal and on SNR forthose organic solvents that are found to have per-formed most favorably. The fluorescence signal ob-tained with water as the solvent is used as thereference measurement. A laminar premixed flameis used to provide a uniform flame medium and toavoid the complexities associated with the use ofturbulent and/or nonpremixed flames.
2. Methodology
A. Nonlinear Regime TLAF
For the present study, the species of interest is neu-tral atomic indium (the TLAFactive species). Indium
1258 APPLIED OPTICS / Vol. 49, No. 8 / 10 March 2010

is an attractive thermometry species because it has agood sensitivity over the 800 to 2800K temperaturerange, covering most practical combustion scenarios[17]. In addition, both the excitation and detectionwavelengths of indium are within the visible range(410.18 and 451:13nm), where the interferencesfrom the hydrocarbons and other natural combustionspecies are less pronounced [26].The three energy levels of indium relevant to TLAF
are shown in Fig. 1. The Stokes process requires410:18nm laser excitation (52P1=2 → 62S1=2 transi-tion), and the subsequent fluorescence (62S1=2 →
52P3=2 transition) is detected at 451:13nm. Theanti-Stokes process uses 451:13nm excitation(52P3=2 → 62S1=2 transition) and 410:18nm detection(62S1=2 → 52P1=2 transition). A full description of theTLAF theory, especially incorporating the NTLAF,has been presented in a previous publication [20].In brief, for the NTLAF method, it has been shownthat the temperature may be determined as follows:
T ¼ ΔE10=k
ln�F21 ×
�1þ CS
I20
��− ln
�F20 ×
�1þ CA
I21
��þ CT
:
ð1ÞHere,E10 is the energy difference between levels, F isthe fluorescence intensity, and I is the incident laserenergy. The other terms are constants. CS and CA arederived experimentally from the fluorescence versusirradiance plot for the two excitation schemes, whileCT is determined via calibration in a premixed flame.The subscripts refer to the transition between theenergy levels (Fig. 1).It has previously been shown that the calibration
constants are independent of the fuel type and flamecomposition, within experimental uncertainty, for arange of premixed flames [20]. Given this indepen-dence from composition, it is anticipated that thetechnique will be applicable across the reaction zoneof nonpremixed flames.
B. Transformation of Indium during its PassageThroughout the Flame
The process involved in the generation of neutral in-dium atoms from indium chloride solution are attrib-uted to the following steps [22,23,27–29].
a. Disintegration of the seeding solution: an aero-sol of droplets is formed from the nebulization of theseeding solution.
b. Desolvation of the droplets: the droplets areheated in the flame where the solvent is evaporatedto form various metal complexes. Single ions and mo-lecules are predominantly formed from the desolva-tion of the droplets with low solute concentration,while salt and ion clusters are predominantly formedfrom the desolvation of droplets with high soluteconcentration. Neutral or ionizedmolecules and frag-ments are subsequently released from the decompo-sition of the clusters.
c. Gas phase ion/molecule and anion/cationrecombination reactions: the desolvated ions and mo-lecules undergo different reactions, such as electron–ion recombination in the gas phase to formavariety ofspecies with competing equilibria. These reactionsare highly localized within the flame and are depen-dent on temperature and the chemical reactionswith-in the region [30].
The species of interest, namely, neutral indiumatom, is subsequently excited via laser irradiancewith a species-specific wavelength.
Despite the complexity of the processes involvedin the generation of neutral indium atoms in gasphase, the number of the thermally excited atomswithin the probe volume can be well described bythe Maxwell–Boltzmann distribution law [22,24]:
N�∝ N exp
�−
EkT
�: ð2Þ
Here, the concentration of the neutral atoms in theexcited state, N�, is governed by the concentrationof the neutral atoms in the ground state, N, andthe temperature of the flame, T. The ground-stateconcentration of the neutral atoms within the probevolume is influenced by the effective supply of the so-lute to flame. The increase in the effective supply ofthe solute is brought about by factors such as im-proved nebulizer performance and increased solventevaporation rate from the droplets. The change intemperature of the flame is directly influenced bythe combustion of the seeding solution that is intro-duced with the solute [23,25].
C. Ultrasonic Nebulization
For the present study, an ultrasonic nebulizer is usedto disintegrate the seeding solution into an aerosol ofdroplets. The electronically driven nebulizer utilizesultrasonic vibrations, whose energy is derived fromthe piezoelectric transducer [31], to generate un-stable surface waves at the liquid–air interface.The liquid sheet is fragmented and subsequently re-leased into the surrounding air as very fine droplets[31–34]. This disintegration technique is character-ized by fine droplets with a quite uniform size distri-bution. An empirical equation to estimate the dropletsize from the ultrasonic nebulizer is described byLang [32]:Fig. 1. Indium energy transitions employed in TLAF.
10 March 2010 / Vol. 49, No. 8 / APPLIED OPTICS 1259
D ¼ 0:34
�8πσρF2
�1=3
: ð3Þ
Here, D is the median diameter of the droplets, F isthe exciting frequency of the ultrasonic nebulizer, σ isthe surface tension, and ρ is the density of the liquid.Lang’s correlation indicates no dependence of thedroplet size on the liquid phase viscosity, whichmay be contrary to a number of experimental obser-vations [31,35]. However, previous study has shownthat Lang’s correlation provides a reasonably accu-rate estimation when the effect of the liquid viscosityon the droplet size is negligible [33].
3. Experimental Setup
A. Experimental Overview
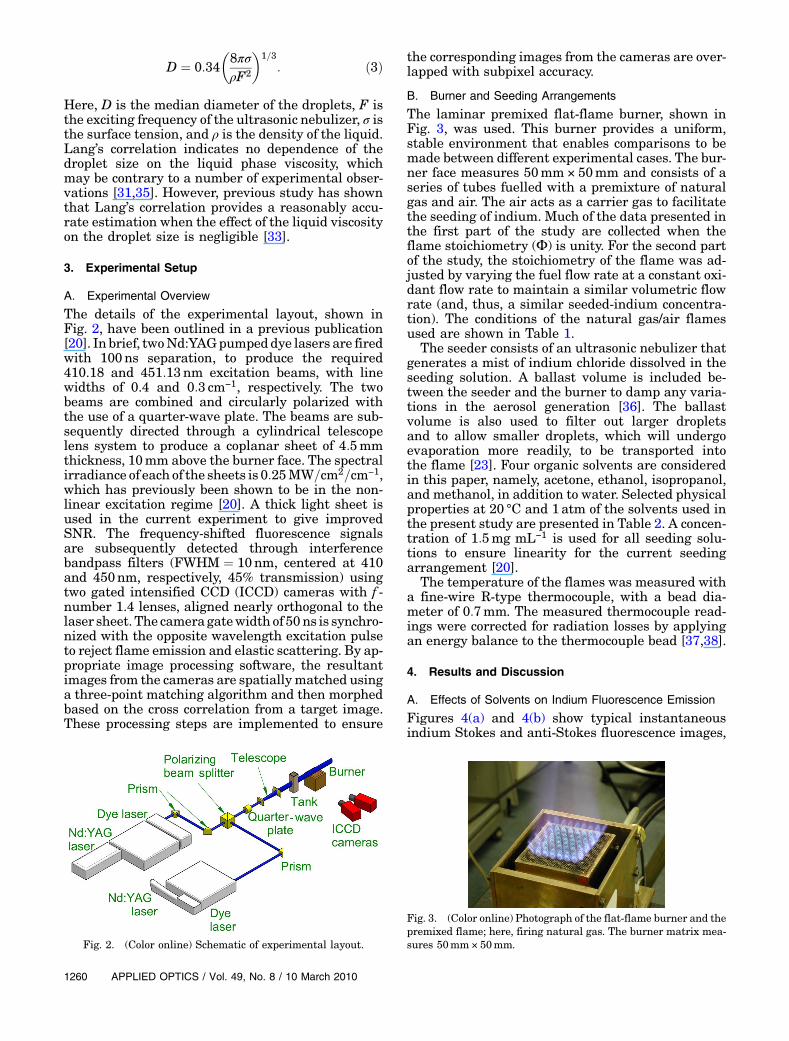
The details of the experimental layout, shown inFig. 2, have been outlined in a previous publication[20]. In brief, twoNd:YAGpumpeddye lasers are firedwith 100ns separation, to produce the required410.18 and 451:13nm excitation beams, with linewidths of 0.4 and 0:3 cm−1, respectively. The twobeams are combined and circularly polarized withthe use of a quarter-wave plate. The beams are sub-sequently directed through a cylindrical telescopelens system to produce a coplanar sheet of 4:5mmthickness, 10mm above the burner face. The spectralirradiance of each of the sheets is0:25MW=cm2=cm−1,which has previously been shown to be in the non-linear excitation regime [20]. A thick light sheet isused in the current experiment to give improvedSNR. The frequency-shifted fluorescence signalsare subsequently detected through interferencebandpass filters (FWHM ¼ 10nm, centered at 410and 450nm, respectively, 45% transmission) usingtwo gated intensified CCD (ICCD) cameras with f -number 1.4 lenses, aligned nearly orthogonal to thelaser sheet. The cameragatewidth of50ns is synchro-nized with the opposite wavelength excitation pulseto reject flame emission and elastic scattering. By ap-propriate image processing software, the resultantimages from the cameras are spatiallymatched usinga three-point matching algorithm and then morphedbased on the cross correlation from a target image.These processing steps are implemented to ensure
the corresponding images from the cameras are over-lapped with subpixel accuracy.
B. Burner and Seeding Arrangements
The laminar premixed flat-flame burner, shown inFig. 3, was used. This burner provides a uniform,stable environment that enables comparisons to bemade between different experimental cases. The bur-ner face measures 50mm × 50mm and consists of aseries of tubes fuelled with a premixture of naturalgas and air. The air acts as a carrier gas to facilitatethe seeding of indium. Much of the data presented inthe first part of the study are collected when theflame stoichiometry (Φ) is unity. For the second partof the study, the stoichiometry of the flame was ad-justed by varying the fuel flow rate at a constant oxi-dant flow rate to maintain a similar volumetric flowrate (and, thus, a similar seeded-indium concentra-tion). The conditions of the natural gas/air flamesused are shown in Table 1.
The seeder consists of an ultrasonic nebulizer thatgenerates a mist of indium chloride dissolved in theseeding solution. A ballast volume is included be-tween the seeder and the burner to damp any varia-tions in the aerosol generation [36]. The ballastvolume is also used to filter out larger dropletsand to allow smaller droplets, which will undergoevaporation more readily, to be transported intothe flame [23]. Four organic solvents are consideredin this paper, namely, acetone, ethanol, isopropanol,and methanol, in addition to water. Selected physicalproperties at 20 °C and 1atm of the solvents used inthe present study are presented in Table 2. A concen-tration of 1:5mg mL−1 is used for all seeding solu-tions to ensure linearity for the current seedingarrangement [20].
The temperature of the flames was measured witha fine-wire R-type thermocouple, with a bead dia-meter of 0:7mm. The measured thermocouple read-ings were corrected for radiation losses by applyingan energy balance to the thermocouple bead [37,38].
4. Results and Discussion
A. Effects of Solvents on Indium Fluorescence Emission
Figures 4(a) and 4(b) show typical instantaneousindium Stokes and anti-Stokes fluorescence images,
Fig. 2. (Color online) Schematic of experimental layout.
Fig. 3. (Color online) Photograph of the flat-flame burner and thepremixed flame; here, firing natural gas. The burner matrix mea-sures 50mm× 50mm.
1260 APPLIED OPTICS / Vol. 49, No. 8 / 10 March 2010

respectively, from the laminar premixed natural gasflat flame, collected simultaneously under a laserspectral irradiance of 0:25MW=cm2=cm−1. Each im-age has been spatially matched and corrected forbackground and detector attenuation. The imagesare ∼20mm high and 50mm wide, centered at a20mm height above burner (HAB). All data is ex-tracted from the central region, as indicated by thedashed area in Fig. 4, where the indium fluorescenceis most uniform.
1. Fluorescence—Solvents
To assess the physical effects of the solvents on thespectral line emission, Fig. 5 presents the data ob-tained from a 150-shot average of both the Stokesand anti-Stokes fluorescence for the solvents se-lected. As a reference, the fluorescence signals arenormalized with respect to the fluorescence signal re-corded when water is used. The concentration of theindium salt was maintained at 1:5mg mL−1 for all
the seeding solutions used. This ensures that anychange in the indium fluorescence observed is solelya function of the solvent used, rather than an effect ofdiffering indium salt concentration within the sol-vents. Additionally, the flame stoichiometry wasmaintained at unity during the course of the experi-ment. This makes certain that any change in thefluorescence signal can be attributed entirely tothe physical effects, i.e., negligible chemical influenceon the properties of the flame. Thermocouple mea-surements show that the flame temperature variesby less than 40K with the different solvents, elimi-nating any influence of this parameter on the fluor-escence emission.
From Fig. 5, it is apparent that there is a threefoldto fivefold gain in fluorescence signal, when organicsolvents (excluding isopropanol) are used instead ofwater. Acetone and methanol, in particular, are ob-served to have intensified the fluorescence emissionthe most. The increase in the emission when organicsolvents are used can be explained by the dependence
Table 1. Premixed Flat-Flame Conditions
Mode Fuel Stoichiometry (Φ) Bulk Velocity (m/s) Temperature (K)
Premixed Natural gas 0.91–1.80 0.27–0.29 1665–2165
Table 2. Selected Physical Properties of Solvents at 20 °C and 1 atm and Median Diameters of the ResultantDroplets Estimated Using Lang’s Correlation
Solvent Vapor Pressure (kPa) Density (kg m−3) Viscosity (cP) Surface Tension (mN m−1) Polarity index Diameter (μm)
Acetone 24 790 0.32 25 5.1 2.21Ethanol 5.9 789 1.18 22 4.3 2.12Isopropanol 4.4 786 2.27 21 3.9 2.09Methanol 12.3 792 0.58 23 5.1 2.15Water 2.3 1000 1.00 73 10.2 2.92
Fig. 4. (Color online) Typical instantaneous images of (a) Stokesand (b) anti-Stokes fluorescence in a laminar premixed natural gasflat flame. Dashed area indicates data extraction area. Laser pro-pagates from left to right. HAB, height above burner.
Fig. 5. (Color online) Normalized indium Stokes and anti-Stokesfluorescence for five different seeding solutions: A, acetone; E,ethanol; I, isopropanol; M, methanol, andW, water, for a flame stoi-chiometry of 1.0.
10 March 2010 / Vol. 49, No. 8 / APPLIED OPTICS 1261
of the nebulizer performance on the viscosity and thesurface tension of the solutions [39]. Organic solvents,such as acetone, ethanol, and methanol, have lowerviscosity and surface tension values than water(Table 2). This eases thedisintegration process, allow-ing droplets with smaller sizes (Table 2) to be gener-ated at a more rapid rate. The droplet sizes areestimated using Lang’s correlation (Eq. (3)). Sindayi-hebura et al. [33] have shown that the effect of liquidviscosity on the diameters of the droplets is negligiblefor the methanol–water and glycerol–water mixturesused in their investigation. This, combined with theknowledge that the estimated values are well withinthe range of droplet sizes (1–5 μm) typically generatedfrom ultrasonic nebulization [31], justifies the use ofthe Lang correlation for the present study. Addition-ally, these organic solvents have a higher vapor pres-sure than water (Table 2), making the resultantdroplets more evaporative and hence leading to a re-duction in the amount of droplets persisting into theflame [22]. Together, these factors enhance the disin-tegration and desolvation process and, hence, the ef-fective supply of the solute, namely indium chloride,into the flame. The increase in the effective supply ofthe solute leads to an increase in the concentration ofindium species in flame. This explains the strongerfluorescence emission observed.It is also interesting to note that, even though iso-
propanol has more favorable physical properties(lower surface tension and higher vapor pressure)than water (Table 2), Fig. 5 shows a drop in the fluor-escence emission when isopropanol is used in place ofwater. The drop in the emission can be explained bythe low solubility of the polar indium salt in isopro-panol. The nonpolarity of isopropanol, as indicatedby the low polarity index [40] in Table 2, is respon-sible for this low solubility and leads to a reductionin the transportation of the solute into the flame andhence also the fluorescence emission. This finding in-dicates that there are limits to the types of organicsolvent that can be used to enhance the fluorescenceemission from the flame due to the polar nature ofthe indium chloride salt.
2. Fluorescence—Organic-Solvent–Water Mixtures
The TLAF process is affected by a combination of pro-cesses (Section 2) that produce the TLAF active spe-cies. Most of these processes utilize little heat ascompared with the heat released in a combustion re-action [19,23]. An exception to these processes is des-olvation, which can consume a significant fraction ofthe heat content, leading to a 100–150K cooling ofthe flame [15,20]. This reduction in the flame tem-perature is significant and will change the combus-tion processes, so should be avoided if possible.The indium Stokes and anti-Stokes fluorescence
are plotted as a function of the volume fraction forthe organic solvents within the seeding solution. Thisis to investigate the feasibility of using an organic-solvent–water mixture whose enthalpy of reaction
matches the latent heat of vaporization and also pro-vides a reasonable gain in fluorescence signal. To as-sess this, the volume fraction of the organic solventand distilled water within the seeding solution werevaried. Again, the concentration of the indium saltwithin the seeding solution was maintained at1:5mg mL−1.
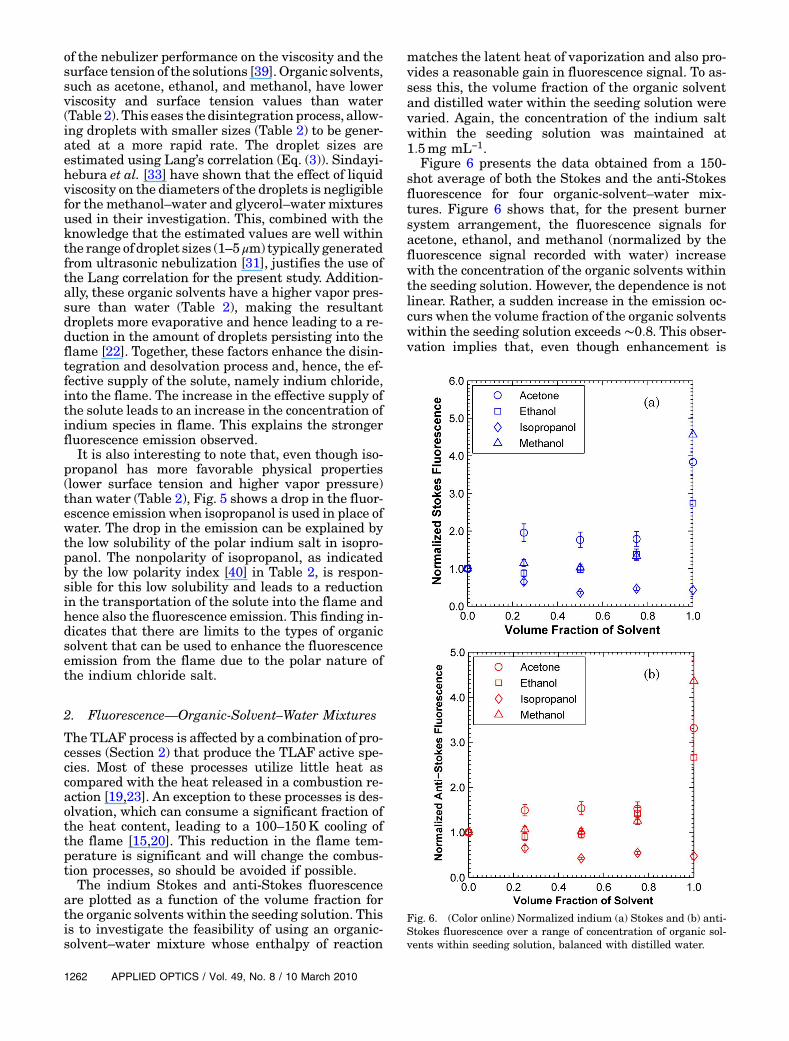
Figure 6 presents the data obtained from a 150-shot average of both the Stokes and the anti-Stokesfluorescence for four organic-solvent–water mix-tures. Figure 6 shows that, for the present burnersystem arrangement, the fluorescence signals foracetone, ethanol, and methanol (normalized by thefluorescence signal recorded with water) increasewith the concentration of the organic solvents withinthe seeding solution. However, the dependence is notlinear. Rather, a sudden increase in the emission oc-curs when the volume fraction of the organic solventswithin the seeding solution exceeds ∼0:8. This obser-vation implies that, even though enhancement is
Fig. 6. (Color online) Normalized indium (a) Stokes and (b) anti-Stokes fluorescence over a range of concentration of organic sol-vents within seeding solution, balanced with distilled water.
1262 APPLIED OPTICS / Vol. 49, No. 8 / 10 March 2010
attainable with the use of organic-solvent–watermixtures; almost pure organic solvents are neededto achieve significant intensification. A volume frac-tion of ∼0:1 (significantly less than the amountrequired for sufficient intensification) correspondsto the concentration of each of the organic-solvent–water mixtures needed to match the enthalpy ofthe reaction with the latent heat of vaporization ofthe mixture within flame. Hence, no benefit in usingorganic-solvent–water mixture was found. Rather,these findings suggest that pure organic solventsshould be used. The use of isopropanol as the solventwas found to reduce the fluorescence, consistent withthe finding reported above.Stokes fluorescence has been shown to have a high-
er SNR than anti-Stokes [20]. Since the temperatureis determined from the ratio of the two signals, thelatter controls the SNR. Additionally, both Stokesand anti-Stokes are observed to display similar char-acteristics throughout the present study. Hence, onlythe anti-Stokes fluorescence results are presentedand discussed in the subsequent sections.
B. Effects of Selected Organic Solvents on IndiumFluorescence across the Flame Stoichiometric Envelope
1. Fluorescence—Stoichiometry
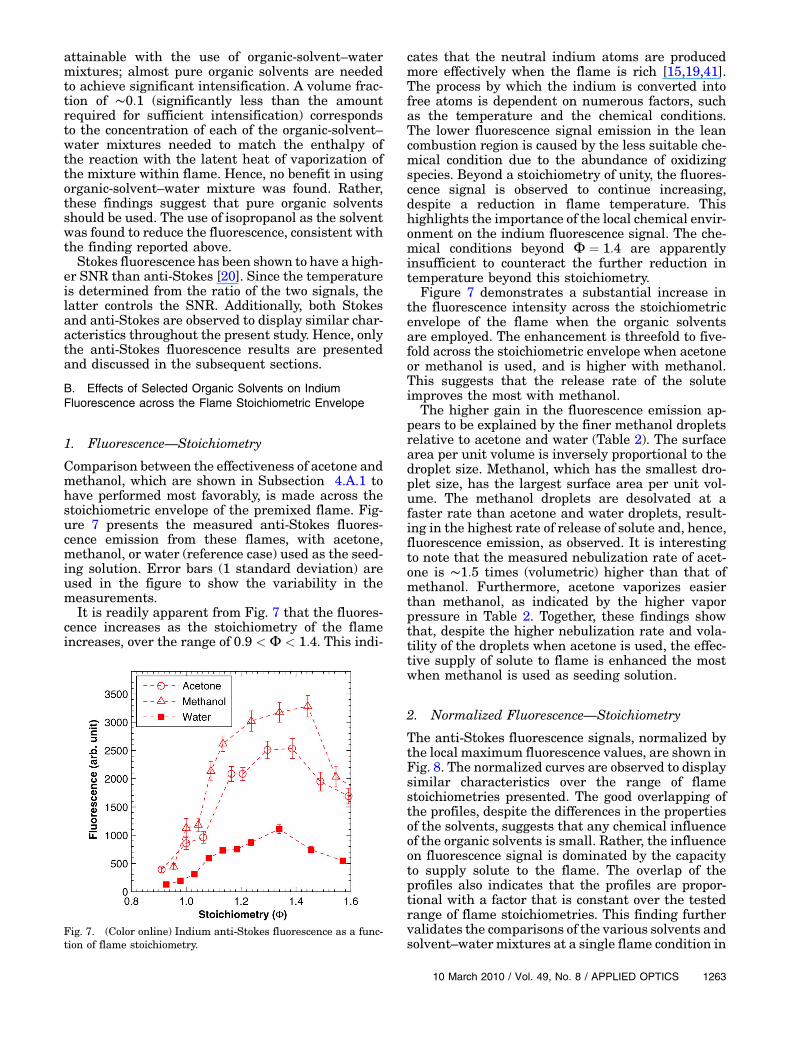
Comparison between the effectiveness of acetone andmethanol, which are shown in Subsection 4.A.1 tohave performed most favorably, is made across thestoichiometric envelope of the premixed flame. Fig-ure 7 presents the measured anti-Stokes fluores-cence emission from these flames, with acetone,methanol, or water (reference case) used as the seed-ing solution. Error bars (1 standard deviation) areused in the figure to show the variability in themeasurements.It is readily apparent from Fig. 7 that the fluores-
cence increases as the stoichiometry of the flameincreases, over the range of 0:9 < Φ < 1:4. This indi-
cates that the neutral indium atoms are producedmore effectively when the flame is rich [15,19,41].The process by which the indium is converted intofree atoms is dependent on numerous factors, suchas the temperature and the chemical conditions.The lower fluorescence signal emission in the leancombustion region is caused by the less suitable che-mical condition due to the abundance of oxidizingspecies. Beyond a stoichiometry of unity, the fluores-cence signal is observed to continue increasing,despite a reduction in flame temperature. Thishighlights the importance of the local chemical envir-onment on the indium fluorescence signal. The che-mical conditions beyond Φ ¼ 1:4 are apparentlyinsufficient to counteract the further reduction intemperature beyond this stoichiometry.
Figure 7 demonstrates a substantial increase inthe fluorescence intensity across the stoichiometricenvelope of the flame when the organic solventsare employed. The enhancement is threefold to five-fold across the stoichiometric envelope when acetoneor methanol is used, and is higher with methanol.This suggests that the release rate of the soluteimproves the most with methanol.
The higher gain in the fluorescence emission ap-pears to be explained by the finer methanol dropletsrelative to acetone and water (Table 2). The surfacearea per unit volume is inversely proportional to thedroplet size. Methanol, which has the smallest dro-plet size, has the largest surface area per unit vol-ume. The methanol droplets are desolvated at afaster rate than acetone and water droplets, result-ing in the highest rate of release of solute and, hence,fluorescence emission, as observed. It is interestingto note that the measured nebulization rate of acet-one is ∼1:5 times (volumetric) higher than that ofmethanol. Furthermore, acetone vaporizes easierthan methanol, as indicated by the higher vaporpressure in Table 2. Together, these findings showthat, despite the higher nebulization rate and vola-tility of the droplets when acetone is used, the effec-tive supply of solute to flame is enhanced the mostwhen methanol is used as seeding solution.
2. Normalized Fluorescence—Stoichiometry
The anti-Stokes fluorescence signals, normalized bythe local maximum fluorescence values, are shown inFig. 8. The normalized curves are observed to displaysimilar characteristics over the range of flamestoichiometries presented. The good overlapping ofthe profiles, despite the differences in the propertiesof the solvents, suggests that any chemical influenceof the organic solvents is small. Rather, the influenceon fluorescence signal is dominated by the capacityto supply solute to the flame. The overlap of theprofiles also indicates that the profiles are propor-tional with a factor that is constant over the testedrange of flame stoichiometries. This finding furthervalidates the comparisons of the various solvents andsolvent–watermixtures at a single flame condition in
Fig. 7. (Color online) Indium anti-Stokes fluorescence as a func-tion of flame stoichiometry.
10 March 2010 / Vol. 49, No. 8 / APPLIED OPTICS 1263

Subsections 4.A.1 and 4.A.2, because the differencesbetween the solvents are observed to be consistentfor all flame stoichiometries.
3. Relative Gain in Signal-to-NoiseRatio—Stoichiometry
To further assess the effectiveness of the organic sol-vents in enhancing the fluorescence signal, the rela-tive gain in the SNR over the stoichiometric envelopeof the flame is presented in Fig. 9. Error bars (1 stan-dard deviation) are used in the figure to show thevariability in themeasurements. SNR is defined hereas the ratio of the average signal intensity to the in-terpixel noise. This figure was obtained by compar-ing the SNR of the anti-Stokes fluorescence imagesobtained with acetone and methanol with water overa range of flame stoichiometries. Figure 9 shows that
methanol and acetone enhance the SNR of the fluor-escence image across the stoichiometric envelope ofthe flame. The gain in SNR is observed to be rela-tively invariant at ∼1:8 above a flame stoichiometryof ∼1:1. The observed invariant profile appears to beexplained by the more efficient neutral indium atomformation process in the fuel-rich region, counteract-ing the drop in fluorescence signals due to the drop inflame temperature (in accordance with Eq. (2)) in thericher region. Some scatter in the data, coupled withlarger error bars, is observable in the lean region ofthe flame. This is to be expected due to the lack ofactive indium species in such an environment.
4. Signal-to-Noise Ratio of TemperatureImages—Solvents
Figure 10 presents histograms obtained from aninstantaneous temperature image of the premixed
Fig. 8. (Color online) Normalized anti-Stokes fluorescence signalas a function of flame stoichiometry.
Fig. 9. (Color online) Relative gain in SNR of the indium anti-Stokes fluorescence, as compared to water, as a function of flamestoichiometry.
Fig. 10. (Color online) Temperature histograms from single in-stantaneous images of laminar premixed flame with a flame stoi-chiometry of ∼1:55 with (a) acetone, (b) methanol, and (c) water asseeding solution. Double-headed arrows indicate the temperaturespans that are associated with 1 standard deviation.
1264 APPLIED OPTICS / Vol. 49, No. 8 / 10 March 2010

laminar flames collected with acetone, methanol,and water as seeding solutions, at a flame stoichio-metry of ∼1:55. The histograms demonstrate thatthe use of the organic solvents provides a significantimprovement in SNR, as indicated by reducedtemperature span, and the increased probability atthe expected temperature (∼1800K) of the flame.Double-headed arrows are also used to indicate thetemperature spans that are associated with 1 stan-dard deviation from the mean. Hence, a reductionin the single-shot uncertainty of the temperatureimages results.
5. Conclusion
This paper has compared the potential use of four dif-ferent solvents, namely acetone, ethanol, isopropa-nol, and methanol, to replace water as the seedingmedium for TLAF. The benefit of the organic solventsis attributed mainly to combined influence of themore favorable physical properties that control therate at which indium species is seeded into the flame,such as surface tension, solubility, and vapor pres-sure. Acetone andmethanol have been shown to yieldthe highest gain in the fluorescence signal intensity(approximately threefold to fivefold). No significantbenefit is observed with the use of organic-solvent–water mixtures. Acetone and methanol have beenshown to enhance the SNR of the fluorescence emis-sion throughout the stoichiometric envelope of theflame, with the most significant enhancement (ap-proximately twofold) observed in the rich combustionregion. Acetone and methanol have also been demon-strated not to have a detrimental effect on the neu-tral indium formation process. The identification ofthe potential of the organic solvents, specifically acet-one and methanol, in enhancing the fluorescence sig-nal represents a significant development to supportfuture imaging applications in turbulent or/and soot-ing flames where the background interferences areexpected to be more pronounced.
The authors would like to thank the Centre for En-ergy Technology (CET) at The University of Adelaidefor their support. The Australia Research Council(ARC) is also gratefully acknowledged for their sup-port of this work through ARC Discovery and Link-age Infrastructure, Equipment and Facilities (LIEF)grant schemes. The authors are also grateful to Gre-gory Metha for his invaluable input in the planningof this work.
References1. K. Kohse-Höinghaus and J. B. Jeffries, Applied Combustion
Diagnostics (Taylor and Francis, 2002).2. D. Hoffman, K. U. Münch, and A. Leipertz, “Two-dimensional
temperature determination in sooting flames by filteredRayleigh scattering,” Opt. Lett. 21, 525–527 (1996).
3. D. Hofmann and A. Leipertz, “Temperature field measure-ments in a sooting flame by filtered Rayleigh scattering(FRS),” Proc. Combust. Inst. 26, 945–950 (1996).
4. S. P. Kearney, R. W. Schefer, S. J. Beresh, and T. W. Grasser,“Temperature imaging in nonpremixed flames by joint filtered
Rayleigh and Raman scattering,” Appl. Opt. 44, 1548–1558(2005).
5. M. Afzelius, P. E. Bengtsson, J. Bood, C. Brackmann, and A.Kurtz, “Development of multipoint vibrational coherent anti-Stokes Raman spectroscopy for flame applications,”Appl. Opt.45, 1177–1186 (2006).
6. A. Burkert, W. Triebel, H. Stafast, and J. König, “Single-shotimaging of gas temperatures in low-temperature combustionbased on laser-induced fluorescence of formaldehyde,” Proc.Combust. Inst. 29, 2645–2651 (2002).
7. A. T. Hartlieb, B. Atakan, andK. Kohse-Höinghaus, “Tempera-turemeasurement in fuel-richnon-sooting low-pressurehydro-carbon flames,” Appl. Phys. B 70, 435–445 (2000).
8. R. Cattolica, “OH rotational temperature from two-line laserexcited fluorescence,” Appl. Opt. 20, 1156–1166 (1981).
9. J. M. Seitzman, R. K. Hanson, P. A. DeBarber, and C. F. Hess,“Application of quantitative two-line OH planar laser-inducedfluorescence for temporally resolved planar thermometry inreacting flows,” Appl. Opt. 33, 4000–4012 (1994).
10. J. Nygren, J. Engström, J. Walewski, C. F. Kaminski, and M.Aldén, “Applications and evaluation of two-line atomic LIFthermometry in sooting combustion environments,” Meas.Sci. Technol. 12, 1294–1303 (2001).
11. G. A. Robinson, R. P. Lucht, and N.M. Laurendeau, “Two-colorplanar laser-induced fluorescence thermometry in aqueoussolutions,” Appl. Opt. 47, 2852–2858 (2008).
12. D. Dabiri, “Digital particle image thermometry/velocimetry: areview,” Exp. Fluids 46, 191–241 (2009).
13. G. Särner, M. Richter, and M. Aldén, “Two-dimensional ther-mometry using temperature-induced line shifts of ZnO:Zn andZnO:Ga fluorescence,” Opt. Lett. 33, 1327–1329 (2008).
14. T. Hirasawa, Y. Kamata, T. Kaneba, and Y. Nakamura, “Visu-alization of ambient gas temperature based on two-color LIF,”in 9th Asia–Pacific Conference on Combustion (NationalTaiwan University, 2009), paper 10092.
15. J. Engström, J. Nygren, M. Aldén, and C. F. Kaminski, “Two-line atomic fluorescence as a temperature probe for highlysooting flames,” Opt. Lett. 25, 1469–1471 (2000).
16. M. Aldén, P. Grafström, H. Lundberg, and S. Svanberg, “Spa-tially resolved temperature measurements in a flame usinglaser-excited two-line atomic fluorescence and diode-arraydetection,” Opt. Lett. 8, 241–243 (1983).
17. H. Haraguchi, B. Smith, S. Weeks, D. J. Johnson, and J. D.Winefordner, “Measurement of small volume flame tempera-tures by the two-line atomic fluorescence method,” Appl. Spec-trosc. 31, 156–163 (1977).
18. I. S. Burns, J. Hult, and C. F. Kaminski, “Spectroscopic use of anovel blue diode laser in a wavelength region around 450nm,”Appl. Phys. B 79, 491–495 (2004).
19. C. F. Kaminski, J. Engström, and M. Aldén, “Quasi-instanta-neous two-dimensional temperaturemeasurements in a sparkignition engine using 2-line atomic fluorescence,” Proc. Com-bust. Inst. 27, 85–93 (1998).
20. P. R. Medwell, Q. N. Chan, P. A. M. Kalt, Z. T. Alwahabi, B. B.Dally, and G. J. Nathan, “Development of temperatureimaging using two-line atomic fluorescence,” Appl. Opt. 48,1237–1248 (2009).
21. J. W. Berry, D. G. Chappell, and R. B. Barnes, “Improvedmeth-od of flame photometry,” Ind. Eng. Chem. Anal. Ed. 18, 19–24(1946).
22. J. H. Gibson, W. E. L. Grossman, and W. D. Cooke, “Excitationprocess in flamespectroscopy,”Anal.Chem.35, 266–277(1963).
23. J. A. Dean and C. T. Rains, Flame Emission and AtomicAbsorption Spectrometry (Marcel Dekker, 1969), Vol. 1.
24. J. Elhanan and W. D. Cooke, “Factors affecting line intensitiesin the flame spectrometry of metals in organic solvents,” Anal.Chem. 38, 1062–1063 (1966).
10 March 2010 / Vol. 49, No. 8 / APPLIED OPTICS 1265

25. R. Avni and C. T. J. Alkemade, “The role of some organicsolvents in flame photometry,” Microchimica Acta 48, 460–471 (1960).
26. G. V. Deverall, K. W. Meissner, and G. J. Zissis, “Hyperfinestructures of the resonance lines of indium,” Phys. Rev. 91,297–299 (1953).
27. J. Casas, J. S. C. Fernádez, and J. Sordo,Lead: Chemistry, Ana-lytical Aspects, Environment Impact &Health Effects (ElsevierScience, 2006).
28. L. Bütfering, G. Schmelzeisen-Redeker, and F. W. Röllgen,“Studies with a dual-beam thermospray interface in high-performance liquid chromatography mass spectrometry,” J.Chromatogr. 394, 109–116 (1987).
29. G. Schmelzeisen-Redeker, L. Bütfering, and F. W. Röllgen,“Desolvation of ions and molecules in thermospray mass spec-trometry,” Int. J. Mass Spectrom. Ion Processes 90, 139–150(1989).
30. V. A. Fassel, J. O. Rasmuson, R. N. Kniseley, and T. G. Cowley,“Relative free-atom populations in nitrous oxide-acetyleneflames used in analytical spectroscopy,” Spectrochim. ActaPart B 25, 559–575 (1970).
31. P. Rajan and A. B. Pandit, “Correlations to predict droplet sizein ultrasonic nebulization,” Ultrasonics 39, 235–255 (2001).
32. R. J. Lang, “Ultrasonic atomization of liquids,” J. Acoust. Soc.Am. 34, 6–8 (1962).
33. D. Sindayihebura, M. Dobre, and L. Bolle, “Experimentalstudy of thin liquid film ultrasonic atomization,” in 4th World
Conference on Experimental Heat Transfer, Fluid Mechanicsand Thermodynamics (Edizioni ETS, 1997), pp. 1249–1256.
34. W. Wang, A. Purwanto, I. W. Lenggoro, K. Okuyama, H.Chang, and H. D. Jang, “Investigation on the correlations be-tween droplet and particle size distribution in ultrasonicspray pyrolysis,” Ind. Eng. Chem. Res. 47, 1650–1659 (2008).
35. A. Balasubrahmanyam, M. N. Patil, P. R. Gogate, and A. B.Pandit, “Ultrasonic atomization: effect of liquid phase proper-ties,” Ultrasonics 44, 146–158 (2006).
36. R. K. Winge, V. A. Fassel, and R. N. Kniseley, “Direct nebuli-zation of metal samples for flame atomic-emisson and absorp-tion spectroscopy,” Appl. Spectrosc. 25, 636–642 (1971).
37. R. M. Frinstrom and A. A. Westenberg, Flame Structure(McGraw-Hill, 1965).
38. C. G. Fotache, T. G. Kreutz, D. L. Zhu, and C. K. Law, “An ex-perimental study of ignition in nonpremixed counterflowinghydrogen versus heated air,” Combust. Sci. Technol. 109,373–393 (1995).
39. J. B. Willis, “Atomization problems in atomic absorption spec-troscopy–i. A study of the operation of a typical nebulizer,spray chamber and burner system,” Spectrochim. Acta PartA 23, 811–830 (1967).
40. L. R. Snyder and J. J. Kirkland, Introduction toModern LiquidChromatography, 2nd. ed. (Wiley, 1979).
41. K. Fujiwara, H. Haraguchi, and K. Fuwa, “Profiles of the dis-tribution of atoms in the nitrous oxide-acetylene flame,” Bull.Chem. Soc. Jpn. 48, 857–862 (1975).
1266 APPLIED OPTICS / Vol. 49, No. 8 / 10 March 2010
Copyright © 2022 FDOKUMEN