Sequential Solvent Extraction of Red-Onion (Allium cepa L) Skin
Upload
khangminh22Category
view
2download
0
HAL Id: tel-02129530https://tel.archives-ouvertes.fr/tel-02129530
Submitted on 28 May 2019
HAL is a multi-disciplinary open accessarchive for the deposit and dissemination of sci-entific research documents, whether they are pub-lished or not. The documents may come fromteaching and research institutions in France orabroad, or from public or private research centers.
L’archive ouverte pluridisciplinaire HAL, estdestinée au dépôt et à la diffusion de documentsscientifiques de niveau recherche, publiés ou non,émanant des établissements d’enseignement et derecherche français ou étrangers, des laboratoirespublics ou privés.
Investigation on the Diluent Effect on SolventExtraction Processes of Trivalent f-Elements by Di-Alkyl
Organophosphorus ExtractantsThibaut Lécrivain
To cite this version:Thibaut Lécrivain. Investigation on the Diluent Effect on Solvent Extraction Processes of Trivalentf-Elements by Di-Alkyl Organophosphorus Extractants. Analytical chemistry. Washington StateUniversity, 2018. English. �tel-02129530�

INVESTIGATION ON THE DILUENT EFFECT ON SOLVENT EXTRACTION
PROCESSES OF TRIVALENT f - ELEMENTS BY
ACIDIC DI-ALKYL ORGANOPHOSPHORUS
EXTRACTANTS
By
THIBAUT JEAN-MICHEL LUCIEN LÉCRIVAIN
A dissertation submitted in partial fulfillment of the requirements for the degree of
DOCTOR OF PHILOSOPHY
WASHINGTON STATE UNIVERSITY Department of Chemistry
17th of September 2018
© Copyright by THIBAUT JEAN-MICHEL LUCIEN LÉCRIVAIN, 2018 All Rights Reserved

ii
© Copyright by THIBAUT JEAN-MICHEL LUCIEN LÉCRIVAIN, 2018 All Rights Reserved

ii
To the Faculty of Washington State University:
The members of the Committee appointed to examine the dissertation of THIBAUT JEAN-
MICHEL LUCIEN LÉCRIVAIN find it satisfactory and recommend that it be accepted.
Kenneth L. Nash, Ph.D., Chair
James Brozik, Ph.D., Co-Chair
Peter Reilly, Ph.D.
Philippe Moisy, Ph.D.
iii
ACKNOWLEDGMENTS
« Que tu es plein de bon sens, mon petit bonhomme ; un de ces
jours je te ferai passer docteur en gai savoir »
Translation
« You have plenty of common sense my little guy, one of this days I
will make you doctor of merry knowledge »
Francois Rabelais - Gargantua. chap. 13
This journey would have not been possible without the love and support of my wife, Lindsey. I
take this opportunity to express how grateful for her patience, her understanding, and countless
help during my completion of this degree program. We certainly have traveled this road together,
and I would not have made it without you.
I must thank my advisor and mentor Ken Nash for his support and guidance throughout the last
couple of years. Having Ken has an advisor has given me the opportunity to grow up as a scientist.
When I came to WSU for an internship, it was with the objective to learn about solvent extraction,
and today I leave with a love of the subtlety of solution chemistry; a new skill set necessary to
perform such research. Ken, you have taught me to critically analyze experimental results (like a
chemist), which I believe was not necessarily an easy task. I will be forever grateful for the

iv
opportunity to learn from the best professor in the field, and probably one the best scientists in the
field in general.
Working with Ken Nash implies that I also work in the Nash Group and its colorful members. I
must thank the postdoctoral researchers Julie Muller and Joey Lapka for their guidance and the
time they gave me to answer to my countless questions. I would like to thank my present fellow
graduate students in the Nash group, Guy Dutech, Matthew RisenHuber, and Samuel Miller, but
also past members, with a special thanks to Ashleigh Kimberlin, Ian Hobbs, and Jeff Berry. I doubt
that I would have been able to produce this quality of work without your constructive criticism of
my work. I must also offer a special thanks to some graduate students from other WSU research
groups such as Cecilia Eiroa Lledo, Sam Battey, Brian Backer, Cameron Naylor, Peyton
Nosbusch, and many others.
I think it is also necessary to thank the Chemistry Department staff members. First the office folks
especially Trent, Stacie, and Molly for the countless help and support. The teaching team
especially Nikki, Ryan and Krista for your trust in me as a chemistry teacher; I learned a lot from
you. Last but not least, the IT wizard Yoshi and his team of minions. All of you people are the
backbones of this department.
While I have had great mentorship at WSU, I could not have made my way here without my
previous mentors. Because of that I wanted to thanks my previous mentors from the CEA for
guiding me from high school to WSU, starting with the clay people: Sebastien Savoye and
Christoph Imbert (CEA Saclay), the resin calcinaters Sebastien Picart and Elodie Remy (CEA
Marcoule), and the sonic bubble team: Matthieu Virot and Serguei Nikitenko (ICSM). Also a
special thank you to Phillippe Moisy, who introduced me to the beauty of the solution chemistry
of the f-elements. Today I laugh about it; I don’t think any of us imagined that I would eventually

v
complete a Ph.D program on solution chemistry of f-elements. The accomplishment of this
doctoral program is a testament of all of your combined encouragements, guidance, and mentor
skills.
I would also like to thank my parents, Florence and Jean-Louis Martin. I know it has been difficult
for you to seem me moving on another continent. Thank you for giving me a lifetime of love and
support. I think it is safe to say that I would not be here without you…
I wanted to thank some friends from outside WSU. Marie-Alix, thank you for your support,
friendship, and for taking the time to speak with me on a regular basis (and for asking me to be
your matron of honor. that was fun!). Thank you Agathe for your friendship and your happiness!
There is so many other people that would deserve to be thanked but that are not listed here, such
as Scott & Jess T (and Willow and Nyx), Jessica J, etc. Thank you, all of you! I will never forget
your help and encouragement.
Lastly, I want to thank my committee, Profs Ken Nash, James Brozik, Pete Reilly and Philippe
Moisy, who each had a hand in my scientific development, and eventual success of this project.

vi
INVESTIGATION ON THE DILUENT EFFECT ON SOLVENT EXTRACTION
PROCESSES OF TRIVALENT f - ELEMENTS BY
ACIDIC DI-ALKYL ORGANOPHOSPHORUS
EXTRACTANTS
Abstract
by Thibaut Jean-Michel Lucien Lécrivain, Ph.D. Washington State University
December 2018
Chair: Kenneth L. Nash
Solvent extraction is the most common chemical technique used in hydrometallurgical separations
and purification of transition metals and f-elements. Solvent extraction of metallic cations, such as
the f-elements, needs the use of organic ligands (extractants) to coordinate the targeted cation, to
make it soluble in an organic phase and then allow the phase transfer from the aqueous phase to
the organic one. The family of acidic di-alkyl organophosphorus extractants are the extractants of
choice for trivalent metals. Furthermore, the large catalogue of diluents available for
experimentation is one of the delightful aspects of solvent extraction chemistry (and probably to
other chemistry domains). There are so many to choose from, and each has its special applications
where it outshines the rest.
This dissertation is focusing on the influence of the choice of the diluent on the solvent extraction
process of selected trivalent f-elements (Nd3+, Eu3+, Tm3+ and Am3+) by HEH[EHP]. The results
show that the diluent influences the efficiency of the extraction (characterized by the Kex), but also
the stoichiometry of the metal chelate. Spectrophotometry shows that the coordination of the metal

vii
chelate is invariant from one diluent to another. The results of the extraction of Eu3+ by HEH[EHP]
are then compared to the diluent properties that are relevant for the solvation process (cavitation,
dispersion and association). Finally, van’t Hoff analysis is applied to the extraction of Am3+ and
Nd3+ by HDEHP in various diluents, reveling an entropy and enthalpy compensation effect.

viii
TABLE OF CONTENTS
ACKNOWLEDGMENTS ............................................................................................................. iii
ABSTRACT ................................................................................................................................... vi
LIST OF TABLES ......................................................................................................................... xi
LIST OF FIGURES ..................................................................................................................... xiii
1 INTRODUCTION ................................................................................................................. 1
Solvent Extraction ........................................................................................................... 1
Calculation of Equilibrium Constants ............................................................................. 9
Analytical Determination of Distribution Ratios. ......................................................... 15
Research Focus ............................................................................................................. 21
Research scope .............................................................................................................. 42
References ..................................................................................................................... 44
2 METHODS .......................................................................................................................... 48
1.1. Materials ....................................................................................................................... 48
1.2. Purification methods ..................................................................................................... 49
1.3. Neutron Activation ........................................................................................................ 52
1.4. Solvent Extraction Method ........................................................................................... 54
1.5. Spectroscopic Methods ................................................................................................. 57
1.6. References ..................................................................................................................... 61
Page
ix
3 DETERMINATION OF STABILITY CONSTANTS OF SOLVENT EXTRACTION OF f-
ELEMENTS BY HEH[EHP] IN VARIOUS DILUENTS .................................................. 62
3.1 Preface ........................................................................................................................... 62
3.2 Introduction ................................................................................................................... 64
3.3 Experimental ................................................................................................................. 65
3.4 Discussion ..................................................................................................................... 90
3.5 Conclusion .................................................................................................................... 97
3.6 References ..................................................................................................................... 98
4 CHARACTERIZATION OF THE DILUENT EFFECT ON SOLVENT EXTRACTION
OF Eu(III) BY HEH[EHP] AS FUNCTION OF FUNDAMENTAL CHEMICAL
PROPERTIES OF THE DILUENTS ................................................................................ 101
4.1 Introduction ................................................................................................................. 101
4.2 Theory of Thermodynamic of the Solvation Process ................................................. 102
4.3 Metrics and Objectives ............................................................................................... 106
4.4 Specific Interactions: Solvatochromic parameters ...................................................... 120
4.5 Discussion on the Diluent Effect ................................................................................ 128
4.6 Conclusion .................................................................................................................. 138
4.7 References ................................................................................................................... 139
5 THERMOMETRIC CHARACTERIZATIONS OF THE EFFECT OF THE DILUENT ON
THE EXTRACTION OF f-ELEMENTS BY HDEHP ...................................................... 143
Preface. ........................................................................................................................ 143

x
Introduction ................................................................................................................. 143
Principle of Thermochemical Analysis ....................................................................... 144
Experimental ............................................................................................................... 149
Discussion ................................................................................................................... 154
Future Work ................................................................................................................ 157
Conclusion .................................................................................................................. 158
References ................................................................................................................... 159
6 GENERAL CONCLUSIONS ............................................................................................ 161
A. APPENDIX ........................................................................................................................ 164
A.1. The Need of Energy and the Impact of its Production ................................................ 165

xi
LIST OF TABLES
Table 1-1. Acidic organophosphorus extractant compound ......................................................... 23
Table 1-2. Reichardt 2003 solvent classification scheme ............................................................ 29
Table 1-3. Kolthoff and Reichardt solvent classification scheme ................................................ 30
Table 1-4. Chastrette solvent classification scheme ..................................................................... 30
Table 1-5. The mole fraction of solubility of the diluent in water, of the water in diluent, and the corresponding 1-octanol/water partition constant ................................................................ 33
Table 1-6. Partitioning (Kd) and extraction equilibrium (Kex) constants involving HTTA, from 1 mol·L-1 (Na-H)ClO4 into various diluents. ..................................................................... 36
Table 1-7. Thermodynamic data involving HDBP, distribution[49] Kd and extraction data of metal chelate[27], Kex from 0.1 mol·L-1 (Na-H)NO3 into various diluents. Bold: aqueous 1.0 mol·L-1 (Na-H)NO3. Parenthesis: distribution form another source.[28] r: corrected value ........ 38
Table 1-8. Thermodynamic data involving HDOP, Extraction data of metal chelate, log Kex from 0.1 mol·L-1 (Na-H)NO3 into various diluents, and average ligand number in the metal chelate from ref [36]. .................................................................................................................. 40
Table 2-1. Feature of 5D0 → 7Fj luminescent transitions for Eu3+.[8] ............................................ 59
Table 3-1. Equilibria constants of extraction of Eu3+by HEH[EHP] for 0.1 mol·L-1 (Na-H)NO3 at 25°C ± 1°C. log Kex represent the equilibria constant considering only the complex Eu(AHA)3, log 𝐾#$∗ consider the average ligand number 𝑛. Complex* refer to the largest portion of complex considering the average ligand number. Type of diluent: i = inert, D = donor, A = acceptor. (a) the efficiency of the extraction seem to be one order of magnitude lower than expected, (b) the efficiency of the extraction seem to be a couple of order of magnitudes lower than expected ................................................................................... 73
Table 3-2. Equilibria constants of extraction of Tm3+by HEH[EHP] for 0.1 mol·L-1 (Na-H)NO3 at 25°C ± 1°C. log Kex represent the equilibria constant considering only the complex Tm(AHA)3, log 𝐾#$∗ consider the average ligand number 𝑛. Complex* refer to the largest portion of complex considering the average ligand number. Type of diluent: i = inert, D = donor, A = acceptor.(a) ) the efficiency of the extraction seem to be one order of magnitude lower than expected .................................................................................................. 76

xii
Table 3-3. Equilibria constants of extraction of Nd3+by HEH[EHP] for 0.1 mol·L-1 (Na-H)NO3 at 25°C ± 1°C. log Kex represent the equilibria constant considering only the complex Nd(AHA)3, log 𝐾#$∗ consider the average ligand number 𝑛. Complex* refer to the largest portion of complex considering the average ligand number. Type of diluent: I = inert, D = donor, A = acceptor. ............................................................................................. 79
Table 3-4. Equilibria constants of extraction of Am3+by HEH[EHP] for 0.1 mol·L-1 (Na-H)NO3 at 25°C ± 1°C. log Kex represent the equilibria constant considering only the complex Am(AHA)3, log 𝐾#$∗ consider the average ligand number 𝑛. Complex* refer to the largest portion of complex considering the average ligand number. Type of diluent: i = inert, D = donor, A = acceptor. ................................................................................................... 80
Table 3-5. Feature of the 5D0 → 7Dn luminescence transition for Eu3+ ........................................ 83
Table 3-6. Organic phase Nd(III) metal loading information ...................................................... 89
Table 5-1. Calculated thermodynamic parameters, ΔG (calculated for 298.15 K), ΔH, and TΔS for the extraction of Nd(III) and Am(III) by HDEHP in various diluents (n-octane, toluene, chloroform, nitrobenzene) from acidic nitrate media, µ = 0.1 mol·L-1 (Na-H)NO3 at pH=2. Values calculated from equation (5.14), uncertainties in ΔH and TΔS calculated from the unweighted linear regression and the 95% confidence interval of the fitting. (T = 298.15 K) .................................................................................................................................. 153
Table 5-2. Parameters calculated from the linear enthalpy-entropy compensation effect ......... 157
Table A-1. Comparison of the deathprint of each electricity production technology. ............... 179

xiii
LIST OF FIGURES
Figure 1-1. Schematic representation of solvent extraction, where a solute S is distributed between the upper (lighter) yellow phase and the lower (heavier) blue phase. ........................... 1
Figure 1-2. Structures of the acidic organophosphorus extractant DBP, (a) acidic monomer, (b) conjugated base, (c) dimeric form .......................................................................................... 3
Figure 1-3. Solvating extractant extraction process, where M represent a metal cation, A represent an anion, B a solvating extractant ................................................................................. 6
Figure 1-4. Structure of the solvating Calix[4]arene-bis(t-Octylbenzo-Crown-6) ........................ 7
Figure 1-5. Solvent Extraction by ion exchange process, where M represent a metal cation, HA represent a weak acid organic extractant, and A its aqueous conjugate base ........................ 8
Figure 1-6. Structure of the acetyl acetone derivative thenoyltrifluoroacetone (HTTA) ............. 9
Figure 1-7. Extraction of Cu(II) from 1 mol.L-1 NaClO4 into benzene as a function of pH (large figure) and of free acetylacetonate ion concentration (insert) at several formal concentrations of acetylacetone. Figure from ref [17] ............................................................... 14
Figure 1-8. Picture of a solution of Arsenazo III in absence of metal (left) and the same solution in presence of Eu(NO)3 ................................................................................................. 16
Figure 1-9. Self-cooled high precision gamma counting instrument, left instrument closed for analysis, right instrument open for sample changing. .......................................................... 20
Figure 1-10. Structures of tributyl phosphate (a) dibutyl phosphoric acid (b) and monobutyl phosphoric acid (c) ..................................................................................................................... 22
Figure 1-11. Chemical structure of (a) Bis-2-ethyl(hexyl) phosphoric acid (HDEHP) and (b) 2-Ethyl(hexyl)phosphoric acid mono-2-ethyl(hexyl) ester. pKa values from ref [35] ................ 24
Figure 1-12. Accepted schematic diagram of equilibria in extraction of cation (M) by HEH[EHP] (HA) based on literature equilibria ......................................................................... 25
Figure 1-13. Accepted structure of the metal chelate formed between a metal cation of charge n and n dimers ref [9]- appendix D ................................................................................. 26
Figure 1-14. Schematic representation of the London dispersion. Top for a monatomic particle, bottom for a hydrocarbon ............................................................................................. 31
Figure 1-15. Schematic representation of a head to tail dipole-dipole interaction (e.g., acetone) ....................................................................................................................................... 32
xiv
Figure 1-16. Schematic representation of observed water/diluent positioning for fluorobenzene used as a diluent (this work) ............................................................................... 35
Figure 1-17. Graphic plot between the distribution ratio of the TTA and the coefficient of extraction of the metal chelate from Table 1-6 .......................................................................... 36
Figure 1-18. Graphic plot between the distribution ratio of the HDBP and the coefficient of extraction of the metal chelate from Table 1-7 .......................................................................... 39
Figure 1-19. Schematic representation of (a) di-octyl-phosphoric acid (HDOP), of the metal chelate with an average ligand number of 3 (b) and 2.5 (2) ....................................................... 41
Figure 2-1. Common impurity found in di alkyl phosphoric acid (mostly A, and C) and alkyl alkyl phophonic acid (mostly B, C and D). A: di-alkyl phosphonate, B: alkyl alkyl phosphinate, C: Mono-alkyl phosphoric acid, Mono-alkyl phosphonic acid.[2] ....................... 49
Figure 2-2. 31P NMR chemical shift for HDEHP purity control, in DCCl3 ................................. 52
Figure 2-3. The Gamma counter, Packard Model 5003 Cobra II Auto Gamma Counter ........... 55
Figure 2-4. Liquid scintillation counter, Beckman LS 6500 Auto Counter ................................. 57
Figure 2-5. Schematic of the utilization of the cuvette for Eu3+ luminescence ........................... 60
Figure 3-1. Graphic slope analysis of sample plots for: left xylene, right n-octane. Unweighted fit of log D vs. log [H+] and log [(HA)2]. Metal 152/154Eu tracer extracted from nitric media (Na-H)NO3 µ = 0.1 mol·L-1. .................................................................................. 68
Figure 3-2. LNM and GSA plot for the extraction of Eu3+ by HEH[EHP] from (H-Na)NO3 media µ = 0.1 mol·L-1 and room temperature. The logarithm of the distribution of europium between the organic and aqueous phase, versus the logarithm of the formal concentration of extractant. Unweighted fit. Top left in iso-octane, top right in benzene, bottom left in methyl iso butyl ketone, and bottom right in chloroform. ................................... 70
Figure 3-3. LNM and GSA plot for the extraction of Tm3+ by HEH[EHP] from (H-Na)NO3 media at 0.1 mol·L-1 and room temperature. The logarithm of the distribution of thulium between the organic and aqueous phase, versus the logarithm of the formal concentration of extractant. Unweighted fit. Top left in toluene, top right in chloroform, bottom left in iso-octane, and bottom right in nitrobenzene. ............................................................................ 75
Figure 3-4. LNM and GSA plot for the extraction of Nd3+ (blank) and Am3+ (solid) by HEH[EHP] from (H-Na)NO3 media at 0.1 mol·L-1 and room temperature. The logarithm of the distribution of tracers between the organic and aqueous phase, versus the logarithm of the formal concentration of extractant. Unweighted fit. Top left in n-octane, top right in benzene, bottom left in MIBK, and bottom right in chloroform ................................................ 78

xv
Figure 3-5. Luminescence in lanthanide complexes .................................................................... 81
Figure 3-6. Europium luminescence under 245 nm excitation beam, left: europium(III) nitrate hexahydrate crystals, right: europium(III) oxide powder. ............................................... 82
Figure 3-7. Red: example of a luminescence from an Eu-HEH[EHP] metal chelate in n-octane, excitation wavelength 393 nm, approx of 0.5 mmol·L-1 of metal chelate extracted by 0.1 mol·L-1 HEH[EHP], light red: first derivative of the luminescence spectra used to detect the 5D0 → 7F(0-2) transitions. ............................................................................................. 83
Figure 3-8. Luminescence from an Eu-HEH[EHP] metal chelate in TCE (black), n-octane (red), toluene (blue), MIBK (green), chloroform (purple). excitation wavelength 393 nm, approx of 0.5 mmol·L-1 of metal chelate extracted by 0.1 mol·L-1 HEH[EHP], 5D0 → 7F(0-
2) transitions ................................................................................................................................ 84
Figure 3-9. Visible absorption of Nd-HEH[EHP] metal chelate in organic phase, 7.9 mmol·L-1 Nd and 506 mmol·L-1 HEH[EHP] in toluene ............................................................ 86
Figure 3-10. Visible absorption of Nd-HEH[EHP] metal chelate in n-octane organic phase at different metal loading condition, mononuclear metal chelate in red, 3rd phase in black ...... 87
Figure 3-11. Neodymium-HEH[EHP] metal chelate visible molar absorptivity in different diluent: Toluene (black), n-octane (red), MIBK (blue), TCE (green), chloroform (purple). Other information in the Table 3-6. ........................................................................................... 88
Figure 3-12. Possible chelate rings around the metal center, left 4 atoms chelate ring, right 8 atoms chelate ring .................................................................................................................... 90
Figure 3-13. Octahedral isomers, left: facial isomer, center: left-handed Δ-meridional isomers, right: right-handed Λ-meridional isomer. In blue the ionic binding of Eu3+--O-P, in red the ion-dipole interaction Eu3+--:O=P, in black dash the chelate rings. ........................... 91
Figure 3-14. Possible coordination modes around the neodymium metal center, left 3 atoms chelate ring, renter 7 atoms chelate ring, right no ring with a molecule of MIBK coordinated in the first coordination sphere. .................................................................................................. 92
Figure 3-15. Chemical structure of di-octyl phosphoric acid ...................................................... 93
Figure 3-16. Linear Gibbs energy plots of Eu3+ extraction equilibrium data. Correlation between the Gibbs energy of extraction of Eu3+ by di-octyl phosphoric acid (HDOP) and 2-ethylhexylphosphonic acid mono-2-ethylhexyl ester (HEH[EHP]) in various diluents. Red: inert diluents (aliphatic hydrocarbon), green : aromatic diluents, purple: n-donors. ......... 93
Figure 3-17. Linear Gibbs energy plot of Eu3+ and Tm3+ extraction by HEH[EHP] from nitrate media (H-Na)HNO3 µ = 0.1 mol·L-1 at T = 25°C – data from Table 3-1 and Table 3-2 Red: inert diluents (aliphatic hydrocarbon), green: aromatic diluents, purple: n-donors .... 94
xvi
Figure 3-18. Linear Gibbs energy plot of Eu3+ and Tb3+ extraction by HDOP from nitrate media (H-Na)NO3 µ = 1.0 mol·L-1 at T = 25°C, data from Kolarik - Table 1, ref: [6]. Red: inert diluents (aliphatic hydrocarbon), green: aromatic diluents, purple: n-donors, orange: acceptor ....................................................................................................................................... 95
Figure 3-19. Linear Gibbs energy plot of Nd3+ and Am3+ extraction by HEH[EHP] from nitrate media (H-Na)HNO3 µ = 0.1 mol·L-1 at T = 25°C – data from Table 3-3 and Table 3-4. Red: inert diluents (aliphatic hydrocarbon), green: aromatic diluents, purple: n-donors, orange: acceptor .......................................................................................................................... 95
Figure 4-1. Schematic representation of a cavitation process needed for the solvation process of a solute in a non-interacting diluent ..................................................................................... 104
Figure 4-2. Correlation between the variation of the Gibbs energy of europium extraction in different diluents by HEH[EHP] (results from the extraction from the Chapter 3, Table 3.1, results relative to carbon tetrachloride) and the cohesive energy density calculated from equation (4.12) .......................................................................................................................... 110
Figure 4-3. Correlation between the variation of the Gibbs energy of europium extraction in different diluents by HEH[EHP] (results from the extraction from the Chapter 3, Table 3.1, results relative to carbon tetrachloride) and the polarity of the diluent calculated from the Debye equation calculated using equation (4.17) ..................................................................... 113
Figure 4-4. Fitting of free Gibbs energy of europium extraction in different diluents by HEH[EHP] (results from the extraction from the Chapter 3, Table 3.1, results relative to carbon tetrachloride) against the polarity parameter f(εr) < 0.3 .............................................. 114
Figure 4-5. Correlation between the variation of the Gibbs energy of europium extraction in different diluents by HEH[EHP] (results from the extraction from the Chapter 3, Table 3.1, results relative to carbon tetrachloride) and the polarizability of the diluent calculated from the Lorenz-Lorenz function calculated using the equation (4.18) ............................................ 116
Figure 4-6. Correlation between the variation of the Gibbs energy of europium extraction in different diluents by HEH[EHP] (results from the extraction from the Chapter 3, Table 3.1, results relative to carbon tetrachloride) and the polarity of the diluent based on the dipole moment using the dipolar field function calculated with equation (4.19) ................................ 118
Figure 4-7. Correlation between the variation of the Gibbs energy of europium extraction in different diluents by HEH[EHP] (results from the extraction from the Chapter 3, Table 3.1, results relative to carbon tetrachloride) and tabulated Hansen solubility parameters from reference [30] .............................................................................................................................. 119
Figure 4-8. Schematic representation of a ground state property of a solvatochromic molecule ................................................................................................................................... 120
Figure 4-9. Schematic representation of iacetylacetonatooxovanadium(IV) used as DN probe by Gutman et al. ............................................................................................................. 121

xvii
Figure 4-10. Correlation between the variations of the Gibbs free energy of europium extraction in different diluents by HEH[EHP] (results from the extraction from the Chapter 3, Table 3.1, results relative to carbon tetrachloride) and tabulated DN from reference [33]. The slope is the fit result, excluding the inert diluents ............................................................. 122
Figure 4-11. Schematic representation of the solvatochromic chromophore used for the determination of the β scale. Top left 4-nitrophenol, top right 4-nitroanisol, bottom left 4-nitroaniline, bottom right 4-nitro-N,N-diethylaniline .............................................................. 123
Figure 4-12. Correlation between the variations of the Gibbs free energy of europium extraction in different diluents (relative to carbon tetrachloride) and tabulated β from reference [33]. The slope is the fit result, excluding the inert diluents .................................... 124
Figure 4-13. Schematic representation of the solvatochromic chromophore used for the determination of the SB scale. Left 5-nitroindoline, right 1-methyl-5-nitroindiline ................ 125
Figure 4-14. Correlation between the variations of the Gibbs free energy of europium extraction by HEH[EHP] in different diluents (relative to carbon tetrachloride) and tabulated SB from reference [35]. ............................................................................................ 126
Figure 4-15. Schematic representation of butylstilbazolium molecule used as a solvatochromic chromophore by Catalan to develop the SA scale, where R and R’ can be either –H or –C(CH3)3 .............................................................................................................. 127
Figure 4-16. Molecular electrostatic potential maps of a HEH[EHP], top monomer, bottom dimer. The green surface are the surface with a zero potential, the red regions are hydrogen bonding acceptors, and the blue is hydrogen bonding donor. .................................. 130
Figure 5-1. Left: vial and lifting used for the solvent extraction van’t Hoff analysis, right: temperature controlled water bath. ........................................................................................... 150
Figure 5-2. Change in log Kex for Nd (red) Am (black) extractions with HDEHP, within different diluents (top left toluene, top right chloroform, bottom left n-octane, bottom right nitrobenzene) as a function of the temperature. ....................................................................... 152
Figure 5-3. Correlation of ΔH and TΔS of extraction of a series of diluent (where T = 298.15°K). Black squares: neodymium data, red spheres: americium data. ........................... 156
Figure A-1. Daily consumption of energy per capita vs. the six stages of human development .................................................................................................................................................. 166
Figure A-2. United Nation HDI data[4] versus annual PCEC[3] ................................................. 169
Figure A-3. World population estimates from 1800 to 2100, based on "high", "medium" and "low" United Nations projections in 2017[7] ............................................................................. 170
Figure A-4. CO2 gas pollutant emission per unit of energy used (integrated though the LCA, in function of the energy source. .............................................................................................. 172
xviii
Figure A-5. NOX (left) and SO2 (right) pollutant emission per unit of energy used (integrated though the LCA, in function of the energy source. .................................................................. 173
Figure A-6. Range of material requirement (fuel excluded) for various electricity generation technologies .............................................................................................................................. 175
Figure A-7. Representative of the land use estimates for a variety of the electricity generating technologies from reference [11]. Left: data represented on a linear scale, right: data represented on a logarithmic scale. ................................................................................... 176
xix
Dedication
This dissertation is dedicated to my wife Lindsey, my mother, and father
for your support, kindness, and selflessness.

1
CHAPTER ONE
1 INTRODUCTION
Solvent Extraction
Generality
Solvent Extraction (SX) is one of the most common separation techniques, because of its
simplicity, speed and wide scope. SX is a practice that has been performed for centuries to achieve
many objectives.[1] It is the main process involved in perfume and dye extractions, but also the
reprocessing of Rare Earth Elements for energy production and technology development[2], the
purification of plutonium for the making of atomic bombs[3], the recycling of nuclear fuels[4], and
the separation and purification of strategic transition metal[5]. This technique has also been shown
by Rydberg to be extremely useful in the determination of metal-ligand stability constants.[6]
Therefore, modern use has made this process an essential daily practice in many scientific
laboratories. The main concept of solvent extraction is using the difference of solubility of an
analyte (S) between two immiscible liquids to partition the solute between the two phases.
Figure 1-1. Schematic representation of solvent extraction, where a solute S is distributed between the upper (lighter) yellow phase and the lower (heavier) blue phase.
2
The distribution law, derived in 1898 by W. Nernst[7], relates the distribution of a solute between
phase 1 and phase 2.
S)*+,-. ⇌ S)*+,-0 (1.1)
The equilibrium constant for reaction (1.1), the Nernst distribution law, called the distribution
constant (originally described in French: “coefficient de partage”), can be written as shown in
equation (1.2).
𝐾1 =[S)*+,-0][S)*+,-.]
(1.2)
where the brackets denote the concentration of the solute. If KD is greater than one, the solute will
move from phase 1 to phase 2. Conversely, the solute will remain in phase 1 if the distribution
constant is less than one.
The KD is an interesting parameter for solvent extraction, it is applicable to describe the distribution
of a molecular solute that can be stabilized in either phase by the action of solvation alone (Nernst
law). The Nernst partitioning coefficient does not apply if the analyte needs a chemical reaction to
be extracted. If a chemical reaction other than solvation is required, the primary parameter in
solvent extraction is the distribution ratio D, calculated by the ratio of the formal concentration of
the analyte in the organic phase over the formal concentration of the same analyte in the aqueous
phase.
𝐷 =∑[�̅�]∑[𝐴] (1.3)
3
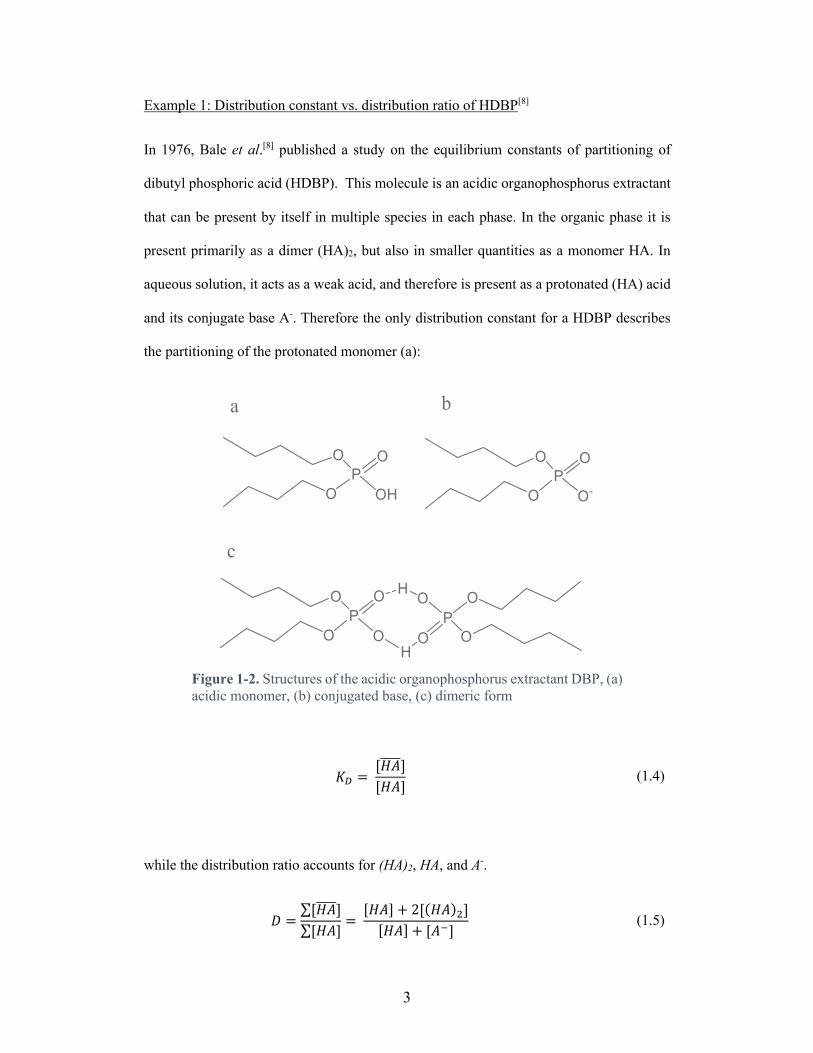
Example 1: Distribution constant vs. distribution ratio of HDBP[8]
In 1976, Bale et al.[8] published a study on the equilibrium constants of partitioning of
dibutyl phosphoric acid (HDBP). This molecule is an acidic organophosphorus extractant
that can be present by itself in multiple species in each phase. In the organic phase it is
present primarily as a dimer (HA)2, but also in smaller quantities as a monomer HA. In
aqueous solution, it acts as a weak acid, and therefore is present as a protonated (HA) acid
and its conjugate base A-. Therefore the only distribution constant for a HDBP describes
the partitioning of the protonated monomer (a):
Figure 1-2. Structures of the acidic organophosphorus extractant DBP, (a) acidic monomer, (b) conjugated base, (c) dimeric form
𝐾1 = [𝐻𝐴::::][𝐻𝐴]
(1.4)
while the distribution ratio accounts for (HA)2, HA, and A-.
𝐷 =∑[𝐻𝐴::::]∑[𝐻𝐴]
= [𝐻𝐴] + 2[(𝐻𝐴)0][𝐻𝐴] + [𝐴?]
(1.5)
4
The Nernst partitioning constants and the distribution ratio describing two different analytes can
be significantly different depending on the experimental conditions. This difference can be
exploited to separate two analytes. This process is called liquid-liquid separation (extraction) and
is characterized by the separation factor (SF), which is defined by the equation (1.6)
𝑆𝐹B./B0 = 𝐾1B.𝐾1B0
(1.6)
𝑆𝐹B./B0 = 𝐷B.𝐷B0
(1.6)
It is also interesting to note that in more “practical” situations (such as in chemical engineering for
characterizing separation schemes), solvent extraction can be characterized in percent extraction
of a solute (also called the extraction factor):
%𝐸 = 100𝐷
1 + 𝐷 (1.7)
Different Types of Solvent Extraction of Metal Cations
During the early years of the solvent extraction sciences, SX was mostly used by organic chemists
for separating organic substances. Since in those extraction the solute often exists under the same
molecular (or supramolecular) form, the system is often referred to as non-electrolyte reaction
(NE), also called nonreactive extraction. Later it was discovered that many organic weak acids (or
5
bases) could complex a targeted ion in an aqueous phase, to form a complex soluble in an organic
phase.
SH/? + A?/H ⇌ SA (1.8)
where S represents the targeted ionic solute in the aqueous phase, A the organic ligand, SA the
complex and the bar on the top of the complex specifies that the complex is solvated in the organic
phase. This is an example of an ion pairing extraction. The reagent responsible for forming the
extractable (solvable) complex is termed the extractant.
1.1.2.1 Solvent Extraction by Solvating Agent
Here the SX by Solvating Agent (SXSA) is in particular the one described as extraction of metal
complex as adducts in Solvent Extraction, Principle and Practice[9]. Solvent extraction by a
solvating agent is the extraction process in which a neutral extractant is extracting a neutral species.
If the neutral extractant is coordinatively unsaturated, it forms a MAz(H2O)x hydrated species. If
the ligand A is not an extractant, this hydrated species does not partition into the organic phase.
However, if the aqueous molecules are replaced by organic neutral molecules, the lipophilicity of
the adduct will drastically increase (proportionally to the number of coordinated organic
extractant) until saturation[10].
MKH +zA? + bBO ⇌ MAK ∙ bB::::::::::: (1.9)
6
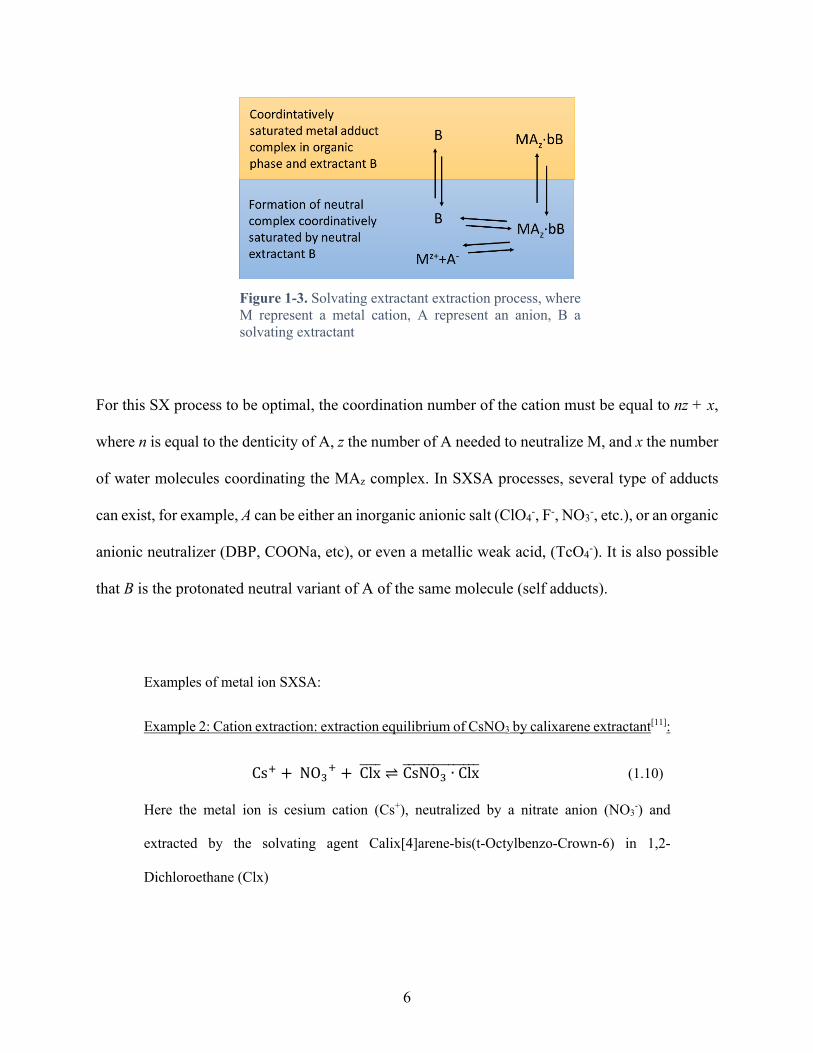
Figure 1-3. Solvating extractant extraction process, where M represent a metal cation, A represent an anion, B a solvating extractant
For this SX process to be optimal, the coordination number of the cation must be equal to nz + x,
where n is equal to the denticity of A, z the number of A needed to neutralize M, and x the number
of water molecules coordinating the MAz complex. In SXSA processes, several type of adducts
can exist, for example, A can be either an inorganic anionic salt (ClO4-, F-, NO3-, etc.), or an organic
anionic neutralizer (DBP, COONa, etc), or even a metallic weak acid, (TcO4-). It is also possible
that B is the protonated neutral variant of A of the same molecule (self adducts).
Examples of metal ion SXSA:
Example 2: Cation extraction: extraction equilibrium of CsNO3 by calixarene extractant[11]:
CsH +NOUH +Clx:::: ⇌ CsNOU ∙ Clx::::::::::::::: (1.10)
Here the metal ion is cesium cation (Cs+), neutralized by a nitrate anion (NO3-) and
extracted by the solvating agent Calix[4]arene-bis(t-Octylbenzo-Crown-6) in 1,2-
Dichloroethane (Clx)
7
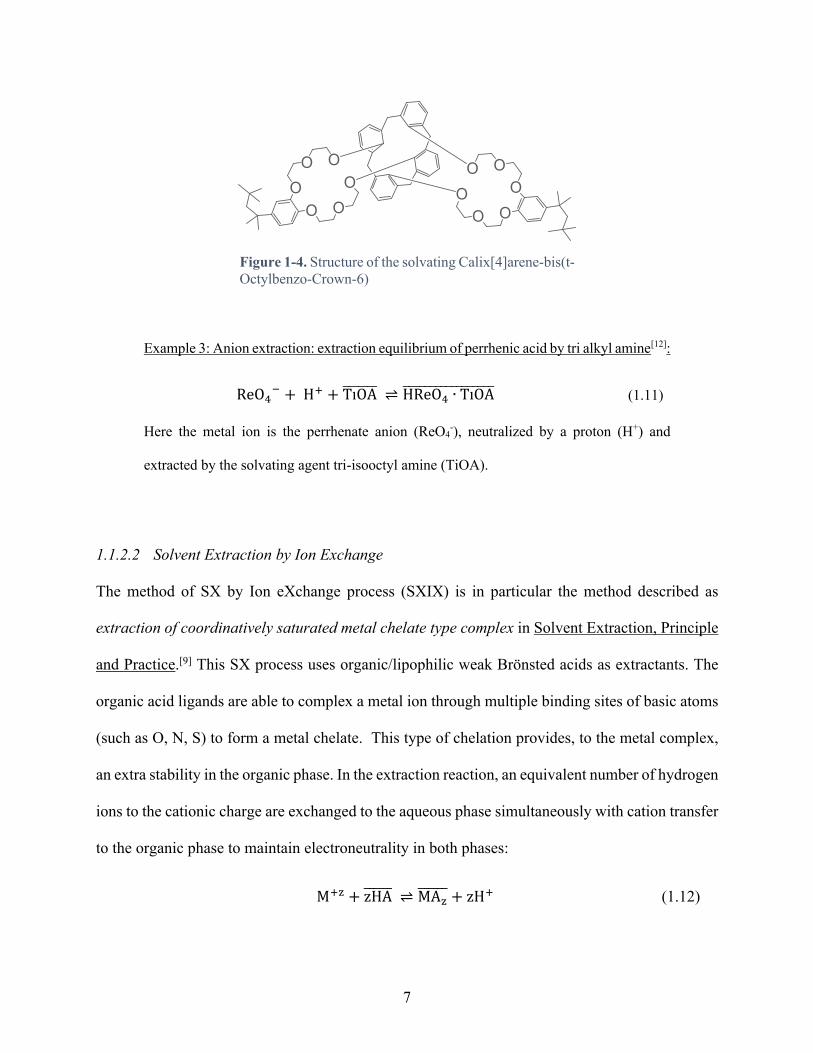
Figure 1-4. Structure of the solvating Calix[4]arene-bis(t-Octylbenzo-Crown-6)
Example 3: Anion extraction: extraction equilibrium of perrhenic acid by tri alkyl amine[12]:
ReOZ? +HH + TıOA::::::: ⇌ HReOZ ∙ TıOA::::::::::::::::: (1.11)
Here the metal ion is the perrhenate anion (ReO4-), neutralized by a proton (H+) and
extracted by the solvating agent tri-isooctyl amine (TiOA).
1.1.2.2 Solvent Extraction by Ion Exchange
The method of SX by Ion eXchange process (SXIX) is in particular the method described as
extraction of coordinatively saturated metal chelate type complex in Solvent Extraction, Principle
and Practice.[9] This SX process uses organic/lipophilic weak Brönsted acids as extractants. The
organic acid ligands are able to complex a metal ion through multiple binding sites of basic atoms
(such as O, N, S) to form a metal chelate. This type of chelation provides, to the metal complex,
an extra stability in the organic phase. In the extraction reaction, an equivalent number of hydrogen
ions to the cationic charge are exchanged to the aqueous phase simultaneously with cation transfer
to the organic phase to maintain electroneutrality in both phases:
MHK + zHA:::::: ⇌ MAK:::::: + zHH (1.12)
8
In order to describe more precisely SEIX, it is not unusual to describe the extraction process
through a stepwise reaction with the deprotonated anion A- added until the coordination sphere of
the metal being mostly (or completely) saturated with the extractant (water could be also present
in the coordination sphere, depending on the denticity and the concentration of the extractant).
When the number of extractants are sufficient for the metal chelate to become hydrophobic, the
complex can partition between the phases.
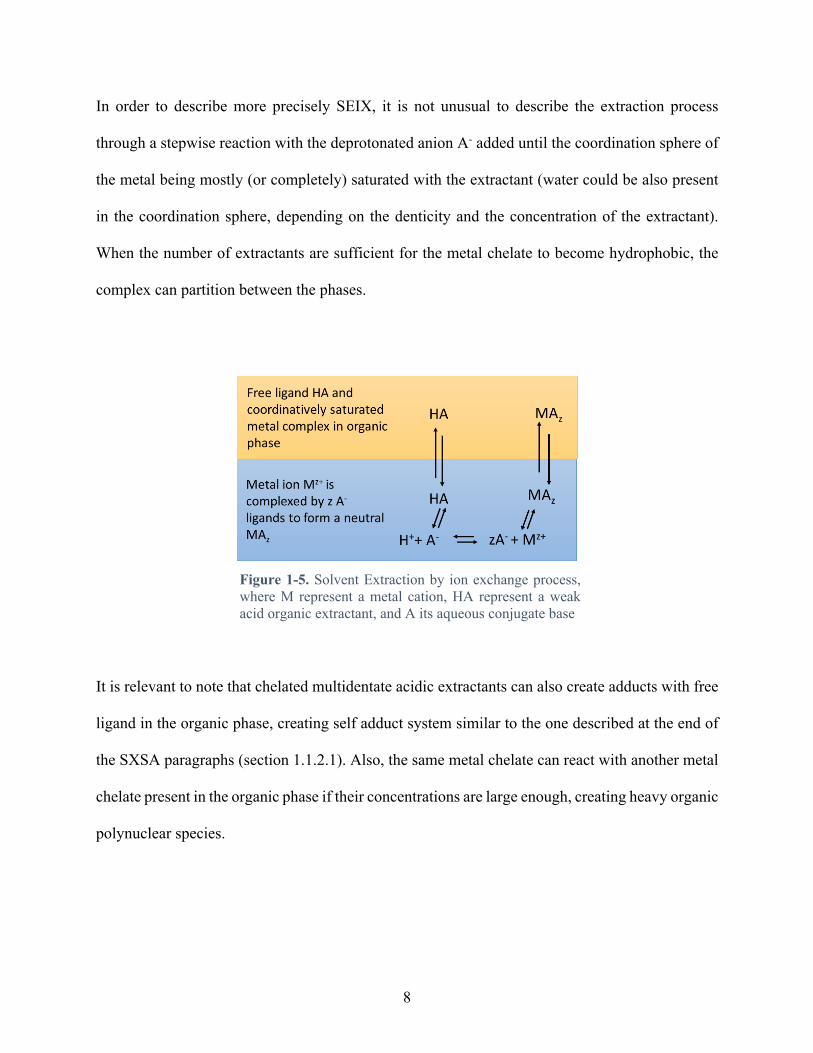
Figure 1-5. Solvent Extraction by ion exchange process, where M represent a metal cation, HA represent a weak acid organic extractant, and A its aqueous conjugate base
It is relevant to note that chelated multidentate acidic extractants can also create adducts with free
ligand in the organic phase, creating self adduct system similar to the one described at the end of
the SXSA paragraphs (section 1.1.2.1). Also, the same metal chelate can react with another metal
chelate present in the organic phase if their concentrations are large enough, creating heavy organic
polynuclear species.
9
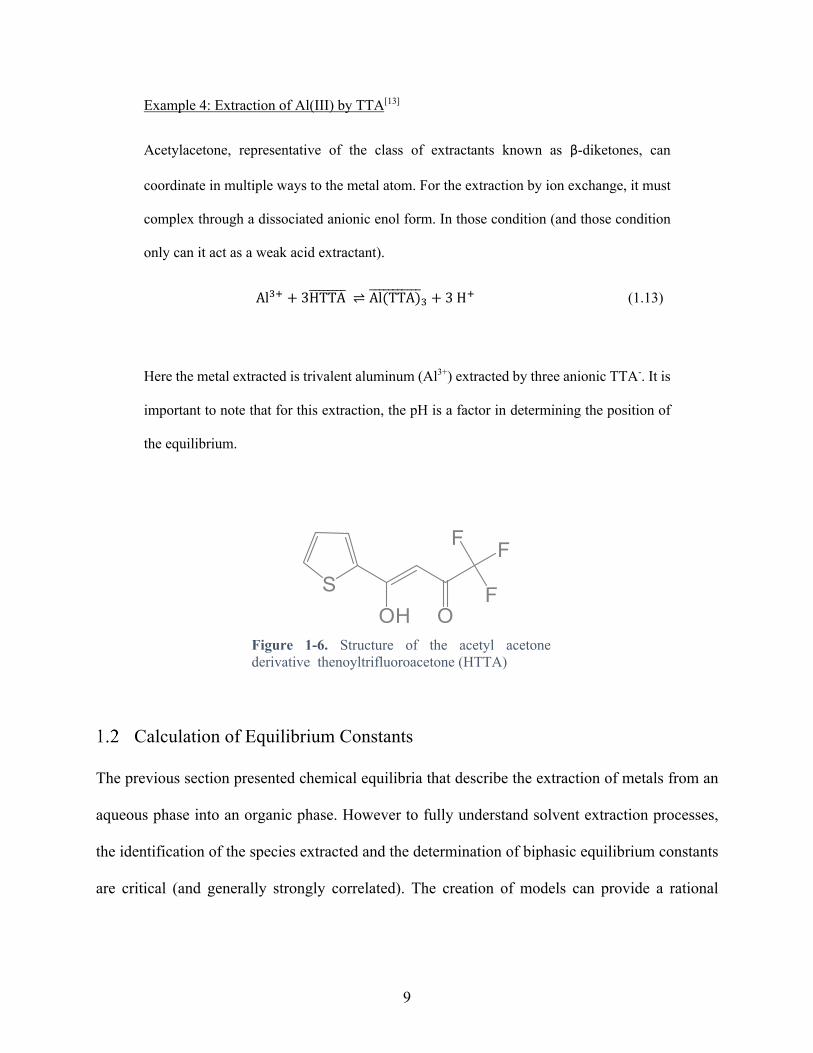
Example 4: Extraction of Al(III) by TTA[13]
Acetylacetone, representative of the class of extractants known as β-diketones, can
coordinate in multiple ways to the metal atom. For the extraction by ion exchange, it must
complex through a dissociated anionic enol form. In those condition (and those condition
only can it act as a weak acid extractant).
AlUH + 3HTTA:::::::: ⇌ Al(TTA):::::::::::U + 3HH (1.13)
Here the metal extracted is trivalent aluminum (Al3+) extracted by three anionic TTA-. It is
important to note that for this extraction, the pH is a factor in determining the position of
the equilibrium.
Figure 1-6. Structure of the acetyl acetone derivative thenoyltrifluoroacetone (HTTA)
Calculation of Equilibrium Constants
The previous section presented chemical equilibria that describe the extraction of metals from an
aqueous phase into an organic phase. However to fully understand solvent extraction processes,
the identification of the species extracted and the determination of biphasic equilibrium constants
are critical (and generally strongly correlated). The creation of models can provide a rational
10
understanding of the chemical principles of solvent extraction to determine those equilibrium
constants.
Two of major methods of determination of critical stability constants are the Ligand Number
Method and Graphic Slope Analysis, both usually referred to as slope analysis.
Ligand Number Method (LNM)
In 1941, Bjerrum developed the LNM method to identify the average composition of the metal
species in the system[14]. This method considers the extraction of MAn into the organic phase and
assumes that the metal exists as one species, MAn, in the aqueous phase. Taking the derivative the
logarithm of the distribution of the metal between each phase versus the logarithm of the formal
concentration of extractant in the system the following equation (1.14) is obtained[15]:
𝜕 log𝐷𝜕 log[𝐴]b[c][d][e][B]
= 𝑚 ∙ 𝑛ghi − 𝑚 ∙ 𝑛kl (1.14)
Where m·norg and m·naq are the metal:ligand ratio in the respective phases. The subscript indicates
other parameters that are held constant. [M], [H], [X], [S], refer respectively to the metal,
hydrogen ion, background electrolyte, and diluent. While it is commonly assumed that the number
of ligands per central atom is a whole number (indicating a fixed stoichiometry), in 1941 Bjerrum
presented the concept of average ligand number, defined as the mean number of ligands per central
atom[14].
𝑛ghi:::::: = ∑𝑛[𝑀𝐴n::::::][𝑀O]
(1.15)
11
It has been also be shown that the n can be substituted by𝑛: in equation (1.16) so it can be redefined
as[9],[15]:
𝜕 log𝐷𝜕 log[𝐴]b[c][d][e][B]
= 𝑛ghi:::::: − 𝑛kl::::: (1.16)
Similarly, equation (1.17) defines the average metal number per complex:
𝜕 log𝐷𝜕 log[𝑀]b[o][d][e][B]
= 𝑚ghi::::::: − 𝑚klp::::::: (1.17)
and equation (1.18) defines the average number of hydrogen ions per metal complex:
𝜕 log𝐷𝜕 log[𝐻]b[o][c][e][B]
= ℎghi:::::: − ℎklp:::::: (1.18)
In the case of the extraction of a metal cation by a weak acid (e.g. Example 4: Extraction of Al(III)
by TTA[13]), equation (1.18) will give a negative result, indicating the number of protons needed
to exchange to achieve a charge balance between the extracted metal and the weak acid to extract
a neutral species[15].
Graphic Slope Analysis:
The graphic slope analysis (GSA) method is the most common analytical plot used to characterize
a solvent extraction system. If used correctly it can give multiple types of critical information on
an extraction system, such as the average ligand number and the coefficient of extraction.
12
For a rational application of the GSA, it is important to measure the distribution ratio of the analyte
with one variable component with the concentration of all other components of the system being
kept constant. By this method, the solvent extraction equation can be expressed into a polynomial
of type:
𝑦 = 𝑎t +u𝑎v𝑥v (1.19)
where y is a function of the distribution ratio of the analyte and x is a function of the variable for
the graphic analysis.
Example 5: Utilization of a GSA in a system humic and fulvic acids with Th(IV)[16]
In a study probing the interaction of humic and fulvic acids with Th(IV) using solvent
extraction by HDEHP, Nash and Choppin characterized their system with GSA using a
second order polynomial:
𝐷𝐷t− 1 = 𝑎𝛽$(𝑍) + 𝑏0𝛽{(𝑍)0 (1.20)
with y being the ratio of D over D0 minus 1, D0 being the distribution ratio of thorium in
absence of aqueous carboxylate, a and b fitting parameters, bx and by respectively the
researched stability constants for 1:1 binding site and a 1:2 binding site, and Z the total
carboxylate binding sites.

13
However, when the expression can be expressed in a simple linear plot where i=1,
(y = a0 + a1·x) from the plot of y vs. x the intercept on the x axis yields the a0 parameter and the
slope yields the a1 parameter. This treatment method can be referred as the limiting value method.
However, in a more general case, this method also called linear slope graphic analysis.[1]
Example 6: Simple linear slope graphic analysis: extraction of Cu(II) by TTA[9],[17]
In the Figure 1-7, Liljenzin et al. used acetylacetonate to extract divalent copper from 1
mol.L-1 perchlorate media as function of pH and free extractant. The following equilibrium
is the accepted solvent extraction mechanism which is based on the charge balance and the
coordination of Cu(II):
Cu0H + 2HTTA::::::::: ⇌ Cu(TTA)0::::::::::::: + 2HH (1.21)
However, in the case an investigative study of this mechanism the previous equilibrium
need to be demonstrated. Here the oxidation state is unknown:
Cu}H + nHTTA::::::::: ⇌ Cu(TTA)}::::::::::::: + nHH (1.22)
To solve for this equilibrium, it is assumed that TTA cannot self-adduct (create an oligomer
composed exclusively of multiple molecules of TTA) based on the stereochemistry of
Cu(II), the coordinative atoms (O-, O:), the number of acidic group (1) and the chelate ring
size (6, Cu-O-C=C-C=O:-Cu). In Figure 1-7 the logarithm of the distribution ratio of
copper (DCu) has been plotted versus the pH at equilibrium at constant [HTTA] (large plot)
and, in the insert plot, the logarithm of the free ligand at constant pH. In Figure 1-7, it can
be seen that log DCu is a function of pH at constant F[HA], while at constant pH the log DCu
14
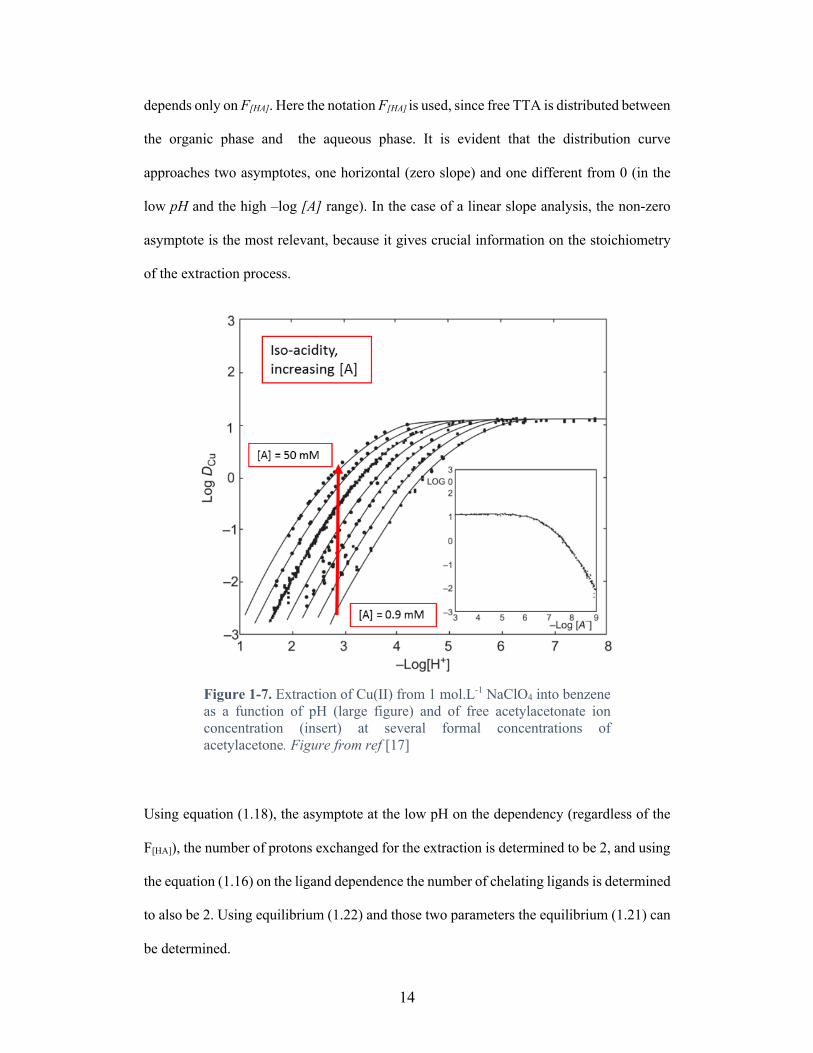
depends only on F[HA]. Here the notation F[HA] is used, since free TTA is distributed between
the organic phase and the aqueous phase. It is evident that the distribution curve
approaches two asymptotes, one horizontal (zero slope) and one different from 0 (in the
low pH and the high –log [A] range). In the case of a linear slope analysis, the non-zero
asymptote is the most relevant, because it gives crucial information on the stoichiometry
of the extraction process.
Figure 1-7. Extraction of Cu(II) from 1 mol.L-1 NaClO4 into benzene as a function of pH (large figure) and of free acetylacetonate ion concentration (insert) at several formal concentrations of acetylacetone. Figure from ref [17]
Using equation (1.18), the asymptote at the low pH on the dependency (regardless of the
F[HA]), the number of protons exchanged for the extraction is determined to be 2, and using
the equation (1.16) on the ligand dependence the number of chelating ligands is determined
to also be 2. Using equilibrium (1.22) and those two parameters the equilibrium (1.21) can
be determined.

15
Then using this equilibrium the following extraction equilibrium can be determined.
𝐾#$ = [𝐶𝑢(𝑇𝑇𝐴)0][𝐻H]0
[𝐶𝑢][𝐻𝑇𝑇𝐴]0 (1.23)
Using equation (1.3) to simplify the equation (1.23) the following equation can be
determined:
𝐾#$ = 𝐷�p[𝐻H]0
[𝐻𝑇𝑇𝐴]0 (1.24)
Analytical Determination of Distribution Ratios.
In the previous section, the role of the distribution ratio of the analyte has been shown to be crucial
for the determination of the coefficient of extraction Kex. Today a large number of methods of
measuring distribution coefficients has been developed, and this number is more likely going to
increase over time (based on the creativity of the solvent extraction community). In addition, even
if there are multiple distribution ratio determination methods, there are some that are most
commonly used.
Spectrophotometric Determinations
Spectrophotometric determination of distribution ratios is a commonly used method.
Spectrophotometric determination of concentration (and thereby distribution ratios) has the main
advantage of being readily accessible and generally accepted. Unfortunately, only a few analytes
are capable of absorbing light in the UV-Vis region, with a large enough coefficient of extinction.
For that reason a number of the spectrophotometric methods use a color forming reagent, such as
16
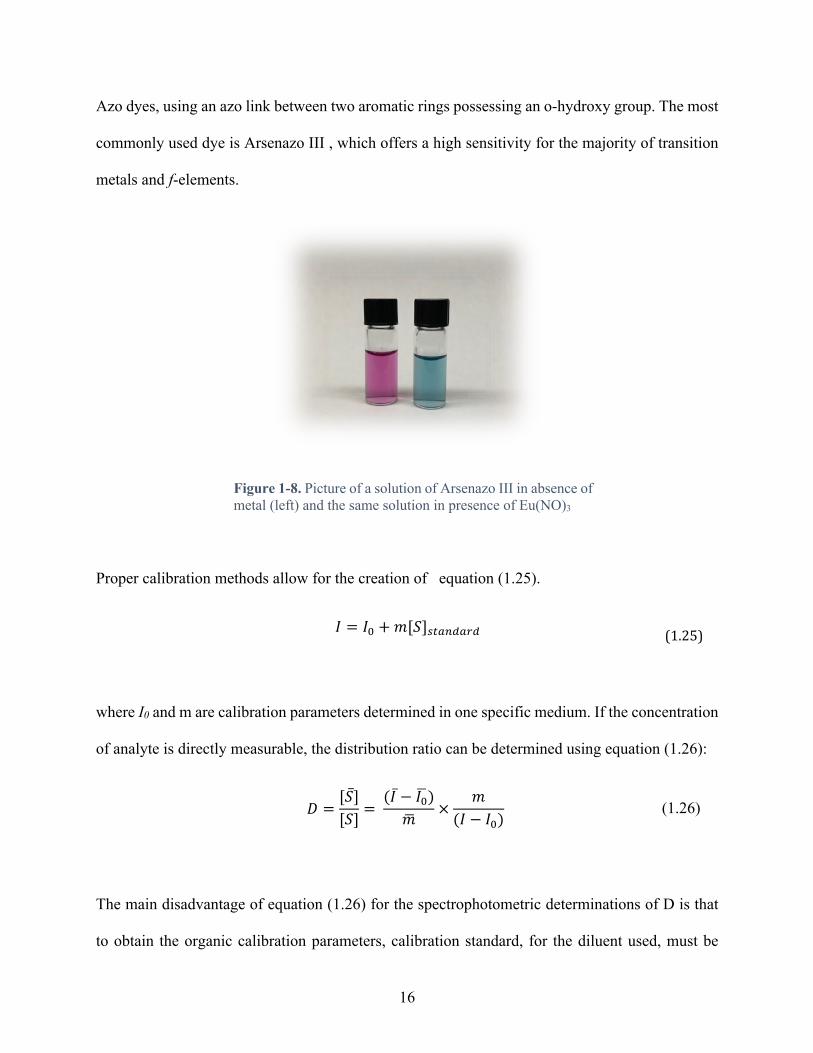
Azo dyes, using an azo link between two aromatic rings possessing an o-hydroxy group. The most
commonly used dye is Arsenazo III , which offers a high sensitivity for the majority of transition
metals and f-elements.
Figure 1-8. Picture of a solution of Arsenazo III in absence of metal (left) and the same solution in presence of Eu(NO)3
Proper calibration methods allow for the creation of equation (1.25).
𝐼 = 𝐼t + 𝑚[𝑆]��kn�kh� (1.25)
where I0 and m are calibration parameters determined in one specific medium. If the concentration
of analyte is directly measurable, the distribution ratio can be determined using equation (1.26):
𝐷 =[𝑆̅][𝑆] =
(𝐼 ̅ − 𝐼tO)𝑚O
×𝑚
(𝐼 − 𝐼t) (1.26)
The main disadvantage of equation (1.26) for the spectrophotometric determinations of D is that
to obtain the organic calibration parameters, calibration standard, for the diluent used, must be

17
available and generally accepted. A common solution to this problem could be to strip the analyte
from the organic phase to an aqueous phase (back extraction), and then to analyze it. This method
only works if it is possible to establish a complete back extraction of the analyte, including possible
dilution effects. If such standard and back extractions are too complicated, a simpler method is
possible based on assuming mass balance. Providing that no third phase is created during the
extraction process, the following equation is true:
[𝑆̅]#l = [𝑆]vnv�vk� − [𝑆]#l (1.27)
where [𝑆̅]#l and [𝑆]#l are respectively the concentration of analyte in the organic and aqueous
phase at equilibrium, and [𝑆]vnv�vk� the concentration of analyte in the aqueous phase before
extraction. Equation (1.27) can be used to define the distribution ratio, D as follows,
𝐷 =[𝑆]vnv�vk� − [𝑆]#l
[𝑆]#l (1.28)
or, as written in terms of absorption intensity:
𝐷 =𝐼vnv�vk� −𝐼#l
𝐼#l (1.29)
This expression is independent of any calibration as long as the intensity of the signal is above the
limit of detection and below the saturation.

18
Flame, Inductively Coupled Plasma, Spectroscopy
These techniques are atomic spectroscopy, which means that the analyte is atomized by
combustion with a flame or a plasma. Due to the atomization process (all molecular species are
decomposed into atoms, and sometimes a change also in the oxidation state). Atomic
spectrophotometry is particularly used for the determination of metal concentration. In principle,
these techniques are extremely similar to the spectrophotometric determination for the
determination of D, permitting the utilization of the equation (1.29) in most of the cases, although
some research groups decide to calibrate their system for the analyte and to use equation (1.26).
Mass Spectrometry
Regardless of the ionization and mass measurement process, mass spectrometry (MS) is a
relatively versatile analytical method. It has long been used to measure isotopes, decipher organic
structures, and even determine microorganism identification. For SX of metal chelates, the most
common utilization is the measure the mass of ions using coupled ICP-MS. The utilization of a
high resolution MS adds the option to take into account the isotopic ratio of the cations studied.
For example, silver possesses two naturally occurring isotopes with a difference of isotopic masses
of 2 Da. If the resolution of the MS is not high enough, one of the isotope of silver could be easily
confounded with another element. If the instrument is used to its best potential, ICP-MS enables
simultaneous study of a large number of metal distribution ratios in a single experiment. The
determination of D for MS is usually done using equation (1.29).

19
Radiometric Analysis
1.3.4.1 The Use of Radioactivity
The radiometric determination of a distribution ratio is most likely the most common method used
by radiochemists around the world. This method uses the proportionality between the
concentration of radioactive analyte (RA) and the radioactivity of the solution – equation (1.30).
[𝑅𝐴] ∝𝑅𝑉 (1.30)
where R is the radioactivity in Bq of the analyte, and V the volume of solution. Knowing the
equation (1.30), and analyzing equal volume samples of each phase, the following equation is true:
𝐷 =[𝑅𝐴::::][𝑅𝐴] =
𝑅:𝑅 (1.31)
One challenge in the utilization of the radiometric method is the choice of the appropriate detection
method. The easiest method is the detection of gamma rays (if gamma rays are emitted). With the
assumption that the difference in the linear energy absorption of gamma ray is negligible between
an organic phase and an aqueous phase, the following equation can be used:
𝐷 =�̅�𝐴 (1.32)
where A is the measured signal of a gamma ray of a specific energy per aliquot of phase (in
Bq/mL). The utilization of high-resolution gamma spectrometers allow the analysis of a large
number of gamma emitter at the same time - Figure 1-9.

20
Figure 1-9. Self-cooled high precision gamma counting instrument, left instrument closed for analysis, right instrument open for sample changing.
For the analyses of beta emitters, a direct measure of the A is not always possible, due to the fast
loss of energy of a beta particle. To simplify the measurement of beta activity, the analyte can be
diluted into a scintillation liquid, converting the energy of the beta decay into light.
Unfortunately, this process does not work for all systems, such as when the radioactive analyte is
solvated in aromatic and chlorinated diluents, where the signal is strongly quenched by the diluent.
To counter this effect, equation (1.29) can be used to measure the distribution ratio.
1.3.4.2 Neutron Activation Analysis
Neutron Activation Analysis (NNA) is one of the most commonly used method by radiochemists.
This is a nuclear process used for determining the concentrations of elements in a vast amount of
materials. NAA allows discrete sampling of elements as it disregards the chemical form of a
21
sample, and focuses solely on its nucleus. The method is based on neutron activation and therefore
requires a source of neutrons.
The main difficulty of NAA is access to a neutron reactor, and the useful neutron cross section
of analyte.
Research Focus
The Acidic Organophosphorus Extractant HEH[EHP]
Solvent extraction has generally been the method of choice for the purification of metals,
regardless of their utilization, from transition metals (such as copper[18], cobalt, nickel[19], etc), rare
earth elements[2],[20], even hazardous metal such as actinides and other radioactive materials[21],[22].
As stated previously in section 1.1.1, solvent extractions / separations are based on the difference
in solubility of chemical species dissolved in each phase of a biphasic (liquid-liquid) system.
However, metal electrolytes (ions) are not soluble by themselves in a non-aqueous phase due to
the poor solvating ability of the organic solvent for charged species. Therefore, they cannot be
extracted without the help of lipophilic complexing agent called an extractant. IUPAC describes
the extractant as the active component(s) primarily responsible for transfer of a solute from one
phase to the other.[23] Most modern extractants are amphiphilic molecules, due to their increased
extraction efficiency[24]. However extractants that can distribute between each phase are still
frequently used.
The variety of extractants commercially available is extremely large, and a significant portion of
them are used for the purification of metallic cations. The organophosphorus extractant family is
one of the major families of extractants used in research and at industrial scale.

22
Organophosphorus compounds, both acid and neutral, provide a versatile range of solvent
extraction, either as a primary extractant or as a synergetic agent. In the 1950s, it was recognized
that the radiolysis/hydrolysis products of tributyl phosphate (TBP) mono and dibutyl phosphoric
acids were very effective extractant for the hexavalent uranium.[25]
Figure 1-10. Structures of tributyl phosphate (a) dibutyl phosphoric acid (b) and monobutyl phosphoric acid (c)
(RO)UPO +nHH�+�����,�,/*������,�,�⎯⎯⎯⎯⎯⎯⎯⎯⎯⎯⎯⎯⎯⎯⎯� (RO)U?}PO(OH)} + nRH (1.33)
UO00H + 2(RO)0PO(OH) ⇌ UO0((O)OP(OR)0)0 + 2HH (1.34)
Acidic organophosphorus extractants extract metals by cation exchange (see section 1.1.2.2, page
7) of enough acidic hydrogen ions of the extractant(s) to allow the extraction of an electroneutral
complex of the metal ion. Unlike the large majority of the other acidic extractants, which do not
associate molecularly in non-polar media, acidic organophosphorus extractants have a strong
tendency toward association into dimer in the non-polar organic phase. Also it is common for the
metal extractant complex MAz to get solvated by one or more additional extractant molecule HA
PO
OOO
PO
O OOH
PO
O OHOH
a b
c
23
(degree of solvation), MAz(HA)y. The nomenclature of the acidic organophosphorus extractant
can be extremely confusing between sources. Without attempting to favor any of them,
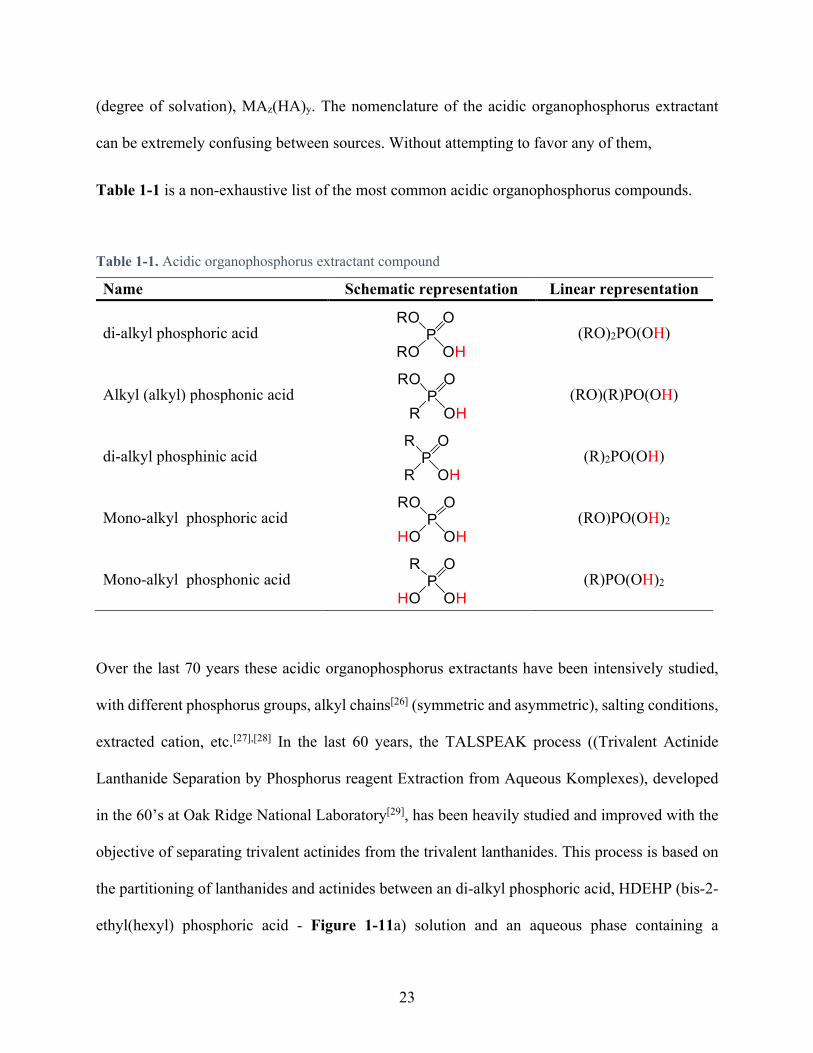
Table 1-1 is a non-exhaustive list of the most common acidic organophosphorus compounds.
Table 1-1. Acidic organophosphorus extractant compound
Name Schematic representation Linear representation
di-alkyl phosphoric acid
(RO)2PO(OH)
Alkyl (alkyl) phosphonic acid
(RO)(R)PO(OH)
di-alkyl phosphinic acid
(R)2PO(OH)
Mono-alkyl phosphoric acid
(RO)PO(OH)2
Mono-alkyl phosphonic acid
(R)PO(OH)2
Over the last 70 years these acidic organophosphorus extractants have been intensively studied,
with different phosphorus groups, alkyl chains[26] (symmetric and asymmetric), salting conditions,
extracted cation, etc.[27],[28] In the last 60 years, the TALSPEAK process ((Trivalent Actinide
Lanthanide Separation by Phosphorus reagent Extraction from Aqueous Komplexes), developed
in the 60’s at Oak Ridge National Laboratory[29], has been heavily studied and improved with the
objective of separating trivalent actinides from the trivalent lanthanides. This process is based on
the partitioning of lanthanides and actinides between an di-alkyl phosphoric acid, HDEHP (bis-2-
ethyl(hexyl) phosphoric acid - Figure 1-11a) solution and an aqueous phase containing a

24
polyaminopolycarboxylate complexant. The latter reagent is principally responsible for holding
back the trivalent actinides, allowing the selective transfer of the lanthanides into the organic
phase.[30]–[33] In the last decade, an advanced TALSPEAK process has been suggested, proposing
to replace HDEHP with a less acidic but structurally analogous extractant alkyl(alkyl)phosphonic
acid HEH[EHP] (2-ethyl(hexyl)phosphoric acid mono-2-ethyl(hexyl) ester - Figure 1-11b)[34].
Different arguments on the use of HEH[EHP] vs. HDEHP have been made, focusing on the green
chemistry aspect of the use of less acidic extractant.[35]
Figure 1-11. Chemical structure of (a) Bis-2-ethyl(hexyl) phosphoric acid (HDEHP) and (b) 2-Ethyl(hexyl)phosphoric acid mono-2-ethyl(hexyl) ester. pKa values from ref [35]
The use of HEH[EHP] in SX system allow for work in less acidic conditions allowing the use of
other buffer and aqueous complexants and increasing the predictability of SX processes. While a
reasonable amount of information on the aqueous chemistry exists of SX using HEH[EHP], very
little is known about the organic phase. This is mostly due to a number of options of user friendly
25
analytical methods and techniques able to probe molecular interactions in this phase. Furthermore,
even less information is available on the role of the diluent in the SX process using HEH[EHP].
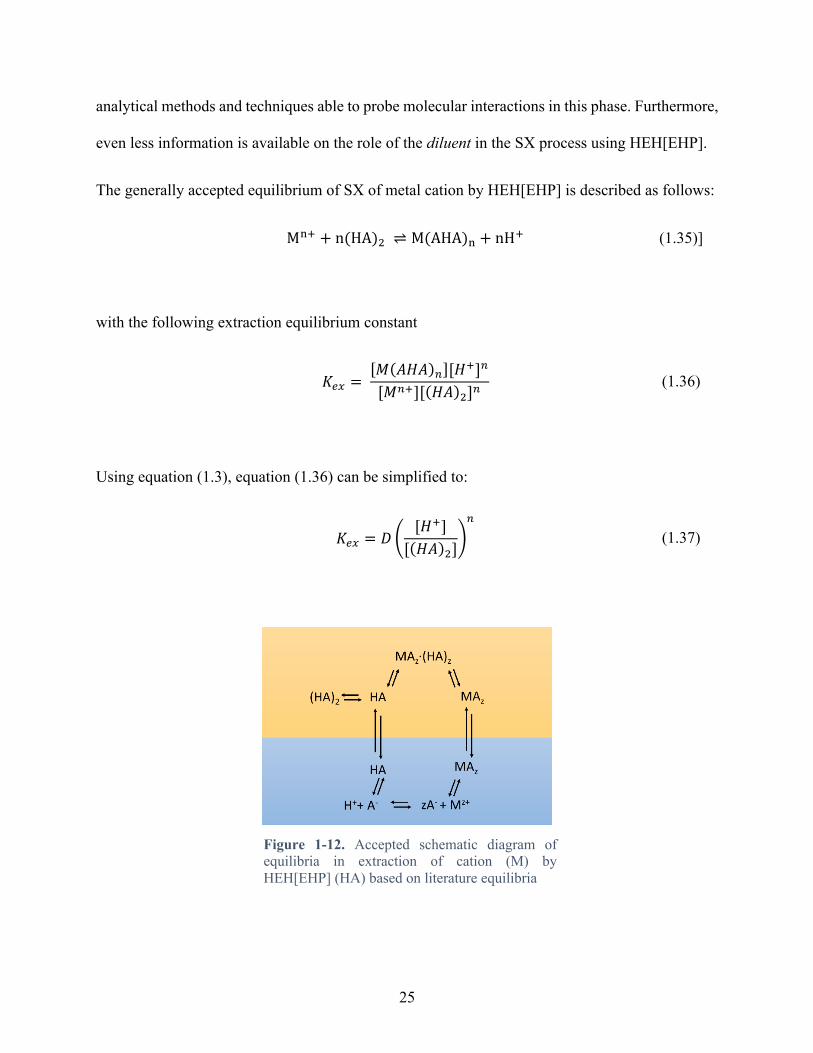
The generally accepted equilibrium of SX of metal cation by HEH[EHP] is described as follows:
M}H + n(HA)0 ⇌ M(AHA)} + nHH (1.35)]
with the following extraction equilibrium constant
𝐾#$ = [𝑀(𝐴𝐻𝐴)n][𝐻H]n
[𝑀nH][(𝐻𝐴)0]n (1.36)
Using equation (1.3), equation (1.36) can be simplified to:
𝐾#$ = 𝐷 �[𝐻H]
[(𝐻𝐴)0]�n
(1.37)
Figure 1-12. Accepted schematic diagram of equilibria in extraction of cation (M) by HEH[EHP] (HA) based on literature equilibria

26
Following this mechanism, and accepting that HEH[EHP] complexes with metal cation as
described in the literature[9],[34],[2] - Figure 1-13 – the metal chelate is formed through two basic
atoms O- and Ӧ:, with a ring size of 7 atoms, metal excluded (M-O-P=O:--H-O-P=O:--M).
Figure 1-13. Accepted structure of the metal chelate formed between a metal cation of charge n and n dimers ref [9]- appendix D
However, it should be emphasized, that it has been demonstrated that for similar mono acidic
organophosphorus extractant (such has di-butyl phosphate and di-octyl phosphate, etc), the Kex,
the average ligand number (also called degree of polymerization, degree of solvation, average
stoichiometry, etc), and the degree of dimerization of the free extractant are sensitive to various
experimental parameters[27],[28],[36]:
• Organic diluent,
• pH of the aqueous solution,
• ionic strength of the aqueous solution,
• Background electrolyte used,
• Extractant used,
• Cation extracted ,
• Etc.

27
In the past, it has been hypothesized that the main reason for the deviation from the ideal behavior
(Figure 1-13) lies in the particular state of solvation of these extractants (are they completely
solvated, dimerized, polymerized, complexed, etc.).[10]
For the purpose of the presented work, the focus is going to be extended to the effect of the organic
diluent on the solvent extraction process of trivalent f-elements by HEH[EHP] and HDEHP.
The Diluent effect
The alchemist’s research for a “Menstruum universal” (universal solvent) indicates the importance
given to the diluent and the process of solubility in a larger scheme, with the development of the
popular “Similia Similibus Solvuntur” (similar solubilizes similars). Diluents are liquids, under the
conditions of this application, in which other substance can be solvated (hydrated if the diluent is
water). In the case of SX, the diluent refers exclusively the non-aqueous phase (organic or ionic
liquid).
As stated in section 1.4.2, the SX process can be strongly impacted by the diluent itself. Regarding
understanding of the SX processes, the development of our knowledge on the diluent effect
reflects, to some extent, to development of the solvent extraction chemistry itself.
A large variety of liquids (condensed fluids) can be used in solvent extraction. They are usually
divided, in the context of SX, into different classes[37]:
• Class 1: Liquids capable of forming three-dimensional networks of strong hydrogen bonds.
Eg. Water, poly and amino alcohol, hydroxyl-acids etc.

28
• Class 2: Liquids with both active hydrogen atoms and donor atoms (oxygen, nitrogen, and
fluorine) but that cannot create a three dimensional network. They are generally called
protic and protogenic substances.
Eg. Primary alcohols, carboxylic acids, primary and secondary amines, nitro compound
with α-positioned hydrogen atoms, condensed ammonia etc.
• Class 3: Liquids containing donor atoms without hydrogen donor atoms. They are
generally called dipolar aprotic substance.
Eg. Ether, ketone, aldehydes, esters, ternary amines, nitro compounds without α-hydrogen,
phosphoryl group containing solvent etc.
• Class 4: Liquids composed of molecules containing active hydrogen atoms, but no donor
atoms.
e.g. Chloroform, dichloromethane, etc.
• Class 5: Liquids with no hydrogen-bond forming capability and no donor atoms. This class
can be also subdivided into two sub category
o Class 5.1: Aliphatic liquids. They are in general open chains (linear or branched)
hydrocarbons, but can also possess one or multiple non-aromatic cycles.
e.g. Ethenes, paraffins, etc.
o Class 5.2: Aromatic liquids: they are in general liquid that verify the Hückel’s rule of
aromaticity.
e.g. Class 5’s benzene derivatives
29
In solvent extraction, only classes 3 to 5 are used as diluent, since they are generally insoluble in
aqueous media. The classes 4 and 5 do not solvate any salt without the help of extractants, however
it has been shown that class 3 can also act as an extractant by itself, without the need of additional
extractants.
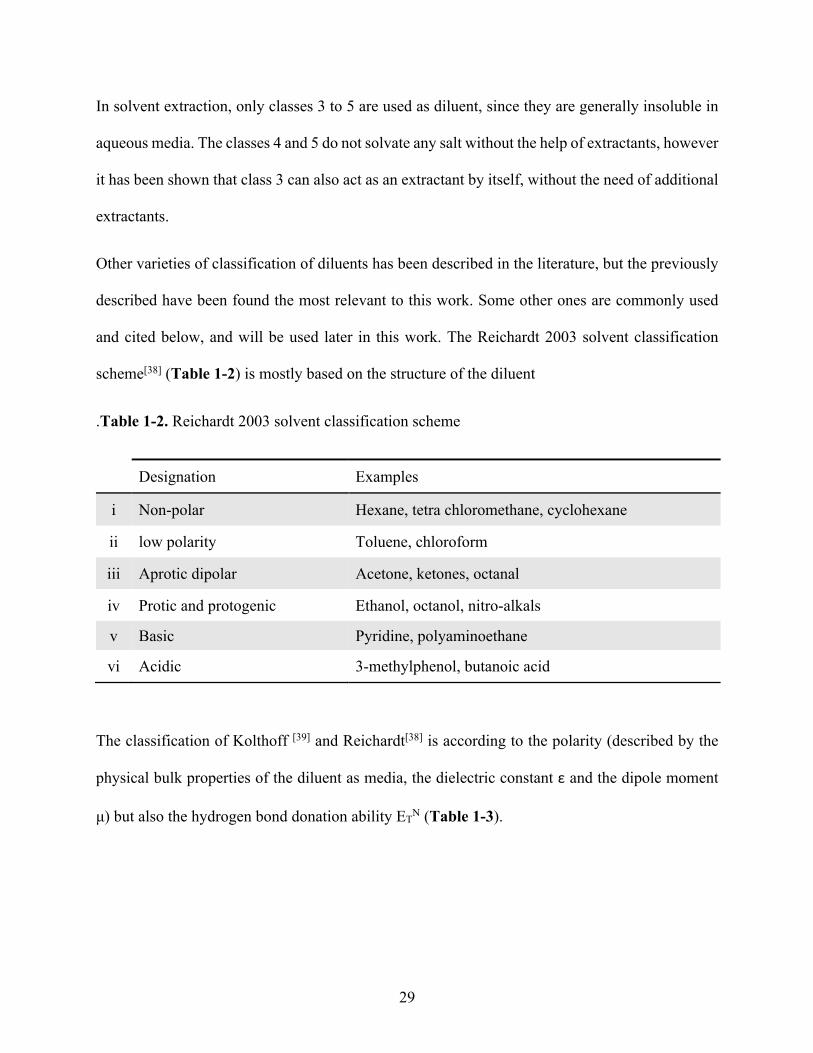
Other varieties of classification of diluents has been described in the literature, but the previously
described have been found the most relevant to this work. Some other ones are commonly used
and cited below, and will be used later in this work. The Reichardt 2003 solvent classification
scheme[38] (Table 1-2) is mostly based on the structure of the diluent
.Table 1-2. Reichardt 2003 solvent classification scheme
Designation Examples
i Non-polar Hexane, tetra chloromethane, cyclohexane
ii low polarity Toluene, chloroform
iii Aprotic dipolar Acetone, ketones, octanal
iv Protic and protogenic Ethanol, octanol, nitro-alkals
v Basic Pyridine, polyaminoethane
vi Acidic 3-methylphenol, butanoic acid
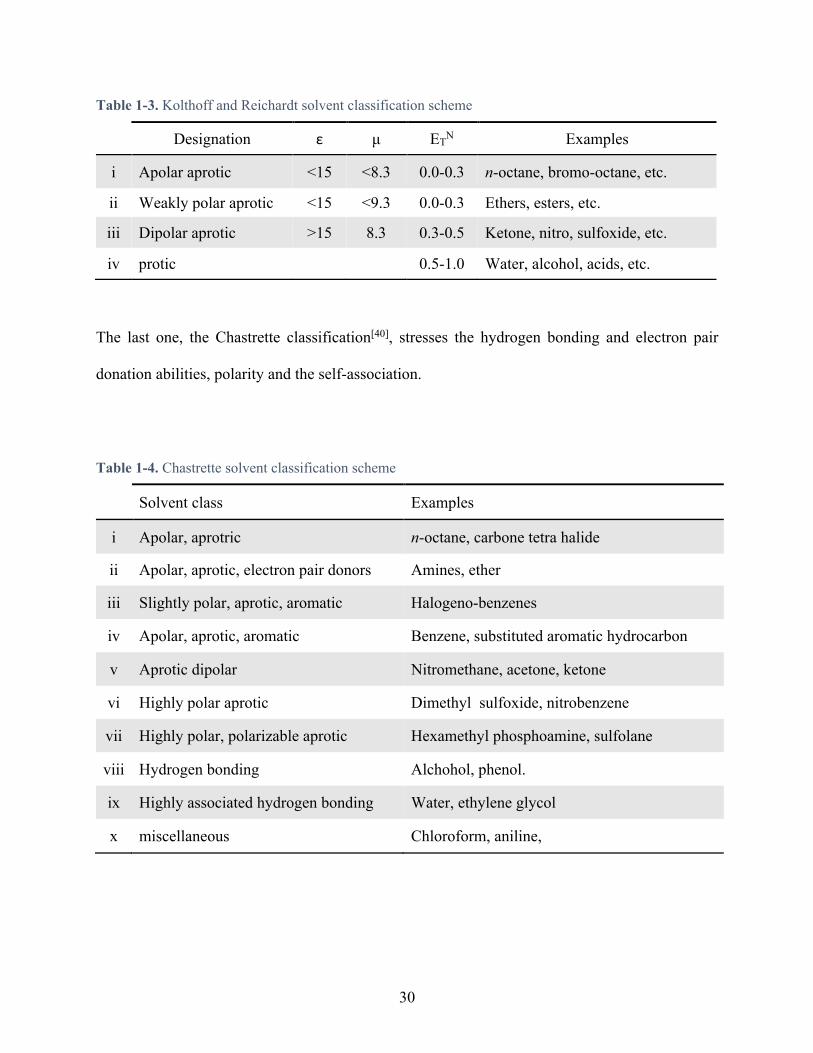
The classification of Kolthoff [39] and Reichardt[38] is according to the polarity (described by the
physical bulk properties of the diluent as media, the dielectric constant ε and the dipole moment
μ) but also the hydrogen bond donation ability ETN (Table 1-3).
30
Table 1-3. Kolthoff and Reichardt solvent classification scheme
Designation ε μ ETN Examples
i Apolar aprotic <15 <8.3 0.0-0.3 n-octane, bromo-octane, etc.
ii Weakly polar aprotic <15 <9.3 0.0-0.3 Ethers, esters, etc.
iii Dipolar aprotic >15 8.3 0.3-0.5 Ketone, nitro, sulfoxide, etc.
iv protic 0.5-1.0 Water, alcohol, acids, etc.
The last one, the Chastrette classification[40], stresses the hydrogen bonding and electron pair
donation abilities, polarity and the self-association.
Table 1-4. Chastrette solvent classification scheme
Solvent class Examples
i Apolar, aprotric n-octane, carbone tetra halide
ii Apolar, aprotic, electron pair donors Amines, ether
iii Slightly polar, aprotic, aromatic Halogeno-benzenes
iv Apolar, aprotic, aromatic Benzene, substituted aromatic hydrocarbon
v Aprotic dipolar Nitromethane, acetone, ketone
vi Highly polar aprotic Dimethyl sulfoxide, nitrobenzene
vii Highly polar, polarizable aprotic Hexamethyl phosphoamine, sulfolane
viii Hydrogen bonding Alchohol, phenol.
ix Highly associated hydrogen bonding Water, ethylene glycol
x miscellaneous Chloroform, aniline,

31
1.4.2.1 Basic diluent properties: the intermolecular forces
The existence of these diluents as liquids at room temperature is the result of cohesive forces
between molecules. The lowest cohesive force for a diluent (diluent class 5.1 and 5.2) is the
London dispersion (also called dispersive force). The motions of the electrons in the atoms of the
molecule induce a transient electric dipole in a neighboring molecule, which in turn strengthens
the temporary dipole in the first molecule. This mutual interaction produces an attractive cohesive
force. The class 5.1 and class 5.2 diluents are hold together in a condensed phase by such forces.
Figure 1-14. Schematic representation of the London dispersion. Top for a monatomic particle, bottom for a hydrocarbon
Polar liquids (characterized by the presence of at least one permanent dipole moment) can
spontaneously “arrange” in a head to tail configuration, driven by a dipole-dipole interaction (the
localized positive charge of one dipole orients toward the negative charge of the neighboring
molecule). This association results in a larger attraction force than the London dispersion. The
energy associated with this force is proportional to the product of the dipole moment of the
molecule and inversely proportional to the sixth power of the mean distance between them.

32
Figure 1-15. Schematic representation of a head to tail dipole-dipole interaction (e.g., acetone)
Finally, some liquids that are used in solvent extraction interact through intermolecular hydrogen
bond. Such molecules have a hydrogen atom attached to a very electronegative atom (F, O, N).
Those atoms are able to attract an hydrogen atom from a neighboring molecule, forming an rigid
hydrogen bridge. This is the strongest bond existing in the liquid state.
The three forces described above collectively as the cohesive force. They are the forces that keep
the molecules of liquid together and are ultimately responsible for a large majority of chemical
properties of liquids.
One method commonly used to characterize the cohesive nature of a liquid is by measuring the
heat of vaporization of the liquid, ΔvH. Using ΔvH in the equation (1.38) the parameter δ2 can be
calculated. This parameter is called the cohesive energy density.[41]
𝛿0 = ∆�𝐻 − 𝑅𝑇
𝑉 (1.38)
where R is the gas constant, T is the absolute temperature, V the molar volume. This parameter
(Hildebrand or Hildebrand-Scott parameter) is called the cohesive energy density[41], and can also
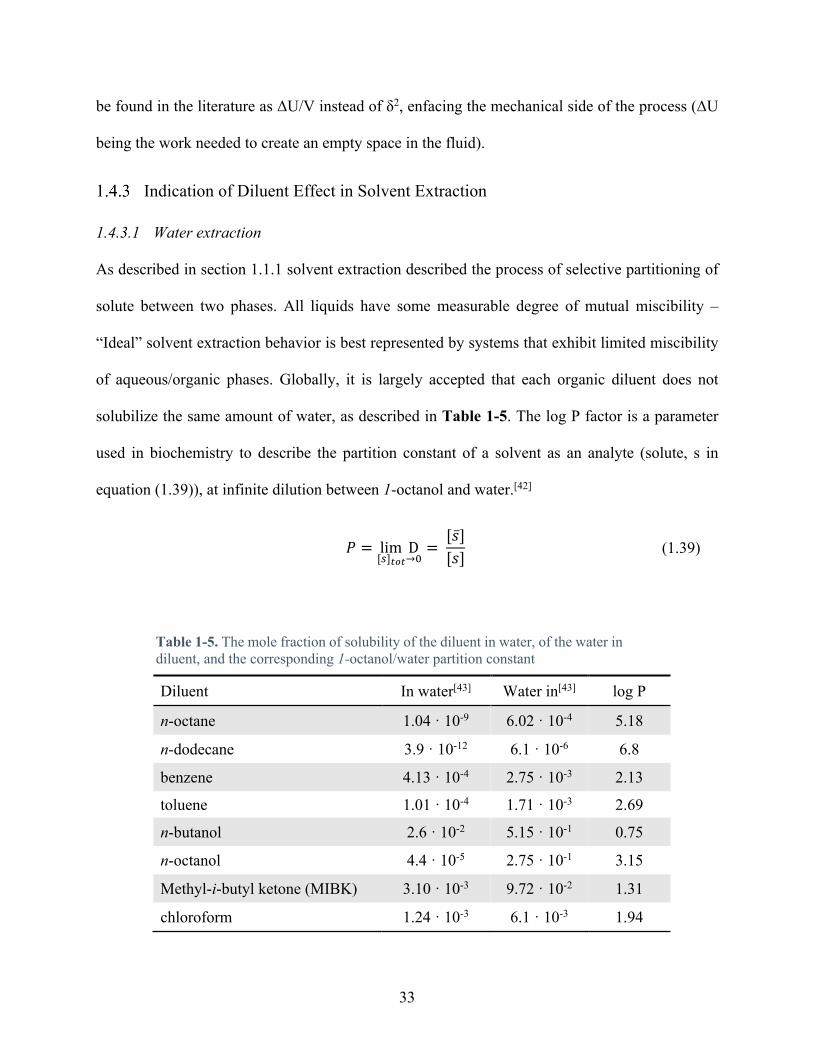
33
be found in the literature as ΔU/V instead of δ2, enfacing the mechanical side of the process (ΔU
being the work needed to create an empty space in the fluid).
Indication of Diluent Effect in Solvent Extraction
1.4.3.1 Water extraction
As described in section 1.1.1 solvent extraction described the process of selective partitioning of
solute between two phases. All liquids have some measurable degree of mutual miscibility –
“Ideal” solvent extraction behavior is best represented by systems that exhibit limited miscibility
of aqueous/organic phases. Globally, it is largely accepted that each organic diluent does not
solubilize the same amount of water, as described in Table 1-5. The log P factor is a parameter
used in biochemistry to describe the partition constant of a solvent as an analyte (solute, s in
equation (1.39)), at infinite dilution between 1-octanol and water.[42]
𝑃 = lim D[�] ¡ →t
= [�̅�][𝑠] (1.39)
Table 1-5. The mole fraction of solubility of the diluent in water, of the water in diluent, and the corresponding 1-octanol/water partition constant
Diluent In water[43] Water in[43] log P
n-octane 1.04 · 10-9 6.02 · 10-4 5.18
n-dodecane 3.9 · 10-12 6.1 · 10-6 6.8
benzene 4.13 · 10-4 2.75 · 10-3 2.13
toluene 1.01 · 10-4 1.71 · 10-3 2.69
n-butanol 2.6 · 10-2 5.15 · 10-1 0.75
n-octanol 4.4 · 10-5 2.75 · 10-1 3.15
Methyl-i-butyl ketone (MIBK) 3.10 · 10-3 9.72 · 10-2 1.31
chloroform 1.24 · 10-3 6.1 · 10-3 1.94

34
As a primitive analysis, it can be seen that the diluents “extract” more water following this order:
alcoholic > MIBK > chloroform > aromatic > aliphatic-hydrocarbons. Comparing n-octane to
n-dodecane it is apparent that increasing the length of the chain of the diluent decreases the
solubility of water (similar observation can be made between n-butanol and n-octanol), and by
functionalizing benzene with a methyl group (toluene) decrease the solubility of water.
There are other criteria that impact the choice of a diluent, beside its influence on the chemistry
itself (shift of equilibria, change in stoichiometry, kinetics, etc.), and its miscibility with water.
The physical properties are also a major concern (especially for large-scale utilization of SX);
properties to be considered (depending on the projected application include properties like density,
viscosity, volatility, flash point, resistance to degradation by contact with aqueous acid/base/redox
active species or radiolysis. Further criteria for choice are also the cost, toxicity, chemical reaction
hazard, etc.
Example 7: practical examples of the importance of the choice of the diluent for SX based
on physical properties
Density: fluorobenzene is a diluent with a density that can be equal to aqueous solution
(density of fluorobenzene[42] : 1.02 kg·L-1, density of 0.5 mol.L-1 nitrate ionic strength[44] :
1.03 kg·L-1). This relatively close density makes the stable top/bottom positioning of the
phases impossible (or at least more complicated) - Figure 1-16.
Viscosity: Tri-n-butyl phosphate can be used as a diluent, however is relatively high
viscosity make the phase engagement (increasing of the surface by mechanically creating
an emulsion) more difficult. This difficulty is one of the reasons why TBP is dissolved in
kerosene for the PUREX process[21].
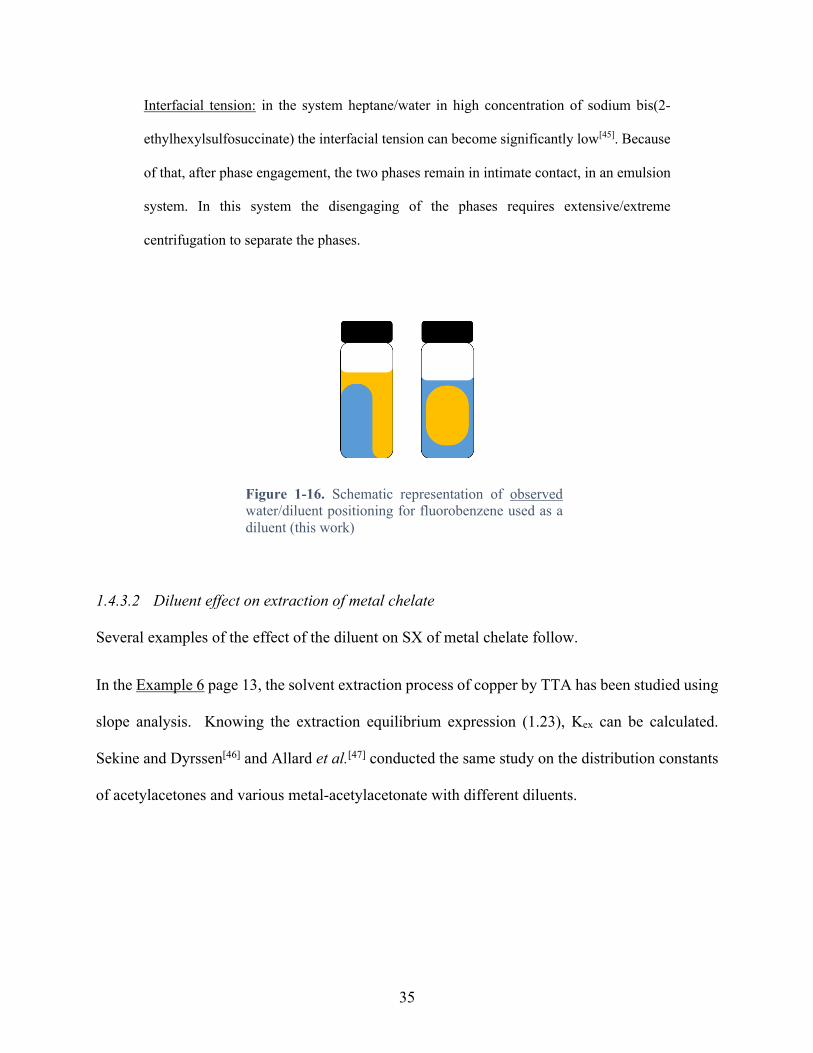
35
Interfacial tension: in the system heptane/water in high concentration of sodium bis(2-
ethylhexylsulfosuccinate) the interfacial tension can become significantly low[45]. Because
of that, after phase engagement, the two phases remain in intimate contact, in an emulsion
system. In this system the disengaging of the phases requires extensive/extreme
centrifugation to separate the phases.
Figure 1-16. Schematic representation of observed water/diluent positioning for fluorobenzene used as a diluent (this work)
1.4.3.2 Diluent effect on extraction of metal chelate
Several examples of the effect of the diluent on SX of metal chelate follow.
In the Example 6 page 13, the solvent extraction process of copper by TTA has been studied using
slope analysis. Knowing the extraction equilibrium expression (1.23), Kex can be calculated.
Sekine and Dyrssen[46] and Allard et al.[47] conducted the same study on the distribution constants
of acetylacetones and various metal-acetylacetonate with different diluents.
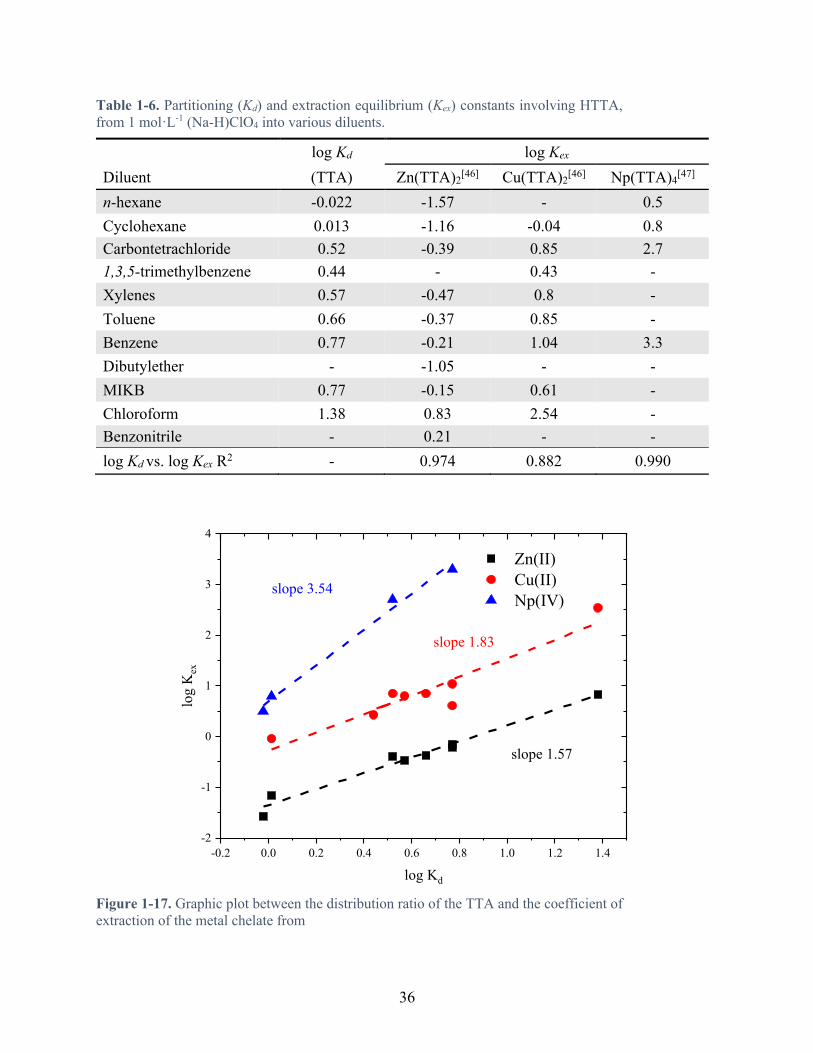
36
Table 1-6. Partitioning (Kd) and extraction equilibrium (Kex) constants involving HTTA, from 1 mol·L-1 (Na-H)ClO4 into various diluents.
log Kd log Kex
Diluent (TTA) Zn(TTA)2[46] Cu(TTA)2[46] Np(TTA)4[47] n-hexane -0.022 -1.57 - 0.5 Cyclohexane 0.013 -1.16 -0.04 0.8 Carbontetrachloride 0.52 -0.39 0.85 2.7 1,3,5-trimethylbenzene 0.44 - 0.43 - Xylenes 0.57 -0.47 0.8 - Toluene 0.66 -0.37 0.85 - Benzene 0.77 -0.21 1.04 3.3 Dibutylether - -1.05 - - MIKB 0.77 -0.15 0.61 - Chloroform 1.38 0.83 2.54 - Benzonitrile - 0.21 - - log Kd vs. log Kex R2 - 0.974 0.882 0.990
Figure 1-17. Graphic plot between the distribution ratio of the TTA and the coefficient of extraction of the metal chelate from
-0.2 0.0 0.2 0.4 0.6 0.8 1.0 1.2 1.4-2
-1
0
1
2
3
4
slope 1.83
slope 3.54
Zn(II) Cu(II) Np(IV)
log
Kex
log Kd
slope 1.57
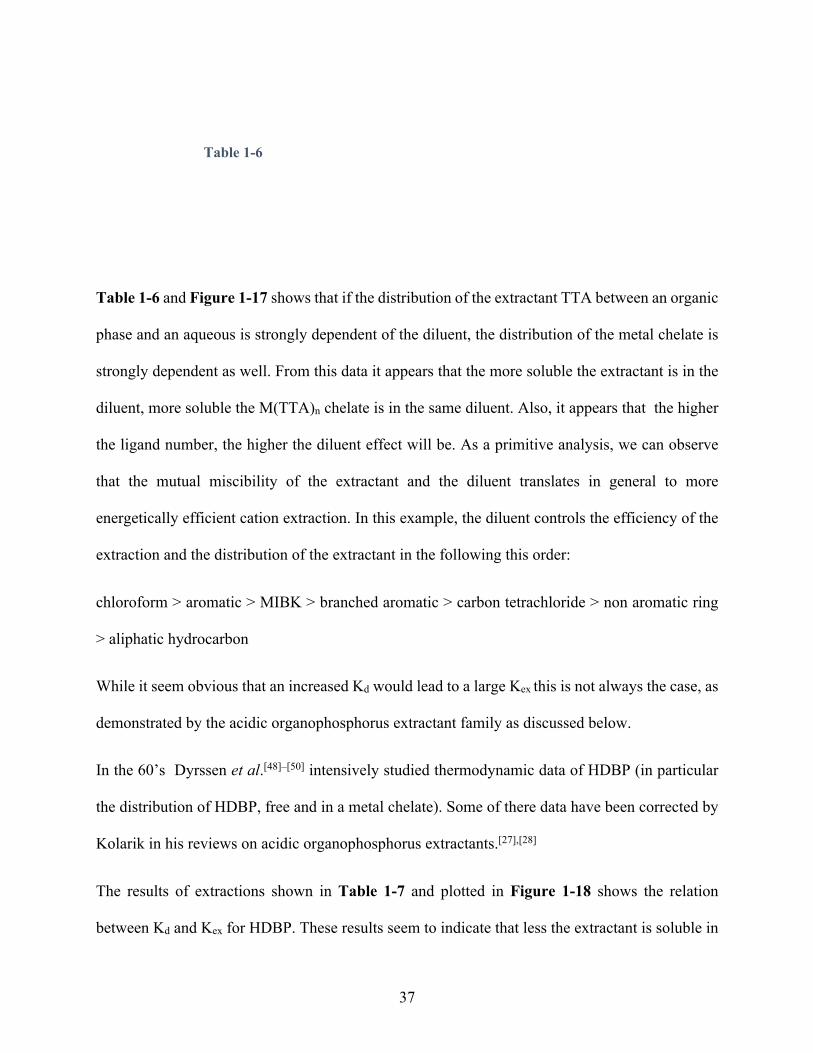
37
Table 1-6
Table 1-6 and Figure 1-17 shows that if the distribution of the extractant TTA between an organic
phase and an aqueous is strongly dependent of the diluent, the distribution of the metal chelate is
strongly dependent as well. From this data it appears that the more soluble the extractant is in the
diluent, more soluble the M(TTA)n chelate is in the same diluent. Also, it appears that the higher
the ligand number, the higher the diluent effect will be. As a primitive analysis, we can observe
that the mutual miscibility of the extractant and the diluent translates in general to more
energetically efficient cation extraction. In this example, the diluent controls the efficiency of the
extraction and the distribution of the extractant in the following this order:
chloroform > aromatic > MIBK > branched aromatic > carbon tetrachloride > non aromatic ring
> aliphatic hydrocarbon
While it seem obvious that an increased Kd would lead to a large Kex this is not always the case, as
demonstrated by the acidic organophosphorus extractant family as discussed below.
In the 60’s Dyrssen et al.[48]–[50] intensively studied thermodynamic data of HDBP (in particular
the distribution of HDBP, free and in a metal chelate). Some of there data have been corrected by
Kolarik in his reviews on acidic organophosphorus extractants.[27],[28]
The results of extractions shown in Table 1-7 and plotted in Figure 1-18 shows the relation
between Kd and Kex for HDBP. These results seem to indicate that less the extractant is soluble in
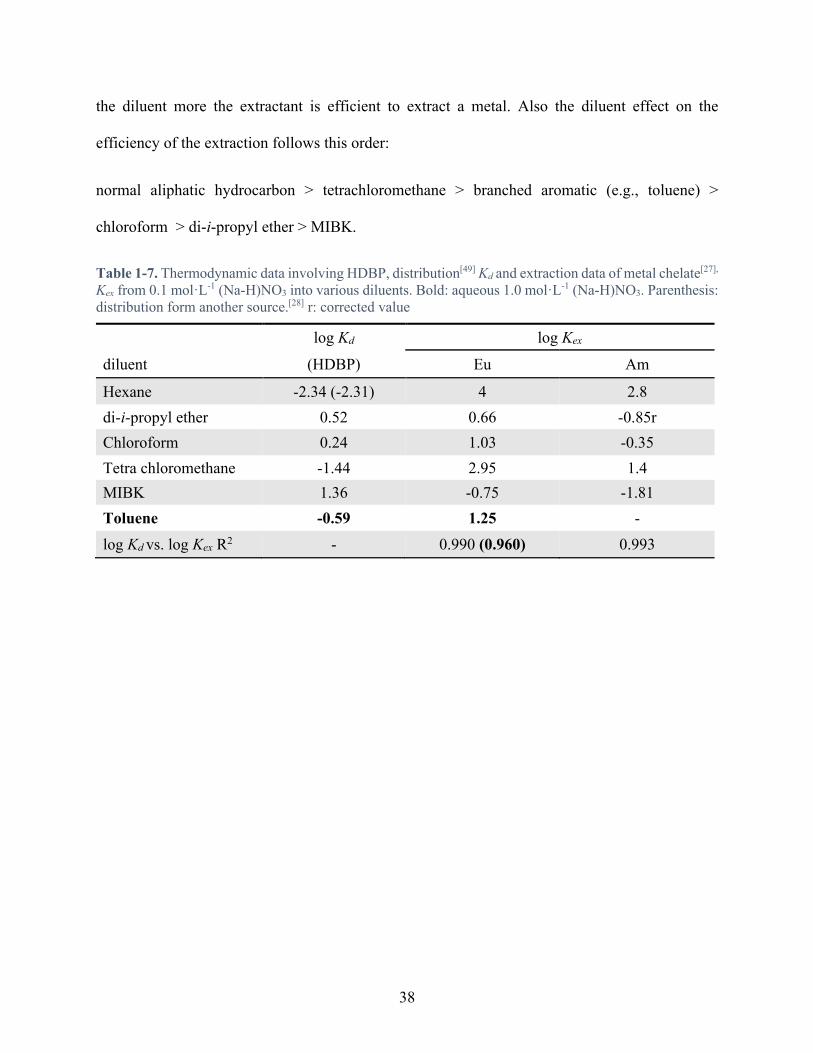
38
the diluent more the extractant is efficient to extract a metal. Also the diluent effect on the
efficiency of the extraction follows this order:
normal aliphatic hydrocarbon > tetrachloromethane > branched aromatic (e.g., toluene) >
chloroform > di-i-propyl ether > MIBK.
Table 1-7. Thermodynamic data involving HDBP, distribution[49] Kd and extraction data of metal chelate[27], Kex from 0.1 mol·L-1 (Na-H)NO3 into various diluents. Bold: aqueous 1.0 mol·L-1 (Na-H)NO3. Parenthesis: distribution form another source.[28] r: corrected value
log Kd log Kex
diluent (HDBP) Eu Am
Hexane -2.34 (-2.31) 4 2.8 di-i-propyl ether 0.52 0.66 -0.85r Chloroform 0.24 1.03 -0.35 Tetra chloromethane -1.44 2.95 1.4 MIBK 1.36 -0.75 -1.81 Toluene -0.59 1.25 - log Kd vs. log Kex R2 - 0.990 (0.960) 0.993
39
Figure 1-18. Graphic plot between the distribution ratio of the HDBP and the coefficient of extraction of the metal chelate from Table 1-7
In 1967 Kolarik published a study on the diluent effect on the extraction of Eu(III) and Tb(III) by
di-octyl-phosphoric acid (HDOP) - Figure 1-19a.[36] This extractant (and this study) is particularly
interesting for the work described here since the alkyl chain of HDOP, HDEHP and HEH[EHP]
contain the same number of carbon atoms in the alkyl chain (8), and because of this feature the Kd
can be approximated to be the same.[28] Furthermore, the Kd is sufficiently large to support the
approximation that the extractant is essentially immiscible in water, especially since the Kd is larger
for aqueous salted solution that for pure water (all reported Kd for HDOP give between 99.8 and
100% HDOP in the organic phase).[28] This study introduced for the first time a change in the
-2.5 -2.0 -1.5 -1.0 -0.5 0.0 0.5 1.0 1.5
-2
-1
0
1
2
3
4
Eu Am
log
Kex
log Kd

40
average number of ligands in the extracted metal chelate as a function of the diluent used - Figure
1-19cb.
Table 1-8. Thermodynamic data involving HDOP, Extraction data of metal chelate, log Kex from 0.1 mol·L-1 (Na-H)NO3 into various diluents, and average ligand number in the metal chelate from ref [36].
Eu Tb
diluent log Kex 𝑛: log Kex 𝑛:
n-heptane 2.98 2.5 3.88 2.5
i-octane 2.81 2.5 3.75 2.5
Cyclohexane 2.55 2.5 3.46 2.5
Chloroform 0.25 3 1.25 3
Tetrachloro methane - 3 - 3
Bromoform - 3 - 3
Di-butyl-ether 2.14 3 3.1 3
MIBK - 2 - 2
Benzene 1.13 3 2.11 3
Toluene 1.2 3 2.39 3
Chlorobenzene 1.2 3 2.25 3
nitrobenzene 0.89 2.5 1.9 2.5

41
Figure 1-19. Schematic representation of (a) di-octyl-phosphoric acid (HDOP), of the metal chelate with an average ligand number of 3 (b) and 2.5 (2)
The change in the average ligand number indicates that the chelate ring is can vary from 8 (M-O-
P=O--H-O-P=O--M), to 4 (M--O=P-O-M). However, if this chelate ring changes as a function of
the diluent used, no dependence has been demonstrated between 𝑛: and Kex.[27][36]
All of these results indicate that the diluent used in a SX process has a direct impact on the behavior
of the extractant, as a free ligand and as a chelating agent, but also on the coordination and
stereochemistry itself.
PO
O OOH
M
O
O
O OO
OP(OR)2
(RO)2P O H
O
(RO)2P
P(OR)2
OH
O
(RO)2PM
O
O
O OO
OP(OR)2
(RO)2P O H
O
(RO)2P
P(OR)2
OH
O
(RO)2P
P(OR)2
OH O
a
b c
42
Research scope
The impact of the diluent on SX processes has been cited in literature since its creation. A large
amount of literature exists on the impact of the diluent on the phase transfer, from a thermodynamic
point of view, kinetic, colloidal, thermal, coordination, etc.
The goal of this work is to improve the understanding the fundamental chemistry of the green
extractant HEH[EHP], in the context of solvent extraction of trivalent f-elements (Ln-Am). The f-
elements have been chosen due to their similar chemical behavior (same oxidation number, small
change in the ionic radii), which would help to understand the mechanism by reducing the possible
variation from one metal to another.
First, an advanced method for calculation of the Kex will be developed, integrating the concept of
average ligand number in the form of a MA3(HA)n metal chelate, instead of a the classic fixed
ligand number in the form of M(AHA)3. This method is going to be completed by spectroscopy
on the metal chelate (UV-Vis and Luminescence) to prove the conservation of the octahedral
environment (regardless of the diluent used).
Based on the methodology developed for the calculation of the Kex, a comparison between the
extraction of different f-elements is going to be described. This will give information on the
mechanism driving the SX process. To do so, a large number of diluents were used, with the
objective of plotting Linear Free Energy Diagram (LFED). Also particular attention was paid to
the impact of 1-octanol as a co-diluent (phase modifier), a mixed diluent system
(cyclohexane:benzene), the extraction of water by HEH[EHP] in the different diluents, and to a
phosphine oxide as extractant in different diluents.

43
Finally, complementary thermometric characterization of the diluent effect has been investigated
to characterize the diluent effect with entropic and enthalpic data.

44
References
(1) Cox, M.; Rydberg, J. Introduction to Solvent Extraction, 2nd ed.; Rydberg, J., Cox, M., Musikas, C., Choppin, G. R., Eds.; CRC Press: NY, 2004.
(2) Xie, F.; Zhang, T. A.; Dreisinger, D.; Doyle, F. A Critical Review on Solvent Extraction of Rare Earths from Aqueous Solutions. Miner. Eng. 2014, 56, 10–28.
(3) Rhodes, R. The Making of the Atomic Bomb; Simon, Schuster, Eds.; Touchstone Press, 2012.
(4) Collins, E. D.; Del Cul, G. D.; Moyer, B. A. Advanced Reprocessing for Fission Product Separation and Extraction. In Advanced Separation Techniques for Nuclear Fuel Reprocessing and Radioactive Waste Treatment; Nash, K. L., Lumetta, G. J., Eds.; Woodhead, 2011; pp 201–228.
(5) Stary, J. The Solvent Extraction of Metal Chelates, 1st ed.; Irving, H., Ed.; Pergamon, 1964.
(6) Rydberg, J. On the Calculation of Complexation Constants by the Method of Least Squares. Acta Chem. Scand. 1961, 15, 1723–1738.
(7) Shmitt, U. Walther Nernst Chronology http://www.nernst.de/chronology.htm (accessed Apr 16, 2018).
(8) Bale, A. G.; Lyle, S. J.; Smith, D. B. Equilibrium Constants from Partition of Di-n-Butylphosphoric Acid between Toluene or Tri-n-Butylphosphate-Toluene and an Aqueous Phase. J. Inorg. Nucl. Chem. 1976, 38 (2), 333–335.
(9) Rydberg, J.; Choppin, G. R.; Musikas, C.; Sekine, T. Solvent Extraction Equilibria. In Solvent Extraction Principles and Practice, Revised and Expanded; Rydberg, J., Cox, M., Musikas, C., Choppin, G. R., Eds.; CRC Press: NY, 2012; pp 109–201.
(10) Marcus, Y.; Kertes, A. S. Ion Exchange and Solvent Extraction of Metal Complexes, first.; Wiley-Interscience: London, 1969.
(11) Haverlock, T. J.; Bonnesen, P. V; Sachleben, R. A.; Moyer, B. A. Analysis of Equilibria in the Extraction of Cesium Nitrate by Calix[4]Arene-Bis(t-Octylbenzo- Crown-6) in 1,2-Dichloroethane. J. Incl. Phenom. Macrocycl. Chem. 2000, 36, 21–37.
(12) Fang, D.; Song, Z.; Zhang, S.; Li, J.; Zang, S. Solvent Extraction of Rhenium(VII) from Aqueous Solution Assisted by Hydrophobic Ionic Liquid. J. Chem. Eng. Data 2017, 62 (3), 1094–1098.
(13) Bolomey, R. A.; Wish, L. Thenoyltrifluoroacetone as a Complexing Agent for the Isolation and Purification of Carrier-Free Radioberyllium. J. Am. Chem. Soc. 1950, 72 (10), 4483–4486.
45
(14) Bjerrum, J. Metal Ammine Formation in Aqueous Solution: Theory of the Reversible Step Reactions, University of Californie, 1941.
(15) De, A. K.; Khopkar, S. M.; Chalmers, R. A. Solvent Extraction of Metals (Analysis Chemistry), 1st ed.; Chalmers, R. A., Ed.; Van Nostrand Reinhold Inc.,U.S, 1970.
(16) Nash, K.; Choppin, G. Interaction of Humic and Fulvic Acids with Th (IV). J. Inorg. Nucl. Chem. 1980, 42 (Iv), 1045–1050.
(17) Liljenzin, J.; Stary, J.; Rydberg, J. No Title. In ISEC’68, Solvent Extraction Research; Marcus, Y., Kertes, A. S., Eds.; John Wiley & son: Jerusalem, 1969.
(18) Chelouaou, S. Synergistic Extraction of Copper Cu (II) Using Di (2-Ethyl Hexyl) Phosphoric Acid (D2EHPA) and Tri-n-Octyl Phosphine Oxide (TOPO). In 15th International Conference on Environmental Science and Technology; Rhodes, Greece, 2017.
(19) Bourget, C. T.; Jakovljevic, B.; Nucciarone, D. CYANEX 301 Binary Extractant Systems in Cobalt / Nickel Recovery from Acidic Sulphate Solutions. Hydrometallurgy 2005, 77, 203–218.
(20) Gergoric, M.; Ekberg, C.; Steenari, B.-M.; Retegan, T. Separation of Heavy Rare-Earth Elements from Light Rare-Earth Elements Via Solvent Extraction from a Neodymium Magnet Leachate and the Effects of Diluents. J. Sustain. Metall. 2017, 3 (3), 601–610.
(21) Herbst, R. S.; Baron, P.; Nilsson, M. Standard and Advanced Separation: PUREX Processes for Nuclear Fuel Reprocessing. In Advanced Separation Techniques for Nuclear Fuel Reprocessing and Radioactive Waste Treatmen; Nash, K. L., Lumetta, G. J., Eds.; Woodhead, 2011; pp 141–175.
(22) Singh, R. N.; Krüger, A.; Lieser, K. H. Extraction of Technetium from Nitric Acid by Tetraphenyl Arsonium Chloride. Radiochim. Acta 1979, 26 (3–4), 197–198.
(23) Rice, N. M.; Irving, H. M. N. H.; Leonard, M. a. Nomenclature for Liquid-Liquid Distribution (Solvent Extraction) (IUPAC Recommendations 1993). Pure Appl. Chem. 1993, 65 (11), 2373–2396.
(24) Blake, C. A.; Baes, C. F.; Brown, K. B. Solvent Extraction with Alkyl Phosphoric Compounds. Ind. Eng. Chem. Res. 1958, 50 (12), 1763–1767.
(25) Peppard, D. F.; Ferraro, J. R.; Mason, G. W. Possible Hydrogen Bonding in Certain Interactions of Organic Phosphorus Compounds. J. Inorg. Nucl. Chem. 1957, 4 (5–6), 371–372.
(26) Kolarik, Z.; Kuhn, W. Acidic Organophosphorus Extractants--XXIII Distribution of Mono-2-Ethylhexyl Phosphoric Acid in Two-Liquid-Phase Systems. J. Inorg. Nucl. Chem. 1976, 38, 1061–1063.
46
(27) Kolarik, Z. Critical Evaluation Of Some Equilibrium Constants Involving Acidic Organophosphorus Extractants. J. Pure Appl. Chem. 1982, 54 (12), 2593–2674.
(28) Kolarik, Z. Review : Dissociation , Self-Association , and Partition of Monoacidic Organophosphorus Extractants. 2010, No. III, 707–763.
(29) Weaver, B.; Kappelmann, F. A. TALSPEAK: A New Method of Separating Americium and Curium from the Lanthanides by Extraction from an Aqueous Solution of an Aminopolyacetic Acid Complex with a Monoacidic Organophosphate or Phosphonate; 1964.
(30) Lapka, J. L.; Nash, K. L. Advanced TALSPEAK Separations Using a Malonate Buffer System. Solvent Extr. Ion Exch. 2015, 33 (4), 346–361.
(31) Nilsson, M.; Nash, K. L. Review Article: A Review of the Development and Operational Characteristics of the TALSPEAK Process. Solvent Extr. Ion Exch. 2007, 25 (6), 665–701.
(32) Nash, K. L.; Johnson, G.; Brigham, D.; Marie, C.; Grimes, T. S.; Braley, J. C. Insights Into F-Element Coordination Chemistry in TALSPEAK Systems. Procedia Chem. 2012, 7, 45–50.
(33) Grimes, T. S.; Tian, G.; Rao, L.; Nash, K. L. Optical Spectroscopy Study of Lanthanide Organic Phase Complexes in the TALSPEAK Separation Process. Inorg. Chem. 2012, 51 (11), 6299–6307.
(34) Braley, J. C.; Grimes, T. S.; Nash, K. L. Alternatives to HDEHP and DTPA for Simplified TALSPEAK Separations. Ind. Eng. Chem. Res. 2012, 51 (2), 629–638.
(35) Huang, X.; Dong, J.; Wang, L.; Feng, Z.; Xue, Q.; Meng, X. Selective Recovery of Rare Earth Elements from Ion-Adsorption Rare Earth Element Ores by Stepwise Extraction with HEH(EHP) and HDEHP. Green Chem. 2017, 19 (5), 1345–1352.
(36) Kolarik, Z. The Effect of Diluent on the Solvent Extraction of Tb(III) and Eu(III) by Di-n-Octyl Phosphoric Acid. In Solvent Extraction Chemistry; Dyrssen, D., Liljenzin, J.-O., Rydberg, J., Eds.; John Wiley: Amsterdam, 1967; pp 250–255.
(37) Marcus, Y. Principles of Solubility and Solution, 2nd ed.; Rydberg, J., Cox, M., Musikas, C., Choppin, G. R., Eds.; CRC Press: NY, 20AD.
(38) Christian, R. Solvents and Solvent Effects in Organic Chemistry. In Solvents and Solvent Effects in Organic Chemistry; Christian, R., Ed.; WILEY-VCH Verlag GmbH & Co. KGaA: Weinheim, 2003; p 0.
(39) Kolthoff, I. M. Acid-Base Equilibria in Dipolar Aprotic Solvents. Anal. Chem. 1974, 46 (13), 1992–2003.
47
(40) Chastrette, M. Etude Statistique Des Effets de Solvant-I. Principes et Applications a l’evaluation Des Parametres de Solvant et a La Classification. Tetrahedron 1979, 35 (11), 1441–1448.
(41) Hildebrand, J. H.; Scott, R. L. The Solubility of Nonelectrolytes, third.; Reinhold Publishing: New York, 1964.
(42) Lide, D. R. CRC Handbook of Chemistry and Physics; David R. Lide, Ed.; CRC Press: Boca Raton, 2005.
(43) Diddick, J. A.; Bunger, W. B.; Sakano, T. K. Organic Solvents: Physical Properties and Methods of Purification, fourth edi.; Wiley-Interscience: New York, 1986.
(44) Engineering_ToolBox. Density of aqueous solutions of inorganic sodium salts. https://www.engineeringtoolbox.com/density-aqueous-solution-inorganic-sodium-salt-concentration-d_1957.html.
(45) Binks, B. P.; Cho, W. G.; Fletcher, P. D. I.; Petsev, D. N. Stability of Oil-in-Water Emulsions in a Low Interfacial Tension System. Langmuir 2000, 16 (3), 1025–1034.
(46) Sekine, T.; Dyrssen, D. Solvent Extraction of Metal Ions With Mixed Ligand - I: Adduct Formation of Cu(II) and Zn(II) Chelate Complexes of Thenoyltrifluoroacetone and β-Isopropyltropolone. J. Inorg. Nucl. Chem. 1964, 26, 1727–1742.
(47) Allard, B.; Johnson, S.; Narbutt, J.; Lundqvist, D. Thermodynamics of Partial Processes in the Solvent Extraction of Some Metal Acetylacetonates. In Proceedings of the International Solvent Extraction Conference; Lucas, B. H., Ritcey, G. M., Smith, H. W., Eds.; Canadian Institute of Mining and Metallurgy: Toronto, 1977; pp 150–153.
(48) Dyrssen, D.; Petković, D. Distribution Studies of Tripropyl Phosphate between Different Organic Diluents and Water. J. Inorg. Nucl. Chem. 1965, 27 (6), 1381–1393.
(49) Dyrssen, D.; Hay, L. D. The Distribution and Dimerization of Di-n-Butyl Phosphate (DBP) in Different Solvents. Acta Chemica Scandinavica. 1960, pp 1091–1099.
(50) Dyrssen, D.; Hay, L. Solvent Extraction of 152,154-Eu and 241-Am by Di-n-Butyl Phosphate (DBP) in Different Organic Solvents. Acta Chemica Scandinavica. 1960, pp 1100–1111.
48
CHAPTER TWO
2 METHODS
1.1. Materials
All aqueous solutions were prepared using reagent grade materials and 18 MΩ distilled de-ionized
water. Most organic diluents were obtained Alfa/Aesar and Sigma-Aldrich Corp with a purity
>98%. Some organic diluents were kindly provided from other professors at WSU. Select organic
diluents were purified by contacting with a potassium permanganate solution, separated, and then
a fractional distillation was performed. The extractant, 2-ethylhexylphosphonic acid mono-2-
ethylhexyl ester (HEH[EHP]) was obtained from eNovation Chemical and Yick/Vic with low
purity. Sigma-Aldrich provided Di-(2-ethylhexyl)phosphoric acid (HDEHP) with low purity. A
third phase formation procedure was used to purify the HEH[EHP] to >99% and copper salt
precipitation method was used to purify the HDEHP to >99%[1] - see below. The purity of the
cleaned extractants was verified by phosphorus NMR spectroscopy and colorimetric titration.
Metal nitrate solutions were prepared by conversion from the solid oxide (purchased from Arris
International Co. with a purity of 99.999%) to the soluble nitrate by evaporating the dissolved
oxide down and re-dissolving in HNO3 multiple times. When needed the metal concentrations
were standardized using the complexometric colorimetric titration with the indicator dye Arsenazo
III. The concentration of H+ was determined by colorimetric titration with standardized NaOH
using phenolphthalein as a colorimetric indicator. The concentration of HO- was determined by
colorimetric titration using KHP as primary standard and phenolphthalein as a colorimetric
indicator. The NO3- concentration was determined using ion-exchange chromatography (Dowex
50x beads, acidic form). The metals studied were Nd, Eu, Tm and Am.

49
The organic solutions were prepared gravimetrically daily when needed. The aqueous solution
were prepared at the desired pH and ionic strength prior to utilization and stored under refrigeration
when not in use. HEH[EHP] and HDEHP were stored in the dark so as to prevent degradation.
Radiotracer 147Nd, 152/154Eu, 170Tm were produced in-house by neutron activation with the 1.0 MW
TRIGA reactor at the WSU NSC, see method below. Radiotracer 241Am was kindly provided by
Pacific Northwest National Laboratory.
1.2. Purification methods
Most of commercially available acidic organophosphorus extractants typically contain multiple
phosphorus-bearing impurities. Though it has been demonstrated that those impurities do not
suppress the efficiency of most extraction system at a large scale, they still must be removed for
fundamental research matters. The most common impurities present in the di-alkyl phosphoric
acid and the alkyl alkyl phosphonic acid, are the di-alkyl phosphonate, alky akyl phosphinate,
Mono-alkyl phosphoric acid, Mono-alkyl phosphonic acid.[2]
Figure 2-1. Common impurity found in di alkyl phosphoric acid (mostly A, and C) and alkyl alkyl phosphonic acid (mostly B, C and D). A: di-alkyl phosphonate, B: alkyl alkyl phosphinate, C: Mono-alkyl phosphoric acid, Mono-alkyl phosphonic acid.[2]
50
Purification of HDEHP
The steps recommended by Partridge et al[1] for the purification of organophosphorus acid
extractant by copper salt precipitation are as follows:
1. A solution 25% mass of copper(II) sulfate in water (250 mL) is contacted in a round
bottom flask with a solution of 30 g of HDEHP in diethyl ether.
2. Slowly 8 g of a saturated solution of NaOH is added dropwise (with the use of a syringe
pump), to prevent the precipitation of copper oxide. After NaOH addition is complete,
the solution is allowed to stir overnight. As the NaOH is added to the dissolved CuSO4,
it immediately forms Cu(OH)2; the Cu(OH)2 then reacts with the HDEHP to form the
Cu/HDEHP
3. The organic phase is then separated using a separation funnel, placed into an
Erlenmeyer flask, and gently heated to reduce the volume by 75-90%. Then the solution
is cooled down into an ice bucket (or stored overnight under refrigeration)
4. The Cu/HDEHP complex is then precipitated from the ether by addition of cold
acetone. This is done by increasing the stirring rate of the solution and adding enough
acetone until the (light blue) solid stops forming.
5. The precipitate is vacuum filtered and washed with acetone. The precipitate is then
transferred into a round bottom flask and contacted with an excess of a 3 mol·L-1 HCl
solution.
6. The mixture will have separated into two phases when the HDEHP protonation step is
complete. The top layer will be a clear oily layer which consists of the desired HDEHP,
and the bottom layer will be a green CuCl2 solution. The solution is transferred in a
separatory funnel and a couple of milliliters of ether is added to solvate the HDEHP.
51
7. The HCl layer is removed and then the organic phase is washed with DI water multiple
times.
8. The organic phase is dried with Na2SO4(s), and distilled from the extractant to remove
the residual ether to produce a high purity HDEHP .
Purification of HEH[EHP]
The steps recommended by Zhengshui et al.[3] for the purification of an organophosphorus acid
extractant by the middle phase micro emulsion method are as follows:
1. A solution of approximately 20% (by volume) impure extractant solution (HEH[EHP])
in the acidic form in hexane is placed in a separatory funnel. A equivalent volume of
an aqueous solution of 1 mol·L-1 NaOH/0.15 mol·L-1 Na2SO4 is added to the separatory
funnel. The funnel is shaken vigorously / vented multiple times and then allowed to
rest overnight. A three-fluid phase system is formed.
2. The middle phase is isolated, placed into a separatory funnel, contacted multiple times
with fresh 6 mol.L-1 HCl solution to convert the extractant to the acidic form. The
organic phase (predominantly extractant) is then washed with DI water multiple times.
3. The organic phase is dried with Na2SO4(s), and the excess hexane is distilled from the
extractant leaving the purified HEH[EHP] as a nearly colorless, viscous liquid
Purity control
Pure acidic organophosphorus extractants are liquids, slightly viscous, retains slight yellow colors,
and has a slight sweet scent. The exact purity is determined by colorimetric titration and 31P-NMR.
A pure acidic organophosphorus compound 31P-NMR spectrum should have one, sharp peak, in
the Figure 2-2, no impurities were detected in purified HEH[EHP].

52
Figure 2-2. 31P NMR chemical shift for HDEHP purity control, in DCCl3
1.3. Neutron Activation
Activation by neutron capture of Ln(NO3)3 was used to create radiotracers with the 1.0 MW NSC
TRIGA1 reactor. The Lns are available as Ln(III) oxides with a 99.999% purity. First, the oxides
were converted into nitrate by dissolving less than 100 mg of the oxide into 2 mL of 10 mol·L-1 of
HNO3 and 90% evaporated multiple times to ensure a complete conversion into the nitrate form.
The nitrate solution was then evaporated down to 90% volume and diluted in 2 mL of DI water
multiple times. The final solution was dissolved in 0.5 mL of HNO3 pH=2.
1 TRIGA: Training, Research, Isotopes, General Atomic
-50050100150200
0
200
400
600
800
1000
1200In
tens
ity
Chemical Shift (ppm)

53
Each sample preparation step was done at low heat with a stir plate and IR heat lamp set up, and
under argon to prevent the solution to dry, boil, parasite reactions with the air.
A 0.5 mL aliquot of the Ln(NO3)3 is transferred to a new clean 1.5 mL (2/5 dram) polyethylene
vial for irradiation. Then the vial is sealed to prevent any leak during the time in the reactor.
A sample is activated by being placed into a homogenous neutron flux for a specific amount of
time to reach the activity desired. The solute is irradiated by a neutron flux, and the resulting
specific activity A (Bq) is determined by the following:
𝐴 = 𝑛 ∙ 𝜙¤(1 − 𝑒?¦�§¨¨)(𝑒?¦�©¡¡ª)(𝜎 + 𝑟 ∙ 𝜀®�¯) (2.1)
Activation facility controlled parameters: ΦT the thermal flux in neutron·cm-2·s-1, tirr and tcool
respectively the irradiation time and cooling time in s, and εeth the epithermal fraction.
NSC WSU Reactor flux (from calibration): ΦT = 1.05·1013 n·cm-2·s-1, εeth = 2.5 %
Analyte properties parameters: n is the number of atoms of lanthanide (taking into account natural
abundance), λ is the decay constant of the activated isotope in s-1, σ the cross section of the targeted
lanthanide in barn (10-24 cm2), and r the integral of the resonance of the lanthanides.
For the production of 170Nd, 90 mg of Nd+3 has been irradiated for 4 hours, and let cool for 7 days
before utilization (Activity Immediately After Irradiation: 9.62 MBq). For the production of 170Tm,
39 mg of Tm3+ has been irradiated for 15 min, and let cool down for 24 h before utilization
(Activity Immediately After Irradiation: 13.7 MBq)

54
1.4. Solvent Extraction Method
Gamma emitters
The distribution ratios for extraction can be calculated by measuring the amount of radioactivity
of both aqueous and organic phases; hence the distribution ratio is defined by the ratio of specific
radioactivity.
𝐷 =�̅�𝐴
(2.2)
The following method is used:
1. In a 2 mL disposable glass vial, 495 µL of acidic solution without any metal (μ = 0.1
mol.L-1) and 500 µL of an organic phase containing the extractant.
2. Five µL of radiotracer solution is pipetted into each vial.
3. The vials are then prepared for shaking. They are capped and parafilm is then used to
seal the vial. For double containment, the vials have been placed in a plastic bag and
tied shut.
4. Mix for approximately 30 min on a vortex mixer and centrifuge for approximately 15
min at 7 000 RPM.
5. The bag and the cap are removed and put into radioactive material disposal.
6. Two hundred µL of the top organic phase is sampled and put into gamma counting
tube.
7. Another 200 µL of the top organic phase is removed and disposed of in a radioactive
organic waste vial.
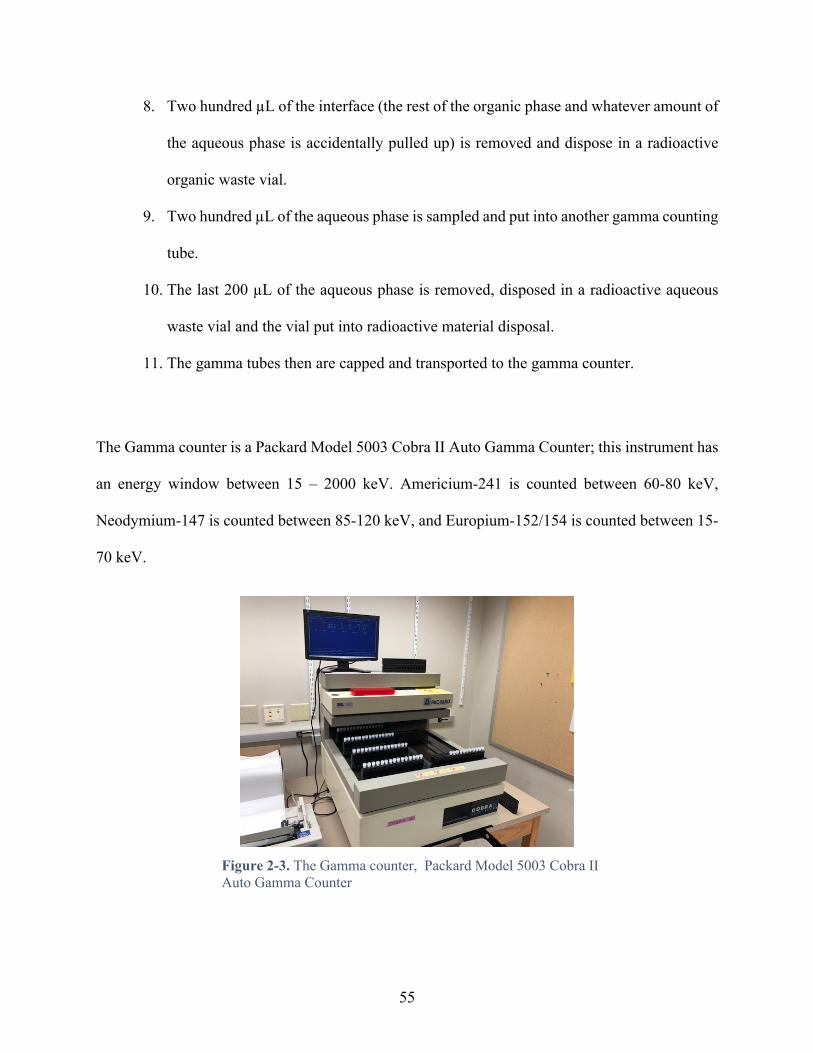
55
8. Two hundred µL of the interface (the rest of the organic phase and whatever amount of
the aqueous phase is accidentally pulled up) is removed and dispose in a radioactive
organic waste vial.
9. Two hundred µL of the aqueous phase is sampled and put into another gamma counting
tube.
10. The last 200 µL of the aqueous phase is removed, disposed in a radioactive aqueous
waste vial and the vial put into radioactive material disposal.
11. The gamma tubes then are capped and transported to the gamma counter.
The Gamma counter is a Packard Model 5003 Cobra II Auto Gamma Counter; this instrument has
an energy window between 15 – 2000 keV. Americium-241 is counted between 60-80 keV,
Neodymium-147 is counted between 85-120 keV, and Europium-152/154 is counted between 15-
70 keV.
Figure 2-3. The Gamma counter, Packard Model 5003 Cobra II Auto Gamma Counter

56
Beta emitters
The distributions ratios for extraction can be calculated by measuring the amount of radioactivity
in the aqueous phases before and after extraction; hence the distribution ratio is defined by the
ratio of the specific activity before and after extraction minus one.
𝐷 =𝐴vnv�vk� − 𝐴°vnk�
𝐴°vnk�= 𝐴vnv�vk�𝐴°vnk�
− 1 (2.3)
The following method is used:
1. Two hundred µL of a stock solution of the aqueous phase at a desired pH and ionic
strength containing the radiotracer (μ = 0.1 mol·L-1) is sampled and put into scintillation
counting tube, with 4 mL of scintillation fluid.
2. In a 2 mL disposable glass vial, 500 µL of acidic solution from the stock solution and
500 µL of an organic phase containing the extractant.
3. The vials are then prepared for shaking. They are capped, parafilm is then used to seal
the vial. For double containment, the vials have been into a plastic bag and tied shut.
4. Mix for approximately 30 min on a vortex mixer and centrifuge for approximately 15
min at 7 000 RPM.
5. The bag and the cap are removed and put into radioactive material disposal.
6. Six hundred µL of the organic phase & interface (the totality of the organic phase and
whatever amount of the aqueous phase is accidentally pulled up) is removed and
dispose in a radioactive organic waste vial.
7. Two hundred µL of the aqueous phase is sampled and put into scintillation counting
tube with 4 mL of scintillation liquid.

57
8. The last 200 µL of the aqueous phase is removed, disposed in a radioactive aqueous
waste vial and the vial put into radioactive material disposal.
9. The counting tubes then are capped and transported to the scintillation counter for
analysis.
The liquid scintillation counter is a Beckman LS 6500 Auto Counter, used on the complete energy
range.
Figure 2-4. Liquid scintillation counter, Beckman LS 6500 Auto Counter
1.5. Spectroscopic Methods
Absorbance Measurement
Absorbance spectrophotometry was used to observe the potential spectral changes and to monitor
the coordination mode of neodymium-HEH[EHP] metal chelate in the organic phase. The
58
coordination mode was monitored by observing the hypersensitive transitions 4I9/2 → 4G5/2, 4G7/2,
between 550 nm and 620 nm.[4] The characteristic spectra of an octahedral Nd3+ should result in
six bands.[5]–[7] Absorbance measurements were done using a double beam high-resolution
spectrophotometer Cary 5000 UV-Vis-NIR with a Cary Dual Cell Peltier temperature control
accessory.
The sample solutions were prepared by extracting Nd3+ from a 50 mmol·L-1 Nd(NO3)3 pH = 3
HNO3 solution, using the method previously described. The 50 mmol·L-1 Nd(NO3)3 solution were
standardized using HDTPA / AAIII standardization method developed in the Nash group. The
samples were measured in a screw top 1 cm 6Q micro cuvette. The Varian scan application 3.00
provided by Cary was used for data output, and each measurement was background and baseline
corrected.
The spectra were analyzed and deconvoluted using the OriginPro 2018 software using the
Gaussian function for six peaks deconvolution:
𝐼¦ = 𝐼t +u𝐴
𝑤² 𝜋4 ∙ ln 2
∙ 𝑒Z∙�} 0∙(¦?¦µ¶·)¸
¹¸
º
v».
(2.4)
where I0 is the baseline, λc the wavelength at maximum intensity for the band i, A the area of the
peak, and w the full width at half maximum. The concentration of metal chelate in the organic
phase was determined using the isotopic dilution method. After a volume of organic phase was
removed for the absorbance analysis, an equivalent volume of the aqueous phase was also removed
and a spike of 147Nd radiotracer was added to the biphasic system. Then the classic solvent

59
extraction method was applied to determine D and the following equation was solved to determine
the metal chelate concentration [Nd]:::::::
𝐷 =[𝑁𝑑]::::::[𝑁𝑑]
= 50 − [𝑁𝑑][𝑁𝑑]
(2.5)
Luminescence Measurement
To monitor the coordination mode of europium-HEH[EHP] metal chelate in the organic phase,
luminescence spectrophotometry was used to search for potential spectral changes. Many
lanthanide ions exhibit luminescence, emitting radiation from an excited electronic state. The light
that is emitted as sharp lines characteristic of f-f transitions of a Ln3+ ion. The coordination mode
was monitored by observing the transitions 5D0 → 7FJ luminescence transitions between 550 nm
and 630 nm[4] (using an excitation monochromatic light beam at 393 nm). The characteristic
spectra of an octahedral Eu3+ should be studied probing the 5D0 → 7F0, 7F1, 7F2 transitions[8] - Table
2-1.
Table 2-1. Feature of 5D0 → 7Fj luminescent transitions for Eu3+.[8]
transition Regions (nm) Intensities comments
5D0 → 7F0 570-585 Very weak Only observed in Cn, Cnv and Cs symmetry. Absent in high symmetry – “forbidden”
5D0 → 7F1 585-600 Strong Intensity largely dependent of environment 5D0 → 7F2 605-615 Very strong Hypersensitive transition; intensity very strongly
dependent on environment. Absent if ion on inversion center – “forbidden”
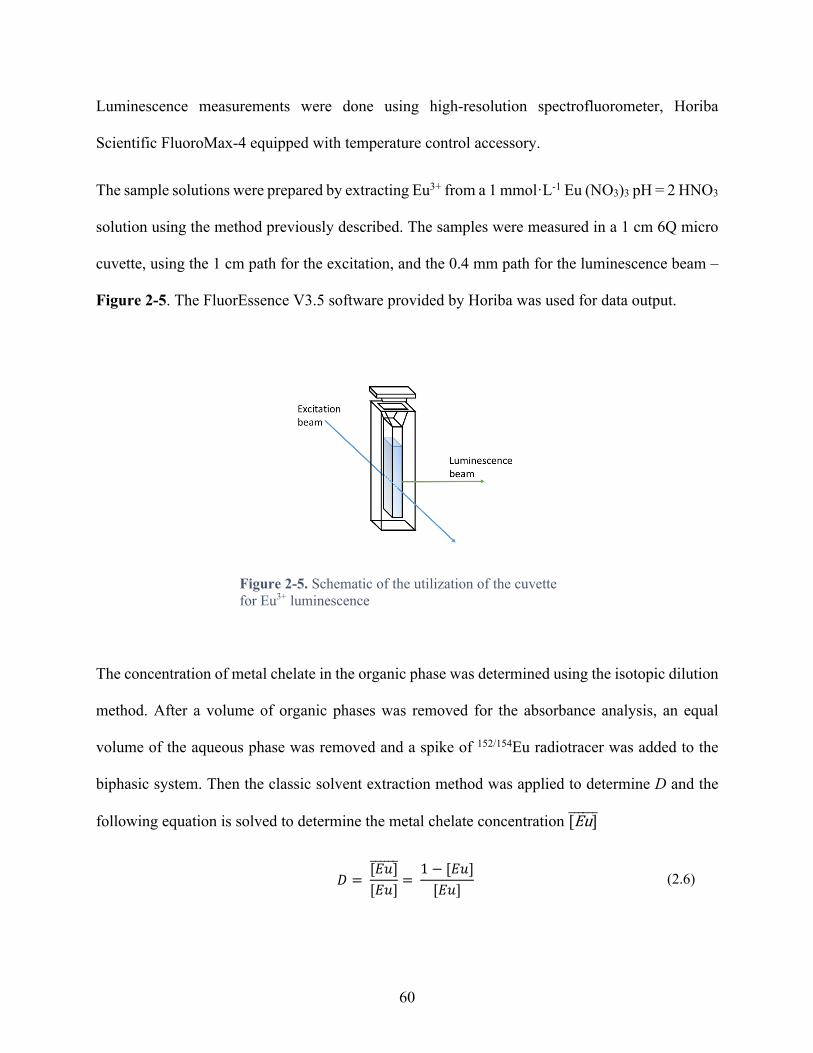
60
Luminescence measurements were done using high-resolution spectrofluorometer, Horiba
Scientific FluoroMax-4 equipped with temperature control accessory.
The sample solutions were prepared by extracting Eu3+ from a 1 mmol·L-1 Eu (NO3)3 pH = 2 HNO3
solution using the method previously described. The samples were measured in a 1 cm 6Q micro
cuvette, using the 1 cm path for the excitation, and the 0.4 mm path for the luminescence beam –
Figure 2-5. The FluorEssence V3.5 software provided by Horiba was used for data output.
Figure 2-5. Schematic of the utilization of the cuvette for Eu3+ luminescence
The concentration of metal chelate in the organic phase was determined using the isotopic dilution
method. After a volume of organic phases was removed for the absorbance analysis, an equal
volume of the aqueous phase was removed and a spike of 152/154Eu radiotracer was added to the
biphasic system. Then the classic solvent extraction method was applied to determine D and the
following equation is solved to determine the metal chelate concentration [Eu]::::::
𝐷 =[𝐸𝑢]::::::[𝐸𝑢]
= 1 − [𝐸𝑢][𝐸𝑢]
(2.6)

61
1.6. References
(1) Partridge, J. A.; Jensen, R. C. Purification of Di-(2-Ethylhexyl)Phosphoric Acid by Precipitation of Copper(II) Di-(2-Ethylhexyl)Phosphate. J. Inorg. Nucl. Chem. 1969, 31, 2587–2589.
(2) Holfeltz, V. E.; Campbell, E. L.; Peterman, D. R.; Standaert, R. F.; Paulenova, A.; Lumetta, G. J.; Levitskaia, T. G. Effect of HEH[EHP] Impurities on the ALSEP Solvent Extraction Process. Solvent Extr. Ion Exch. 2018, 36 (1), 22–40.
(3) Zhengshui, H.; Pan, Y.; Ma, W.; Fu, X. Purification of Organophosphorus Acid Extractant. Solvent Extr. Ion Exch. 1995, 13 (5), 965–976.
(4) Cotton, S. Lanthanide and Actinide Chemistry; John Wiley: West Sussex, 2013.
(5) Grimes, T. S.; Jensen, M. P.; Debeer-Schmidt, L.; Littrell, K.; Nash, K. L. Small-Angle Neutron Scattering Study of Organic-Phase Aggregation in the TALSPEAK Process. J. Phys. Chem. B 2012, 116 (46), 13722–13730.
(6) Lumetta, G. J.; Sinkov, S. I.; Krause, J. A.; Sweet, L. E. Neodymium(III) Complexes of Dialkylphosphoric and Dialkylphosphonic Acids Relevant to Liquid-Liquid Extraction Systems. Inorg. Chem. 2016, 55 (4), 1633–1641.
(7) Jensen, M. P.; Chiarizia, R.; Urban, V. Investigation of the Aggregation of the Neodymium Complexes of Dialkylphosphoric, -Oxothiophosphinic, and -Dithiophosphinic Acids in Toluene. Solvent Extr. Ion Exch. 2001, 19 (5), 865–884.
(8) Binnemans, K. Interpretation of Europium (III) Spectra. Coord. Chem. Rev. 2015, 295, 1–45.

62
CHAPTER THREE
3 DETERMINATION OF STABILITY CONSTANTS OF SOLVENT EXTRACTION OF f-ELEMENTS BY HEH[EHP] IN VARIOUS
DILUENTS
3.1 Preface
The purpose of this chapter is to characterize the impact of the organic diluent used is solvent
extraction of some selected trivalent f-elements (Nd3+, Eu3+, Tm3+, Am3+) by the acidic (cation
exchanging) organophosphorus extractant 2-ethylhexylphosphonic acid mono-2-ethylhexyl ester
– HEH[EHP]. The analytical method consists of using a Graphic Slope Analysis (GSA) and the
Ligand Number Method (LNM) using different diluents in similar aqueous conditions. The graphic
plot of each GSA and LNM has been analyzed but are not included in this dissertation, only the
final result of each individual set of experiments. The results of the GSA and LNM on the Eu3+
extraction have been done in cooperation of multiple Nash group members over multiple years of
combined effort.
In Chapter 3, the coefficient of extraction and 𝑛: for the extraction of Nd3+, Eu3+, Tm3+, and Am3+
by HEH[EHP] have been determined for an extensive list of different diluents. The aqueous media
contained only the background electrolyte (H-Na)NO3. Overall when compared side by side in the
same diluent, the coefficient of extractions were organized as expected, Tm3+ > Eu3+ > Nd3+ >
Am3+ (regardless of the diluent used). Linear free energy diagrams were also obtained between
metal ions, suggesting that as expected the metal-extractant bonding interactions are
predominantly electrostatically driven under these conditions. The primary diluent effect study
suggests that the aromatic diluents have a lower efficiency of extraction that the aromatics ones,
but exhibit higher overall M:L stoichiometry in the extracted complex.
63
The diluent effect for the extraction of Eu3+ by HEH[EHP] has bee accepted for publication in
Solvent Extraction and Ion Exchange, Rydberg Special Editions. However, the data has been
expended since submitted. A special acknowledgment is needed for the co-authors of this
publication, for the joint effort and the development of the analytical method, especially Doctor
Kimberlin and Doctor Dodd.
64
3.2 Introduction
Liquid cation exchanger extractants accomplish cation transfer via the exchange (between two
phases at the interface) of an appropriate number of ions of the same sign as the extracted species
to maintain electroneutrality. This exchange mechanism requires that there is an exchangeable ion
in the organic phase. For an acidic extractant, the most common cation exchanged is the hydrogen
ion, as the following equilibrium suggests[1]:
M}H + (m + n)(HA)::::::::::::::::: ⇋ MA} ∙ HAÂ:::::::::::::: + nHH (3.1)
Because the HO(O=)P< group is polar, for most of the phosphorus cation exchangers and in the
majority of organic solvents, the free HA extractants tend to form hydrogen bonded dimers in the
bulk organic phase (dimer form (HA)2)[2],[3]
M}H +m+ n2 (HA)0
::::::::::::::::⇋ MA} ∙ HAÂ:::::::::::::: + nHH (3.2)
Though the dominance of the organic phase extractant dimer is widely expected, information
concerning dimerization equilibrium constants is comparatively limited and subject to substantial
uncertainty[3].
Determination of the extraction equilibrium constant is critical for improved understanding of an
extraction system. While solvent extraction methods have been used extensively to study aqueous
phase equilibria, organic phase equilibria (though integral to the solvent extraction process) have
been the subject of far fewer detailed studies. In particular, the effect of the “inert” diluent on metal
ion extraction has been touched upon by a small number of authors.[2],[4]–[14] As a starting

65
assumption, the diluent is usually considered as inert, since it does not appear in the extraction
equilibrium expression. However, the impact of the diluent has already been demonstrated on
multiple occasions for various systems. Mason et al.[5][11][12][15][16] investigated the influence of the
diluent on numerous organophosphorus extractants through Graphic Slope Analysis (GSA) and
observed that the “inert” diluent had a significant effect on the efficiency of the extraction. They
also observed, using Ligand Number Method (LNM), that some diluents appeared to decrease the
number of extractant molecules in the final extracted metal complex. The diluent did not seem to
affect the apparent amount of H+ exchanged for the metal when cation exchanging extractants were
used, as a slope of three was observed.[5],[11],[12],[16]
The effect of the diluent on extractant behavior in solvent extraction of trivalent lanthanides by
HEH[EHP] and similar families of extractants has not been extensively investigated in the
literature due to the limited number of appropriate analytical techniques that are well adapted to
understand the chemistry of the organic phase. The GSA combined with the LNM have been used
to analyze the impact of the diluent on the solvated metal chelate, through its distribution and
stoichiometry. Those two method are then supported by spectroscopic inspection of the cations
and the free ligand.
3.3 Experimental
3.3.1 Method: Combined Graphic Slope Analysis and Ligand Number Method
The extraction of trivalent f-elements from dilute nitric media by acidic organophosphorus
extractants is generally considered to occur via the following equilibrium (3.1):
MUH + 3(HA)0:::::::::: ⇋ M(AHA)U:::::::::::: + 3HH (3.1)

66
𝐾#$ = [M(𝐴𝐻𝐴)U][MUH] ∙
[𝐻H]U
[(𝐻𝐴)0::::::::]U (3.2)
This equilibrium requires that three hydrogen ions are exchanged (to the aqueous phase) from three
extractant dimers to satisfy the requirement of charge balance; the coordination of three dimers
(the dominant form of the extractant in typical diluents) in principle represents a nearly octahedral
arrangement of O-donor atoms around the metal center. In this hypothetical complex, the cation
should be surrounded by three eight-membered chelate rings (M-O-P=O:--H-O-P=O:--M).
However, to be true, the equilibrium (3.1) should predict the slope for a GSA. With this fixed
equilibrium, the GSA of the extraction of a trivalent metal should have shown to be inversely third
power dependent upon the concentration of hydrogen ion in the aqueous phase (charge balance),
but also third power dependent upon the concentration of the extractant.
In the late 60’s, extensive studies of lanthanide extraction by di-alkyl phosphoric acids showed
that, under some circumstances (in general, using different diluents), the apparent integrated ligand
number in the metal chelate could be 2.5, with a proposed dominant complex of MA3(HA)2.
MUH + 2.5(HA)0:::::::::::: ⇋ MAU(HA)0:::::::::::::: + 3HH (3.3)
𝐾#$ = [M𝐴U(𝐻𝐴)0::::::::::::::]
[MUH] ∙[𝐻H]U
[(𝐻𝐴)0::::::::]0.Ä (3.4)
In the past, most of the equilibria have been characterized in a binary way, where the stoichiometry
was either MA3(HA)2 or MA3(HA)3 for trivalent f-elements. The difference in those
stoichiometries found by LNM have been attributed to “activity effects”, used as a correction factor
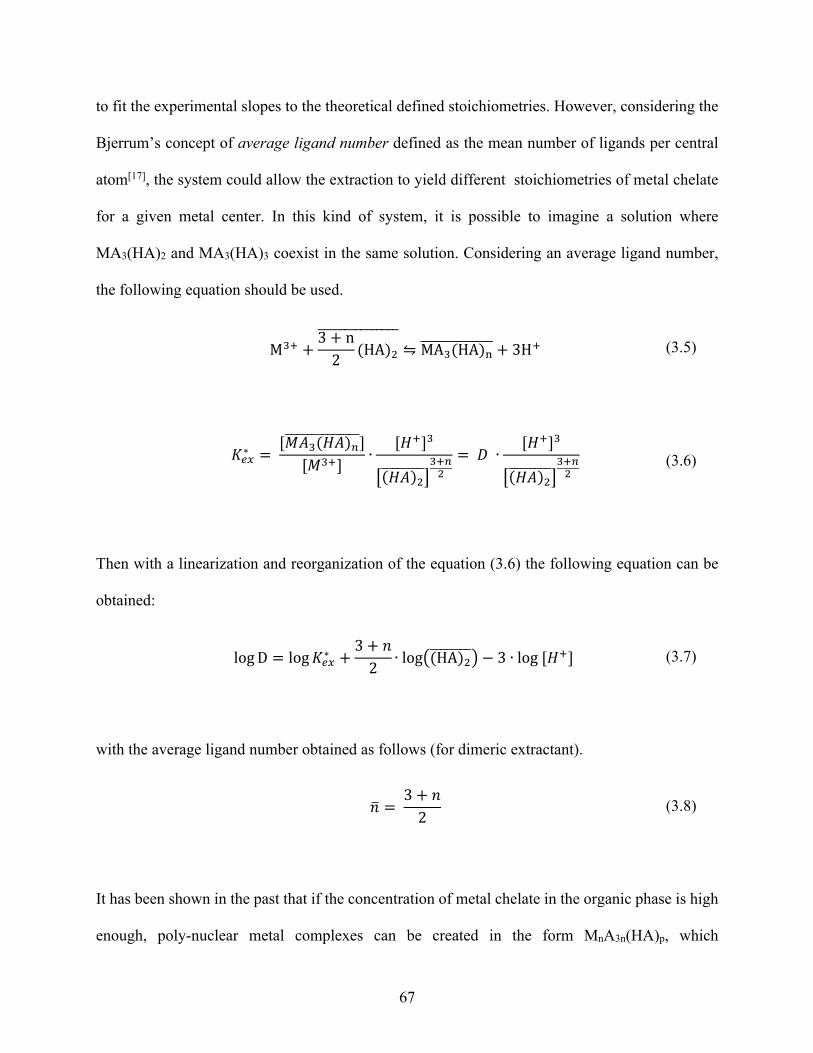
67
to fit the experimental slopes to the theoretical defined stoichiometries. However, considering the
Bjerrum’s concept of average ligand number defined as the mean number of ligands per central
atom[17], the system could allow the extraction to yield different stoichiometries of metal chelate
for a given metal center. In this kind of system, it is possible to imagine a solution where
MA3(HA)2 and MA3(HA)3 coexist in the same solution. Considering an average ligand number,
the following equation should be used.
MUH +3 + n2 (HA)0
:::::::::::::::⇋ MAU(HA)}:::::::::::::: + 3HH (3.5)
𝐾#$∗ = [𝑀𝐴U(𝐻𝐴)n::::::::::::::]
[𝑀UH] ∙[𝐻H]U
Å(𝐻𝐴)0::::::::ÆUHn0= 𝐷 ∙
[𝐻H]U
Å(𝐻𝐴)0::::::::ÆUHn0
(3.6)
Then with a linearization and reorganization of the equation (3.6) the following equation can be
obtained:
log D = log𝐾#$∗ +3 + 𝑛2 ∙ logÇ(HA)0::::::::È − 3 ∙ log[𝐻H] (3.7)
with the average ligand number obtained as follows (for dimeric extractant).
𝑛: = 3 + 𝑛2 (3.8)
It has been shown in the past that if the concentration of metal chelate in the organic phase is high
enough, poly-nuclear metal complexes can be created in the form MnA3n(HA)p, which
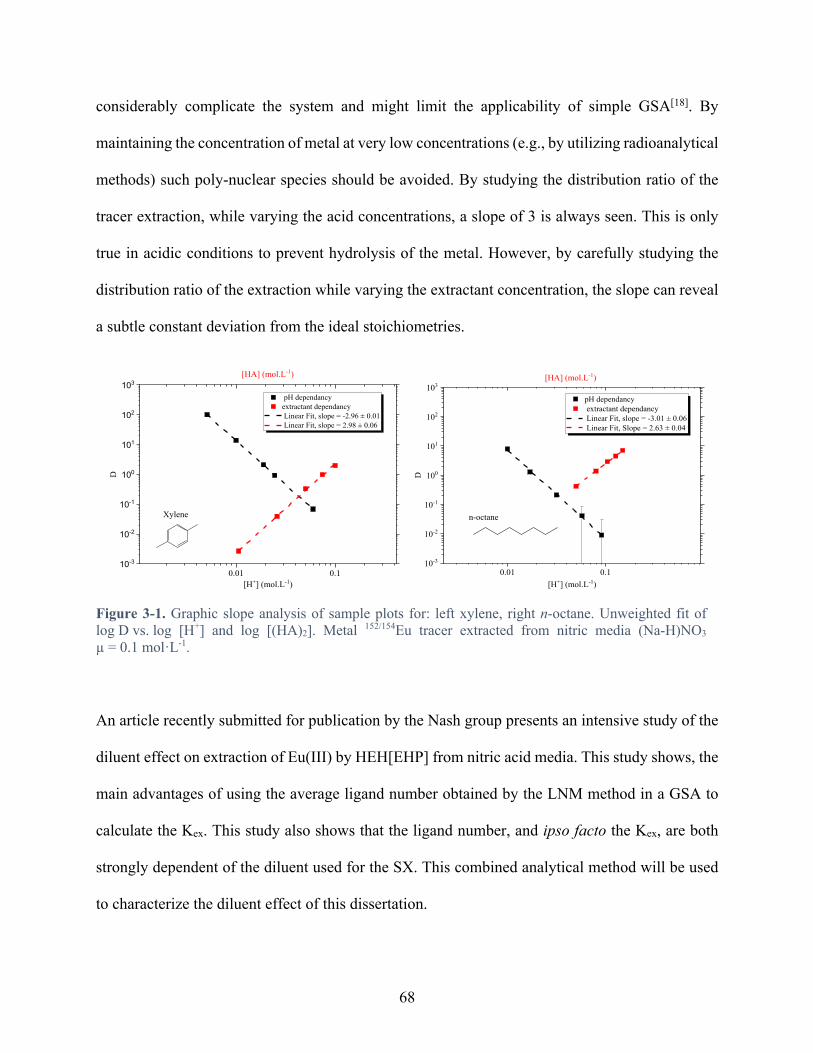
68
considerably complicate the system and might limit the applicability of simple GSA[18]. By
maintaining the concentration of metal at very low concentrations (e.g., by utilizing radioanalytical
methods) such poly-nuclear species should be avoided. By studying the distribution ratio of the
tracer extraction, while varying the acid concentrations, a slope of 3 is always seen. This is only
true in acidic conditions to prevent hydrolysis of the metal. However, by carefully studying the
distribution ratio of the extraction while varying the extractant concentration, the slope can reveal
a subtle constant deviation from the ideal stoichiometries.
Figure 3-1. Graphic slope analysis of sample plots for: left xylene, right n-octane. Unweighted fit of log D vs. log [H+] and log [(HA)2]. Metal 152/154Eu tracer extracted from nitric media (Na-H)NO3 µ = 0.1 mol·L-1.
An article recently submitted for publication by the Nash group presents an intensive study of the
diluent effect on extraction of Eu(III) by HEH[EHP] from nitric acid media. This study shows, the
main advantages of using the average ligand number obtained by the LNM method in a GSA to
calculate the Kex. This study also shows that the ligand number, and ipso facto the Kex, are both
strongly dependent of the diluent used for the SX. This combined analytical method will be used
to characterize the diluent effect of this dissertation.
0.01 0.110-3
10-2
10-1
100
101
102
103[HA] (mol.L-1)
pH dependancyextractant dependancy Linear Fit, slope = -2.96 ± 0.01 Linear Fit, slope = 2.98 ± 0.06
[H+] (mol.L-1)
D
Xylene
0.01 0.110-3
10-2
10-1
100
101
102
103[HA] (mol.L-1)
pH dependancy extractant dependancy Linear Fit, slope = -3.01 ± 0.06 Linear Fit, Slope = 2.63 ± 0.04
[H+] (mol.L-1)
D
n-octane

69
The GSA and the LNM of the distribution data have been done on OriginPro 2018 to determine
the slopes, using an unweighted linear fit (y = a·x + b). Since the dimerization constants of
HEH[EHP] in each diluent are unknown (especially since the dimerization constant in a biphasic
system is dependent on the background electrolyte, the pH, the water dissolved in the organic
phase, the distribution of the extractant between each phase etc.)[3], the choice has been made to
use the following equation (3.9) to calculate the log 𝐾#$∗ . This method is similar to the methods
used by Mason et al.[5],[15]
log𝐾#$∗ = log𝐷 + log𝐹dÉÊË
U
𝐹don: (3.9)
where 𝐾#$∗ represents the equilibrium constant using an average ligand number 𝑛:, the formal
concentration of nitric acid 𝐹dÉÊËand the formal concentration of extractant 𝐹do.
During the experiments, slope analysis using n-octane and n-dodecane as diluent has been
performed with and without pre-contact of the phases before injection of the europium radiotracer,
with the objective to observe a potential change in extraction behavior. The log 𝐾#$∗ obtained were
identical within errors, regardless of the pre-contact action. The impact of the pre-contact has not
been studied for the other diluents, which may behave differently.
70
3.3.2 Results
3.3.2.1 Europium Extraction Result and Proof of Concept
The extractions were done at room temperature, 25°C ± 1°C, with an ionic strength of 0.1 mol·L-
1 (H-Na)NO3. Since the europium radiotracers used, 152/154Eu, were both gamma emitters, the
method used were the solvent extraction method for gamma emitters. Some examples of results of
the LNM are shown in the Figure 3-2. Those results emphasize the impact that a diluent has on
the average ligand number, represented by the slope.
Figure 3-2. LNM and GSA plot for the extraction of Eu3+ by HEH[EHP] from (H-Na)NO3 media µ = 0.1 mol·L-1 and room temperature. The logarithm of the distribution of europium between the organic and aqueous phase, versus the logarithm of the formal concentration of extractant. Unweighted fit. Top left in iso-octane, top right in benzene, bottom left in methyl iso butyl ketone, and bottom right in chloroform.
-2.0 -1.8 -1.6 -1.4 -1.2 -1.0
-2.0
-1.5
-1.0
-0.5
0.0
0.5
1.0
-1.0 -0.9 -0.8 -0.7
0.0
0.5
-1.0 -0.9 -0.8 -0.7 -0.6 -0.5
0.5
1.0
1.5
-1.8 -1.6 -1.4 -1.2 -1.0 -0.8 -0.6-2.0-1.5-1.0-0.50.00.51.01.52.0
inter : 2.87 ± 0.11
slope : 3.02 ± 0.13
R2 = 0.991
pH = 1.5
inter : 3.49 ± 0.05
slope : 2.66 ± 0.03
R2 = 0.999
pH = 2.1
inter : 3.68 ± 0.06
slope : 2.66 ± 0.08
R2 = 0.997
log
DEu
pH = 2.0
log
DEu
inter : 3.40 ± 0.03
slope : 2.90 ± 0.02
R2 = 0.999
log FHA
pH = 2.0
log FHA
71
Table 3-1 shows the average ligand numbers obtained by the LNM method and the log 𝐾𝑒𝑥∗
obtained with the equation (3.9), organized according to their log 𝐾#$∗ . Generally, the complexes
closer to EuA3(HA)2 are aliphatic hydrocarbons, and EuA3(HA)3 are aromatic hydrocarbons, and
the complex EuA3(HA)4 observed in MIBK. The addition of less than 3 molecules of HEH[EHP]
to the EuA3 can be attributed to the stepwise equation.
𝐾#$∗ = 1
𝐾0n:/0 ∙
1𝐾�n:
∙1𝐾kU
∙ 𝛽 ∙ 𝐾1 ∙ 𝛽oii (3.10)
where K2 is the dimerization constant, Kd the distribution constant of the monomeric extractant, Ka
the acidic association constant, β the association constant between one metal and three extractants
molecules, KD the distribution constant of the MA3 complex, and βagg the association constant of
additional extractant HA.
The table also shows the log Kex defined with the classic calculation method as comparison. This
calculation assumes that the chelate ring is always composed of two dimerized ligands
log𝐾#$ = log𝐷 + log �[𝐻]
[(𝐻𝐴)0::::::::]�U
(3.11)
A comparison of the log Kex (calculated by using defining a 1:6 ligand stoichiometry) and the
log 𝐾#$∗ (calculated by using the stoichiometry determined by the LNM) , and specifically the errors
attributed those constants, show that the result for log Kex are less internally consistent due to the
larger standard deviation on the data for the same set GSA.
72
As a primitive analysis of the diluent effect, the highest extraction efficiencies and lowest average
ligand numbers are observed with the “inert” diluent. In this case, inert refers to the tendency of
the diluent to not enter into any type of association with the solute (the only interactions are the
London dispersive forces), especially with the extractant. The molecule of HEH[EHP] is able to
form hydrogen bonding either through the hydroxyl or the phosphoryl group. The aromatic type
diluents are characterized by the higher suppressing activity toward the extractions and higher
average ligand number.
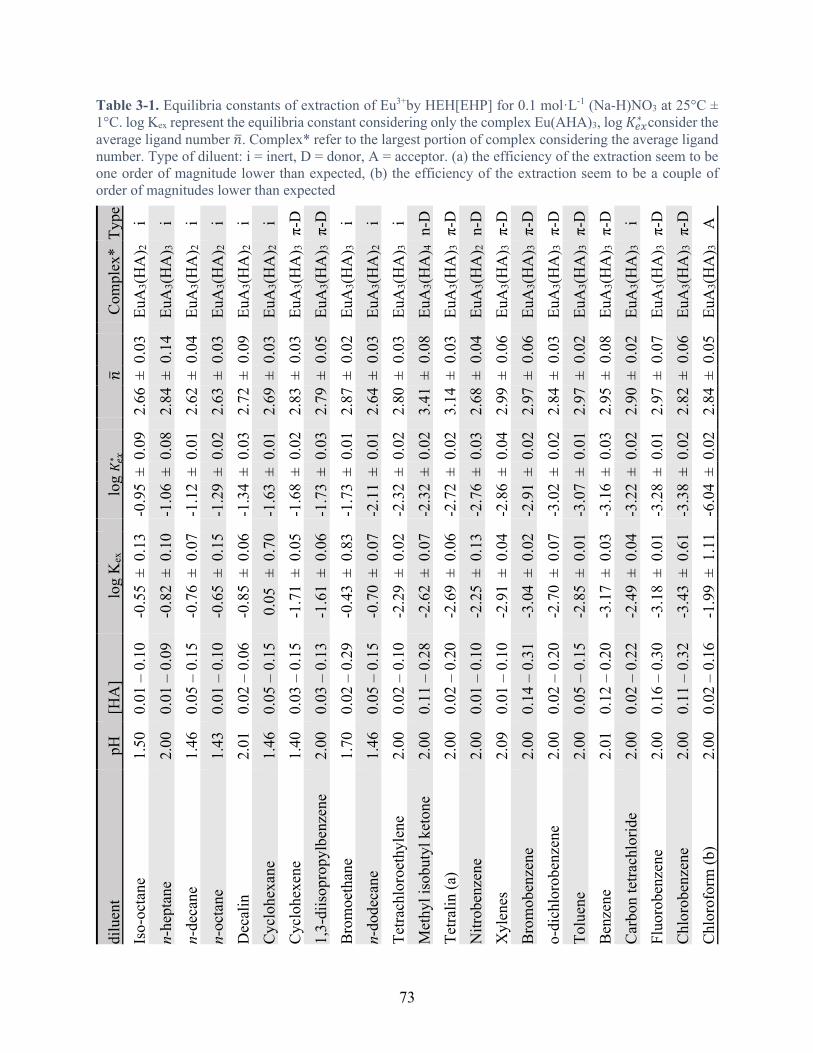
73
Table 3-1. Equilibria constants of extraction of Eu3+by HEH[EHP] for 0.1 mol·L-1 (Na-H)NO3 at 25°C ± 1°C. log Kex represent the equilibria constant considering only the complex Eu(AHA)3, log 𝐾#$∗ consider the average ligand number 𝑛:. Complex* refer to the largest portion of complex considering the average ligand number. Type of diluent: i = inert, D = donor, A = acceptor. (a) the efficiency of the extraction seem to be one order of magnitude lower than expected, (b) the efficiency of the extraction seem to be a couple of order of magnitudes lower than expected
Type
i i i i i i π -D
π -
D
i i i n-D
π-
D
n-D
π-
D
π-D
π-
D
π-D
π -
D
i π-D
π-
D
A
Com
plex
* Eu
A3(
HA
) 2
EuA
3(H
A) 3
Eu
A3(
HA
) 2
EuA
3(H
A) 2
Eu
A3(
HA
) 2
EuA
3(H
A) 2
Eu
A3(
HA
) 3
EuA
3(H
A) 3
Eu
A3(
HA
) 3
EuA
3(H
A) 2
Eu
A3(
HA
) 3
EuA
3(H
A) 4
Eu
A3(
HA
) 3
EuA
3(H
A) 2
Eu
A3(
HA
) 3
EuA
3(H
A) 3
Eu
A3(
HA
) 3
EuA
3(H
A) 3
Eu
A3(
HA
) 3
EuA
3(H
A) 3
Eu
A3(
HA
) 3
EuA
3(H
A) 3
Eu
A3(
HA
) 3
𝑛 : 0.
03
0.14
0.
04
0.03
0.
09
0.03
0.
03
0.05
0.
02
0.03
0.
03
0.08
0.
03
0.04
0.
06
0.06
0.
03
0.02
0.
08
0.02
0.
07
0.06
0.
05
± ± ± ± ± ± ± ± ± ± ± ± ± ± ± ± ± ± ± ± ± ± ±
2.66
2.
84
2.62
2.
63
2.72
2.
69
2.83
2.
79
2.87
2.
64
2.80
3.
41
3.14
2.
68
2.99
2.
97
2.84
2.
97
2.95
2.
90
2.97
2.
82
2.84
log 𝐾 #
$∗ 0.09
0.
08
0.01
0.
02
0.03
0.
01
0.02
0.
03
0.01
0.
01
0.02
0.
02
0.02
0.
03
0.04
0.
02
0.02
0.
01
0.03
0.
02
0.01
0.
02
0.02
± ± ± ± ± ± ± ± ± ± ± ± ± ± ± ± ± ± ± ± ± ± ±
-0.9
5 -1
.06
-1.1
2 -1
.29
-1.3
4 -1
.63
-1.6
8 -1
.73
-1.7
3 -2
.11
-2.3
2 - 2
.32
- 2.7
2 - 2
.76
-2.8
6 -2
.91
-3.0
2 -3
.07
-3.1
6 -3
.22
-3.2
8 -3
.38
-6.0
4
log
Kex
0.13
0.
10
0.07
0.
15
0.06
0.
70
0.05
0.
06
0.83
0.
07
0.02
0.
07
0.06
0.
13
0.04
0.
02
0.07
0.
01
0.03
0.
04
0.01
0.
61
1.11
± ± ± ± ± ± ± ± ± ± ± ± ± ± ± ± ± ± ± ± ± ± ±
- 0.5
5 - 0
.82
- 0.7
6 - 0
.65
- 0.8
5 0.
05
- 1.7
1 - 1
.61
- 0.4
3 - 0
.70
- 2.2
9 - 2
.62
- 2.6
9 - 2
.25
- 2.9
1 - 3
.04
- 2.7
0 - 2
.85
- 3.1
7 - 2
.49
- 3.1
8 - 3
.43
- 1.9
9
[HA
]
Ran
ge
0.01
– 0
.10
0.01
– 0
.09
0.05
– 0
.15
0.01
– 0
.10
0.02
– 0
.06
0.05
– 0
.15
0.03
– 0
.15
0.03
– 0
.13
0.02
– 0
.29
0.05
– 0
.15
0.02
– 0
.10
0.11
– 0
.28
0.02
– 0
.20
0.01
– 0
.10
0.01
– 0
.10
0.14
– 0
.31
0.02
– 0
.20
0.05
– 0
.15
0.12
– 0
.20
0.02
– 0
.22
0.16
– 0
.30
0.11
– 0
.32
0.02
– 0
.16
pH
1.50
2.
00
1.46
1.
43
2.01
1.
46
1.40
2.
00
1.70
1.
46
2.00
2.
00
2.00
2.
00
2.09
2.
00
2.00
2.
00
2.01
2.
00
2.00
2.
00
2.00
dilu
ent
Iso -
octa
ne
n-he
ptan
e n-
deca
ne
n-oc
tane
D
ecal
in
Cyc
lohe
xane
C
yclo
hexe
ne
1,3-
diis
opro
pylb
enze
ne
Bro
moe
than
e n-
dode
cane
Te
trach
loro
ethy
lene
M
ethy
l iso
buty
l ket
one
Tetra
lin (a
) N
itrob
enze
ne
Xyl
enes
B
rom
oben
zene
o-
dich
loro
benz
ene
Tolu
ene
Ben
zene
C
arbo
n te
trach
lorid
e Fl
uoro
benz
ene
Chl
orob
enze
ne
Chl
orof
orm
(b)
74
Acceptor diluents, such as chloroform, form very stable molecular complexes with HEH[EHP]
due to the high basicity of the phosphoryl group. For the same reason alcoholic diluents would
also suppress the extraction.[19]
Other equilibria that involve diluent effect will be discussed in the next chapter.
3.3.2.2 Thulium Extraction Results
Extractions were done at room temperature, 25°C ± 1°C, with an ionic strength of 0.1 mol·L-1 (H-
Na)NO3. Since the thulium radiotracers used (170Tm) is a beta emitter, the method used for
quantitation was the solvent extraction method for beta emitters. Some examples of results of the
LNM are shown in the Figure 3-3. These results emphasize the impact that the diluent has on the
average ligand number, represented by the slope.
The Table 3-2 shows the average ligand numbers obtained by the LNM method and the log 𝐾𝑒𝑥∗
obtained with the equation (3.9), organized according to their log 𝐾#$∗ . Generally, the average
stoichiometries of the Tm complexes seem to be lower than the ones obtained with Eu in the
previous section. This could imply that the 𝛽kii is dependent on the cation extracted.
LnAU + n(HA)0 + mHA ⇌ LnAU(HA)}0HÂ
(3.12)
Since this equilibrium seems to be exclusively driven by a Lewis Acid/base adduct formation, it
may indicate that the denticity of the ligand around the metal is at the origin of the difference
between Tm and Eu.
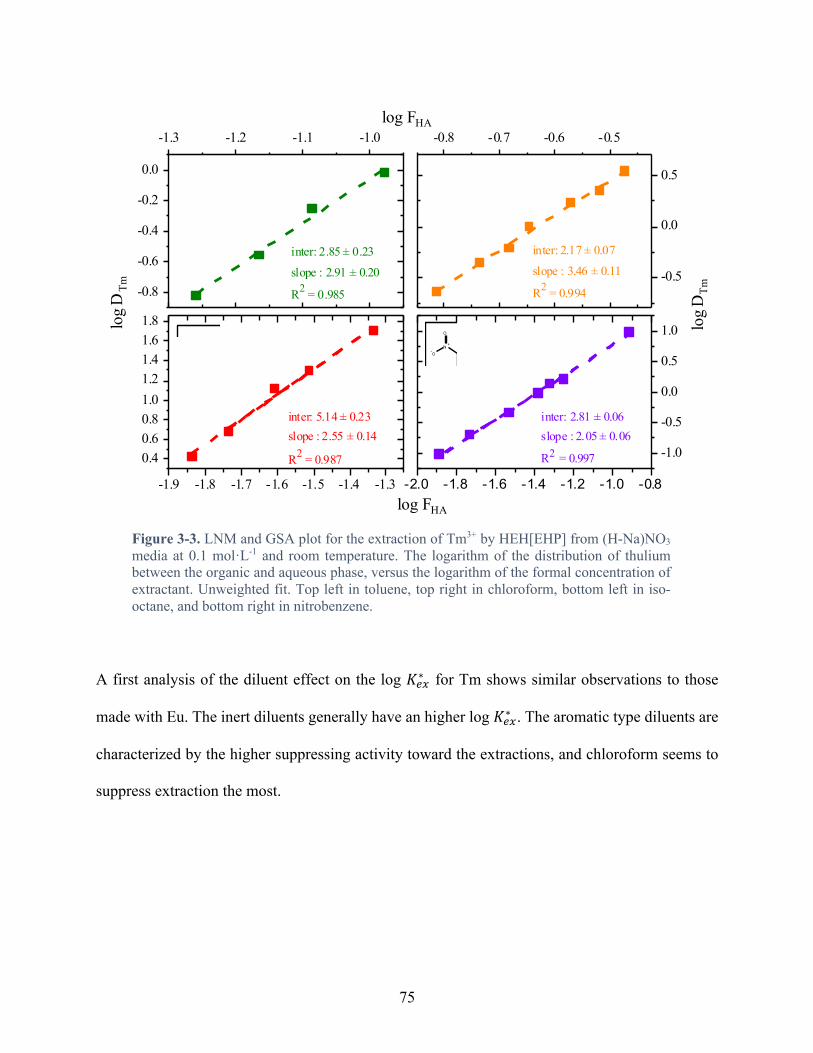
75
Figure 3-3. LNM and GSA plot for the extraction of Tm3+ by HEH[EHP] from (H-Na)NO3 media at 0.1 mol·L-1 and room temperature. The logarithm of the distribution of thulium between the organic and aqueous phase, versus the logarithm of the formal concentration of extractant. Unweighted fit. Top left in toluene, top right in chloroform, bottom left in iso-octane, and bottom right in nitrobenzene.
A first analysis of the diluent effect on the log 𝐾#$∗ for Tm shows similar observations to those
made with Eu. The inert diluents generally have an higher log 𝐾#$∗ . The aromatic type diluents are
characterized by the higher suppressing activity toward the extractions, and chloroform seems to
suppress extraction the most.
-1.3 -1.2 -1.1 -1.0
-0.8
-0.6
-0.4
-0.2
0.0
-0.8 -0.7 -0.6 -0.5
-0.5
0.0
0.5
-1.9 -1.8 -1.7 -1.6 -1.5 -1.4 -1.3
0.40.60.81.01.21.41.61.8
-2.0 -1.8 -1.6 -1.4 -1.2 -1.0 -0.8
-1.0
-0.5
0.0
0.5
1.0
inter: 2.81 ± 0.06slope : 2.05 ± 0.06
R2 = 0.997
inter: 2.17 ± 0.07
slope : 3.46 ± 0.11
R2 = 0.994
inter: 2.85 ± 0.23
slope : 2.91 ± 0.20
R2 = 0.985
inter: 5.14 ± 0.23slope : 2.55 ± 0.14
R2 = 0.987
log D
Tm
log D
Tm
iso-octane
log FHA
N +
O
-O
ni trobenzene
log FHA

76
Table 3-2. Equilibria constants of extraction of Tm3+by HEH[EHP] for 0.1 mol·L-1 (Na-H)NO3 at 25°C ± 1°C. log Kex represent the equilibria constant considering only the complex Tm(AHA)3, log 𝐾#$∗ consider the average ligand number 𝑛:. Complex* refer to the largest portion of complex considering the average ligand number. Type of diluent: i = inert, D = donor, A = acceptor.(a) ) the efficiency of the extraction seem to be one order of magnitude lower than expected
Type
i i i i i i i π -D
π-D
i n-D
i i π-D
n - D
π-D
π-D
π-D
π-D
A
Com
plex
* Tm
A3(
HA
) 3
TmA
3(H
A) 2
TmA
3(H
A) 3
TmA
3(H
A) 2
TmA
3(H
A) 2
TmA
3(H
A) 2
TmA
3(H
A) 3
TmA
3(H
A) 2
TmA
3(H
A) 2
TmA
3(H
A) 2
TmA
3(H
A) 3
TmA
3(H
A) 2
TmA
3(H
A) 2
TmA
3(H
A) 3
TmA
3(H
A)
TmA
3(H
A) 3
TmA
3(H
A) 2
TmA
3(H
A) 2
TmA
3(H
A) 1
TmA
3(H
A) 4
𝑛: 0.
13
0.07
0.13
0.09
0.10
0.03
0.09
0.20
0.08
0.13
0.22
0.08
0.16
0.14
0.04
0.20
0.10
0.14
0.08
0.11
± ± ± ± ± ± ± ± ± ± ± ± ± ± ± ± ± ± ± ±
2.81
2.65
2.82
2.74
2.68
2.57
3.10
2.59
2.36
2.42
2.97
2.32
2.69
2.80
2.05
2.91
2.70
2.74
2.21
3.46
log 𝐾 #
$∗ 0.08
0.05
0.08
0.07
0.06
0.02
0.06
0.22
0.06
0.08
0.07
0.11
0.02
0.05
0.03
0.03
0.02
0.05
0.03
0.03
± ± ± ± ± ± ± ± ± ± ± ± ± ± ± ± ± ± ± ±
1.87
1.48
1.47
1.45
1.24
1.00
0.87
0.46
0.23
-0.0
2
-0.0
4
-0.2
3
-0.3
6
-0.7
1
-0.7
8
-0.8
1
-0.8
4
-0.9
5
-1.1
0
-5.9
9
log
Kex
0.10
0.14
0.10
0.12
0.12
0.14
0.60
0.13
0.27
0.23
0.07
0.35
0.35
0.24
0.27
0.32
0.25
0.05
0.21
0.07
± ± ± ± ± ± ± ± ± ± ± ± ± ± ± ± ± ± ± ±
2.19
1.95
1.74
1.85
1.67
1.76
0.89
0.88
1.13
2.26
0.00
0.54
0.08
- 0.4
2
0.64
- 0.5
7
- 0.4
5
- 0.6
7
- 0.0
3
- 1.8
0
[HA
] Ran
ge
0.05
0.12
0.09
0.09
0.09
0.06
0.17
0.21
0.10
0.05
0.12
0.09
0.16
0.21
0.12
0.11
0.17
0.13
0.10
0.36
- - - - - - - - - - - - - - - - - - - -
0.01
0.01
0.01
0.01
0.02
0.01
0.02
0.05
0.01
0.01
0.04
0.02
0.09
0.06
0.01
0.06
0.09
0.06
0.02
0.16
pH
1.20
1.20
1.20
1.20
1.20
1.20
1.20
1.20
1.20
1.20
2.00
1.20
1.20
1.20
1.20
1.20
1.20
1.20
1.20
1.20
iso -
octa
ne
n-de
cane
-
n-he
ptan
e
n-oc
tane
Dec
alin
Cyc
lohe
xane
brom
o et
hane
Tetra
lin
1,3-
diis
opro
pylb
enze
ne
n-do
deca
ne
met
hyl i
sobu
tyl k
eton
e
tetra
chlo
roet
hyle
ne
Car
bon
tetra
chlo
ride
Bro
mob
enze
ne
Nitr
oben
zene
Tolu
ene
Chl
orob
enze
ne
Ben
zene
o-di
chlo
robe
nzen
e (a
)
Chl
orof
orm
77
3.3.2.3 Neodymium and Americium Extraction Results
In this set of experiment, radiotracers of Am and Nd have been used in the same extraction.
Therefore, the condition of the extractions of both metals have been identical, and will be easier
to compare. The extractions were done at room temperature, 25°C ± 1°C, with an ionic strength of
0.1 mol·L-1 (H-Na)NO3. Since the radiotracers used 241Am and 146Nd, were both gamma emitters,
the method used was the solvent extraction method for gamma emitters. Some examples of results
of the LNM are shown in the Figure 3-4. Those results emphasize the impact that a diluent have
on the average ligand number, represented by the slope.
The analysis of the diluent effect on the log 𝐾#$∗ shows similar trends to those made with Eu, and
Nd. The inert diluents seem to have an higher log 𝐾#$∗ . The aromatic type diluents are characterized
by the higher suppressing activity toward the extractions despite higher stoichiometry (in principle,
a more hydrophobic outer shell) in the extracted complex.
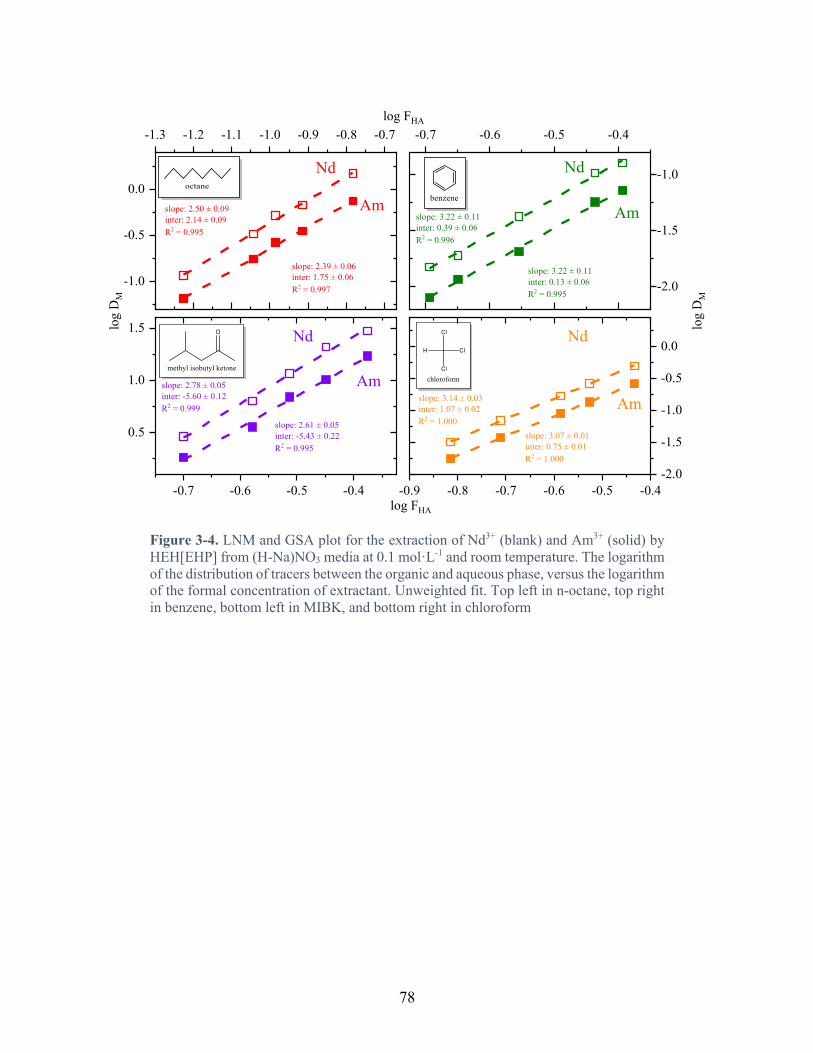
78
Figure 3-4. LNM and GSA plot for the extraction of Nd3+ (blank) and Am3+ (solid) by HEH[EHP] from (H-Na)NO3 media at 0.1 mol·L-1 and room temperature. The logarithm of the distribution of tracers between the organic and aqueous phase, versus the logarithm of the formal concentration of extractant. Unweighted fit. Top left in n-octane, top right in benzene, bottom left in MIBK, and bottom right in chloroform
-1.3 -1.2 -1.1 -1.0 -0.9 -0.8 -0.7
-1.0
-0.5
0.0
-0.7 -0.6 -0.5 -0.4
-2.0
-1.5
-1.0
-0.7 -0.6 -0.5 -0.4
0.5
1.0
1.5
-0.9 -0.8 -0.7 -0.6 -0.5 -0.4-2.0
-1.5
-1.0
-0.5
0.0
slope: 3.07 ± 0.01inter: 0.75 ± 0.01R2 = 1.000
slope: 3.14 ± 0.03inter: 1.07 ± 0.02R2 = 1.000slope: 2.61 ± 0.05
inter: -5.43 ± 0.22R2 = 0.995
slope: 2.78 ± 0.05inter: -5.60 ± 0.12R2 = 0.999
slope: 3.22 ± 0.11inter: 0.13 ± 0.06R2 = 0.995
slope: 3.22 ± 0.11inter: 0.39 ± 0.06R2 = 0.996
slope: 2.39 ± 0.06inter: 1.75 ± 0.06R2 = 0.997
slope: 2.50 ± 0.09inter: 2.14 ± 0.09R2 = 0.995
log
DM
log
DM
Am
Nd
Am
Nd
Am
Nd
log FHA
log FHA
Nd
Am
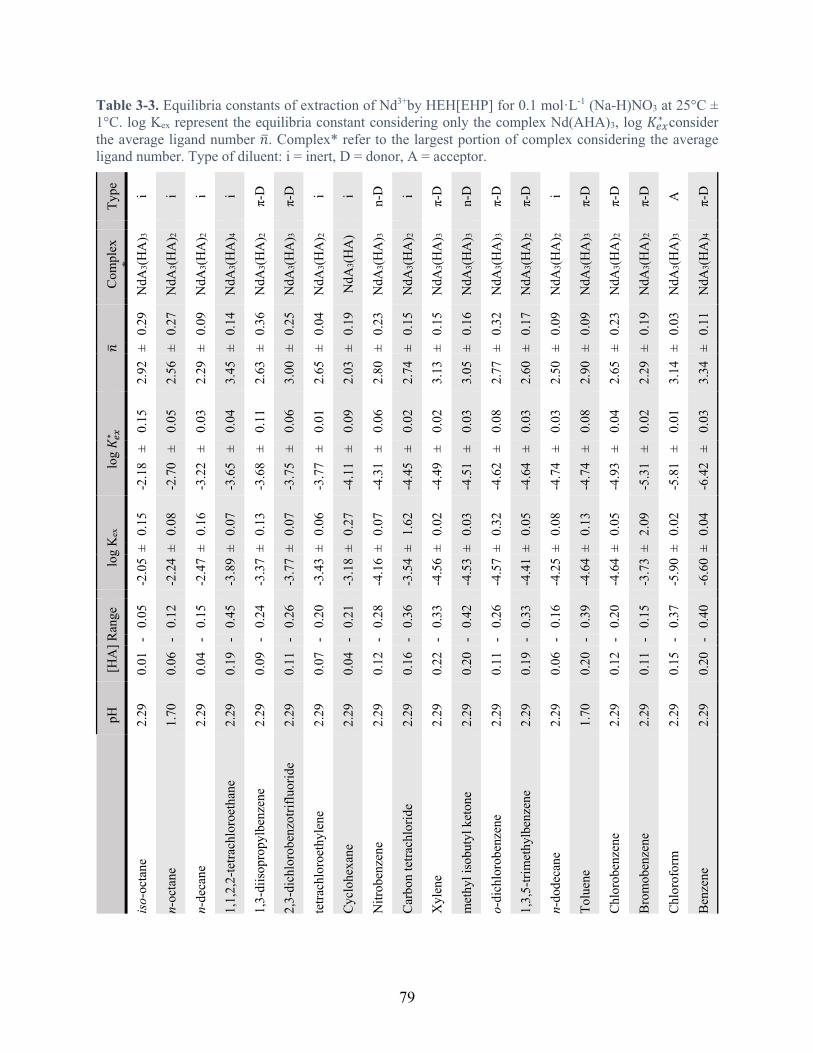
79
Table 3-3. Equilibria constants of extraction of Nd3+by HEH[EHP] for 0.1 mol·L-1 (Na-H)NO3 at 25°C ± 1°C. log Kex represent the equilibria constant considering only the complex Nd(AHA)3, log 𝐾#$∗ consider the average ligand number 𝑛:. Complex* refer to the largest portion of complex considering the average ligand number. Type of diluent: i = inert, D = donor, A = acceptor.
Type
i i i i π -D
π -D
i i n-D
i π -D
n-D
π -D
π -D
i π -D
π -D
π -D
A
π -D
Com
plex
* N
dA3(H
A) 3
NdA
3(HA
) 2
NdA
3(HA
) 2
NdA
3(HA
) 4
NdA
3(HA
) 2
NdA
3(HA
) 3
NdA
3(HA
) 2
NdA
3(HA
)
NdA
3(HA
) 3
NdA
3(HA
) 2
NdA
3(HA
) 3
NdA
3(HA
) 3
NdA
3(HA
) 3
NdA
3(HA
) 2
NdA
3(HA
) 2
NdA
3(HA
) 3
NdA
3(HA
) 2
NdA
3(HA
) 2
NdA
3(HA
) 3
NdA
3(HA
) 4
𝑛:
0.29
0.27
0.09
0.14
0.36
0.25
0.04
0.19
0.23
0.15
0.15
0.16
0.32
0.17
0.09
0.09
0.23
0.19
0.03
0.11
± ± ± ± ± ± ± ± ± ± ± ± ± ± ± ± ± ± ± ±
2.92
2.56
2.29
3.45
2.63
3.00
2.65
2.03
2.80
2.74
3.13
3.05
2.77
2.60
2.50
2.90
2.65
2.29
3.14
3.34
log 𝐾 #
$∗ 0.15
0.05
0.03
0.04
0.11
0.06
0.01
0.09
0.06
0.02
0.02
0.03
0.08
0.03
0.03
0.08
0.04
0.02
0.01
0.03
± ± ± ± ± ± ± ± ± ± ± ± ± ± ± ± ± ± ± ±
-2.1
8
-2.7
0
-3.2
2
- 3.6
5
-3.6
8
- 3.7
5
- 3.7
7
- 4.1
1
- 4.3
1
- 4.4
5
- 4.4
9
-4.5
1
-4.6
2
- 4.6
4
- 4.7
4
-4.7
4
- 4.9
3
-5.3
1
- 5.8
1
- 6.4
2
log
Kex
0.15
0.08
0.16
0.07
0.13
0.07
0.06
0.27
0.07
1.62
0.02
0.03
0.32
0.05
0.08
0.13
0.05
2.09
0.02
0.04
± ± ± ± ± ± ± ± ± ± ± ± ± ± ± ± ± ± ± ±
- 2.0
5
- 2.2
4
- 2.4
7
- 3.8
9
- 3.3
7
- 3.7
7
- 3.4
3
- 3.1
8
- 4.1
6
- 3.5
4
- 4.5
6
- 4.5
3
- 4.5
7
- 4.4
1
- 4.2
5
- 4.6
4
- 4.6
4
- 3.7
3
- 5.9
0
- 6.6
0
[HA
] Ran
ge
0.05
0.12
0.15
0.45
0.24
0.26
0.20
0.21
0.28
0.36
0.33
0.42
0.26
0.33
0.16
0.39
0.20
0.15
0.37
0.40
- - - - - - - - - - - - - - - - - - - -
0.01
0.06
0.04
0.19
0.09
0.11
0.07
0.04
0.12
0.16
0.22
0.20
0.11
0.19
0.06
0.20
0.12
0.11
0.15
0.20
pH
2.29
1.70
2.29
2.29
2.29
2.29
2.29
2.29
2.29
2.29
2.29
2.29
2.29
2.29
2.29
1.70
2.29
2.29
2.29
2.29
iso- o
ctan
e
n-oc
tane
n-de
cane
1,1,
2,2-
tetra
chlo
roet
hane
1,3-
diiso
prop
ylbe
nzen
e
2,3-
dich
loro
benz
otrif
luor
ide
tetra
chlo
roet
hyle
ne
Cycl
ohex
ane
Nitr
oben
zene
Carb
on te
trach
lorid
e
Xyl
ene
met
hyl i
sobu
tyl k
eton
e
o-di
chlo
robe
nzen
e
1,3,
5 -tri
met
hylb
enze
ne
n -do
deca
ne
Tolu
ene
Chlo
robe
nzen
e
Brom
oben
zene
Chlo
rofo
rm
Benz
ene
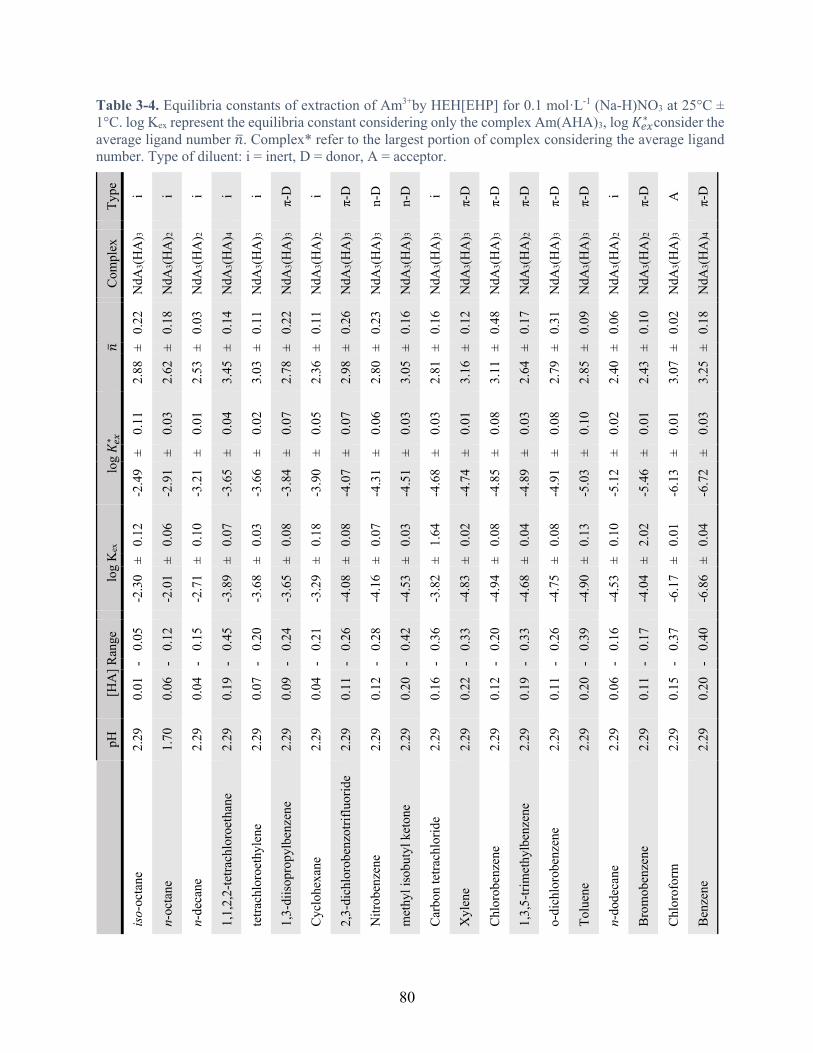
80
Table 3-4. Equilibria constants of extraction of Am3+by HEH[EHP] for 0.1 mol·L-1 (Na-H)NO3 at 25°C ± 1°C. log Kex represent the equilibria constant considering only the complex Am(AHA)3, log 𝐾#$∗ consider the average ligand number 𝑛:. Complex* refer to the largest portion of complex considering the average ligand number. Type of diluent: i = inert, D = donor, A = acceptor.
Type
i i i i i π -D
i π -D
n-D
n-D
i π -D
π -D
π -D
π -D
π -D
i π -D
A
π -D
Com
plex
* N
dA3(H
A) 3
NdA
3(HA
) 2
NdA
3(HA
) 2
NdA
3(HA
) 4
NdA
3(HA
) 3
NdA
3(HA
) 3
NdA
3(HA
) 2
NdA
3(HA
) 3
NdA
3(HA
) 3
NdA
3(HA
) 3
NdA
3(HA
) 3
NdA
3(HA
) 3
NdA
3(HA
) 3
NdA
3(HA
) 2
NdA
3(HA
) 3
NdA
3(HA
) 3
NdA
3(HA
) 2
NdA
3(HA
) 2
NdA
3(HA
) 3
NdA
3(HA
) 4
𝑛:
0.22
0.18
0.03
0.14
0.11
0.22
0.11
0.26
0.23
0.16
0.16
0.12
0.48
0.17
0.31
0.09
0.06
0.10
0.02
0.18
± ± ± ± ± ± ± ± ± ± ± ± ± ± ± ± ± ± ± ±
2.88
2.62
2.53
3.45
3.03
2.78
2.36
2.98
2.80
3.05
2.81
3.16
3.11
2.64
2.79
2.85
2.40
2.43
3.07
3.25
log 𝐾 #
$∗ 0.
11
0.03
0.01
0.04
0.02
0.07
0.05
0.07
0.06
0.03
0.03
0.01
0.08
0.03
0.08
0.10
0.02
0.01
0.01
0.03
± ± ± ± ± ± ± ± ± ± ± ± ± ± ± ± ± ± ± ±
-2.4
9
-2.9
1
-3.2
1
-3.6
5
-3.6
6
-3.8
4
-3.9
0
-4.0
7
- 4.3
1
- 4.5
1
-4.6
8
-4.7
4
- 4.8
5
-4.8
9
-4.9
1
-5.0
3
-5.1
2
-5.4
6
-6.1
3
-6.7
2
log
Kex
0.12
0.06
0.10
0.07
0.03
0.08
0.18
0.08
0.07
0.03
1.64
0.02
0.08
0.04
0.08
0.13
0.10
2.02
0.01
0.04
± ± ± ± ± ± ± ± ± ± ± ± ± ± ± ± ± ± ± ±
-2.3
0
-2.0
1
-2.7
1
- 3.8
9
- 3.6
8
- 3.6
5
- 3.2
9
- 4.0
8
- 4.1
6
- 4.5
3
- 3.8
2
- 4.8
3
- 4.9
4
- 4.6
8
- 4.7
5
- 4.9
0
- 4.5
3
- 4.0
4
- 6.1
7
- 6.8
6
[HA
] Ran
ge
0.05
0.12
0.15
0.45
0.20
0.24
0.21
0.26
0.28
0.42
0.36
0.33
0.20
0.33
0.26
0.39
0.16
0.17
0.37
0.40
- - - - - - - - - - - - - - - - - - - -
0.01
0.06
0.04
0.19
0.07
0.09
0.04
0.11
0.12
0.20
0.16
0.22
0.12
0.19
0.11
0.20
0.06
0.11
0.15
0.20
pH
2.29
1.70
2.29
2.29
2.29
2.29
2.29
2.29
2.29
2.29
2.29
2.29
2.29
2.29
2.29
2.29
2.29
2.29
2.29
2.29
iso- o
ctan
e
n-oc
tane
n-de
cane
1,1,
2,2-
tetra
chlo
roet
hane
tetra
chlo
roet
hyle
ne
1,3 -
diiso
prop
ylbe
nzen
e
Cycl
ohex
ane
2,3 -
dich
loro
benz
otrif
luor
ide
Nitr
oben
zene
met
hyl i
sobu
tyl k
eton
e
Carb
on te
trach
lorid
e
Xyl
ene
Chlo
robe
nzen
e
1,3,
5 -tri
met
hylb
enze
ne
o -di
chlo
robe
nzen
e
Tolu
ene
n -do
deca
ne
Brom
oben
zene
Chlo
rofo
rm
Benz
ene
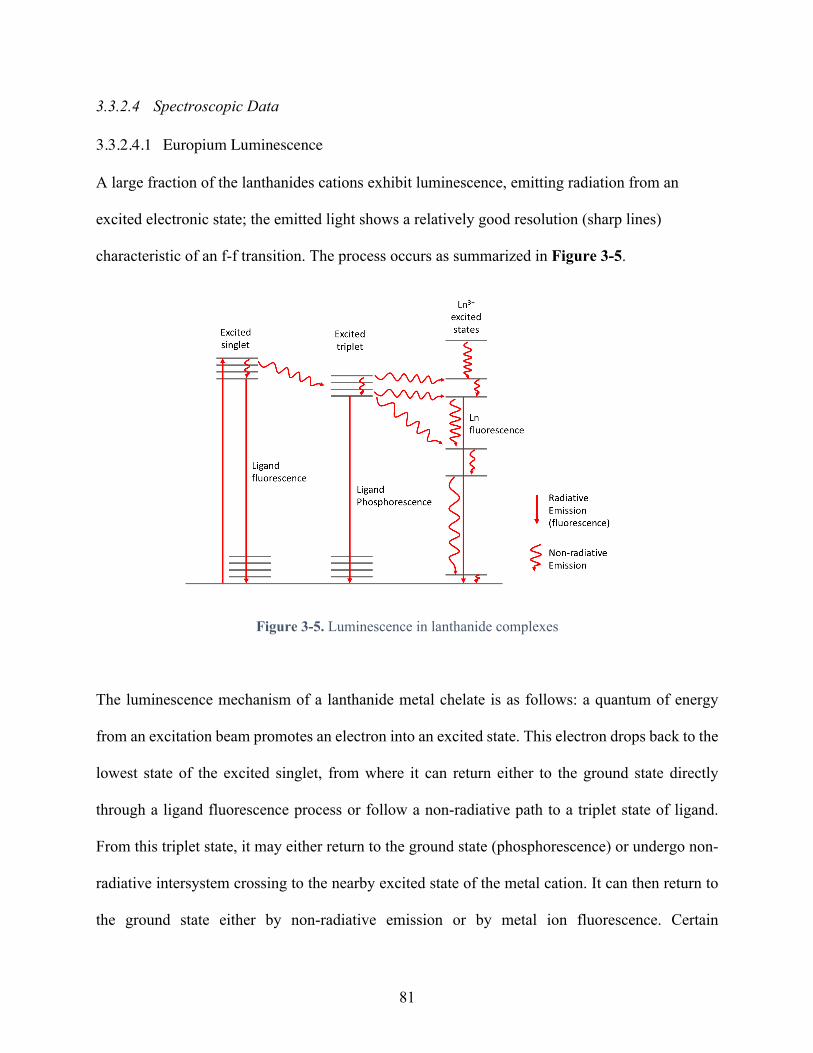
81
3.3.2.4 Spectroscopic Data
3.3.2.4.1 Europium Luminescence
A large fraction of the lanthanides cations exhibit luminescence, emitting radiation from an
excited electronic state; the emitted light shows a relatively good resolution (sharp lines)
characteristic of an f-f transition. The process occurs as summarized in Figure 3-5.
Figure 3-5. Luminescence in lanthanide complexes
The luminescence mechanism of a lanthanide metal chelate is as follows: a quantum of energy
from an excitation beam promotes an electron into an excited state. This electron drops back to the
lowest state of the excited singlet, from where it can return either to the ground state directly
through a ligand fluorescence process or follow a non-radiative path to a triplet state of ligand.
From this triplet state, it may either return to the ground state (phosphorescence) or undergo non-
radiative intersystem crossing to the nearby excited state of the metal cation. It can then return to
the ground state either by non-radiative emission or by metal ion fluorescence. Certain
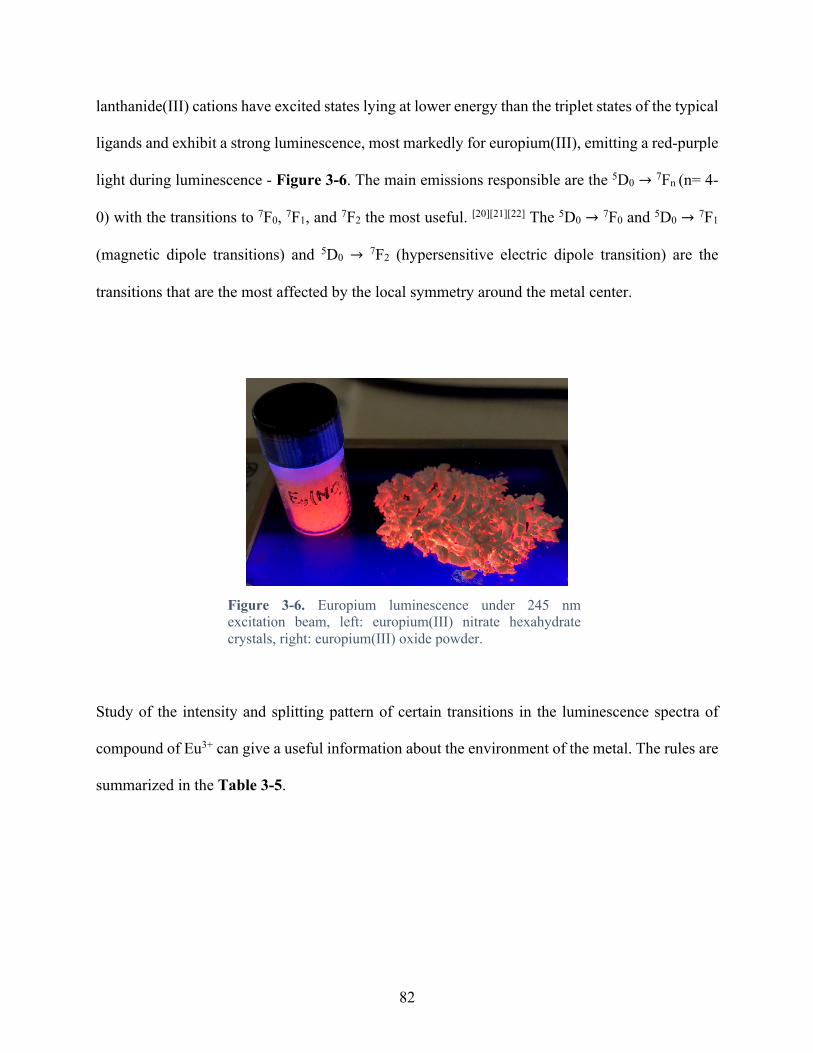
82
lanthanide(III) cations have excited states lying at lower energy than the triplet states of the typical
ligands and exhibit a strong luminescence, most markedly for europium(III), emitting a red-purple
light during luminescence - Figure 3-6. The main emissions responsible are the 5D0 → 7Fn (n= 4-
0) with the transitions to 7F0, 7F1, and 7F2 the most useful. [20][21][22] The 5D0 → 7F0 and 5D0 → 7F1
(magnetic dipole transitions) and 5D0 → 7F2 (hypersensitive electric dipole transition) are the
transitions that are the most affected by the local symmetry around the metal center.
Figure 3-6. Europium luminescence under 245 nm excitation beam, left: europium(III) nitrate hexahydrate crystals, right: europium(III) oxide powder.
Study of the intensity and splitting pattern of certain transitions in the luminescence spectra of
compound of Eu3+ can give a useful information about the environment of the metal. The rules are
summarized in the Table 3-5.
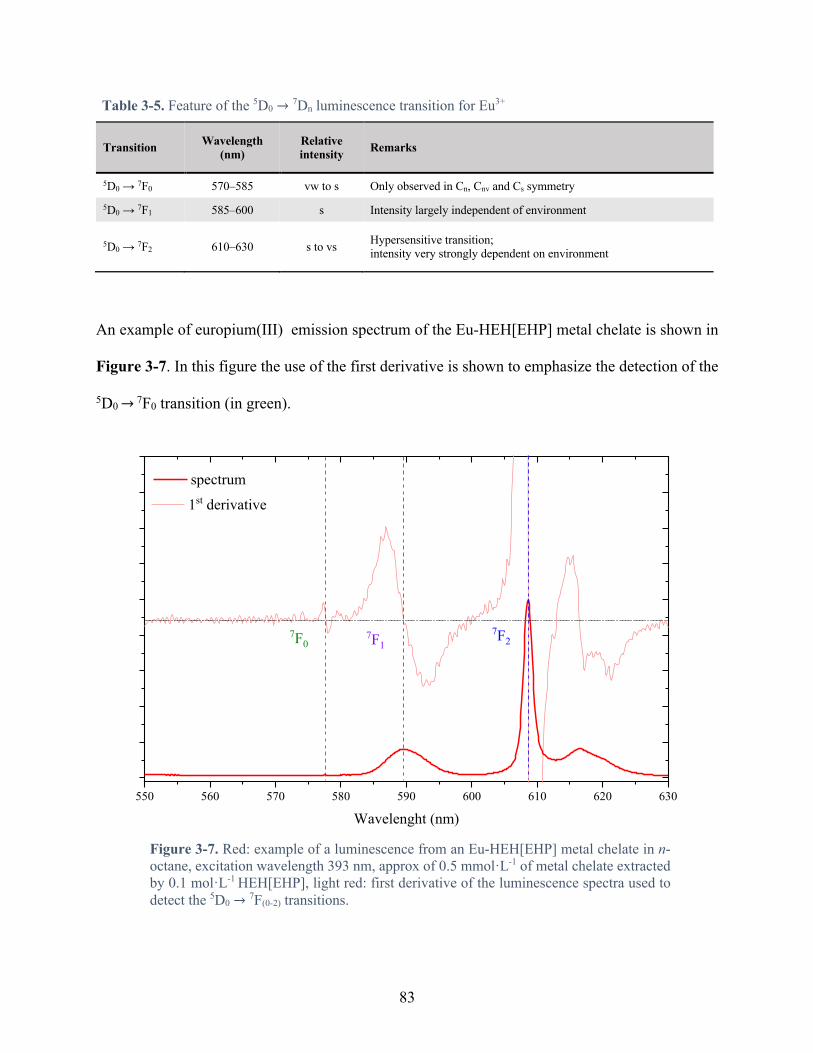
83
Table 3-5. Feature of the 5D0 → 7Dn luminescence transition for Eu3+
Transition Wavelength (nm)
Relative intensity Remarks
5D0 → 7F0 570–585 vw to s Only observed in Cn, Cnv and Cs symmetry 5D0 → 7F1 585–600 s Intensity largely independent of environment
5D0 → 7F2 610–630 s to vs Hypersensitive transition; intensity very strongly dependent on environment
An example of europium(III) emission spectrum of the Eu-HEH[EHP] metal chelate is shown in
Figure 3-7. In this figure the use of the first derivative is shown to emphasize the detection of the
5D0 → 7F0 transition (in green).
Figure 3-7. Red: example of a luminescence from an Eu-HEH[EHP] metal chelate in n-octane, excitation wavelength 393 nm, approx of 0.5 mmol·L-1 of metal chelate extracted by 0.1 mol·L-1 HEH[EHP], light red: first derivative of the luminescence spectra used to detect the 5D0 → 7F(0-2) transitions.
550 560 570 580 590 600 610 620 630
1st derivative
7F27F1
spectrum
Wavelenght (nm)
7F0
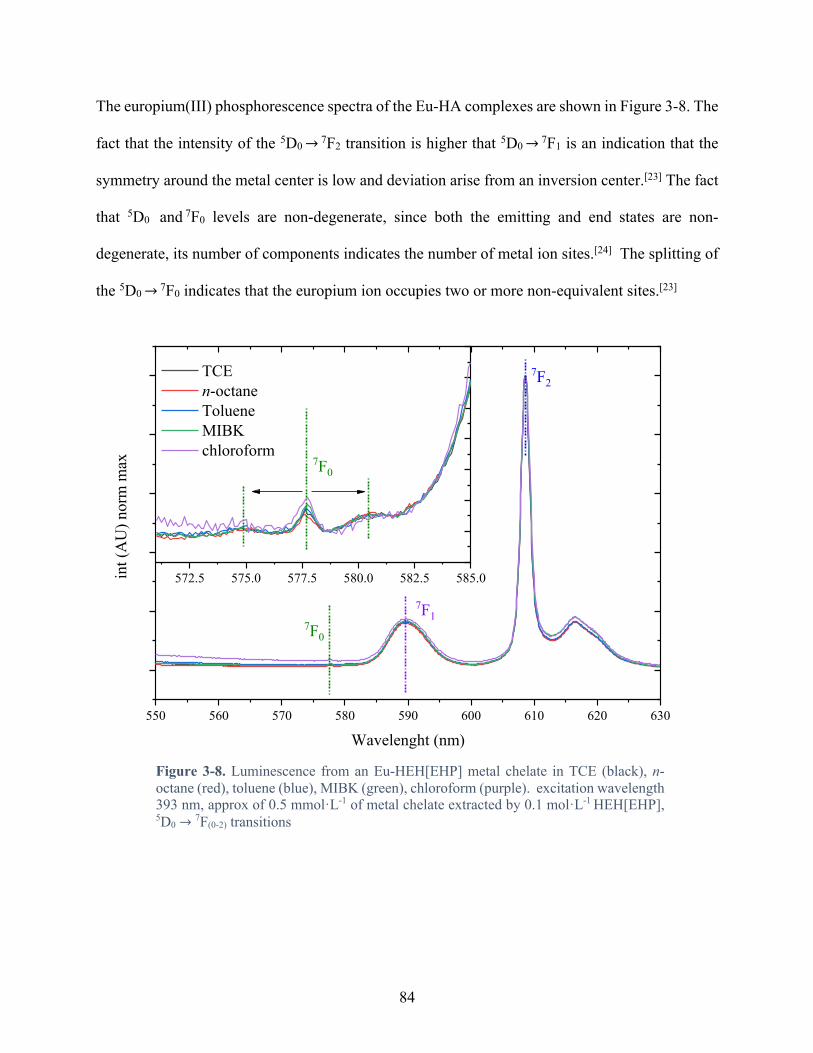
84
The europium(III) phosphorescence spectra of the Eu-HA complexes are shown in Figure 3-8. The
fact that the intensity of the 5D0 → 7F2 transition is higher that 5D0 → 7F1 is an indication that the
symmetry around the metal center is low and deviation arise from an inversion center.[23] The fact
that 5D0 and 7F0 levels are non-degenerate, since both the emitting and end states are non-
degenerate, its number of components indicates the number of metal ion sites.[24] The splitting of
the 5D0 → 7F0 indicates that the europium ion occupies two or more non-equivalent sites.[23]
Figure 3-8. Luminescence from an Eu-HEH[EHP] metal chelate in TCE (black), n-octane (red), toluene (blue), MIBK (green), chloroform (purple). excitation wavelength 393 nm, approx of 0.5 mmol·L-1 of metal chelate extracted by 0.1 mol·L-1 HEH[EHP], 5D0 → 7F(0-2) transitions
550 560 570 580 590 600 610 620 630
572.5 575.0 577.5 580.0 582.5 585.0
7F0
7F2
7F1
int (
AU
) nor
m m
ax
Wavelenght (nm)
TCE n-octane Toluene MIBK chloroform
7F0
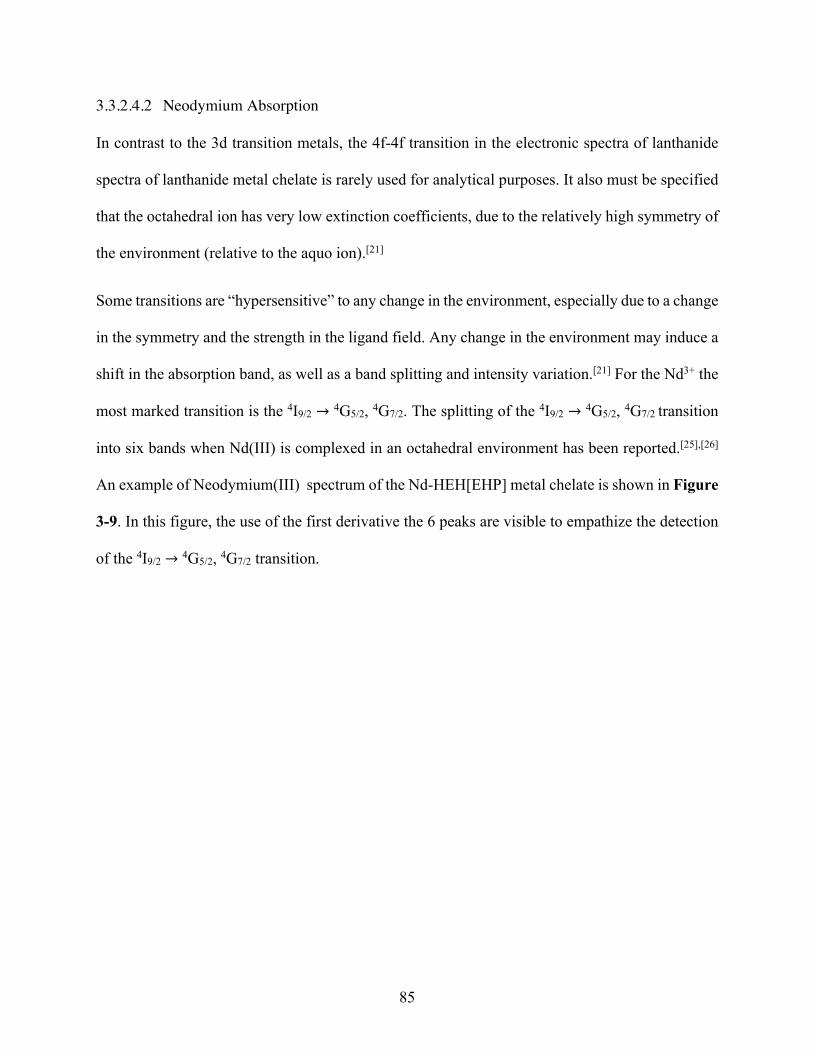
85
3.3.2.4.2 Neodymium Absorption
In contrast to the 3d transition metals, the 4f-4f transition in the electronic spectra of lanthanide
spectra of lanthanide metal chelate is rarely used for analytical purposes. It also must be specified
that the octahedral ion has very low extinction coefficients, due to the relatively high symmetry of
the environment (relative to the aquo ion).[21]
Some transitions are “hypersensitive” to any change in the environment, especially due to a change
in the symmetry and the strength in the ligand field. Any change in the environment may induce a
shift in the absorption band, as well as a band splitting and intensity variation.[21] For the Nd3+ the
most marked transition is the 4I9/2 → 4G5/2, 4G7/2. The splitting of the 4I9/2 → 4G5/2, 4G7/2 transition
into six bands when Nd(III) is complexed in an octahedral environment has been reported.[25],[26]
An example of Neodymium(III) spectrum of the Nd-HEH[EHP] metal chelate is shown in Figure
3-9. In this figure, the use of the first derivative the 6 peaks are visible to empathize the detection
of the 4I9/2 → 4G5/2, 4G7/2 transition.

86
Figure 3-9. Visible absorption of Nd-HEH[EHP] metal chelate in organic phase, 7.9 mmol·L-1 Nd and 506 mmol·L-1 HEH[EHP] in toluene
On the basis of small-angle neutron scattering (SANS) investigations, Jensen et al.[27] and Grimes
et al.[18][28] proposed the formation of the dimeric species Ln2A6 when the [HA]/[Ln]org molar ratio
is around 10, using the following mechanism:
2LnUH + 3(HA)0:::::::::: ⇌ Ln0Aº:::::::: + 6HH (3.13)
555 560 565 570 575 580 585 590 595 600 605 610
0
1
2
3
4
5
6M
olar
Abs
ortiv
ity o
f Nd(
III)
(L·m
ol-1
·cm
-1)
Wavelength (nm)
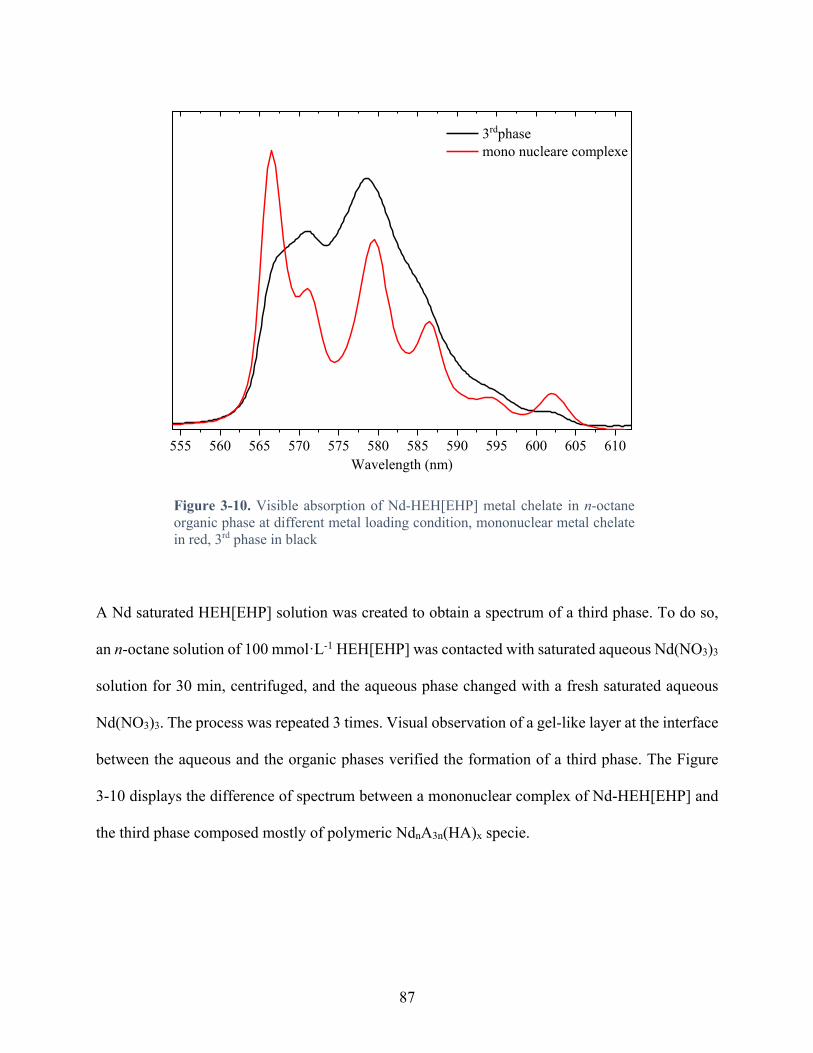
87
Figure 3-10. Visible absorption of Nd-HEH[EHP] metal chelate in n-octane organic phase at different metal loading condition, mononuclear metal chelate in red, 3rd phase in black
A Nd saturated HEH[EHP] solution was created to obtain a spectrum of a third phase. To do so,
an n-octane solution of 100 mmol·L-1 HEH[EHP] was contacted with saturated aqueous Nd(NO3)3
solution for 30 min, centrifuged, and the aqueous phase changed with a fresh saturated aqueous
Nd(NO3)3. The process was repeated 3 times. Visual observation of a gel-like layer at the interface
between the aqueous and the organic phases verified the formation of a third phase. The Figure
3-10 displays the difference of spectrum between a mononuclear complex of Nd-HEH[EHP] and
the third phase composed mostly of polymeric NdnA3n(HA)x specie.
555 560 565 570 575 580 585 590 595 600 605 610Wavelength (nm)
3rdphase mono nucleare complexe

88
Figure 3-11. Neodymium-HEH[EHP] metal chelate visible molar absorptivity in different diluent: Toluene (black), n-octane (red), MIBK (blue), TCE (green), chloroform (purple). Other information in the Table 3-6.
In this study the metal loadings were kept as low as possible (represented by elevated [HA]/[Ln]org
molar ratio). Since Grimes et al started to observe a measurable amount of the dimeric specie with
a [HA]/[Ln]org ratio of 7.7 for a Gd-HDEHP metal chelate in p-xylene, and almost non measurable
amount of dimeric species with a [HA]/[Ln]org ratio of 20.1, it has been hypothesized in this work
that if the [HA]/[Nd]org is kept above 20, the species should be exclusively mono metallic.[18],[28]
The information on the metal loading are given in Table 3-6
555 560 565 570 575 580 585 590 595 600 605 610
0
1
2
3
4
5
6M
olar
Abs
ortiv
ity N
d(III
) (L·
mol
-1·c
m-1
)
Wavelength (nm)
Toluene n-octane MIBK TCE Chloroform
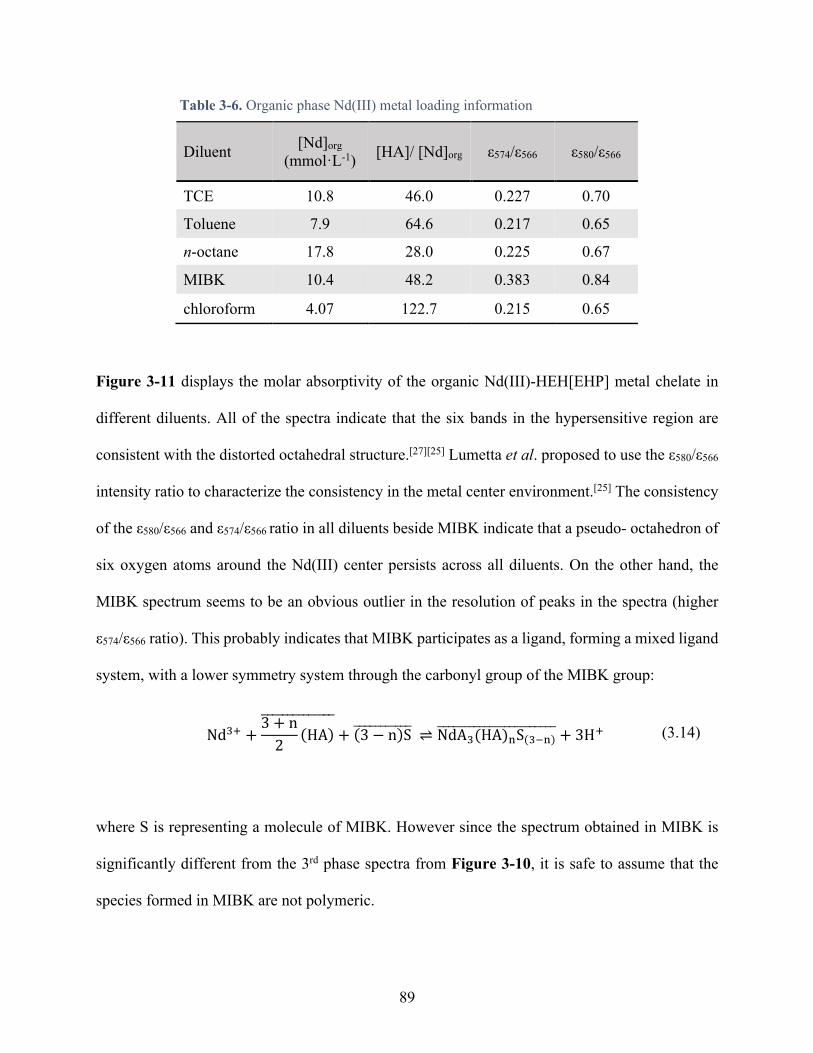
89
Table 3-6. Organic phase Nd(III) metal loading information
Diluent [Nd]org (mmol·L-1) [HA]/ [Nd]org ε574/ε566 ε580/ε566
TCE 10.8 46.0 0.227 0.70
Toluene 7.9 64.6 0.217 0.65
n-octane 17.8 28.0 0.225 0.67
MIBK 10.4 48.2 0.383 0.84
chloroform 4.07 122.7 0.215 0.65
Figure 3-11 displays the molar absorptivity of the organic Nd(III)-HEH[EHP] metal chelate in
different diluents. All of the spectra indicate that the six bands in the hypersensitive region are
consistent with the distorted octahedral structure.[27][25] Lumetta et al. proposed to use the ε580/ε566
intensity ratio to characterize the consistency in the metal center environment.[25] The consistency
of the ε580/ε566 and ε574/ε566 ratio in all diluents beside MIBK indicate that a pseudo- octahedron of
six oxygen atoms around the Nd(III) center persists across all diluents. On the other hand, the
MIBK spectrum seems to be an obvious outlier in the resolution of peaks in the spectra (higher
ε574/ε566 ratio). This probably indicates that MIBK participates as a ligand, forming a mixed ligand
system, with a lower symmetry system through the carbonyl group of the MIBK group:
NdUH +3 + n2
(HA)::::::::::::::
+ (3 − n)S::::::::::: ⇌ NdAU(HA)}S(U?})::::::::::::::::::::::: + 3HH (3.14)
where S is representing a molecule of MIBK. However since the spectrum obtained in MIBK is
significantly different from the 3rd phase spectra from Figure 3-10, it is safe to assume that the
species formed in MIBK are not polymeric.
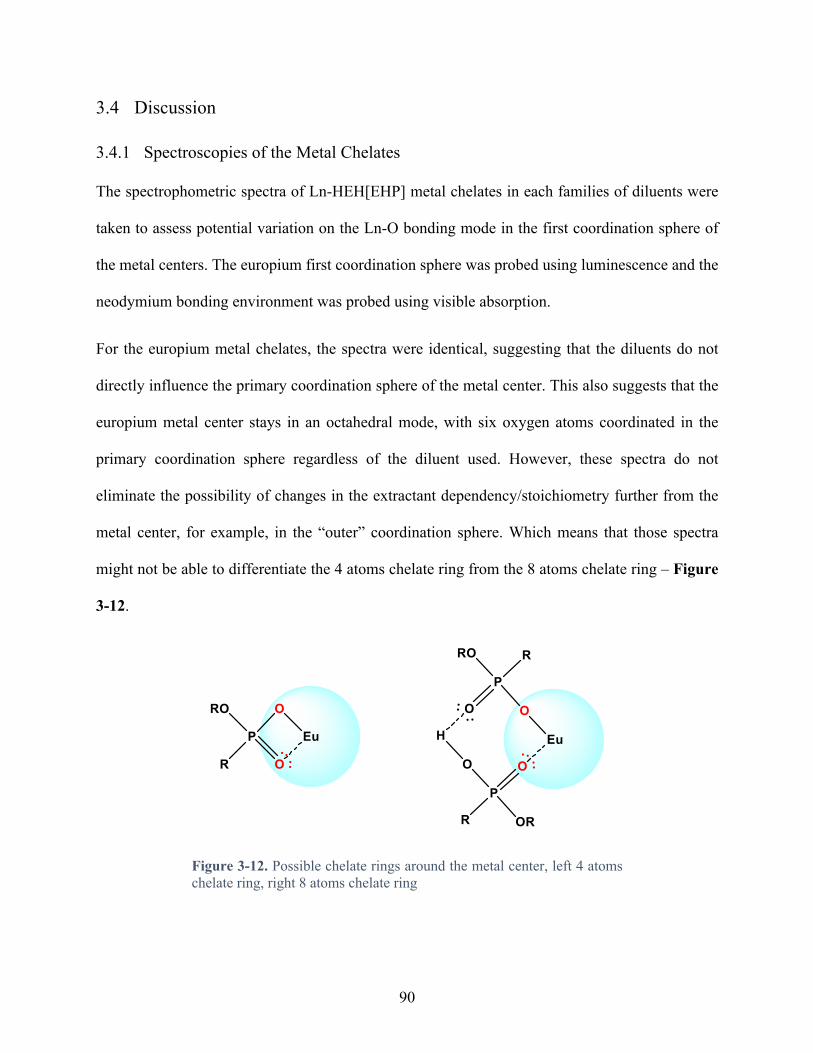
90
3.4 Discussion
3.4.1 Spectroscopies of the Metal Chelates
The spectrophometric spectra of Ln-HEH[EHP] metal chelates in each families of diluents were
taken to assess potential variation on the Ln-O bonding mode in the first coordination sphere of
the metal centers. The europium first coordination sphere was probed using luminescence and the
neodymium bonding environment was probed using visible absorption.
For the europium metal chelates, the spectra were identical, suggesting that the diluents do not
directly influence the primary coordination sphere of the metal center. This also suggests that the
europium metal center stays in an octahedral mode, with six oxygen atoms coordinated in the
primary coordination sphere regardless of the diluent used. However, these spectra do not
eliminate the possibility of changes in the extractant dependency/stoichiometry further from the
metal center, for example, in the “outer” coordination sphere. Which means that those spectra
might not be able to differentiate the 4 atoms chelate ring from the 8 atoms chelate ring – Figure
3-12.
Figure 3-12. Possible chelate rings around the metal center, left 4 atoms chelate ring, right 8 atoms chelate ring
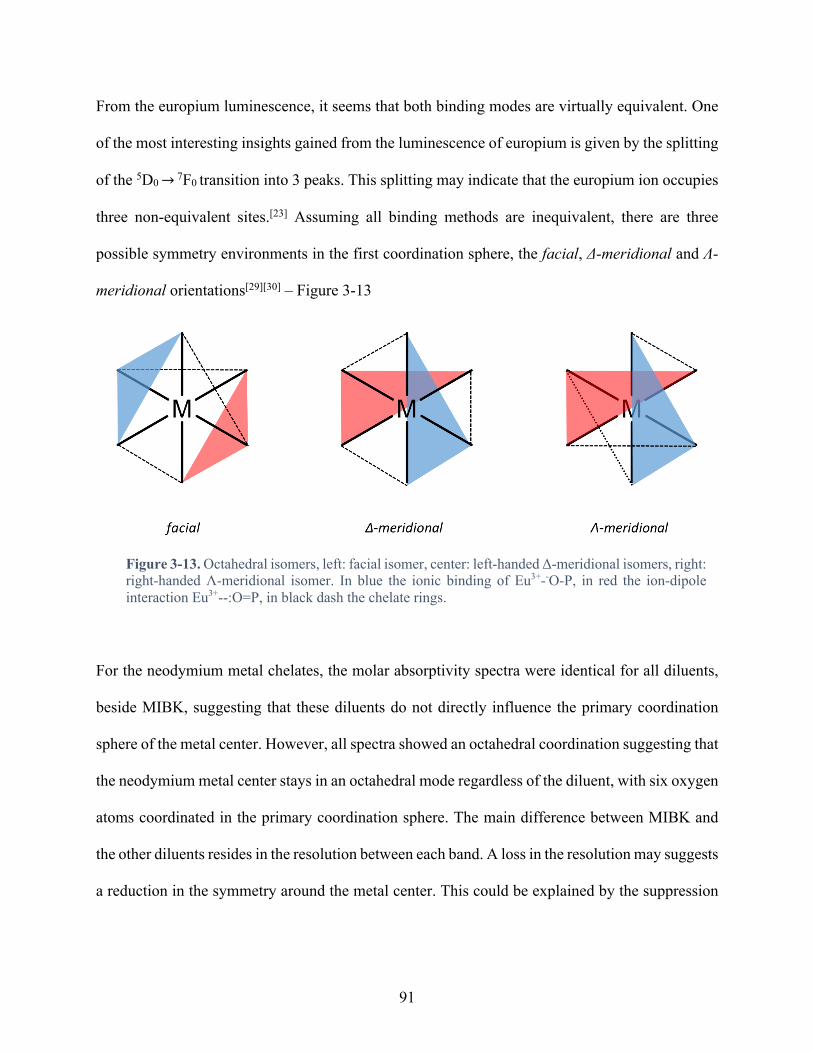
91
From the europium luminescence, it seems that both binding modes are virtually equivalent. One
of the most interesting insights gained from the luminescence of europium is given by the splitting
of the 5D0 → 7F0 transition into 3 peaks. This splitting may indicate that the europium ion occupies
three non-equivalent sites.[23] Assuming all binding methods are inequivalent, there are three
possible symmetry environments in the first coordination sphere, the facial, Δ-meridional and Λ-
meridional orientations[29][30] – Figure 3-13
Figure 3-13. Octahedral isomers, left: facial isomer, center: left-handed Δ-meridional isomers, right: right-handed Λ-meridional isomer. In blue the ionic binding of Eu3+--O-P, in red the ion-dipole interaction Eu3+--:O=P, in black dash the chelate rings.
For the neodymium metal chelates, the molar absorptivity spectra were identical for all diluents,
beside MIBK, suggesting that these diluents do not directly influence the primary coordination
sphere of the metal center. However, all spectra showed an octahedral coordination suggesting that
the neodymium metal center stays in an octahedral mode regardless of the diluent, with six oxygen
atoms coordinated in the primary coordination sphere. The main difference between MIBK and
the other diluents resides in the resolution between each band. A loss in the resolution may suggests
a reduction in the symmetry around the metal center. This could be explained by the suppression
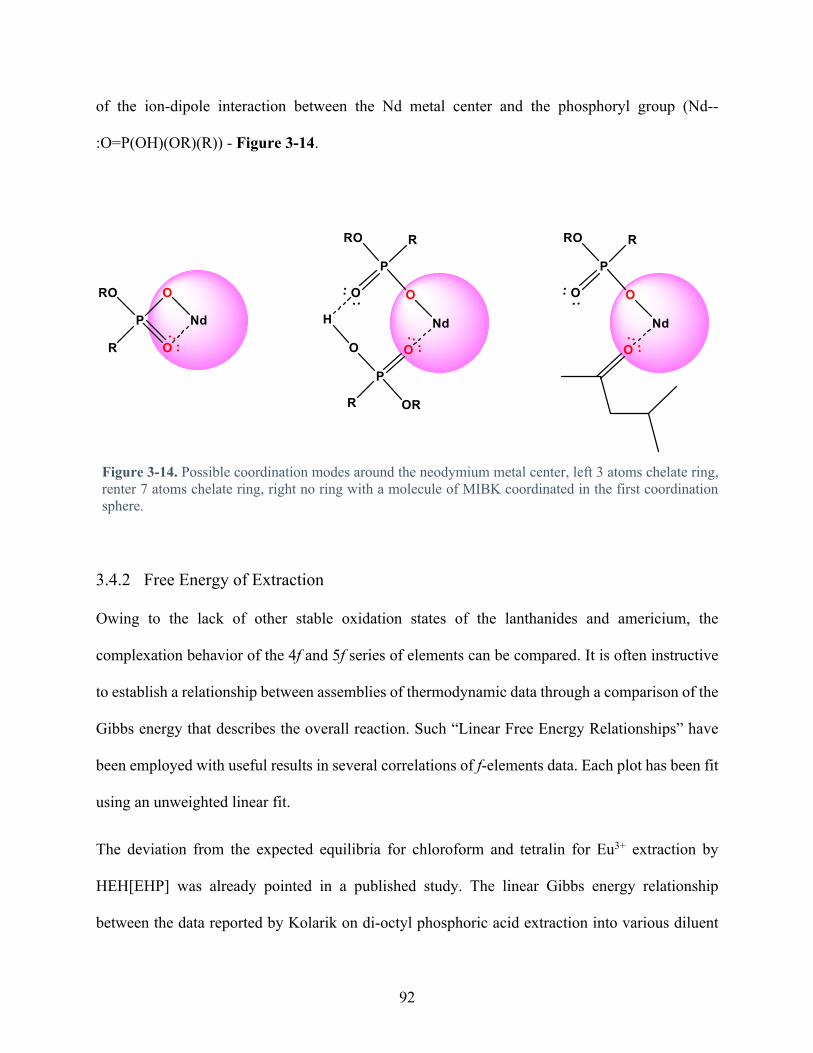
92
of the ion-dipole interaction between the Nd metal center and the phosphoryl group (Nd--
:O=P(OH)(OR)(R)) - Figure 3-14.
Figure 3-14. Possible coordination modes around the neodymium metal center, left 3 atoms chelate ring, renter 7 atoms chelate ring, right no ring with a molecule of MIBK coordinated in the first coordination sphere.
3.4.2 Free Energy of Extraction
Owing to the lack of other stable oxidation states of the lanthanides and americium, the
complexation behavior of the 4f and 5f series of elements can be compared. It is often instructive
to establish a relationship between assemblies of thermodynamic data through a comparison of the
Gibbs energy that describes the overall reaction. Such “Linear Free Energy Relationships” have
been employed with useful results in several correlations of f-elements data. Each plot has been fit
using an unweighted linear fit.
The deviation from the expected equilibria for chloroform and tetralin for Eu3+ extraction by
HEH[EHP] was already pointed in a published study. The linear Gibbs energy relationship
between the data reported by Kolarik on di-octyl phosphoric acid extraction into various diluent

93
and the equivalent results is represented in the Figure 3-16.[6][2] The HDOP results overlap with
this study on the eleven diluents common to the two studies (the aqueous media differ somewhat
(0.1 mol·L-1 vs. 1.0 mol·L-1 nitrate media)). The linear correlation is acceptable for the more
common diluents, deviating most significantly for chloroform and nitrobenzene. The linear Gibbs
energy plots shows also that HEH[EHP] seems to be around a 30% stronger extractant than DOP.
Figure 3-15. Chemical structure of di-octyl phosphoric acid
Figure 3-16. Linear Gibbs energy plots of Eu3+ extraction equilibrium data. Correlation between the Gibbs energy of extraction of Eu3+ by di-octyl phosphoric acid (HDOP) and 2-ethylhexylphosphonic acid mono-2-ethylhexyl ester (HEH[EHP]) in various diluents. Red: inert diluents (aliphatic hydrocarbon), green : aromatic diluents, purple: n-donors.
-18 -16 -14 -12 -10 -8 -6 -4 -2 0-5
0
5
10
15
20
25
30
A n-D p-D i
DG
(HE
H[E
HP]
) kJ/
m
DG(DOP) kJ/m
Slope = 1.34(±0.21)
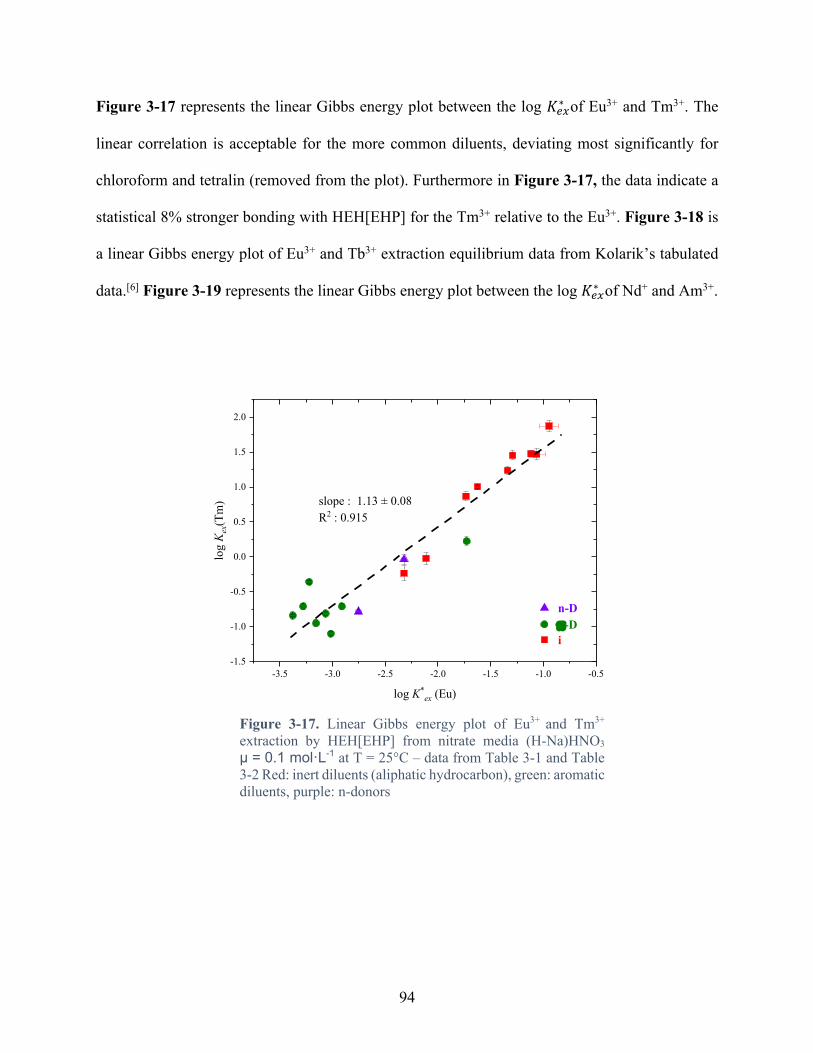
94
Figure 3-17 represents the linear Gibbs energy plot between the log 𝐾#$∗ of Eu3+ and Tm3+. The
linear correlation is acceptable for the more common diluents, deviating most significantly for
chloroform and tetralin (removed from the plot). Furthermore in Figure 3-17, the data indicate a
statistical 8% stronger bonding with HEH[EHP] for the Tm3+ relative to the Eu3+. Figure 3-18 is
a linear Gibbs energy plot of Eu3+ and Tb3+ extraction equilibrium data from Kolarik’s tabulated
data.[6] Figure 3-19 represents the linear Gibbs energy plot between the log 𝐾#$∗ of Nd+ and Am3+.
Figure 3-17. Linear Gibbs energy plot of Eu3+ and Tm3+ extraction by HEH[EHP] from nitrate media (H-Na)HNO3 µ = 0.1 mol·L-1 at T = 25°C – data from Table 3-1 and Table 3-2 Red: inert diluents (aliphatic hydrocarbon), green: aromatic diluents, purple: n-donors
-3.5 -3.0 -2.5 -2.0 -1.5 -1.0 -0.5-1.5
-1.0
-0.5
0.0
0.5
1.0
1.5
2.0
n-Dp-Di
log Kex
(Tm
)
log K*ex (Eu)
slope : 1.13 ± 0.08R2 : 0.915
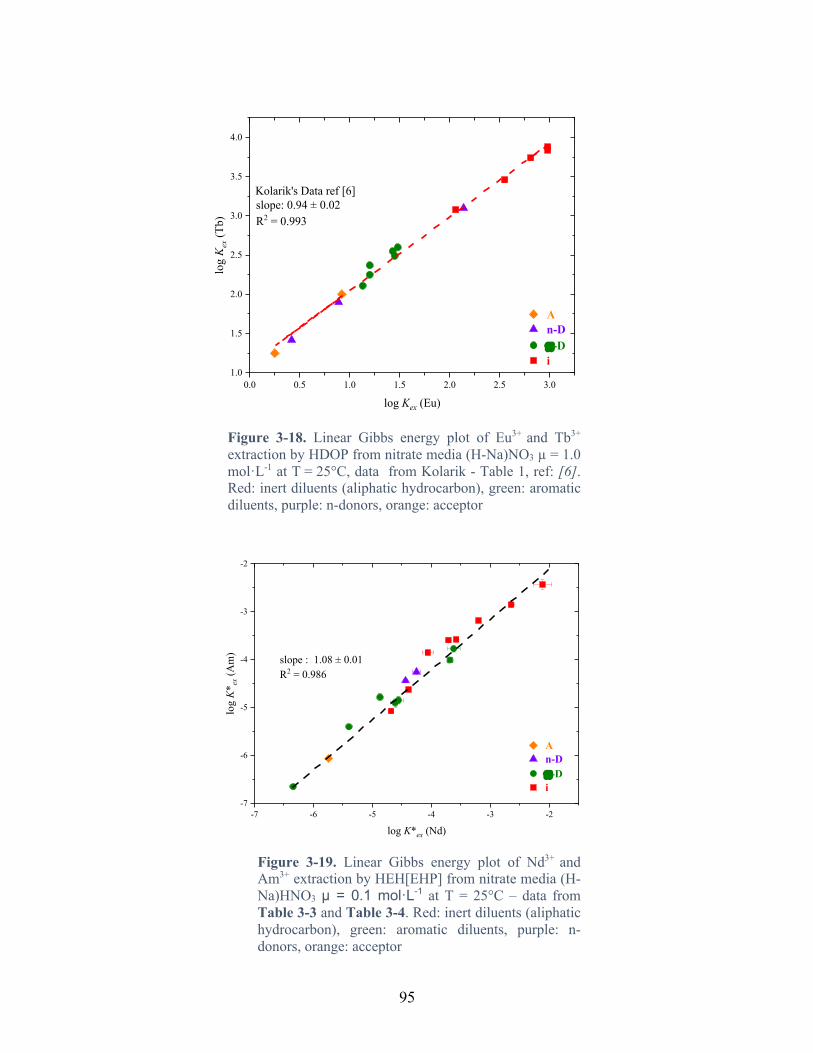
95
Figure 3-18. Linear Gibbs energy plot of Eu3+ and Tb3+ extraction by HDOP from nitrate media (H-Na)NO3 µ = 1.0 mol·L-1 at T = 25°C, data from Kolarik - Table 1, ref: [6]. Red: inert diluents (aliphatic hydrocarbon), green: aromatic diluents, purple: n-donors, orange: acceptor
Figure 3-19. Linear Gibbs energy plot of Nd3+ and Am3+ extraction by HEH[EHP] from nitrate media (H-Na)HNO3 µ = 0.1 mol·L-1 at T = 25°C – data from Table 3-3 and Table 3-4. Red: inert diluents (aliphatic hydrocarbon), green: aromatic diluents, purple: n-donors, orange: acceptor
0.0 0.5 1.0 1.5 2.0 2.5 3.01.0
1.5
2.0
2.5
3.0
3.5
4.0
An-Dp-Di
log
Kex
(Tb)
log Kex (Eu)
Kolarik's Data ref [6]slope: 0.94 ± 0.02R2 = 0.993
-7 -6 -5 -4 -3 -2-7
-6
-5
-4
-3
-2
An-Dp-Di
log K* ex (
Am
)
log K*ex (Nd)
slope : 1.08 ± 0.01R2 = 0.986

96
Evidence for the strongly ionic character of the bonding is found from Figure 3-16 to Figure 3-19.
The experimental values fit for hard cations behavior, in accordance with the known chemistry of
the f-elements.[21] In the Figure 3-19, the data indicate a statistical 8% stronger bonding with
HEH[EHP] for the Am3+ relative to the Nd3+. Since the ionic radii are equivalents, a covalent
component can be suggested for Am-HEH[EHP] bonding. This behavior is noteworthy since the
oxygen of the phosphoryl group is considered a hard Lewis acid. These linear plots are consistent
with the hypothesis that the trivalent lanthanides and actinide bonding to acidic organophosphorus
extractant can be described satisfactorily by an electrostatic model and thus that the extraction
might be driven by this electrostatic model, according to Choppin.[31][32] However, even for these
results, careful inspection of the data provides evidence of a difference in the extraction behavior
as a function of the nature of the diluents used. This will be further discussed in the next chapter.
97
3.5 Conclusion
The effect of the organic diluent on the extraction of selected trivalent f-element by HEH[EHP]
has been characterized in a large list of organic diluents with various functional groups, dielectric
constant, polarizability, shape, and size. It appears that the number of extractant molecules in the
complex changes, while the coordination mode (probed by spectrophotometry) and the number of
protons exchanged for the Eu3+ remains constant at three.
The log 𝐾#$∗ value generally decreases as the diluent gains the ability to enter into hydrogen
bonding with the extractant or the extracted metal complex, in accord with the following trend
described by Kolarik and Andrew et al[6][19]:
inert diluents > n-donor > π-donor > Acceptor.
There are many aspects of solvent extraction chemistry that were not taken into account in this
work. For example, the dimerization of the extractant likely changes with the diluent (K2). The
interfacial behavior, pKa, and the amount of water solubilized and nitrate in the organic phase are
all diluent-dependent and will affect the extraction and dimerization equilibria. More studies to
determine these and other organic phase parameters in a large variety of diluents would greatly
assist in determining the exact origins of the diluent effect.
98
3.6 References
(1) Flett, D. S. Solvent Extraction in Hydrometallurgy: The Role of Organophosphorus Extractants. J. Organomet. Chem. 2005, 690 (10), 2426–2438.
(2) Kolarik, Z. Critical Evaluation Of Some Equilibrium Constants Involving Acidic Organophosphorus Extractants. J. Pure Appl. Chem. 1982, 54 (12), 2593–2674.
(3) Kolarik, Z. Review : Dissociation , Self-Association , and Partition of Monoacidic Organophosphorus Extractants. 2010, No. III, 707–763.
(4) Ghebghoub, F.; Barkat, D. The Effect of Diluents on Extraction of Copper(II) with Di(2-Ethylhexyl)Phosphoric Acid. J. Coord. Chem. 2009, 62 (9), 1449–1456.
(5) Mason, G. W.; Bollmeier, A. F.; Peppard, D. F. Diluent Effects in the Extraction of Selected Metallic Cations by Bis(Hexoxy-Ethyl) Phosphoric Acid. J. Inorg. Nucl. Chem. 1967, 29 (4), 1103–1112.
(6) Kolarik, Z. The Effect of Diluent on the Solvent Extraction of Tb(III) and Eu(III) by Di-n-Octyl Phosphoric Acid. In Solvent Extraction Chemistry; Dyrssen, D., Liljenzin, J.-O., Rydberg, J., Eds.; John Wiley: Amsterdam, 1967; pp 250–255.
(7) Löfström-engdahl, E. N. On the Diluent and Solvent Effects in Liquid- Liquid Extraction Systems Based on Bis-Triazine-Bipyridine ( BTBP ) Ligands, CHALMERS UNIVERSITY OF TECHNOLOGY, 2014.
(8) Chowdhury, M. R.; Sanyal, S. K. Diluent Effect on Extraction of Tellurium (IV) and Selenium (IV) by Tri-n Butyl Phosphate. Hydrometallurgy 1994, 34 (3), 319–330.
(9) Löfström-engdahl, E. N.; Aneheim, E.; Ekberg, C.; Foreman, M.; Skarnemak, G. Diluent Effects in Solvent Extraction. In Proceedings of the First ACSEPT International Workshop Lisbon; Lisbon, Portugal, 2010.
(10) Marcus, Y. Diluent Effects in Solvent Extraction. Solvent Extr. Ion Exch. 1989, 7 (4), 567–575.
(11) Mason, G. W.; Schofer, N. L.; Peppard, D. F. Extraction of U(VI) and Selected M(III) Cations by Bis-n-Octyl Phosphoric Acid in Two Different Hydrocarbon Diluents. J. Inorg. Nucl. Chem. 1970, 32 (VI), 3911–3922.
(12) Mason, G. W.; Schofer, N. L.; Peppard, D. F. The Extraction of U(VI) and Selected M(III) Cations by Bis Neo-Octyl Phosphoric Acid in Two Different Hydrocarbon Diluents. J. Inorg. Nucl. Chem. 1970, 32 (12), 3911–3922.
(13) Löfström-Engdahl, E.; Aneheim, E.; Ekberg, C.; Foreman, M.; Skarnemark, G.; Hájková, Z.; Grűner, B. The Extraction of Silver and the Effect of Diluent, Ligand Side Group and Solvent Composition. In Atalante 2012; 2012; Vol. 7, pp 239–244.

99
(14) Akiba, K.; Wada, M.; Kanno, T. Effect of Diluent on Synergic Extraction of Europium by Thenoyltrifluoroacetone and Tri-n-Octyl Phosphine Oxide. J. Inorg. Nucl. Chem. 1981, 43 (5), 1031–1034.
(15) Mason, G. W.; Metta, D. N.; Peppard, D. F. The Extraction of Selected M(III) Metals by Bis 2-Ethylhexyl Phosphoric Acid in n-Heptane. J. Inorg. Nucl. Chem. 1976, 38 (11), 2077–2079.
(16) Peppard, D. F.; Mason, G.; Lewey, S. Di N-Octyl Phosphinic Acid as a Selective Extractant for Metallic Cations, Selected M(III) and M(VI) Tracer Studies; 1965; Vol. 27.
(17) Bjerrum, J. Metal Ammine Formation in Aqueous Solution: Theory of the Reversible Step Reactions, University of California, 1941.
(18) Grimes, T. S.; Jensen, M. P.; Debeer-Schmidt, L.; Littrell, K.; Nash, K. L. Small-Angle Neutron Scattering Study of Organic-Phase Aggregation in the TALSPEAK Process. J. Phys. Chem. B 2012, 116 (46), 13722–13730.
(19) Andrew, L. J.; Keefer, R. M. Molecular Complexes in Organic Chemistry, first.; Holden-Day, Inc: San Fransisco, 1964.
(20) Binnemans, K. Interpretation of Europium (III) Spectra. Coord. Chem. Rev. 2015, 295, 1–45.
(21) Cotton, S. Lanthanide and Actinide Chemistry; John Wiley: West Sussex, 2013.
(22) Horrocks, W. D.; Sudnick, D. R. Lanthanide Ion Probes of Structure in Biology. Laser- Induced Luminescence Decay Constants Provide a Direct Measure of the Number of Metal-Coordinated Water Molecules. J. Am. Chem. Soc. J 1979, 101 (2), 334–340.
(23) Gupta, S. K.; Reghukumar, C.; Kadam, R. M. Eu3+ Local Site Analysis and Emission Characteristics of Novel Nd2Zr2O7:Eu Phosphor: Insight into the Effect of Europium Concentration on Its Photoluminescence Properties. RSC Adv. 2016, 6 (59), 53614–53624.
(24) Du, F.; Zhu, R.; Huang, Y.; Tao, Y.; Jin Seo, H. Luminescence and Microstructures of Eu3+-Doped Ca9LiGd2/3(PO4)7. Dalt. Trans. 2011, 40 (43), 11433–11440.
(25) Lumetta, G. J.; Sinkov, S. I.; Krause, J. A.; Sweet, L. E. Neodymium(III) Complexes of Dialkylphosphoric and Dialkylphosphonic Acids Relevant to Liquid-Liquid Extraction Systems. Inorg. Chem. 2016, 55 (4), 1633–1641.
(26) Grimes, T. S.; Tian, G.; Rao, L.; Nash, K. L. Optical Spectroscopy Study of Lanthanide Organic Phase Complexes in the TALSPEAK Separation Process. Inorg. Chem. 2012, 51 (11), 6299–6307.
(27) Jensen, M. P.; Chiarizia, R.; Urban, V. Investigation of the Aggregation of the Neodymium Complexes of Dialkylphosphoric, -Oxothiophosphinic, and -Dithiophosphinic Acids in Toluene. Solvent Extr. Ion Exch. 2001, 19 (5), 865–884.
100
(28) Grimes, T. S. Coordination Chemistry of F-Elements in the TALSPEAK Process, Ph.D. dissertation, Washington State University, 2011.
(29) Kimberlin, A. Utilization of Traditional and Novel NMR Spectroscopic Techniques to Probe Interaction in the Organic Phase of Liquid-Liquid Solvent Extraction System, Ph.D. dissertation, Washington State University, 2017.
(30) Lecrivain-Martin, T.; Kimberlin, A.; Dodd, D. E.; Miller, S.; Hobbs, I.; Heller, F.; Lapka, J.; Huber, M.; Nash, K. L. The Effect of Organic Diluent on the Extraction of Eu(III) by HEH[EHP]. Solvent Extr. Ion Exch. special ed, 1–23.
(31) Choppin, G. R. Comparison of the Solution Chemistry of the Actinides and Lanthanides. J. Less-Common Met. 1983, 93 (2), 323–330.
(32) Choppin, G. R.; Rizkalla, E. N. Solution Chemistry of Actinides and Lanthanides. In Handbook on the Physics and Chemistry of Rare Earths; Gshneidner, K. A., Eyring, L., Choppin, G. R., Lander, G. H., Eds.; Elsevier Science B.V., 1994; Vol. 18–Lanth, pp 559–590.
101
CHAPTER FOUR
4 CHARACTERIZATION OF THE DILUENT EFFECT ON SOLVENT EXTRACTION OF Eu(III) BY HEH[EHP] AS
FUNCTION OF FUNDAMENTAL CHEMICAL PROPERTIES OF THE DILUENTS
4.1 Introduction
There are many aspects of solution chemistry, and the effect of solvation in solution is one of the
most fascinating. Since the solvent (diluent) is fundamental to solution chemistry, it is necessary
to be familiar with their properties in order to understand their role and how they can be used to
increase our degree of control on a system. In addition, solvent extraction has been referred to as
the "ultimate solution chemistry experiment”2 due to its complexity, in general due to the
cohabitation of two condensed phases in the same system.
In the previous chapter an extensive list of diluents were used to demonstrate the general impact
of a diluent on the solvent extraction behavior of f-elements by an acidic organophosphorus
extractant. In this chapter, special attention will be given, first, to the theory of the diluent effect,
then a more detailed analysis will be done on the data from Chapter 3, tying it to information from
the literature. The main objective of this chapter is to attempt to integrate all of the collected
information to achieve a deeper understanding of the impact of the diluent on the solvent extraction
processes, specifically focusing on an acidic organophosphorus extractant.
2 Personal quote from prof Ken Nash
102
4.2 Theory of Thermodynamics of the Solvation Process
The first aspect, and probably the most important one, that must be considered on the choice of a
diluent is its ability to dissolve a solute through a solvation process. In order to study the solvation
process, it is critical to first agree on a definition of this process. In 1984 Ben-Naim and Marcus
defined the solvation process as[1]:
“The process in which a particle of the solute is transferred at a given
temperature and pressure from a fixed position in the ideal gas phase into a
fixed position in the liquid phase in which it is solvated”
This definition is particularly interesting, as it emphasizes the phenomenology and the
thermodynamic aspects of the process. This definition implies that a change must occurs in the
diluent (creation of a “cavity”) for the particle to take place in within it, such as the rearrangement
of the diluent molecules and if needed the other solute molecules.[2]
Gibbs energy of solvation of a diluent particle in its own liquid (e.g., one molecule of ethanol is
condensed in an ethanol media) is defined as[3][4]:
∆�𝐺° = −𝑅𝑇 · ln𝑝𝑀𝑅𝑇𝑑 (4.1)
where p is the saturation vapor pressure, M is the molar mass, d the density, R the ideal gas
constant, and T the absolute temperature. Solubility is often defined as the mole fraction of a solute
xs at a given temperature, at the saturation point[5]:
∆�g�p�vgn𝐺° = −𝑅𝑇 · ln 𝑥� (4.2)
103
The ΔsolutionG° is interpreted as the difference between the Gibbs energy of solvation of the solute
in the solvent and any Gibbs energy related to diluent-diluent interaction that is lost during the
solvation process. It is necessary to furnish work against the cohesive force of the diluent, as the
first stage of the solvation process is the creation of a cavity to accommodate the solute itself.
Figure 4-1 demonstrates a schematic representation of the cavitation process. Simply, the creation
of an empty volume in the liquid is needed to provide space for the solute in the liquid. The total
volume fraction of the solute takes into account any change in the volume to the system:
𝜑� = 1
1 + 𝑉�(1 − 𝑥�)𝑉�
(4.3)
where Vd and Vs are the molar volume of the diluent and the solute respectively, and xs being the
mole fraction of the solute. In dilute solution, this parameter can be approximated to:
𝜑� = [𝑆]𝑣� (4.4)
where [S] is the concentration of the solute S in mol·L-1 and νs is the partial molar volume of the
solute in the solution in L·mol-1. The solvation of a solute molecule in a diluent affects the diluent-
diluent interaction in addition to the solute-diluent interaction that takes place. Knowing that, it
seem obvious that the forces that reside in the diluent itself, and ipso facto the properties of the
diluents, are going to have a major role into the diluent effect.

104
Conceptually it is possible to decompose the solvation process into multiple steps[5]:
1. First a cavity is formed, breaking down the cohesive forces of the diluent
2. Then, dispersive forces are “switched on”, allowing any solute particle to be dispersed
(regardless of the polarity, polarizability of the particle considered)
3. Then interactive forces a “switched on” to provide the interactive contributions (interaction
of polar and polarizable molecule, electron and hydrogen donor and acceptor actions)
4.2.1 Cavitation
Each of these steps are interesting to consider, even if it is an approximation to separate them into
distinct contributions, as it helps to articulate a better understanding of the overall process. When
the cohesive forces of the diluent are low (weak diluent-diluent interaction), the Hildebrand’s
solubility parameter concept provides a very useful equation with the Gibbs energy of cavitation[6]:
∆ÔkÕ𝐺 = 𝐴ÔkÕ𝑉�𝛿�0 (4.5)
where Acav is a proportionality coefficient, Vs is the molar volume of the solute, and δd2 the cohesive
energy density of the solvent. Thus, in a series of diluents for the same solute, the positive
contribution of cavity formation to the free Gibbs energy of solvation increases with the square of
the Hildebrand solubility parameter.
Figure 4-1. Schematic representation of a cavitation process needed for the solvation process of a solute in a non-interacting diluent

105
4.2.2 Dispersion
The contribution of the diluent to the dispersion of a large particle is negative (attractive force)
and proportional to the surface area of the interacting molecules or to the number N of segment
present and depends on their chemical nature. For classic molecule a segment may be a –CH2–, a
–CH3, or a –CH= (aromatic) or equivalents for oxygen, nitrogen, phosphorus atoms in a molecule.
∆�v�Ö𝐺 =u𝐴v�� · 𝑁v� · 𝑁v� = 𝐴× · 𝜋 (4.6)
where Aisd is the negative interaction Gibbs energy of the pair of segment i, and the sum extend
over all the different kind of segments. Aπ being a proportionality coefficient, and π the
polarizability of the diluent.
4.2.3 Interactive forces
There may be additional, specific, interactions between the solute and the diluent. Hydrogen
bonding arise in protic diluents (e.g., water, alcohols) with very basic atoms with lone pair of
electrons as hydrogen acceptor. Also, donor-acceptor bond adducts can be formed if the diluent
presents a very basic and or acidic atom.
∆vn�#h𝐺 = 𝐴Ø · 𝛼 + 𝐴Ú · 𝛽 (4.7)
with Aα and Aβ being proportionality coefficients, α being hydrogen bond donation (acidity), and
β for hydrogen bond acceptance (basicity).

106
Then the Gibbs energy could be summarized as:
∆�g�Õk�vgn𝐺 = ∆ÔkÕ𝐺 +∆�v�Ö𝐺 +∆vn�#h𝐺 (4.8)
4.3 Metrics and Objectives
In the past, few attempts have been made to try to relate the diluent effect to the properties of the
diluent, with arguably the most successful being the study of Marcus in 1989.[7] Generally, when
the diluent effect (or more often called solvent effect in the literature) is carefully investigated, the
phenomena studied may be chemical equilibria K, reaction rates k, and electromagnetic spectra.
The classic methodology is to set up a scale based on one phenomenon (in general the logarithm
of K or k) plotted against a scale, with the ultimate objective to yield a mathematically significant
correlation, usually a straight line. The slope of the line may then be interpreted as a “measure” of
the susceptibility of the molecule or the reaction to changes in the particular solvent property on
which the scale is based.
This modus operandi is often termed linear free energy relationship (LFER), since it seems to
work better when the scales are based on the logarithm of K (or k) which are related to the Gibbs
energy of reaction:
∆h#kÔ�vgn𝐺 = −𝑅𝑇 ln𝐾 (4.9)
107
where ΔreactionG is the Gibbs free energy of reaction, R the ideal gas constant (R = 8.314462 J·mol-
1·K-1), T the temperature (T = 25°C = 298.15°K) and K the equilibrium constant of the reaction. In
the context of this chapter, the following equations are applied:
∆#$�hkÔ�vgn𝐺∗ = −𝑅𝑇 ln𝐾#$∗ (4.11)
where ΔextractionG* is the Gibbs energy of extraction associated with the constant of extraction 𝐾#$∗ .
Since diluent effect studies of a cation have been done in the same condition, regardless of the
diluent used, it is possible the consider this equation to follow more precisely the diluent effect[8]:
∆∆#$�hkÔ�vgn𝐺∗ = −𝑅𝑇 ln𝐾#$∗
𝐾#$∘= ∆#$�hkÔ�vgn𝐺∗ −∆#$�hkÔ�vgn𝐺∘ (4.10)
where ΔΔextractionG* is the variation of the Gibbs energy of extraction from a reference and
ΔextractionG° is an arbitrary Gibbs energy of extraction used as reference. For the remainder of this
document, carbon tetrachloride (CCl4) has been chosen to be the diluent of reference, due to its
absence of polarity, symmetry, hardness (relative to the Marcus’s softness factor[9]) and rigidity.[10]
This variation of the Gibbs energy is similar to the those used by Marcus[7] and Shmidt et al.[8][11]
In their publication, Shmidt et al. related this variation in the ΔΔextractionG* to an empirical
parameter they created based on observation, the parameter BP (from Bлияниe Pacтвopитeля,
Solvent Influence in English). This parameter was obtained for the distribution of ZnCl2 with tri-
n-octyl-amine with different diluents.[11] It was the first important step into the development of a
systematic quantitative approach in the study of diluent effects in solvent extraction, even though
this parameter applied to a very limited number of systems[11].

108
Following Shmidt, a very large number of empirical parameters have been derived by chemists,
with the objective to correlate the diluent properties (characterized by their scales) in the equilibria
and rate. In all cases it appears that the effect of a given diluent seems to the sum of many
properties, similar to the theory of solvation described by Marcus (section 4.2). Knowing that, it
is safe to assume that
∆∆#$�hkÔ�vgn𝐺∗ = ∆∆�g�Õk�vgn𝐺 = ∆∆ÔkÕ𝐺 +∆∆�v�Ö𝐺 +∆∆vn�#h𝐺 (4.11)
The statistical study made by Buncel et al. suggested that the ΔΔcavG and ΔΔdispG should be studied
together and the ΔΔinterG should be divided into two components, the acidic interactions and basic
interactions.[12] According to the literature, the cavitation and dispersion mechanisms can be
classified in the non-specific interaction diluent effect (also called general interaction).[13] In the
non-specific interaction (NSI), each diluent is treated as a dielectric continuum. According to
Marcus[14] and Stairs [15], it is reasonable to study NSI due to the cavitation and dispersion
processes in the same time. According to literature, specific interaction (SI) can be described in
term of donor-acceptor interactions. Drago described the SI as interactions involving orbitals by
using electrostatic and covalence parameters.[16] However, more recent studies described SI in
terms of acid-base hydrogen-bonding interactions.[17][18][19]
In the rest of this chapter, the equilibrium constant data from Chapter 3 are going to be investigated
as a function of each of the components of the ΔΔsolvationG, with the objective of understand how
each parameter influences the solvation process. Non-Specific Interaction: Cavitation and
Dispersion
109
4.3.1 Hildebrand Solubility Parameters
In Chapter 1 the solubility parameter has been described as the cohesive force that keeps molecules
together. This solubility parameter is usually described by:
𝛿0 = ∆ÕkÖ𝐻∘ − 𝑅𝑇
𝑉Ü (4.12)
where δ2 is the cohesive energy density, and δ, the Hildebrand solubility parameter, Vm, the molar
volume of the considered molecule, and ΔvapH° the molar heat of vaporization. The molar volume
information have been taken from the CRC Handbook[20] and the molar heat of vaporization taken
from the NIST Standard Reference Database Number 69[21]. This equation is considered as true
for a regular solution3 that shows ideal entropy effects in mixing solute and solvent and no
interactions occur beside the cohesive forces between the solute and the solvent. For this equation
to be true, it should not have any change of state in association or in orientation, which makes this
an unlikely parameter to accurately characterize diluents that can coordinate to the metal chelate
(i.e., n-donors) or diluents that can associate with the free extractants (i.e., n-donors, π-donors, and
acceptors).
Figure 4-2 represents the correlation between the ΔΔextractionG* of europium by HEH[EHP]
(results of the extractions from the Chapter 3, Table 3.1) and the δ2. Multiple interesting features
can be observed from this correlation. First, it seems that the higher the cohesive energy of a
diluent, higher the energy of solvation of the europium metal chelate, with a slope
of 63 ± 10 cm3·mol-1 (R2 = 0.68, nitrobenzene excluded). It appears that the inert diluents and the
π-donor diluents form two independent groups, with a large variation within the inert diluents, in
3 Regular solutions exhibit heat changes when mixed, ideal solutions exhibit a heat of mixing of 0.

110
the range of δ2 = 197 - 365 J·cm3 and a cluster of π-donors, in the range of δ2 = 320 - 422 J·cm3
(1,3-diisopropylbenzene excluded). There are too few data to develop any correlation among the
n-donors group or the acceptor group. A look at the inert diluents shows that the alkanes (red
squares) seem to be a different behavioral group from the halogenated diluents (open red squares),
and the variation in the inter alkanes seem increase with the molecular weight of the diluent. This
could be explained by the rigidity of the diluent; the larger the diluent molecule, higher the degree
of freedom.
Figure 4-2. Correlation between the variation of the Gibbs energy of europium extraction in different diluents by HEH[EHP] (results from the extraction from the Chapter 3, Table 3.1, results relative to carbon tetrachloride) and the cohesive energy density calculated from equation (4.12)
100 200 300 400 500 600-20
-15
-10
-5
0
5
10
nitro-bz
An-Dp-Dinertinert chlorinated
DD
exG
* Eu
d2 (J·cm-3)
MIBK
1,3-di-i-propyl-bz
increasing molecularweight of alkane diluents
111
This type of behavior suggests that the equilibria that are influenced by this parameter are
equilibria that do not involve any association constant between the solutes (HA, (HA)2,
MA3(HA)n) and the diluent.
HA → HA:::: (4.13)
(HA)0:::::::: → 2HA:::: (4.14)
MAU(HA)} → MAU(HA)}:::::::::::::: (4.15)
This behavior has been observed and heavily characterized and nicely correlated for β-Diketone
extractants, for the equilibria (4.13) and (4.15).[22][23][24] The scattering observed in their system
could be attributed to potential diluent-solute interactions:[25]
HA:::: + S: → HA · S:::::::: (4.16)
4.3.2 Polarity Parameters
4.3.2.1 Polarity
The polarity of a diluent is commonly described using a macroscopic scale (corresponding to the
polar properties of the bulk solvent) as a function of the relative permittivity of a medium
composed exclusively of this molecule, and on a molecular scale by the electrical dipole and the
dipole moment. Characterizing the diluent using macroscopic scales to describe the polarity,
means that the diluent is treated as a continuum and it can well be replaced by an electric field.[26]
112
The macroscopic scales do not to take into account the interaction of the solutes with the solvent
molecules that are necessary for the creation of the solvation shell around a solute. For that
purpose, the molecular scales are more useful. The Debye function (also called “dielectric
function”[13]) is the most common equation used to described polarity at a molecular scale:[20][15][27]
𝑓(𝜀h) = 𝜀h − 1𝜀h + 2
= 𝜌 ∙ 𝒩k
3 ∙ 𝑀 ∙ 𝜀t�𝜋 +
𝜇0
3 ∙ 𝑘 ∙ 𝑇� (4.17)
where εr is the relative permittivity, 𝜌 is the density, 𝒩k is Avogadro’s number, M the molar
mass, ε0 is the permittivity in vacuum, 𝜋 is the polarizability, 𝜇 is the dipole moment, 𝑘 is the
Boltzmann constant, and T the temperature.
The Figure 4-3 is the correlation between the variation of the Gibbs energy of europium extraction
in different diluents (relative to carbon tetrachloride) and the polarity of the diluent calculated from
the Debye function using equation (4.17). The low polarity diluents (𝑓(𝜀h) < 0.3) are composed
exclusively of the inert diluents, and the Gibbs energy of extraction generally increases with the
polarity of the diluent. At polarity 𝑓(𝜀h) > 0.3, the relative Gibbs energy maintains a constant
average within ± sigma of zero (or maybe -2 kJ/mol).
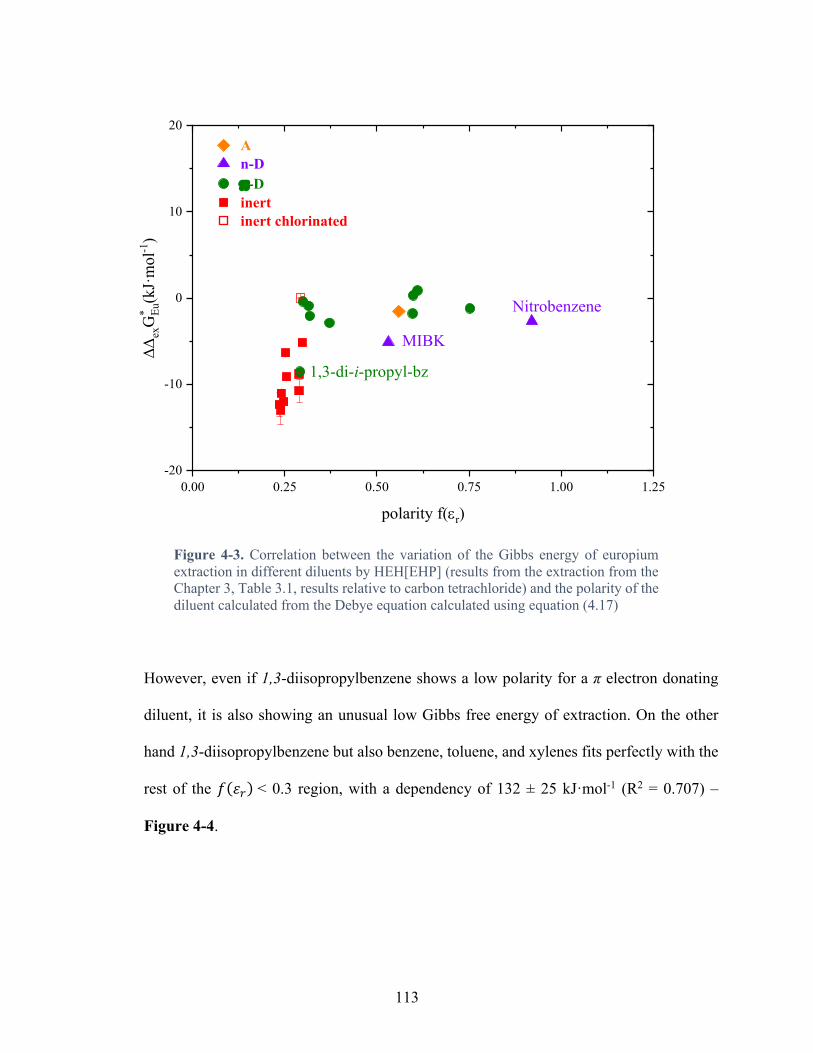
113
Figure 4-3. Correlation between the variation of the Gibbs energy of europium extraction in different diluents by HEH[EHP] (results from the extraction from the Chapter 3, Table 3.1, results relative to carbon tetrachloride) and the polarity of the diluent calculated from the Debye equation calculated using equation (4.17)
However, even if 1,3-diisopropylbenzene shows a low polarity for a π electron donating
diluent, it is also showing an unusual low Gibbs free energy of extraction. On the other
hand 1,3-diisopropylbenzene but also benzene, toluene, and xylenes fits perfectly with the
rest of the 𝑓(𝜀h) < 0.3 region, with a dependency of 132 ± 25 kJ·mol-1 (R2 = 0.707) –
Figure 4-4.
0.00 0.25 0.50 0.75 1.00 1.25-20
-10
0
10
20An-Dp-Dinertinert chlorinated
DDex
G* Eu
(kJ·
mol
-1)
polarity f(er)
1,3-di-i-propyl-bz
Nitrobenzene
MIBK

114
Figure 4-4. Fitting of free Gibbs energy of europium extraction in different diluents by HEH[EHP] (results from the extraction from the Chapter 3, Table 3.1, results relative to carbon tetrachloride) against the polarity parameter f(εr) < 0.3
4.3.2.2 Polarizability
It is important to specify that dipolar bonds in a molecule may act independently on the
neighboring molecule, doing so some molecules that would appear to be non-polar, such as carbon
dioxide, still exhibit a high polarity. The part of the electrical influence of a diluent on a solute that
arises from the polarizability of the solvent is represented by the refractive index n, more
specifically by function of n, such as the Lorenz-Lorenz function (also called “polarizability
function”[13]) f(n2) given by the equation (4.18):[20][15][13][27]
0.25 0.50 0.75 1.00 1.25-20
-10
0
10
20
DDex
G* Eu
(kJ·
mol
-1)
fitted data non fitted data
polarity f(er)
115
𝑓(𝑛0) = 𝑛0 − 1𝑛0 + 2 = 𝜋
𝜌 ∙ 𝒩k
3 ∙ 𝑀 ∙ 𝜀t (4.18)
where n is the refractive index of the diluent of the n-line from a sodium light, π the polarizability,
ρ the density of the diluent, 𝒩k the Avogadro number, M the molecular weight and ε0 the dielectric
permittivity of the vacuum. The correlation between the variation of the Gibbs energy of europium
extraction in different diluents (relative to carbon tetrachloride) and the polarizability of the diluent
calculated from the Lorenz-Lorenz function calculated using the equation (4.18) is shown in
Figure 4.6. The correlation shows that increasing the polarizability of a diluent seems to
proportionally increase the Gibbs energy of extraction of the metal chelate. However, Gibbs energy
for decalin and 1,3-diisopropylbenzene are lower than expected.
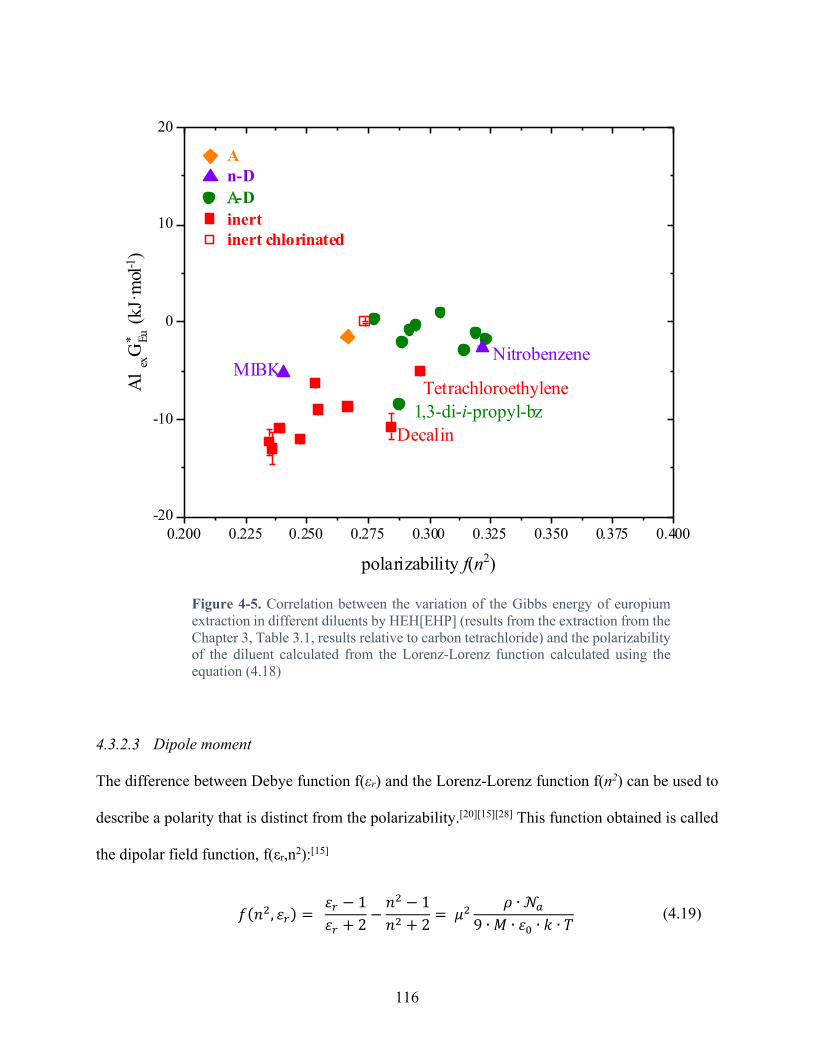
116
Figure 4-5. Correlation between the variation of the Gibbs energy of europium extraction in different diluents by HEH[EHP] (results from the extraction from the Chapter 3, Table 3.1, results relative to carbon tetrachloride) and the polarizability of the diluent calculated from the Lorenz-Lorenz function calculated using the equation (4.18)
4.3.2.3 Dipole moment
The difference between Debye function f(εr) and the Lorenz-Lorenz function f(n2) can be used to
describe a polarity that is distinct from the polarizability.[20][15][28] This function obtained is called
the dipolar field function, f(εr,n2):[15]
𝑓(𝑛0, 𝜀h) = 𝜀h − 1𝜀h + 2
−𝑛0 − 1𝑛0 + 2 = 𝜇
0 𝜌 ∙ 𝒩k
9 ∙ 𝑀 ∙ 𝜀t ∙ 𝑘 ∙ 𝑇 (4.19)
0.200 0.225 0.250 0.275 0.300 0.325 0.350 0.375 0.400-20
-10
0
10
20
Nitrobenzene
1,3-di-i-propyl-bzTetrachloroethylene
An-DA-Dinertinert chlorinated
A1 e
xG* Eu
(kJ·
mol
-1)
polarizability f(n2)
Decalin
MIBK
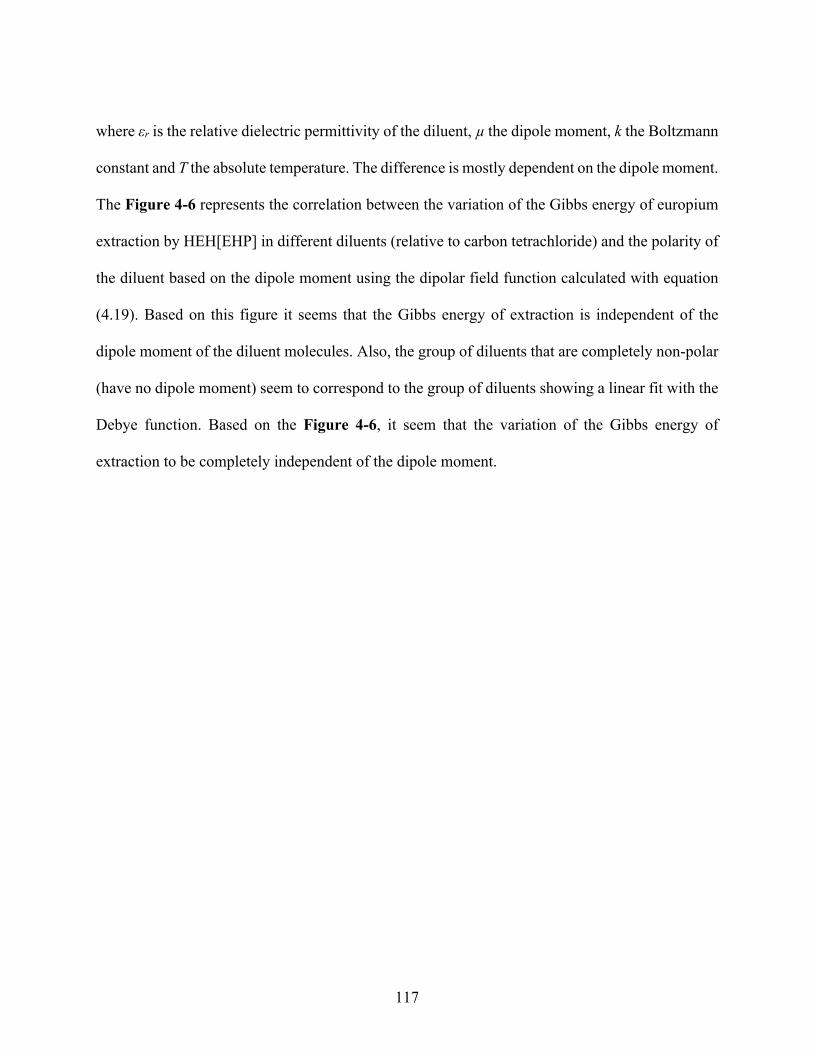
117
where εr is the relative dielectric permittivity of the diluent, µ the dipole moment, k the Boltzmann
constant and T the absolute temperature. The difference is mostly dependent on the dipole moment.
The Figure 4-6 represents the correlation between the variation of the Gibbs energy of europium
extraction by HEH[EHP] in different diluents (relative to carbon tetrachloride) and the polarity of
the diluent based on the dipole moment using the dipolar field function calculated with equation
(4.19). Based on this figure it seems that the Gibbs energy of extraction is independent of the
dipole moment of the diluent molecules. Also, the group of diluents that are completely non-polar
(have no dipole moment) seem to correspond to the group of diluents showing a linear fit with the
Debye function. Based on the Figure 4-6, it seem that the variation of the Gibbs energy of
extraction to be completely independent of the dipole moment.
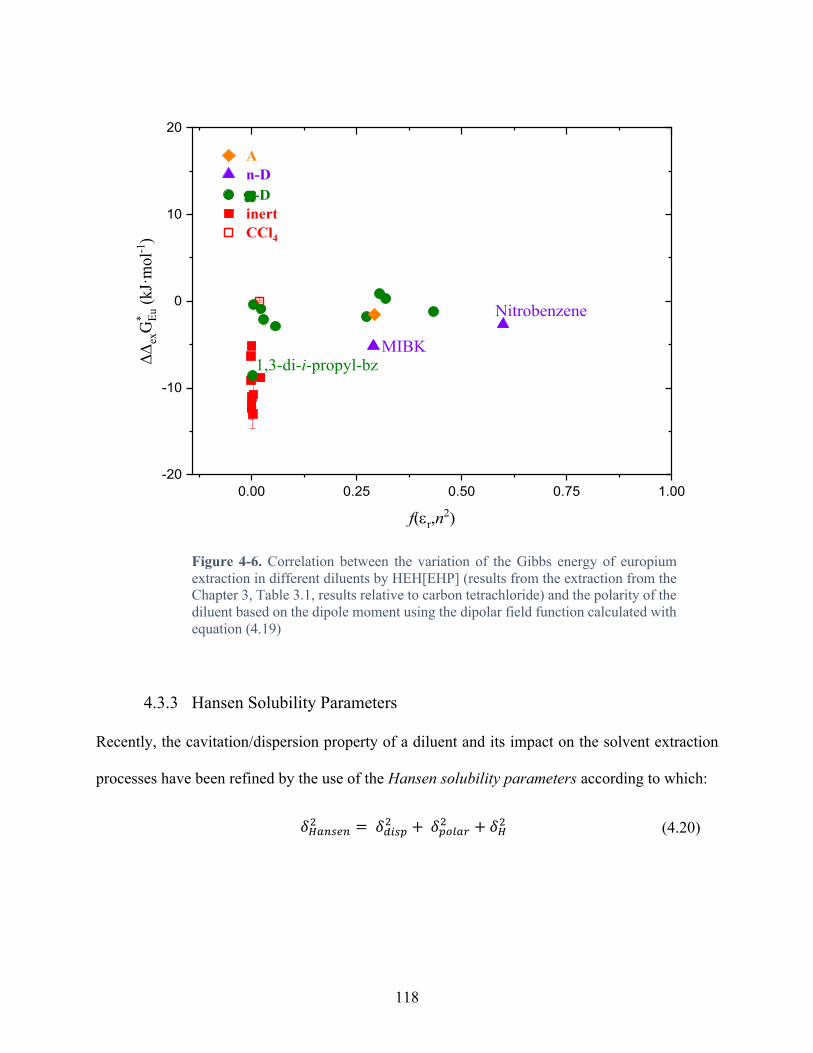
118
Figure 4-6. Correlation between the variation of the Gibbs energy of europium extraction in different diluents by HEH[EHP] (results from the extraction from the Chapter 3, Table 3.1, results relative to carbon tetrachloride) and the polarity of the diluent based on the dipole moment using the dipolar field function calculated with equation (4.19)
4.3.3 Hansen Solubility Parameters
Recently, the cavitation/dispersion property of a diluent and its impact on the solvent extraction
processes have been refined by the use of the Hansen solubility parameters according to which:
𝛿dkn�#n0 = 𝛿�v�Ö0 +𝛿Ög�kh0 + 𝛿d0 (4.20)
0.00 0.25 0.50 0.75 1.00-20
-10
0
10
20
Nitrobenzene
MIBK1,3-di-i-propyl-bz
An-Dp-DinertCCl4
DDex
G* Eu
(kJ·
mol
-1)
f(er,n2)

119
where the Hansen solubility representing the interaction between solute and diluent, and is describe
the addition of various type of cohesive forces.[29] In general, dispersion dominates and are
described as London dispersion parameters.[30] The Hildebrand and the Hansen theory diverge in
the matter that when Hildebrand developed his equation, his theory was mostly based on the
behavior of lower polarity hydrocarbons, without considering the importance of hydrogen bonding
and carboxyl groups.[30] Figure 4-7 demonstrates the correlation between the variation of the
Gibbs energy of europium extraction by HEH[EHP] in different diluents (relative to carbon
tetrachloride) and tabulated Hansen solubility parameters from reference [30]
Figure 4-7. Correlation between the variation of the Gibbs energy of europium extraction in different diluents by HEH[EHP] (results from the extraction from the Chapter 3, Table 3.1, results relative to carbon tetrachloride) and tabulated Hansen solubility parameters from reference [30]
150 200 250 300 350 400 450 500 550-20
-10
0
10
20
1,3-di-i-propyl-bz
d2Hansen(MPa)
An-Dp-Dinertinert chlorinated
DD
exG
* Eu (k
J·m
ol-1
)
MIBK Nitrobenzene

120
The inert family of diluents (red in the Figure 4-7) shows a correlation between the 𝛿dkn�#n0 and
the Gibbs free energy of extraction of europium (slope = 0.0380 ± 0.0021 kJ·mol-1·MPa-1,
R2 = 0.971). However, the other families of diluents do not show any correlation. Interestingly,
nitrobenzene and 1,3 - diisopropylbenzene are aligned on the inert diluent trend.
4.4 Specific Interactions: Solvatochromic parameters
The solvatochromism is the ability of a chemical substance to change color due to a change in the
solvent properties, such as polarity, or acidity and basicity.[31] The solvatochromic effect or
solvatochromic shift refers to a strong dependence of absorption and emission spectra with the
solvent properties. Since polarities of the ground and excited state of a chromophore are different,
a change in the solvent polarity will lead to different stabilization of the ground and excited states,
and thus, a change in the energy gap between these electronic states. Consequently, variations in
the position, intensity, and shape of the absorption spectra can be direct measures of the specific
interactions between the solute and solvent molecules.[32]
Figure 4-8. Schematic representation of a ground state property of a solvatochromic molecule
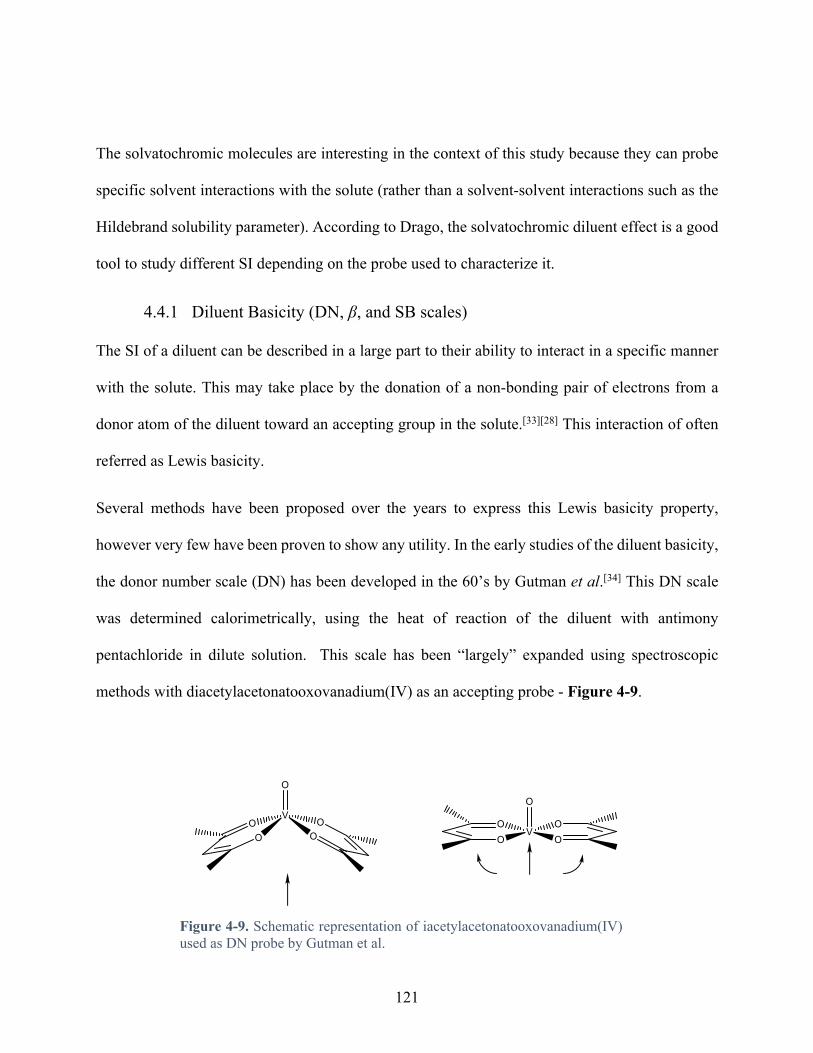
121
The solvatochromic molecules are interesting in the context of this study because they can probe
specific solvent interactions with the solute (rather than a solvent-solvent interactions such as the
Hildebrand solubility parameter). According to Drago, the solvatochromic diluent effect is a good
tool to study different SI depending on the probe used to characterize it.
4.4.1 Diluent Basicity (DN, β, and SB scales)
The SI of a diluent can be described in a large part to their ability to interact in a specific manner
with the solute. This may take place by the donation of a non-bonding pair of electrons from a
donor atom of the diluent toward an accepting group in the solute.[33][28] This interaction of often
referred as Lewis basicity.
Several methods have been proposed over the years to express this Lewis basicity property,
however very few have been proven to show any utility. In the early studies of the diluent basicity,
the donor number scale (DN) has been developed in the 60’s by Gutman et al.[34] This DN scale
was determined calorimetrically, using the heat of reaction of the diluent with antimony
pentachloride in dilute solution. This scale has been “largely” expanded using spectroscopic
methods with diacetylacetonatooxovanadium(IV) as an accepting probe - Figure 4-9.
Figure 4-9. Schematic representation of iacetylacetonatooxovanadium(IV) used as DN probe by Gutman et al.
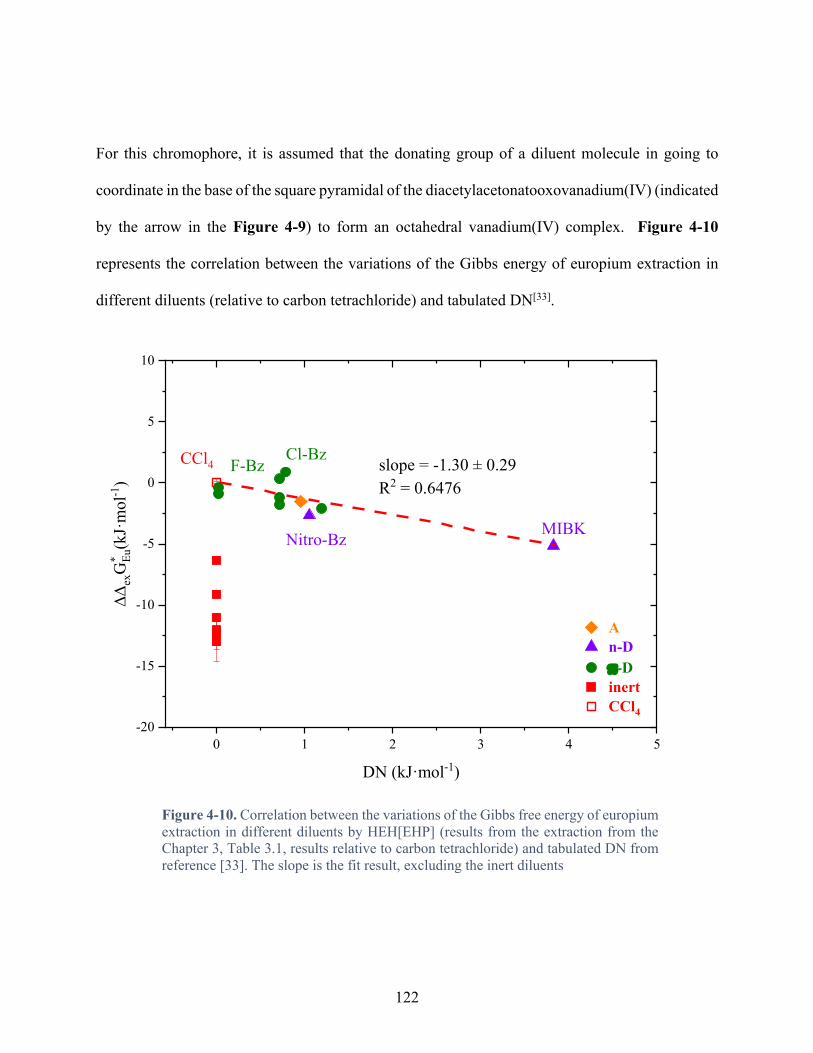
122
For this chromophore, it is assumed that the donating group of a diluent molecule in going to
coordinate in the base of the square pyramidal of the diacetylacetonatooxovanadium(IV) (indicated
by the arrow in the Figure 4-9) to form an octahedral vanadium(IV) complex. Figure 4-10
represents the correlation between the variations of the Gibbs energy of europium extraction in
different diluents (relative to carbon tetrachloride) and tabulated DN[33].
Figure 4-10. Correlation between the variations of the Gibbs free energy of europium extraction in different diluents by HEH[EHP] (results from the extraction from the Chapter 3, Table 3.1, results relative to carbon tetrachloride) and tabulated DN from reference [33]. The slope is the fit result, excluding the inert diluents
0 1 2 3 4 5-20
-15
-10
-5
0
5
10
F-Bz
MIBK
CCl4
An-Dp-DinertCCl4
DDex
G* Eu
(kJ·
mol
-1)
DN (kJ·mol-1)
slope = -1.30 ± 0.29R2 = 0.6476
Nitro-Bz
Cl-Bz

123
On the DN scale, the inert diluents all have a DN of 0, implying, as expected that the inert diluent
family does not give any electrons, showing no Lewis basicity character. The remaining diluents
show a DN > 0, where the variations of the Gibbs energy of extraction of Eu3+ by HEH[EHP]
becomes more favorable (DG < 0) proportionally to DN, with a slope of -1.30 ± 0.20 (R2 = 0.648).
Another solvatochromic scale has been created by Kamlet and Taft, the β scale. This scale is based
on the averaged quantity, for which that wavenumber of different protic chromophores shift in
function of the diluent. The interesting feature of this scale is that the effect the diluent on a
chromophore can be impacted by specific interactions but also nonspecific interactions, especially
from the polarizability. The chromophore used was studied in parallel with aprotic equivalent, to
correct for the polarizability - Figure 4-11.[17][33]
Figure 4-11. Schematic representation of the solvatochromic chromophore used for the determination of the β scale. Top left 4-nitrophenol, top right 4-nitroanisol, bottom left 4-nitroaniline, bottom right 4-nitro-N,N-diethylaniline
This β scale is by far the most popular scale of diluent hydrogen donor properties. Figure 4-12
represent the correlation between the variations of the Gibbs energy of europium extraction in
different diluents (relative to carbon tetrachloride) and tabulated β.[33] Based on the average of

124
multiple probes used and the inconsistency on the number of probes used by diluent, it is advised
to use a uncertainty of ± 0.04 units on this scale.[33] One of the first interesting features to be
observed is that, according to this scale, chlorinated diluents are classified as electron donors.
Figure 4-12. Correlation between the variations of the Gibbs free energy of europium extraction in different diluents (relative to carbon tetrachloride) and tabulated β from reference [33]. The slope is the fit result, excluding the inert diluents
For the non-inert diluent family, it appears that the variations of the Gibbs free energy of extraction
decreases proportionally to the β factor, with a slope of -10.50 ± 2.29 (R2 = 0.699) - Figure 4-12.
This result shows an improvement from the DN scale (based on the R2). This is probably due to a
combination of the higher number of solvents tabulated, presence of error bars on the β scale, and
0.0 0.1 0.2 0.3 0.4 0.5 0.6-20
-15
-10
-5
0
5
10
slope = -10.50 ± 2.29R2 = 0.699
TCE
An-Dp-Dinertinert chlorinated
DDex
G* Eu
(kJ·
mol
-1)
b (dimensionless)
CCl4
Nitro-BzMIBK

125
the stronger basicity character of methyl-isobutyl-ketone, based on the β scale. However, it is
interesting to note that the R2 decreases to 0.666 if the error bars on the β scale are removed.
The scale developed by Catalán et al. is called the SB scale (SB standing for Solvent Basicity).[35]
This scale is based on the solvatochromism of 5-nitroindolin compared to 1-methyl-5-nitroindolin
(Figure 4-13), with the advantage that the N-H acid function of the 5-nitroindoline probe has only
one hydrogen.
Figure 4-13. Schematic representation of the solvatochromic chromophore used for the determination of the SB scale. Left 5-nitroindoline, right 1-methyl-5-nitroindiline
However since this scale has been created recently, the application of this scale is not yet common
in the literature. This scale shows a surprising variation in the basic character of the inert alkane
diluents, which has not yet been explained. Figure 4-14 represents the correlation between the
variations of the Gibbs energy of europium extraction in different diluents (relative to carbon
tetrachloride) and tabulated SB.[35] Similar to the DN and β scales, the correlation using the SB
scale shows a relatively good dependency for the non-inert diluents, with a slope of -9.68 ± 2.48
(R2 = 0.49), in red in Figure 4-14. On this correlation, it is clear that chlorobenzene and
fluorobenzene are outliers. Catalán already observed surprising results with these diluents, and
assimilated this to an electron withdrawing effect. Since this electron withdrawing effect has never
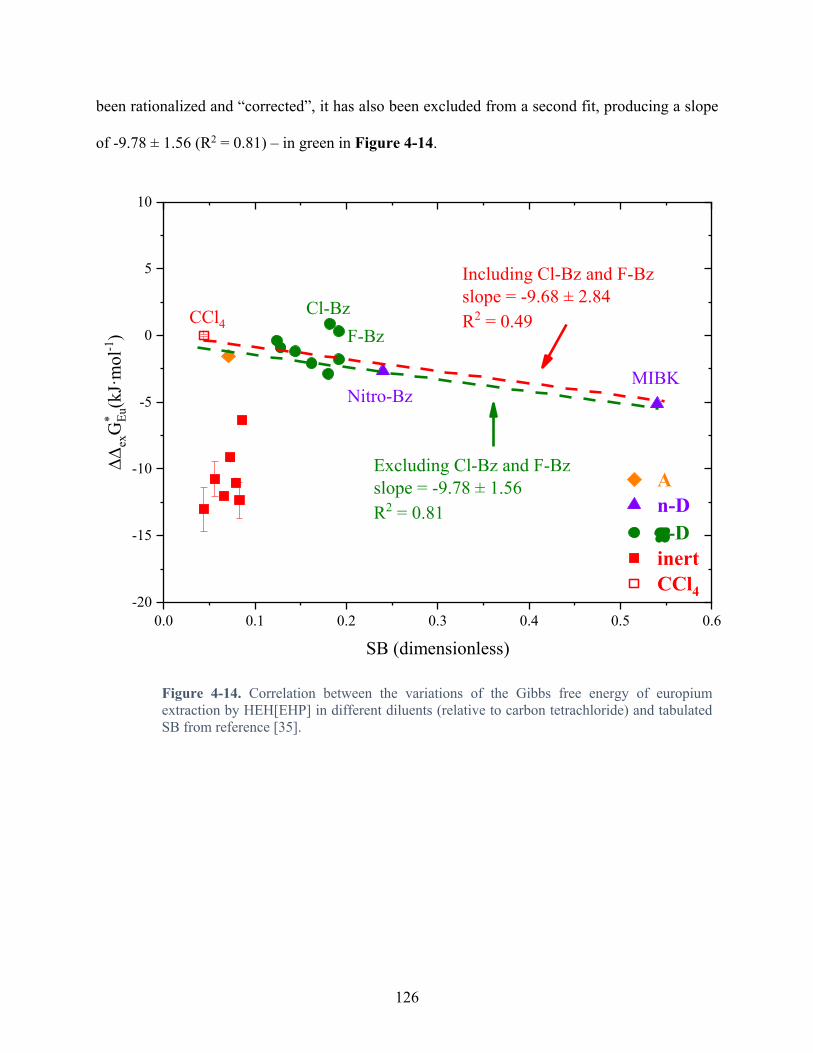
126
been rationalized and “corrected”, it has also been excluded from a second fit, producing a slope
of -9.78 ± 1.56 (R2 = 0.81) – in green in Figure 4-14.
Figure 4-14. Correlation between the variations of the Gibbs free energy of europium extraction by HEH[EHP] in different diluents (relative to carbon tetrachloride) and tabulated SB from reference [35].
0.0 0.1 0.2 0.3 0.4 0.5 0.6-20
-15
-10
-5
0
5
10
Excluding Cl-Bz and F-Bzslope = -9.78 ± 1.56R2 = 0.81
Cl-BzF-Bz
CCl4
Nitro-Bz
Including Cl-Bz and F-Bzslope = -9.68 ± 2.84R2 = 0.49
MIBK
An-Dp-DinertCCl4
DDex
G* Eu
(kJ·
mol
-1)
SB (dimensionless)
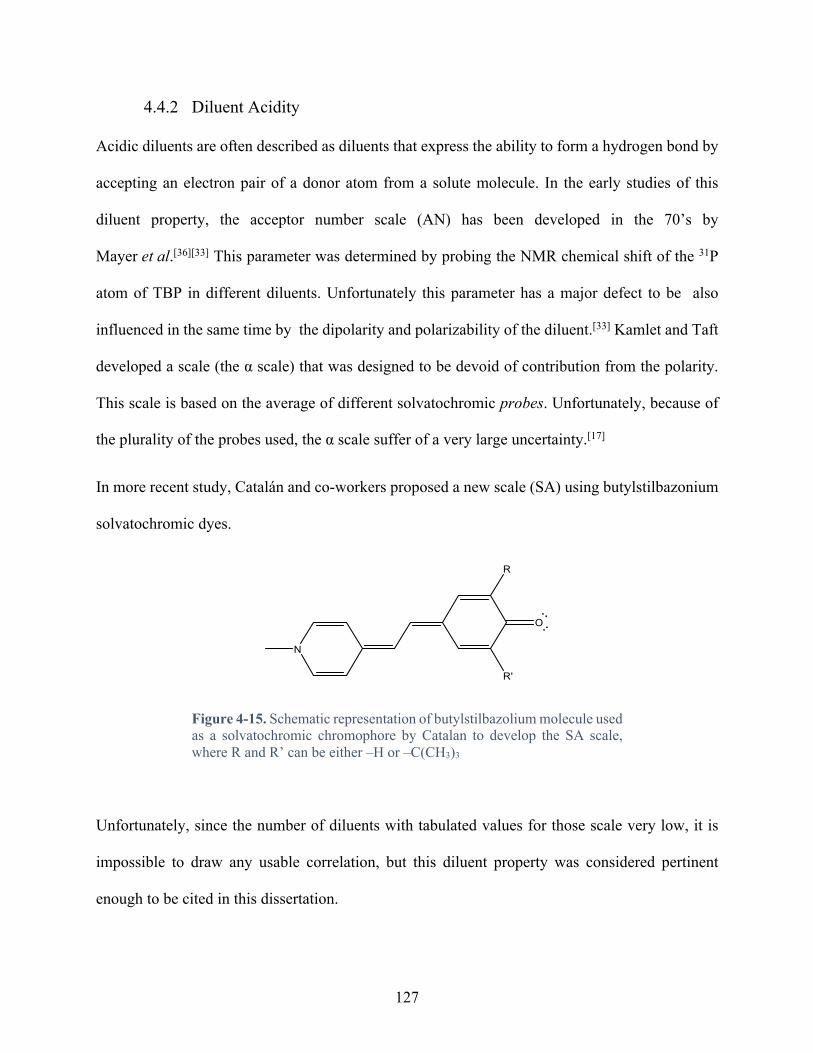
127
4.4.2 Diluent Acidity
Acidic diluents are often described as diluents that express the ability to form a hydrogen bond by
accepting an electron pair of a donor atom from a solute molecule. In the early studies of this
diluent property, the acceptor number scale (AN) has been developed in the 70’s by
Mayer et al.[36][33] This parameter was determined by probing the NMR chemical shift of the 31P
atom of TBP in different diluents. Unfortunately this parameter has a major defect to be also
influenced in the same time by the dipolarity and polarizability of the diluent.[33] Kamlet and Taft
developed a scale (the α scale) that was designed to be devoid of contribution from the polarity.
This scale is based on the average of different solvatochromic probes. Unfortunately, because of
the plurality of the probes used, the α scale suffer of a very large uncertainty.[17]
In more recent study, Catalán and co-workers proposed a new scale (SA) using butylstilbazonium
solvatochromic dyes.
Figure 4-15. Schematic representation of butylstilbazolium molecule used as a solvatochromic chromophore by Catalan to develop the SA scale, where R and R’ can be either –H or –C(CH3)3
Unfortunately, since the number of diluents with tabulated values for those scale very low, it is
impossible to draw any usable correlation, but this diluent property was considered pertinent
enough to be cited in this dissertation.

128
4.5 Discussion on the Diluent Effect
4.5.1 Rationalization of the diluent properties on the equilibria
4.5.1.1 Associative properties
The extraction of a trivalent f-element by HEH[EHP] equilibrium has been demonstrated to be
expressed by the following equilibrium[37]:
𝑀UH +3 + 𝑛2 (𝐻𝐴)0:::::::: ⇌ 𝑀𝐴U(𝐻𝐴)n:::::::::::::: + 3𝐻H (4.21)
with the equilibrium constant for this reaction is written as[37][38]:
𝐾#$∗ = Å𝑀𝐴U(𝐻𝐴)n::::::::::::::Æ[𝐻H]U
[𝑀UH][(𝐻𝐴)0::::::::](UHn)
0ä (4.22)
However, a more precise description of the solvent extraction can be formally written to occur in
the following steps[38][25][6]:
2(HA)::::::: ⇌ (HA)0:::::::: (𝐾0) (4.23)
HA ⇌ HA:::: (𝐾�) (4.24)
HA ⇌ HH +A? (𝐾k) (4.25)
MUH + 3A? ⇌ MAU (𝛽k) (4.26)

129
MAU ⇌ MAU:::::: (𝐾1) (4.27)
MAU:::::: + n(HA)::::::: ⇌ MAU(HA)}:::::::::::::: (𝛽g) (4.28)
The equilibrium constant of this reaction is connected with those of the different steps as[38]:
𝐾#$g = 1
𝐾0..Ä∙ 𝐾�U ∙ 𝐾kU ∙ 𝛽k ∙ 𝐾1 ∙ 𝛽g (4.29)
Here the contribution of the dehydration is assumed to be the same in all system, therefore is not
taken into account here. However, as mentioned previously, the diluent is capable of influencing
markedly the extraction processes. Due to the hydroxyl group and the phosphoryl groups in the
HEH[EHP] extractant, the following equilibria could be considered for a Lewis acid/base adduct
formation:[38][25]
HA:::: +S: ⇌ HA ∙ S:::::::: (𝐾�) (4.30)
MAU(HA)}:::::::::::::: + xS: ⇌ MAU ∙ (HA)} ∙ Så::::::::::::::::::::: (𝛽$) (4.31)
The Figure 4-16 represent the electrostatic potential mapping of the monomer and dimer molecule
of HEH[EHP], HA and (HA)2 obtained using Density Function Theory calculation on Gaussian.
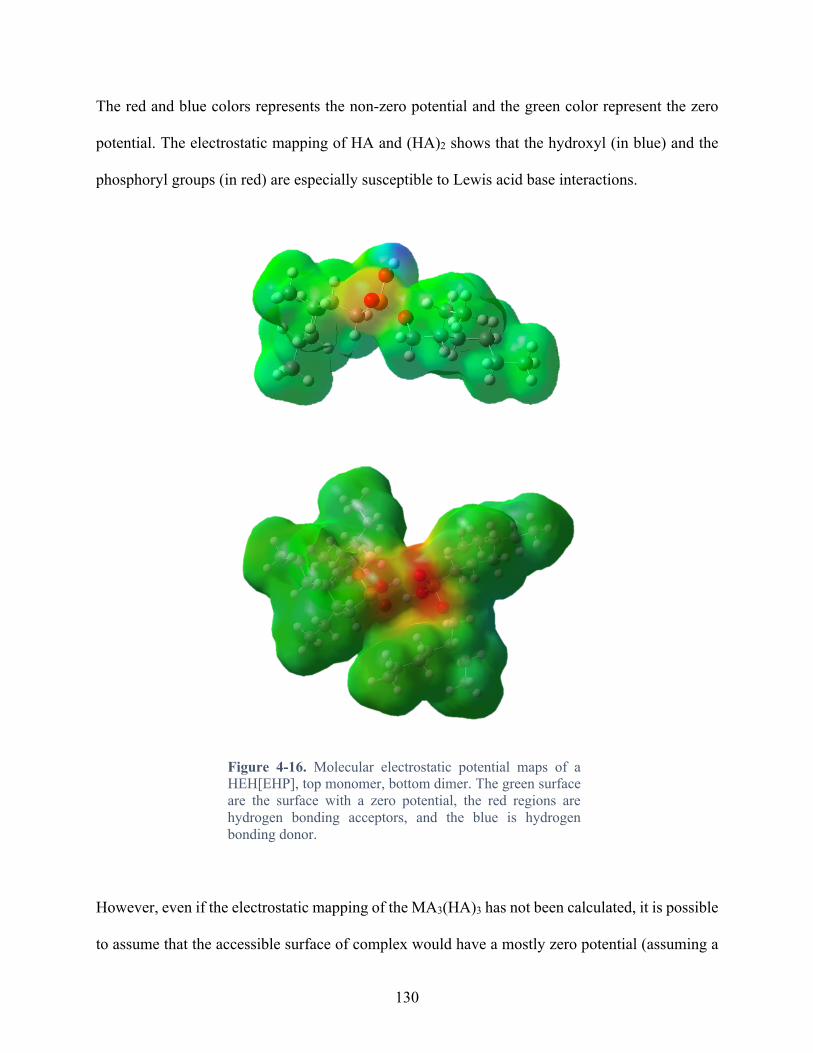
130
The red and blue colors represents the non-zero potential and the green color represent the zero
potential. The electrostatic mapping of HA and (HA)2 shows that the hydroxyl (in blue) and the
phosphoryl groups (in red) are especially susceptible to Lewis acid base interactions.
Figure 4-16. Molecular electrostatic potential maps of a HEH[EHP], top monomer, bottom dimer. The green surface are the surface with a zero potential, the red regions are hydrogen bonding acceptors, and the blue is hydrogen bonding donor.
However, even if the electrostatic mapping of the MA3(HA)3 has not been calculated, it is possible
to assume that the accessible surface of complex would have a mostly zero potential (assuming a

131
negligible ligand exchange dynamic). This potential will then assume that βs is negligible in
comparison of the other stability constants. Even if the Ks is not known but assumed higher than
zero, the equilibrium constants K2, Kd, and βo are apparent constants (henceforth 𝐾0∗, 𝐾�∗ and 𝛽g∗);
their relation to the actual constant can be expressed as follow[25]:
𝐾0∗ = 𝐾0(𝐾�[𝑆̅] + 1)?0 (4.32)
𝐾�∗ = 𝐾�(𝐾�[𝑆̅] + 1) (4.33)
𝛽g∗ = 𝛽g(𝐾�[𝑆̅] + 1)?n (4.34)
Then, using the actual constant, the 𝐾#$∗ can be expressed as follow:
𝐾#$∗ = 1
𝐾0∗..Ä ∙ 𝐾�
∗U ∙ 𝐾kU ∙ 𝛽k ∙ 𝐾1 ∙ 𝛽g∗ (4.35)
and summarized as the following[25]:
𝐾#$∗ = 𝐾#$g (𝐾�[𝑆̅] + 1)n (4.36)
Then when adapted to the Gibbs energy of extraction the following equation can be obtained:
∆𝐺#$∗ = −𝑅𝑇 ∙ ln𝐾#$g − 𝑛 ∙ 𝑅𝑇 ∙ ln(𝐾�[𝑆̅] + 1) (4.37)
Then when derived on the Ks the following equation is obtained:

132
𝑑𝑑𝐾�
∆𝐺#$∗ = −𝑛𝑅𝑇[𝑆̅](𝐾�[𝑆̅] + 1)
(4.38)
From this equation, the variation of the Gibbs energy should decrease when Ks is larger than zero,
which is consistent with the observations made with the associative properties scales – Section 4.4,
Figure 4-10, Figure 4-12, and Figure 4-14. Also, according to Kolarik[39] and Marcus[6], the
product K2Kd should be approximatively constant for a given acidic organophosphorus extractant,
regardless of the diluent used. This approximation allows a semi quantitative evaluation of the
results. The higher Ks is, the lower the 𝐾0∗is, and the higher 𝐾�∗ is, and consequently the lower the
free ligand “in” the aqueous phase. Doing so there should be a decrease in the extraction of the
metal chelate.[25] The word “in” has been placed within quotation marks, because it has been
demonstrated that HEH[EHP] is not soluble in the aqueous phase, but adsorbed at the interphase,
with the >P(=O)(O)H group in the aqueous phase and the alkyl chains in the organic phase.[39][40]
However regardless of this subtlety, the description of the impact of the Ks in the extraction stays
the same, since the diluents used are not appreciably water soluble. This semi quantitative
description of the impact of Ks on the efficiency of extraction is also in agreement with the
experimental values obtained compared to the basicity scales.
4.5.1.2 Cohesive properties
A closer look to the stability constants and at the mechanism involving solubility parameters
(assuming that the swelling of a solute is negligible between both sides of a monophasic equation),
it is possible to assume that the energy of cavitation for a monophasic equation is essentially zero
in comparison to a biphasic system. Then, it is possible to assume that the percent swelling of the
HEH[EHP] extractant without a proton or metal cation (so an EH[EHP]- anion) is again close to
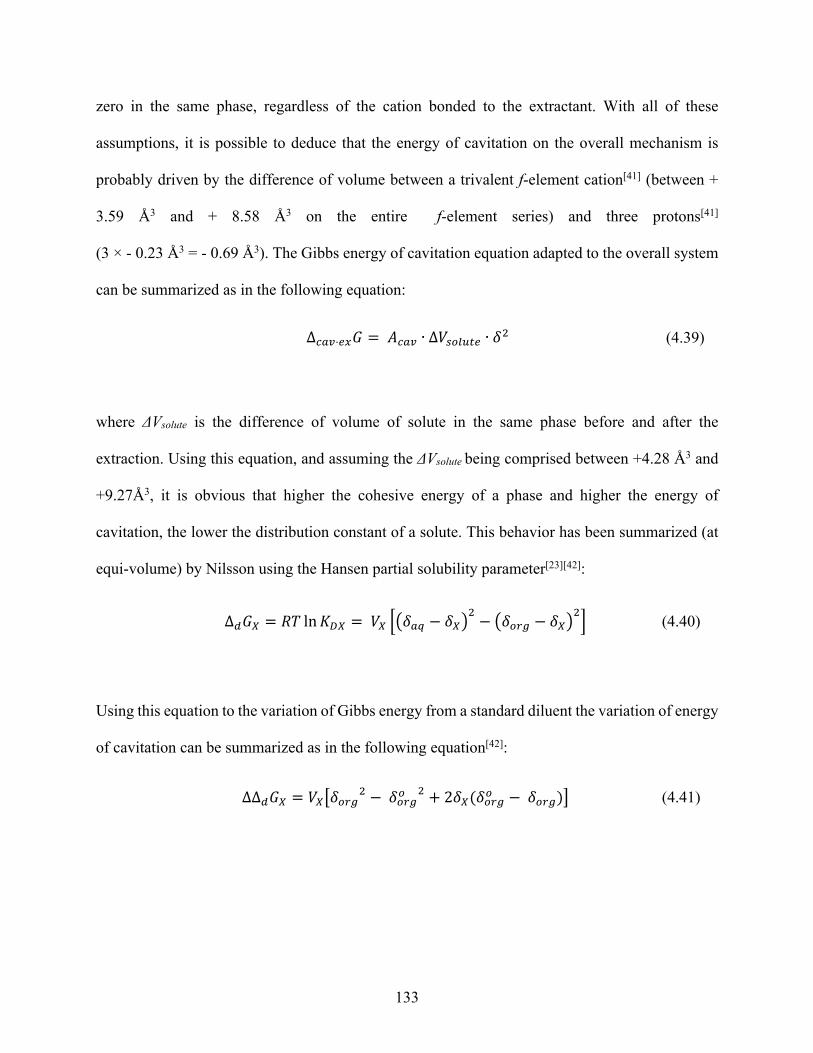
133
zero in the same phase, regardless of the cation bonded to the extractant. With all of these
assumptions, it is possible to deduce that the energy of cavitation on the overall mechanism is
probably driven by the difference of volume between a trivalent f-element cation[41] (between +
3.59 Å3 and + 8.58 Å3 on the entire f-element series) and three protons[41]
(3 × - 0.23 Å3 = - 0.69 Å3). The Gibbs energy of cavitation equation adapted to the overall system
can be summarized as in the following equation:
∆ÔkÕ·#$𝐺 = 𝐴ÔkÕ ∙ ∆𝑉�g�p�# ∙ 𝛿0 (4.39)
where ΔVsolute is the difference of volume of solute in the same phase before and after the
extraction. Using this equation, and assuming the ΔVsolute being comprised between +4.28 Å3 and
+9.27Å3, it is obvious that higher the cohesive energy of a phase and higher the energy of
cavitation, the lower the distribution constant of a solute. This behavior has been summarized (at
equi-volume) by Nilsson using the Hansen partial solubility parameter[23][42]:
∆�𝐺e = 𝑅𝑇 ln𝐾1e = 𝑉e æÇ𝛿kl − 𝛿eÈ0 − Ç𝛿ghi − 𝛿eÈ
0ç (4.40)
Using this equation to the variation of Gibbs energy from a standard diluent the variation of energy
of cavitation can be summarized as in the following equation[42]:
∆∆�𝐺e = 𝑉eÅ𝛿ghi0 −𝛿ghig 0 + 2𝛿e(𝛿ghig −𝛿ghi)Æ (4.41)

134
Then when derived on the solubility parameter of the organic phase:
𝑑
𝑑𝛿ghi∆∆�𝐺e = 2𝑉e(𝛿ghi − 𝛿e) (4.42)
Assuming then that δX is always smaller than δorg (due to the Coulombic repulsion of a charged
particle) it is safe to assume that this derivative is always positive. This behavior seems to be in
accord with the experimental observations in the variation of ΔΔGex as a function of the cohesive
parameters (Hildebrand and Hansen solubility parameters and the polarizability parameters).
4.5.2 Assumptions made and Future Work.
4.5.2.1 Assumptions
For the objective of this chapter, a couple of assumptions had to be made to be able to use the
different scales from literature applied to this research. One major assumption was that even if the
scales values used in this chapter were determined as a pure diluent value, the scale would still be
valid in the presence of solute. However this assumption is most likely to be wrong since most of
the non-inert diluents can extract water by themselves; HEH[EHP] can also extract water. Doing
so the fraction of water is most likely to change the bulk properties of the solvent creating extra
interferences with the model of the system.4 The same assumption has been made with the solute
itself. In some cases (especially the non-inert diluent) the volume fraction of HEH[EHP] was
comparable to the total volume of the organic phase, doing so it also interferes with the bulk diluent
scale value used for this analysis (at the larger concentrations, the volume fraction of HEH[EHP]
was about 30%).
4 Personal correspondence with professor Christian Ekberg from the Chalmers University of Technology (Sweden)
135
Furthermore, one most important concern that comes from those scales is to know if the values of
compound determined in bulk, when acting as a diluent, are the same when they are in dilute
solution, acting as a solute. This question is especially important when HBA and HBS scales of
diluent are compared with association constant similar to the Ks used earlier and used to explain
reactions.[33]
Another concern from those scales is that it has been demonstrated that significant systematic
differences between similar values on the same scale have been observed as a function of the probe
used on a same chromophore (meaning P=O, C=CO, S=O, N=O or –O–).[43] In an attempt to
accommodate their scales Kamlet and Taft proposed a new “covalency” parameter, ξ, to take in
account this probe dependency problem.[44] Since this parameter was not determined for enough
diluents, its influence on the results observed in this study was not investigated.
In her dissertation, Krahn studied the influence of the diluent on the ligand exchange dynamics on
Ln-HEH[EHP] metal chelate.[45] This study demonstrated that the characteristic associative or
dissociative nature of the ligand exchange dynamic was dependent on the metal center[46], but also
extremely dependent of the diluent used. This effect has not been taken into account, and is likely
have an influence on the system, especially in the case of an inner-sphere interaction (dissociative
exchange)[47], which could reveal for a short time, a polar area in the core of the metal available
for electron donor diluent (such as MIBK).
4.5.2.2 Future Work
As stated in the previous section, one of the main problems of these empirical and pseudo empirical
scales are the fact that they are based on a pure medium diluent property, and is more likely to
differ from the medium properties in a solvent extraction system (wet solvents, presence of solute
136
in relatively high volume fraction, etc.). Some of those parameters could be simply redefined as
described below
4.1.1.1.1 Characterization of the solvent polarizability (n)
As described in the section 4.2.2, the Lorenz-Lorenz function can be used to describe a medium
polarizability. This function is based on the standard refractive index of the medium. The
wavelength used for the determination of this standard refractive index is the one obtained at the
yellow doublet of the sodium D line, at precisely 589 nm (transition from the orbit 3p3/2 to the
3s1/2).[20] In the simplest matter, this 589 nm ray is sent to an air/solvent interface and by measuring
the entry angle, θair (in air) at the interface and the exit angle, θsolvent, at the interface (solvent). The
refractive index of the solvent can be determined (goniometric method) using the Snell-Descartes
equation (4.43):
𝑛kvh ∙ sin(𝜃kvh) = 𝑛�g�Õ#n� ∙ sin(𝜃�g�Õ#n�) (4.43)
Other and more precise methods exist, especially the ones using interferometry method.[48]
4.5.2.2.1 Characterization of the of the Solvent Polarity (εr)
As described in the section 4.2.2, the Debye function can be used to describe a medium’s polarity.
This function is based on the relative permittivity of the medium. This parameter can be measured
using a static electric field. Measuring the capacitance (Ck) of a capacitor with a known medium
between its two plates (with a known relative permittivity εk). Then the medium is replaced by the
solvent and the capacity is measured (C). Using the flowing equation the relative permittivity of
the solvent can be calculated.
137
𝜀𝑟 = 𝐶𝐶𝑘𝜀𝑘 (4.44)
4.5.2.2.2 Interactive Scale Based on HEH[EHP]
Based on the work of Mayer et al[36], Elias et al[49], and Kamlet and Taft[50] it could be possible to
create interactive scale based on the interaction in HEH[EHP] with its diluent (especially
interesting since HEH[EHP] is an electron donor through the P=O group and acceptor through the
P-O-H group). To do so this scale can be based the limiting value of the NMR chemical shift δP of
the 31P atom and the chemical shift δH of the acidic proton at infinite dilution. Then this value
would be relativized to a reference value obtained from a reference diluent (both corrected for
diamagnetic susceptibility of the solvent). It has already been demonstrated that the 31P shift
changes as a function of the diluent used (n-octane vs. toluene) but also in the presence of alcoholic
phase modifier (1-octanol).[51] Knowing that it is possible to predict a feasibility for the
development of this scale. Also, if a tri-alkyl phosphine oxide is added to the system, it could be
possible to differentiate the basic interaction from acidic ones (interactions with P=O vs.
interactions with P-O-H).
138
4.6 Conclusion
In this chapter, coefficient of extraction of europium by HEH[EHP] in various diluents have been
compared to multiple diluent properties scales. Based on the results it seems that the cohesive
properties of a diluent (described by the solubility parameters) and the dispersive properties of a
diluent work against the extraction process by increasing the Gibbs energy of extraction
mechanism in the organic phase. This mechanism has been attributed to the change in cavitation
and dispersion energy between (3+n)/2(HA)2 dimers and the MA3(HA)n metal chelate. Based on
the observation made in the interactive forces dependency, it seems that the higher the electron
donor and or acceptor capability of a diluent, higher is the interaction between the diluent and the
free monomer in solution, creating a stronger Lewis acid/base abduct. Doing so, the concentration
of free monomer available (not involved in a diluent-solute or solute-solute adduct) for the
exaction is reduced and therefore a decrease in the extraction. Understanding that, it seems that the
diluent effect on solvent extraction follow the general schematic behavior described in the
solvation process of a solute in a liquid.

139
4.7 References
(1) Ben‐Naim, A.; Marcus, Y. Solvation Thermodynamics of Nonionic Solutes. J. Chem. Phys. 1984, 81 (4), 2016–2027.
(2) Marcus, Y. Principles of Solubility and Solution, In Solvent Extraction Principles and Practice, Revised and Expanded; Rydberg, J., Cox, M., Musikas, C., Choppin, G. R., Eds.; CRC Press: NY, 2004.
(3) Marcus, Y. Chapter 1 — Introduction. In The Properties of Solvent; Marcus, Y., Ed.; Wiley: west sussex, 1988; pp 1–33.
(4) Hildebrand, J. H.; Scott, R. L. The Solubility of Nonelectrolytes, third.; Reinhold Publishing: New York, 1964.
(5) Marcus, Y. Introduction to Liquid State Chemistry; John Wiley & son: London, 1977.
(6) Marcus, Y.; Kertes, A. S. Ion Exchange and Solvent Extraction of Metal Complexes, first.; Wiley-Interscience: London, 1969.
(7) Marcus, Y. Diluent Effects in Solvent Extraction. Solvent Extr. Ion Exch. 1989, 7 (4), 567–575.
(8) Shmidt, V. T.; Mezhov, E. A.; Novikova, S. S. Linera Relation of Free Energies as a Device for the Generalization and Analysis of Data on Extraction. Radiokhimiya 1967, 9, 657.
(9) Marcus, Y. The Properties of Solvents, 1st ed.; John Wiley: west sussex, 1988.
(10) Dyrssen, D.; Hay, L. D. The Distribution and Dimerization of Di-n-Butyl Phosphate (DBP) in Different Solvents. Acta Chemica Scandinavica. 1960, pp 1091–1099.
(11) Shmidt, V. S. Linear Free Energy Relations as a Means of Generalising and Analysing Extraction Data Calculation of Extraction Constants — the First Stage in the “Condensation” and Analysis. Russ. Chem. Rev. 1978, 47, 929.
(12) Buncel, E.; Stairs, R. A. Chemometrics: Solvent Effects and Statistics. In Solvent Effects in Chemistry; John Wiley & son: Hoboken (NJ), 2016; pp 89–111.
(13) Catalán, J.; Hopf, H. Empirical Treatment of the Inductive and Dispersive Components of Solute-Solvent Interactions: The Solvent Polarizability (SP) Scale. European J. Org. Chem. 2004, No. 22, 4694–4702.
(14) Marcus, Y. Chapter 2 — Solvent Effects. In The Properties of Solvent; Marcus, Y., Ed.; Wiley: west sussex, 1988; pp 34–66.
(15) Buncel, E.; Stairs, R. A. Unreactive Solvents. In Solvent Effects in Chemistry; John Wiley & son: Hoboken (NJ), 2016; pp 23–56.
140
(16) Epley, D.; Drago, R. S. Calorimetric Studies on Some Hydrogen-Bonded Adducts. J. Am. Chem. Soc. 1967, 89 (23), 5770–5773.
(17) Kamlet, M. J.; Abboud, J.-L. M.; Abraham, M. H.; Taft, R. W. Linear Solvation Energy Relationships. 23. A Comprehensive Collection of the Solvatochromic Parameters,. J. Org. Chem. 1983, 48 (13), 2877–2887.
(18) Kamlet, M. J.; Taft, R. W. Linear Solvation Energy Relationships. Local Empirical Rules -- or Fundamental Laws of Chemistry? A Reply to the Chemometricians. Acta Chem. Scand. 1985, 39b, 611–628.
(19) Reichardt, C. Empirical Parameters of Solvent Polarity. In Solvents and Solvent Effects in Organic Chemistry; WILEY-VCH Verlag GmbH & Co.: Weinheim, 2003; pp 389–467.
(20) Lide, D. R. CRC Handbook of Chemistry and Physics; David R. Lide, Ed.; CRC Press: Boca Raton, 2005.
(21) Linstrom, P. J. NIST Standard Reference Database Number 69 https://webbook.nist.gov/chemistry/.
(22) Allard, B. The Coordination of Tetravalent Actinide Chelate Complexes with [Beta]-Diketones, Chalmers university of technology, 1975.
(23) Nilsson, M. Influence of the Organic Phase Composition on the Extraction of Trivalent Actinides, Chalmer universitry of technology, 2000.
(24) Rydberg, J. Solvent Extraction Principles and Practice, Revised and Expanded, 2th ed.; Rydberg, J., Cox, M., Musikas, C., Choppin, G., Eds.; CRC Press, 2004.
(25) Kolarik, Z. The Effect of Diluent on the Solvent Extraction of Tb(III) and Eu(III) by Di-n-Octyl Phosphoric Acid. In Solvent Extraction Chemistry; Dyrssen, D., Liljenzin, J.-O., Rydberg, J., Eds.; John Wiley: Amsterdam, 1967; pp 250–255.
(26) Narbutt, J.; Czerwinski, M. Computational Chemistry in Modeling Solvent Extraction of Metal Ions. In Solvent Extraction Principles and Practice, Revised and Expanded; Rydberg, J., Cox, M., Musikas, C., Choppin, G. R., Eds.; CRC Press: NY, 2004; pp 679–714.
(27) Catalán, J. Toward a Generalized Treatment of the Solvent Effect Based on Four Empirical Scales: Dipolarity (SdP, a New Scale), Polarizability (SP), Acidity (SA), and Basicity (SB) of the Medium. J. Phys. Chem. B 2009, 113 (17), 5951–5960.
(28) Andrew, L. J.; Keefer, R. M. Molecular Complexes in Organic Chemistry, first.; Holden-Day, Inc: San Fransisco, 1964.
(29) Rydberg, J.; Choppin, G. R.; Musikas, C.; Sekine, T. Solvent Extraction Equilibria. In Solvent Extraction Principles and Practice, Revised and Expanded; Rydberg, J., Cox, M., Musikas, C., Choppin, G. R., Eds.; CRC Press: NY, 2012; pp 109–201.

141
(30) Hansen, C. M. Hansen Solubility Parameters A User’s Handbook, second Edi.; Hansen, C. M., Ed.; CRC Press: Boca Raton, 2007.
(31) Reichardt, C. Solvatochromic Dyes as Solvent Polarity Indicators. Chem. Rev. 1994, 94, 2319–2358.
(32) Christian, R. Solvent Effects on the Absorption Spectra of Organic Compounds. In Solvents and Solvent Effects in Organic Chemistry; Christian, R., Ed.; WILEY-VCH Verlag GmbH & Co. KGaA: Weinheim, 2003; pp 329–388.
(33) Marcus, Y. Chapter 4 - Chemical Properties of Solvents. In The Properties of Solvent; Marcus, Y., Ed.; Wiley: west sussex, 1988; pp 131–203.
(34) Gutman, V.; Wychera, E. Coordination Reactions in Non Aqueous Solutions - The Role of the Donor Strength. Inorg. Nucl. Chem. Lett. 1966, 2 (9), 257–260.
(35) Catalán, J.; Díaz, C.; López, V.; Pérez, P.; De Paz, J. L. G.; Rodríguez, J. G. A Generalized Solvent Basicity Scale: The Solvatochromism of 5-Nitroindoline and Its Homomorph 1-Methyl-5-Nitroindoline. Liebigs Ann. 1996, No. 11, 1785–1794.
(36) Mayer, U.; Gutmann, V.; Gerger, W. The Acceptor Number - A Quantitative Empirical Parameter for the Electrophilic Properties of Solvents. Monatshefte für Chemie 1975, 106 (6), 1235–1257.
(37) Lecrivain-Martin, T.; Kimberlin, A.; Dodd, D. E.; Miller, S.; Hobbs, I.; Heller, F.; Lapka, J.; Huber, M.; Nash, K. L. The Effect of Organic Diluent on the Extraction of Eu(III) by HEH[EHP]. Solvent Extr. Ion Exch. special ed, 1–23.
(38) Stary, J. The Solvent Extraction of Metal Chelates, 1st ed.; Irving, H., Ed.; Pergamon, 1964.
(39) Kolarik, Z. Review : Dissociation , Self-Association , and Partition of Monoacidic Organophosphorus Extractants. 2010, No. Iii, 707–763.
(40) Kusaka, R.; Watanabe, M. The Structure of a Lanthanide Complex at an Extractant/Water Interface Studied Using Heterodyne-Detected Vibrational Sum Frequency Generation. Phys. Chem. Chem. Phys. 2018, 20 (4), 2809–2813.
(41) Shannon, R. D. Revised Effective Ionic Radii and Systematic Studies of Interatomic Distances in Halides and Chalcogenides. Acta Crystallogr. Sect. A 1976, 32 (5), 751–767.
(42) Baes Jr., C. F.; Moyer, B. A. Solubility Parameters and the Distribution of Ions to Nonaqueous Solvents. J. Phys. Chem. B 1997, 101 (33), 6566–6574.
(43) Nicolet, P.; Laurence, C. Polarity and Basicity of Solvents. Part 1. A Thermosolvatochromic Comparison Method. J. Chem. Soc. Perkin Trans. 2 1986, No. 7, 1071–1079.

142
(44) Kamlet, M. J.; Gal, J. F.; Maria, P. C.; Taft, R. W. Linear Solvation Energy Relationships. Part 32. A Co-Ordinate Covalency Parameter, Ksi , Which, in Combination with the Hydrogen Bond Acceptor Basicity Parameter, Beta, Permits Correlation of Many Properties of Neutral Oxygen and Nitrogen Bases (Including. J. Chem. Soc. Perkin Trans. II 1985, 1583–1589.
(45) Krahn, E. Probing Molecular Interactions in the Organic Phase of TALSPEAK-like Systems Using NMR Spectroscopy, Ph.D. dissertation, Washington State University, 2016.
(46) Krahn, E.; Marie, C.; Nash, K. L. Probing Organic Phase Ligand Exchange Kinetics of 4f/5f Solvent Extraction Systems with NMR Spectroscopy. Coord. Chem. Rev. 2016, 316, 21–35.
(47) Roberto Danesi, P. Solvent Extraction Kinetics. In Solvent Extraction Principles and Practice, Revised and Expanded; Rydberg, J., Cox, M., Musikas, C., Choppin, G. R., Eds.; CRC Press: NY, 2004; pp 203–252.
(48) Rocha, A. C. P.; Silva, J. R.; Lima, S. M.; Nunes, L. A. O.; Andrade, L. H. C. Measurements of Refractive Indices and Thermo-Optical Coefficients Using a White-Light Michelson Interferometer. Appl. Opt. 2016, 55 (24), 6639.
(49) Elias, H.; Dreher, M.; Neitzel, S.; Volz, H. Characterization of Alcohol Solvents by the Empirical Polarity Parameters AN, Z, and ET(30). Zeitschrift fur Naturforsch. - Sect. B J. Chem. Sci. 1982, 37 (6), 684–687.
(50) Kamlet, M. J.; Abboud, J. L. M.; Abraham, M. H.; Taft, R. W. Linear Solvation Energy Relationships. 23. A Comprehensive Collection of the Solvatochromic Parameters, π, α, and β, and Some Methods for Simplifying the Generalized Solvatochromic Equation. J. Org. Chem. 1983, 48 (17), 2877–2887.
(51) Martin, T. Influence of 1-Octanol as a Phase Modifier on HEH[EHP] Extraction and Aggregation, Universite de Montpellier 2, 2014.
143
CHAPTER FIVE
5 THERMOMETRIC CHARACTERIZATIONS OF THE EFFECT OF THE DILUENT ON THE EXTRACTION
OF f-ELEMENTS BY HDEHP
Preface.
Of particular interest in this investigation is to assess the role of the diluent in controlling the
progress of the extraction of trivalent lanthanide and actinide metal ions from dilute nitric acid
media into solutions containing cation exchanging organophosphorus extractants. As the research
results described in the previous chapters have sought to develop insight into the contribution of
the diluent to the overall driving force of such reactions (Gibbs energy, DG), it is the purpose of
this chapter to assess the relative importance of the thermal heat change (Enthalpy, DH) and
disorder (entropy, TDS) on these same reactions. To broaden the scope of the investigation, the
extractant studied herein was bis(2-ethyl(hexyl)) phosphoric acid, HDEHP; the van’t Hoff method
was selected to enable the thermometric analysis.
Introduction
Thermodynamics is the study of thermal, electrical, chemical, and mechanical forms of energy.
The study of thermodynamics crosses many disciplines, including physics, engineering, chemistry
and even biology. Of the various branches of thermodynamics, the most important to chemistry is
the study of the change in the energetic state of the system that occurs during a chemical reaction.
Such diagnostic evidence can reveal important details about the features of the chemistry that drive
a reaction of interest. In the context of this research, the methods of thermometric analysis will be
144
applied to gain additional insight into the effect of the diluent on lanthanide and actinide extraction
by acidic organophosphorus reagents.
It is possible to obtain critical parameters when using thermometric methods including van’t Hoff
analysis and calorimetry to study a chemical reaction including the change of entropy (ΔS) and
enthalpy (ΔH) of a reaction. Knowledge of these parameters is vital for increased understanding
of a chemical equilibrium. The focus of this chapter is on characterizing those thermodynamic
parameters (ΔG, ΔH and ΔS) for the solvent extraction of Am3+ and Nd3+ from mildly acidic nitrate
media, by HDEHP using van’t Hoff analysis within selected diluent (n-octane, toluene,
nitrobenzene and chloroform). These diluents are taken as representative of the four principal
subgroups (aliphatic, aromatic, polar, and H-donor).
Principle of Thermochemical Analysis
The first law of thermodynamic states that when a quantity of heat Q is absorbed by a system, at
the exact same time the system performs a quantity of work W against mechanical, gravitational,
electrical or magnetic forces. The increase of energy of the system on passing from an initial state
to a final state is given by the function:
∆𝐸 = 𝑄 −𝑊 =𝐸°vnk� −𝐸vnv�vk� (5.1)
In most thermochemical considerations, the work done on and/or by the system is mechanical and
is given by the expression (when reversible).
145
𝑊 = ë 𝑃𝑑𝑉�ì§í¶ª
�§í§ §¶ª (5.2)
where P and V represent respectively the pressure and the volume of the system. Substituting
equation (5.2) into equation (5.1) and integrating for a constant pressure process yields the
equation:
𝑄 = ∆𝐸 + 𝑃∆𝑉 = (𝐸 + 𝑃𝑉)°vnk� − (𝐸 + 𝑃𝑉)vnv�vk� (5.3)
The function of state represented by E+PV is called the enthalpy or heat content, and is represented
by H. In general, the increase in enthalpy for processes occurring under any conditions of
temperature and pressure are given by the equation:
∆𝐻 = ∆𝐸 + ∆(𝑃𝑉) [5.1]
When a quantity of heat, dQ, is absorbed at the absolute temperature T, under reversible conditions
the increase of entropy is given by the relation:
𝑑𝑆 =𝑑𝑄𝑇 (5.4)
As in the case of energy and enthalpy, entropy is a point function, depending only on the state of
the system and not how the system reaches that state. Substituting equation (5.3) into
equation (5.1) gives the following equation.
146
𝑑𝐸 = 𝑇𝑑𝑆 − 𝑃𝑑𝑉 (5.5)
This equation is valid for process involving mechanical work only. Another function of the state
of a system exists which is of major interest to chemist since it permits the prediction of
equilibrium conditions for physical and chemical changes. It represents the maximum non-
mechanical work theoretically obtainable for processes occurring at constant temperature and
pressure. This function is called the Gibbs energy. The increase in Gibbs energy in going from the
initial to the final state of the system is given by the equation:
∆𝐺 = ∆𝐻 − 𝑇∆𝑆 (5.6)
The quantity TΔS represents the heat that must be absorbed or given up to the surroundings during
the reversible process, in order to maintain isothermal conditions.
The determination of these energetic parameters are essential for solvent extraction chemists.
Choppin demonstrated the importance of the knowledge of those factors, and gave a thoughtful
description of the thermodynamics in a metal chelate formation, ionic medium effect, hydration,
solvation, Lewis acid base interaction, and complexation.[1]
These thermodynamic quantities may be obtained accurately from direct calorimetric
measurement.[2][3][4] However exceptions need to be made for more “challenging” systems.5 For
examples where slow reaction occurs, where low vapor pressures makes the PV parameter non-
constant though the measurements, or where low solubilities or non available material (as is often
5 Personal conversation with Cecilia Eiroa Lledo (WSU): “OMG, I can’t use our calorimeter with Tc, because the concentrations are too low, it is almost insoluble, it is too radioactive and it is too slow! I hate it...”
147
true with radioactive isotopes) require work with trace quantities. To overcome the limitations of
calorimetry, the use of the van’t Hoff analysis is a relatively good method, and has been shown to
give results similar to the calorimetric ones.[3] Analysis by van’t Hoff plot has been used in the
past by solvent extraction chemists.[5][6][7]
The van’t Hoff equation relates the change in the equilibrium constant, Keq, of a chemical reaction,
as a function of the temperature T (K), given the standard enthalpy change ΔH for a given
process.[8] The van’t Hoff equation is expressed under standard conditions as:
𝑑𝑑𝑇 ln𝐾#l =
1𝑅𝑇0 ∆𝐻 (5.7)
where R is the ideal gas constant. This equation is exact at any one temperature. In practice, the
equation is often integrated between two temperatures under the assumption that the reaction
enthalpy ΔH is constant. Since in reality ΔH and ΔS do vary with temperature for most processes,
the integrated equation is only an approximation.[9] To obtain the integrated equation, it is
convenient to first rewrite the van 't Hoff equation as:
𝑑
𝑑 1𝑇ln𝐾#l = −
1𝑅 ∆𝐻 (5.8)
The definite integral between temperatures T1 and T2 is then defined by:
ln𝐾0𝐾.
= −1𝑅 ∆𝐻 î
𝑇. − 𝑇0𝑇.𝑇0
ï (5.9)
148
The equilibrium constant can be measured over a range of temperatures for a reversible reaction.
These measured Keq can plotted on a natural logarithm scale, against the inverse of the absolute
temperature. In the most basic case the data should yield a linear relationship, the equation for
which can be found fitting the linearized form of the van’t Hoff equation:
ln𝐾#l = −∆𝐻𝑅𝑇 +
∆𝑆𝑅 (5.10)
This type of plot/fitting is called the van’t Hoff plot analysis and is widely used to estimate the
enthalpy and entropy of a chemical reaction at equilibrium. For an endothermic reaction, heat is
absorbed, making the net enthalpy change positive. Thus, the slope of a van’t Hoff plot analysis
should be negative. For an exothermic reaction, heat is released, making the net enthalpy change
negative. Thus, the slope of a van’t Hoff plot analysis should be positive. The entropy term (DS)
can be calculated from the y-intercept of the linear plot.
149
Experimental
5.1.1 Method
The analytical method used in this chapter is adapted from the method described for gamma
emitters in chapter 2. However, the method has been adapted for the van’t Hoff analysis and must
be described further.
The following experimental method is used:
1. In a 25 mL disposable glass vial, 9.8 mL of acidic solution without any metal, μ =
0.1 mol·L-1 (Na-H)NO3 and 10 mL of an organic phase containing the extractant.
2. A sample of 200 µL of americium-241/ neodymium-147 radiotracers solution is spiked
into the vials.
3. The vial is capped with a PTFE cap and PTFE tape is used to seal the vial. Then the vial a
placed into three layers of zip-lock bags and lifted with multiple binder clips to assure a
complete immersion of the vial in the water bath.
4. The vial is immersed in a constant temperature water bath, and equilibrated 12 hours for
the first sampling (overnight), and then for at least 2 hours after changing the temperature.
When the sample is left in the bath overnight, the mass of the vial before and after the night
is measured to check for evaporation of the diluent.
5. Before removing the sample, the temperature of the bath is measured with an alcohol
thermometer.
6. The zip lock bags are removed and disposed into radioactive wastes

150
7. A 200 µL sample of the top organic phase is taken and introduced into a gamma counting
tube.
8. A 200 µL sample of the aqueous phase is taken and introduced into another gamma
counting tube.
9. Steps 3 to 8 are then repeated for each increment of temperature.
10. The gamma tubes then are capped and transported to the gamma counter.
Figure 5-1. Left: vial and lifting used for the solvent extraction van’t Hoff analysis, right: temperature controlled water bath.
The water bath used for the van’t Hoff analysis was a VWR scientific heated refrigerated
circulating water bath 1180’s.
The Gamma counter is a Packard Model 5003 Cobra II Auto Gamma Counter with an energy
window between 15 – 2000 keV. Americium-241 is counted between 60-80 keV; neodymium-147
is counted between 85-120 keV.
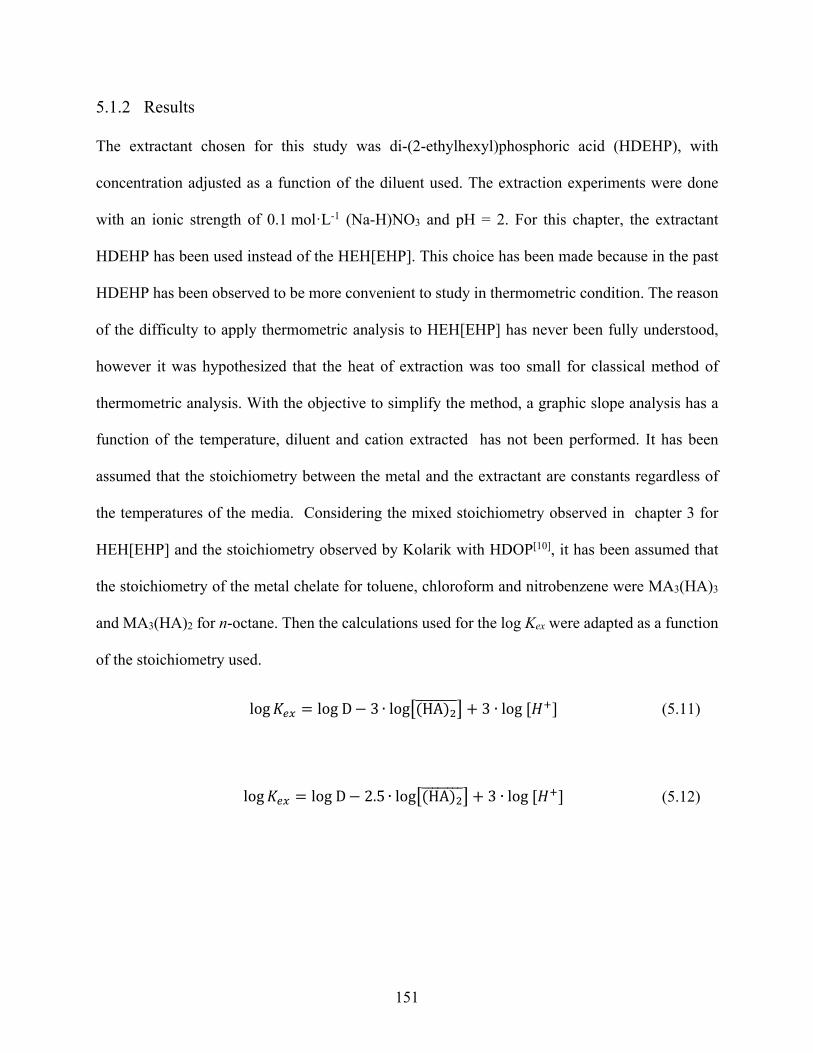
151
5.1.2 Results
The extractant chosen for this study was di-(2-ethylhexyl)phosphoric acid (HDEHP), with
concentration adjusted as a function of the diluent used. The extraction experiments were done
with an ionic strength of 0.1 mol·L-1 (Na-H)NO3 and pH = 2. For this chapter, the extractant
HDEHP has been used instead of the HEH[EHP]. This choice has been made because in the past
HDEHP has been observed to be more convenient to study in thermometric condition. The reason
of the difficulty to apply thermometric analysis to HEH[EHP] has never been fully understood,
however it was hypothesized that the heat of extraction was too small for classical method of
thermometric analysis. With the objective to simplify the method, a graphic slope analysis has a
function of the temperature, diluent and cation extracted has not been performed. It has been
assumed that the stoichiometry between the metal and the extractant are constants regardless of
the temperatures of the media. Considering the mixed stoichiometry observed in chapter 3 for
HEH[EHP] and the stoichiometry observed by Kolarik with HDOP[10], it has been assumed that
the stoichiometry of the metal chelate for toluene, chloroform and nitrobenzene were MA3(HA)3
and MA3(HA)2 for n-octane. Then the calculations used for the log Kex were adapted as a function
of the stoichiometry used.
log𝐾#$ = logD−3 ∙ logÅ(HA)0::::::::Æ + 3 ∙ log[𝐻H] (5.11)
log𝐾#$ = logD−2.5 ∙ logÅ(HA)0::::::::Æ + 3 ∙ log[𝐻H] (5.12)
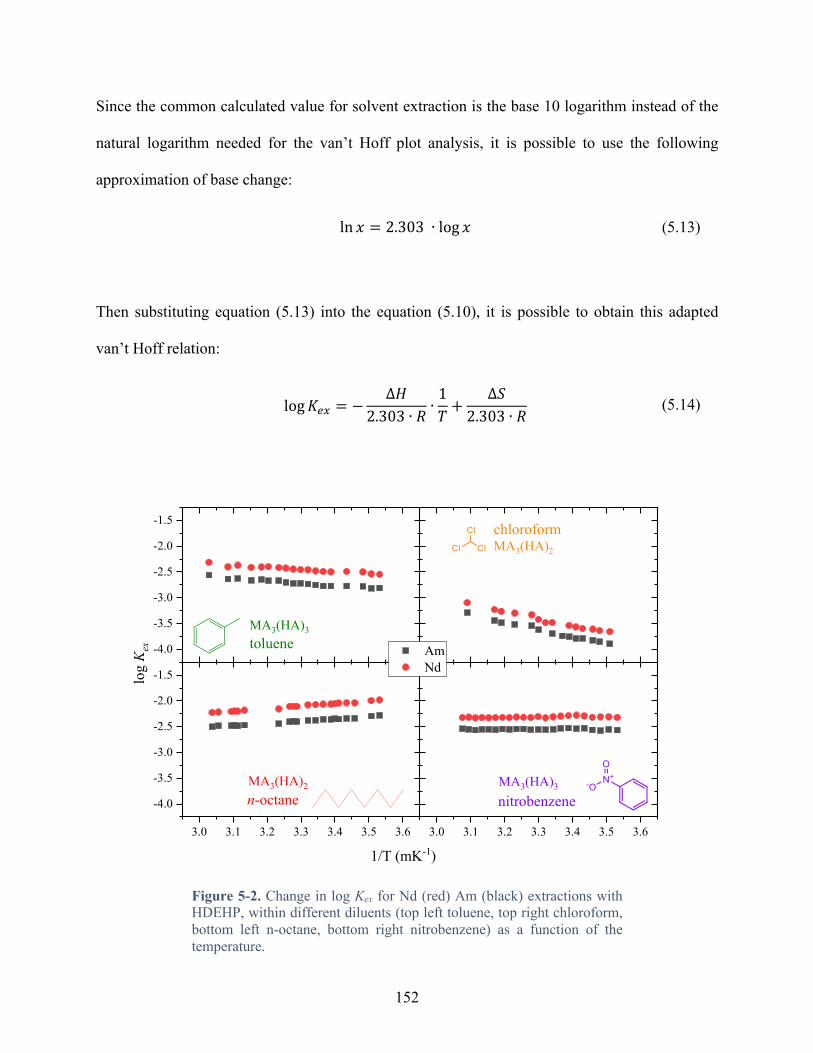
152
Since the common calculated value for solvent extraction is the base 10 logarithm instead of the
natural logarithm needed for the van’t Hoff plot analysis, it is possible to use the following
approximation of base change:
ln 𝑥 = 2.303 ∙ log 𝑥 (5.13)
Then substituting equation (5.13) into the equation (5.10), it is possible to obtain this adapted
van’t Hoff relation:
log𝐾#$ = −∆𝐻
2.303 ∙ 𝑅 ∙1𝑇 +
∆𝑆2.303 ∙ 𝑅 (5.14)
Figure 5-2. Change in log Kex for Nd (red) Am (black) extractions with HDEHP, within different diluents (top left toluene, top right chloroform, bottom left n-octane, bottom right nitrobenzene) as a function of the temperature.
-4.0
-3.5
-3.0
-2.5
-2.0
-1.5
3.0 3.1 3.2 3.3 3.4 3.5 3.6
-4.0
-3.5
-3.0
-2.5
-2.0
-1.5
3.0 3.1 3.2 3.3 3.4 3.5 3.6
MA3(HA)3
MA3(HA)2
MA3(HA)2
tolueneMA3(HA)3
n-octane nitrobenzene
chloroform
Am Nd
log K ex
1/T (mK-1)
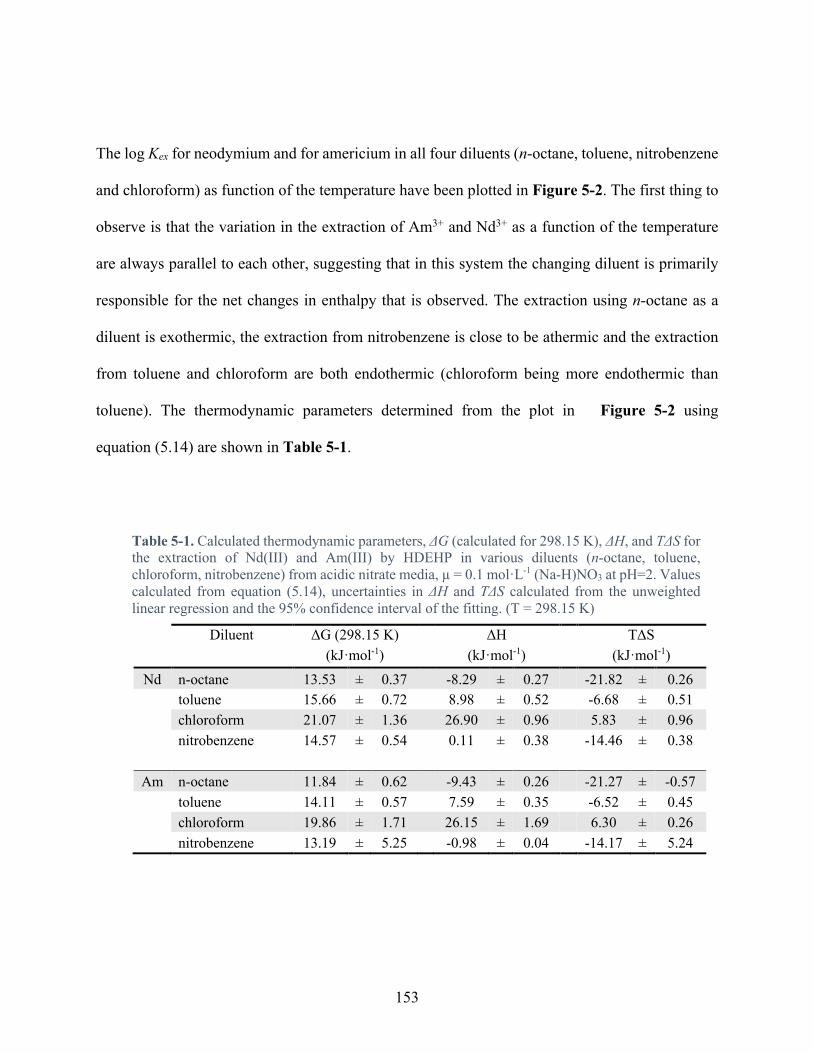
153
The log Kex for neodymium and for americium in all four diluents (n-octane, toluene, nitrobenzene
and chloroform) as function of the temperature have been plotted in Figure 5-2. The first thing to
observe is that the variation in the extraction of Am3+ and Nd3+ as a function of the temperature
are always parallel to each other, suggesting that in this system the changing diluent is primarily
responsible for the net changes in enthalpy that is observed. The extraction using n-octane as a
diluent is exothermic, the extraction from nitrobenzene is close to be athermic and the extraction
from toluene and chloroform are both endothermic (chloroform being more endothermic than
toluene). The thermodynamic parameters determined from the plot in Figure 5-2 using
equation (5.14) are shown in Table 5-1.
Table 5-1. Calculated thermodynamic parameters, ΔG (calculated for 298.15 K), ΔH, and TΔS for the extraction of Nd(III) and Am(III) by HDEHP in various diluents (n-octane, toluene, chloroform, nitrobenzene) from acidic nitrate media, µ = 0.1 mol·L-1 (Na-H)NO3 at pH=2. Values calculated from equation (5.14), uncertainties in ΔH and TΔS calculated from the unweighted linear regression and the 95% confidence interval of the fitting. (T = 298.15 K)
Diluent ΔG (298.15 K)
ΔH
TΔS
(kJ·mol-1)
(kJ·mol-1)
(kJ·mol-1) Nd n-octane 13.53 ± 0.37 -8.29 ± 0.27 -21.82 ± 0.26
toluene 15.66 ± 0.72 8.98 ± 0.52 -6.68 ± 0.51 chloroform 21.07 ± 1.36 26.90 ± 0.96 5.83 ± 0.96 nitrobenzene 14.57 ± 0.54 0.11 ± 0.38 -14.46 ± 0.38
Am n-octane 11.84 ± 0.62 -9.43 ± 0.26 -21.27 ± -0.57 toluene 14.11 ± 0.57 7.59 ± 0.35 -6.52 ± 0.45 chloroform 19.86 ± 1.71 26.15 ± 1.69 6.30 ± 0.26 nitrobenzene 13.19 ± 5.25 -0.98 ± 0.04 -14.17 ± 5.24

154
The Gibbs energy values for both Am and Nd become increasingly unfavorable (more positive)
following the order: n-octane (strongest extraction) < nitrobenzene < toluene < chloroform
(weakest extraction). The measured enthalpy for extraction from n-octane is exothermic, from
toluene endothermic (and of similar magnitude to n-octane), three to four times more unfavorable
for extraction into chloroform, with nitrobenzene characterized by near zero enthalpy. The
extraction entropy term is most unfavorable in n-octane, though the exothermic heat cancels
enough of the unfavorable entropy to give n-octane the least unfavorable Gibbs energy of the four
diluents. The entropy term is only favorable in the chloroform system, which suffers the most
unfavorable enthalpy. The minimal difference seen between Nd and Am extraction
thermodynamics data is as expected.
Discussion
The thermochemistry of a solvent extraction process can be considered as a first approximation to
be a balancing act between the endothermic[1] heat associated with metal ion dehydration[11] in the
aqueous phase and the exothermic formation of lipophilic complexes in the organic phase. The
thermodynamic results of extractions indicate a TΔS < ΔH regardless of the diluent, per consequent
ΔG is positive and log Kex negative. Also, the relation TΔS < ΔH indicates an enthalpy driven
reaction[1], regardless of the diluent used. This conclusion is consistent with the heat diagram
determined by Marcus, where he noted that these processes dominate the enthalpy level diagrams
for every liquid-liquid distribution process.[2] Though entropy can exert a significant influence on
the net free energy of extraction, the final outcome of this enthalpic ‘‘tug of war’’ is often the
driving force of a separation process.[3] The thermodynamic results obtained of n-octane are
consistent extraction of lanthanides from nitrate media by HDEHP in n-dodecane data published
by Zalupski and Nash (measured calorimetrically)[3].
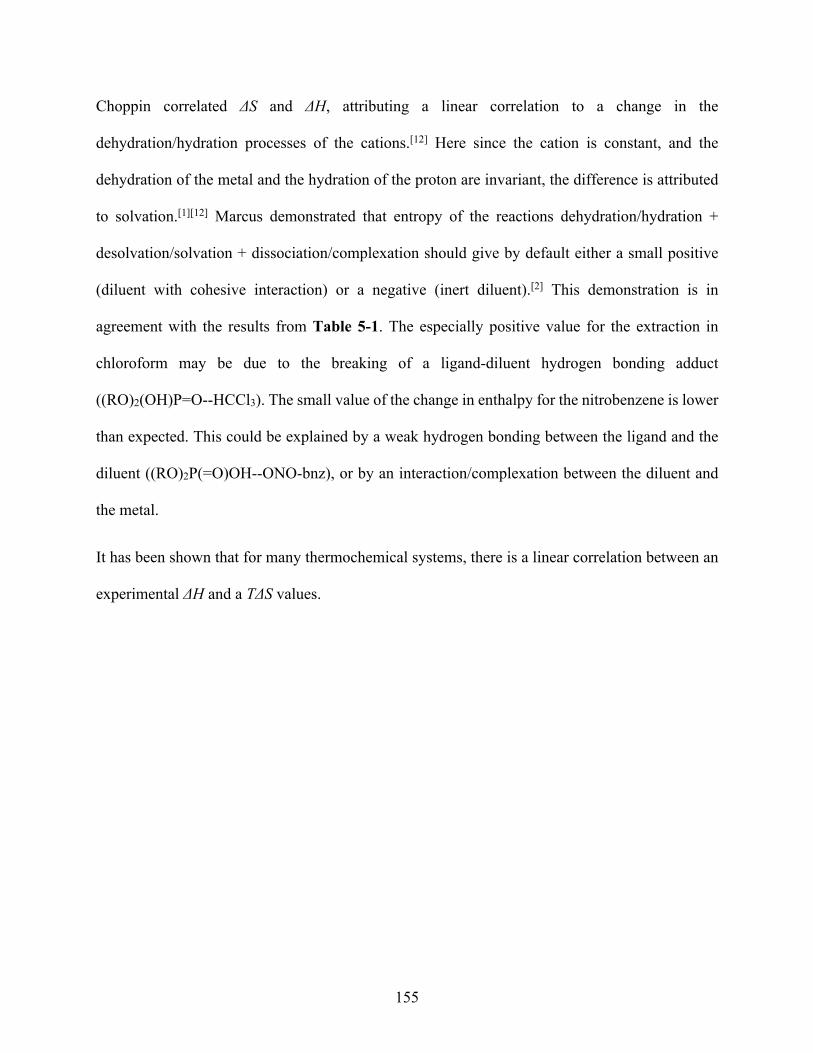
155
Choppin correlated ΔS and ΔH, attributing a linear correlation to a change in the
dehydration/hydration processes of the cations.[12] Here since the cation is constant, and the
dehydration of the metal and the hydration of the proton are invariant, the difference is attributed
to solvation.[1][12] Marcus demonstrated that entropy of the reactions dehydration/hydration +
desolvation/solvation + dissociation/complexation should give by default either a small positive
(diluent with cohesive interaction) or a negative (inert diluent).[2] This demonstration is in
agreement with the results from Table 5-1. The especially positive value for the extraction in
chloroform may be due to the breaking of a ligand-diluent hydrogen bonding adduct
((RO)2(OH)P=O--HCCl3). The small value of the change in enthalpy for the nitrobenzene is lower
than expected. This could be explained by a weak hydrogen bonding between the ligand and the
diluent ((RO)2P(=O)OH--ONO-bnz), or by an interaction/complexation between the diluent and
the metal.
It has been shown that for many thermochemical systems, there is a linear correlation between an
experimental ΔH and a TΔS values.

156
Figure 5-3. Correlation of ΔH and TΔS of extraction of a series of diluent (where T = 298.15°K). Black squares: neodymium data, red spheres: americium data.
Figure 5-1 show the experimental correlation for Nd and Am extraction from Table 5-1. Such
correlation between ΔH and TΔS is called the enthalpy-entropy compensation effect.[13][14] The
general phenomenon of enthalpy-entropy compensation in essence refers to the experimental
observation of a linear scaling between enthalpy (ΔH) and entropy (ΔS) for a set of related
reactions.
∆𝐻 = 𝛼 + 𝛽 ∙ ∆𝑆 (5.15)
where α and β are constants, with β called the “compensation” temperature, as well as a common
isoequilibrium temperature for all van’t Hoff plots.[14] Considerable controversy surrounds the
subject of this phenomenon. Some scientists, such as Choppin or Freed, from puzzlement and
-25 -20 -15 -10 -5 0 5 10-30
-20
-10
0
10
20
30
slope = 1.29 ± 0.06int = 17.3 ± 0.8R2 = 0.996
Nd Am Fitted Y of Nd Fitted Y of Am
DH (k
J·m
ol-1
)
TDS (kJ·mol-1)
slope = 1.27 ± 0.06int = 18.7 ± 0.8R2 = 0.996
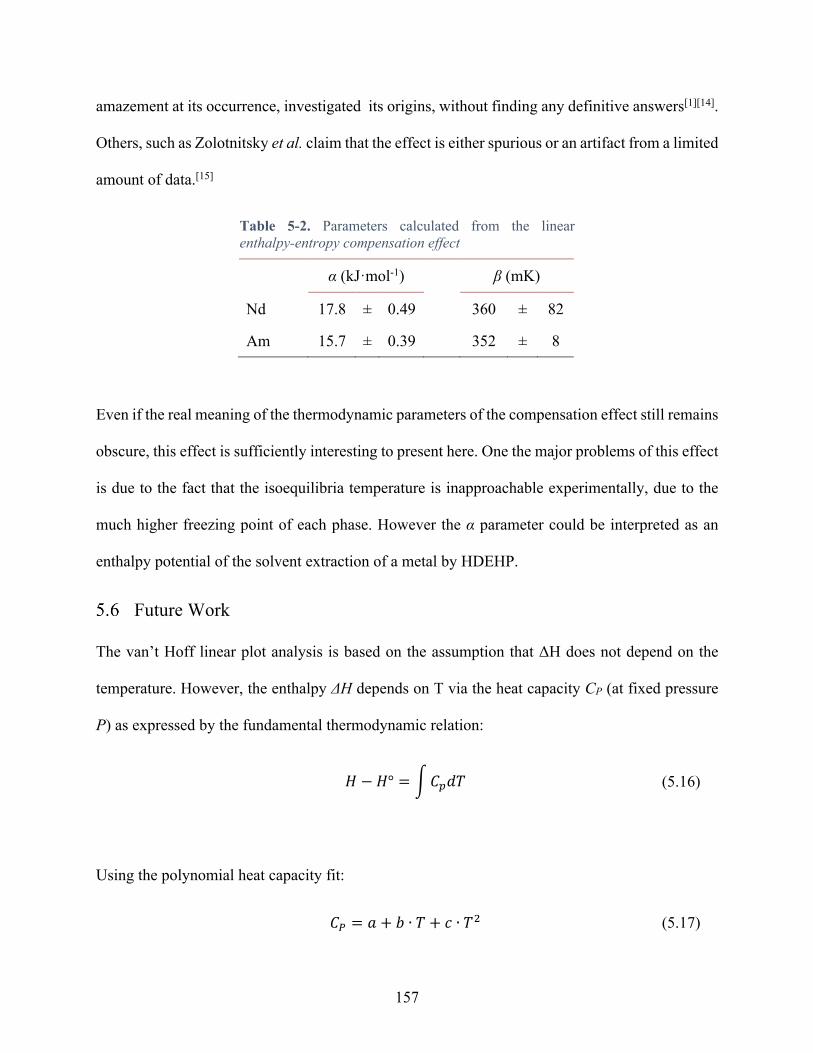
157
amazement at its occurrence, investigated its origins, without finding any definitive answers[1][14].
Others, such as Zolotnitsky et al. claim that the effect is either spurious or an artifact from a limited
amount of data.[15]
Table 5-2. Parameters calculated from the linear enthalpy-entropy compensation effect
α (kJ·mol-1) β (mK)
Nd 17.8 ± 0.49 360 ± 82
Am 15.7 ± 0.39 352 ± 8
Even if the real meaning of the thermodynamic parameters of the compensation effect still remains
obscure, this effect is sufficiently interesting to present here. One the major problems of this effect
is due to the fact that the isoequilibria temperature is inapproachable experimentally, due to the
much higher freezing point of each phase. However the α parameter could be interpreted as an
enthalpy potential of the solvent extraction of a metal by HDEHP.
Future Work
The van’t Hoff linear plot analysis is based on the assumption that ΔH does not depend on the
temperature. However, the enthalpy ΔH depends on T via the heat capacity CP (at fixed pressure
P) as expressed by the fundamental thermodynamic relation:
𝐻 − 𝐻° = ë𝐶Ö𝑑𝑇 (5.16)
Using the polynomial heat capacity fit:
𝐶ð = 𝑎 + 𝑏 ∙ 𝑇 + 𝑐 ∙ 𝑇0 (5.17)

158
It is possible to develop the following equation:
ln𝐾 = 𝑐𝑠𝑡 +∆𝐻t𝑅 ∙
1𝑇 +
∆𝑎𝑅 ln 𝑇 +
∆𝑏𝑅 𝑇 +
∆𝑐𝑅 𝑇0 (5.18)
It also is possible to obtain these parameters measuring the Cp for the system as a function of the
temperature, using calorimetry. Doing so it could be possible to refine the determination of the
standard enthalpy change and standard entropy change.
Also with the objective to increase the degree of precision of the analysis, increasing the number
of diluents in the correlation of ΔH and TΔS and increasing the number of trivalent cations studied
with the same method are probably needed.
Conclusion
This study represents the preliminary investigation of a van’t Hoff analysis of the diluent effect on
the solvent extraction of trivalent f-elements by HDEHP. The Gibbs energy, the enthalpy and the
entropy change as function of the diluent has been found to increase as follows: n-octane <
nitrobenzene < toluene < chloroform. With these thermodynamic parameters, a linear enthalpy-
entropy compensation diagram has been obtained, allowing to determine the iso-equilibria
temperature as well as an enthalpy potential of the mechanism. Such diagram can be attributed to
the change in the desolvation and solvation processes in the organic phase.
159
References
(1) Choppin, G. R. Complexation of Metal Ions. In Solvent Extraction Principles and Practice, Revised and Expanded; Rydberg, J., Cox, M., Musikas, C., Choppin, G. R., Eds.; CRC Press: NY; 2012; pp 81-107
(2) Marcus, Y.; Kolarik, Z. Thermodynamics of Liquid-Liquid Distribution Reactions. I. the Dioxouranium(VI) Nitrate-Water-Tri-n-Butyl Phosphate-n-Dodecane System. J. Chem. Eng. Data 1973, 18 (2), 155–163.
(3) Zalupski, P. R.; Nash, K. L. Two-Phase Calorimetry. I. Studies on the Thermodynamics of Lanthanide Extraction by Bis ( 2-EthylHexyl ) Phosphoric Acid. Solvent Extraction and Ion Exchange. 2008, No. February, 514–533.
(4) Berry, J. Assessing Medium Effects in TALSPEAK-Like Systems via Calorimetric Entropy Titrations, Ph.D. dissertation, Washington State University, 2017.
(5) Ekberg, C.; Aneheim, E.; Fermvik, A.; Foreman, M.; Löfström-Engdahl, E.; Retegan, T.; Spendlikova, I. Thermodynamics of Dissolution for Bis(Triazine)-Bipyridine-Class Ligands in Different Diluents and Its Reflection on Extraction. J. Chem. Eng. Data 2010, 55 (11), 5133–5137.
(6) Buch, A. Etude Thermodynamique et Cinetique de l’extraction Liquide-Liquide Du Nickel(II) Par La 2-Ethylhanal Oxime et Un Melange de 2-Ethylhexanal Oxime et d’acide Di-2-(Ethylhexyl) Phosphorique, University of Paris 6, 2006.
(7) Nash, K.; Choppin, G. Interaction of Humic and Fulvic Acids with Th (IV). J. Inorg. Nucl. Chem. 1980, 42 (IV), 1045–1050.
(8) Van’t Hoff, J. H. Etudes de Dynamique Chimique, first.; Frederik Muller & Co: Amsterdam, 1884.
(9) Craig, N. C. Entropy Diagrams. J. Chem. Educ. 1996, 73 (8), 710–715.
(10) Kolarik, Z. The Effect of Diluent on the Solvent Extraction of Tb(III) and Eu(III) by Di-n-Octyl Phosphoric Acid. In Solvent Extraction Chemistry; Dyrssen, D., Liljenzin, J.-O., Rydberg, J., Eds.; John Wiley: Amsterdam, 1967; pp 250–255.
(11) Narbutt, J. Outer Sphere Hydration of Metal Chelates and Its Role in Liquid Liquid Partition Equilibria. 104–107.
(12) Choppin, G. R. Comparison of the Solution Chemistry of the Actinides and Lanthanides. J. Less-Common Met. 1983, 93 (2), 323–330.
(13) Grunwald, E.; Steel, C. Solvent Reorganization and Thermodynamic Enthalpy—Entropy Compensation. J. Am. Chem. Soc. 1995, 117 (21), 5687–5692.

160
(14) Freed, K. Entropy− Enthalpy Compensation in Chemical Reactions and Adsorption: An Exactly Solvable Model. J. Phys. Chem. B 2011, 1689–1692.
(15) Zolotnitsky, G.; Cogan, U.; Adir, N.; Solomon, V.; Shoham, G.; Shoham, Y. Mapping Glycoside Hydrolase Substrate Subsites by Isothermal Titration Calorimetry. Proc. Natl. Acad. Sci. U. S. A. 2004, 101 (31), 11275–11280.

161
CHAPTER SIX
6 GENERAL CONCLUSIONS
This study has reported the results of work improving the understanding of the fundamental
chemistry of solvent extraction of f-elements by acidic di-alkyl organophosphorus extractants, 2-
ethylhexyl phosphoric acid 2-ethylhexyl ester (HEH[EHP]) and bis-2-ethylhexyl phosphoric acid
(HDEHP). The focus of this study reported on the influence of the organic phase, in which the
extractants were dissolved, on the solvent extraction equilibria and thermochemistry. The results
presented emphasized the diluent used had a strong influence on the efficiency of the extraction,
the stoichiometry of the metal chelate, and the change in thermodynamic parameters.
In the chapter 3, the results from the extractions of europium, thulium, neodymium and
americium as function of the diluent showed, through linear free energy diagrams, that the
influence of the diluent on the solvent extraction is strong, and independent of the cation used. The
stoichiometry of the metal chelate has been showed to be variable as a function of the diluent used,
where low interacting diluents can favor lower stoichiometry, MA3(HA)2, and higher interactive
diluents can cause higher stoichiometry, with MA3(HA)4 observed. Spectrophotometric methods
have been used to observe a potential change intro the coordination environment of the cation.
This data has shown that the octahedral environment of the metal chelate stayed unchanged from
one diluent to another. However, the results also show a small change in the symmetry of the metal
chelate (thought the diminution of the pic resolution of the Nd+3 UV-Vis spectra, and the apparition
of the 5D0 → 7F0 transition of the Eu3+ luminescence spectra).

162
To extend this study, additional diluents could be investigated, especially hydrogen donors
such as dichloromethane, bromoform, 1,1-dichloroethene, etc. Also as an extension of this general
study done with pure diluents, mixed diluent systems should be studied – see examples in the
appendices.
In the chapter 4, the change in Gibbs energy of extraction of Europium by HEH[EHP]
obtained from the chapter 3 was studied in this work and was compared to physical and chemical
properties of the diluent used. It has been shown that higher cohesive dispersive energies cause a
lower efficiency of extraction. The Hansen solubility parameters showed the best correlation with
the Gibbs energy of extractions. This effect has been attributed to the lower solubility of the
metallic cation in comparison to the three protons exchanged from the extractant during the solvent
extraction process. In a second period, the ability of the diluent to associate with the extractant
(thought a Lewis acid base abduct formation mechanism), has been investigated. To do so,
empirical Lewis acid/base scales have be compared to the change in Gibbs energy of extractions.
The results showed interesting correlations between the basicity scales and the efficiency of
extraction, which was a strong indication of a potential adduct formation.
To extend this study, additional parameters should be determined, such as association
parameter constants, but also redefining/measuring the nonspecific interaction while taking into
account the water and nitric acid uptake. In addition, it would be interesting to determine the
Hansen solubility parameters of the extracted complexes; this could lead to a new plot of log D vs.
solubility parameters, bringing additional insight into diluent effect study.
In the chapter 5, solvent extraction of Am+3 and Nd3+ by HDEHP with using different
diluent have been investigated using van’t Hoff thermometric analysis. The results from the
thermometric analysis of the extraction Nd3+ and Am3+ by HDEHP showed a variation of the Gibbs

163
energy, the change in enthalpy and entropy a function of the diluent. The ΔG and ΔH have been
found to increase as following: n-octane < nitrobenzene < toluene < chloroform. ΔS have been
found to increase as follows: chloroform < toluene < nitrobenzene < n-octane. A linear enthalpy-
entropy compensation effect was also plotted. This plot allowed us to find the iso-equilibrium
temperature β, Nd: 360 mK ± 82 mK, Am: 352 mK ± 8 mK. A second parameter α has been
determined, Nd: 17.8 kJ·mol-1 ± 0.49 kJ·mol-1, Am: 15.7 kJ·mol-1 ± 0.39 kJ·mol-1.
To extend this study, additional cations and diluents could be investigated (especially to
extend the thermochemical data to complete the entropy-enthalpy compensation diagram). If a
trend was observed, it would help to attribute enthalpic and entropic behavior to family of diluents
but also help to understand the meaning behind the parameter α.
The overall impact of this work on the broader scientific community is an increased
understanding of the chemistry of acidic di-alkyl organophosphorus extractant during the solvent
extraction of an f-element. Included in this work is the first extensive study of slope analysis with
various cation (Nd3+, Eu3+, Tm3+ and Am3+), cross-compared with diluent physical and chemical
properties. The overall conclusion is that the diluent has a strong impact on the solvent extraction
mechanism, mostly due to the cohesive and interactive properties of the diluent with the solutes.

A. APPENDIX

165
A.1. The Need of Energy and the Impact of its Production
A.1.1. Energy and Quality of Life
At the most basic level, energy is required to cook our food, warm people from the cold, and light
the dark. Moving beyond survival, energy becomes an essential component to every aspect of
enhanced development: providing motive force for industry, refrigerating medicines, lighting
schools, preserving food, transporting products, and communication. When those goals are
achieved, the excess of energy can be used to fulfilling basic social needs, driving economic
growth, and fueling human development. This is because energy services have an effect on
productivity, health, education, safe water, and communication services. Also, modern services
such as electricity, natural gas, modern cooking fuel, and mechanical power are necessary for
improved health and education, better access to information, and agricultural productivity.[1]
Figure A-1 shows the energy needs related to this living standard. It is also very important to
notice that in 2016 there are 1.1 billion people that are living without access to electricity (this
number fell from 1.7 billion in 2000) and 2.7 billion have only a limited access[2]
In Figure A-2 the recent Per Capita6 Energy Consumption (PCEC) patterns[3] are compared with
recent quality of life data (UNDP, 2014[4]) from the UN Human Development Index to isolate
those nations that have a favorable HDI compared with moderate energy consumption at different
stages of development.
6 Per Capita means Per Person, from the Latin capita = head.
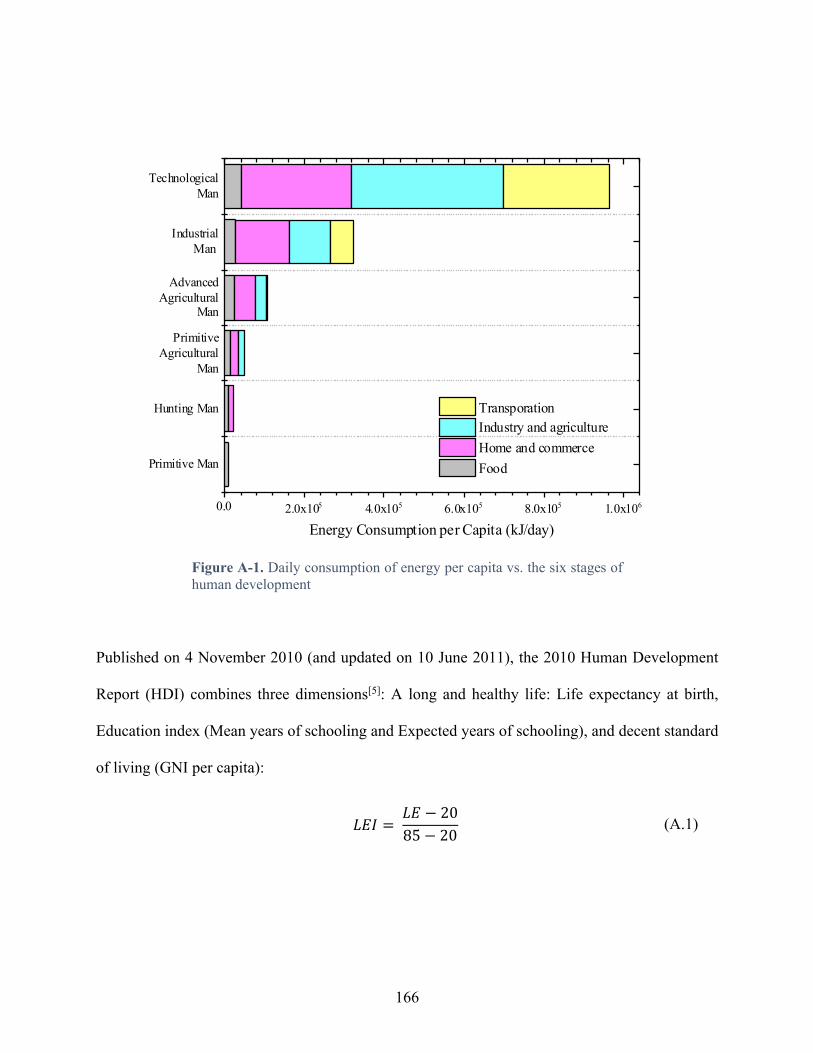
166
Figure A-1. Daily consumption of energy per capita vs. the six stages of human development
Published on 4 November 2010 (and updated on 10 June 2011), the 2010 Human Development
Report (HDI) combines three dimensions[5]: A long and healthy life: Life expectancy at birth,
Education index (Mean years of schooling and Expected years of schooling), and decent standard
of living (GNI per capita):
𝐿𝐸𝐼 = 𝐿𝐸 − 2085 − 20 (A.1)
Primitive Man
Hunting Man
PrimitiveAgricultural
Man
AdvancedAgricultural
Man
IndustrialMan
TechnologicalMan
0.0 2.0x10⁵ 4.0x10⁵ 6.0x10⁵ 8.0x10⁵ 1.0x10⁶
Energy Consumption per Capita (kJ/day)
Transporation Industry and agriculture Home and commerce Food
167
where LEI is the Life Expectancy Index, and LE is the Life Expectancy. LEI is 1 when Life
expectancy at birth is 85 and 0 when Life expectancy at birth is 20.
𝐸𝐼 =𝑀𝑌𝑆𝐼 + 𝐸𝑌𝑆𝐼
2 (A.2)
𝑀𝑌𝑆𝐼 = 𝑀𝑌𝑆15 (A.3)
𝐸𝑌𝑆𝐼 = 𝐸𝑌𝑆18 (A.4)
where EI is the Education Index, MYSI is the Mean Years of Schooling Index, MYS is the Mean
Years of Schooling (fifteen is the projected maximum of this indicator for year 2031), EYSI is the
Expected Years of Schooling Index, and EYS is the Expected Years of Schooling (eighteen is
equivalent to achieving a master's degree in most countries)
𝐼𝐼 = ln(𝐺𝑁𝐼) − ln(100)
ln(75000) − ln(100) (A.5)
where II is the Income Index, GNI is the Gross National Income per capita. II is one when GNI is
$75 000 and 0 when GNI is $100.
Finally, the HDI is the geometric mean of the previous three normalized indices:
𝐻𝐷𝐼 = √𝐿𝐸𝐼 ∙ 𝐸𝐼 ∙ 𝐼𝐼Ë (A.6)
168
The comparison of PCEC to HDI is becoming the most common type of analysis in the energy
production industry. Indeed, as depicted in Figure A-2, a moderately satisfactory and commonly
applied fit may be made using a logarithmic trend. This logarithmic representation shows that there
is a first order relation between the energy production of a country and the quality of life. An HDI
between 0.3 and 0.7 means there is an extremely strong dependence of HDI and PCEC. The second
region, located near the point of inflection (HDI 0.7–0.9), represents transitioning nations and
indicates a threshold from very poor human development to very high development. In the third
region, the higher energy consumption (above 5 000 kOE), there is a saturation phenomenon,
where a higher consumption of energy does not increase the quality of life. A final assumption
from Figure A-2 could be that the countries in region 2 (HDI > 0.7 and PCEC < 5 000 kOE)
would have difficulty to reduce their PCEC without risking a reduction in their HDI. The results
in terms of energy footprint show that the generalization of the living standards from the so-called
highly developed countries to the rest of the world would require a substantial increase in the
global energy use rates.

169
Figure A-2. United Nation HDI data[4] versus annual PCEC[3]
A.1.2. Energy and World Population Growth
“Is there a sustainable solution for the world and the resources it needs to
maintain a decent standard of living for everybody, at a population very much
higher than today’s? Clearly, there cannot be both a permanent growth in the
use of materials and a sustainable future.”
~John Sheffield[6]
If the earth is considered as a closed system where the amount of critical resources available are
limited (clear water, food, clean air, living space), it is easy to understand that the growth of the
human population needs to be monitored. The world population was estimated to be around 7.6
billion in December 2018 and is expected to increase to 8.8 Billion in 2050 for the most optimistic
0 5000 10000 15000 200000.3
0.4
0.5
0.6
0.7
0.8
0.9
1.0
FranceJapanUnited KingdomUnited StatesGermanyChina
HD
I
Per Capita Energy Consumption (kOE)
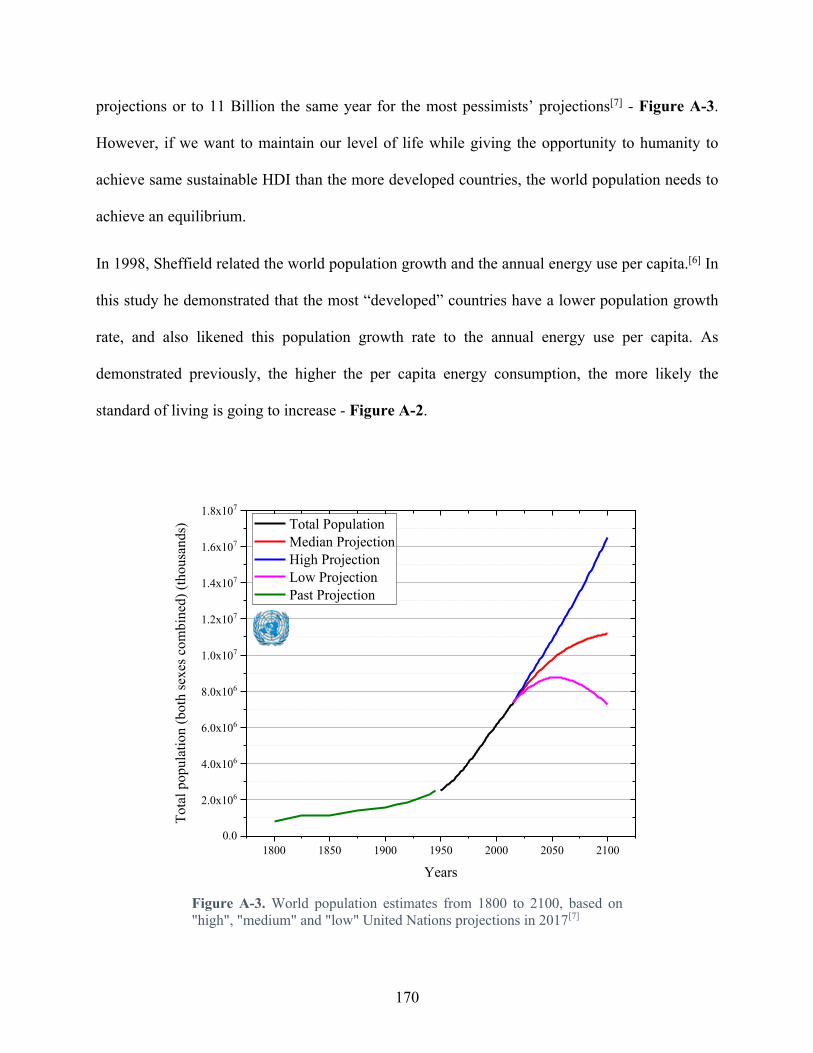
170
projections or to 11 Billion the same year for the most pessimists’ projections[7] - Figure A-3.
However, if we want to maintain our level of life while giving the opportunity to humanity to
achieve same sustainable HDI than the more developed countries, the world population needs to
achieve an equilibrium.
In 1998, Sheffield related the world population growth and the annual energy use per capita.[6] In
this study he demonstrated that the most “developed” countries have a lower population growth
rate, and also likened this population growth rate to the annual energy use per capita. As
demonstrated previously, the higher the per capita energy consumption, the more likely the
standard of living is going to increase - Figure A-2.
Figure A-3. World population estimates from 1800 to 2100, based on "high", "medium" and "low" United Nations projections in 2017[7]
1800 1850 1900 1950 2000 2050 21000.0
2.0x10⁶
4.0x10⁶
6.0x10⁶
8.0x10⁶
1.0x10⁷
1.2x10⁷
1.4x10⁷
1.6x10⁷
1.8x10⁷
Tota
l pop
ulat
ion
(bot
h se
xes c
ombi
ned)
(tho
usan
ds)
Years
Total Population Median Projection High Projection Low Projection Past Projection

171
Also with increasing standard of living comes more extensive education for both men and women,
increasing literacy, and the availability of information (print, television, internet), better access the
health care, greater availability and use of contraception, more opportunities for women, lower
early mortality, less need for parents to want a large number of children to support them in their
old age, etc. By understanding that, it is logic that the access to a sustainable source of energy is a
key factor for the survival of our planet.
A.1.3 Production of Energy and Gaseous Emission Footprints
In the last 20 years it has been largely demonstrated that the current energy consumption patterns
are both physically and socially unsustainable. While the industrialized world faces sweeping
energy transitions imposed by an impending decline of petroleum production, much of the non-
industrialized world already faces significant energy shortages[8]. There is discussion about the
nature of an overall transition to more sustainable energy systems (such as the COP21 in Paris in
2017). In recent years, progress has been made in developing cleaner, more efficient energy
technologies. Indeed, we are seeing signs that economic growth and energy-related emissions –
which have historically moved in the same direction – are starting to decouple. It seems unlikely
that any single source will succeed in claiming a market share comparable to that currently owned
by petroleum, let alone the collective fossil fuels. It will be critical in planning for the transition to
understand the energy demand and potential production from various sources in terms of carbon
footprint of each source[9], but also the emission of NO2 and SO2, responsible for the acid rains.
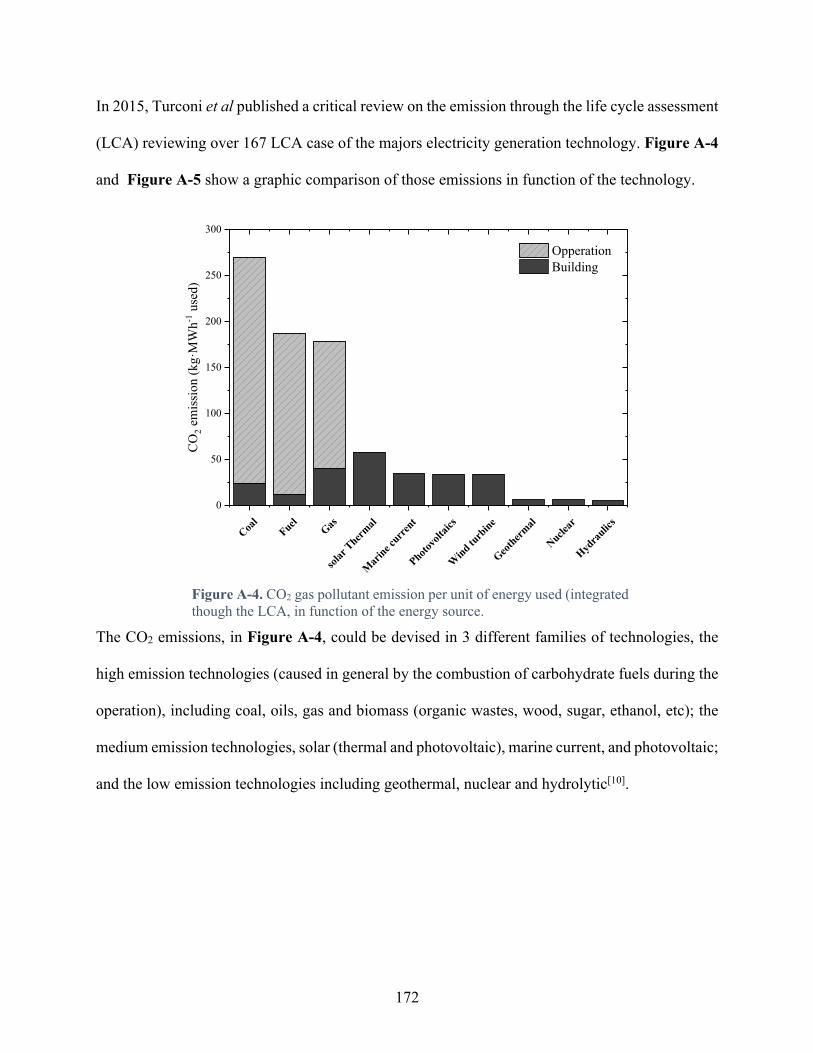
172
In 2015, Turconi et al published a critical review on the emission through the life cycle assessment
(LCA) reviewing over 167 LCA case of the majors electricity generation technology. Figure A-4
and Figure A-5 show a graphic comparison of those emissions in function of the technology.
Figure A-4. CO2 gas pollutant emission per unit of energy used (integrated though the LCA, in function of the energy source.
The CO2 emissions, in Figure A-4, could be devised in 3 different families of technologies, the
high emission technologies (caused in general by the combustion of carbohydrate fuels during the
operation), including coal, oils, gas and biomass (organic wastes, wood, sugar, ethanol, etc); the
medium emission technologies, solar (thermal and photovoltaic), marine current, and photovoltaic;
and the low emission technologies including geothermal, nuclear and hydrolytic[10].
Coal
Fuel Gas
solar
Thermal
Mar
ine curre
nt
Photovo
ltaics
Wind tu
rbine
Geotherm
al
Nuclear
Hydra
ulics
0
50
100
150
200
250
300
CO
2 em
issi
on (k
g·M
Wh-1
use
d)
Opperation Building
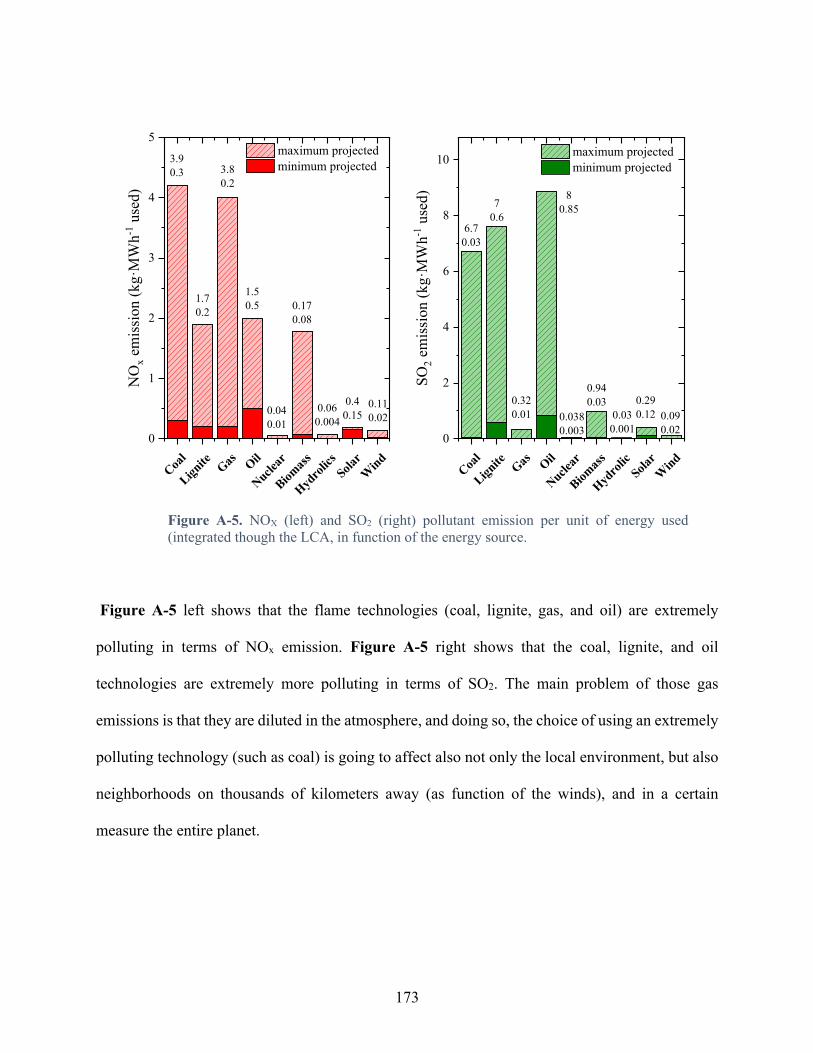
173
Figure A-5. NOX (left) and SO2 (right) pollutant emission per unit of energy used (integrated though the LCA, in function of the energy source.
Figure A-5 left shows that the flame technologies (coal, lignite, gas, and oil) are extremely
polluting in terms of NOx emission. Figure A-5 right shows that the coal, lignite, and oil
technologies are extremely more polluting in terms of SO2. The main problem of those gas
emissions is that they are diluted in the atmosphere, and doing so, the choice of using an extremely
polluting technology (such as coal) is going to affect also not only the local environment, but also
neighborhoods on thousands of kilometers away (as function of the winds), and in a certain
measure the entire planet.
Coal
LigniteGasOil
Nuclear
Biomass
HydrolicsSolarWind
0
1
2
3
4
5
0.110.02
0.060.004
0.40.150.04
0.01
0.170.08
1.50.51.7
0.2
3.80.2
3.90.3
NO
x em
issi
on (k
g·M
Wh-1
use
d) maximum projected minimum projected
Coal
LigniteGasOil
Nuclear
Biomass
HydrolicSolarWind
0
2
4
6
8
10
0.290.12 0.09
0.020.030.001
0.940.03
0.0380.003
80.85
0.320.01
70.6
SO2 e
mis
sion
(kg·
MW
h-1 u
sed)
maximum projected minimum projected
6.70.03
174
A.1.4. Energy and Resources
A.1.4.1. Raw Materials
Regardless of the nature of the source of energy used for the production of energy (sun, wind,
water, uranium, etc.), all energy technologies require material to support the production. However,
in function of the technology installed, the type and amount of material consumed can vary widely.
Some technologies require only common, plentiful material, such as steel and concrete, but some
other may consume various quantities of more critical material, such as noble metal and rare earth
elements.[11] Since the earth is still a closed and limited system, is seem obvious that the quantities
of material is also limited and can become critical as a function of the market value and
availability.[12] In addition, for the moment, the technologies that require the largest amount of
material for their construction are not supported by any sustainable recycling program. This is
especially true for the photovoltaic technology, were after deconditioning the solar panel join the
classic waste streams.7[13] Figure A-6 is a graphic representation of the key materials by mass per
energy technology lifetime.[14]
Recycling, reuse, and more efficient use of critical materials could significantly lower the demand
for new material. In 2015, it has been estimated by the US Department of Energy that only 1% of
critical materials are recycled in the end of life of the electricity generator.[11] Finally, it is
interesting to point out that the technology that require the lower amount of materials are the
technology using heat from various fuel as a source of energy (coal, gas, biomass and nuclear).
7 France opened the first solar panel recycling plant in 2018 see ref [18]

175
Figure A-6. Range of material requirement (fuel excluded) for various electricity generation technologies
A.1.4.2. Land Footprint
In the same manner of any other industry, the energy industry requires land area. Comparing the
required land area for each technology can inform the decision making for the choice of a
technology as function of the land available and the process footprint. One of the major challenges
to compare each technology as function of the land use is the absence of a universally accepted
definition of the land use and per consequence, of any universal metric. [11],[15]–[17] A US
Department of Energy report presented some estimates on the land use requirement per technology
in m2·TWh-1, giving a low and a high estimate, and a crop area for the biomass. This data is
presented in Figure A-7.
Coal Ga
s
Biomass
Nuclear
hydrolic
Wind So
lar
Geothermal
0
5000
10000
15000
20000
Mat
eria
l Thr
ough
put (
Tonn
es·T
Wh-1
) Steel Silicon Plastic Lead Iron Glass Copper Concrete Cement Aluminium

176
Figure A-7. Representative of the land use estimates for a variety of the electricity generating technologies from reference [11]. Left: data represented on a linear scale, right: data represented on a logarithmic scale.
The logarithmic scale in Figure A-7 (right) has been used to visualize all the land use on the same
graphic. However, the linear scale used in Figure A-7 left to emphasize the real differences
between each technology. A closer look at this data shows that the three technologies that require
the larger area of land are the hydraulic (necessary for the water storage), wind (since a large radius
is required between each turbine to reduce the wind buffer effect) and biomass (completely
dominated by the land needed for the crops used as fuel). The three technologies that are the most
land efficient are coal, nuclear, and geothermal. However, it is important to specify that these
Coal
Nuclear
biomass
Hydro
licW
indSola
r
Geotherm
al0.0
2.0x10⁹
4.0x10⁹
6.0x10⁹
8.0x10⁹
1.0x10¹⁰
Land
Use
Ene
rgy
Inte
nsity
Esti
mat
e (m
2 ·TW
h-1)
Coal
Nuclear
biomass
Hydro
licW
indSola
r
Geotherm
al104
105
106
107
108
109
1010
1011linear scale
Low estimate Upper estimate Crop area
logarithmic scale
177
estimations do not take into account the mining for the coal and uranium, the storage of ashes, and
radioactive wastes.
A.1.5. Energy’s Deathprint
If the environmental footprint is largely discussed, the energy’s deathprint, as it is can be called,
is rarely discussed. It could be calculated by the number of people killed per TWh produced.
According to the World Health Organization (WHO), the Centers for Disease Control, the National
Academy of Science and many health studies over the last decade (NAS 2010), the adverse impacts
on health become a significant effect for fossil fuel and biofuel/biomass sources[18]. The major
source of death from coal, oil and biomass are the carbon particulates resulting from burning that
cause upper respiratory distress, kind of a second-hand black lung. WHO’s doctors have called
biomass burning in developing countries a major global health issue[19]. Coal and fossil fuel deaths
usually do not include deaths caused during transportation of the fuel; there is an increase in deaths
due to an increase in trucking and rail transport. The non-air pollution related deathprint are related
to occupational health and safety statistics of the deaths of workers in the different industries. The
deathprint of hydropower is dominated by a few rare large dam failures like Banqiao in China in
1976 which killed about 171 000 people.[20] For wind power, workers still regularly fall off wind
turbines during maintenance for a relatively little electricity production, which could be simply
reduced by increasing the workers’ safety regulation.[21],[22] The deathprint of solar energy is
mostly dominated by the fall of workers and non-workers installing the rooftop solar panels, but
can be divided by two if only solar farms are considered.[23] The major issue with the rooftop panel
is roof worker safety, in the US alone about 1000 construction fatalities are reported per year, with
32 fatality per 100 000 roof workers.[24] Wind power and solar deaths do not include the deaths
caused by mining of rare earth material in China due to its difficulty to integrate percentage of the
178
mass of ore extracted and used for the production of those technologies. Solar does not include the
death due to maintenance or any electrical shock incidents through a 30 years average lifetime per
solar panel.[23] Nuclear energy is integrated through the entire lifecycle, from mining to storage.
Uranium mining is a lot safer because in-situ leaching (the main method of uranium mining)
involves flushing acid down pipes. This process prevents workers digging underground,
preventing mining accidents. Also due to the very large energy density of uranium less material is
being moved than for coal plants. Before 2008 WHO indicated that 50 people died in the
Chernobyl incident, and 4000 may eventually die (using the Linear No-Treshold Dose hypothesis).
However, it has been recently discussed by health physicists that the LNT model may overestimate
the potential deaths from the Chernobyl’s accident[25],[26]. Furthermore in 2008, the United
Nations’ Scientific Committee on the Effects of Atomic Radiation (UNSCEAR) corrected the
number of deaths caused by Chernobyl to no more than 49 [27]. Reconsidering these data, a
correction can be applied to the civilian nuclear deathprint. In 2010, the Agency for the Nuclear
Energy published a cross reference similar the one just developed, including the specific deathprint
of the nuclear energy in the entire OECD[28]. However, it is important to note that in this report the
data were pre-Fukushima, increasing the number to death in the OCDE from 0 to 6 (nota bene: the
6 deaths at Fukishima are non-radioactivity related workplace accident[29], but should be integrated
for a more objective integration). Considering deathprint as a comparison factor, it is interesting
to point that coal is the more deadly technology and nuclear technology the safest, even after the
major accidents.
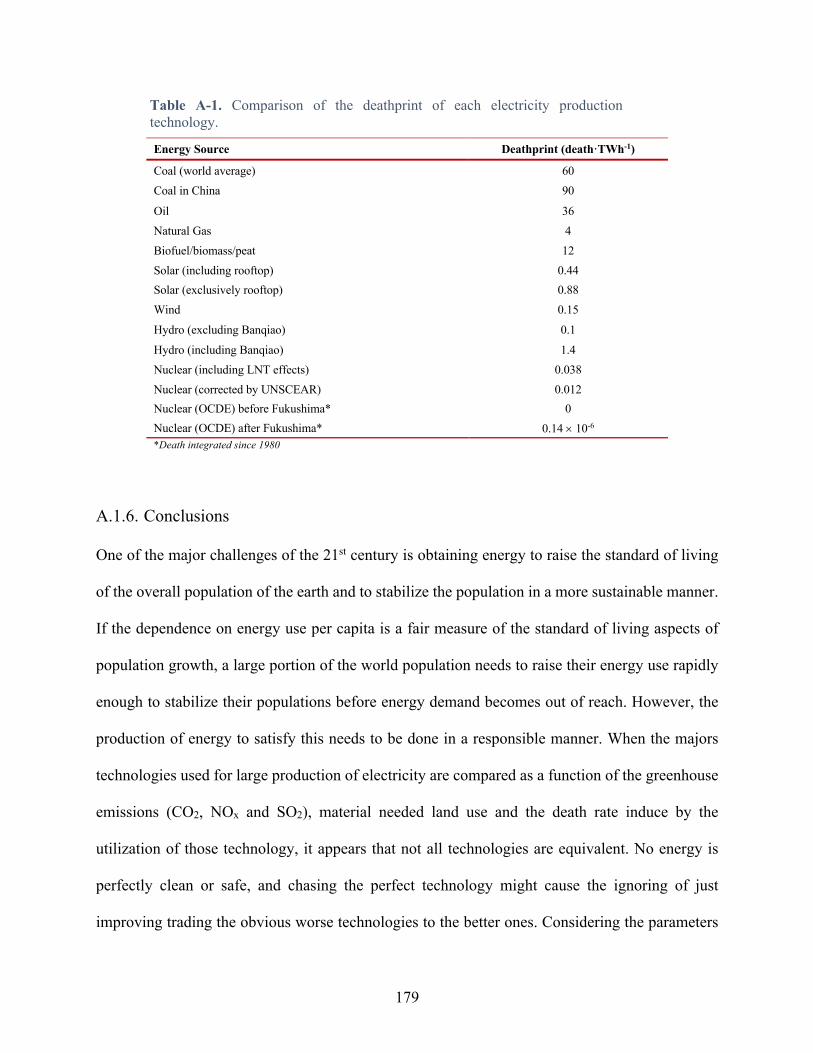
179
Table A-1. Comparison of the deathprint of each electricity production technology.
Energy Source Deathprint (death·TWh-1)
Coal (world average) 60 Coal in China 90
Oil 36 Natural Gas 4 Biofuel/biomass/peat 12 Solar (including rooftop) 0.44 Solar (exclusively rooftop) 0.88 Wind 0.15
Hydro (excluding Banqiao) 0.1
Hydro (including Banqiao) 1.4 Nuclear (including LNT effects) 0.038 Nuclear (corrected by UNSCEAR) 0.012 Nuclear (OCDE) before Fukushima* 0 Nuclear (OCDE) after Fukushima* 0.14 ´ 10-6 *Death integrated since 1980
A.1.6. Conclusions
One of the major challenges of the 21st century is obtaining energy to raise the standard of living
of the overall population of the earth and to stabilize the population in a more sustainable manner.
If the dependence on energy use per capita is a fair measure of the standard of living aspects of
population growth, a large portion of the world population needs to raise their energy use rapidly
enough to stabilize their populations before energy demand becomes out of reach. However, the
production of energy to satisfy this needs to be done in a responsible manner. When the majors
technologies used for large production of electricity are compared as a function of the greenhouse
emissions (CO2, NOx and SO2), material needed land use and the death rate induce by the
utilization of those technology, it appears that not all technologies are equivalent. No energy is
perfectly clean or safe, and chasing the perfect technology might cause the ignoring of just
improving trading the obvious worse technologies to the better ones. Considering the parameters
180
presented in this appendix, it appear that the nuclear energy and the hydroelectric are the most
reliable. The question of the waste have not been treated here, because the information on the waste
management of most of the other technology than nuclear are not necessary available and/or
reliable. However, it is important to specify that an intense effort if given by the nuclear industry
to reduce the amount of waste (close fuel cycle, fast neutron reactor, molten salt reactor, etc), but
also to propose long-term safe and controlled disposal of the final waste. In regards of this
information, it seems that two technologies are more sustainable that the others (in term of
pollution emission, resources (material and land) and deathprint), hydropower and nuclear energy.
Furthermore, one of the major advantage of hydropower as source of energy can be stored and
tuned easily in function of the need. However, this energy suffers because of its dependency on
the availability of a large quantity of unsalted water, which is already limited due to the lack of
access of water and is probably going to be reduced in the context of global warming.
“if we’re going to tackle global warming, nuclear is the only way you can
create a massive amount of power”
~ Sting, December 2016
181
A.1.7 References
(1) Arto, I.; Capellán-Pérez, I.; Lago, R.; Bueno, G.; Bermejo, R. The Energy Requirements of a Developed World. Energy Sustain. Dev. 2016, 33, 1–13.
(2) IEA. Energy Access Outlook 2017: From Poverty to Prosperity; Paris, 2017.
(3) IEA_statistics. Energy use (kg of oil equivalent per capita) http://data.worldbank.org/indicator/EG.USE.PCAP.KG.OE (accessed Sep 1, 2016).
(4) United_Nations_Development_Programme. Human Development Data (1980-2015) http://hdr.undp.org/en/data (accessed Sep 1, 2016).
(5) Fukuda-Parr, S. The Human Development Paradigm: Operationalizing Sen’S Ideas on Capabilities. Fem. Econ. 2003, 9 (2–3), 301–317.
(6) Sheffield, J. World Population Growth and the Role of Annual Energy Use per Capita. Technol. Forecast. Soc. Change 1998, 59 (1), 55–87.
(7) United Nations, Department of Economic and Social Affairs, P. D. World Population Prospects: The 2017 Revision. 2017.
(8) Hirsch, R. L.; Bezdek, R.; Wendling, R. Peaking of World Oil Production and Its Mitigation; 2007.
(9) IEA. World Energy Outlook Special Report: Energy and Climate Change; Paris, 2015.
(10) Turconi, R.; Boldrin, A.; Astrup, T. Life Cycle Assessment (LCA) of Electricity Generation Technologies: Overview, Comparability and Limitations. Renew. Sustain. Energy Rev. 2013, 28 (May 2015), 555–565.
(11) U.S. DOE. Quadrennial Technology Review: An Assessment of Energy Technologies and Research Opportunities; 2015.
(12) Castor, S.B., Hendrick, J. B. Rare Earth Elements. Ind. Miner. Rocks Commod. Mark. Uses 2006, 769–792.
(13) De Clercq, G. Europe’s first solar panel recycling plant opens in France https://www.reuters.com/article/us-solar-recycling/europes-first-solar-panel-recycling-plant-opens-in-france-idUSKBN1JL28Z (accessed Oct 8, 2018).
(14) ANL (Argonne NationalLaboratory). Argonne GREET Model https://greet.es.anl.gov (accessed Oct 8, 2018).
(15) Fthenakis, V.; Kim, H. C. Land Use and Electricity Generation: A Life-Cycle Analysis. Renew. Sustain. Energy Rev. 2009, 13 (6–7), 1465–1474.

182
(16) Cheng, V. K. M.; Hammond, G. P. Life-Cycle Energy Densities and Land-Take Requirements of Various Power Generators: A UK Perspective. J. Energy Inst. 2017, 90 (2), 201–213.
(17) Mattila, T.; Helin, T.; Antikainen, R. Land Use Indicators in Life Cycle Assessment A Case Study on Beer Production. Int. J. Life Cycle Assess. 2012, 17 (3), 277–286.
(18) Markandya, A.; Wilkinson, P. Electricity Generation and Health. Lancet 2007, 370 (9591), 979–990.
(19) WHO. Household Air Pollution and Health; 2016.
(20) Fish, E. The Forgotten Legacy of the Banqiao Dam Collapse https://www.internationalrivers.org/resources/the-forgotten-legacy-of-the-banqiao-dam-collapse-7821 (accessed Aug 8, 2018).
(21) Gipe, P. The Giant Killers. In Wind Energy Comes of Age; John Wiley & Sons, 1997; pp 143–225.s
(22) Gipe, P. Wind Power, Revised Edition: Renewable Energy for Home, Farm, and Business, 2nd ed.; Chelsea Green Publishing, 2004.
(23) Wang, B. Deaths per TWh for all energy sources: Rooftop solar power is actually more dangerous than Chernobyl https://www.nextbigfuture.com/2008/03/deaths-per-twh-for-all-energy-sources.html (accessed Mar 6, 2018).
(24) Roof Revider. Why Roofing is Such a Dangerous Job https://roofrevivers.com/roofing-dangers/ (accessed Aug 8, 2018).
(25) Weber, W.; Zanzonico, P. The Controversial Linear No-Threshold Model. J. Nucl. Med. 2017, 58 (1), 7–8.
(26) Tubiana, M.; Feinendegen, L. E.; Yang, C.; Kaminski, J. M. The Linear No-Threshold Relationship Is Inconsistent with Radiation Biologic and Experimental Data. Radiology 2009, 251 (1), 13–22.
(27) UNSCEAR. Sources and Effects of Ionizing Radiation; 2008; Vol. II.
(28) OCDE. Évaluation De Risques D ’ Accidents Nucléaires Comparés À Ceux D ’ Autres Filières Énergétiques; 2010.
(29) UNSCEAR. Developments since the 2013 UNSCEAR Report on the Levels and Effects of Radiation Exposure Due to the Nuclear Accident Following The Great East-Japan Earthquake and Tsunami. 2015, 51.
Copyright © 2022 FDOKUMEN


![Solvent Extraction and Ion Exchange Studies on the Extraction—Simultaneous Back-Extraction of Alkali Metal Picrates Using 1,3 Bis-Benzo-Crown-6-Calix[4] Arene in Hollow-Fiber Contactors](https://static.fdokumen.com/doc/165x107/6328857bac8251a20b024d52/solvent-extraction-and-ion-exchange-studies-on-the-extractionsimultaneous-back-extraction.jpg)