Measurement of the oxidative potential of PM2.5 and its constituents: The effect of extraction...
34
Accepted Manuscript Measurement of the oxidative potential of PM 2.5 and its constituents: The effect of extraction solvent and filter type Aileen Yang, Aleksandra Jedynska, Bryan Hellack, Ingeborg Kooter, Gerard Hoek, Bert Brunekreef, Thomas AJ. Kuhlbusch, Flemming R. Cassee, Nicole AH. Janssen PII: S1352-2310(13)00802-9 DOI: 10.1016/j.atmosenv.2013.10.049 Reference: AEA 12541 To appear in: Atmospheric Environment Received Date: 11 June 2013 Revised Date: 25 September 2013 Accepted Date: 23 October 2013 Please cite this article as: Yang, A., Jedynska, A., Hellack, B., Kooter, I., Hoek, G., Brunekreef, B., Kuhlbusch, T.A., Cassee, F.R, Janssen, N.A., Measurement of the oxidative potential of PM 2.5 and its constituents: The effect of extraction solvent and filter type, Atmospheric Environment (2013), doi: 10.1016/j.atmosenv.2013.10.049. This is a PDF file of an unedited manuscript that has been accepted for publication. As a service to our customers we are providing this early version of the manuscript. The manuscript will undergo copyediting, typesetting, and review of the resulting proof before it is published in its final form. Please note that during the production process errors may be discovered which could affect the content, and all legal disclaimers that apply to the journal pertain.
-
Upload
independent -
Category
Documents
-
view
3 -
download
0
Transcript of Measurement of the oxidative potential of PM2.5 and its constituents: The effect of extraction...

Accepted Manuscript
Measurement of the oxidative potential of PM2.5 and its constituents: The effect ofextraction solvent and filter type
Aileen Yang, Aleksandra Jedynska, Bryan Hellack, Ingeborg Kooter, Gerard Hoek,Bert Brunekreef, Thomas AJ. Kuhlbusch, Flemming R. Cassee, Nicole AH. Janssen
PII: S1352-2310(13)00802-9
DOI: 10.1016/j.atmosenv.2013.10.049
Reference: AEA 12541
To appear in: Atmospheric Environment
Received Date: 11 June 2013
Revised Date: 25 September 2013
Accepted Date: 23 October 2013
Please cite this article as: Yang, A., Jedynska, A., Hellack, B., Kooter, I., Hoek, G., Brunekreef, B.,Kuhlbusch, T.A., Cassee, F.R, Janssen, N.A., Measurement of the oxidative potential of PM2.5 andits constituents: The effect of extraction solvent and filter type, Atmospheric Environment (2013), doi:10.1016/j.atmosenv.2013.10.049.
This is a PDF file of an unedited manuscript that has been accepted for publication. As a service toour customers we are providing this early version of the manuscript. The manuscript will undergocopyediting, typesetting, and review of the resulting proof before it is published in its final form. Pleasenote that during the production process errors may be discovered which could affect the content, and alllegal disclaimers that apply to the journal pertain.

MANUSCRIP
T
ACCEPTED
ACCEPTED MANUSCRIPT
Measurement of the oxidative potential of PM2.5
and its constituents: The effect of extraction
solvent and filter type
Aileen Yang a,b*, Aleksandra Jedynska c, Bryan Hellack d, Ingeborg Kooter c, Gerard Hoek b,
Bert Brunekreef b,e, Thomas AJ Kuhlbusch d,f, Flemming R Cassee a,b, Nicole AH Janssen b
a National Institute for Public Health and the Environment (RIVM), P.O. Box 1, 3720BA
Bilthoven, the Netherlands;
b Institute for Risk Assessment Sciences, Division Environmental Epidemiology, Utrecht
University, P.O. Box 80.178, 3508TD Utrecht, the Netherlands;
c The Netherlands Organisation for Applied Scientific Research (TNO), Princetonlaan 6,
3584CB Utrecht, the Netherlands;
d Air Quality & Sustainable Nanotechnology, Institute of Energy and Environmental
Technology (IUTA) e.V., Blierheimer Str. 60, 47229 Duisburg, Germany;
e Julius Center for Health Sciences and Primary Care, University Medical Center Utrecht,
Utrecht, the Netherlands
f CENIDE, University Duisburg-Essen, Duisburg, Germany
Abstract
The capacity of Particulate Matter (PM) to oxidise target molecules, defined as its oxidative
potential (OP), has been proposed as a biologically more relevant metric than PM mass.
Different assays exist for measuring OP and their methodologies vary in the choice of
extraction solvent and filter type. Little is known about the impact of extraction and filter type
on reported OP. Four a-cellular assays; electron spin resonance (ESR), dithiothreitol (DTT),
ascorbate acid depletion (AA) and reductive acridinium triggering (CRAT) assay were chosen
to evaluate whether these differences affect the OP measurement, the correlation between OP
from different assays and the association with PM chemical composition. We analysed 15

MANUSCRIP
T
ACCEPTED
ACCEPTED MANUSCRIPT
urban 48-72 hour PM2.5 samples collected on quartz and Teflon filters. The choice of
extraction solvent had only a significant effect on OPDTT, while all OP measures for quartz
filters were heavily attenuated. OP values derived from quartz were, however, highly
correlated with those derived from Teflon. OPDTT correlated highly with OPCRAT, and OPESR
correlated highly with OPAA. These correlations were affected by the choice of filter type.
Correlations between OP and PM chemical composition were not affected by filter type and
extraction solvent. These findings indicate that the measurement of relative OP reactivity is
not greatly influenced by filter type and extraction solvent for the investigated assays. This
robustness is also promising for exploratory use in monitoring and subsequent
epidemiological studies.
1 Introduction 1
It has been recognized that increased exposure to ambient particulate matter (PM) is 2
associated with a wide range of adverse health effects (Brunekreef and Holgate, 2002; Pope 3
III and Dockery, 2006). Currently, PM is regulated based on mass concentration, whereas 4
evidences indicate that the chemical composition, surface area and other characteristics of PM 5
are more closely linked to the induction of toxic responses (Nel, 2005). Oxidative stress, 6
initiated by the presence and formation of reactive oxygen species (ROS), or free radicals, has 7
been considered an important mechanism to the particle-induced health effects (Delfino et al., 8
2005). Although the human body is capable of dealing with ROS, diseases can overwhelm or 9
impair this host defence mechanism (Delfino et al., 2011). In that case, ROS can trigger a 10
cascade of events eventually leading to for example airway and pulmonary inflammation. 11
This in turn can cause a range of adverse effects like cell and tissue damage (Nel, 2005). 12
Oxidative potential (OP) is defined as a measure of the capacity of PM to oxidise target 13
molecules, i.e. by generating ROS in environments without living cells. It has been proposed 14
as a metric that is better related to biological responses to PM exposures and thus could be 15
more informative than mass alone (Borm et al., 2007). Several methods for testing OP have 16
been developed, but no consensus has been reached yet as to which assay is most appropriate 17
(Ayres et al., 2008). Furthermore, few inter-assay comparisons have been published. 18
Various assays exist to assess the oxidative capacity of PM, each with a different sensitivity to 19
the ROS generating compounds. Electron spin resonance (ESR) with 5,5-dimethylpyrroline-20
N-oxide (DMPO) as a spin trap, measures the ability of PM to induce hydroxyl radicals (•OH) 21
(Shi et al., 2003a, 2003b) in the presence of H2O2. The consumption of dithiothreitol (DTT) is 22

MANUSCRIP
T
ACCEPTED
ACCEPTED MANUSCRIPT
based on the ability of redox active compounds to transfer electrons from DTT to oxygen 23
(Cho et al., 2005; Kumagai et al., 2002). Other common assays involve measuring the ability 24
of PM to deplete antioxidants such as vitamin C, glutathione and uric acid (Mudway et al., 25
2004). Due to high detection sensitivity, fluorescent-based probes have also been used to 26
quantify PM-related ROS. These are based on the principle that a fluorescent product is 27
generated when the non-fluorescent probe molecule reacts with ROS. The most common used 28
probe is 2,7-dichlorofluorescein (DCFH) (Landreman et al., 2008). Another system with high 29
sensitivity consists of chemiluminogenic compounds, where certain acridinium esters, e.g. 4-30
methoxyphenyl-10-methylacridinium-9-carboxylate, have a high selectivity for superoxide 31
(Yamaguchi et al., 2010). Using this principle, a ROS assay using acridinium esters (CRAT) 32
as a redox probe was developed (Zomer et al., 2011) . 33
PM is usually collected on filters. After sampling, various methods are used to extract the PM 34
from the filters into suspension and then used for physical, biological, chemical and 35
toxicological analyses. The choice of extraction solvent varies between laboratories ranging 36
from deionised water to organic solvents (e.g. dichloromethane, methanol). This has an effect 37
on the efficiency of which PM species will be extracted and, as such, their toxicological 38
properties (Eiguren-Fernandez et al., 2010; Verma et al., 2012). Polytetrafluoroethylene 39
(PTFE), also known as Teflon, glass and quartz are frequently used PM sampling filter types. 40
Quartz is often used when PM is sampled for composition analysis. In the literature, most a-41
cellular assays for assessment of oxidative potential assessment have been applied to Teflon 42
filters and information on the usage of quartz filters is limited. Presently, quartz filters are 43
used as reference material within the PM10 standard (EN 12341) in the national air 44
monitoring networks in EU, while quartz, glass fibre, PTFE and PTFE-coated glass fibre are 45
allowed within the PM2.5 standard (EN 14907) 46
(“http://ec.europa.eu/environment/air/quality/legislation/assessment.htm,” 2012). 47
In the framework of the OPERA project (Oxidative Potential Exposure and Risk Assessment); 48
we aim to evaluate the value of OP as a health relevant PM metric for air quality assessment 49
and regulation. Given the different filter types and extraction methods, our primary goal for 50
this study was to assess if the aforementioned differences in methodologies might affect the 51
measurement of OP. Additionally, we aimed to see how this influenced the correlation 52
between OP from different assays and the association with PM composition. We evaluated 53
this for four acellular OP assays. ESR, depletion of ascorbate assay and the reductive 54
acridinium triggering (CRAT) assay. 55

MANUSCRIP
T
ACCEPTED
ACCEPTED MANUSCRIPT
2 Materials and Method 56
2.1 Study design 57
Ambient PM2.5 samples were collected at two locations in the Netherlands using Harvard 58
Impactors operating at 10 L/min flow (Air Diagnostics and Engineering Inc., Naples, Maine, 59
USA). The sampling sites were located at an urban background site in Rotterdam and along a 60
busy highway in Amsterdam. The sample volume was calculated using elapsed time 61
indicators and flow readings. The sampling periods were five (day 1 – 5) 48-72-hour 62
measurements in Rotterdam and ten (day 6 – 15) 48-72-hour measurements in Amsterdam 63
from August to November 2011. Five collocated pump units, each containing four Harvard 64
Impactors of which two used 37-mm Teflon (2 µm pore size, PVC support ring, Pall Corp., 65
NY, USA) and two 37-mm quartz filters (prebaked, QMA, Whatman - GE Healthcare 66
Biosciences Corp) were operated simultaneously. Thus, ten Teflon filters and ten quartz filters 67
were collected for each measurement period. 68
To determine particle mass concentrations, filters were weighed before and after sampling, in 69
accordance to EN14907, in a climatised room at an average temperature of 20 ± 1 °C and 50 ± 70
5 % relative humidity using a microbalance (Model MT5, Mettler-Toledo Ltd., Greifensee, 71
Switzerland) with 1 µg precision. Until processing, the filters were stored in petri dishes at 72
4°C in the dark. The OP analyses were completed by September 2012. 73
2.2 Extraction procedures 74
In our experiments, the Teflon filters were extracted with methanol (HPLC grade, Biosolve 75
BV, Valkenswaard, Netherlands) and traceSELECT ultrapure water (Sigma, Zwijndrecht, 76
Netherlands). The quartz filters were only extracted with methanol, and additionally analysed 77
directly on filter with ESR. See Supplement information (SI) Table S 1 for an overview of 78
how filter duplicates were allocated to different extraction procedure and OP analysis. 79
Methanol extraction 80
The filters were immersed with methanol in a petri dish and extracted in an ultrasonic bath 81
(Branson 5510 Ultrasonic cleaner, 40 kHz). The extract was then transferred to a rounded 82
glass flask and reduced in volume using the evaporator set (RV 10 Basic Rotary Evaporators, 83
IKA Works, VWR, USA) at 30 °C until about 1 mL was left. The filtrates were then 84
transferred to Eppendorf vials and dried overnight at 30 °C under a constant flow of nitrogen. 85

MANUSCRIP
T
ACCEPTED
ACCEPTED MANUSCRIPT
The quartz filter extracts were filtered through a 0.45µm PTFE syringe filter (VWR, Breda, 86
Netherlands), to remove the high amount of observed quartz fibres. 87
Water extraction 88
Water based extractions were only performed on Teflon filters using the method by Shi et al. 89
(Shi et al., 2003b). Briefly, the filters were immersed in 2 mL deionised water followed by 90
five minutes shaking, five minutes sonication (Bandelin Sonorex RK-52, 60/120 KW, 35 91
KHz) in a sonication water bath and finally five minutes vortexing (rpm 2800). 92
We attempted water extraction on the quartz filters, but it was proven difficult as the filters 93
readily absorbed water, thus requiring large quantities of water (> 5 mL). Due to the low mass 94
loading (79 – 1000 µg of PM) on several filters, adding such a substantial amount of water 95
might result in too heavily diluted suspensions. This is without taking into consideration loss 96
due to extraction. In addition, sonication destroyed the quartz fibres making it difficult to 97
separate quartz fibres from particles when filtering the suspensions. 98
2.3 Elemental composition analysis 99
Teflon filter duplicates for each sampling day, and two lab blanks were analysed with energy 100
dispersive X-ray fluorescence spectrometry (ED-XRF) at Cooper Environmental Services 101
(Portland, OR, USA) to get the elemental composition. Not enough quartz filters were 102
obtained due to pump failure, thus additional composition analysis was not possible. All 103
elements of interest (see SI Table S 3) were above detection limit (LOD) in all samples except 104
for aluminium (Al) and nickel (Ni) (1-3 samples < LOD). The limit of detection was 105
calculated as 3 times the standard deviation of the lab blanks. The coefficients of variation 106
(CV) values, as a measure for the precision of duplicate measurements, were less than 25%. 107
CV values were calculated as the sum of the squared absolute differences of the duplicates, 108
divided by two times the number of duplicates. The square root of this value was then divided 109
by the mean and multiplied by 100 to get the percentage (Eeftens et al., 2012). 110
Carbon analysis (EC/OC) was performed on quartz filers using a Thermal Optical 111
Transmittance (TOT) analyser (Sunset Laboratory Inc., Tigard, OR, USA). From each filter, a 112
punched sample of 1.5 cm2 was analysed with the temperature protocol EUSAAR_2; a 113
standard protocol developed for European aerosols (Cavalli et al., 2010). Optical 114
transmittance is used to correct for charring. For quality assurance, we analysed every 4th 115
filter twice. 116

MANUSCRIP
T
ACCEPTED
ACCEPTED MANUSCRIPT
2.4 Oxidative potential assays 117
2.4.1 DTT 118
The DTT assay measures the presence of reactive oxygen species via formation of the DTT-119
disulfide due to transfer electrons from DTT to ROS by recycling chemicals such as quinones 120
(Cho et al., 2005). Typically compounds which react in this assay are organic species (e.g. 121
quinones), but previous studies have shown that transition metals can also oxidize DTT 122
(Charrier and Anastasio, 2012; Lin and Yu, 2011) 123
In brief, aliquots of PM2.5 water-reconstituted methanol and water extracts were incubated 124
with DTT (Sigma, Zwijndrecht). The reaction was stopped at designated time points (0, 10, 125
20, 30 minutes), adding 5,5′-Dithiobis(2-nitrobenzoic acid) (DTNB) (Sigma, Zwijndrecht). 126
The absorbance at 412 nm is recorded, and the rates are calculated using linear regression of 127
the data as seen from a plot of absorbance against time. The results are expressed as nmol 128
DTT/min per sampled volume or per µg of PM. Domestic oil burning furnace (DOFA, 129
obtained from US EPA, RTP, NC) with a fixed concentration was used as a positive control 130
and ultrapure water as a negative control 131
2.4.2 Ascorbate (AA) depletion assay 132
The AA assay is a simplified version of the synthetic respiratory tract lining fluid (RTFL) 133
assay (Zielinski et al., 1999), where only ascorbate acid is used. This assay can be used to 134
quantify the transition metal-based redox activities, but has also shown to be sensitive to 135
quinones (Roginsky et al., 1999). 136
AA analysis was performed according to the protocol by Mudway et al. (2011), but 137
TraceSELECT ultrapure water was used instead of Chelex-resin treated water. Briefly, PM 138
extracts are incubated in the spectrophotometer (spectraMAX 190: Molecular Devices, 139
Sunnyvale, USA) for 10 min at 37 °C. After adding ascorbate acid, the absorption at 265 nm 140
is measured every 2 min for 2 hours. The 96-wells plate is auto shaken for 3 seconds before 141
each measurement. The maximum depletion rate of ascorbic acid is determined by linear 142
regression of the linear section data, plotted as absorbance against time. The results are 143
expressed as nmol/s of max AA depletion per sampled volume or per µg of PM. Domestic oil 144
burning furnace (DOFA obtained from US EPA, RTP, NC) with a fixed concentration was 145
used as a positive control and ultrapure water as a negative control 146
MANUSCRIP
T
ACCEPTED
ACCEPTED MANUSCRIPT
2.4.3 ESR 147
Two different ESR measurements approaches were applied, one for the different filter extracts 148
and an improved method for the quartz fibre filters without any extraction procedure (ESR-149
direct). Both approaches are based on the trapping of PM induced (hydroxyl radicals) OH• 150
mainly generated via Fenton-type reaction in presence of H2O2 and 5,5-dimethyl-1-pyrroline-151
N-oxide (DMPO) as spin trap. Transition metals are especially sensitive to H2O2 oxidation 152
and generation of OH-radical. 153
The preparation and analyses of the extracted filter samples were done according to the 154
method by Shi et al. (2003b) without the described filtering step of the sample after 155
incubation and prior the ESR analyses. Briefly, PM suspensions are mixed with the chemical 156
ingredients (H2O2 and DMPO), followed by incubation for 15 minutes at 37 °C in a heated 157
shaking water bath prior to ESR analysis. The ESR quantification was conducted with the 158
Analysis Software (2.0 or higher, Magnettech GmbH, Berlin) on first derivation of ESR 159
signals of DMPO–OH quartet as the average of total amplitudes and expressed in arbitrary 160
units (A.U.), expressed per sampled volume or per µg of PM. Tempol (4-hydroxy-2,2,6,6-161
tetramethylpiperidinyloxy) was used as an internal standard, and CuSO4 as a positive control. 162
2.4.4 CRAT assay 163
The chemiluminescence reaction of acridinium ester under slightly basic conditions forms the 164
basis of the CRAT assay. ROS production is measured from the interaction of reductants and 165
oxidants (Zomer et al., 2011). The CRAT assay uses DTT as the reducing agent leading to 166
formation of hydrogen peroxide, which in turn reacts with acridinium ester after addition of a 167
buffer. The light emitted during this reaction is measured for about 1 second with 168
luminescence meter. This assay is sensitive to oxidants such as ferric or cupric ions or organic 169
species (e.g. quinones). 170
Briefly, 50 µL of sample with known concentration is incubated with 50 µL of 10 mM DTT 171
for 10 minutes at 438 rpm in the plate reader. After incubation, 30 µL of acridinium ester (0.5 172
µg/mL in 0.1M HNO3,) is added. The luminescence is measured in the kinetic mode after 173
adding 50 µL 400 mM carbonate buffer pH 9.4 during 1 second. ROS production assay is 174
performed using Mithras LB 940 Luminescence meter (Berthold) and 96 white micro plates. 175
During the measurement the 1,2-Naphtoquinone (NQ) is used as calibration line. The results 176
are quantified as equivalent of 1,2-Naphtoquinone per sample PM mass (pmol NQ/µg). 9,10-177
Phenanthrenequinone is used for quality control. 178

MANUSCRIP
T
ACCEPTED
ACCEPTED MANUSCRIPT
A more detailed methodology description of the assays is provided in the Supplement 179
Information (SI). 180
2.5 Statistical analysis 181
Correlations for each OP method for different extraction methods and filter types were 182
calculated using Spearman rank correlation coefficient (rS). p < 0.05 was considered 183
statistically significant. We did not differentiate between sampling site and sampling day due 184
to too few data points. The paired sample t-test was used to examine whether filter type and 185
extraction solvent differed significantly for each OP method. 186
3 Results and discussion 187
To investigate measurement precision, CVs for all duplicates used for OP analysis were 188
calculated (See Table 1). Quartz filter extracts gave generally the highest CV values (15 – 189
38%), and the water extracted PM from Teflon filters the lowest (8 – 22%). The DTT and 190
CRAT assay gave respectively the lowest and highest CV values. Corresponding CV values 191
of the PM mass concentrations are shown in SI Table S 2. 192
3.1 Quartz filter versus Teflon filter 193
To our knowledge, no study has been published on the effect of filter type on oxidative 194
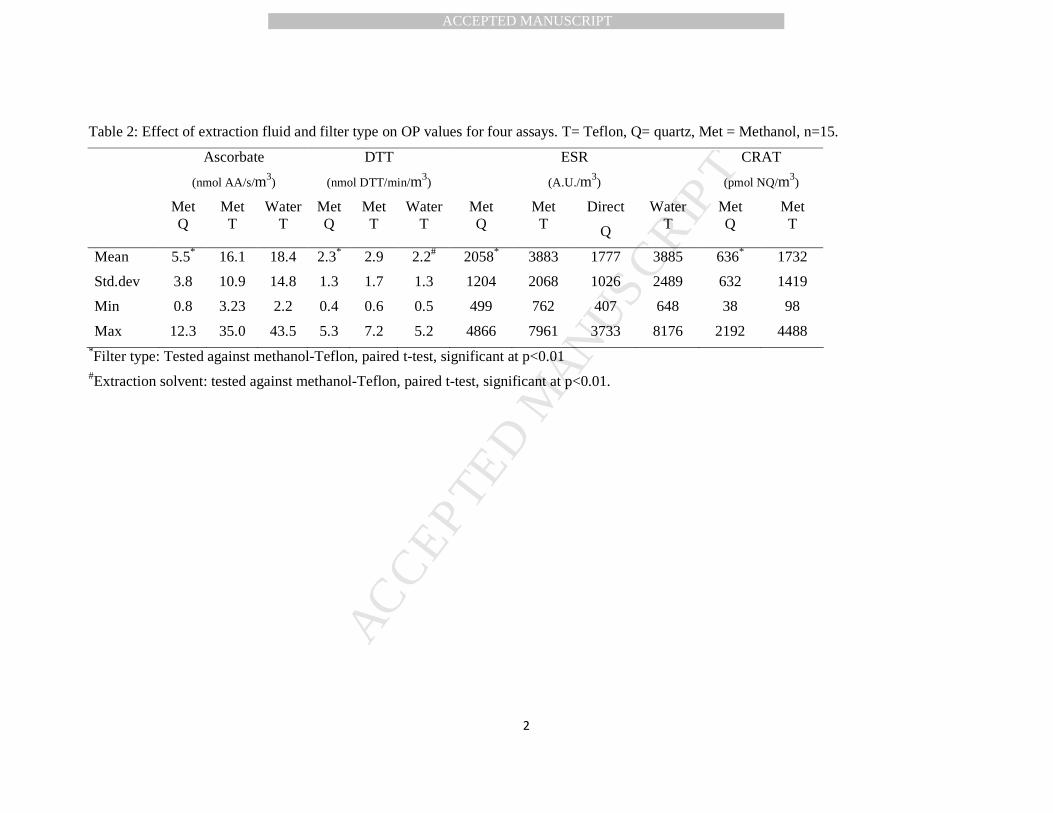
potential of PM2.5. Irrespective of assay type, OP/m3 values from quartz filters were 195
significantly lower than those from Teflon filters (see Table 2). The AA and CRAT assay 196
showed the largest difference in OP values, as the average OPCRAT/m3 and OPAA/m3 for quartz 197
filters was 63% and 66% lower respectively. The DTT assay yielded the lowest decrease 198
(21%) in OP values, while OPESR/m3 was 47% lower for quartz filters. 199
The attenuation of the OP values for the metal-driven assays (AA and ESR) might suggest 200
lower extraction efficiency of the OP reactive components from the quartz filters compared to 201
Teflon filters. OP values from the DTT assay were less affected, indicating that reactive 202
components for this assay (e.g. organic species) were readily extracted from the quartz filters. 203
The filtering of the quartz filters extracts, which was inevitable due to the high amount of 204
quartz fibres, also led to removal of insoluble PM species. This might have contributed further 205
to the attenuation of the OP values. Yet, as seen in Table 3 and Figure 1, we found high 206
correlations between OP values derived from Teflon and those from quartz filters. This 207
suggests that the choice of sample collection media may have a profound effect on the 208

MANUSCRIP
T
ACCEPTED
ACCEPTED MANUSCRIPT
absolute value for each OP assay, but not on the relative measure of OP reactivity for these 209
four assays. 210
3.2 Methanol extracts versus water extracts 211
We only observed a significant effect of the choice of extraction solvent for the DTT assay (p 212
<0.01, paired t-test), with a lower OPDTT/m3 for the water extracts. Water extracts were not 213
analysed with the CRAT assay. As mentioned in section 2.2, we did not perform water 214
extraction on quartz filters, thus the comparison has only been done for Teflon extracts. 215
Several studies assessed the choice of extraction solvent on OP assessment. Eiguren-216
Fernandez et al. (2010) compared the DTT activity of ambient PM with two extraction 217
methods for Teflon filters; dichloromethane extraction including filtering and water 218
extraction. They found the water extracts to be over an order of magnitude more reactive than 219
the dichloromethane extracts (Eiguren-Fernandez et al., 2010). Verma et al. (2012) measured 220
the DTT consumption of water and methanol PM2.5 extracts from quartz filters Both extracts 221
were filtered, but the methanol extract still produced significantly higher DTT reactivity 222
(expressed per µg of PM mass) than the water extract (Verma et al., 2012). Moreover, 223
Rattanavara et al. (2011) also tested out the difference in extraction solvent for the DTT assay, 224
and found for 1,4-Naphtoquinone, a greater DTT consumption when extracted with methanol 225
compared to water. Methanol and dichloromethane have similar extraction properties, but the 226
former has higher polarity and is therefore also able to extract the hydrophilic compounds in 227
addition to the hydrophobic organic components. Since we also did not filter the methanol 228
extracts, the methanol-insoluble components are also retained. Daher et al. (2011) examined 229
the DTT activity for different sampling methods and reported the highest OPDTT/mg for the 230
Biosampler, which is considered most efficient in collecting both the insoluble and soluble 231
PM species. Consistent with our results, this suggests that the use of methanol to retrieve DTT 232
reactive components might be more efficient than using water. 233
The choice of extraction solvent had no significant effect on the ESR and AA assay, showing 234
that the OP reactive components (i.e. water-soluble transition metals) are equally effectively 235
extracted with water as with methanol. 236
We also used ESR to assess OP for quartz filters without the extraction step (ESR-direct), 237
which shortened analysis time. ESR-direct had the lowest OP values among the ESR assays. 238
This might be caused by the fact that not all components are available for reacting with H2O2 239
(and subsequently DMPO). Despite the attenuation of the ESR-direct signal, the difference in 240

MANUSCRIP
T
ACCEPTED
ACCEPTED MANUSCRIPT
OP between methanol quartz extract and ESR-direct was not significant. More importantly, 241
ESR-direct was very highly correlated with OPESR/m3and OPAA/m3 measured from PM 242
suspensions. This indicates that the ESR-direct may be a promising method to use in future 243
OP studies. 244
3.3 Correlations between OP measurement methods 245
Furthermore, the effect of filter type and extraction solvent between the different OP methods 246
by was explored by calculating Spearman rank correlation coefficient shown in Table 3. 247
Generally, the correlations between different OP values were affected by filter type (lower for 248
quartz) and less so by extraction fluid. As discussed in section 3.1, the filtering of PM 249
suspension of the quartz filters might be one of the reasons for the attenuated OP reactivity. 250
Two of the chosen OP assays, ESR and AA, are mainly sensitive towards the transition metals 251
which trigger the formation of OH radicals (Godri et al., 2009; Shi et al., 2003b), and the 252
strong correlations between OPESR and OPAA confirms this. Similar strong correlations were 253
found for the DTT and CRAT assay, which rely on organic compound-mediated, and the 254
latter also to a certain extent metals (Zomer et al., 2011). To what extent metals influence the 255
DTT reactivity is a complex issue yet to be solved (Charrier and Anastasio, 2012; Lin and Yu, 256
2011). 257
Few inter-assay comparisons have been published so far. A comparison study was done by 258
Künzli et al. (2006) where OP was assessed for water extracted PM2.5 Teflon samples from 20 259
European cities using the ESR with DMPO as spin trap and RTFL assay reporting the AA 260
dependent OP value. A moderate correlation was found (Pearson’s correlation, r = 0.65) 261
between OPESR and OPAA, consistent with our results, although we applied the simplified AA-262
only assay. We observed moderate (rS = 0.63 – 0.69) to very high correlations (rS >0.90) 263
between OPAA/m3and OPESR/m3 for both filter types and extraction solvent, with the highest 264
correlation for Teflon filter extracts. 265
Mudway et al. (2011) compared the DTT, AA depletion from a complex RTFL assay, and the 266
AA-only assay for methanol extracts from TEOM filters. They observed no significant 267
correlations between DTT and the two AA assays as with our results, but found a quantitative 268
association (Pearson’s correlation, r = 0.74) between the simplified AA assay and the AA 269
depletion from RTFL assay (Mudway et al., 2011). 270

MANUSCRIP
T
ACCEPTED
ACCEPTED MANUSCRIPT
We found no significant correlations between OPDTT/m3 and OPAA/m3, or between OPDTT/m3 271
and OPESR/m3. This suggests that a combination of OPDTT and OPESR, or OPDTT and OPAA 272
assay, might provide complementary results regarding their oxidative properties. 273
3.4 Correlations between OP and PM chemical constituents 274
The results of the correlations between PM chemical composition and OP methods are shown 275
in Table 4. Generally, we found no major impact of filter type and choice of extraction fluid 276
on these correlations. 277
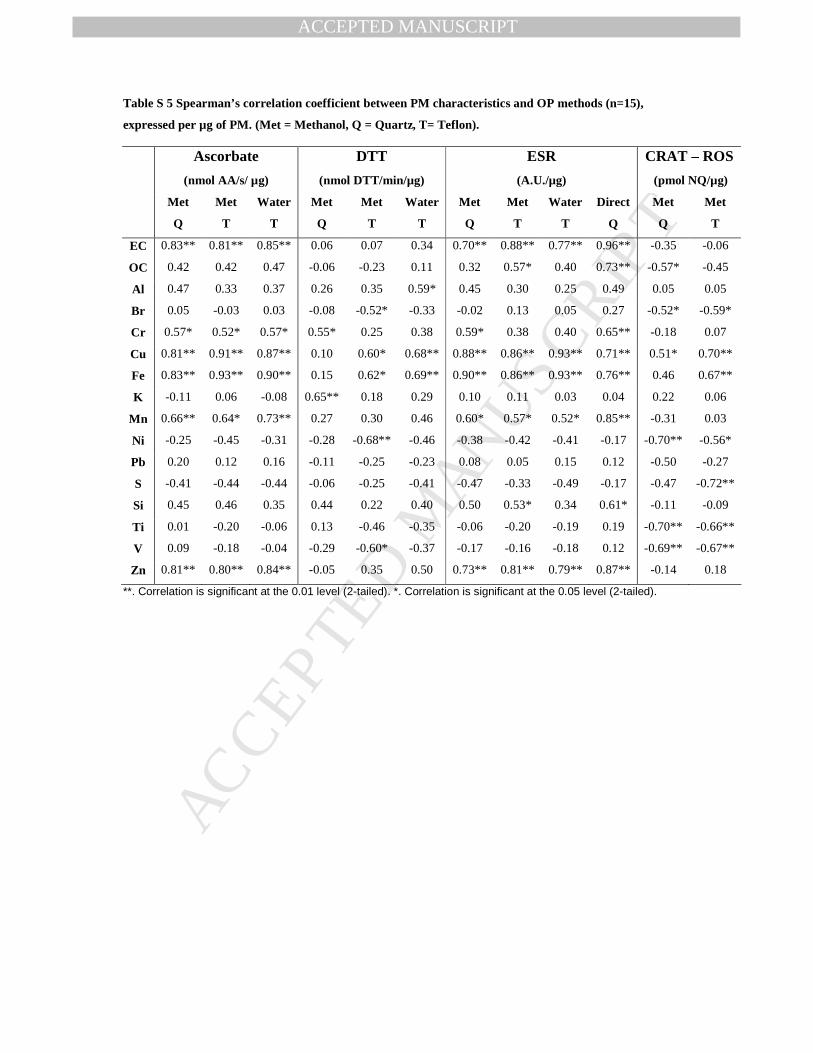
OPESR/m3 and OPAA/m3 were strongly correlated with Cu, Fe, and EC, and moderately with 278
Zn. These correlations were also found when OP is expressed per µg of PM for these two 279
assays (see SI Table S 5). OPESR/m3 and OPAA/m3 were also not correlated with PM mass 280
concentration. High correlations between OPESR, OPAA and the transition metal 281
concentrations are consistent with previous observations (Boogaard et al., 2011; Godri et al., 282
2009; Künzli et al., 2006; Nawrot et al., 2009; Shi et al., 2003b). 283
OPDTT/m3 correlated moderately (rS = 0.61 – 0.68) with Cu, Fe, Mn and Zn, and highly (rS = 284
0.86 -0.96) with K, Br and OC. When expressed per µg of PM, no significant positive 285
correlations were found for the latter, but the correlations with Cu and Fe remained. 286
OPCRAT/m3 correlated moderately to highly (rS = 0.66 – 0.88) to the same elements as 287
OPDTT/m3, with the exception of Mn. Both OPCRAT/m3 and OPDTT/m3 correlated very highly 288
with PM mass concentration. This strong correlation with PM mass concentrations may also 289
have contributed to the high correlations between DTT, CRAT and Br, K, and OC. This is 290
obvious when the correlations are expressed per µg of PM (see SI Table S 5) and the 291
mentioned correlations disappear. As seen in SI Table S 7, DTT normalised by PM mass 292
resulted in low OP variation between the samples, which might have led to the high 293
correlations to PM mass concentrations when expressed per m3. Another reason of the high 294
correlations might be the low sample variation for some of the PM components (see SI Table 295
S 4). 296
The DTT assay has been reported to be predominately reactive towards PM quinone content 297
and insensitive towards metals (Cho et al., 2005). However, recent studies have shown that 298
DTT might be associated with the water-soluble metals, but the overall interactions between 299
DTT and metal ions have proven to be complex (Charrier and Anastasio, 2012; Lin and Yu, 300
2011; Ntziachristos et al., 2007). 301

MANUSCRIP
T
ACCEPTED
ACCEPTED MANUSCRIPT
The PM chemical constituents in our study are derived by ED-XRF, which only provides the 302
total elemental concentrations in the samples. As mentioned earlier, due to pump failure, we 303
did not have enough quartz filters to do elemental analysis for filter comparison. Less detailed 304
information is provided with only ED-XRF, as the redox activities of PM associated elements 305
depend on the chemical speciation and oxidative state of the metals (Shi et al., 2003a). 306
However, the total elemental concentrations do offer an insight, albeit limited, on the 307
interactions between the different OP assays and PM constituents, and also to which extent 308
choice of extraction solvent and filter type affected these correlations. Furthermore, it was not 309
within the scope of our paper to look at the complex interactions between the different OP 310
assays and the various fractions of soluble/insoluble PM components. 311
4 Conclusions 312
We evaluated the effect of the choice of extraction solvent and filter type on four OP assays. 313
Extraction solvent only had a significant effect on OPDTT, but not on OPESR and OPAA. We 314
observed high correlations between OPDTT and OPCRAT, and between OPESR and OPAA. These 315
correlations were affected by filter type and to a lesser extent choice of extraction fluid. OPESR 316
and OPAA were highly correlated with Cu, Fe, Zn and EC, but not with PM mass. OPDTT and 317
OPCRAT were highly correlated with PM mass, OC, Br, K, and S. These correlations were not 318
affected by the choice of filter type and extraction fluid. 319
Despite the difference in extraction procedure, which likely led to the heavy attenuation of the 320
OP values for the quartz filters, we still found strong correlations with OP/m3 values obtained 321
from Teflon filter for each assay, and between the expected assay types. This indicates that 322
the measurement of the relative OP reactivity is not greatly influenced by filter type for the 323
four assays we applied in our study. These findings are promising for exploratory use in 324
monitoring and subsequent epidemiological studies. 325
The ESR direct method, where ROS formation is measured directly on the filter, showed 326
promising results, with high correlations to the ESR results from suspensions. By omitting the 327
extraction step, analysis time is also shortened, which is an advantage for routine monitoring 328
work. 329
330
Acknowledgements 331

MANUSCRIP
T
ACCEPTED
ACCEPTED MANUSCRIPT
We would like to thank John Boere, Paul Fokkens, Daan Leseman from RIVM, Kees 332
Meliefste (IRAS) and Maciej Strak for helping with the sampling campaigns and lab work. 333
We would also like to thank Saskia van der Zee (GGD Amsterdam) for assistance in locating 334
the sampling site in Amsterdam. Lastly, thanks to Astrid John and Mareile Renker (IUTA) 335
for performing the EC/OC analysis. The OPERA project is funded by the RIVM Strategic 336
Research Program (SOR) 337
338
AUTHOR INFORMATION 339
Corresponding Author 340
*Phone: +31 30 2743316; fax: +31 30 2744451; e-mail: [email protected] 341
342
MANUSCRIP
T
ACCEPTED
ACCEPTED MANUSCRIPT
14
REFERENCES
Ayres, J.G., Borm, P., Vincent, C., Donaldson, Ken, Ghio, Andy, Harrison, Roy M, Hider,
Robert, Kelly, Frank, Kooter, Ingeborg M., 2008. Evaluating the Toxicity of Airborne
Particulate Matter and Nanoparticles by Measuring Oxidative Stress Potential—A
Workshop Report and Consensus Statement, Inhalation Toxicology, Informa
Healthcare. Inhalation Toxicology 20, 75–99.
Boogaard, H., Janssen, N.A.H., Fischer, P.H., Kos, G.P.A., Weijers, E.P., Cassee, F.R., van
der Zee, S.C., de Hartog, J.J., Brunekreef, B., Hoek, G., 2011. Contrasts in Oxidative
Potential and Other Particulate Matter Characteristics Collected Near Major Streets
and Background Locations. Environmental Health Perspectives 120, 185–191.
Borm, P.J.A., Kelly, F., Künzli, N., Schins, R.P.F., Donaldson, K., 2007. Oxidant generation
by particulate matter: from biologically effective dose to a promising, novel metric.
Occupational and Environmental Medicine 64, 73–74.
Brunekreef, B., Holgate, S.T., 2002. Air pollution and health. Lancet 360, 1233–1242.
Cavalli, F., Viana, M., Yttri, K.E., Genberg, J., Putaud, J.-P., 2010. Toward a standardised
thermal-optical protocol for measuring atmospheric organic and elemental carbon: the
EUSAAR protocol. Atmospheric Measurement Techniques 3, 79–89.
Charrier, J.G., Anastasio, C., 2012. On dithiothreitol (DTT) as a measure of oxidative
potential for ambient particles: evidence for the importance of soluble \newline
transition metals. Atmospheric Chemistry and Physics 12, 9321–9333.
Cheung, K.L., Ntziachristos, L., Tzamkiozis, T., Schauer, J.J., Samaras, Z., Moore, K.F.,
Sioutas, C., 2010. Emissions of Particulate Trace Elements, Metals and Organic
Species from Gasoline, Diesel, and Biodiesel Passenger Vehicles and Their Relation
to Oxidative Potential. Aerosol Science and Technology 44, 500.
Cho, A.K., Sioutas, C., Miguel, A.H., Kumagai, Y., Schmitz, D.A., Singh, M., Eiguren-
Fernandez, A., Froines, J.R., 2005. Redox activity of airborne particulate matter at
different sites in the Los Angeles Basin. Environmental Research 99, 40–47.
Daher, N., Ning, Z., Cho, A.K., Shafer, M., Schauer, J.J., Sioutas, C., 2011. Comparison of
the Chemical and Oxidative Characteristics of Particulate Matter (PM) Collected by
Different Methods: Filters, Impactors, and BioSamplers. Aerosol Science and
Technology 45, 1294–1304.

MANUSCRIP
T
ACCEPTED
ACCEPTED MANUSCRIPT
15
Delfino, R., Staimer, N., Vaziri, N., 2011. Air pollution and circulating biomarkers of
oxidative stress. Air Quality, Atmosphere & Health 4, 37–52.
Delfino, R.J., Sioutas, C., Malik, S., 2005. Potential Role of Ultrafine Particles in
Associations between Airborne Particle Mass and Cardiovascular Health. Environ
Health Perspect 113, 934–946.
DiStefano, E., Eiguren-Fernandez, A., Delfino, R.J., Sioutas, C., Froines, J.R., Cho, A.K.,
2009. Determination of metal-based hydroxyl radical generating capacity of ambient
and diesel exhaust particles. Inhalation Toxicology 21, 731–738.
Eeftens, M., Tsai, M.-Y., Ampe, C., Anwander, B., Beelen, R., Bellander, T., Cesaroni, G.,
Cirach, M., Cyrys, J., de Hoogh, K., De Nazelle, A., de Vocht, F., Declercq, C.,
Dėdelė, A., Eriksen, K., Galassi, C., Gražulevičienė, R., Grivas, G., Heinrich, J.,
Hoffmann, B., Iakovides, M., Ineichen, A., Katsouyanni, K., Korek, M., Krämer, U.,
Kuhlbusch, T., Lanki, T., Madsen, C., Meliefste, K., Mölter, A., Mosler, G.,
Nieuwenhuijsen, M., Oldenwening, M., Pennanen, A., Probst-Hensch, N., Quass, U.,
Raaschou-Nielsen, O., Ranzi, A., Stephanou, E., Sugiri, D., Udvardy, O., Vaskövi, É.,
Weinmayr, G., Brunekreef, B., Hoek, G., 2012. Spatial variation of PM2.5, PM10,
PM2.5 absorbance and PM coarse concentrations between and within 20 European
study areas and the relationship with NO2 – Results of the ESCAPE project.
Atmospheric Environment 62, 303–317.
Eiguren-Fernandez, A., Shinyashiki, M., Schmitz, D.A., DiStefano, E., Hinds, W., Kumagai,
Y., Cho, A.K., Froines, J.R., 2010. Redox and electrophilic properties of vapor- and
particle-phase components of ambient aerosols. Environmental Research 110, 207–
212.
Godri, K.J., Duggan, S.T., Fuller, G.W., Baker, T., Green, D., Kelly, F.J., Mudway, I.S.,
2009. Particulate Matter Oxidative Potential from Waste Transfer Station Activity.
Environ Health Perspect 118, 493–498.
http://ec.europa.eu/environment/air/quality/legislation/assessment.htm [WWW Document],
2012. URL http://ec.europa.eu/environment/air/quality/legislation/assessment.htm
(accessed 1.6.13).
Kumagai, Y., Koide, S., Taguchi, K., Endo, A., Nakai, Y., Yoshikawa, T., Shimojo, N., 2002.
Oxidation of Proximal Protein Sulfhydryls by Phenanthraquinone, a Component of
Diesel Exhaust Particles. Chemical Research in Toxicology 15, 483–489.

MANUSCRIP
T
ACCEPTED
ACCEPTED MANUSCRIPT
16
Künzli, N., Mudway, I.S., Götschi, T., Shi, T., Kelly, F.J., Cook, S., Burney, P., Forsberg, B.,
Gauderman, J.W., Hazenkamp, M.E., Heinrich, J., Jarvis, D., Norbäck, D., Payo-Losa,
F., Poli, A., Sunyer, J., Borm, P.J.A., 2006. Comparison of Oxidative Properties, Light
Absorbance, and Total and Elemental Mass Concentration of Ambient PM2.5
Collected at 20 European Sites. Environ Health Perspect 114, 684–690.
Landreman, A.P., Shafer, M.M., Hemming, J.C., Hannigan, M.P., Schauer, J.J., 2008. A
Macrophage-Based Method for the Assessment of the Reactive Oxygen Species
(ROS) Activity of Atmospheric Particulate Matter (PM) and Application to Routine
(Daily-24 h) Aerosol Monitoring Studies. Aerosol Science and Technology 42, 946.
Li, N., Sioutas, C., Cho, A., Schmitz, D., Misra, C., Sempf, J., Wang, M., Oberley, T.,
Froines, J., Nel, A., 2002. Ultrafine Particulate Pollutants Induce Oxidative Stress and
Mitochondrial Damage. Environ Health Perspect 111, 455–460.
Lin, P., Yu, J.Z., 2011. Generation of Reactive Oxygen Species Mediated by Humic-like
Substances in Atmospheric Aerosols. Environ. Sci. Technol. 45, 10362–10368.
Mudway, I., Fuller, G.W., Green, D., Dunster, C., Kelly, F.J., 2011. Report: Quantifying the
London Specific Component of PM10 Oxidative Activity - Defra, UK. Defra -
Department of Environment Food and Rural Affairs.
Mudway, I.S., Stenfors, N., Duggan, S.T., Roxborough, H., Zielinski, H., Marklund, S.L.,
Blomberg, A., Frew, A.J., Sandström, T., Kelly, F.J., 2004. An in vitro and in vivo
investigation of the effects of diesel exhaust on human airway lining fluid
antioxidants. Archives of Biochemistry and Biophysics 423, 200–212.
Nawrot, T.S., Kuenzli, N., Sunyer, J., Shi, T., Moreno, T., Viana, M., Heinrich, J., Forsberg,
B., Kelly, F.J., Sughis, M., Nemery, B., Borm, P., 2009. Oxidative properties of
ambient PM2.5 and elemental composition: Heterogeneous associations in 19
European cities. Atmospheric Environment 43, 4595–4602.
Nel, A., 2005. Air Pollution-Related Illness: Effects of Particles. Science 308, 804–806.
Ntziachristos, L., Froines, J.R., Cho, A.K., Sioutas, C., 2007. Relationship between redox
activity and chemical speciation of size-fractionated particulate matter. Part Fibre
Toxicol 4, 5–5.
Pope III, C.A., Dockery, D.W., 2006. Health effects of fine particulate air pollution: Lines
that connect. Journal of the Air and Waste Management Association 56, 709–742.

MANUSCRIP
T
ACCEPTED
ACCEPTED MANUSCRIPT
17
Rattanavaraha, W., Rosen, E., Zhang, H., Li, Q., Pantong, K., Kamens, R.M., 2011. The
reactive oxidant potential of different types of aged atmospheric particles: An outdoor
chamber study. Atmospheric Environment 45, 3848–3855.
Roginsky, V.A., Barsukova, T.K., Stegmann, H.B., 1999. Kinetics of redox interaction
between substituted quinones and ascorbate under aerobic conditions. Chemico-
Shi, T., Knaapen, A., Begerow, J., Birmili, W., Borm, P., Schins, R., 2003a. Temporal
variation of hydroxyl radical generation and 8-hydroxy-2’-deoxyguanosine formation
by coarse and fine particulate matter. Occup Environ Med 60, 315–321.
Shi, T., Schins, R., Knaapen, A., Kuhlbusch, T., Pitz, M., Heinrich, J., Borm, P., 2003b.
Hydroxyl radical generation by electron paramagnetic resonance as a new method to
monitor ambient particulate matter composition. J. Environ. Monitor. 5, 550.
Verma, V., Pakbin, P., Cheung, K.L., Cho, A.K., Schauer, J.J., Shafer, M.M., Kleinman,
M.T., Sioutas, C., 2011. Physicochemical and oxidative characteristics of semi-
volatile components of quasi-ultrafine particles in an urban atmosphere. Atmospheric
Environment 45, 1025–1033.
Verma, V., Rico-Martinez, R., Kotra, N., King, L., Liu, J., Snell, T.W., Weber, R.J., 2012.
Contribution of Water-Soluble and Insoluble Components and Their
Hydrophobic/Hydrophilic Subfractions to the Reactive Oxygen Species-Generating
Potential of Fine Ambient Aerosols. Environ. Sci. Technol. 46, 11384–11392.
Yamaguchi, S., Kishikawa, N., Ohyama, K., Ohba, Y., Kohno, M., Masuda, T., Takadate, A.,
Nakashima, K., Kuroda, N., 2010. Evaluation of chemiluminescence reagents for
selective detection of reactive oxygen species. Analytica Chimica Acta 665, 74–78.
Zielinski, H., Mudway, I.S., Bérubé, K.A., Murphy, S., Richards, R., Kelly, F.J., 1999.
Modeling the interactions of particulates with epithelial lining fluid antioxidants.
American Journal of Physiology - Lung Cellular and Molecular Physiology 277, L719
–L726.
Zomer, B., Collé, L., Jedyńska, A., Pasterkamp, G., Kooter, I., Bloemen, H., 2011.
Chemiluminescent reductive acridinium triggering (CRAT)—mechanism and
applications. Analytical and Bioanalytical Chemistry 401, 2945–2954.
MANUSCRIP
T
ACCEPTED
ACCEPTED MANUSCRIPT
Figure 1 Association between extraction methods and filter types for the different OP assays
normalised by sampled volume. Correlation analysis from this figure is given in Table 3.
Removing the outliner for CRAT assay results in an rS=0.90.

MANUSCRIP
T
ACCEPTED
ACCEPTED MANUSCRIPT
1
TABLES
Table 1 Coefficient of variation (CV) values for filter duplicates used in the different OP methods, expressed as OP/m3. (Met = Methanol, Q = quartz, T = Teflon).
Ascorbate
(nmol AA/s/m3)
DTT
(nmol DTT/min/m3)
ESR
(A.U./m3)
CRAT
(pmol NQ/m3)
Met
Q
Met
T
Water
T
Met
Q
Met
T
Water
T
Met
Q
Met
T
Water
T
Direct
Q
Met
Q
Met
T
Duplicates 14a 15 15 14a 15 15 14a 15 15 14c 14a 15
CV (%) 22 21 17 15 11 9 19 29b 22 29 36 22
a Filter omitted from calculations due to technical problems during sampling. b High CV caused by one poor duplicate with an individual CV of 82%; without this duplicate, the CV decreases to 13%. c One ESR signal was below detection limit.
MANUSCRIP
T
ACCEPTED
ACCEPTED MANUSCRIPT
2
Table 2: Effect of extraction fluid and filter type on OP values for four assays. T= Teflon, Q= quartz, Met = Methanol, n=15.
Ascorbate
(nmol AA/s/m3)
DTT
(nmol DTT/min/m3)
ESR
(A.U./m3)
CRAT
(pmol NQ/m3)
Met Q
Met T
Water T
Met Q
Met T
Water T
Met Q
Met T
Direct
Q
Water T
Met Q
Met T
Mean 5.5* 16.1 18.4 2.3* 2.9 2.2# 2058* 3883 1777 3885 636* 1732
Std.dev 3.8 10.9 14.8 1.3 1.7 1.3 1204 2068 1026 2489 632 1419
Min 0.8 3.23 2.2 0.4 0.6 0.5 499 762 407 648 38 98
Max 12.3 35.0 43.5 5.3 7.2 5.2 4866 7961 3733 8176 2192 4488 *Filter type: Tested against methanol-Teflon, paired t-test, significant at p<0.01 #Extraction solvent: tested against methanol-Teflon, paired t-test, significant at p<0.01.

MANUSCRIP
T
ACCEPTED
ACCEPTED MANUSCRIPT
3
Table 3 Spearman’s correlation coefficient between OP methods, the lower shaded area is expressed per m3 and the upper part is expressed per µg. (n=15)
Ascorbate DTT ESR CRAT
Methanol Quartz
Methanol Teflon
Water Teflon
Methanol Quartz
Methanol Teflon
Water Teflon
Methanol Quartz
Methanol Teflon
Water Teflon
ESR Direct
Methanol Quartz
Methanol Teflon
Methanol Quartz
0.94** 0.96** 0.04 0.53* 0.60* 0.92** 0.86** 0.88** 0.90** 0.10 0.36
Methanol Teflon
0.94** 0.96** 0.03 0.61* 0.63* 0.93** 0.94** 0.93** 0.88** 0.22 0.51* Ascorbate
Water Teflon
0.93** 0.95** 0.03 0.54* 0.62* 0.89** 0.87** 0.91** 0.91** 0.14 0.45
Methanol Quartz
0.30 0.21 0.27 0.36 0.48 0.20 -0.07 0.00 0.09 0.23 0.08
Methanol Teflon
0.41 0.36 0.36 0.88** 0.72** 0.61* 0.50 0.49 0.40 0.61* 0.50 DTT
Water Teflon
0.31 0.27 0.30 0.91** 0.97** 0.62* 0.58* 0.58* 0.55* 0.49 0.56*
Methanol Quartz
0.69** 0.63* 0.66** 0.79** 0.81** 0.80** 0.87** 0.93** 0.83** 0.31 0.54*
Methanol Teflon
0.88** 0.91** 0.94** 0.38 0.49 0.44 0.76** 0.94** 0.87** 0.19 0.46
Water Teflon
0.93** 0.95** 0.96** 0.34 0.46 0.41 0.75** 0.97** 0.81** 0.29 0.60* ESR
ESR Direct
0.94** 0.91** 0.94** 0.29 0.34 0.28 0.69** 0.90** 0.91** -0.10 0.17
Methanol Quartz
0.39 0.36 0.37 0.91** 0.93** 0.93** 0.85** 0.52* 0.48 0.35 0.70**
CRAT Methanol
Teflon 0.53* 0.56* 0.53* 0.63* 0.82** 0.81** 0.83** 0.64** 0.67** 0.51* 0.78**
**. Correlation is significant at the 0.01 level (2-tailed). *. Correlation is significant at the 0.05 level (2-tailed).

MANUSCRIP
T
ACCEPTED
ACCEPTED MANUSCRIPT
4
Table 4 Spearman’s correlation coefficient between PM characteristics and OP methods (n=15), expressed per m3. (Met = Methanol, Q = Quartz, T= Teflon).
Ascorbate DTT ESR CRAT
(nmol AA/s/m3) (nmol DTT/min/m3) (A.U./m3) (pmol NQ/m3)
Met Q
Met T
Water T
Met Q
Met T
Water T
Met Q
Met T
Water T
Direct
Q Met Q
Met T
Mass Teflon 0.27 0.22 0.23 0.85** 0.95** 0.97** 0.72** 0.35 0.34 0.16 0.90** 0.78**
Mass quartz 0.29 0.25 0.26 0.85** 0.97** 0.98** 0.75** 0.37 0.38 0.20 0.91** 0.80**
EC 0.88** 0.86** 0.93** 0.38 0.35 0.32 0.70** 0.93** 0.90** 0.87** 0.41 0.46
OC 0.19 0.13 0.24 0.88** 0.95** 0.96** 0.80** 0.35 0.40 0.18 0.88** 0.76**
Al 0.43 0.25 0.39 0.80** 0.74** 0.72** 0.64** 0.35 0.35 0.39 0.69** 0.41
Br 0.29 0.27 0.33 0.77** 0.86** 0.88** 0.63* 0.41 0.39 0.19 0.79** 0.73**
Cr 0.30 0.25 0.29 0.57* 0.41 0.46 0.51 0.29 0.31 0.34 0.33 0.29
Cu 0.83** 0.80** 0.88** 0.62* 0.66** 0.63* 0.89** 0.91** 0.91** 0.83** 0.70** 0.73**
Fe 0.80** 0.79** 0.86** 0.63* 0.68** 0.64* 0.89** 0.89** 0.89** 0.81** 0.69** 0.74**
K 0.26 0.25 0.26 0.82** 0.87** 0.90** 0.71** 0.40 0.38 0.23 0.82** 0.79**
Mn 0.65** 0.51 0.59* 0.67** 0.65** 0.61* 0.69** 0.54* 0.54* 0.65** 0.55* 0.43
Ni -0.34 -0.50 -0.38 0.15 0.13 0.20 -0.16 -0.41 -0.44 -0.40 0.01 -0.11
Pb 0.39 0.48 0.47 0.33 0.56* 0.54* 0.36 0.54* 0.51 0.25 0.48 0.52*
S -0.15 -0.19 -0.21 0.72** 0.70** 0.78** 0.39 -0.13 -0.10 -0.23 0.70** 0.39
Si 0.34 0.21 0.31 0.56* 0.41 0.40 0.56* 0.36 0.37 0.41 0.50 0.35
Ti -0.08 -0.18 -0.08 0.34 0.09 0.20 0.09 -0.13 -0.20 -0.12 0.05 -0.09
V -0.21 -0.33 -0.25 -0.05 -0.10 -0.05 -0.29 -0.31 -0.37 -0.33 -0.15 -0.28
Zn 0.63* 0.63* 0.75** 0.63* 0.68** 0.67** 0.76** 0.79** 0.83** 0.66** 0.69** 0.66** **. Correlation is significant at the 0.01 level (2-tailed). *. Correlation is significant at the 0.05 level (2-tailed).

MANUSCRIP
T
ACCEPTED
ACCEPTED MANUSCRIPT

MANUSCRIP
T
ACCEPTED
ACCEPTED MANUSCRIPT
Highlights:
• We examined effects of filter type and extraction solvent on oxidative potential (OP). • Extraction solvent had a significant effect on OPDTT, but not on OPESR or OPAA. • OP values measured from quartz filter extracts were heavily attenuated for all assays. • However, OP values from quartz filters were highly correlated with those from Teflon. • OP measured with ESR direct method showed promising results.

MANUSCRIP
T
ACCEPTED
ACCEPTED MANUSCRIPT
Measurement of the oxidative potential of PM2.5
and its constituents: The effect of extraction
solvent and filter type
Aileen Yang a,b*, Aleksandra Jedynska c, Bryan Hellack d, Ingeborg Kooter c, Gerard Hoek b,
Bert Brunekreef b,e, Thomas AJ Kuhlbusch d,f, Flemming R Cassee a,b, Nicole AH Janssen b
a National Institute for Public Health and the Environment (RIVM), Bilthoven, the
Netherlands;
b Institute for Risk Assessment Sciences, Division Environmental Epidemiology, Utrecht
University, Utrecht, the Netherlands;
c The Netherlands Organisation for Applied Scientific Research (TNO), Utrecht, the
Netherlands;
d Air Quality & Sustainable Nanotechnology, Institute of Energy and Environmental
Technology (IUTA) e.V., Duisburg, Germany;
e Julius Center for Health Sciences and Primary Care, University Medical Center Utrecht,
Utrecht, the Netherlands
f CENIDE, University Duisburg-Essen, Duisburg, Germany
Supporting Information
Number of Pages 8
Number of Tables 7

MANUSCRIP
T
ACCEPTED
ACCEPTED MANUSCRIPT
Table S 1 Overview of the filter allocation for the OP assays.
Teflon filters Quartz filters
Methanol extraction
AA+ DTT 2 (duplicate) 2 (duplicate)
CRAT + ESR 2 (duplicate) 2 (duplicate)
Water extraction
AA+DTT 2 (duplicate)
ESR 2 (duplicate)
Non-extracted
ESR- direct 2 (duplicate)
XRF 2 (duplicate)
EC/OC 2 (duplicate)
Note: + indicates analysis from same filter
Table S 2 Coefficient of variation (CV) for mass concentration of the filters used in the different OP
methods. AA and DTT used the same set of filter duplicates, while ESR and CRAT were analysed using
another set of filter duplicates. (Met = Methanol, Q = Quartz, T = Teflon).
AA/DTT
(µg /m3)
ESR/CRAT
(µg/m3)
Met
Q
Met
T
Water
T
Direct
Q
Met
T
Met
Q
Duplicates 14* 15 15 15 15 14*
CV (%) 19 4 3 8 6 9
*Filter omitted from calculations due to technical problems during sampling.

MANUSCRIP
T
ACCEPTED
ACCEPTED MANUSCRIPT
Protocol for OP assays
DTT
PM2.5 extracts from Teflon filters were diluted with traceSELECT ultrapure water (Sigma,
Zwijndrecht, Netherlands) to a standard of 500µg/mL. The quartz filter sample extracts are
each diluted with 1 mL ultrapure water. The incubation volume is 500µL. All PM samples are
analysed in duplicates. Domestic oil burning furnace (DOFA obtained from US EPA, RTP,
NC) was used as a positive control and ultrapure water as a negative control.
For every sample, 100µL of 0.5M potassium phosphate buffer (pH 7.4), 10µL PM-stock (for
Teflon and quartz) are added to a 1.5mL Eppendorf vial. The solution is then incubated for 10
minutes at 37°C before adding 50µL 1mM DTT (DL-Dithiothreithol, Sigma, Zwijndrecht) to
start the reaction. At designated time points (0, 10, 20 and 30 minutes), 50µL of the reaction
mixture is withdrawn from the tubes and added into a precooled vial containing 50µL icecold
10% TCA (Trichloroacetic acid ACS reagent, Sigma, Zwijndrecht, Netherlands). 200µL of
2mL Tri-HCl containing 50µl DTNB-stock (5,5′-Dithiobis(2-nitrobenzoic acid), Sigma,
Zwijndrecht) is then added into the cold Eppendorf containing the stopped reaction mixture.
The solution is mixed using a vortex before 250µL is transferred to the dedicated well on the
96 wells plate. The absorbance at 412nm is recorded on the spectrophotometer
(SpectraMax190). The rate of DTT consumption, here considered as the OP, is calculated
using linear regression of the data in the linear range as seen from a plot of absorbance against
time. The results are expressed as nmol DTT/min per sampled volume (m3) or per PM mass
(µg).
AA
PM derived from Teflon filters are diluted to a concentration of 12.5 µg/mL in ultrapure
water. After dilution, aliquots of 160 µL of PM sample are added to a 96-well flat-bottomed
UV plates (UV-star: VWR, Breda, Netherlands) in quadruplicate. The quartz filter sample
extracts are each diluted with 1 mL ultrapure water, then 20µL of the samples are added to the
UV-plate. The final incubation volume for both filter types is 200 µL.

MANUSCRIP
T
ACCEPTED
ACCEPTED MANUSCRIPT
160 µL of ultrapure water is used as the negative control, and 160 µL of Domestic oil burning
furnace (DOFA) suspension, in the same concentration as the samples, as the positive control.
The samples are incubated in the spectrophotometer (spectraMAX 190: Molecular Devices,
Sunnyvale, USA) for 10 min at 37 °C, the optimal temperature for the depletion of ascorbic
acid. After incubation, 20 µl of 2mM ascorbic acid is added, and the absorption at 265 nm
measured every 2 min for 2 hours. The 96-wells plate is auto shaken for 3 seconds before
each measurement.
ESR
DMPO (5.5-dimethyl-pyrrolineN-oxide) and Tempol (4-hydroxy-2,2,6,6-
tetramethylpiperidinyloxy) were purchased from Alexis (Switzerland). All other reagents, like
hydrogen peroxide (H2O2), Cu(II)SO4, Ni(II)SO4, Fe(II)SO4, Fe(III)SO4 and the BCR 723
Road Dust (all solid) were purchased from Sigma-Aldrich (Germany). DMPO and H2O2 was
prepared and used in a chloride and calcium free phosphate Buffer (PBS, Sigma-Aldrich).
Filter extracts (Teflon and quartz) or quartz filters (ESR direct) are directly placed in a vessel,
completely covered by the chemical ingredients (DMPO, H2O2 and dH2O) and agitated by a
vortexer for 30 seconds before being placed in a heating shaking water bath for incubation at
37 °C for 15 minutes. After incubation, the suspension is vortexed again for 15 seconds, then
transferred into a 50 µl glass capillary without any filtration. The DMPO-OH quartet signal is
measured with a MS-300 ESR spectrometer (Magnettech, Berlin, Germany). The following
ESR settings at room temperature were used for all measurements: magnetic field: 3.365 G,
sweep width: 100 G, scan time: 30 s, number of scans: 3, modulation amplitude: 2 G, receiver
gain: 1.000.
Quantification was carried out on first derivation of EPR signal of DMPO–OH quartet as
average of total amplitudes of the four peaks in arbitrary units (A.U.). As blank, a mixture of
deionised water (dH2O), H2O2 and DMPO (plus a blank filter) were used and a limit of
detection (LOD) was calculated for each experiment as mean of n blank value plus threefold
standard deviation (SD) of the blank.

MANUSCRIP
T
ACCEPTED
ACCEPTED MANUSCRIPT
Table S 3 PM components above the LOD and their corresponding CV values .
Component LOD
(ng)
< LOD
(n)
CV
(%)
Al 0.00 1 8
Br 0.19 0 7
Cr 1.02 0 12
Cu 1.22 0 5
Fe 3.57 0 6
K 5.09 0 6
Mn 1.17 0 4
Ni 0.60 1 18
Pb 0.00 0 5
S 0.00 0 6
Si 61.00 0 19
Ti 2.24 0 21
V 0.35 0 19
Zn 8.34 0 5

MANUSCRIP
T
ACCEPTED
ACCEPTED MANUSCRIPT
Table S 4 Summary of the XRF values for PM elements. n= 15 for all except EC/OC where n = 13.
per m3 per µg of PM
Mean
Std.
Deviation Min Max Mean
Std.
Deviation Min Max
Al 19.89 11.91 0.00 43.54 1.20 0.65 0.00 2.65
Br 3.87 1.91 1.59 8.91 0.25 0.04 0.18 0.33
Cr 2.13 1.00 0.52 4.15 0.15 0.12 0.06 0.54
Cu 11.55 6.91 1.40 22.07 0.73 0.47 0.18 1.74
Fe 266.77 149.72 37.79 499.87 17.15 10.11 5.43 39.84
K 110.15 78.22 30.32 346.95 6.51 1.68 3.96 9.05
Mn 6.48 2.40 2.56 11.12 0.45 0.17 0.22 0.76
Ni 1.26 0.94 0.26 3.28 0.10 0.10 0.02 0.36
Pb 7.84 4.46 2.13 18.87 0.53 0.37 0.26 1.77
S 797.69 474.56 311.84 2333.43 52.36 18.22 30.27 86.42
Si 49.98 24.59 8.51 95.70 3.81 3.45 1.28 14.87
Ti 2.99 1.99 1.16 8.09 0.24 0.25 0.06 1.05
V 1.85 1.27 0.32 4.68 0.15 0.15 0.02 0.55
Zn 29.10 12.56 5.86 50.50 1.92 0.79 0.76 3.66
EC 1.54 0.57 0.61 2.31 0.11 0.07 0.03 0.25
OC 3.52 1.45 1.66 7.06 0.23 0.06 0.16 0.33
Mass
Teflon 16.46 8.90 5.21 38.36
Mass
quartz 16.06 9.07 5.13 37.45
MANUSCRIP
T
ACCEPTED
ACCEPTED MANUSCRIPT
Table S 5 Spearman’s correlation coefficient between PM characteristics and OP methods (n=15),
expressed per µg of PM. (Met = Methanol, Q = Quartz, T= Teflon).
Ascorbate
(nmol AA/s/ µg)
DTT
(nmol DTT/min/µg)
ESR
(A.U./µg)
CRAT – ROS
(pmol NQ/µg)
Met
Q
Met
T
Water
T
Met
Q
Met
T
Water
T
Met
Q
Met
T
Water
T
Direct
Q
Met
Q
Met
T
EC 0.83** 0.81** 0.85** 0.06 0.07 0.34 0.70** 0.88** 0.77** 0.96** -0.35 -0.06
OC 0.42 0.42 0.47 -0.06 -0.23 0.11 0.32 0.57* 0.40 0.73** -0.57* -0.45
Al 0.47 0.33 0.37 0.26 0.35 0.59* 0.45 0.30 0.25 0.49 0.05 0.05
Br 0.05 -0.03 0.03 -0.08 -0.52* -0.33 -0.02 0.13 0.05 0.27 -0.52* -0.59*
Cr 0.57* 0.52* 0.57* 0.55* 0.25 0.38 0.59* 0.38 0.40 0.65** -0.18 0.07
Cu 0.81** 0.91** 0.87** 0.10 0.60* 0.68** 0.88** 0.86** 0.93** 0.71** 0.51* 0.70**
Fe 0.83** 0.93** 0.90** 0.15 0.62* 0.69** 0.90** 0.86** 0.93** 0.76** 0.46 0.67**
K -0.11 0.06 -0.08 0.65** 0.18 0.29 0.10 0.11 0.03 0.04 0.22 0.06
Mn 0.66** 0.64* 0.73** 0.27 0.30 0.46 0.60* 0.57* 0.52* 0.85** -0.31 0.03
Ni -0.25 -0.45 -0.31 -0.28 -0.68** -0.46 -0.38 -0.42 -0.41 -0.17 -0.70** -0.56*
Pb 0.20 0.12 0.16 -0.11 -0.25 -0.23 0.08 0.05 0.15 0.12 -0.50 -0.27
S -0.41 -0.44 -0.44 -0.06 -0.25 -0.41 -0.47 -0.33 -0.49 -0.17 -0.47 -0.72**
Si 0.45 0.46 0.35 0.44 0.22 0.40 0.50 0.53* 0.34 0.61* -0.11 -0.09
Ti 0.01 -0.20 -0.06 0.13 -0.46 -0.35 -0.06 -0.20 -0.19 0.19 -0.70** -0.66**
V 0.09 -0.18 -0.04 -0.29 -0.60* -0.37 -0.17 -0.16 -0.18 0.12 -0.69** -0.67**
Zn 0.81** 0.80** 0.84** -0.05 0.35 0.50 0.73** 0.81** 0.79** 0.87** -0.14 0.18
**. Correlation is significant at the 0.01 level (2-tailed). *. Correlation is significant at the 0.05 level (2-tailed).

MANUSCRIP
T
ACCEPTED
ACCEPTED MANUSCRIPT
Table S 6 Spearman correlation coefficients between the chemical composition and other PM characteristics, the lower area is expressed per m3 and the upper
shaded area is expressed per µµµµg of PM (n=15).
Mass Teflon
Mass Quartz EC OC Al Br Cr Cu Fe K Mn Ni Pb S Si Ti V Zn
Mass Quartz 0.99**
EC 0.29 0.29 0.80** 0.29 0.63* 0.62* 0.64* 0.68* -0.01 0.74** 0.01 0.26 -0.09 0.60* 0.53 0.44 0.90**
OC 0.95** 0.95** 0.46 0.38 0.80** 0.40 0.23 0.31 0.18 0.68* 0.29 0.25 0.15 0.59* 0.74** 0.47 0.75**
Al 0.71** 0.71** 0.36 0.69** -0.18 0.37 0.26 0.30 0.04 0.53* 0.06 -0.25 -0.17 0.45 0.23 0.07 0.45
Br 0.93** 0.90** 0.45 0.92** 0.68** 0.18 -0.13 -0.10 0.16 0.20 0.39 0.39 0.35 0.36 0.59* 0.62* 0.19
Cr 0.36 0.33 0.70** 0.68* 0.40 0.35 0.33 0.43 0.26 0.76** 0.11 0.20 -0.08 0.63* 0.40 0.18 0.33
Cu 0.56* 0.57* 0.95** 0.66* 0.59* 0.63* 0.44 0.99** 0.14 0.42 -0.62* 0.00 -0.65** 0.29 -0.39 -0.38 0.69**
Fe 0.56* 0.58* 0.93** 0.69** 0.59* 0.64* 0.50 0.99** 0.17 0.53* -0.57* -0.01 -0.60* 0.33 -0.31 -0.37 0.71**
K 0.90** 0.89** 0.25 0.90** 0.60* 0.85** 0.35 0.56* 0.59* 0.05 -0.41 -0.05 -0.08 0.61* -0.16 -0.42 -0.08
Mn 0.55* 0.56* 0.52 0.55* 0.87** 0.51 0.55* 0.68** 0.70** 0.53* 0.10 0.08 0.02 0.49 0.42 0.11 0.73**
Ni 0.28 0.23 -0.14 0.31 0.31 0.31 0.16 -0.23 -0.25 0.06 0.07 0.28 0.43 -0.15 0.72** 0.78** -0.20
Pb 0.61* 0.60* 0.39 0.53 0.33 0.68** 0.01 0.48 0.45 0.62* 0.29 -0.03 -0.07 -0.02 0.31 0.46 0.24
S 0.80** 0.79** -0.05 0.73** 0.55* 0.63* 0.29 0.10 0.10 0.60* 0.31 0.48 0.29 0.05 0.48 0.34 -0.26
Si 0.33 0.33 0.33 0.42 0.46 0.37 0.25 0.57* 0.56* 0.51* 0.45 -0.05 0.06 0.00 0.18 0.08 0.33
Ti 0.24 0.16 0.44 0.53 0.38 0.29 0.67** 0.03 0.06 0.13 0.32 0.54* -0.08 0.41 -0.09 0.69** 0.14
V 0.07 -0.01 0.06 0.07 0.15 0.19 0.07 -0.20 -0.25 -0.16 -0.08 0.88** 0.01 0.23 -0.07 0.50 0.03
Zn 0.60* 0.61* 0.69** 0.74** 0.63* 0.68** 0.30 0.88** 0.86** 0.68** 0.64** -0.20 0.65** 0.16 0.53* -0.05 -0.26
**. Correlation is significant at the 0.01 level (2-tailed). *. Correlation is significant at the 0.05 level (2-tailed).

MANUSCRIP
T
ACCEPTED
ACCEPTED MANUSCRIPT
Table S 7 Effect of extraction fluid and filter type on OP values for four assays. T= Teflon, Q= quartz, Met = Methanol, n=15.
Ascorbate (nmol AA/s/µµµµg of PM)
DTT (nmol DTT/min/ µµµµg of PM)
ESR (A.U./ µ µ µ µg of PM)
CRAT (pmol NQ/µµµµg of PM)
Met Q
Met T
Water T
Met Q
Met T
Water T
Met Q
Met T
Water T
Direct Q
Met Q
Met T
Mean 0.41 1.14 1.33 0.15 0.17 0.13 133 265 133 267 32 95
Std. dev 0.32 0.95 1.28 0.07 0.04 0.02 55 163 88 201 21 59
Min 0.07 0.22 0.12 0.07 0.11 0.10 66 85 29 76 5 12
Max 1.16 3.24 4.18 0.35 0.23 0.18 249 595 351 760 67 180