
Influence of Solvent on Crystal Nucleation of Risperidone
20
Influence of solvent on crystal nucleation of risperidone† Donal Mealey, a Jacek Zeglinski, * a Dikshitkumar Khamar a and ˚ Ake C. Rasmuson * ab Received 17th November 2014, Accepted 3rd February 2015 DOI: 10.1039/c4fd00223g Over 2100 induction time experiments were carried out for the medium-sized, antipsychotic drug molecule, risperidone in seven different organic solvents. To reach the same induction time the required driving force increases in the order: cumene, toluene, acetone, ethyl acetate, methanol, propanol, and butanol, which reasonably well correlates to the interfacial energies as determined within classical nucleation theory. FTIR spectroscopy has been used to investigate any shifts in the spectra and to estimate the interaction of solute and solvent at the corresponding site. The solution condition has also been investigated by Density Functional Theory (DFT) calculations over (1 : 1) solvent–solute binding interactions at 8 different sites on the risperidone molecule. The DFT computational results agree with the spectroscopic data suggesting that these methods do capture the binding strength of solvent molecules to the risperidone molecule. The difficulty of nucleation correlates reasonably to the DFT computations and the spectroscopic measurements. The results of the different measurements suggest that the stronger the solvent binds to the risperidone molecule in solution, the slower the nucleation becomes. 1. Introduction Crystal nucleation from solution is a key step in crystallization processes and solution crystallization is widely used in the pharmaceutical, food, chemical and agrochemical industries. Crystal nucleation is inuenced by the solvent and within the Classical Nucleation Theory (CNT) framework this is captured in the interfacial energy 1,2 and in the pre-exponential factor. 3 The inuence on the kinetics of nucleation is assumed to be partly related to an inuence on the type and the size of molecular assemblies (clusters) in the solution. Solution struc- turing of solute molecules has been investigated by various spectroscopic a Materials and Surface Science Institute, Chemical and Environmental Science Department, University of Limerick, Limerick, Ireland. E-mail: [email protected]; [email protected]; Tel: +353 61 23 46 17; +353 61 23 41 57 b Department of Chemical Engineering and Technology, KTH Royal Institute of Technology, Stockholm, Sweden † Electronic supplementary information (ESI) available. See DOI: 10.1039/c4fd00223g This journal is © The Royal Society of Chemistry 2015 Faraday Discuss. Faraday Discussions Cite this: DOI: 10.1039/c4fd00223g PAPER Published on 03 February 2015. Downloaded by University of Limerick on 20/04/2015 09:07:05. View Article Online View Journal
Transcript of Influence of Solvent on Crystal Nucleation of Risperidone

Faraday DiscussionsCite this: DOI: 10.1039/c4fd00223g
PAPER
Publ
ishe
d on
03
Febr
uary
201
5. D
ownl
oade
d by
Uni
vers
ity o
f L
imer
ick
on 2
0/04
/201
5 09
:07:
05.
View Article OnlineView Journal
Influence of solvent on crystal nucleationof risperidone†
Donal Mealey,a Jacek Zeglinski,*a Dikshitkumar Khamara
and Ake C. Rasmuson*ab
Received 17th November 2014, Accepted 3rd February 2015
DOI: 10.1039/c4fd00223g
Over 2100 induction time experiments were carried out for the medium-sized,
antipsychotic drug molecule, risperidone in seven different organic solvents. To reach
the same induction time the required driving force increases in the order: cumene,
toluene, acetone, ethyl acetate, methanol, propanol, and butanol, which reasonably well
correlates to the interfacial energies as determined within classical nucleation theory.
FTIR spectroscopy has been used to investigate any shifts in the spectra and to estimate
the interaction of solute and solvent at the corresponding site. The solution condition
has also been investigated by Density Functional Theory (DFT) calculations over (1 : 1)
solvent–solute binding interactions at 8 different sites on the risperidone molecule. The
DFT computational results agree with the spectroscopic data suggesting that these
methods do capture the binding strength of solvent molecules to the risperidone
molecule. The difficulty of nucleation correlates reasonably to the DFT computations
and the spectroscopic measurements. The results of the different measurements
suggest that the stronger the solvent binds to the risperidone molecule in solution, the
slower the nucleation becomes.
1. Introduction
Crystal nucleation from solution is a key step in crystallization processes andsolution crystallization is widely used in the pharmaceutical, food, chemical andagrochemical industries. Crystal nucleation is inuenced by the solvent andwithin the Classical Nucleation Theory (CNT) framework this is captured in theinterfacial energy1,2 and in the pre-exponential factor.3 The inuence on thekinetics of nucleation is assumed to be partly related to an inuence on the typeand the size of molecular assemblies (clusters) in the solution. Solution struc-turing of solute molecules has been investigated by various spectroscopic
aMaterials and Surface Science Institute, Chemical and Environmental Science Department, University of
Limerick, Limerick, Ireland. E-mail: [email protected]; [email protected]; Tel: +353 61 23 46 17; +353
61 23 41 57bDepartment of Chemical Engineering and Technology, KTH Royal Institute of Technology, Stockholm, Sweden
† Electronic supplementary information (ESI) available. See DOI: 10.1039/c4fd00223g
This journal is © The Royal Society of Chemistry 2015 Faraday Discuss.

Faraday Discussions PaperPu
blis
hed
on 0
3 Fe
brua
ry 2
015.
Dow
nloa
ded
by U
nive
rsity
of
Lim
eric
k on
20/
04/2
015
09:0
7:05
. View Article Online
methods (IR,4 Raman,5 NMR,6 UV-visible7) to establish a link with the crystalstructure of the nucleating solid phase. In some cases such a link could beestablished and in others cases not.8,9 In addition to the type of aggregates6,10 inthe solutions, the type of solvent–solute interaction can also dictate themorphology11 as well as the kinetics of nucleation.12 Lohani et al.13 showed thetype of solvent–solute interaction affecting the diffusion coefficient, resulting inthe preferential crystallization of one form over another. The hydrogen bondingcapabilities of a solvent and the nature of interaction prevailing between soluteand solvent resulting in the nucleation of a particular form has also been a subjectof a number of studies.5,14
Application of the CNT framework on experimentally measured nucleationrate data helps to determine the nucleation work and the interfacial energy indifferent solvents. The inuence of solvent on the ease or difficulty of nucleationcan be used to probe the nucleation process on the molecular level. Our previouswork12 on a small molecule, salicylic acid (138.12 g mol�1) reveals the role of thesolvent in the nucleation of this compound. By employing solution calorimetry,vibrational spectroscopy and quantum-chemical calculations over one-to-onesolvent–solute molecule interactions as well as over the complete rst solvationshell, it was consistently observed that the stronger the solvent binds to salicylicacid, the greater is the difficulty of nucleation. On a similar note, the effect ofsolvent was also recently highlighted by Sullivan et al.15 in which the authorssuggest the process of desolvation affects the kinetics of nucleation and thusgoverns the nucleation process. Zhao et al.16 studied the effect of solvent on thecrystallization of nesquehonite (MgCO3$2H2O). They reported faster nucleationkinetics with the addition of dimethyl formamide (DMF) to the water which theyattributed to the kinetic factors accelerating the cluster aggregation in a non-classical mechanism.
In spite of the critical importance of the choice of solvent in solution crystal-lization, there is only a limited amount of nucleation rate data available formedium- to large-sized organic molecules in a range of organic solvents. Much ofthe previously published work is carried out either in one solvent only or forsmall-sized molecules only. The size and complexity of the solute molecule cancertainly add complications to an already complex nucleation process. In thiswork, we use a medium sized (410.49 g mol�1), fairly complex and conforma-tionally exible pharmaceutical molecule (API), risperidone, and use the inu-ence of the solvent as a probe to investigate the mechanisms of nucleation. Theresults are analysed directly without the use of the CNT framework as well aswithin that framework. The strength of solvent–solute interaction is quantiedusing DFT calculations and is examined by solution spectroscopy for particular
Fig. 1 Molecular structure of risperidone.
Faraday Discuss. This journal is © The Royal Society of Chemistry 2015

Paper Faraday DiscussionsPu
blis
hed
on 0
3 Fe
brua
ry 2
015.
Dow
nloa
ded
by U
nive
rsity
of
Lim
eric
k on
20/
04/2
015
09:0
7:05
. View Article Online
interaction sites. The molecular structure of risperidone is shown in Fig. 1. Thereare two reported polymorphs of risperidone and both structures, form I (WASTEP)and form II (WASTEP01) are reported in the Cambridge Structure Database.
2. Materials and methods2.1. Materials
Risperidone (>99.95%), form I, was kindly provided by Janssen Pharmaceuticals,Ireland, and used without further purication. All solvents were purchased fromVWR International; methanol (99.8% purity by volume), 1-propanol (99.8%), 1-butanol (99.8%), ethyl acetate (99.8%), acetone (99.8%), toluene (99.8%), andcumene (99.8%).
2.2. Induction time measurement
The induction time of nucleation of risperidone was measured in seven solventsystems with a saturation temperature of 50 �C. Over 2160 nucleation events wereobserved at 27 different conditions.
Stock solutions were prepared in 500 ml sealed glass bottles by weighingappropriate amounts of risperidone and solvent according to previously pub-lished solubility data.9 An equilibration period of 12 h at 55 �C was allowed, withagitation provided with a PTFE (polytetrauoroethylene) coated magnetic stirrer(38 � 10 mm, 3 � 11 mm pivot ring) at 500 rpm. Solutions were dispensed viapreheated syringes and 0.2 mm solvent compatible lters (PTFE or Nylon), intotwenty 20 ml glass vials (70� 20 mm, VWR International). A magnetic stirring bar(13� 3 mm) was added to each vial prior to sealing with a plastic screw cap with aPTFE seal. Solutions were then subjected to a second equilibration period at 55 �Covernight before the crystallization experiments were performed.
An experimental apparatus identical to that described by Mealey et al.17 wasemployed to simultaneously monitor 20 individual nucleation experiments. Solu-tions were transferred from bath A at 55 �C to bath B held at a temperature wherethe solutions were supersaturated (Tsupersat). Agitationwas provided at 400 rpm via a60 point submersible magnetic stirring plate (2Mag). Immediately aer the trans-fer, the time to nucleate (temperature equilibration time + isothermal nucleationtime) was measured with a high denition video camera observing the transitionfrom a clear to cloudy solution. The approach to temperature equilibrium wasmeasured separately with a control tube of pure solvent and an in situ calibratedtemperature probe (Dostmann P600). Once all tubes had nucleated they weretransferred back to water bath A where complete dissolution occurred and equili-bration was allowed overnight. The cycle was repeated four times until approxi-mately 80 nucleation events were recorded for a given driving force and solvent.
To avoid the possible effects of degradation of the risperidone molecule eachbatch of 20 tubes were subjected to just four temperature cycles. It was observedthat upon extended time at elevated temperature an obvious colour change wouldoccur in the solutions. A new batch of tubes was prepared for each separatedriving force. Along with monitoring solutions visually, aer four cycles solutionswere spotted onto silica gel thin layer chromatography (TLC) plates using meth-anol as a mobile phase and viewed under UV light to ensure there were nodetectable impurities.
This journal is © The Royal Society of Chemistry 2015 Faraday Discuss.

Faraday Discussions PaperPu
blis
hed
on 0
3 Fe
brua
ry 2
015.
Dow
nloa
ded
by U
nive
rsity
of
Lim
eric
k on
20/
04/2
015
09:0
7:05
. View Article Online
Solid samples were isolated by ltration, moments aer nucleation for both anearly nucleation and a late nucleation event, at both high and low driving forces.The polymorphic form was determined by reectance powder X-ray diffraction(PXRD, Philips PANalytical X'Pert MP PRO) in the range 5–35� (2q) with a wave-length of 1.54 A (40 kV, 35 mA). In all cases the solid phase analysed was pureform I. The theoretical PXRD patterns generated from the crystallographicinformation les for both form I and form II along with the samples taken fromrisperidone nucleation in toluene are shown in the ESI.†
2.3. Computational methods
Density Functional Theory (DFT) calculations have been applied to investigate(1 : 1) solvent–solute pair interactions. For this purpose, a risperidone moleculehas been extracted from the crystal lattice of its form I (WASTEP) and optimized inisolation at the B97-D3/6-31G(d,p) level. The molecular geometry changed onlyslightly upon gas-phase optimization, preserving the original crystal-like confor-mation (cf. Fig. S4, ESI†). The seven solvents used in our experimental work can bedivided into three groups: polar protic (alcohols), polar aprotic (acetone and ethylacetate), and nonpolar (toluene and cumene). Three solvents (one from eachgroup), representing different polarity and H-bond capability, were chosen for themodelling part, i.e. 1-propanol, acetone, and toluene. These solvents possesdifferent bonding mechanisms. 1-Propanol is both a H-bond donor and acceptor,acetone is only capable of accepting H-bonds, while toluene is not capable ofmaking strong H-bonds, although it can interact through p-electrons located overits benzene ring. The (1 : 1) solvent–solute interactions are probed at eight sites ofthe risperidone molecule chosen with aid of the electrostatic potential map (EPM)as shown in Fig. 2. The EPM indicates higher electron deciency (dark bluecolour) at the hydrogens labelled H1, H2, and H3, while the electron rich regions,having H-bond accepting capabilities, are highlighted in red/yellow at theheteroatoms O1, O2, and N1–N3 (Fig. S2, ESI,† shows more projections of theEPM). Based on the electron distribution, one can expect that in the crystal, thehigher electron deciency at the ring 1 hydrogens will be complemented byneighbouring electron rich polar atoms resulting in relatively strong intermo-lecular bonding. This can indeed be observed in the risperidone crystal structure(cf. Fig. 2b) and thus validates the electrostatic potential map presented.
The considered eight sites represent all the important binding features of therisperidone molecule such as interaction at (i) polar sites containing O and Nheteroatoms (H-bond acceptors; sites 3, 5, and 7), (ii) non-polar C–H-terminatedsites 1 and 8, and (iii) the connected rings 1–2 (site 4) and 4–5 (site 6). In addition,for all the seven solvents we have modelled the (1 : 1) risperidone–solvent asso-ciates at site 5; this site combines two electron-rich atoms, i.e. carbonyl oxygenand tertiary amine nitrogen, and thus it is expected to yield strong interactions.Another reason for choosing site 5 was the ability of comparing the calculatedsolvent–solute binding energies of the risperidone carbonyl group across all theseven solvents with the respective experimentally determined C]O shis in theFTIR spectrum.
The equilibrium geometries of the (1 : 1) dimers are calculated with a B97-D3Grimme's functional,18 and a Gaussian-type 6-31G(d,p) basis set.19 Bindingenergies in the dimers are calculated for the lowest energy congurations, aer
Faraday Discuss. This journal is © The Royal Society of Chemistry 2015

Fig. 2 Molecular arrangement in the risperidone crystal (a); chief interactions and inter-molecular distances (in Angstroms) between molecules neighbouring in a monolayer (b);electrostatic potential isosurface and definition of interaction sites in risperidonemoleculefor probing solvent–solute bonding (c) (blue – positive, red – negative, green – neutralpotential).
Paper Faraday DiscussionsPu
blis
hed
on 0
3 Fe
brua
ry 2
015.
Dow
nloa
ded
by U
nive
rsity
of
Lim
eric
k on
20/
04/2
015
09:0
7:05
. View Article Online
probing a set of sensible molecular orientations, using a double hybrid B2PLYP-D3 functional,20 which combines exact Hartree–Fock exchange with an MP2-likecorrelation and long-range dispersion corrections; here we use a basis set ofquadruple-z valence quality (def2-QZVP).21 The binding energy is calculated asfollows:
DEbind ¼ EA–B � (EA + EB) (1)
This journal is © The Royal Society of Chemistry 2015 Faraday Discuss.

Faraday Discussions PaperPu
blis
hed
on 0
3 Fe
brua
ry 2
015.
Dow
nloa
ded
by U
nive
rsity
of
Lim
eric
k on
20/
04/2
015
09:0
7:05
. View Article Online
where EA–B is the energy of a dimer and EA and EB are the energies of isolatedmonomers A and B in fully relaxed gas phase geometries.
Conformational analysis of the risperidone molecule has been carried out atthe DFT B97-D3/6-31G(d,p)//B2PLYP-D3/def2-QZVP level (gas-phase, 0 K), withenergy barriers to rotation calculated for four rotational centres (single bonds) ofthe risperidone molecule (Fig. S5, ESI†). We restricted our calculations to elec-tronic energies only (corrections for zero point energy and other vibrationalcontributions are not included). A relaxed potential energy surface (PES) scan over360�, with the step interval of 5�, has been performed for the respective dihedralangles. Four new low energy conformers were identied upon PES scanning andtheir stabilities have been compared relative to the relaxed crystal-likeconformation.
Calculations were performed using the GAUSSIAN 09 package.22 Electrostaticpotential maps were generated with the MOLEKEL 5.4 soware.23
2.4. Spectroscopic methods
Solution spectroscopy was carried out for risperidone in all the seven solvents thatwere used for nucleation work. Raman spectra were collected using Kaiser RamanRxn2 analyser with an Invictus 785 nm excitation laser. For liquid samples, a shortfocus immersion probe of 1/4 inch diameter was used and the solid samples wereanalysed using a non-contact optic probe. Each spectrum was collected for aminimum of 15 s exposure time and ve accumulations in the spectral region of3400–200 cm�1 using Mettler Toledo iC Raman soware version 4.1.
IR spectrum of the solid material was collected using Perkin Elmer spectrum100 spectrometer with Universal ATR accessory in the spectral region of 4000–650cm�1 with 4 cm�1 resolution. IR spectra of solutions were collected using MettlerToledo ReactIR 10 tted with a bre optic probe and a diamond composite tip.Due to the nature of the bre optic probe, the solution spectra were collected inthe ngerprint region of 2000–650 cm�1 with 4 cm�1 resolution using iC IRsoware version 4.3. All the spectral data were collected at ambient temperature(20–22 �C).
3. Results3.1. Rate of nucleation in different solvents
Induction time distributions from toluene (a) and ethyl acetate (b) are shown inFig. 3.
The use of various distribution functions to examine induction time data haspreviously been examined.17,24 Here we have used the lognormal cumulativedistribution function (LCDF) and the exponential-based function of Jiang and terHorst.24 Both distributions provide reasonably similar ts to the data, and resultsare collected in Table 1. The calculated nucleation rates using both methodsdisplay similar trends with driving force. Fitting the LCDF produced coefficientsof determination greater than 0.97 in all instances while the ts of the exponentialfunction were similar with one exception resulting in a coefficient of determi-nation of 0.94.
The tting to the LCDF includes no assumption of a particular mechanism ofnucleation. By examining the relation of the induction time distributions to the
Faraday Discuss. This journal is © The Royal Society of Chemistry 2015
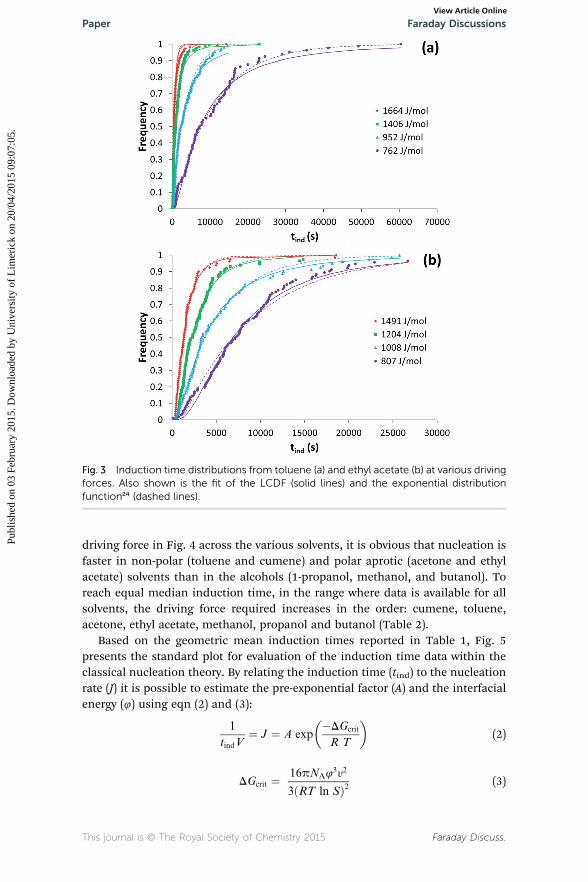
Fig. 3 Induction time distributions from toluene (a) and ethyl acetate (b) at various drivingforces. Also shown is the fit of the LCDF (solid lines) and the exponential distributionfunction24 (dashed lines).
Paper Faraday DiscussionsPu
blis
hed
on 0
3 Fe
brua
ry 2
015.
Dow
nloa
ded
by U
nive
rsity
of
Lim
eric
k on
20/
04/2
015
09:0
7:05
. View Article Online
driving force in Fig. 4 across the various solvents, it is obvious that nucleation isfaster in non-polar (toluene and cumene) and polar aprotic (acetone and ethylacetate) solvents than in the alcohols (1-propanol, methanol, and butanol). Toreach equal median induction time, in the range where data is available for allsolvents, the driving force required increases in the order: cumene, toluene,acetone, ethyl acetate, methanol, propanol and butanol (Table 2).
Based on the geometric mean induction times reported in Table 1, Fig. 5presents the standard plot for evaluation of the induction time data within theclassical nucleation theory. By relating the induction time (tind) to the nucleationrate (J) it is possible to estimate the pre-exponential factor (A) and the interfacialenergy (4) using eqn (2) and (3):
1
tindV¼ J ¼ A exp
��DGcrit
R T
�(2)
DGcrit ¼ 16pNA43y2
3ðRT ln SÞ2 (3)
This journal is © The Royal Society of Chemistry 2015 Faraday Discuss.

Table 1 Parameters describing induction time distributions of risperidone in varioussolvents from fitting the lognormal distribution function (geometric mean (h*), geometricstandard deviation (s*), calculated nucleation rate (J), and size of the critical nucleus (N*),or exponential based function24 (nucleation rate (Ja))
Solvent RT ln S [J mol�1] h* (s) �∕ s* J (m�3 s�1) N* Ja (m�3 s�1)
Cumene 757 4682 �∕ 3.75 10.68 24 6.67940 1343 �∕ 1.93 37.25 13 43.48
1120 732 �∕ 1.83 68.29 7 87.22
Toluene 762 7397 �∕ 2.84 6.76 23 4.78952 2286 �∕ 3.24 21.87 12 14.28
1406 886 �∕ 3.15 56.44 4 38.001664 489 �∕ 2.19 102.28 2 105.12
Acetone 526 18374 �∕ 3.22 2.72 78 1.99858 5528 �∕ 2.36 9.05 18 7.43
1074 2472 �∕ 2.02 20.23 9 18.251287 1036 �∕ 2.17 48.28 5 46.65
Ethyl acetate 807 6914 �∕ 2.21 7.23 15 6.051008 3666 �∕ 2.55 13.64 8 10.781204 2247 �∕ 2.20 22.25 5 21.161491 1265 �∕ 2.17 39.51 2 37.46
Methanol 1338 3166 �∕ 2.07 15.79 9 14.661553 2289 �∕ 2.68 21.85 6 16.421897 1514 �∕ 3.45 33.02 3 20.202224 673 �∕ 2.41 74.31 2 64.33
1-Propanol 1072 16549 �∕ 3.52 3.02 19 1.811632 3216 �∕ 3.43 15.55 5 9.542013 1172 �∕ 2.76 42.65 3 31.992378 654 �∕ 2.39 76.48 2 68.52
Butanol 1377 4362 �∕ 2.86 11.46 6 8.411654 2963 �∕ 2.51 16.88 4 13.842025 2262 �∕ 2.52 22.10 2 18.972370 1239 �∕ 2.01 40.37 1 42.53
Faraday Discussions PaperPu
blis
hed
on 0
3 Fe
brua
ry 2
015.
Dow
nloa
ded
by U
nive
rsity
of
Lim
eric
k on
20/
04/2
015
09:0
7:05
. View Article Online
where NA is the Avogadro number, R is the gas constant, T is temperature, DGcrit isthe nucleation work assuming a spherical nucleus, V is the volume of the solution,y is the molar volume of risperidone in the cluster, and RT ln S is the supersat-uration driving force where S is the supersaturation ratio in terms of the molefraction. The solid liquid interfacial energies and the preexponential factors arereported in Table 3.
No direct relation can be found between the interfacial energy in thedifferent solvents and the solid–liquid solubility, regardless of units of thelatter which agrees with our previous ndings.3,12,25 There is neither a clearcorrelation with the Hansen solubility parameter nor with the viscosity of thesolvent.
Faraday Discuss. This journal is © The Royal Society of Chemistry 2015

Fig. 4 Induction time distributions. Data points represent the geometric mean (h*) of theLCDF while the shaded regions represent one geometric standard deviation (s*) from thismean.
Paper Faraday DiscussionsPu
blis
hed
on 0
3 Fe
brua
ry 2
015.
Dow
nloa
ded
by U
nive
rsity
of
Lim
eric
k on
20/
04/2
015
09:0
7:05
. View Article Online
3.2. DFT calculations
By running the potential energy surface scan over the dihedral angles of the foursingle bonds that serve as rotational centres, we have found that the relevantenergy barriers to interconversion between the different conformational isomersrange from 10 kJ mol�1 to 26 kJ mol�1 (ESI†). There is one new isomer identiedfor each rotational centre being structurally different from those constitutingknown conformations in the crystal structure of risperidone form I (and form II).Three of the new conformers are linear and the fourth is U-shaped. Two of thelinear conformers are slightly more stable (lower in energy by 2–3 kJ mol�1), whilethe U-shaped molecule is higher in energy by 6.3 kJ mol�1 as compared to the
Table 2 A quantified measure of the ease of nucleation of risperidone in 7 differentsolvents
Solvent
Driving force (RT ln S, Jmol�1) required to reachmedian induction time
Driving force order2000 s 3000 s
Cumene 854 784 1Toluene 1015 841 2Acetone 1055 954 3Ethyl acetate 1288 1112 4Methanol 1639 1370 5Propanol 1829 1657 6Butanol 1976 1671 7
This journal is © The Royal Society of Chemistry 2015 Faraday Discuss.

Fig. 5 Log geometric mean induction times plotted against driving force to determine theinterfacial energy and preexponential factor within classical nucleation theory.
Faraday Discussions PaperPu
blis
hed
on 0
3 Fe
brua
ry 2
015.
Dow
nloa
ded
by U
nive
rsity
of
Lim
eric
k on
20/
04/2
015
09:0
7:05
. View Article Online
crystal-like starting conformer; this suggests the least favourable geometry. It canbe assumed that only kinetically stable conformers, i.e. those separated by higherenergy barriers, could signicantly affect the nucleation process. The relativelylow rotational barriers along with small energy differences of the three gas-phaselinear conformations vs. the crystal structure conformations indicate absence ofone kinetically stable conformation that could be unambiguously chosen as amodel conformation to study interactions of risperidone with solvent molecules.For this reason, the linear conformation appearing in the crystal structure ofrisperidone is used consistently in our modelling work. The calculated low energybarriers to rotation indicate high conformational exibility of the risperidonemolecule and suggest a variety of different conformations are present in solution.
The relatively large and complex risperidone molecule can possess a variety ofbinding congurations with solvent molecules. Here we consider eight bindingsites, where the interactions at the risperidone molecule are probed with three
Table 3 Experimental solid–liquid interfacial energy and preexponential factor of ris-peridone nucleation in the different solvents. Also given is the solubility as mole fraction(MF) and mol l�1 at 25 �C, as well as the Hansen solubility parameter c12 and the solventviscosity
Solvent
Driving forceorder fromTable 2
Interfacialenergy(mJ m�2)
Pre-exponentialfactor,A (m�3 s�1)
Solubility at 25 �C
c12
Solventviscosity(mPa S)(MF � 103) (mol l�1)
Cumene 1 1.72 348 2.60 18.68 2.05 0.78Toluene 2 1.70 181 6.67 63.17 1.43 0.59Acetone 3 1.77 161 1.75 23.79 1.18 0.31Ethyl acetate 4 1.58 71 2.16 22.01 1.32 0.426Methanol 5 2.18 134 3.96 98.12 1.44 0.591-Propanol 6 2.25 129 3.05 40.86 1.35 1.94Butanol 7 2.04 61 3.47 38.01 1.46 2.54
Faraday Discuss. This journal is © The Royal Society of Chemistry 2015

Fig. 6 Optimized geometry of risperidone–1-propanol, risperidone–acetone, and ris-peridone–toluene (1 : 1) molecular associates (B97-D3/6-31G(d,p) level). Binding energyin kJ mol�1, calculated at B2PLYP-D3/def2-QZVP level. Hydrogen –white, carbon – grey,oxygen – red, nitrogen – blue, fluorine – pale blue.
Paper Faraday DiscussionsPu
blis
hed
on 0
3 Fe
brua
ry 2
015.
Dow
nloa
ded
by U
nive
rsity
of
Lim
eric
k on
20/
04/2
015
09:0
7:05
. View Article Online
representative solvents, i.e. 1-propanol, acetone and toluene. The DFT bindingenergy is calculated for each of the 24 solvent–solute (1 : 1) heterodimers (Fig. 6).One solvent molecule can interact with a number of atoms of the risperidonemolecule. In case of site 1 and site 8, only C–Hhydrogens are involved in bonding.The other sites feature a combined interaction of hydrogens and heteroatoms.
This journal is © The Royal Society of Chemistry 2015 Faraday Discuss.

Faraday Discussions PaperPu
blis
hed
on 0
3 Fe
brua
ry 2
015.
Dow
nloa
ded
by U
nive
rsity
of
Lim
eric
k on
20/
04/2
015
09:0
7:05
. View Article Online
Our calculations indicate that 1-propanol does not establish strong bonding atthe nonpolar sites 1 and 8 of risperidone, being up to 30% weaker than therespective bonding to acetone and toluene. However, the propanol moleculebinds stronger at sites 3–7, where it forms H-bonds with polar heteroatoms of thesolute molecule. The strongest binding of �26.9 kJ mol�1 and �26.3 kJ mol�1 isobserved for site 7 and 5, respectively. The interaction at site 2, which combinesbinding to hydrogen and uorine ring atoms, is relatively weak and decreases inorder: acetone > 1-propanol > toluene. Acetone and toluene molecules yield thestrongest binding of �19.5 kJ mol�1 and �13.8 kJ mol�1, respectively, whenplaced over rings 4–5 (site 6). The solvent–risperidone (1 : 1) binding energiesaveraged over the eight sites form an order: 1-propanol (�16.2 kJ mol�1) > acetone(�12.8 kJ mol�1) > toluene (�8.2 kJ mol�1).
When comparing all the eight interaction sites it appears that site 5 is amongstthe strongest interacting sites. This site provides a set of polar groups, includingcarbonyl oxygen and tertiary amine nitrogen, which result in strong binding witha solvent molecule. In order to compare strength of the risperidone–solventinteraction for all the seven solvents, the site 5 was chosen, and the respectivebinding energies are shown in Fig. 7.
The binding energies calculated at site 5 form three distinct groups ofcomparable values: (i) alcohols, yielding very similar and the strongest bindinginteractions, (ii) acetone and ethyl acetate, with moderate binding, and (iii)cumene and toluene, being relatively weakly bound to the risperidone molecule.
3.3. Solution spectroscopy
Solid state spectra. IR and Raman spectra of risperidone form I are shown inFig. 8. In the ngerprint region carbonyl stretching appears as a strong peak at1643 cm�1 in the IR spectra, whereas in the Raman spectra it is only of moderateintensity. In the crystal structure of form I the carbonyl is attached to threedifferent C–H sites through weaker interaction and the interaction at the carbonylsite roughly corresponds to the interaction at site 5 of the risperidone molecule(Fig. 2). Apart from the dominant carbonyl peak, the ngerprint region shows astrong peak at 1534 cm�1 corresponding to mainly v(C4]N3, C1]C2)26 in thepyrimidine ring (ring 4) and also some contribution from v(C1–N3) of the samering (cf. Fig. 2). Functional groups responsible for this vibration frequencycorrespond to site 7 as shown in Fig. 2.
Solution spectra. For solution spectroscopy of this compound, IR spectroscopywas found to be more suitable than Raman spectroscopy due to the low solubilityin the different solvents leading to a weak solute signal in the Raman spectra. Thebiggest difference in the solution spectra was observed for the carbonyl peak. Incase of alcoholic solutions this peak is marginally shied to 1648 cm�1 followedby higher shis in acetone and further shis in ethyl acetate, toluene and cumene(Fig. 9). The shi in the carbonyl frequency follows the polarity order27 of thesolvents: alcohols > acetone > ethyl acetate > methyl benzenes (toluene andcumene). The carbonyl stretching frequency, v(C]O) is sensitive to hydrogenbonding and other solvent–solute interactions due to the effect of interactingspecies on the double bond characteristics of the carbonyl bond. The v(C]O), hasoen been used as a probe to study the solvent–solute interaction12,28,29 andgenerally the stronger the solvent interacts, the lower the frequency at which it
Faraday Discuss. This journal is © The Royal Society of Chemistry 2015

Fig. 7 Risperidone–solvent (1 : 1) associates at site 5, with all the seven solvents used inthe experiment (B97-D3/6-31G(d,p) level). Binding energy in kJ mol�1, calculated atB2PLYP-D3/def2-QZVP level.
Paper Faraday DiscussionsPu
blis
hed
on 0
3 Fe
brua
ry 2
015.
Dow
nloa
ded
by U
nive
rsity
of
Lim
eric
k on
20/
04/2
015
09:0
7:05
. View Article Online
absorbs. The shis of the carbonyl frequency suggest that at site 5 of the ris-peridone molecule (Fig. 2) the alcohols are strongly bound followed by acetoneand ethyl acetate, and the methyl benzenes (toluene and cumene) are relativelyweakly interacting at this site.
Similar to the carbonyl peak, shis were also observed for the peak (1534 cm�1)corresponding to site 7. This peak at 1534 cm�1 (in solid material) moves tosomewhat higher frequency in alcoholic solutions (1536 cm�1) followed byslightly higher frequency in acetone solution (1538 cm�1) and further higherfrequency (1540 cm�1) in toluene, cumene and ethyl acetate solutions. The
Fig. 8 IR (blue) and Raman (green) spectrum of risperidone Form I (solid).
This journal is © The Royal Society of Chemistry 2015 Faraday Discuss.

Fig. 9 IR spectra of risperidone showing the peak shift observed in different solvents. Thesolvent spectrum is subtracted from the solution spectra.
Faraday Discussions PaperPu
blis
hed
on 0
3 Fe
brua
ry 2
015.
Dow
nloa
ded
by U
nive
rsity
of
Lim
eric
k on
20/
04/2
015
09:0
7:05
. View Article Online
relative shi difference was smaller than that observed for the carbonyl peakwhich is expected considering a higher force constant for carbonyl stretchingfrequency over the frequency responsible for the peak at 1534 cm�1 in IR. Theconcentration effect on the spectra was also analysed for toluene, 1-propanol,methanol and acetone solutions: there was no clear difference in the spectra dueto the different concentrations. Details of concentration and the wavenumberaccuracy are shown in the ESI† le.
4. Discussion
The induction time experiments reveal that in order to reach the same inductiontime the required driving force increases in the order: cumene < toluene < acetone< ethyl acetate < methanol < propanol < butanol. We will refer to this order asincreasing difficulty of nucleation, and point out that this observation is directlyextracted from the experimental work without assumption of a particular theory.This work further shows that if the data are processed within the framework of theclassical nucleation theory the obtained interfacial energies increase in a similarbut not identical order. Overall, the difference in interfacial energy of risperidonedepending on the solvent is rather limited, spanning from 1.58 to 2.25 mJ m�2 forthe seven solvents investigated. In the alcohols the value is clearly higher than inthe other four solvents, but within these two groups of solvents the differences arerelatively small. With respect to the experimental uncertainties we do not see a bigdiscrepancy between the driving force order and the interfacial energy order eventhough we do want to point out the difference with respect to ethyl acetate inparticular. Furthermore, since the nucleation rate in the classical nucleation
Faraday Discuss. This journal is © The Royal Society of Chemistry 2015

Fig. 11 Relationship between driving force required to reach a median induction time of2000 s and the FTIR vibrational frequency of the risperidone carbonyl group, site 5.
Fig. 10 Cross-validation of solvent–risperidone interactions: DFT binding energy vs. FTIRvibrational frequency at (a) carbonyl v(C]O) (site 5) for all the 7 solvents and (b) v(C]N +C]C) in ring 4 (site 7) for selected 3 solvents.
Paper Faraday Discussions
This journal is © The Royal Society of Chemistry 2015 Faraday Discuss.
Publ
ishe
d on
03
Febr
uary
201
5. D
ownl
oade
d by
Uni
vers
ity o
f L
imer
ick
on 2
0/04
/201
5 09
:07:
05.
View Article Online

Fig. 12 Relationship between driving force at median induction time of 2000 s and DFTbinding energy: (a) for seven solvents at site 5, and (b) averaged over eight interaction sitesconsidering three representative solvents.
Faraday Discussions PaperPu
blis
hed
on 0
3 Fe
brua
ry 2
015.
Dow
nloa
ded
by U
nive
rsity
of
Lim
eric
k on
20/
04/2
015
09:0
7:05
. View Article Online
theory depends on the preexponential factor as well as the nucleation work, theorder of nucleation according to the driving force scale doesn't necessarily have tocorrelate with the interfacial energy order.
Risperidone is a relatively large molecule (410.49 g mol�1) that possessesvarious functional groups of different polarity, serving as sites for intermolecularinteractions. Because of this DFT simulation of the complete rst solvation shell10
becomes too demanding and we settled for simulating a number of one-to-onemolecule solvent–solute pairs. In Fig. 10 the spectroscopic results are comparedwith the DFT-computed solvent–risperidone binding energies at the carbonylgroup (Fig. 10a) site 5 and the pyrimidine ring (Fig. 10b) site 7. Obviously, there isa good correlation in the data from the two methods: with increasing bindingenergy the carbonyl peak and the pyrimidine peak both shi towards lowerfrequencies. The results of both methods suggest that the binding to the non-polar solvents cumene and toluene, is quite weak, is somewhat stronger to theaprotic solvents ethyl acetate and acetone, and clearly stronger than the alcohols.Since the carbonyl site shows a relatively larger shi in solution spectra, ascompared to the (C]N, C]C) vibrations of ring 4, the carbonyl group appears a
Faraday Discuss. This journal is © The Royal Society of Chemistry 2015

Paper Faraday DiscussionsPu
blis
hed
on 0
3 Fe
brua
ry 2
015.
Dow
nloa
ded
by U
nive
rsity
of
Lim
eric
k on
20/
04/2
015
09:0
7:05
. View Article Online
relatively more sensitive probe for investigating the solvent–solute interactions insolution.
In Fig. 11 we examine the correlation between the driving force required toreach a median induction time of 2000 s and the FTIR carbonyl peak frequency.The overall trend is that the required driving force increases with decreasing peakfrequency suggesting that the crystal nucleation of risperidone becomes graduallymore difficult the stronger the solvent binds to the carbonyl site. The correlationrather clearly distinguishes between the non-polar solvents, the aprotic solventsand especially the alcohols. It must be noted though that the correlation in Fig. 11shows strength of solvent–solute interaction only at one site. However a similarcorrelation could be observed for the shi in the pyrimidine ring vibrationsaffecting site 7 as well. Unfortunately, in the solution IR spectroscopy only certainsites of interactions can be probed, and the resolution is somewhat limited forsolvents bearing similar structural features such as the group of alcohols and thepair of toluene and cumene. This points out certain limitations of FTIR spec-troscopy in such work.
Fig. 12a shows, as expected, that the nucleation driving force correlates nicelywith the DFT computed (1 : 1) binding energy to the carbonyl group at site 5. Atthe sites where the DFT binding energies are the strongest, i.e. sites 5, 6, and 7,we also observe a correlation between binding energy and the ease of nucleationfor the three considered solvents. It is noteworthy that, for ve sites out of theeight considered, the binding energies follow the order of difficulty of
Fig. 13 Relationship between interfacial energy and (a) driving force at median inductiontime of 2000 s, (b) FTIR vibrational frequency of risperidone carbonyl group, (c) DFTbinding energy of solvent–solute at site 5 (purple diamonds) and site 7 (red dots), and (d)DFT binding energy of solvent–solute as averaged over eight interaction sites. Cumene(CU), toluene (TL), acetone (AC), ethyl acetate (EA), methanol (ME), propanol (PR), andbutanol (BU).
This journal is © The Royal Society of Chemistry 2015 Faraday Discuss.

Faraday Discussions PaperPu
blis
hed
on 0
3 Fe
brua
ry 2
015.
Dow
nloa
ded
by U
nive
rsity
of
Lim
eric
k on
20/
04/2
015
09:0
7:05
. View Article Online
nucleation. The three sites where there is no such a correlation are those wherethe solvent–solute interactions are relatively weak, as they feature either rela-tively non-polar C–H hydrogens (site 1 and 8) or a combined interaction ofhydrogen and uorine (site 2). For the three solvents where we have DFT-computed binding energies to all 8 sites, we have calculated a mean interactionenergy, and the correlation to the nucleation driving force is shown in Fig. 12b.Based on these three solvents only the correlation is not overly impressive, sincethe nucleation driving force required in acetone for 2000 s induction time isalmost the same as for toluene. It is noteworthy though that at 3000 s inductiontime (Table 2), there is a somewhat more clear difference in driving forcebetween toluene and acetone.
Since oen the nucleation propensity is characterised by the interfacial energyonly, for completeness we also show the corresponding correlations in Fig. 13.Fig. 13a shows the correlation between the interfacial energy and the driving forcerequired to induce the same induction time. Overall, the difference between thealcohols and the other solvents is distinguished but the more detailed orderdiffers, and in particular a discrepancy is observed in case of ethyl acetate, wherethe lowest interfacial energy of 1.58 mJ m�2 is calculated, despite the driving forcebeing somewhat in the mid-range (cf. Fig. 4 and Table 2). The correlations ofinterfacial energy with carbonyl frequency (Fig. 13b), the DFT calculated bindingenergies at sites 5 and 7 (Fig. 13c), and the average binding energy (Fig. 13d), aresimilar to that shown in Fig. 13a. Overall, we observe that the strength of solvent–solute interaction affects the nucleation process, such that the stronger thesolvent binds to the solute, the greater the difficulty of nucleation becomes. Thisvery much follows the observations made for salicylic acid,13 further supportingthe hypothesis that desolvation of the solvent molecules during the process offormation of crystal nuclei can be a key step in explaining the inuence of thesolvent on the nucleation process.
5. Conclusions
The nucleation of risperidone depends on the solvent. To reach the sameinduction time the required driving force increases in the order: cumene, toluene,acetone, ethyl acetate, methanol, propanol, and butanol. This order overallcorresponds to the order of increasing interfacial energy as determined within theclassical nucleation theory, but there are deviations in the detailed order. Thefrequency of the FTIR spectroscopy peaks corresponding to the carbonyl andpyrimidine group vibrations decreases in the polarity order of the three solventgroups. DFT (1 : 1) solvent–solute binding energies depend signicantly on thebinding site for all three solvents investigated. For the carbonyl site the bindingenergy increases essentially in the same order as the order of increasing drivingforce. A good correlation between spectroscopic data and DFT simulationsprovides validation for the relevance of these techniques in characterisingsolvent–solute interactions. The results of this work support the hypothesis thatthe inuence of the solvent on the crystal nucleation is related to the desolvationof the risperidone molecules. The stronger the solvent binds to the risperidonemolecule in solution, the more difficult the desolvation and the slower thenucleation becomes.
Faraday Discuss. This journal is © The Royal Society of Chemistry 2015

Paper Faraday DiscussionsPu
blis
hed
on 0
3 Fe
brua
ry 2
015.
Dow
nloa
ded
by U
nive
rsity
of
Lim
eric
k on
20/
04/2
015
09:0
7:05
. View Article Online
Acknowledgements
The support of the Science Foundation Ireland (10/IN.1/B3038) is gratefullyacknowledged. J. Zeglinski acknowledges the Science Foundation Ireland (SFI)and Higher Education Authority funded Irish Centre for High End Computing(ICHEC) for access to computational facilities, and A. C. Rasmuson the support ofthe Swedish Research Council (621-2010-5391).
References
1 R. A. Granberg, C. Ducreux, S. Gracin and A. C. Rasmuson, Chem. Eng. Sci.,2001, 56, 2305–2313.
2 S. Teychene and B. Biscans, Cryst. Growth Des., 2008, 8, 1133–1139.3 M. Svard and A. C. Rasmuson, Cryst. Growth Des., 2013, 13, 1140–1152.4 R. J. Davey, G. Dent, R. K. Mughal and S. Parveen, Cryst. Growth Des., 2006, 6,1788–1796.
5 S. A. Kulkarni, E. S. McGarrity, H. Meekes and J. H. ter Horst, Chem. Commun.,2012, 48, 4983.
6 C. A. Hunter, J. F. McCabe and A. Spitaleri, CrystEngComm, 2012, 14, 7115.7 R. J. Davey, N. Blagden, S. Righini, H. Alison, M. J. Quayle and S. Fuller, Cryst.Growth Des., 2001, 1, 59–65.
8 C. S. Towler and L. S. Taylor, Cryst. Growth Des., 2007, 7, 633–638.9 R. J. Davey, S. L. Schroeder and J. H. ter Horst, Angew. Chem., Int. Ed. Engl.,2013, 52, 2166–2179.
10 A. Mattei, X. Mei, A. Miller and T. Li, Cryst. Growth Des., 2013, 13, 3303–3307.11 M. Lahav and L. Leiserowitz, Cryst. Growth Des., 2006, 6, 619–624.12 D. Khamar, J. Zeglinski, D. Mealey and A. C. Rasmuson, J. Am. Chem. Soc.,
2014, 136, 11664–11673.13 S. Lohani, I. V. Nesmelova, R. Suryanarayanan and D. J. W. Grant, Cryst.
Growth Des., 2011, 11, 2368–2378.14 W. Du, Q. Yin, J. Gong, Y. Bao, X. Zhang, X. Sun, S. Ding, C. Xie, M. Zhang and
H. Hao, Cryst. Growth Des., 2014, 14, 4519–4525.15 R. A. Sullivan, R. J. Davey, G. Sadiq, G. Dent, K. R. Back, J. H. ter Horst, D. Toroz
and R. B. Hammond, Cryst. Growth Des., 2014, 14, 2689–2696.16 L. Zhao, C. Zhu, J. Ji, J. Chen and H. H. Teng, Geochim. Cosmochim. Acta, 2013,
106, 192–202.17 D. Mealey, D. M. Croker and A. C. Rasmuson, CrystEngComm, 2015, DOI:
10.1039/C4CE01428F.18 S. Grimme, S. Ehrlich and L. Goerigk, J. Comput. Chem., 2011, 32, 1456–1465.19 V. A. Rassolov, M. A. Ratner, J. A. Pople, P. C. Redfern and L. A. Curtiss, J.
Comput. Chem., 2001, 22, 976–984.20 L. Goerigk and S. Grimme, J. Chem. Theory Comput., 2011, 7, 291–309.21 F. Weigend and R. Ahlrichs, Phys. Chem. Chem. Phys., 2005, 7, 3297–3305.22 M. J. Frisch, G. W. Trucks, H. B. Schlegel, G. E. Scuseria, M. A. Robb,
J. R. Cheeseman, et al., Gaussian 09, Revision D.01, Gaussian Inc.,Wallingford, CT, 2013, 24.
23 S. Portmann and H. P. Luthi, Chimia, 2000, 54, 766–770.24 S. Jiang and J. H. ter Horst, Cryst. Growth Des., 2011, 11, 256–261.25 H. Y. Yang and A. C. Rasmuson, Cryst. Growth Des., 2013, 13, 4226–4238.
This journal is © The Royal Society of Chemistry 2015 Faraday Discuss.

Faraday Discussions PaperPu
blis
hed
on 0
3 Fe
brua
ry 2
015.
Dow
nloa
ded
by U
nive
rsity
of
Lim
eric
k on
20/
04/2
015
09:0
7:05
. View Article Online
26 A. Alparone, Spectrochim. Acta, Part A, 2011, 81, 631–639.27 C. Reichardt and T. Welton, Solvents and Solvent Effect in Organic Chemistry,
Wiley-VCH Verlag GmbH & Co. KGaA, 2011, pp. 425–490.28 R. A. Nyquist, in Interpreting Infrared, Raman, and Nuclear Magnetic Resonance
Spectra, ed. R. A. Nyquist, Academic Press, San Diego, 2001, pp. 165–203.29 S. I. Nam, E. S. Min, Y. M. Jung andM. S. Lee, Bull. Korean Chem. Soc., 2001, 22,
989–993.
Faraday Discuss. This journal is © The Royal Society of Chemistry 2015