Investigating the structural properties of hydrophobic solvent ...
Upload
khangminh22Category
view
0download
0
15
Methods of Solvent Detection
and Testing
15.1 STANDARD METHODS OF SOLVENT ANALYSIS
George Wypych
ChemTec Laboratories, Inc., Toronto, Canada
This section includes information on solvent analysis based on methods included in national
and international standards. ASTM standard methods are emphasized because they contain
more methods on solvent testing than any other set of methods available. ISO standards are
also covered in full detail because they are used in practical applications and are a basis for
preparation of national standards. References to other national standards are also given in-
cluding Australian (AS), Australian/New Zealand (AS/NZS), (British (BS), Canadian
(CAN/CGSB), German (DIN), Japanese (JIS), and Finish (SFS). The same number is given
in references to all national and international standards for the same solvent property to fa-
cilitate searching and referencing. Methods of analysis are grouped by subject in alphabeti-
cal order.
15.1.1 ALKALINITY AND ACIDITY
Amine acid acceptance by halogenated solvents is the degree to which an amine is capable
of absorbing or neutralizing acid present from an external source or generated by the
solvent.1 This method is useful for comparing the effect of an amine with other
acid-accepting compounds. The test is performed by the titration of an alkaline water
extract from the solvent with 0.2 N hydrochloric acid to pH = 3.9 as detected by pH
electrode.The alkalinity of acetone is determined by a titration with 0.05 N H2SO4 in the pres-
ence of methyl red indicator.2 The test method provides a measure of acetone alkalinity cal-culated as ammonia.
The acidity of halogenated solvents can be determined by titration with 0.01 N sodiumhydroxide in the presence of a 0.1% solution of bromophenyl blue indicator.3 Similar to thedetermination of alkalinity,1 acidity is determined in water extract. The determination canalso be done directly in solvent but the solution of sodium hydroxide should be prepared inmethanol. A third option is to determine acidity by a pH-metric titration of a water extract.Prior to determination, the pH of solvent is measured. If the pH is above 7, then an alkalinitymeasurement is done by the above method.1 If the pH is below 7, acidity is determined bythis method.3 The method is used to establish purchasing and manufacturing specificationsand control the quality of solvents.

The acidity of benzene, toluene, xylenes, naphthas, and other aromatic hydrocarbonsis determined by the titration of a water extract with 0.01 N sodium hydroxide in the pres-ence of 0.5% phenolphthalein indicator solution.4 The method is suitable for setting specifi-cations, internal quality control, and development of solvents. The result indicates thepotential corrosivity of solvent.
The acidity of solvents used in paint, varnish, and lacquer is determined by the titrationof solvent diluted with water (for water soluble solvents) or isopropyl alcohol or ethanol(for water insoluble solvents) in proportion of 1:1. A water solution of 0.05 N sodium hy-droxide in the presence of 0.5% phenolphthalein indicator dissolved in ethanol orisopropanol is used for titration.5 The method is useful for determination of acidity below0.05%. Acidity is a result of contamination or decomposition during storage, transportationor manufacture. The method is used to assess compliance with specification.
Solvents which are depleted of stabilizers (amine or alpha epoxide) may becomeacidic. The following method determines the combined effect of both alkaline (amine) andneutral (usually epoxy) stabilizers.6 The determination is done in two steps. First solvent ismixed with hydrochlorination reagent (0.1 N HCl), then the excess is titrated with 0.1 N so-dium hydroxide in the presence of 0.1% bromophenyl blue as an indicator.
The total acidity of trichlorotrifluoroethane and other halocarbons is determined by ti-tration of a sample diluted with isopropanol with 0.01 N sodium hydroxide in isopropanol inthe presence of a 0.05% isopropanol solution of phenolphthalein as an indicator.7 Themethod is used for setting specifications and quality control.
15.1.2 AUTOIGNITION TEMPERATURE
The autoignition temperature can be determined by the hot and cold flame method.8 Cool
flames occur in vapor-rich mixtures of hydrocarbons and oxygenated hydrocarbons in air.
The autoignition temperature is the spontaneous (self-ignition) temperature at which a sub-
stance will produce a hot flame without an external ignition source. Autoignition occurs
when a hot flame inside a test flask suddenly appears accompanied by a sharp rise in tem-
perature. With cold flame ignition the temperature rise is gradual.The test equipment shown in a schematic drawing in the method8 consists of a test
flask, a furnace, a temperature controller, a syringe, a thermocouple and other auxiliaryparts. The measurement is performed in a dark room for optimum visual detection of coolflames. The results are reported as ignition temperature, time lags (delay between sampleinsertion and material ignition), and reaction threshold temperature (the lowest flask tem-perature at which nonluminous pre-flame reactions (e.g., temperature rise) occur).
The results depend on the apparatus employed. The volume of vessel is especially crit-ical. A larger flask will tend to produce lower temperature results. The method is not de-signed for materials which are solid at the measurement temperature or which undergoexothermic decomposition.
15.1.3 BIODEGRADATION POTENTIAL
The method covers a screening procedure which assesses the anaerobic biodegradation of
organic materials.9 The procedure converts organic substances into methane and carbon
dioxide which are measured by a gas volumetric pipette − part of the standard apparatus.
Other parts include, a biodegradation flask, a magnetic stirrer, a pressure transducer, a sy-
ringe, and a water seal. The apparatus may be interfaced with a gas chromatograph to
determine quantities of the two gases.The biodegradation process is conducted in a specially prepared medium inoculated
with sludge inoculum. The process occurs under the flow of a mixture of 70% nitrogen and30% carbon dioxide to provide anaerobic conditions.
1054 George Wypych

The method was developed to screen organic substances for their potential tobiodegrade. If a high degree of biodegradability is determined it provides a strong evidencethat the test substance will be biodegradable in the anaerobic digestors of a waste treatmentplant and in many natural environments. Other references9 give methods of determining ofbiological and chemical oxygen demand.
15.1.4 BOILING POINT
The boiling point of solvent, its specific heat capacity, and its enthalpy of vaporization
determine the energy required for solvent separation in a distillation column. They also
determine numerous other properties of solvents (see Chapter 2).Several methods of determination can be used, but two, distillation and gas chroma-
tography are the most popular. Industrial aromatic hydrocarbons are determined by distilla-tion. The temperature is recorded for the initial boiling point, for the sample which has beendistilled at 5%, 10%, then at 10% increments up to 90%, then finally at 95%. The tempera-ture should be recorded with precision of 0.1oC.10 A general test method to determine thedistillation range of volatile liquids11 outlines a similar method of measurement. In additionto the measurements at the intervals given above, the temperature of the dry point (distilla-tion temperature of residual quantities) is also recorded. Results must be reported as speci-fied in the method.
A vacuum distillation procedure is used to determine the amount of solvents in sol-vent-based paints.12 The paint sample is diluted with tricresyl phosphate, distilled for awhile under normal pressure to evaporate the more volatile solvents, followed by vacuumdistillation at 2 mm Hg.
Capillary gas chromatography is used to determine the boiling point of hydrocarbonsolvents.13 The initial boiling point is defined as the point at which the cumulative area ofchromatogram equals 0.5% of its final total surface area. The final boiling point is at cumu-lative area of 95% of the total surface area of chromatogram. The method reports boilingpoint distribution in 1% intervals over the 1-99% range of the total cumulative surface areaof chromatogram as well as the initial and final boiling points. A flame ionization detector isused in the determination and a standard solvent containing 16 known components is usedfor calibration.
15.1.5 BROMINE INDEX
Two methods are used to determine bromine index of aromatic hydrocarbons which contain
trace amounts of olefins and are substantially free of materials lighter than isobutane and
have distillation end-point lower than 288oC. The methods measure trace amounts of
unsaturations in materials which have a bromine index below 500.The bromine index can be measured by electrometric14 and coulometric15 titration. In
the electrometric titration method, a sample is titrated with bromide-bromate solution (0.1N solution of mixture of potassium bromide and potassium bromate) until the end-point in-crease in potential remains steady for 30 s.14 In coulometric titration, a potassium bromidesolution is used to titrate the solvent until the bromine concentration increases because it isno longer being consumed by the unsaturation of the solvent.15
Both methods can be used for setting specification, quality control, and testing of de-velopment solvents to find olefinic content. The methods do not differentiate between thetypes of unsaturations.
15.1.6 CALORIFIC VALUE
The heat of combustion of liquid hydrocarbon fuels can be determined with bomb
calorimeter.16 Two definitions are used in result reporting: gross heat of combustion (the
quantity of energy released from fuel burned in constant volume with all products gaseous
15.1 Standard methods of solvent analysis 1055

except water which is in liquid state) and net heat of combustion (the same but water is also
in a gaseous state). These determinations are useful in assessing the thermal efficiency of
equipment used for generation of power or heat. The results are used to estimate the range of
an aircraft between refueling stops which is a direct function of heat of combustion. The
calorimeter bomb is standardized against benzoic acid standard. Net and gross heats of
combustion are reported. A specific method is used for aviation fuels.17 This method reports
results in SI units and the measurements are made under constant pressure. The method is
applicable for aviation gasolines or aircraft turbine and jet engine fuels. The method is used
when heat of combustion data are not available. An empirical equation was developed
which gives net heat of combustion based on the determined values of aniline point (ASTM
D 611) and API gravity (ASTM D 287). If the fuel contains sulfur, a correction is applied for
sulfur determined according to ASTM D129, D 1266, D 2622, or D 3120 (the method se-
lected depends on the volatility of the sample).Gross calorific value and ash content of waste materials can be determined by a calori-
metric method.19 After a calorimetric analysis, the bomb washing can be used to determineof mineral content by elemental analysis. The sample is burned under controlled conditionsin oxygen. The calorimeter is standardized by burning known amount of benzoic acid. Theformation of acids can additionally be determined by titration.
15.1.7 CLEANING SOLVENTS
Several standard procedures are available for evaluation of cleaning solvents. The stability
of aircraft cleaning compounds is determined after 12 months storage at controlled
conditions which may include moderate temperatures, cold storage, and hot storage.20 Sol-
vent vapor degreasing operations which use halogenated solvents follow standardized
procedure.21 The standard contains information on the location and design of a degreasing
installation and operation during startup, degreasing, shutdown, and solvent reclamation.
The purpose of the standard is to reduce the probability of accidents and exposure to
personnel. A separate standard practice22 gives reasons for and methods of preventing acid
formation in degreasing solvents. The formation of acid is generally related to excessive
heat, contaminations, the presence of chlorinated and sulfonated oils, admixture of acids,
and solvent mixtures.
15.1.8 COLOR
Impurities in benzene, toluene, xylene, naphthas, and industrial aromatic hydrocarbons are
determined by a simple colorimetric analysis of an acid wash.23 A solvent is washed with
sulfuric acid and the color of the acid layer is determined by a visual comparison with color
standards prepared from solutions of cobalt chloride and ferric chloride.Aromatic hydrocarbons which melt below 150oC can be subjected to color analysis in
the liquid (molten) state using a visual comparison with platinum-cobalt standards.24 Stan-dards are prepared from a stock solution of K2PtCl2 to form a scale varying in color inten-sity. Similar procedure was developed to evaluate color of halogenated organic solvents andtheir admixtures.25
Objective color measurement is based on tristimulus colorimetry.26 This instrumentalmethod measures tristimulus values of light transmitted by a sample and compares the re-sults to the values transmitted by distilled water. The results can be recalculated to the plati-num-cobalt scale referred to in the previous standards.24,25 The results can also beinterpreted by normal methods of color measurement to yellowness index, color, colordepth, etc.
1056 George Wypych

15.1.9 CORROSION (EFFECT OF SOLVENTS)
The corrosiveness of perchloroethylene to copper is determined using Soxhlet apparatus.27
Three pre-weighed strips of copper are used, one placed in the bottom flask, the second in
the bottom of the Soxhlet attachment, and the third below the condenser. The specimens are
exposed to refluxing solvent for 72 h after which the entire apparatus is flushed with dis-
tilled water to wash all acidic substances back to the flask. The water layer is titrated with
0.01 N NaOH to determine its acidity and the strips are weighed to determine weight loss.
The results indicate quality of solvent. A different method is used to test copper corrosion
by aromatic hydrocarbons.28 Here, a copper strip is immersed in a flask containing solvent
and the flask is placed in boiling water for 30 min. Next, the copper strip is compared with
ASTM standard corroded copper strips.If 1,1,1-trichloroethane is not properly stabilized it forms hydrochloric acid in the
presence of aluminum. HCl corrodes aluminum. The presence of free water invalidates theresult of this test.29 An aluminum coupon is scratched beneath the surface of a solvent. Thecoupon is observed for 10 min and 1 h and the degree of corrosion is recorded in form ofpass (no reaction) or fail (gas bubbles, color formation, or metal corrosion). The test is im-portant to cleaning operations because aluminum should not be used for parts of machines(pumps, tanks, valves, spray equipment) in contact with corrosive solvent.
15.1.10 DENSITY
Density and specific gravity of solvents are discussed together. The difference in their defi-
nitions is that specific gravity is the density of material relative to the density of water
whereas the density is the weight in vacuo of a unit volume. The density of liquids (includ-
ing solvents) can be measured by a Bingham pycnometer.30 The determination includes in-
troduction of the liquid to the tared pycnometer, equilibration of temperature, then
weighing. Other standardized method31 determines the specific density of liquid industrial
chemicals by two methods: hydrometer and pycnometer. The pycnometric method is essen-
tially similar to the previously described. It differs in that the water and then solvent are
weighed. Thus the density determination error may only be due to an imprecise weighing
(the pycnometer calibrated volume does not enter calculations). In the hydrometer method,
the calibrated hydrometer is immersed in controlled temperature liquid and direct readings
are obtained.The standard method for determining the specific gravity of halogenated organic sol-
vents32 involves the use of both a pycnometer and a hydrometer as described above but, inaddition, an electronic densitometer is also used. Here, a liquid is placed in U-shaped tubeand subjected to electronic excitations. The density changes the mass of tube and frequencyof oscillations which is the basis for measurement and display of specific gravity readings.
Two standard tables33,34 (American and metric system of units) are used to calculateweight and volume of benzene, toluene, xylenes mixture and isomers, styrene, cumene, andethylbenzene as well as aromatic hydrocarbons and cyclohexane. Tables provide volumecorrections for these solvents in a temperature range from -5 to 109oF (-20.5 to 43oC).
15.1.11 DILUTION RATIO
The dilution ratio is the maximum number of units of diluent that can be added to unit
volume of solvent before precipitation occurs. Cellulose nitrate dissolved in an oxygenated
solvent (8 wt% resin) is the most classical method to determine dilution ratio used to
evaluate toluene as a standard diluent and to compare different diluents and solvents with a
standard solvent (n-butyl acetate). The standard dilution ratio of toluene by n-butyl acetate
15.1 Standard methods of solvent analysis 1057

solution is 2.73-2.83. Two end points are determined. The first occurs when a known
amount of diluent forms precipitate after 2 min of vigorous swirling. The second is deter-
mined by re-dissolving the precipitate, adding a known volume of solvent (dependent on
dilution ratio) and precipitating it again with diluent.35
Similar method can be used for any resin, solvent, or diluent.36 A solution of resin isprepared by the method described in ASTM D 1725 or by dispersing in blender (results maydiffer). Precipitation with diluent is determined at 25oC. The diluent is added dropwise fromburette or weight is controlled throughout the experiment. The resin dilutability is recorded.If more than 100 g of diluent is required for 10 g of solution then diluent is regarded as beinginfinitely soluble.
Heptane miscibility in lacquer solvents is determined by mixing equal amounts of thespecimen (lacquer) and heptane.37 If a clear solution results after mixing, it indicates goodmiscibility. If a turbid solution results, either the heptane is immiscible with the tested spec-imen or water is present in either component.
Water-insoluble admixtures in solvents may affect many uses of solvent. The speci-men solvent (primarily acetone, isopropanol, methanol, and many other) is diluted to 10volumes with water and the resulting turbidity or cloudiness is recorded.38
15.1.12 DISSOLVING AND EXTRACTION
A standard practice for preparing polymer solution contains information on solvents, their
concentration, temperature, pressure, mixing time, and heating.39 The annex contains
information on the best solvents for 75 typical polymers with different degrees of
substitution or modification. Frequently, temperature and concentration of solution is also
given.Solvent extraction is used on textile materials to determine naturally occurring oily
and waxy materials that have not been completely removed from the fibers.40 The percent-age of extracted material is given in relationship to the dry mass of fiber. Solvents used forextraction including 1,1,2-trichloro-1,2,3-trifluoroethane and dichloromethane but thesemay be replaced by other solvents by mutual agreement. The Soxhlet extraction andgravimetric determination are used.
15.1.13 ELECTRIC PROPERTIES
Specific resistivity is numerically equivalent to the volume resistance between opposite
faces of one centimeter cube. The specific resistivity of electronic grade solvents is
measured by a low-voltage a-c bridge operating at 1000 Hz providing the specific resistance
does not exceed 109 Ω-cm.41 If the specific resistance is higher than 109 Ω-cm, d-c
equipment is used. D-c equipment is capable of measuring up to at least 1012 Ω-cm.The electrical conductivity of liquid hydrocarbons can be measured by a precision me-
ter.42 The method is used to evaluate aviation fuels and other low-conductivity hydrocar-bons. The generation and dissipation of electrostatic charges in liquids during handlingdepends on ionic species which may be characterized by electrical conductivity at rest. Thedissipation time of the charges is inversely proportional to the conductivity. The measure-ment is done by a conductivity meter.
Two standard methods43,44 were designed to determine the electric breakdown voltageof insulating oils of petroleum origin. These are VDE electrodes method43 and the methodunder impulse conditions.44 The dielectric breakdown voltage measurement allows to esti-mate the ability of an insulating liquid to withstand electric stress without failure. In thepresence of contaminations such as water, dirt, or cellulosic fibers low breakdown voltagesare obtained. VDE stands for Verband Deutscher Electrotechniker, an organization whichdesigned brass electrodes used for measurement. The equipment uses a transformer, voltage
1058 George Wypych

control equipment, and a voltmeter. The impulse method44 uses highly divergent field underimpulse conditions. The breakdown voltage of fresh oil decreases as the concentration of ar-omatic hydrocarbons increases. The method can be used for quality control of fresh oil, anddetermining the effect of service aging, and effect of impurities. The material is placed intest cell containing electrodes which are supplied from an impulse generator controlled byvoltage control equipment.
15.1.14 ENVIRONMENTAL STRESS CRAZING
Crazing is a group of surface fissures which appear as small cracks after the material has
been exposed to solvent and stress. Crazes are usually oriented perpendicular to stress and
their appearance depends on the index of refraction and on the angle of viewing. A suitable
light source must be used. Transparent plastic materials can be directly tested for crazing.45
Two variations of method are used to determine stress crazing of transparent plastics:
determination of stress required to cause cracking or determination of craze development
along the time of stress application. In the first method specimens are exposed to solvent by
the direct contact of specimen surface with filter paper wetted with solvent. By selecting
different values of stress (using each time new specimen) the range of two stress forces is
searched for the largest stress under which specimen does not craze and the smallest stress
under which it does craze. In the second variation of the method, sample is tested first
without solvent to assure that it does not craze under the selected load. Solvent is then
applied and specimen inspected in 15 min time intervals taking note of location of craze
front as crazing progresses. If the sample does not craze higher load is selected and vice
versa. Similar to the first variation the range is determined within which specimen crazes
and does not craze.The crazing effect can be indirectly determined by testing chip impact resistance of
specimens which crack either because of weathering or environmental stress cracking.46
15.1.15 EVAPORATION RATE
The evaporation rate of a solvent is determined to obtain relative value to some standard, se-
lected solvent. The solvent selection depends on reasons for solvent use and the type of sol-
vent and it is usually agreed upon between interested parties. In Europe, diethyl ether is the
most frequently used reference solvent and in the US butyl acetate. The evaporation rate of
other solvents is determined under identical conditions and the resultant values are used to
rank solvents. The most obvious requirement is that the determination is done without ex-
cessive drafts and air currents. The evaporation rate is the ratio of the time required to evap-
orate a test solvent to the time required to evaporate the reference solvent under identical
conditions. The results can be expressed either as the percentage evaporated within certain
time frame, the time to evaporate a specified amount, or a relative rate. Relative rate is the
most common.For halogenated solvents used in cleaning applications, the relative evaporation rate is
compared either to xylene or perchloroethylene.47 The determination is done on a test panelusing 10 ml of solvent. The relative evaporation rate is calculated.
15.1.16 FLAMMABILITY LIMITS
These tests cover the methods of determination of the minimum temperature at which
vapors in equilibrium with liquid solvent are sufficiently concentrated to form flammable
mixtures with air at atmospheric pressure and concentration limits of chemicals. Flammable
(explosive) limits are the percent levels, volume by volume, of a flammable vapor or gas
mixed in air between which the propagation of a flame or an explosion will occur upon the
15.1 Standard methods of solvent analysis 1059

presence of ignition. The leanest mixture at which this will occur is called the lower flam-
mable limit. The richest mixture at which it will occur is the upper flammable limit. The per-
cent of vapor mixture between the lower and upper limits is known as the flammable range.The temperature limits of flammability can be determined in an air/vapor mixture
above a flammable liquid in a closed vessel.48 The temperature in vessel is varied until aminimum temperature is reached at which the flame will propagate away from the ignitionsource. A glass vessel is equipped with an ignition device, a magnetic stirrer, a clamping de-vices, and a safety glass window. The initial temperature of determination is estimated fromclosed-cup flash point measurement. If the flash point is below 38oC, the initial temperatureshould be 8oC below flash point temperature. If the flash point is between 38 and 96oC, thestarting temperature should be at least 14oC below the flash point. If the flash point tempera-ture is above 96oC then the initial temperature should be 22 to 44oC below the flash pointtemperature. Selecting higher initial temperature may result in explosion. The lower tem-perature limit of flammability is obtained from the test which can be used to determineguidelines for the safe handling of solvents in closed process and storage vessels.
The concentration limits of flammability are determined using another method.49 Themethod is limited to atmospheric pressure and temperature of 150oC. Equipment is similarto that used in the previous method. A uniform mixture of vapor and air is ignited and flamepropagation from ignition source is noted. The concentration of flammable components isvaried until a composition is found which is capable to propagate flame.
15.1.17 FLASH POINT
A variety of apparatus such as the small scale closed tester,50 the tag open cup,51 the tag
closed tester,52 the Cleveland open cup,53 the Pensky-Martens closed cup,54 and the equilib-
rium method55 are used to determine the flash point. The selection of method is based
suggestions included in separate standard.56
The small scale closed tester50 is a metal cup with a thermometer fitted below the bot-tom of the internal chamber with a hinge mounted cover having filling orifice. The sample isintroduced to the cup and the cup is maintained at a constant temperature by means of tem-perature controller. After a specific time, a test flame is applied for 2.5 s and an observationis made whether or not flash has occurred. If flash did not occur the cup is cleaned, a newsample is introduced and the temperature is increased by 5oC. The measurements are re-peated until the flash point is determined with accuracy of 1oC.
The tag open cup51 is a larger unit equipped with water-glycol bath for temperaturecontrol or a solid carbon dioxide-acetone bath for lower flash points. A much larger sampleis used with this equipment and the temperature is gradually increased at a rate of 1oC/min.A taper flame is passed for 1 s in 1 min intervals until the flash point is detected. The tagclosed tester52 can use either a manual or an automated procedure. A sample volume of 50ml is used. Either a gas flame or an electric ignitor is used. In the automated mode, theequipment is programmed to perform the standard procedure.
The Cleveland open cup53 is placed on a heated plate which increases temperature at arate of 5-6oC/min. This method can also be automated. The method is designed for testingpetroleum products which are viscous and have flash point above 79oC. ThePensky-Martens54 closed cup tester was also designed for petroleum products but for thosewith flash points from 40 to 360oC. This apparatus has its own heating source, stirrer, andcover by which it differs from Cleveland cup. It can be either manual or automated. Theequilibrium method55 uses either a modified tag close cup or the Pensky-Martens apparatus.The modification intended to keep the vapor/air temperature in equilibrium with the liquidtemperature. The method is limited to the temperature range from 0 to 110oC.
1060 George Wypych
Depending on the viscosity of liquid and its expected flash point range, one of theabove methods is chosen as described in detail elsewhere.56 It should be additionally notedthat if the flash point method uses continuous heating, it is not suitable for testing mixturesof flammable substances because their vapor concentrations are not representative of equi-librium conditions. One of the weaknesses of flash point analysis is that the flame is wellabove the liquid surface therefore full vapor concentration is not attained. Many cases existwhere a flash point cannot be detected but the material does form flammable mixtures. Be-fore a method is chosen and a data interpretation made full information on the test procedureshould be studied in detail and the proper authorities should be consulted to define safepractices for a particular material.
15.1.18 FREEZING POINT
Freezing point apparatus consists of freezing tube, Dewar flasks to act as cooling and
warming baths, stirring mechanisms, absorption tubes, clamps and other auxiliary parts.57
Freezing point can be obtained precisely from interpretation of time-temperature freezing
and melting curves. The determination is made by measuring the electrical resistance of
liquid which decreases on cooling and becomes constant when it freezes. This method in
conjunction with the testing details described in a separate standard58 can be used to deter-
mine the purity of many hydrocarbon solvents. The data given in the last standard58 allow
for a precise determination of the purity of solvent in percent of pure compound. A simple
method was designed to determine solidification point of benzene based on visual
observation of formation of solid phase.59
15.1.19 FREE HALOGENS IN HALOGENATED SOLVENTS
This simple qualitative test involves the extraction by water of free halogens, followed by
the reaction of the halogens with potassium iodide in the presence of a starch indicator.60
The solution color changes to blue in the presence of free halogens.
15.1.20 GAS CHROMATOGRAPHY
Gas chromatography provides many tools for the analysis of solvents. In section 15.1.4, a
method was discussed which determines the distribution of boiling points of hydrocarbon
mixtures. Many uses of gas chromatography for the determination of purity of different sol-
vents are discussed in Section 15.1.25. In this section, some examples of of gas chromatog-
raphy are included to show its usefulness in the qualitative determination of solvents
mixtures61 the analysis of solvent impurities,62-64 the determination of solvents in a product
by direct injection,65 and the generation of data to evaluate waste materials to determine
their hazardous content.66
The relative distribution of aromatic hydrocarbons in xylene products can be quantita-tively determined by gas chromatography.61 A flame ionization or thermal conductivity de-tector is used with a capillary or packed column containing crosslinked polyethylene glycolas the stationary phase. The peak area of each component is measured and the weight per-centage concentration is calculated by dividing the peak area of the component by the sumof the areas of all peaks.
Ortho-xylene concentration and the concentrations of its admixtures and impuritiesare measured using a flame ionization detector and a polar fused-silica capillary column.62
An internal standard (iso-octane) is used to increase precision and a standard mixture is usedfor calibration. A similar method is used with p-xylene but either n-undecane or n-octaneare used as the internal standards.63 In both methods, peak areas are interpreted relative tothe peak area of internal standard. The main impurities in benzene are non-aromatics withless than 10 carbons, toluene, 1,4-dioxane and aromatics containing 8 carbon atoms. The
15.1 Standard methods of solvent analysis 1061

method of determination of benzene impurities64 is similar to two methods describedabove.62,63 Normal-nonane is used as an internal standard. In all three methods the internalstandards must be at least 99% pure component.
A gas chromatograph equipped with a thermal conductivity or a flame ionization de-tector and capillary or packed columns is used for direct determination of solvents inpaints.65 Columns are usually packed with either polyethylene glycol (molecular weight20,000) or a diisodecyl phthalate as liquid phase on diatomaceous earth (60-80 mesh) usedas a solid support. Low viscosity paints are drawn into a syringe and injected through the in-jection port. High viscosity paints are diluted with solvent that does not interfere with theanalysis, usually ethyl ether or dichloromethane. A standardized gas chromatographictechnique66 is capable of determining the 67 solvents most frequently found in hazardouswastes. Several detectors are suggested for analysis such as flame ionization, electron cap-ture, thermal conductivity, photoionization, or mass selective. Each waste mixture maycontain a large number of solvents. Their detection is facilitated by the use of gaschromatograph interfaced with mass spectrometer. The method is designed to facilitate siteassessment, recycling operations, plant control, and pollution programs.
15.1.21 LABELING
Warnings, first aid measures and operating instructions are standardized for vapor
degreasers.67 Placards containing this information should be placed close to the degreaser in
an area accessible to employees. The placards should contain the information required by
applicable federal and local laws and regulations. The placard should include name of the
solvent used, and warnings indicating that the vapor is harmful, that breathing the vapor
should be avoided, that the machine should only be used with proper ventilation, that swal-
lowing and contact with the skin should be avoided, that cutting or welding should not be
performed close to the machine, and that the tank should not be entered unless a proper
procedure is followed. In addition, start-up and operation procedures should be available.Minimum labeling requirements for several halogenated solvents should also follow a
standard practice.68 The label should state the company name, its logo and address, emer-gency telephone numbers, lot number, the net weight, solvent name, its CAS number,OSHA PEL and ACGIH TLV values, and quantity. In addition, health and safety informa-tion, precautions, first aid, and handling and storage information should be provided.
15.1.22 ODOR
Strips of rapid qualitative paper are dipped in a standard liquid and in the liquid under the
test. Their odor is compared to establish if the odor of sample is more or less acceptable than
the standard to the purchaser and the manufacturer.69 In a similar method, papers dipped in a
standard and specimens are allowed to dry at room temperature and tested for residual odor
at specified time intervals.Odor testing may be performed by a selected group of panelist to either determine the
effect of various additives on the odor or taste of a medium or to determine the odor or tastesensitivity of a particular group of people.70 For this purpose, a series of samples is preparedin concentration scale which increases in geometric increments. At each concentration steptwo samples containing the medium alone are given to a panelist. The panelist should deter-mine which sample is different from the other two samples. The panelist should begin withthe lowest concentration selected to be two or three concentration steps below estimatedthreshold. The method description contains information on sample selection and prepara-tion, result, and precision determination.
A method of evaluation of denatured and undenatured alcohols to assess their accept-ability is used.71 This method is developed specifically to compare methanol, ethanol,
1062 George Wypych

isopropanol, and n-propanol. The group of panelist is asked to compare the characteristicand residual odors of evaporation, its intensity by dilution, and its concentration. A similarmethod was developed for a series of glycols.72 Here, odor character and intensity are evalu-ated.
The residual odor of a drycleaning grade of perchloroethylene is determined by com-paring treated and untreated samples of bleached cotton fabric. The treated fabric is soakedfor 5 min in perchloroethylene and dried for 4 hours at room temperature.73 Good qualityperchloroethylene should leave no odor.
15.1.23 PAINTS − STANDARDS RELATED TO SOLVENTS
The paint industry, a major user of solvents, has developed numerous standards. Some are
included in Sections 15.1.25, 15.1.31, and 15.1.35. The paint industry also uses many gen-
eral standards and some specific standards, which have not been included in any other sec-
tion of this chapter. Details of these are given below.Sampling and testing requirements for solvents used in the paint industry are summa-
rized in a special standard.74 This comprehensive list of standards used by paint industryalso includes a brief discussion of each method of testing, including sampling, specificgravity, color, distillation range, nonvolatile matter, odor, water, acidity, alkalinity, estervalue, copper corrosion test, sulfur, permanganate time test for acetone and methanol, flashpoint, purity of ketones, solvent power evaluation, water miscibility, analysis of methanol,analysis of ethylene and propylene glycols, acid wash color of aromatic hydrocarbons, par-affins and other nonaromatic hydrocarbons in aromatics, and aromatics in mineral spirits.
The nonvolatile matter in paints is determined by a gravimetric method after drying a100 ml sample in oven at 105oC.75 The transfer efficiency of paints is a volume or weight ra-tio of paint solids deposited to the volume/weight of the paint solids sprayed, expressed inpercent. This method76 can be used to optimize the paint application process. The measure-ment is done by weighing or measuring the volume of paint used on a certain sprayed sur-face area and comparing this value with known or predetermined by the above methodweight of solids in the paint used for spraying.
In order to determine an ester value for solvents or thinners, the specimen is reactedwith aqueous potassium hydroxide, using isopropanol as the mutual solvent.77 The hydroly-sis is conducted at 98oC and the excess potassium hydroxide is determined by titration.From the amount of potassium hydroxide consumed, the ester value is calculated.
15.1.24 pH
A method developed for halogenated solvents is applicable for determining the pH of water
extracts of solvents.78 The solvent sample is shaken with distilled or deionized water and the
pH is determined either by comparing color upon the addition of Gramercy universal indi-
cator or by using a glass electrode pH meter.
15.1.25 PURITY
Several techniques are used to determine purity of solvents. Gas chromatography is the
most common and this and other methods are discussed first followed by other analytical
methods which include instrumental and simple methods. The aim of these tests is to deter-
mine the concentration of the main component but more frequently qualitative and quantita-
tive determination of admixtures. Some methods have already been discussed in Sections
15.1.1, 15.1.5, 15.1.8, 15.1.9, 15.1.18, 15.1.20 and 15.1.23.Alcohol content and purity of an acetate ester is determined by gas chromatography.79
The method was applied to ethyl, n-propyl, isopropyl, n-butyl, isobutyl, and 2-ethylhexylacetates. Water and acetic acid cannot be measured by this method and other methods are
15.1 Standard methods of solvent analysis 1063

used. A thermal conductivity or flame ionization detector is used. A stainless steel columnwith 80-100 mesh Chromosorb G-HP is used with 9.05% Dow Corning QF-1 and 0.45%Igepal CO-990. The concentration of the main component and the amount of free alcoholare measured by the method.
Traces of benzene in hydrocarbon solvents are measured by capillary gas chromatog-raphy.80 Because of the hazardous nature of benzene, the method was introduced to ensurecompliance with the stringent regulations. A flame ionization detector is used with 0.53 mmfused silica capillary columns with bound methyl silicone or polyethylene glycol. Similarmethod is used to determine benzene content in cyclic products (cyclohexane, toluene,cumene, styrene, etc.).81 This method does not specify any particular column but the columnused should be able to resolve benzene from other components. The method can determinebenzene in concentrations of 5 to 300 mg/kg. Traces of thiophene in refined benzene are de-termined by a flame photometric detector.82 Several column types given in standard arefound satisfactory to overcome potential problem of quenching effects of hydrocarbons onthe light emissions from thiophene. High purity benzene for cyclohexane feedstock is testedfor several known impurities by capillary gas chromatography.83 The gas chromatograph isequipped with a flame ionization detector and a splitter injector suitable for fused silica cap-illary column internally coated with crosslinked methyl silicone. The concentration of ben-zene and the concentrations of impurities can be adequately determined.
The purity of halogenated solvents is determined using a thermal conductivity orflame ionization detector, a column made from 3.2 mm stainless tubing packed with 30 wt%silicone fluid on 80-100 mesh diatomaceous earth or using capillary column.84 Admixturesin 1,1,1-trichloroethane are determined using a thermal conductivity or hydrogen flame de-tector. Column from copper or stainless steel is packed with Chromosorb W HP with 20%polydimethylsiloxane.85
Various impurities, such as hydrocarbons, acetone, alcohols and other can be deter-mined using a thermal conductivity or a flame detector.86 Several columns are specified inthe standard mostly using polyethylene glycol on diatomaceous earth. For determination ofpurity of methyl isobutyl ketone different method is used.87 In both cases the amounts of de-termined impurities are subtracted from total mass to give purity of specimen.
The determination of aromatics in mineral spirits is another method that has been de-veloped to ensure compliance with regulations restricting aromatic content.88 Three meth-ods are given, each capable to determine ethylbenzene and total aromatic content. Themethods differ in column type and packing.
A spectrophotometric method89 for determining thiophene in benzene is available asalternative to gas chromatography.82 The spectrometer used is capable of detectingabsorbance in the range from 400 to 700 nm with a repeatability of 0.005 absorbance units.Thiophene is reacted with isatin to form a colored compound. The quantitative determina-tion is based on reading concentrations from master curve.
The presence of reducing substances in pyridine can be detected by a simple visual ob-servation.90 The sample of pyridine is mixed with 0.32% potassium permanganate solutionand color is observed after 30 min. If color of the potassium permanganate is retained, thesample is free of reducing agents.
Oxidative microcoulometry is used to determine trace quantities of sulphur in aro-matic hydrocarbons.91 An oxidative pyrolysis converts sulfur to sulfur dioxide which is ti-trated in titration cell with the triiodide ion present in the electrolyte.
The total chloride (organic and inorganic) in aromatic hydrocarbons and cyclohexanecan be determined by titration.92 Bromides and iodides present are recorded as chlorides.The sample is mixed with toluene in a proportion which depends on the expected concentra-tion of chloride. The reagent sodium biphenyl is added to convert organic halogens into in-
1064 George Wypych

organic halides. After decomposing the excess reagent with water, the separated aqueousphase is titrated in presence of acetone with a silver nitrate solution. Organic chlorides pres-ent in aromatic hydrocarbons can also be determined by microcoulometry.93 The presenceof chlorine compounds may adversely affect equipment and/or reaction therefore their con-centration is frequently controlled. A liquid specimen is injected into a combustion tubemaintained at 900oC, converted to hydrogen halides, and carried by a carrier gas (50% oxy-gen, 50% argon) to a titration cell where it reacts with silver ions in the electrolyte.
The determination of peroxides has two goals: one is to monitor peroxide concentra-tion used as initiator and catalysts and the other is to detect formation of hazardous perox-ides formed as autoxidation products in ethers, acetals, dienes, and alkylaromatichydrocarbons. A sample is dissolved in a mixture of acetic acid and chloroform. The solu-tion is deaerated and potassium iodide reagent is added and let to react for 1 h in darkness.94
The iodine formed in reaction is measured by absorbance at 470 nm and result calculated toactive oxygen in the sample. The method can determine hydroperoxides, peroxides,peresters, and ketone peroxides. Oxidizing and reducing agents interfere with the determi-nation.
Mercaptans in motor fuels, kerosene and other petroleum products can be detected byshaking the liquid sample with sodium plumbite solution, adding powdered sulfur and shak-ing again.95 If a mercaptan or hydrogen sulfide is present, discoloration of the floating sulfuror liquid phase occurs.
The nonvolatile content of a halogenated solvent is determined by drying the samplein a platinum evaporating dish at 105oC.96 Depending on boiling point and the concentrationof nonvolatile matter three alternate procedures are proposed.
The Karl Fisher method is recommended for general use in solvents to determine thewater content.97 It is not suitable if mercaptans, peroxides, or appreciable quantities of alde-hydes and amines are present. Water in halogenated solvents may cause corrosion, spotting,reduce shelf-life of aerosols, or inhibit chemical reactions, thus special method, also basedon the Karl Fischer titration, was developed for halogenated solvents.98
The titration of ionizable chlorides with mercuric acetate solution in the presence ofs-diphenylcarbazone as an indicator is used to determine chloride intrichlorotrifluoroethane.99 A visual appearance test to detect admixtures in halogenated sol-vents is based on the observation of suspended particles, sediment, turbidity and free float-ing water.100
The aromatic content of hydrocarbon mixture is estimated from the determination ofaniline point.101 Aromatic hydrocarbons have the lowest and paraffins the highest anilinepoints. Cycloparaffins and olefins are between the two. Aniline point increases as the mo-lecular weight increases. A mixture of specific aniline and solvent is heated at a controlledrate until it forms one phase. The mixture is then cooled and the temperature at which themiscible liquid separates into two phases is determined. Four methods are discussed in thestandard101 suitable for transparent, non-transparent, easily vaporizing, and measured insmall quantities.
The presence of oxidizable materials in acetone and methanol that are associated withcontaminations during manufacture and distribution can be evaluated by permanganatetime.102 Oxidizable contaminants may adversely affect catalysts or ligand complexes whichare sensitive to oxidation. Oxidizable substances reduce potassium permanganate to man-ganese oxide which is yellow. The method is designed to measure the time required tochange color to the color of a standard.
Small admixtures of acetone in methanol (more than 0.003 wt%) can be detected aftera reaction with Nessler’s reagent.103 The reacted sample is compared with a standard, whichcontains 0.003 wt% acetone and the difference in turbidity is reported.
15.1 Standard methods of solvent analysis 1065

15.1.26 REFRACTIVE INDEX
Refractive index is measured by a standard method.104 It covers transparent and light col-
ored liquids having a refractive index in the range from 1.33 to 1.50. The refractive index is
the ratio of light velocity of a specified wavelength in air to its velocity in the substance un-
der evaluation. The refractive dispersion is the difference between refractive indices for
light of two different wavelengths. This value is usually multiplied by 10,000. The method
uses a Bausch & Lomb refractometer equipped with a thermostat and with a circulating bath
to control the sample temperature with a precision of 0.2oC. Several light sources can be
used, including the sodium arc lamp, mercury light lamp, and hydrogen or helium discharge
lamp. Light sources are equipped with filters which transmit a specific spectral line. Stan-
dardization of equipment is done using a solid reference standard or using liquids standards
such as 2,2,4-trimethylpentane (1.39), methylcyclohexane (1.42), or toluene (1.49).
15.1.27 RESIDUAL SOLVENTS
Residual solvents may cause odor, off-taste, blocking, and an increased degradation rate in
outdoor exposures. A single standard test method has been developed to determine residual
solvent levels and it is primarily used for the evaluation of flexible barrier materials.105 The
method is based on gas chromatography. The specimen of the barrier material is enclosed in
a container and heated to vaporize the retained solvents into the head space. The vapor from
the head space is taken by a gas syringe and injected into a gas chromatograph. The recovery
of solvents is compared by the means of response factor which is a peak intensity of the
detector in response to a given volume of injected sample. Response factors of different
solutions vaporized in the test containers are compared. Round robin tests have
demonstrated that this method has a coefficient of variation between laboratories of ±15%.
The method does not specify the detector or the columns. Before a flexible barrier material
is analyzed, the optimum heating time to recover volatilized solvents is determined.
15.1.28 SOLUBILITY
Solvent power of a hydrocarbon solvents is determined by kauri-butanol value.106 The
method applies to solvents having a boiling point above 40oC and a dry point below 300oC.
The method is most frequently used to evaluate solvents for applications in paints and lac-
quers. The kauri-butanol value is the volume of solvent required to produce a defined de-
gree of turbidity when added to 20 g of a standard solution of kauri resin in n-butanol (400 g
of resin in 2000 g of solvent). High kauri value indicates a relatively strong dissolving
power. The method is standardized using 105±5 ml of toluene.The solubility of common gases in hydrocarbon liquids is determined to meet require-
ments of aerospace industry.107 This test method is based on the Clausius-Clapeyron equa-tion, Henry’s law, and the perfect gas law. The results are important in the lubrication of gascompressors where dissolved gas may cause erosion due to cavitation. In fuels, dissolvedgases may cause interruption of fuel supply and foaming in tank. The liquid density is deter-mined experimentally. Using this density, the Ostwald coefficient is taken from a chart andused for the calculation of the Bunsen coefficient (solubility of gas). The solubility of thegas or mixture of gases and Henry’s law constant are also calculated.
15.1.29 SOLVENT PARTITIONING IN SOILS
A procedure is available to determine partitioning organic chemicals between water and soil
or sediment.108 By measuring sorption coefficients for specific solids, a single value is
obtained which can be used to predict partitioning under a variety of conditions. The
1066 George Wypych

underlining principle of the method is that organic chemicals bind with the surfaces of
solids through chemical and physical interactions. However, the sorption coefficient is
based on organic carbon content which does not apply to all solvents or all soils.The sorption coefficient of a particular solvent is measured by equilibrating its aque-
ous solution, containing a realistic concentration similar to that found in the environment,with a known quantity of soil or sediment. After equilibrium is reached, the concentration ofsolvent in the water and the soil is measured by a suitable analytical technique. The sorptionconstants for all solids tested are averaged and reported as a single value. The standard doesnot define the actual method of determining the concentrations but strategy that should befollowed. The data are useful in predicting the migration of chemicals in soil, in estimatingtheir volatility from water and soil, determining their concentration in water, and their pro-pensity to leach through the soil profile.
15.1.30 SOLVENT EXTRACTION
Often materials must be extracted from a compounded product to perform testing. Extracted
material must then be recovered from solution without degradation to be subjected to
testing. The method discussed here was developed as means of recovering asphalt from
pavement samples.109 The solution of extracted asphalt in solvent is distilled by rotating the
distillation flask of a rotary evaporator in a heated oil bath. The distillation is carried out un-
der partial pressure in the presence of nitrogen to prevent degradation. The asphalt
recovered by this method can be tested in the same manner as were the original asphalt sam-
ples.
15.1.31 SPECIFICATIONS
Standard specifications are designed to set criteria for commercial solvents which can be
used to determine the compliance of a solvent sample. Because applications of solvents dif-
fer very widely, the selected criteria are also different for different groups of solvents. Table
15.1.1 is a compiled list of parameters all of which can be found in solvent specifications.
The most common parameters used to characterize solvent include acidity, appearance,
color, concentration of main component, distillation range, dry point, initial boiling point,
and specific gravity. The methods of determining these parameters are found in this chapter.The list of references includes information on specifications for various solvents.
Solvents in this list are arranged into groups: alcohols,110-120 aromatic hydrocarbons,121-128
other hydrocarbons,129-132 ketones,133-138 esters,139-145 glycol,146 and chlorine-containing sol-vents.147-152
15.1.32 SUSTAINED BURNING
The sustained burning test was originally developed for British Standard BS-3900 and
adapted by ASTM.153 The purpose of the test is to determine the sustained burning
characteristics of solvents by direct experiment rather than by deducing characteristics from
flash point data. Mixtures of some flammable liquids (e.g., alcohol and water) are classified
as flammable based on the closed-cup flash point method. Some mixtures may be classed as
flammable even though they do not sustain burning. The test is performed in a block of
aluminum with a concave depression called a well. The liquid under test is heated to a tem-
perature of 49oC and a flame is passed over the well and held in position for 15 s. The
specimen is observed to determine if it can sustain burning.
15.1 Standard methods of solvent analysis 1067

15.1.33 VAPOR PRESSURE
The vapor pressure is the pressure of the vapor of a substance in equilibrium with the pure
liquid at a given temperature. Two procedures are used: an isoteniscope procedure
(standard) for measuring vapor pressures from 1x10⁻¹ to 100 kPa and a gas-saturation
pressure for measuring vapor pressures from 1x10-11 to 1 kPa.154-155 In the isoteniscope
method, a sample is deaerated by heating under reduced pressure. The vapor pressure is then
determined by balancing the pressure of the vapor against a known pressure of an inert gas.
The vapor pressure is determined at minimum three different temperatures.In the gas-saturation method, an inert gas is passed through a sufficient amount of
compound to maintain saturation. The vapor is then removed from the gas by a sorbent or acold trap and quantitatively determined by gas chromatography or other suitable technique.
15.1.34 VISCOSITY
The viscosity of solvents can be determined by one of three methods: glass viscometer,156
Saybolt viscometer,157 and bubble time method.158 Glass viscometry is applicable to
Newtonian, transparent liquids which because of volatility cannot be measured in
conventional capillary viscometers. The viscometer uses a purge gas which helps to transfer
the measuring liquid from a lower reservoir to the sample bulb. The time of flow is
measured for a fixed volume of liquid at a temperature controlled with a precision of 0.01oC.
A set of liquids is available as viscosity standards in order to select the standard having
closest viscosity to the measured sample.The Saybolt viscometer was developed for petroleum products. A sample of 60 ml
flows through a calibrated orifice and the time of flow is measured at a controlled tempera-
1068 George Wypych
Table 15.1.1. Typical chemical and physical properties of solvents included in theirspecifications
Acid acceptance Distillation range
Acidity Doctor test
Acid wash color Dry point
Alkalinity Flash point
Aluminum scratch Free halogens
Aniline point Initial boiling point
Appearance Iron concentration
Bromine index Kauri-butanol value
Color Non-volatile matter
Concentration of admixtures Permanganate time
Concentration of isomers Residual odor
Concentration of main component (or purity) Specific gravity
Concentration of sulfur Water concentration
Copper corrosion Water miscibility

ture. Measurements are made at a temperature selected from the range 21-99oC. The instru-ment is standardized by measuring the flow of a standard oil at both 37.8 and 50oC.
In the bubble method, a standard viscosity tube is filled with a specimen liquid, thetemperature of liquid is equilibrated to 25oC in a bath, the level of the meniscus is adjustedto 100 mm line, cork is inserted to end on 108 mm line, sample is hold in thermostating bathfor another 20 min. Then the tube is inverted and the time for the bubble to flow from a markat 27 mm to 100 mm is measured.
15.1.35 VOLATILE ORGANIC COMPOUND CONTENT, VOC
Several terms are used in the paint industry to provide data on the VOC content of paints.159
The percent of solids in paints is calculated either per unit weight or per unit volume. The
weight solids content is the weight of non-volatile materials divided by the total weight of
the coating. In practice, it is calculated by subtracting the total weight of volatile solvents
from the total weight of the coating and dividing the result by the total weight of coating.
The final result is multiplied by 100 to express it in percent. Percent of solids by weight is
calculated in similar manner.A solvent, as defined by paint standards, is a volatile liquid that is incorporated primar-
ily for vehicle solvency and control of the application characteristics. The solvent content isthe calculated weight of solvents in a specific volume of paint. This definition is not equiva-lent to the definition of VOC compound because it does include compounds which are ex-cluded by EPA (see more on this subject in Section 18.1).
Volatile organic compound by EPA definition means any compound of carbon, ex-cluding carbon monoxide, carbon dioxide, carbonic acid, metallic carbides or carbonates,and ammonium carbonate, which participates in atmospheric photochemical reactions. Thisincludes any such organic compound other than the following, which have been determinedto have negligible photochemical reactivity: methane; ethane; methylene chloride;1,1,1-trichloroethane; 1,1,2-trichloro-1,2,2-trifluoroethane; trichlorofluoromethane;dichlorodifluoromethane; chlorodifluoromethane; trifluoromethane; dichlorotetrafluoro-ethane; chloropentafluoroethane; dichlorotrifluoroethane; tetrafluoroethane;dichlorofluoroethane; chlorodifluoroethane; 2-chloro-1,1,1,2-tetrafluoroethane;pentafluoroethane; 1,1,2,2-tetrafluoroethane; 1,1,1-trifluoroethane; 1,1-difluoroethane;perchloroethylene; acetone; parachlorobenzotrifluoride; cyclic, branched, or linear com-pletely methylated siloxanes; and perfluorocarbon compounds which fall into these classes:cyclic, branched, or linear, completely fluorinated alkanes; cyclic, branched, or linear, com-pletely fluorinated ethers with no unsaturations; cyclic, branched, or linear, completely flu-orinated tertiary amines with no unsaturations; and sulfur containing perfluorocarbons withno unsaturations and with sulfur bonds only to carbon and fluorine. For purposes of deter-mining compliance with emissions limits, VOC is measured by the test methods in the ap-proved State implementation plan (SIP) or 40 CFR Part 60, Appendix A, as published in(7/1/91) edition, as applicable.
Based on the above definition of VOC, the VOC content is calculated from a formulaby excluding from the total solvent content of the paint, the content of water and solventsexcluded by the above regulation. The following formula can be used for VOC calculation:
VOCW W W
V V V
total solvents w excluded solvents
w
=− −
− −paint excluded solvents
[15.1.1]
where:
Wtotal solvents total weight of solvents
Ww weight of water present in formulation
15.1 Standard methods of solvent analysis 1069

Wexcluded solvents total weight of solvents excluded by EPA regulation
Vpaint total volume of paint
Vw volume of water present in formulation
Vexcluded solvents total volume of solvents excluded by EPA regulation
The above definition may vary in various countries thus the proper definition should be
obtained from the appropriate authorities. Examples of other definitions are included in
Chapter 18.1.The weight percent of the volatile content in waterborne aerosol paints is determined
by releasing the propellant from can, testing the remaining paint for water content using theKarl Fischer method, and determining non-volatiles.160 The VOC content in a solventborneautomotive paints is determined by the simulation of VOC loss during baking using labora-tory panels.161
REFERENCES1 ASTM D 2106-95. Standard test method for determination of amine acid acceptance (alkalinity) of
halogenated organic solvent.
2 ASTM D 1614-95. Standard test method for alkalinity in acetone.
ISO 755-2-81. Butan-1-ol for industrial use - Methods of test - Part 2: Determination of acidity -
Titrimetric method.
ISO 756-2-81. Propan-2-ol for industrial use - Methods of test - Part 2: Determination of acidity -
Titrimetric method.
ISO 757-2-82. Acetone for industrial use - Methods of test - Part 2: Determination of acidity to
phenolphthalein - Titrimetric method.
3 ASTM D 2989-97. Standard test method for acidity-alkalinity of halogenated solvents and their
admixtures.
ISO 1393-77. Liquid halogenated hydrocarbons for industrial use - Determination of acidity - Titrimetric
method.
ISO 3363-76. Fluorochlorinated hydrocarbons for industrial use - Determination of acidity - Titrimetric
method.
4 ASTM D 847-96. Standard test method for acidity of benzene, toluene, xylenes, solvent naphthas, and
similar industrial aromatic hydrocarbons.
5 ASTM D 1613-96. Standard test method for acidity in volatile solvents and chemical intermediates used
in paint, varnish, lacquer, and related products.
6 ASTM D 2942-96. Standard test method for total acid acceptance of halogenated organic solvents
(nonreflux method).
7 ASTM D 3444-95. Standard test method for total acid number of trichlorotrifluoroethane.
8 ASTM E 659-94. Standard test method for autoignition temperature of liquid chemicals.
AS 1896-1976. Method of test for ignition temperature of gases and vapors.
9 ASTM E 1196-92. Standard test method for determining the anaerobic biodegradation potential of organic
chemicals.
BS 6068-2.34-88. Water quality. Physical, chemical and biochemical methods. Method for the
determination of the chemical oxygen demand.
DIN 38409-41-80. German standard methods for examination of water, waste water and sludge. Summary
action and material characteristic parameters (group H). Determination of the chemical oxygen demand
(COD) in the range over 15 mg/l.
DIN 38409-43-81. German standard methods for the analysis of water, waste water and sludge. Summary
action and material characteristic parameters (group H). Determination of the chemical oxygen demand
(COD). Short duration method.
ISO 5815-89. Water quality - Determination of biochemical oxygen demand after 5 days - Dilution and
seeding method.
ISO 6060-89. Water quality - Determination of the chemical oxygen demand.
JIS K 0400-20-10-99. Water quality - Determination of the chemical oxygen demand.
JIS K 0400-21-10-99. Water quality - Determination of biochemical oxygen demand after 5 days. Dilution
seeding method.
JIS K 3602-90. Apparatus for the estimation of biochemical oxygen demand with microbial sensor.
1070 George Wypych

10 ASTM D 850-93. Standard test method for distillation of industrial aromatic hydrocarbons and related
materials.
BS 7392-90. Method for determination of distillation characteristics of petroleum products (ISO 3405).
ISO 918-83. Volatile organic liquids for industrial use - Determination of distillation characteristics.
ISO 3405-88. Petroleum products - Determination of distillation characteristics.
ISO 4626-80. Volatile organic liquids - determination of boiling range of organic solvents used as raw
materials.
JIS K 2254-98. Petroleum products - Determination of distillation characteristics.
11 ASTM D 1078-97. Standard test method for distillation range of volatile organic liquids.
BS 4591-90. Method of determination of distillation characteristics of organic liquids (other than
petroleum products) (ISO 918).
JIS K 0066-92. Test methods for distillation of chemical products.
12 ASTM D 3272-98. Standard practice for vacuum distillation of solvents from solvent-reducible paints for
analysis.
13 ASTM D 5399-95. Standard test method for boiling point distribution of hydrocarbon solvents by gas
chromatography.
ISO 3924-99. Petroleum products - Determination of boiling range distribution - Gas chromatography
method.
14 ASTM D 5776-98. Standard method for bromine index of aromatic hydrocarbons by electrometric
titration.
ISO 3839-96. Petroleum products - Determination of bromine number of distillates and aliphatic olefins -
Electrometric method.
JIS K 2605-96. Petroleum distillates and commercial aliphatic olefins - Determination of bromine number
- Electrometric method.
15 ASTM D 1492-96. Standard test method for bromine index of aromatic hydrocarbons by coulometric
titration.
16 ASTM D 240-97. Standard test method for heat of combustion of liquid hydrocarbon fuels by bomb
calorimeter.
BS 7420-91. Guide for determination of calorific values of solid, liquid and gaseous fuels (including
definitions).
DIN 5499-72. Gross and net Calorific values. Terms.
DIN 51900-1-89. Determination of gross calorific value of solid and liquid fuels by the bomb calorimeter
and calculation of net calorific value. Part 1: Principles, apparatus, methods.
DIN 51900-2-77. Testing of solid and liquid fuels. Determination of gross calorific value by bomb
calorimeter and calculation of net calorific value. Method of using isothermal water jacket.
DIN 51900-3-77. Testing of solid and liquid fuels. Determination of gross calorific value by bomb
calorimeter and calculation of net calorific value. Method of using adiabatic jacket.
JIS K 2279-93. Crude petroleum and petroleum products - Determination and estimation of heat of
combustion.
17 ASTM D 1405-95a. Standard test method for estimation of net heat of combustion of aviation fuels.
18 ASTM D 5468-95. Standard test method for gross calorific value of waste materials.
19 ASTM D 5468-95. Standard test method for gross calorific and ash value of waste materials.
20 ASTM F 1105-95. Standard test method for preparing aircraft cleaning compounds, liquid-type,
temperature sensitive, or solvent-based, for storage stability testing.
21 ASTM D 3698-92. Standard practices for solvent vapor degreasing operations.
22 ASTM D 4579-96. Standard practice for handling an acid degreaser or still.
23 ASTM D 848-97. Standard test method for acid wash color of industrial aromatic hydrocarbons.
ISO 5274-79. Aromatic hydrocarbons - Acid wash test.
ISO 755-3-81. Butan-1-ol for industrial use - Methods of test - Part 3: Sulfuric acid color test.
JIS K 0072-98. Testing method of color after treatment with sulfuric acid.
24 ASTM D 1686-96. Standard test method for color of solid aromatic hydrocarbons and related materials
in the molten state (platinum-cobalt scale).
BS 5339-76. Method of measurement of color in Hazen units (platinum-cobalt scale) of liquid chemical
products (ISO 2211).
ISO 2211-73. Liquid chemical products - Measurement of color in Hazen units (platinum-cobalt scale).
ISO 6271-97. Clear liquids - Estimation of color by the platinum-cobalt scale.
JIS K 0071-98. Testing methods for color of chemical products - Part 1. Estimation of color in Hazen
units (platinum-cobalt scale).
15.1 Standard methods of solvent analysis 1071

25 ASTM D 2108-97. Standard test method for color of halogenated organic solvents and their admixtures
(platinum-cobalt scale).
26 ASTM D 5386-93b. Standard test method for color of liquids using tristimulus colorimetry.
27 ASTM D 3316-96. Standard test method for stability of perchloroethylene with copper.
28 ASTM D 849-97. Standard test method for copper strip corrosion by industrial aromatic hydrocarbons.
ISO 2160-98. Petroleum products - Corrosiveness of copper - Copper strip test.
JIS K 2513-91. Petroleum products - Corrosiveness to copper - Copper strip test.
SFS-EN ISO 2160. Petroleum products. Corrosiveness to copper. Copper strip test.
29 ASTM D 2943-96. Standard test method for aluminum scratch of 1,1,1-trichloroethane to determine
stability.
30 ASTM D 1217-98. Standard test method for density and relative density (specific gravity) of liquids by
Bingham pycnometer.
31 ASTM D 891-95. Standard test method for specific gravity, apparent, of liquid industrial chemicals.
BS 4522-88. Method for determination of absolute density at 20oC of liquid chemical products for
industrial use (ISO 758).
JIS K 0061-92. Test methods for density and relative density of chemical products.
32 ASTM D 2111-95. Standard test methods for specific gravity of halogenated organic solvents and their
admixtures.
33 ASTM D 1555-95. Standard test method for calculation of volume and weight of industrial aromatic
hydrocarbons.
34 ASTM D 1555M-95. Standard test method for calculation of volume and weight of industrial aromatic
hydrocarbons (metric).
ISO 5281-80. Aromatic hydrocarbons - Benzene, xylene and toluene - Determination of density at 20oC.
SFS 3773-76. Determination of density of liquids at 20oC.
35 ASTM D 1720-96. Standard test method for dilution ratio of active solvents in cellulose nitrate solutions.
36 ASTM D 5062-96. Standard test method for resin solution dilutability by volumetric/gravimetric
determination.
37 ASTM D 1476-96. Standard test method for heptane miscibility of lacquer solvents
38 ASTM D 1722-94. Standard test method for water miscibility of water-soluble solvents.
39 ASTM D 5226-98. Standard practice for dissolving polymer materials.
40 ASTM D 2257-96. Standard test method for extractable mater in textiles.
41 ASTM F 58-96. Standard test method for measuring specific resistivity of electronic grade solvents.
JIS C 0052-95. Environmental testing procedure of electronic and electrical resistance to solvents.
42 ASTM D 4308-95. Standard test method for electrical conductivity of liquid hydrocarbons by precision
meter.
43 ASTM D 1816-97. Standard test method for dielectric breakdown voltage of insulating oils of petroleum
origin using VDE electrodes.
44 ASTM D 3300-94. Standard test method for dielectric breakdown voltage of insulating oils of petroleum
origin under impulse conditions.
45 ASTM F 791-96. Standard test method for stress crazing of transparent plastics.
46 ASTM D 4508-98. Standard test method for chip impact strength of plastics.
47 ASTM D 1901-95. Standard test method for relative evaporation time of halogenated organic solvents and
their admixtures.
DIN 53170-91. Solvents for paints and similar coating materials. Determination of the evaporation rate.
48 ASTM E 1232-96. Standard test method for temperature limit of flammability of chemicals.
49 ASTM E 681-98. Test method for concentration limits of flammability of chemicals.
BS 6713-3-86. Explosion protection systems. Method for determination of explosion indices of fuel/air
mixtures other than dust/air and gas/air mixtures (ISO 6184-3).
50 ASTM D 3828-97. Standard test method for flash point by small scale closed tester.
AS/NZS 2106.0-99. Methods for determination of flash point of flammable liquids (closed cup) -
General.
AS/NZS 2106.1-99. Methods for the determination of the flash point of flammable liquids (closed cup) -
Abel closed cup method.
51 ASTM D 1310-97. Standard test method for flash point and fire point of liquids by tag open-cup
apparatus.
52 ASTM D 56-97a. Standard test method for flash point by tag closed tester.
53 ASTM D 92-97. Standard test method for flash and fire points by Cleveland open cup.
ISO 2592-73. Petroleum product - Determination of flash and fire points - Cleveland open cup method.
1072 George Wypych

SFS-EN 22592. Petroleum products. Determination of flash and fire points. Cleveland open cup method
(ISO 2592).
54 ASTM D 93. Standard test methods for flash-point by Pensky-Martens closed cup tester.
AS/NZS 2106.2-99. Methods for determination of the flash point of flammable liquids (closed cup) -
Pensky-Martens closed cup method.
DIN EN 22719-93. Petroleum products and lubricants. Determination of flash point. Pensky-Martens
closed cup method (ISO 2719).
ISO 2719-88. Petroleum products and lubricants - Determination of flash point - Pensky-Martens closed
cup method.
SFS-EN 22719. Petroleum products and lubricants. Determination of flash point. Pensky-Martens closed
cup method (ISO 2719)
55 ASTM D 3941-96. Standard test method for flash point by the equilibrium method with a closed-cup
apparatus.
AS/NZS 2106.3-99. Methods for the determination of the flash point of flammable liquids (closed cup) -
Flash/no flash test - Rapid equilibrium method.
AS/NZS 2106.4-99. Methods for the determination of the flash point of flammable liquids (closed cup) -
Determination of flash point - Rapid equilibrium method.
AS/NZS 2106.5-99. Methods for the determination of the flash point of flammable liquids (closed cup) -
Flash/no flash test - Closed cup equilibrium method.
AS/NZS 2106.6-99. Methods for the determination of the flash point of flammable liquids (closed cup) -
Determination of flash point - Closed cup equilibrium method.
DIN EN 456-91. Paints, varnishes and related products. Determination of flash point. Rapid equilibrium
method (ISO 3679).
ISO 1516-81. Paints, varnishes, petroleum and related products - Flash/no flash test - Closed cup
equilibrium method.
ISO 1523-83. Paints, varnishes, petroleum and related products - Determination of flash point - Closed
cup equilibrium method.
ISO 3679-83. Paints, varnishes, petroleum and related products - Determination of flash point - Rapid
equilibrium method.
ISO 3680-83. Paints, varnishes, petroleum and related products - Flash/no flash test - Rapid
equilibrium method.
SFS-EN 456-93. Paints, varnishes, and related products. Determination of flash point. Rapid equilibrium
method (ISO 3679).
56 ASTM E 502-94. Standard test method for selection and use of ASTM standards for the determination of
flash point of chemicals by closed cup methods.
57 ASTM D 1015-94. Standard test method for freezing points of high-purity hydrocarbons.
JIS K 0065-92. Test method for freezing point of chemical products.
58 ASTM D 1016-94. Standard test method for purity of hydrocarbons from freezing points.
59 ASTM D 852-97. Standard test method for solidification point of benzene.
ISO 5278-80. Benzene - Determination of crystallizing point.
60 ASTM D 4755-95. Standard test method for free halogenated organic solvents and their admixtures.
61 ASTM D 2306-96. Standard test method for C8 hydrocarbon analysis by gas chromatography.
DIN 51437-89. Testing of benzene and benzene homologues. Determination of the content of
non-aromatics, toluene and C8-aromatics in benzene. Gas chromatography.
DIN 51448-1-97. Testing of liquid petroleum hydrocarbons. Determination of hydrocarbon types. Part 1:
Gas chromatographic analysis by column switching procedure.
62 ASTM D 3797-96. Standard test method for analysis of o-xylene by gas chromatography.
63 ASTM D 3798-96b. Standard test method for analysis of p-xylene by gas chromatography.
64 ASTM D 4492-98. Standard test method for analysis of benzene by gas chromatography.
65 ASTM D 3271-87-93. Standard test method for direct injection of solvent reducible paints into a gas
chromatograph for solvent analysis.
DIN 55682-94. Solvents for paints and varnishes. Determination of solvents in water-thinnable coating
materials. Gas chromatographic method. (Amendment A1 - DIN 55682/A1-98).
DIN 55683-94. Solvents for paints and varnishes. Determination of solvents in coating materials
containing organic solvents only. Gas chromatographic method.
66 ASTM D 5830-95. Standard test method for solvent analysis in hazardous waste using gas
chromatography.
67 ASTM D 4757-97. Standard practice for placarding solvent vapor degreasers.
15.1 Standard methods of solvent analysis 1073
68 ASTM D 3844-96. Standard guide for labeling halogenated hydrocarbon solvent containers.
69 ASTM D 1296-96. Standard test method for odor of volatile solvents and diluents.
ISO 2498-74. Methyl ethyl ketone for industrial use - Examination for residual odor.
70 ASTM E 679-97. Standard practice for determination of odor and taste thresholds by forced-choice
ascending concentration series method.
71 ASTM E-769-97. Standard test methods for odor of methanol, ethanol, n-propanol, and isopropanol.
72 ASTM E 1075-97. Standard test methods for odor of ethylene glycol, diethylene glycol, triethylene glycol,
propylene, glycol, and dipropylene glycol and taste of propylene glycol.
73 ASTM D 4494-95. Standard test method for detecting residual odor of drycleaning grade
perchloroethylene.
74 ASTM D 268-96. Standard guide for sampling and testing volatile solvents and chemical intermediates for
use in paint and related coatings and material.
75 ASTM D 1353-96. Standard test method for nonvolatile matter in volatile solvents for use in paint,
varnish, lacquer, and related products.
76 ASTM D 5286-95. Standard test methods for determination of transfer efficiency under general conditions
for spray application of paints.
77 ASTM D 1617-96. Standard test method for ester value of solvents and thinners.
78 ASTM D 2110-96. Standard test method for pH of water extractions of halogenated organic solvents and
their admixtures.
79 ASTM D 3545-95. Standard test method for alcohol content and purity of acetate esters by gas
chromatography.
DIN 55686-92. Solvents for paints and varnishes. Acetic esters. Gas chromatographic determination of the
degree of purity.
80 ASTM D 6229-98. Standard test method for trace benzene in hydrocarbon solvents by capillary gas
chromatography.
81 ASTM D 4534-93. Standard test method for benzene content of cyclic products by gas chromatography.
82 ASTM D 435-96. Standard test method for determination of trace thiophene in refined benzene by gas
chromatography.
DIN 51438-91. Testing of benzene and benzene homologues. Determination of the content of thiophene in
benzene. Gas chromatography.
83 ASTM D 5713-96. Standard test method for analysis of high purity benzene for cyclohexane feedstock by
capillary gas chromatography.
84 ASTM D 3447-96. Standard test method for purity of halogenated organic solvents.
CAN/CGSB 1-GP-71 No. 73-96. Methods of testing paints and pigments. Beilstein test for chlorinated
solvents.
85 ASTM D 3742-94. Standard test method for 1,1,1-trichloroethane content.
86 ASTM D 2804-98. Standard test method for purity of methyl ethyl ketone by gas chromatography.
87 ASTM D 3329-94a. Standard test method for purity of methyl isobutyl ketone by gas chromatography.
88 ASTM D 3257-97. Standard test methods for aromatics in mineral spirits by gas chromatography.
89 ASTM D 1685-95. Standard test method for traces of thiophene in benzene by spectrophotometry.
90 ASTM D 2031-97. Standard test method for reducing substances in refined pyridine.
91 ASTM D 3961-98. Standard test method for trace quantities of sulfur in liquid aromatic hydrocarbons by
oxidative microcoulometry.
ISO 5282-82. Determination of sulfur content - Pitt-Ruprecht reduction and spectrophotometric
determination method.
ISO 8754-92. Petroleum products - Determination of sulfur content - Energy-dispersive X-ray
fluorescence method.
SFS-EN ISO 8754. Petroleum products. Determination of sulfur content. Energy-dispersive X-ray
fluorescence method.
ISO 14596-98. Petroleum products - Determination of sulfur content - Wavelength-dispersive X-ray
fluorescence method.
92 ASTM D5194-96. Standard test method for trace chloride in liquid aromatic hydrocarbons.
93 ASTM D 5808-95. Standard test method for determining organic chloride in aromatic hydrocarbons and
related chemicals by microcoulometry.
94 ASTM E 299-97. Standard test method for trace amounts of peroxides in organic solvents.
95 ASTM D 4952-97. Standard test method for qualitative analysis for active sulfur species in fuels and
solvents (Doctor Test).
ISO 5275-79. Aromatic hydrocarbons - Test for presence of mercaptans (thiols) - Doctor test.
1074 George Wypych

96 ASTM D 2109-96. Standard test methods for nonvolatile matter in halogenated organic solvents and their
admixtures.
BS 5598-3-79. Methods of sampling and test for halogenated hydrocarbons. Determination of residue on
evaporation (ISO 2210).
ISO 759-81. Volatile organic liquids for industrial use - Determination of dry residue after evaporation on
water bath - General method.
ISO 2210-72. Liquid halogenated hydrocarbons for industrial use - Determination of residue on
evaporation.
ISO 5277-81. Aromatic hydrocarbons - Determination of residue on evaporation of products having
boiling points up to 150oC.
JIS K 0067-92. Test methods for loss and residue of chemical products.
SFS 3773-77. Determination of residue on evaporation.
97 ASTM D 1364-95. Standard test method for water in volatile solvents (Karl Fischer reagent titration
method).
BS 2511-70. Methods for determination of water (Karl Fischer method).
ISO 6191-81. Light olefins for industrial use - Determination of traces of water - Karl Fischer method.
ISO 8917-88. Light olefins for industrial use - Determination of water - Guidelines for use of in-line
analyzers.
SFS 3774-76. Determination of water by the Karl Fischer method.
98 ASTM D 3401-97. Standard test methods for water in halogenated organic solvents and their admixtures.
99 ASTM D 3443-95. Standard test method for chloride in trichlorotrifluoroethane.
100 ASTM D 3741-95. Standard test methods for appearance of admixtures containing halogenated organic
solvents.
101 ASTM D 611-98. Standard test methods for aniline point and mixed aniline point of petroleum products
and hydrocarbon solvents.
ISO 2977-97. Petroleum products and hydrocarbon solvents - Determination of aniline point and mixed
aniline point.
102 ASTM D 1363-97. Standard test method for permanganate time of acetone and methanol.
ISO 757-7-83. Acetone for industrial use - Methods of test - Part 4: Determination of permanganate time.
103 ASTM D 1612-95. Standard test method for acetone in methanol.
104 ASTM D 1218-96. Standard test method for refractive index and refractive dispersion of hydrocarbon
liquids.
ISO 5661-83. Petroleum products - Hydrocarbon liquids - Determination of refractive index.
JIS K 0062-92. Test methods for refractive index of chemical products.
105 ASTM F 151-97. Standard test method for residual solvents in flexible barrier materials.
106 ASTM D 1133-97. Standard test method for Kauri-butanol value of hydrocarbon solvents.
107 ASTM D 2779-97. Standard test method for estimation of solubility of gases in petroleum liquids.
108 ASTM E 1195-93. Standard test method for determining a sorption constant, Koc, for an organic chemical
in soil and sediments.
109 ASTM D 5404-97. Standard practice for recovery of asphalt from solution using the rotary evaporator.
110 ASTM D 304-95. Standard specification for n-butyl alcohol (butanol).
BS 508-1-86. Butan-1-ol for industrial use. Specification for butan-1-ol.
BS 508-2-84. Butan-1-ol for industrial use. Methods of test.
JIS K 1504-93. Butanol.
JIS K 8810-96. 1-butanol.
111 ASTM D 319-95. Standard specification for amyl alcohol (synthetic).
112 ASTM D 331-95. Standard specification for 2-ethoxyethanol.
113 ASTM D 770-95. Standard specification for isopropyl alcohol.
BS 1595-1-86. Propan-2-ol (isopropyl alcohol) for industrial use. Specification for propan-2-ol (isopropyl
alcohol).
BS 1595-2-84. Propan-2-ol (isopropyl alcohol) for industrial use. Methods of test.
ISO 756-1-81. Propan-2-ol for industrial use - Methods of test - Part 1: General.
JIS K 1522-78. Isopropyl alcohol.
114 ASTM D 1007-95. Standard specification for sec-butyl alcohol.
ISO 2496-73. sec-butyl alcohol for industrial use - List of methods of test.
JIS K 1523-78. 2-butanol.
115 ASTM D 1152-97. Standard specification for methanol (methyl alcohol).
BS 506-1-87. Methanol for industrial use. Specification for methanol.
15.1 Standard methods of solvent analysis 1075

BS 506-2.84. Methanol for industrial use Methods of test.
CAN/CGSB-3-GP-531M. Methanol, technical.
ISO 1387-82. Methanol for industrial use - Methods of test.
JIS K 1501-93. Methanol.
116 ASTM D 1719-95. Standard specification for isobutyl alcohol.
117 ASTM D 1969-96. Standard specification for 2-ethylhexanol (synthetic).
BS 1835-91. Specification for 2-ethylhexan-1-ol for industrial use.
118 ASTM D 2627-97. Standard specification for diacetone alcohol.
BS 549-70. Specification for diacetone alcohol.
ISO 2517-74. Diacetone alcohol for industrial use - List of methods of test.
119 ASTM D 3128-97. Standard specification for 2-methoxyethanol.
120 ASTM D 3622-95. Standard specification for 1-propanol (n-propyl alcohol).
JIS K 8838-95. 1-propanol.
121 ASTM D 841-97. Standard specification for nitration grade toluene.
AS 3529-1988. Solvent - Toluene.
ISO 5272-79. Toluene for industrial use - Specification.
JIS K 8680-96. Toluene.
122 ASTM D 843-97. Standard specification for nitration grade xylene.
ISO 5280-79. Xylene for industrial use - specification.
JIS K 8271-96. Xylene.
123 ASTM D 4734-98. Standard specification for refined benzene-545.
124 ASTM D 5136-96. Standard specification for high purity p-xylene.
125 ASTM 5211-97. Standard specification for xylenes for p-xylene feedstock.
126 ASTM D 5471-97. Standard specification for o-xylene 980.
127 ASTM D 5871-98. Standard specification for benzene for cyclohexane feedstock.
ISO 5721-79. Benzene for industrial use - Specification.
128 ASTM D 3734-96. Standard specification for high-flash aromatic naphthas.
129 ASTM D 5309-97. Standard specification for cyclohexane 999.
130 ASTM D 235-95. Standard specification for mineral spirits (petroleum spirits) (hydrocarbon dry cleaning
solvent).
AS 35-1988. Solvents - Mineral turpentine and white spirit.
BS 245-76. Specification for mineral solvents (white spirit and related hydrocarbon solvents) for paints
and other purposes.
CAN/CGSB-53.7-92. Duplicating liquid, Direct process, Spirit type.
131 ASTM D 1836-94. Standard specification for commercial hexanes.
132 ASTM D 3735-96. Standard specification for VM&P naphthas.
133 ASTM D 740-97. Standard specification for methyl ethyl ketone.
134 ASTM D 4360-90. Standard specification for n-amyl ketone.
135 ASTM D 329-95. Standard specification for acetone.
BS 509-1-87. Acetone for industrial use. Specification for acetone.
BS 509-2-84. Acetone for industrial use. Methods of test.
CAN/CGSB-15.50-2. Technical grade acetone.
ISO 757-1-82. Acetone for industrial use - Methods of test - Part 1: General.
JIS K 1503-59. Acetone.
JIS K 8035-95. Acetone.
SFS 3775 ISO/R 757. Acetone for industrial use. Methods of test.
136 ASTM D 740-94. Standard specification for methyl ethyl ketone.
CAN/CGSB-15.52-92. Technical grade methyl ethyl ketone.
ISO 2597-73. Methyl ethyl ketone for industrial use - List of methods of test.
JIS K 1524-78. Methyl ethyl ketone.
137 ASTM D 1153-94. Standard specification for methyl isobutyl ketone.
ISO 2499-74. Methyl isobutyl ketone for industrial use - List of methods of test.
138 ASTM D 2917-94. Standard specification for methyl isoamyl ketone.
ISO 2500-74. Ethyl isoamyl ketone for industrial use - List of methods of test.
139 ASTM D 5137-95. Standard specification for hexyl acetate.
140 ASTM D 1718-94. Standard specification for isobutyl acetate (95% grade).
BS 551-90. Specification for butyl acetate for industrial use.
141 ASTM D 2634-98. Standard specification for methyl amyl acetate (95% grade).
1076 George Wypych

142 ASTM D 3130-95. Standard specification for n-propyl acetate (96% grade).
143 ASTM D 3131-97. Standard specification for isopropyl acetate (99% grade).
BS1834-68. Specification for isopropyl acetate.
144 ASTM D 3540-98. Standard specification for primary amyl acetate, synthetic (98% grade).
145 ASTM D 3728-97. Standard specification for 2-ethoxyethyl acetate (99% grade).
146 ASTM D 5164-96. Standard specification for propylene glycol and dipropylene glycol.
JIS K 1530-78. Propylene glycol.
147 ASTM D 4701-95. Standard specification for technical grade methylene chloride.
ISO 1869-77. Methylene chloride for industrial use - List of methods of test.
JIS K 1516-84. Methyl chloride.
148 ASTM D 4079-95. Standard specification for vapor-degreasing grade methylene chloride.
149 ASTM D 4080-96. Standard specification for trichloroethylene, technical and vapor-degreasing grade.
ISO 2212-72. Trichloroethylene for industrial use - Methods of test.
JIS K 1508-82. Trichloroethylene.
150 ASTM D 4081-95. Standard specification for drycleaning-grade perchloroethylene.
ISO 2213-72. Perchloroethylene for industrial use - Methods of test.
JIS K 1521-82. Perchloroethylene.
151 ASTM D 4126-95. Standard specification for vapor-degreasing grade and general solvent grade
1,1,1-trichloroethane.
AS 2871-1988. Solvents. 1,1,1-trichloroethane (inhibited).
ISO 2755-73. 1,1,1-trichloroethane for industrial use - List of methods of test.
JIS K 1600-81. 1,1,1-trichloroethane.
152 ASTM D 4376-94. Standard specification for vapor-degreasing grade perchloroethylene.
153 ASTM D 4206-96. Standard test method for sustained burning of liquid mixtures using small scale
open-cup apparatus.
ISO/TR 9038-91. Paints and varnishes - Determination of the ability of liquid paints to sustain
combustion.
154 ASTM E 1194-93. Standard test method for vapor pressure.
DIN EN 12-93. Petroleum products. Determination of Reid vapor pressure. Wet method.
ISO 3007-99. Petroleum products and crude petroleum - Determination of vapor pressure - Reid method.
155 ASTM D 2879-96. Standard test method for vapor pressure-temperature relationship and initial
decomposition temperature of liquids by isoteniscope.
156 ASTM D 4486-96. Standard test method for kinematic viscosity of volatile and reactive liquids.
DIN EN ISO 3104. Petroleum products. Transparent and opaque liquids. Determination of kinematic
viscosity and calculation of dynamic viscosity.
ISO 3104-94. Petroleum products - Transparent and opaque liquids - Determination of kinematic viscosity
and calculation of dynamic viscosity.
SFS-EN ISO 3104. Petroleum products. Transparent and opaque liquids. Determination of kinematic
viscosity and calculation of dynamic viscosity.
157 ASTM D 88-94. Standard test method for Saybolt viscosity.
158 ASTM D 1545-93. Standard test method for viscosity of transparent liquids by bubble time method.
159 ASTM D 5201-97. Standard practice for calculating formulation physical constants of paints and coatings.
ISO/FDIS 11890-1-99. Paints and varnishes - Determination of volatile organic compound content (VOC)
- Part 1: Difference method.
ISO/FDIS 11890-2-99. Paints and varnishes - Determination of volatile organic compound (VOC) content
- Part 2: Gas-chromatographic method.
160 ASTM D 5325-97. Standard test method for determination of weight percent volatile content of
water-borne aerosol paints.
161 ASTM D 5087-94. Standard test method for determining amount of volatile organic compound (VOC)
released from solventborne automotive coatings and available for removal in a VOC control device
(abatement).
15.1 Standard methods of solvent analysis 1077

15.2 SPECIAL METHODS OF SOLVENT ANALYSIS
15.2.1 USE OF BREATH MONITORING TO ASSESS EXPOSURES TOVOLATILE ORGANIC SOLVENTS
Myrto Petreas
Hazardous Materials Laboratory, Department of Toxic Substances Control,California Environmental Protection Agency, Berkeley, CA, USA
15.2.1.1 Principles of breath monitoring
Exposure to organic solvents may occur as a result of occupation, diet, lifestyles, hobbies,
etc., in a variety of environments (occupational, residential, ambient). Solvents reach the or-
ganism through inhalation, ingestion and dermal exposure. The magnitude of exposures,
however, may be modulated by factors such as the use of protective equipment (decrease) or
physical exertion (increase). All sources and routes of exposure are integrated in the result-
ing internal dose. The dose at the target organ may trigger mechanisms that eventually may
result in irreversible biological changes and disease. Cellular repair mechanisms and indi-
vidual susceptibility have a significant effect on the onset of disease, resulting in a broad
distribution of outcomes. This continuum between exposure to organic solvents and disease
can be depicted, in a simplified way, in Figure 15.2.1.1. Biological monitoring focuses on
the elucidation of the first step of this process; i.e., the relationship between environmental
exposure and internal dose. Whereas the dose at the target organ is the biologically impor-
tant, concentrations of the solvent (or its metabolites) may be more easily measured in other
fluid or tissue samples, such as blood, breath, urine, etc.Traditional workplace monitoring relied on measurements of airborne contaminant
concentrations at the breathing zone, and comparisons to reference values or regulatorybenchmarks, such as the Threshold Limit Values (TLVs) and the Permissible ExposureLimits (PELs) in the USA, and similar values promulgated by the European Union andother organizations. Air measurements, however, may not always represent actual personalexposures since workers may be exposed dermally and orally, or they may be using protec-tive equipment. Over the last decade, work-place monitoring programs have expanded toinclude biological monitoring. Biological monitoring gives an estimate of the dose insidethe body (or specific target organ) rather than the concentration of the solvent in the external
environment. Internal dose is de-fined as the amount of the solventtaken up by the whole organism(or a body compartment) over aspecified period of time.1 De-pending on the chemical, the timeof sampling and the tissue ana-lyzed, the dose may reflect theamount of the chemical recentlyabsorbed, the amount of the chem-ical stored (body burden), or theamount of the chemical bound tothe active sites of a receptor. It isthe dose at the receptor or sensi-tive tissue (the biologically effec-
1078 Myrto Petreas
Figure 15.2.1.1. Relationship between exposure to volatile organic
solvents and potential outcomes.

tive dose) that is related to toxicity and/or damage. In general, the dose at the receptor cannot be measured because, at this time, available methodology is unacceptably invasive to beemployed. On the other hand, biological monitoring allows measurements to be made onbody fluids or tissues that would serve as surrogate measurements of the dose at the recep-tor. Certain conditions, however, are required for meaningful interpretations of the analyti-cal results.
1. There should be adequate information on the absorption, distribution,biotransformation, metabolism and elimination of the chemical in the body. This type of in-formation will indicate what tissues to sample, for what compound (parent chemical or ametabolite) and at what time. The latter issue is very important with chemicals that are elim-inated rapidly (i.e., those with short half-lives).
2. The concentration of the chemical (or its metabolite) to be measured in the selectedmedium (breath, blood, urine) must be in equilibrium with the concentration of the chemicalat the target organ.
3. The assay has to be sensitive, in order to detect low levels of the compound beforeany adverse effects take place; specific, in order to link exposure to dose; and accurate andprecise, in order to be reliable.
Very few chemicals have been adequately studied to allow biological monitoring ac-cording to the above criteria. This is, however, an expanding area, as indicated by the num-ber of substances for which Biological Exposure Indices (BEIs) have been proposed by theAmerican Conference of Governmental Industrial Hygienists (ACGIH). In the 1984-85Threshold Limit Value (TLV) booklet there were BEIs for 10 chemicals; in the 1998 book-let there were 37 compounds with adopted BEIs.2 BEIs are considered reference values in-tended as guidelines and do not determine whether the worker is at risk of disease. They aresupplementary to TLVs in evaluating workers’ exposures to workplace hazardous agents.The recommended values of BEIs are based on data correlating exposure intensity and bio-logical effects from field studies and/or on pharmacokinetic treatment of data obtained fromcontrolled human exposures. The BEIs developed by the ACGIH, assume 8-hour exposuresfor 5 days, followed by 2 days of non-exposure, and they strictly specify the time of samplecollection.
A clear advantage of biological monitoring over environmental or personal monitor-ing is that the estimate of the internal dose takes into account all possible routes of entry (in-halation, ingestion and dermal exposure). In addition, exposures other than occupational,such as through diet, hobbies or residential air, all contribute to the internal dose, which isrelated to adverse effects. When the effect of occupational exposure alone needs to be eval-uated, non-occupational exposures need to be assessed and controlled to allow interpreta-tion of biological monitoring results. A special case is the evaluation of protectiveequipment in reducing workplace exposures.
Biological monitoring is limited by parameters that can affect the exposure and doserelationship. Such parameters include the following: biological conditions (age, sex, obe-sity, pregnancy, disease), physical workload, or exposure to other agents (other chemicals,tobacco smoking, dietary components) that in some way interfere with the uptake, distribu-tion, metabolism or elimination of the chemical in the body.3-6 Such parameters may intro-duce large inter-individual variation in the resulting dose. When simulation techniqueswere used to evaluate the influence of these parameters, it was shown6 that up to 100% biasmay result from inter-individual variation in the metabolism of aromatic compounds. Ifthese differences occur randomly, they will widen the confidence limits of the biologicalmonitoring results, decreasing the statistical power of a study. This is just one example il-lustrating the care that must be taken when interpreting biological monitoring results.
15.2.1 Use of breath monitoring 1079

In short, biological monitoring should be used with specific objectives, such as toevaluate exceedence of a reference or regulatory value; dermal or oral exposure not as-sessed by personal monitoring; efficacy of protective equipment; etc. Accordingly, current,recent or cumulative exposure may need to be assessed and, therefore, the appropriatechemical (parent or metabolite) should be monitored in the appropriate specimen, collectedat the appropriate time, from the appropriate worker(s).
15.2.1.2 Types of samples used for biological monitoring
Of the various tissues/fluids that can be used for biological monitoring, the most common
are blood, urine and exhaled air because they are relatively easy to obtain.Blood collection is the most invasive of the three and the chemical analysis may be
subject to interferences because of the complex matrix. Additionally, concern over hepatitisand HIV infection, and confidentiality issues, make blood sampling less attractive for rou-tine collection. Nevertheless, concentrations of a compound of interest in blood are easier torelate to concentrations at the target organ.
Analysis of urine samples allows elimination rates of the chemical or its metabolite(s)to be ascertained. However, measurements in urine require specimen collection under aschedule (first morning urine, or 24-hour sample) that can create logistical difficulties. Theconcentration of the contaminant, or its metabolite(s), is usually corrected for the dilution ofthe urine (specific gravity or, more commonly, creatinine correction) to be used as a mea-sure of dose.
Collection of breath samples is the easiest of the three methods. It is non-invasive; itcan take place almost anywhere; and the analytical matrix is usually very simple. The basicassumption underlying breath monitoring is the existence of gaseous equilibrium betweenthe concentration of the vapor of interest in the alveolar air and in the arterial blood. This re-lationship must be established for every solvent for which biological monitoring by exhaledair analysis is considered. The apparent simplicity of breath sampling should not be over-stated, however, and the limitations and pitfalls should be identified before any large scale,routine applications of breath monitoring can be envisioned. Since breath is a non-homoge-neous mixture of air coming from different regions of the lung with varying ventilation, per-fusion, and diffusion characteristics, some portion of the breath should be consistentlyidentified and tested for its relationship to the blood concentration.
The ACGIH only recommends measurements in exhaled air when:7
• The chemical is poorly metabolized and, therefore, exhalation is the primary route
of elimination;
• Sampling can occur when the effect of time and other circumstantial factors can be
controlled;
• The sampling method is well defined.
15.2.1.3 Fundamentals of respiratory physiology
In order for any inhaled solvent vapors to enter the blood circulation, they need to reach the
alveoli, cross the gas-blood interface and dissolve in the blood. Gas is carried to the
gas-blood interface by airways, while blood is carried by blood vessels. Since these func-
tions take place in the lung, the essentials of respiratory physiology will be briefly reviewed.The primary function of the lungs is to allow oxygen to move from the inhaled air into
the arterial blood and to allow carbon dioxide to move from the venous blood to the exhaledair. Both oxygen and carbon dioxide move between air and blood by simple diffusion froman area of high partial pressure to an area of low partial pressure. The barrier between air andblood is less than 0.5 µm in thickness and has an area of between 50 to 100 m2.8 This barrieris very efficient for gas exchange by molecular diffusion, according to Fick’s 2nd law.
1080 Myrto Petreas

The airways consist of a series of tubes that become narrower and shorter as they ex-tend deeper into the lung. The first segment, the trachea, divides into two main bronchi,which in turn divide into lobar and segmental bronchi, which turn into terminal bronchioles.All these segments collectively constitute the anatomical dead space with a volume of about150 mL for an adult male. The function of this conducting portion of the lung is to transportthe inspired air into the gas exchange regions. The terminal bronchioles divide within a dis-tance of 5 mm into respiratory bronchioles and alveolar ducts, which are completely linedwith alveoli. This region of the lung is the respiratory zone where the gas exchange takesplace. The volume of this zone (about 2,500 mL) makes up most of the lung volume.
15.2.1.3.1 Ventilation
Air is drawn into the lungs by contractions of the diaphragm and the intercostal muscles,
which raise the rib cage, and flows to the terminal bronchioles by bulk flow. After that point,
the velocity of the inspired air diminishes as the cross sectional area of the airways increases
dramatically. Thereafter, ventilation is carried out by molecular diffusion, which results in
rapid exchange of gases.Similarly to the airways, the pulmonary blood vessels form a series of branching tubes
from the pulmonary artery to the capillaries and back to the pulmonary veins. The diameterof a capillary segment is about 10 µm, just large enough for a red blood cell. The capillariesform a dense network in the walls of the alveoli, with the individual capillary segments soshort that the blood forms an almost continuous sheet around the alveoli, providing idealconditions for gas exchange. In about one second, each red blood cell transverses two orthree alveoli in the capillary network, achieving complete equilibration of oxygen and car-bon dioxide between alveolar gas and capillary blood.
For an adult male at rest, a typical breathing frequency is 15 breaths per minute and atypical exhaled air volume (tidal volume), at rest, is about 500 mL. The total volume of airexhaled in 1 min is, therefore, about 7,500 mL. This is the minute volume total ventilation.The inhaled volume during the same time is slightly greater, since more oxygen is taken upthan carbon dioxide released. Not all the inhaled air reaches the alveoli; the anatomical deadspace (volume of conducting airways where no gas exchange takes place) contains approxi-mately 150 mL of each breath. Therefore, the volume of fresh inhaled air that reaches the al-veoli in 1 min is 5,250 mL [(500-150) mL/breath * 15 breaths/min = 5,250 mL/min].8 Thisis the alveolar ventilation and it represents the volume of fresh air available for gas ex-change in 1 min. The alveolar ventilation cannot be measured directly, but it can be calcu-lated by measuring the minute volume and subtracting the anatomical dead space. Theformer is easily measured by collecting all the expired air in a bag. The volume of the ana-tomical dead space can be assumed to be 150 mL, with minimal variation for all adults, andthe dead space ventilation can be calculated given a respiratory frequency. Subtraction ofthe dead space ventilation from the total ventilation (or minute volume) results in the alveo-lar ventilation. Pulmonary ventilation may be affected by chronic diseases such as asthmaor pulmonary fibrosis, or even by transient hyperventilation or hypoventilation.
15.2.1.3.2 Partition coefficients
Whereas the rate of transfer of a solvent vapor between alveolar air and capillary blood is
determined by its diffusivity, the equilibrium between these matrices is determined by the
blood/air partition coefficient (λ). This is the ratio of the concentration of the vapor in blood
and air at 37oC, at equilibrium. Partition coefficients are commonly determined in vitro, and
occasionally in vivo.2,9,10 Although considered constant at a particular temperature, partition
coefficients may be affected by the composition of the blood. The blood/air partition coeffi-
15.2.1 Use of breath monitoring 1081

cients of some industrial solvents were shown to increase by up to 60% after meals,4 pre-
sumably due to an increase in lipid content of the blood.Depending on the affinity of a gas or vapor for blood, the transfer from the alveoli to
the capillaries may be diffusion-limited or perfusion-limited. The difference can be illus-trated by examining two solvents, styrene and methyl chloroform. Because of the high sol-ubility of styrene (λ=52)11 large amounts of it can be taken up by the blood, and the transferis only diffusion-limited. On the other hand, methyl chloroform is not very soluble (λ=1.4)12
and its partial pressure rises rapidly to that of the alveolar air, at which point no net transfertakes place. The amount of methyl chloroform taken up by the blood will depend exclu-sively on the amount of available blood flow and not on the diffusion properties of thegas-blood interface. This kind of transfer is perfusion-limited.
It is the concentration in the mixed venous blood, however, that better reflects the con-centration at the target organ. It has been shown that:13
P PvV Q
//
=+
λλ
where:
P partial pressure in the alveoli and in the arterial blood leaving that region of the lung
Pv partial pressure in the venous blood coming to the lung
λ blood/air partition coefficient
V alveolar ventilation
Q blood flow of the lung region under consideration
The greater the blood/air partition coefficient, the closer the arterial concentration willbe to the venous concentration.
The concentration in the alveolar air will reflect both arterial and venous blood if theblood/air partition coefficient of the vapor is greater than 5,14 a criterion that applies to mostindustrial solvents. In a normal subject at rest, the ventilation-to-perfusion ratio (V/Q)ranges from 0.7 to 1.0, with an average of about 0.9.15 Variations in the V/Q ratio exist invarious parts of the lung because not all alveoli are ventilated and perfused in ideal propor-tions. The V/Q ratio may vary from 0.5 at the lung base to 3.0 at the apex,16 and it becomesmore homogeneous with physical exertion.17 When the partition coefficient exceeds 10,however, even large degrees of ventilation/perfusion imbalance have very little effect onthe relationship between alveolar and mixed venous solvent partial pressures.14
15.2.1.3.3 Gas exchange
When a person is exposed to a volatile organic solvent through inhalation, the solvent vapor
diffuses very rapidly through the alveolar membranes, the connective tissues and the capil-
lary endothelium and into the red blood cells or plasma. With respiratory gases the whole
process takes less than 0.3 seconds.15 This results in almost instantaneous equilibration be-
tween the concentration in alveolar air and in blood and, therefore, the ratio of the solvent
concentration in pulmonary blood to that in alveolar air should be approximately equal to
the partition coefficient. As the exposure continues, the solvent concentration in the arterial
blood exceeds that in the mixed venous blood.18 The partial pressures in alveolar air, arterial
blood, venous blood and body tissues reach equilibrium at steady state. When the exposure
stops, any unmetabolized solvent vapors are removed from the systemic circulation through
pulmonary clearance. During that period the concentration in the arterial blood is lower than
in the mixed venous blood18 and the solvent concentration in alveolar air will depend on the
pulmonary ventilation, the blood flow, the solubility in blood and the concentration in the
1082 Myrto Petreas

mixed venous blood. These are the prevailing conditions when breath monitoring takes
place after the end of the exposure17 and therefore, samples of alveolar air after exposure
should reflect concentrations in mixed venous blood. During exposure, however, alveolar
air should reflect concentrations in arterial blood. Solvent concentrations in arterial and ve-
nous blood diverge even more with physical exertion.To summarize, the uptake of solvent vapors through inhalation will depend on the fol-
lowing factors:3
1. Pulmonary ventilation, i.e., the rate at which fresh air (and solvent vapor) enters thelungs. This is determined by the metabolic rate and therefore depends on physical exertion.The concentration in alveolar air approaches that in inhaled air when the physical exertion isgreat. When exertion is low, the alveolar air concentration approaches the concentration inmixed venous blood.
2. Diffusion of the solvent vapor through the gas-blood interface. According to Fick’s2nd law, the rate of diffusion through the interface depends on the concentration gradientacross the tissue membrane. Therefore, the concentration of the vapor leaving the lungs de-pends on the amount of vapor entering the alveoli, on the solubility in blood (blood/gas par-tition coefficient) and on the flow rate of the blood through the lungs. For lipophilicchemicals, such as organic solvents that readily cross cellular membranes, diffusion is notthe rate-limiting factor.18
3. The solubility of the vapor in the blood. The higher the blood/gas partition coeffi-cient, the more rapidly the vapor will diffuse into the blood, until equilibrium is achieved.At equilibrium the net diffusion between blood and air ceases, but the concentrations in airand blood may still be different. A highly soluble vapor will therefore demonstrate a loweralveolar air concentration relative to the inhaled air concentration during exposure, and ahigher alveolar concentration relative to the inhaled air concentration after exposure.
4. The circulation of the blood through the lungs and tissues. This depends on the car-diac output and therefore, on physical exertion. For a soluble vapor, high exertion movesblood faster, increasing uptake.
5. The diffusion of the vapor through the tissue membranes, which depends on mem-brane permeability and is governed by Fick’s law, as discussed in #2 above.
6. The solubility of the solvent vapor in the tissue. This reflects the tissue/blood parti-tion coefficient of the solvent vapor and depends largely on the lipid composition of the par-ticular tissue. Lipophilic vapors will exhibit high solubility in tissues with high fat content,freeing blood of vapors and increasing uptake.
Substances that are not well metabolized are eliminated primarily through the lungs3
and to a lesser extent through the kidneys. During elimination through the lungs the samephysiological principles apply in a reverse sequence.
15.2.1.4 Types of exhaled air samples
Samples obtained from even a single breath may contain different concentrations of the sol-
vent vapor of interest depending on the way the sample was collected. This is a result of the
non-homogeneity of the exhaled air discussed previously. Figure 15.2.1.2 depicts a concen-
tration curve of a solvent in exhaled air. When measurement takes place in an environment
free of that solvent, the first part of the exhalation, corresponding to air in the anatomical
dead space, will be solvent-free (Phase 1). Then the solvent concentration curve rises
sharply reflecting exhalation of air from the respiratory zone of the lungs (Phase 2). This
phase is followed by a slowly increasing plateau, indicating an alveolar steady state (Phase
3). The level of this plateau depends on the preceding ventilatory state of the subject, being
higher for a hypoventilating subject and lower for a hyperventilating subject.6 Sample col-
15.2.1 Use of breath monitoring 1083

lection at the alveolar plateau con-
stitutes end-exhaled air. When the
total expiration is collected (com-
bination of all three phases) the
sample is considered mixed-ex-
haled air. Simultaneous monitor-
ing of CO2,6,19-21 or oxygen and
nitrogen22 has been suggested to
normalize the measured solvent
vapor concentrations in breath
samples in order to facilitate data
interpretation and comparisons.The various sampling tech-
niques must be evaluated and theone most applicable to the purposeof sampling chosen. The mostcommonly used sampling tech-niques based on physiologicalprinciples include mixed-exhaledair and end-exhaled air:
Mixed-exhaled air. Thistechnique involves the collection
of the entire volume of exhaled air. It corresponds to a mixture of the alveolar air with airfrom the dead space. The collection apparatus may also contribute to the dead space. Totaldead space should be considered and the concentration adjusted, either by subtraction, or byregression against some other technique unaffected by the dead space. Timing of the breathcollection is important here since the concentration of the air in the dead space may equalthat of the air in the workroom if the sample is taken during exposure, or it may equal zero iftaken after the end of exposure.
End-exhaled air. This technique excludes air from the dead space and collects only thelast part of the breath, in order to estimate the concentration in the alveolar air which is inequilibrium with the arterial blood. Use of a Haldane-Priestley tube,23 or simultaneous mon-itoring of the peaking of the temperature of the breath19 or its CO2 concentration,6,19,24 willassure a valid alveolar air sample.6,25,26
Two less frequently used techniques include breath holding or rebreathing to homoge-nize the breath sample:
Breath holding. For compounds that achieve equilibrium slowly, some researchershave used the breath holding technique, which involves holding the breath for 5-30 secondsprior to exhaling into the collection device. This results in a more constant concentration inthe exhaled breath. The extent to which the lungs are filled with air (as with a deep inhala-tion) will affect the results. Kelman14 showed, however, that breath holding is not necessaryfor solvents with blood/gas partition coefficients greater than 10.
Rebreathing. With this technique the subject rebreathes his/her exhaled air to providea more homogenized breath sample. This technique is applicable to solvents that reachsteady state very slowly. For prolonged rebreathing, removal of CO2 to avoid pH changesand/or supply of oxygen may be necessary.27
15.2.1.5 Breath sampling methodology
The theoretical principles discussed above lead to two choices for collecting breath sam-
ples: Should a mixed-exhaled air or an end-exhaled air sample be collected?
1084 Myrto Petreas
Figure 15.2.2. Solvent concentration in breath during exhalation.

End-exhaled air is becoming the standard for breath monitoring. Of the 36 chemicalswith established BEIs,7 end-exhaled air is recommended for 6, while earlier BEIs recom-mending mixed-exhaled air have been withdrawn. Beyond the regulatory arena, however,mixed-exhaled air continues to be used with satisfactory results.
Methodologically, the difference between these two types of samples is the controlover which portion of the breath is collected. Many techniques28-32 make use of theHaldane-Prestley tube to collect the last portion of the expiration. Earlier work6,19 used thesimultaneous monitoring of CO2 or temperature in the exhaled breath to identify the mo-ment (CO2 or temperature reaching a maximum) when air from the anatomical dead spacehas been purged and alveolar air can be sampled.
A variety of sampling techniques has been tried for measuring organic vapors in ex-haled air. Table 15.2.1.1 shows a classification of these techniques. The main distinction isbetween direct reading instruments and transportable samples that require analysis in thelaboratory. The former group covers the widest range, from simple detector tubes to HighResolution Mass Spectrometry.
Table 15.2.1.1. Techniques for sampling organic vapors in exhaled air
Technique References
A. SAMPLE COLLECTIONA.1 END-EXHALED AIR
Use of Haldane-Prestley tubeSimultaneous CO2 monitoringSimultaneous temperature monitoring
B. SAMPLE ANALYSISB.1 DIRECT READING INSTRUMENTSB.1.1 DETECTOR TUBES
ColorimetricB.1.2 GAS CHROMATOGRAPHS with various detectors and
modified injector/inlet with mouthpieceGC/FIDGC/PIDGC/MS
B.2 TRANSPORTABLE SAMPLE COLLECTORSB.2.1 CONTAINERSB.2.1.1 Rigid containers
Stainless steel tubesGlass tubesAluminum tubes
B.2.1.2 Flexible containersTedlar bagsSaran bagsMylar bags
B.2.2 ADSORBENTSB.2.2.1 Tubes/cartridges containing:
CharcoalTenaxSilica gel
B.2.2.2 Felt/cloth
23, 25, 26, 28, 29, 31
6, 20, 21, 2419
33
5225, 2624, 41, 42, 43
249, 53, 54, 55, 61, 6428, 29, 47
6, 4954, 55, 60
25, 26, 28, 29, 4031, 49648
Specifically, detector tubes operating on colorimetric reaction principles have beenused to determine the concentration of alcohol in breath for traffic safety.33 Alcohol mea-surements in breath have been thoroughly studied and scrutinized because of the forensic
15.2.1 Use of breath monitoring 1085

and legal repercussions associated with the results. Portable devices have been developedfor field use with on-site analysis of alcohol.34-36 These portable devices could be adaptedfor use with other organic solvents of interest in industrial hygiene and occupational health.
Gas chromatographs (GCs) equipped with suitable detectors allow analysis of morethan one solvent vapor at a time. The subject exhales through a valve system and the exhaledvolume of air, or a fraction of it, is drawn into the GC.21,26,37-39 Depending on the detectorused, one or more cylinders containing appropriate gases under pressure are required to op-erate the instrument, limiting its field use. An Electron Capture Detector (ECD), which isthe most sensitive for polyhalogenated solvents, requires helium and/or nitrogen. A FlameIonization Detector (FID), which is a universal detector for aliphatic and aromatic hydro-carbons, requires nitrogen, air and hydrogen. The advent of the Photoionization Detector(PID) offered a compromise, in that it can detect all the above classes of organic solvents(with varying sensitivity) requiring only one gas (nitrogen, air or helium) for its operation.A simple system employed a portable GC/PID modified to sample 1 mL of air from aHaldane-Priestley tube into which the subject would exhale.25,40 The latter assured collec-tion of end-exhaled air and this device was successfully used to assess exposures tostyrene26 and PERC.40
Mass spectrometry (MS) offers the advantages of high sensitivity and specificity at thecost of portability and the need of highly trained operators. Direct exhalation into the MS isnot possible because the ion source of the detector operates under high vacuum. Two ap-proaches have been taken to overcome this limitation. In the first, an inlet system was de-signed where the high pressure breath sample was directed over a methyl siliconemembrane, permeable to organic molecules but not to air, that served as the entry port to theion source operating under high vacuum.41 With the second approach, the inlet system wasattached to the source of an Atmospheric Pressure Ionization mass spectrometer (API/MS),that operates under atmospheric pressure.42,43
In summary, the basic advantage of the direct reading/analyzing instruments is thatthere is no sample collection, transportation, storage, handling and analysis where the sam-ple integrity may be compromised. The disadvantages are the need for expensive, special-ized equipment, usually requiring highly trained operators and the difficulty, or some timesimpossibility, of field use.
The other category of breath sampling methodology involves sample collection in thefield with subsequent analysis in the laboratory. There are two groups of devices in this cat-egory:
1. Sample containers that hold the total volume or part of the exhalation in a gaseousform.
2. Sample adsorbents that trap the chemicals of interest from the exhaled breath.In the first group belong rigid containers such as stainless steel, aluminum, or glass vi-
als of various sizes, open at both ends. The subject exhales into the vial and then the twoopenings are closed, either with caps or with stopcocks. Vials of this kind have been usedextensively in experimental studies involving exposures to industrial chemi-cals.24,28,29,44-47,53-55,61,64
The advantages of these containers are inertness of the walls, low cost, reusability andsimplicity of the technique. The disadvantages are the potential for contamination,photodegradation, or dilution of the collected breath sample with atmospheric air, sorptionand/or reaction of the vapor with surfaces and breakage during transportation or storage.The problem of condensation of water vapor has been addressed by heating the tubes,28,29,47
but this approach increases the complexity and counters the main advantages. Another limi-tation is that only a small volume of sample can be withdrawn for analysis from a rigid con-tainer, with ensuing restrictions on the analytical sensitivity.
1086 Myrto Petreas

The last limitation is overcome when collapsible bags are used for sample collection.The bags are commonly made of Tedlar (clear) or Mylar (aluminized) material. The subjectexhales directly into the bag through a valve and when an appropriate volume has been col-lected, the valve is closed. The bag is transported to the laboratory where an aliquot is with-drawn for analysis through a septum. The collapsibility of the bag allows any volume to bewithdrawn without air infiltration. Disadvantages, however, include losses because of per-meation through the walls, sorption and/or reaction of the vapor with the wall surfaces andphotodegradation. The latter concern is eliminated with the aluminized Mylar bags, whichalso minimize sorption and permeation through the walls.
The second group of field sampling devices with subsequent analysis involves the useof adsorbents. Extensively used in personal monitoring in industrial hygiene surveys, thesedevices were naturally considered for exhaled breath sampling. Commercially availableglass tubes containing granular adsorbent material such as activated charcoal, Tenax, mo-lecular sieve, etc. could be used with selected organic vapors. However, because of the highpressure drop during exhalation through the adsorbent bed, and the condensation of watervapor, these materials have not been used much for direct sampling of exhaled breath. Onedevice48 is, basically, a respirator mask with two commercial charcoal inhalation canistersand an exhalation port fitted with a wafer of charcoal cloth. A Wright respirometer con-nected to the exhalation port records the volume of exhaled air. Another hand-held deviceemployed a custom-made glass tube containing charcoal to collect organic vapors in ex-haled air, while the volume collected was measured with a Wright respirometer and ad-justed for back-pressure measured with an attached pressure gauge.25,40
Commercial tubes or specially made cartridges containing the appropriate adsorbenthave been used in conjunction with bag sampling for exhaled breath monitoring.49 The sub-ject exhales into the bag, the contents of which are subsequently pumped through the tube orcanister containing the adsorbent. This combination offers the advantages of bag sampling(low cost, low resistance), while eliminating the disadvantages (losses, bulkiness). The or-ganic vapors can be thermally desorbed from the adsorbent material and the concentrationsmeasured with polymer-coated surface-acoustic-wave detector,50 GC or GC/MS analy-sis.31,49 Alternatively, solvent vapors can be extracted from the adsorbent with an appropri-ate solvent prior to conventional analysis.
15.2.1.6 When is breath monitoring appropriate?
Breath monitoring may be used to assess exposures to solvents either qualitatively or quan-
titatively. Qualitative information may be useful when exposure to a number of solvents is
suspected. For qualitative purposes, either mixed-exhaled or end-exhaled air samples may
be used. Provided that the sample collection and the analytical techniques are appropriate, a
list of solvents may be thus identified and quantitative measurements planned.Quantitative information is needed for regulatory enforcement situations, where ap-
propriately collected breath samples are compared to BEIs to assess whether exposure lim-its have been exceeded. BEIs have been developed after thorough studies ofpharmacokinetics for a limited number of occupational contaminants. Exhaled air is used asa surrogate for blood when the relationships between exhaled air, alveolar air and (arterialor mixed venous) blood have been established.
Besides regulatory purposes, breath monitoring can provide valid information on sol-vent exposures when:
• The pharmacokinetics (absorption, distribution, metabolism, elimination) of the
solvent are well established.
• The solvent is not soluble in the conducting portion of the lung (anatomical dead
space).
15.2.1 Use of breath monitoring 1087

• The solvent is not metabolized to a great extent, and it is mainly eliminated via
exhalation.
• Sample collection is conducted in a location unaffected by ambient levels of the
solvent(s) of concern that may interfere and bias the measurements.
• The concentration in exhaled air is compatible with the analytical method allowing
adequate sensitivity.
• Appropriate timing is strictly followed.
15.2.1.7 Examples of breath monitoring
Two solvents are used to illustrate the use of breath monitoring in assessing solvent expo-
sure: A solvent with minimal metabolism, tetrachloroethylene (PERC) and a solvent with
significant metabolism, styrene. Both solvents are used extensively in industry with a great
number of workers potentially exposed. As shown in Table 15.2.1.2, styrene is only mini-
mally excreted through the lungs, whereas exhaled air is the major elimination route for
PERC. Accordingly, end-exhaled air is recommended as a BEI for PERC, but not for sty-
rene. Nevertheless, end-exhaled and mixed-exhaled air techniques have been studied in ex-
perimental settings and in real-life occupational environments for both solvents. A
compilation of such studies is presented below.
Table 15.2.1.2. Characteristics of styrene and tetrachloroethylene (PERC).[Information compiled from ACGIH, Documentation of Threshold Limit Values andBiological Limit Values, 19917]
STYRENE PERC
Eliminated via lungs ~5% ~80-100%
Eliminated in the urine ~90% ~2%
Urinary metabolite(s)Mandelic acid (MA),Phenylglyoxylic acid (PA)
Trichloroacetic acid (TCA)
Blood/air partition coefficient (λ) 32-55 9-15
Pulmonary eliminationhalf-lives (T1/2)
13-52 min4-20 hr3 days
15 min4 hrs4 days
TLV (1998) 50 ppm 25 ppm
STEL (1998) 100 ppm 100 ppm
BEI (1998)End-exhaled air
Blood
Urine
Not recommended
0.55 mg/L end-of-shift0.02 mg/L prior-to-next-shift
MA=800 mg/g creatinine,end-of-shiftMA=300 mg/g creatinine,prior-to-next-shiftPA=240 mg/g creatinine,end-of-shiftPA=100 mg/g creatinine,prior-to-next-shift
10 ppm end-of-shift, after atleast 2 shifts1 mg/L end-of-shift,after at least 2 shifts
TCA=7 mg/L
Major Industry Reinforced Plastics Dry Cleaning
1088 Myrto Petreas

15.2.1.7.1 PERC
Tetrachloroethylene (PERC) is used extensively in the textile industry as a dry cleaning aid
and in metal processing as a metal degreaser. The major concern is on occupational expo-
sures, but elevated indoor air concentrations of PERC have also been documented.49 As a re-
sult, the potentially exposed population is very large, with a wide range of exposures. The
uptake of PERC by the lung is high51,52 because of its high solubility in blood and adipose.
Most of it is eliminated via the lung, with very small amounts metabolized to trichloroacetic
acid (TCA) and eliminated in the urine.51,52 Even smaller amounts of trichloroethanol in the
urine have been reported.52
A number of field studies have been published with similar designs, in which breath-ing zone air, blood, breath and urine were measured in groups of workers. In addition,chamber studies allowed measurements under predetermined consistent conditions. Theemerging patterns formed the basis for recommendations for biologic monitoring.
In a study of thirty two workers,9 end-exhaled air was measured at the beginning of thefirst shift of the week, after 15-30 min after the end of the shift on the 3rd and 5th day of thesame week, and at the beginning of the first shift of the subsequent week. The authors re-quired the subjects to hold their breaths for 5 seconds and collected only the last part of thebreath to obtain alveolar air. These measurements correlated with personal breathing zonesamples collected each day. The highest correlation was found between PERC and TCA inblood at the end of the workweek and the average exposure for the entire week (R2=0.953).Among the non-invasive techniques, PERC in exhaled air collected 15-30 min after the endof the shift at the end of the week had an R2 of 0.931, and was followed by TCA in urine(R2=0.909).
In a field study of workers employed in dry cleaning,53 twenty-four female and twomale subjects were monitored. End-exhaled air and blood samples were collected at the be-ginning and at 30 minutes after the end of the 3rd workday of the week. On that same day,personal, shift-long, breathing zone samples were also collected from each worker. Urinesamples were collected before and after the shift on a daily basis and analyzed for TCA.With a mean exposure of 20.8 ppm, no TCA was detected in any of the urine samples (nodetection limit was reported). Among the three exposure parameters (breathing zone air,blood and end-exhaled air) only the correlation between the PERC concentration in theblood and in the breath was reported as statistically significant by the authors (R2=0.77).The authors concluded that if the concentration of PERC in blood, 16 hours after the end ofexposure, was below 1000 µg/L, the average exposure was likely to have been below 50ppm.
A group of thirteen male dry cleaners40 was followed for a week with daily shift-longpersonal (badge) monitoring; mixed-exhaled air collected daily before- and after-shift; andmixed-exhaled air, blood and urine measurements on the morning after the last shift. Re-sults indicated strong correlations between PERC concentrations in mixed-exhaled air andblood (R2=0.944), as well as mixed-exhaled air and personal air samples collected either af-ter the shift (R2=0.885), or on the following morning (R2=0.770). Mixed-exhaled air mea-surements collected either at the end of the last shift of the week (R2=0.814) or in themorning following the last shift (R2=0.764) were better indicators of exposure over the en-tire week than either blood (R2=0.697) or urine (R2=0.678). The authors recommended con-sideration of mixed-exhaled air as a potential BEI.
In addition to field studies, controlled human exposures to PERC have been reported.In this type of studies, subjects were exposed to various constant levels of PERC for differ-ent lengths of time with or without exercise. Samples of blood, exhaled air and urine werecollected according to a variety of schedules both during exposure and for varying lengths
15.2.1 Use of breath monitoring 1089

of time after exposure. One study involved single exposures, whereas in others at least someof the subjects participated more than once.
In one of the first chamber studies, nine male volunteers were exposed to 100-200 ppmof PERC for 80 to 180 minutes. Concentrations of PERC in exhaled air were measured overtime.54 The authors demonstrated that exposures of similar duration resulted in similar de-cay curves of PERC concentrations in breath after exposure. In addition, the data showedthat the length of time that PERC was measurable in exhaled air was proportional to both theconcentration and the duration of the exposure.
The same group55 exposed sixteen males to single and repeated concentrations of 100ppm PERC for periods of 7 hrs/day over a 5-day workweek. Alveolar air samples were col-lected over a period of up to 300 hours post-exposure. The authors observed higher alveolarair concentration in subjects with greater body mass. They recommended measurement ofPERC in alveolar air 2-16 hours post-exposure to assess the average exposure.
Six healthy males were exposed to 72 and 144 ppm, as well as 142 ppm with 2 halfhours of 100 W of exercise.51 Uptake of PERC was calculated from the minute volume andthe concentration of PERC in breath. PERC was measured in breath and blood and TCAwas measured in blood and urine. During the first hour of exposure the uptake was higher by25% than during the last hour and retention decreased with time and with exercise. Themean ratio of the concentration of PERC in venous blood and the concentration of PERC inmixed exhaled air was 23. Assuming a mix-exhaled air to end-exhaled air ratio of 0.71, theyestimated a blood/air partition coefficient of 16. After 20 hours from the end of exposure thehalf-life was estimated to be 12-16 hours, after 50 hours the half-life was estimated to be30-40 hours and after 100 hours it was estimated at approximately 55 hours. The authors es-timated that 80-100% of PERC was excreted unchanged through the lung, and about 2%was excreted as TCA in the urine.
Simple and multiple linear regression analyses were applied to the data collectedabove to predict the best estimator of exposure to PERC.56,57 PERC in blood was the bestpredictor followed by PERC in exhaled air. TCA per gram of creatinine in urine was theleast reliable predictor.
Twenty four subjects were exposed to 100, 150 and 200 ppm of PERC for 1 to 8hours.52 The concentration of PERC in alveolar air decreased rapidly during the first hoursof the post-exposure period, but 2 weeks were required for complete elimination followingan exposure of 100 ppm for 8 hours. The authors were the first to demonstrate that the rate ofrise and of decay of the alveolar concentration with respect to time was independent of thelevel of the inspired concentration during exposure.
The experimental data from the above study were used in a pharmacokinetic model58
that divided the body into four tissue compartments: the Vessel Rich Group (VRG), theMuscle Group (MG), the Fat Group (FG) and the Vessel Poor Group (VPG). No metabolicpathway was considered. After 20 hours from the end of the exposure the concentration ofPERC in alveolar air was related to release from the FG with an approximate half-life of71.5 hours. The model predicted small differences in alveolar concentrations due to differ-ences in body weight, height and fat tissue. The authors provided a nomogram to predictmean exposure given the exposure duration (0-8 hrs), time since end of exposure (0-8 hrs)and post-exposure measurement of the alveolar air concentration.
A perfusion-limited, four compartment model was used to simulate the effect of sev-eral confounding factors on the levels of several contaminants in the breath, includingPERC.6 The model, which considered metabolic clearance, consisted of a pulmonary com-partment, a vessel-rich group, a group of low-perfused tissues containing muscles and skin,and a group of poorly perfused fatty tissues. The authors predicted that intra-day fluctua-tions in exposure would have a large effect on breath sampled just after the shift, but that the
1090 Myrto Petreas

effect would be negligible the next morning. Breath samples collected the next morningwould reflect exposure on preceding days and the measurements would be independent oflevel of physical exertion. Finally, individual differences in body build and metabolismwould have the greatest effect on breath levels, with the largest variations expected for me-tabolized solvents.
Experimental data were used in a model,59 which divided the body into four tissuecompartments: vessel rich group, muscle group, fat group and liver. Metabolism was as-sumed to take place in the liver as a combination of a linear metabolic component and a Mi-chaelis-Menten component. Metabolic parameters and partition coefficients determined forrats were scaled for body weight and were used in fitting results for humans. The model fitvery well the data reported from other controlled human exposure studies.51,52,54
The BEI committee of the ACGIH recommends2 three indices of PERC exposure:1) PERC in end-exhaled air collected prior to the shift after at least 2 consecutive
workdays.2) PERC in blood collected prior to the shift after at least 2 consecutive workdays.3) Trichloroacetic acid (TCA) in urine voided at the end of the workweek. This index
is recommended only as a screening test because of the variability associated with urinaryexcretion of TCA and, as such, no creatinine correction is necessary.
15.2.1.7.2 Styrene
The highest exposures to styrene take place in plants manufacturing glass-reinforced plas-
tics, particularly during lamination, where there is considerable evaporation of styrene.
Most of the inhaled styrene is absorbed and retained in the body. The first step in the major
metabolic pathway is the formation of styrene-7,8-oxide (phenyloxirane), a reaction cata-
lyzed by Cytochrome P-450 in the liver. The oxide is then hydrated to styrene glycol
(1-phenyl-1,2-ethanediol) by microsomal epoxide hydratase. The styrene glycol is conju-
gated with beta-glucuronic acid, or is oxidized to mandelic acid and further to
phenylglyoxylic acid. In humans, less than 5% of absorbed styrene is eliminated via the
lung, whereas 90% is eliminated in the urine as mandelic and phenylglyoxylic acids.A number of chamber and field studies have been reported, where blood, exhaled air
and urine have been studied as possible biological indicators. Although conditions andstudy design differed among studies, certain consistent patterns emerged, which formed thebasis for subsequent recommendations.
In an early series of chamber exposures,60 nine healthy males were exposed to styreneconcentrations of 50 to 370 ppm for periods ranging from 1 to 7 hours. Alveolar air sampleswere collected during and for 8 hours following exposure. The authors showed that theamounts of styrene present in the breath were directly related to the level and the duration ofexposure.
In another study,61 fourteen healthy males were exposed to 50 and 150 ppm of styrenein inspired air during rest and light (50 W) physical exercise. The duration of exposure foreach styrene concentration was 30 minutes, with total pulmonary ventilation, cardiac out-put, and styrene concentration in alveolar air, arterial blood and venous blood measuredduring and after exposure. During exposure at rest to either 50 or 150 ppm, the alveolar airconcentrations were about 20% of the inspired air concentrations. When alveolar ventila-tion almost tripled with exercise at 50 W, the alveolar air concentrations increased slightly,whereas arterial blood concentrations almost tripled. Alveolar air concentrations reached aplateau within a minute or so, that persisted throughout the 30-minute period. Arterial bloodconcentrations, however, rose rapidly during each such period and even more with increas-ing exercise intensity (50, 100 and 150 W). Venous blood concentrations also rose sharplyduring the 30-minute exposure periods without ever reaching a plateau. No linear relation-ship was found between exposure duration and arterial and venous blood concentrations,
15.2.1 Use of breath monitoring 1091

even after log-log transformations. The decay of styrene concentrations in alveolar air andin venous and arterial blood was slower in the first 30 to 50 minutes than later on. The au-thors concluded that post-exposure alveolar air measurements were poor predictors of ex-posures to styrene, whereas arterial blood would be the best index of exposure. For practicalreasons, they recommended capillary blood samples from fingertips as a surrogate for arte-rial blood.
In a follow-up study62 using the same experimental set up as above, seven male sub-jects were exposed to 50 ppm (210 mg/m3) of styrene in inspired air for 30 minutes at rest,followed by 30 minute exposure periods under exertion at intensities of 50, 100 and 150 W.The mean alveolar air concentration at the end of the first 30-minute period was 16% of theconcentration in the inspired air and 23% at the end of the final period. Both the arterial andvenous blood concentrations of styrene rose with increasing workload during exposure withno equilibrium achieved between alveolar air and arterial blood during 2 hours of total ex-posure. Weak correlations were found for the amount of styrene taken up per kg of bodyweight and the concentrations of styrene in alveolar air 0.5 and 2 hours after exposure. Theelimination was faster during periods of exercise than during rest periods, leading to the au-thors’ recommendation for leisure time physical activity for people exposed to solvents as ameans to enhance elimination.
In another study,63 four male volunteers were exposed to 80 ppm of styrene in a cham-ber for 6 hours. Venous blood samples were collected during exposure and a nearly simulta-neous set of 10 blood and mixed exhaled air samples were collected following exposure forup to 40 hours. Blood levels during exposure rose rapidly and reached an almost constantlevel by the end of the 6 hours. Following exposure, the results showed that styrene wascleared from the blood according to a linear two-compartment pharmacokinetic model,with half-life values of 0.58 and 13 hours, for the rapid and slow elimination phases, respec-tively.
Retention of styrene was studied in a chamber setting where healthy males were ex-posed to either constant or fluctuating air concentrations of styrene.26 A computer-con-trolled system was used to generate time-varying air concentrations over 4-5 hrs with amean air concentration of 50 ppm. End-exhaled air measurements taken throughout the ex-posure period showed styrene retention of 93.5% during constant exposures, but higher re-tention (96-97%) during fluctuating exposures. The authors speculated that the differencein retention was related to non-steady-state behavior of styrene in the richly perfused tis-sues.
In summary, pulmonary retention during exposure is about 60-70%62,64 with exhaledconcentrations accounting for 25-35%.60 Higher retention (96-97%) was observed whenvolunteers were exposed to fluctuating, rather than constant, air concentrations.26 Followingexposure, the desaturation curve shows two exponential decays with half-lives of 13minutes60 to 52 minutes63 for the rapid elimination phase and 4 hours60 to 20 hours63 for theslower elimination phase. A third compartment can be defined to represent eliminationfrom the adipose tissue with a half-life of 3 days.62
Measurements of styrene in venous blood at the end of the workshift and/or prior tothe next shift have been recommended by the ACGIH.2 Monitoring of urinary metabolitesof styrene has also been recommended by the ACGIH2 at the end of the week, even thoughthey are not specific to styrene exposure. Styrene in exhaled air after the end of exposurewas not recommended as a BEI because the levels would be too low to detect, leading to un-certainties.
Terminology
ACGIH American Conference of Governmental Industrial Hygienists
Alveolar air Gas in the alveoli
1092 Myrto Petreas

Alveolar ventilation Inhaled air available for gas exchange in 1 min
Anatomical dead space Volume (~150 mL) of conducting airways where no gas exchange occurs
BEI Biological Exposure Index. Reference value developed by ACGIH
Blood/air partition coefficient Ratio of the vapor concentration in blood and in air at 37oC
Breathing frequency 15 breaths per minute at rest, increases with physical exertion
Conductive zone of lungs First segment of the airways, which includes the trachea, bronchi, terminal
bronchioles
End-exhaled air Operationally defined as the last portion of an exhalation to simulate alveolar
air
Exhaled air volume Approx. 500 mL at rest, increases with workload
GC-MS Gas Chromatography Mass Spectrometry
Minute Volume Ventilation The volume of air exhaled in 1 min, approx. 7,500 mL
Mixed-exhaled air Entire volume of exhaled air collected from alveolar space and anatomically
dead space
Respiratory zone Consists of respiratory bronchioles and alveolar ducts where gas exchange
takes place. Approx. 2,500 mL
STEL Short-Term Exposure Limit. The concentration to which most workers may
be exposed continuously for a short period of time without adverse effects.
Issued by ACGIH
Tidal Volume Volume of exhaled air; ~500 mL at rest
TLV Threshold Limit Value. Airborne concentration of a substance to which most
workers may be exposed without adverse health effects. Established by
ACGIH and intended as guideline.
References
1 R Lauwerys, Industrial chemical exposure: Guidelines for biological monitoring. Biomedical
Publications. Davis, California, 1983.
2 ACGIH, American Conference of Governmental Industrial Hygienists: TLV, Threshold Limit Values and
Biological Limit Values. Cincinnati, Ohio, 1998.
3 I Astrand, Scand J Work Environ Health. 1, 199-218, 1975.
4 V Fiserova-Bergerova, J Vlach, JC Cassady, Br J Ind Med., 37, 42-49, 1980.
5 PJA Borm and B de Barbanson, J Occup Med. 30, 214-223, 1988.
6 PO Droz and MP Guillemin, J Occup Med., 28, 593-602, 1986.
7 ACGIH, American Conference of Governmental Industrial Hygienists, Documentation of Threshold Limit
Values and Biological Limit Values. Cincinnati, Ohio, 1991.
8 JB West, Respiratory Physiology - The essentials, The Williams & Wilkins Co., Baltimore, 1981.
9 AC Monster, W Regouin-Peeters, A van Schijndel, J van der Tuin, Scand J Work Environ Health, 9,
273-281, 1983.
10 V Fiserova-Bergerova, Modeling of inhalation exposure to vapors, Uptake, distribution and
elimination, CRC Press Inc., Boca Raton, Florida, 1983.
11 A Sato and T Nakajima, Brit. J. Ind. Med., 36, 231-234, 1979.
12 A Morgan, A Black, DR, Belcher, Ann Occup Hyg., 13, 219-233, 1970.
13 LE Farhi, Respir Physiol., 3, 1-11, 1967.
14 GR Kelman, Br J. Ind Med., 39, 259-264, 1982.
15 JE Cotes, Lung function, Assessment and application in medicine, Blackwell Scientific Publications,
Oxford, 1979.
16 J Widdicombe and A Davies, Respiratory physiology, Edward Arnold, London, 1983.
17 HK Wilson, Breath analysis, Scand J Work Environ Health, 12, 174-192, 1986.
18 V Fiserova-Bergerova, M Tichy, and FJ DiCarlo, Drug metabolism reviews, 15, 1033-1070, 1984.
19 KM Dubowski, Clin. Chem., 20, 966-972, 1974.
20 HC Niu, DA Schoeller, PD Klein, J Lab Clin Med., 91, 755-763, 1979.
21 M Guillemin and E Guberan, Br J Ind Med., 39, 161-168, 1982.
22 TA Robb TA and GP Davidson, Clinica Chimica Acta, 111, 281-285, 1981.
23 JS Haldane, and JG Priestley, J Physiol., 32, 225-266. 1905.
24 JH Raymer, KW Thomas, SD Cooper, DA Whitaker, ED Pellizzari, J Anal. Toxicol., 14, 337-344, 1990.
25 SM Rappaport, E Kure, MX Petreas, D Ting, J Woodlee, Scand. J. Work Envir. Health, 17, 195-204, 1991.
15.2.1 Use of breath monitoring 1093

26 M Petreas, J Woodlee, CE Becker, SM Rappaport, Int. Arch. Occup. Environ. Health, 67, 27-34, 1995.
27 RH Hill, M Guillemin, PO Droz, in Methods for Biological Monitoring, TJ Kneip and JV Crable Eds.
American Public Health Association, Washington DC, 1988.
28 JF Periago, A Luna, A Morente, A Zambudio, J. Appl. Toxicol., 12, 91-96, 1992.
29 JF Periago, A Cardona, D Marhuenda, J Roel, et al., Int. Arch. Occup. Environ. Health, 65, 275-278, 1993.
30 L Campbell, AH Jones, HK Wilson, Am. J. Ind. Med., 8, 143-153, 1985.
31 D Dyne, J Cocker, HK Wilson, The Sci. Total Envir., 199, 83-89, 1997.
32 L Drummond, R Luck, AS Afacan, HK Wilson, Br. J. Ind. Med., 45, 256-261, 1988.
33 Dragerwerk AG, Detector tube handbook, Lubeck, Germany, 1976.
34 NC Jaim, J. Chromatogr. Sci., 12, 214-218, 1974.
35 MF Mason and KM Dubowski, J. Forensic Sci., 4, 9-41, 1975.
36 D Clasing, U Brackmeyer and G Bohn, Blutalcohol, 18, 98-102, 1981.
37 CG Hunter and D Blair, Am. Occ. Hyg., 15, 193-199, 1972.
38 R Teraniski, TR Mon, AB Robinson, P Cary, L Pauling, Anal. Chem., 44, 18-20, 1972.
39 PO Droz and JG Fernandez, Br. J. Ind. Med., 35, 35-42, 1978.
40 MX Petreas, SM Rappaport, B Materna, D Rempel, J. Exp. Analysis & Env. Epidem., Supplm. 1, 25-39, 1992
41 HK Wilson and TW Ottley, Biomed. Mass Spectrom., 8, 606-610, 1981.
42 FM Benoit, WR Davidson, AM Lovett, S Nacson, and A Ngo, Anal. Chem., 55, 805-807, 1983.
43 FM Benoit, WR Davidson, AM Lovett, S Nacson, and A Ngo, Int. Arch. Occup. Environ. Health, 55,
113-120, 1985.
44 RJ Sherwood, and FWG Carter, The measurement of occupational exposure to benzene vapour. Ann. Occup.
Hyg., 13, 125-146, 1970.
45 DA Pasquini, Am. Ind. Hyg. Assoc. J., 39, 55-62, 1978.
46 F Brugnone, L Perbellini, GL Faccini, F Pasini, L Romeo, M Gobbi, A Zedde, Int. Arch. Occup. Environ.
Health, 61, 303-311, 1989.
47 M Imbriani, S Ghittori, G Pezzagno, E Capodaglio, G. Ital. Med. Lav., 4, 271-278, 1982.
48 RA Glaser, and JE Arnold, Am. Ind. Hyg. Assoc. J., 50, 112-121, 1989.
49 L Wallace, R Zweidinger, M Erickson, S Cooper, D Whitaker, E Pellizzari, Environment International, 8,
269-282, 1982.
50 WA Groves and ET Zellers, Am. Ind. Hyg. Assoc. J., 57, 1103-1108, 1996.
51 AC Monster, G Boersma, H Steenweg, Int. Arch. Occup. Environ. Health, 42, 303-309, 1979.
52 J Fernandez, E Guberan, J Caperos, Am. Ind. Hyg. Assoc. J., 37, 143-150, 1976.
53 R Lauwerys, J Ferbrand, JP Buchet, A Bernard, J Gaussin, Int. Arch. Occup. Environ. Health, 52, 69-77,
1983.
54 RD Stewart, HH Gay, DS Erley, CL Hake, AW Scaffer, Arch. Environ. Health, 2, 40-46, 1961.
55 RD Stewart, ED Baretta, HC Dodd, TR Torkelson, Arch. Environ. Health, 20, 224-229, 1970.
56 AC Monster, Int. Arch. Occup. Environ. Health, 42, 311-317, 1979.
57 AC Monster, JM Houtkooper, Int. Arch. Occup. Environ. Health, 42, 319-323, 1979.
58 E Guberan and J Fernandez, Br. J. Ind. Med., 31, 159-167, 1974.
59 RC Ward, CC Travis, DM Hetrick, ME Andersen, ML Gargas, Tox. Appl. Pharmacol., 93, 108-117, 1988.
60 RD Stewart, HC Dodd, ED Baretta, et al., Arch. Environ. Health, 16, 656-662, 1968.
61 I Astrand, A Kilbom, P Ovrum, I Wahlberg, O Vesterberg, Work-Environm.& Health, 11, 69-85, 1974.
62 J Engstrom, R Bjurstrom, I Astrand P Ovrum, Scand. J. Work Environ. Health, 4, 315-323, 1978.
63 JC Ramsey, JD Young, RJ Karbowski, MB Chenoweth, LP McCarty, WH Braun, Toxicol. Appl.
Pharmacol., 53, 54-63, 1980.
64 E Wigaeus, A Lof, R Bjustrom, MB Nordqvist, Scand. J. Work. Environ. Health, 9, 479-488. 1983.
1094 Myrto Petreas

15.2.2 A SIMPLE TEST TO DETERMINE TOXICITY USING BACTERIA
James L. Botsford
Department of Biology, New Mexico State University, Las Cruces, NM, USA
15.2.2.1 Introduction
The author has developed a simple, inexpensive and rapid method to measure toxicity using
a bacterial indicator. This paper describes this test in detail. It also reviews the field of alter-
native tests for toxicity, tests not involving viable animals.
15.2.2.2 Toxicity defined
In toxicology, a compound is defined to be toxic if it damages living organisms. There is no
chemical definition of toxicity. Classically, toxicity is determined from the LD50 for ani-
mals, the amount of the compound that kills 50% of the test animals (Rodericks, 1992).
Typically varying concentrations of the toxin are given to groups of 10 animals and a single
test can take 80 to 100 animals. Tests can take several weeks. Animal tests are expensive.
The animals must be cared for and trained personnel are required. The animals are force fed
the toxin so it passes through the acidic stomach or the toxins are introduced by
intraperitoneal injection. This can alter the activity of the toxin. The results from animal
tests are difficult to interpret since animals can die of causes other than the toxic chemical
and analysis of the data usually requires sophisticated statistical analysis. In the United
States it is estimated that 30 million animals die each year testing for toxic chemicals. Many
question the value of animal tests (Ruelius, 1987). Results vary dramatically between
strains of animals. Results with closely related species, rats and mice, often don’t agree
well. The drug Thalidomide many years ago was tested in animals and was found to be
harmless. The drug had tragic effects on humans. And, of course, animal tests do not note if
the animal becomes ill from the toxin. They only note if the toxin kills the animal.Often it is not known why the chemical is toxic. It is simply observed that animals
coming in contact with the toxin die at abnormally high rates. Obviously the first step in astudy of a toxic chemical, is simply to determine if it is toxic.
Most animal tests are run with rats and mice, the usual laboratory animals. Rats andmice are rodents and they have a caecum, a chamber that opens off the small intestine. Thecaecum contains many microorganisms. It is not known what the role of the aecum could bein handling toxic chemicals. This may influence results with rats and mice.
Alternatives to animal tests are sought. The sand flea Daphnia magna is used exten-sively. Tests are inexpensive, most the animal rights advocates are not offended. Daphniatests are difficult to perform and require highly skilled personnel. The tests typically taketwo days (Stephenson, 1990). Once it has been determined that the toxin kills the juvenilecells, it can be determined if the toxin interferes with maturation of the juveniles, with re-production in the adults, or if the toxin simply inhibits growth. However, nearly all reportssimply deal with death of the animals. Ceriodaphnia dubia offers another approach to thissort of test (Jung and Bitton,1997). There is a version of this test called CeriofastTM thattakes only one hour. Daphnia testing requires laboratory skills that typically lab workers donot develop. The juvenile insects must be isolated using a dissecting microscope. The ani-mals must be monitored to determine if they are living. It is necessary to watch the culture toknow when to isolate the juveniles.
15.2.2 A simple test to determine toxicity using bacteria 1095

In Europe many tests with animal and human cells have been developed (Clemendsonet al., 1996). These tests are effective, provide values comparable to those obtained with an-imals. But they require that the animal cells be grown in culture. This requires a sophisti-cated laboratory and well trained personnel. Again the tests take several days. Some teststake up to a week. Damage to the cells is determined in a variety of ways. The ability of cellsto reduce the thiazole tetrazolium dye, MTT, is noted; the activity of an enzyme, often lacticdehydrogenase, is determined; the ability of the cell to take up some dyes or to retain otherdyes is observed. Often morphological changes are noted to determine if the cells are dam-aged. These techniques can be quite complicated and require well trained personnel and asophisticated, well equipped, laboratory.
There are several reports using animal cells to test the MEIC chemicals (Shrivastava etal., 1992; Rommert et al., 1994; Rouget et al., 1993). Shrivastava et al., used freshly isolatedrat hepatocyte cells and two transformed cell lines. Comparable results were obtained withthe three cell types indicating that rat hepatocytes are no more resistant to toxic chemicalsthan are other cells. They determined viability of the cells with 1) morphological studies; 2)lactic dehydrogenase activity in the hepatocytes; 3) the ability of the cells to take up the dyetryptan blue. They got much the same results with the three techniques. Rommert et al., sim-ply determined the effect of the toxins on the ability of the cells to replicate. They deter-mined cell numbers with a Coulter Counter after 48 hours. Rouget et al., followed the effectof the toxins by determining the ability of cells to reduce the tetrazolium dye MTT and theability of cells to take up the dye neutral red. The authors maintained that the two methodsprovided comparable results.
In Europe tests with rotifers, cysts from aquatic invertebrates (Calleja et al., 1994), de-velopment of onion roots have been tried but none have been accepted (Persoone et al.,1994; Snell and Persoone, 1989; Fresjog, 1985; Gaggi et al. 1995). Jaffe (1995) has pro-posed a method using the survival of a protozoan. Toxic chemicals kill the protozoa. Thetest requires a Coulter particle counter to determine the numbers of viable protozoa.
Tests using bacteria as the indicator organism are on the market. MicrotoxTM uses abioluminescent marine bacterium (Bullich et al., 1990). The bacteria, when growing in highnumbers, emit light. Toxic chemicals inhibit the production of light. The test requires aluminometer to measure light production and a refrigerated water bath to grow the cells at15oC. The results are difficult to interpret. The ability of the cells to emit light gradually de-creases and a control to follow production of light in the absence of a toxin must be run. Andthe value for this enters into the calculations. Typically the calculations require at least ahalf hour to carry out (Ribo and Kaiser, 1987). A sophisticated computer program is used toanalyze the results. The initial cost of the kit is significant, but it is inexpensive to use oncethis cost is absorbed (Elanabarwy et al., 1988). The test appears to be challenge for an MSlevel graduate student at our university. It is not certain why toxic chemicals inhibit lightproduction but it is assumed that the chemicals damage the cytoplasmic membrane and re-duce electron transport to the pigments responsible for light production. This method is verypopular as a “first test”, to see if a chemical need be investigated further. The test has beenused to determine the toxicity of more than a thousand chemicals (Kaiser and Palabrica,1991). There is a European version of the same text, BiotoxTM (Kahru and Borchardt, 1994).Thomulka et al. (1995) have proposed a variation on this test.
PolytoxTM uses a consortium of bacteria from sewage sludge. Toxic chemicals inhibitthe oxidation of a carbon source (presumably glucose). Presumably the toxic chemicalsdamage the cellular membrane and the associated cytochromes involved in electron trans-port. Oxidation of the substrate is followed with a respirometer or with oxygen electrodes.Both these methods are complicated and expensive to set up and to maintain. Again, at ouruniversity, this technique appears to be appropriate for MS level graduate students. This test
1096 James L. Botsford
is used to determine if chemicals will harm sewage treatment plants. It is rarely used to de-termine the toxicity of compounds. The test provides values comparable to those observedusing sewage sludge as the source of bacteria (Sun et al., 1993; Toussaint et al., 1995;Elnabarawy et al., 1988).
ToxitrakTM has been used to determine toxicity in water samples. There is a report(Gupta and Karuppiah, 1995) in which they tested water samples from a river in Marylandusing this method, MicrotoxTM, Ceriodaphnia dubia (a variation of the standard Daphniatest), and this test. With four samples, they got comparable results. The Toxitrak test is notused extensively. Apparently the test follows the reduction of dye resazurin by cells of Ba-cillus cereus (Liu, 1989).
Dozens of tests using bacteria as indicator organisms in toxicity studies have been pro-posed (Bitton and Dutka, 1986). Very few of these have been characterized extensively.Bacterial tests are inexpensive, inoffensive to animal rights groups, the cells are easy togrow and to prepare. And it is thought there is enough universality at the biochemical level,that a compound that is toxic for a bacterium will be toxic for a higher organism.
Ideally an alternative test for toxic chemicals would be inexpensive. It would not re-quire any specialized equipment, only equipment normally found in a laboratory should berequired. The test should not require that the personnel be specially trained in the tech-niques. It should involve only the procedures that any laboratory worker would know. Itshould be the sort of test that any laboratory with a tangential interest in toxicology couldcarry out. Water quality laboratories, industrial safety laboratories, agricultural researchlaboratories, should be able to carry out the procedure. Small samples should be tested.Tests with fish often involve quite large volumes of toxic chemicals and this can limit theirutility. This has been discussed in detail by Blaise (1991).
The sensitivity of a test can be a problem. Every test for toxic chemicals has somechemicals that the test is very sensitive to. And every test has some toxic chemicals that it isnot sensitive to. Often several tests will be run and the median value for toxicity is judged tobe representative for the toxicity of that chemical. It can be argued that if a test system is ex-tremely sensitive to a chemical, than it must be concluded that this chemical could be toxicfor humans at this very low level. If it damages one life form, it could very well damage an-other. Tests with live animals, LD50 tests, are usually not as sensitive as tests with Daphnia,with animal cells, with bacterial tests. Tests with live animals usually involve injecting thetoxin into the stomach and it is not always certain what effect the acidic conditions of thestomach may have on the toxin. And humans rarely come in contact with toxins in this fash-ion. It can be argued that this sort of animal test is not indicative of the toxicity of the chemi-cal (Ruelius, 1987). On the other hand, chemical analysis is often much more sensitive thanany toxicity test. There are reports of chemicals in the range of parts per trillion yet few testsfor toxic chemicals can detect less than parts per million or occasionally, parts per billion.Yet we see public policy formulated on the basis of these chemical tests.
15.2.2.3 An alternative
A simple, inexpensive and rapid test to determine the toxicity of chemicals has been devel-
oped. (Botsford, 1997, 1998, 1999). The assay uses the bacterium Rhizobium meliloti as the
indicator organism. This bacterium reduces the thiazole tetrazolium dye, MTT
(3-[4,5-dimethylthiazole-2-y]-2,5-biphenyl tetrazolium bromide) readily. The dye is al-
most completely reduced after a 20 minute incubation at 30oC. The dye turns dark blue
when reduced and this can be followed readily with a simple spectrophotometer. Reduction
of the dye is inhibited by toxic compounds. More than 200 compounds have been tested and
the results obtained with this test are comparable to those obtained with other tests
(Botsford, 2000a).
15.2.2 A simple test to determine toxicity using bacteria 1097

Since alternative tests don’t involve killing test animals, results are reported as IC50values (inhibitory concentration, 50%), the concentration that results in death of 50% of thecells, in 50% inhibition of oxygen consumption, 50% inhibition of reduction of the dye inthe Rhizobium assay.
Cells are grown overnight in a simple defined medium with 0.1% casamino acids.Cells are collected by centrifugation in a refrigerated preparative centrifuge. Cells arewashed once with 0.01 M (pH 7.5) potassium phosphate buffer and are then diluted in thissame buffer. Volumes of the toxin (usually 5 to 1000 µl) are put into test tubes. The volumeof the toxin is made up to 2.1 ml with water. 0.1 ml of 0.1 M Tris or Bicene buffer, pH 7.5, isadded. The absorbancy at 550 nm is determined. 0.1 ml MTT (the tetrazolium dye) is added(3.2 mM). The tubes are incubated 20 minutes at 30oC. The absorbance is read a secondtime. The difference in the absorbance at time = 0 and at time = 20 min is determined. Theresults are plotted, the difference in absorbance of each tube with a different volume of thetoxic chemical on the X axis versus the absorbance on the Y axis (Figure 15.2.2.1). A re-gression line is fit to the plot and if the regression coefficient is less than 0.8, the experimentis rejected. From the average value of the controls (tubes with no toxin), the Y interceptforms the regression equation and the slope, the volume of toxin inhibits reduction of thedye 50% can be readily calculated. For some toxins, better results are obtained if the log of
1098 James L. Botsford
Figure 15.2.2.1. Cyanazine is in units of µl. Cyanazine is a herbicide. The toxicity of cyanazine is: IC50 = [Y/2
-B]/m; Y = 0.35, 0.37 = 0.36, 0.36/2 = 0.18; B = 0.3487 m = 3.5058x10⁻³; IC50 = 48.1; 48.1µl = ([48.1 x 10⁻⁶ l]/test
tube) x([3300 mg]/l) x [1 test tube]/3.3 ml)= 48.1 µg/ml = 48.1 mg/l = 48.1 ppm.
the volume of the toxin is plotted. From this the log of the volume corresponding to 50% in-hibition of reduction can be determined and the antilog of this value provides the volume. Inthis laboratory the data is plotted both linearly and logarithmically and the best method pro-viding the regression coefficient closest to 1.00 is chosen. From the concentration of thetoxic compound, the volume found to inhibit reduction of the dye could be converted tomg/ml present in the test tube. From this the inhibitory concentration causing 50% inhibi-tion, the IC50, can be calculated. The test has been described in detail (Botsford et al., 1997;Botsford 1998; Botsford, 1999).
A method to lyophilize cells has been developed and cells are active for at least amonth after being lyophilized (Robertson, 1996).
This test for toxic chemicals is very inexpensive. It can be carried out by unskilled per-sonnel. It is rapid, taking less than an hour to determine the toxicity of a compound. It pro-vides values comparable to more conventional tests (Botsford, 2000a). It provides a sort oftoxicological triage, a method to rapidly determine if something is toxic and should be in-vestigated further. Since it uses bacteria rather than animals as an indicator, it is acceptablewith animal rights advocates. The test has been patented and the author is seeking a firm tomarket the test. In the meantime, it can be carried out by any laboratory equipped to growbacteria.
Since this test uses a bacterium as the indicator organism. It can be argued that the re-sults with a bacterium are not applicable to humans. But tests with rats and mice may not beapplicable to humans (Ruelius, 1987). For example, in a test of 10 chemicals comparing re-sults with mice, rats and five cellular assays, the toxicity of three of compounds differed byat least an order magnitude when rats and mice were compared (Ekwall et al., 1989). Suchanomalies been observed with many drugs, that drugs were up to 12×more toxic for humansthan for rats and mice (Brodie and Reid, 1967). At a biochemical level, a compound thatdamages the cytoplasmic membrane of a bacterium will also damage the cytoplasmic mem-brane of a human or any other organism. This test has been compared with 20 other tests fortoxic chemicals and comparable results (similar IC50 values) are obtained (Botsford,2000a). No one test finds all chemicals to be toxic. Every assay for toxic chemicals is blindto some compounds and conversely every assay for toxic chemicals is much more sensitiveto some compounds than are other tests. Thus toxicologists desire “batteries of tests”, acompound is not considered to be toxic until it has proven to be toxic in 3 or 4 systems.
15.2.2.4 Chemicals tested
In Table 15.2.2.1, the values for the more than 200 chemicals tested in this laboratory are re-
ported. This includes a series of organic chemicals, chemicals that are reported in the litera-
ture as being toxic. It was noted that aromatics, phenol, benzene and toluene are not very
toxic. But when they have substituents, a phenoxy group, chlorine, methyl or nitro they be-
come quite toxic. Solvents were tested for toxicity and most solvents are not very toxic. We
have found we can dissolve toxic compounds in solvents (methanol and DMSO) and find no
change in the toxicity. Apparently the toxin is so much more toxic than the solvent that only
the toxin affects the mechanism affording the assay. Many drugs were also tested and it is
significant that many of these drugs are toxic for the bacterium and presumably would be
toxic for patients receiving them. Often it is noted that when a drug is taken, an individual
simply does not feel well. This could be due to toxicity of the drug. It was found that many
alkaloids are toxic and then it was shown that many herbs are also toxic. Presumably the
herbs contain toxic levels of some alkaloids. Some of these herbs are toxic enough that if
mega herb therapy ever becomes popular, there could be problems from the toxicity of the
herbs. It was found that divalent cations are toxic for the system. It was found that small
amounts of EDTA could relieve this toxicity in soil and water samples. This will be dis-
15.2.2 A simple test to determine toxicity using bacteria 1099
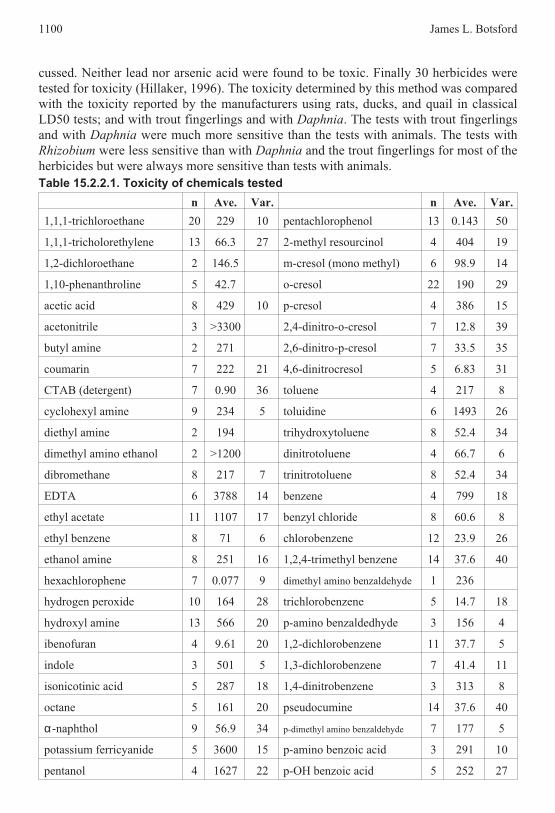
cussed. Neither lead nor arsenic acid were found to be toxic. Finally 30 herbicides were
tested for toxicity (Hillaker, 1996). The toxicity determined by this method was compared
with the toxicity reported by the manufacturers using rats, ducks, and quail in classical
LD50 tests; and with trout fingerlings and with Daphnia. The tests with trout fingerlings
and with Daphnia were much more sensitive than the tests with animals. The tests with
Rhizobium were less sensitive than with Daphnia and the trout fingerlings for most of the
herbicides but were always more sensitive than tests with animals.
Table 15.2.2.1. Toxicity of chemicals tested
n Ave. Var. n Ave. Var.
1,1,1-trichloroethane 20 229 10 pentachlorophenol 13 0.143 50
1,1,1-tricholorethylene 13 66.3 27 2-methyl resourcinol 4 404 19
1,2-dichloroethane 2 146.5 m-cresol (mono methyl) 6 98.9 14
1,10-phenanthroline 5 42.7 o-cresol 22 190 29
acetic acid 8 429 10 p-cresol 4 386 15
acetonitrile 3 >3300 2,4-dinitro-o-cresol 7 12.8 39
butyl amine 2 271 2,6-dinitro-p-cresol 7 33.5 35
coumarin 7 222 21 4,6-dinitrocresol 5 6.83 31
CTAB (detergent) 7 0.90 36 toluene 4 217 8
cyclohexyl amine 9 234 5 toluidine 6 1493 26
diethyl amine 2 194 trihydroxytoluene 8 52.4 34
dimethyl amino ethanol 2 >1200 dinitrotoluene 4 66.7 6
dibromethane 8 217 7 trinitrotoluene 8 52.4 34
EDTA 6 3788 14 benzene 4 799 18
ethyl acetate 11 1107 17 benzyl chloride 8 60.6 8
ethyl benzene 8 71 6 chlorobenzene 12 23.9 26
ethanol amine 8 251 16 1,2,4-trimethyl benzene 14 37.6 40
hexachlorophene 7 0.077 9 dimethyl amino benzaldehyde 1 236
hydrogen peroxide 10 164 28 trichlorobenzene 5 14.7 18
hydroxyl amine 13 566 20 p-amino benzaldedhyde 3 156 4
ibenofuran 4 9.61 20 1,2-dichlorobenzene 11 37.7 5
indole 3 501 5 1,3-dichlorobenzene 7 41.4 11
isonicotinic acid 5 287 18 1,4-dinitrobenzene 3 313 8
octane 5 161 20 pseudocumine 14 37.6 40
α-naphthol 9 56.9 34 p-dimethyl amino benzaldehyde 7 177 5
potassium ferricyanide 5 3600 15 p-amino benzoic acid 3 291 10
pentanol 4 1627 22 p-OH benzoic acid 5 252 27
1100 James L. Botsford

n Ave. Var. n Ave. Var.
phenanthroline 5 43.3 20 2-OH benzoic acid (salicylic acid) 3 217 13
Tris (Trizma, pH 7.5) 3 5447 16 p-amino benzoic acid 4 307 2
MOPS 3-[N-morpholino]
propane sulfonate5 13090 27 chlorobenzoic acid 6 233 19
tetrachloroethylene 16 91.2 21 4-chlorobenzoic acid 5 234 14
tetrachloromethane 10 1791 12 3-phenoxybenzoic acid 4 62.7 25
salicylic acid 4 198 203(3,5-dichlorophenoxy)
benzoic acid5 41.9 20
sulfosalicylic acid 11 1107 17 3(4-chlorophenoxy) benzoic acid 7 32.9 43
xylene 4 132 27 3(4-methyl phenoxy) benzoic acid 6 92.1 9
phenol 16 1223 283(3,4-dichlorophenoxy)
benzoic acid4 45.9 24
4-chlorophenol 6 186 23 Solvents
3-chlorophenol 6 3.21 45 acetone 18 123000 24
3-methyl-4-nitro phenol 4 54.9 27 acetic acid 8 429 10
2,4-dichlorophenol 4 68.7 5 coumarin 7 222 21
3,4-dichlorophenol 5 82.3 74 chloroform 10 1550 22
3,5-dichlorophenol 5 174 37 ethanol 20 75581 28
2,3-dimethyl phenol 10 120 5 DMSO 13 87629 31
2,4-dimethyl phenol 11 71.4 28 dichloroethane 28 237 38
2,4,6-trimethyl phenol 10 123 9 dibromomethane 8 217 15
3,4,5-trimethyl phenol 6 49.5 4 isopropyl alcohol 3 57000 19
2,3,6-trimethyl phenol 6 151 9 methanol 4 68172 13
dimethyl amino methyl phenol 10 413 24 pentanol 4 1623 22
trichlorophenol 45 8.24 38 ethylene glycol 5 212700 12
o-nitrophenol 13 37.6 33
Herbs Detergents
Aloe Vera 4 219 4 CTAB 7 0.90 36
Cayenne 4 700 1 SDS 8 31.4 14
Echinacea 7 451 1 Tween 20 5 2896 22
Echinacea root 5 939 4 Insecticides
Elderberry 4 291 1 Lindane 8 41.1 28
Evening Primrose 11 35 17 Malathion 14 37.1 40
Myrrh 6 71.2 3 Diazanon 18 35.6 24
15.2.2 A simple test to determine toxicity using bacteria 1101
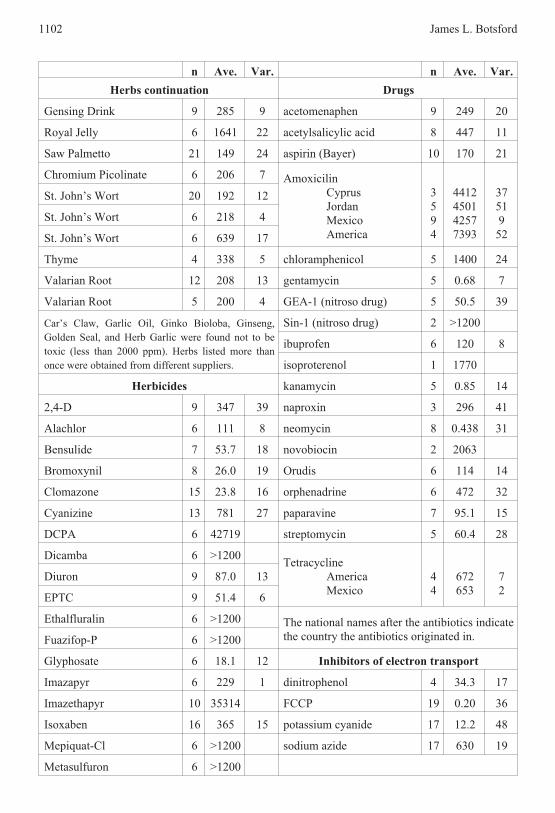
n Ave. Var. n Ave. Var.
Herbs continuation Drugs
Gensing Drink 9 285 9 acetomenaphen 9 249 20
Royal Jelly 6 1641 22 acetylsalicylic acid 8 447 11
Saw Palmetto 21 149 24 aspirin (Bayer) 10 170 21
Chromium Picolinate 6 206 7 Amoxicilin
Cyprus
Jordan
Mexico
America
3
5
9
4
4412
4501
4257
7393
37
51
9
52
St. John’s Wort 20 192 12
St. John’s Wort 6 218 4
St. John’s Wort 6 639 17
Thyme 4 338 5 chloramphenicol 5 1400 24
Valarian Root 12 208 13 gentamycin 5 0.68 7
Valarian Root 5 200 4 GEA-1 (nitroso drug) 5 50.5 39
Car’s Claw, Garlic Oil, Ginko Bioloba, Ginseng,
Golden Seal, and Herb Garlic were found not to be
toxic (less than 2000 ppm). Herbs listed more than
once were obtained from different suppliers.
Sin-1 (nitroso drug) 2 >1200
ibuprofen 6 120 8
isoproterenol 1 1770
Herbicides kanamycin 5 0.85 14
2,4-D 9 347 39 naproxin 3 296 41
Alachlor 6 111 8 neomycin 8 0.438 31
Bensulide 7 53.7 18 novobiocin 2 2063
Bromoxynil 8 26.0 19 Orudis 6 114 14
Clomazone 15 23.8 16 orphenadrine 6 472 32
Cyanizine 13 781 27 paparavine 7 95.1 15
DCPA 6 42719 streptomycin 5 60.4 28
Dicamba 6 >1200Tetracycline
America
Mexico
4
4
672
653
7
2
Diuron 9 87.0 13
EPTC 9 51.4 6
Ethalfluralin 6 >1200 The national names after the antibiotics indicate
the country the antibiotics originated in.Fuazifop-P 6 >1200
Glyphosate 6 18.1 12 Inhibitors of electron transport
Imazapyr 6 229 1 dinitrophenol 4 34.3 17
Imazethapyr 10 35314 FCCP 19 0.20 36
Isoxaben 16 365 15 potassium cyanide 17 12.2 48
Mepiquat-Cl 6 >1200 sodium azide 17 630 19
Metasulfuron 6 >1200
1102 James L. Botsford

n Ave. Var. n Ave. Var.
Herbicides continuation Alkaloids
Metribuzin 6 >1200 atropine 9 191 11
Naproamide 10 289 43 caffeine 3 3700 18
Nicosulfuron 10 267 11 immitine 11 122 8
Norflurazon 8 182 14 nicotine 13 990 13
Oxadiazon 6 269 16 quinine 4 131 14
Quniclorac 6 >1200 qunidine 4 137 15
Sethoxydim 6 2.70 17 scopolomine 5 129 5
Thiazopyr 6 43.2 4
Thifensulfuron 7 928 4
Trifluralin 7 10.3 18
n = the number of samples tests; ave. = the average of the values obtained, reported as part per million (ppm), mg
per liter; var. = the variance in the results, the standard deviation divided by the mean.
15.2.2.5 Comparisons with other tests
The Rhizobium test has been compared with other tests. This is done by finding values in the
literature for various toxins using different tests and plotting the log of these values vs. the
log of values from the second assay. A regression line was plotted and the correlation coeffi-
cient calculated from the regression coefficient (the correlation coefficient is the square root
of the regression coefficient). In Figure 15.2.2.2, values for chemicals from two laboratories
15.2.2 A simple test to determine toxicity using bacteria 1103
Figure 15.2.2.2. Representative plot of the comparison of two assays. These are data from Daphnia 1 (Calleja et al.,
1993) and Daphnia 2 (Lilius et al.,1994).

(Calleja et al., 1993; Lilius et al., 1994) using the assay involving the sand flea Daphnia
magna are presented. If two systems give the same results, the correlation coefficient will be
1.00. In the literature there are reports of the toxicity of 50 MEIC chemicals (MEIC,
multicenter evaluation of cytotoxicity) tests used in Europe to evaluate different tests for
toxicity. When these two tests with Daphnia were compared, a correlation coefficient of
0.895 was obtained (Figure 15.2.2.2). This indicates that when a standardized test is run in
two laboratories with different personnel, the results are not identical. This discrepancy is
noted in tests involving animals. Apparently variations in the strains of animals, differences
in care and other factors influence the results of toxicity tests with animals. Often variations
of 10x are observed.This sort of analysis was carried using the Rhizobium assay. Published values for the
chemicals using Microtox, LD50 reports for rats, IC50 (testing with animal cells), Daphniamagna, and HLD (Human Lethal Dose determined from autopsy reports) are included (Ta-ble 15.2.2.2). These values for the assay with Rhizobium will permit comparisons to bemade (Table 15.2.2.3). It should be noted that the values for rats and HLD are much higherthan with the other methods. With animal tests, the animals are force fed the chemical, it isinjected through a tube into their stomach. Occasionally the toxin is injectedintraperitoneally. It is uncertain what happens to the toxic chemical in the acidic stomach.This methodology has been criticized because humans are rarely exposed to toxic chemicalsin this fashion. HLD data comes from autopsy reports and it can never be certain how muchof the chemical the victim actually came in contact with, it can only be estimated. And thismethod only provides data for chemicals already in the environment, it is not a good methodto predict toxicity.
Table 15.2.2.2. MEIC chemicals tested. Comparison
Chemical tested Rhiz
obiu
m,
mm
ole
s
Mic
roto
x,
mm
ole
s
Rat
,
mm
ole
s
IC50,
mm
ole
s
Dap
hnia
,m
mole
s
HL
D,
mm
ole
s
rat
hep
at,
mm
ole
s
acetomenaphen 1.649 2.19 15.8 1.45 0.269 1.698 10.75
acetylsalicylic acid 1.106 0.145 1.122 1.7 0.932 2.818 2.662
amitriptyline 0.0146 0.078 1.148 0.1 0.02 0.2 0.07
barium chloride 0.109 1.349 0.794 0.47
caffeine 1.02 3.388 1 1.58 3.388 1 1.596
carbon tetrachloride 1.91 4.786 15.1 22.1 126 0.447 3.984
chloroform 5.29 12.9 7.586 2.63 1.738 6.198
chlororamphenicol 4.332 1.122 7.7 0.54 5.248 0.402
copper II sulfate 0.007 0.01 1.86 0.001 0.316 0.048
dichloromethane 4.122 37.1 18.6 10.5 4.17 109.1
digoxin 0.231 0.426 0.12 12.8 0.0014 0.271
ethanol 1643 691 151 158 234 109.6 451
ethylene glycol* 3427 1778 75.8 322 1202 25.7 358
1104 James L. Botsford

Chemical tested Rhiz
obiu
m,
mm
ole
s
Mic
roto
x,
mm
ole
s
Rat
,
mm
ole
s
IC50,
mm
ole
s
Dap
hnia
,m
mole
s
HL
D,
mm
ole
s
rat
hep
at,
mm
ole
s
hexachlorophene 0.0002 0.019 0.138 0.0068 0.00027 0.002
isopropyl alcohol 950 380 83.2 90.5 155 41.7 304
iron II sulfate 0.32 0.782 2.089 0.302 3.020 1.621
lindane 0.141 21.9 0.263 0.36 0.0056 0.144
malithion 0.112 0.479 0.871 0.741
mercury II chloride 0.00006 0.0002 3.715 0.00013 0.107 0.003
methanol 2130 912 178 673 661 52.5 906
nicotine 6.1 0.224 0.309 4.52 0.0.23 0.11 3.581
orphenadrine HCI* 1.168 0.005 0.832 0.033 0.098 0.114
paraquat 0.262 2.344 0.224 0.1 0.166 1.176
pentachlorophenol 0.00054 0.02 0.1 0.025 0.0022 0.098 0.05
phenol 13 0.186 3.39 4.25 0.077 1.48 0.797
potassium chloride 290 493 34.6 490 0.288 92.22
potassium cyanide 0.225 0.275 0.0776 1 0.0141 0.437 0.783
quinidine sulfate 0.422 1.202 0.617 0.036 0.0797 0.129
sodium chloride 288 562 51.3 60.3 17 102
sodium oxalate >13 5.428 0.582
theophylline 1.926 13.8 1.349 2.63 0.724 2.175
1,1,1-trichloroethane 0.583 0.342 77.6 6.71 1.48
warfarin 1.781 0.209 0.005 0.67 1.549 0.0219 0.139
xylene 1.24 0.079 34.6 0.851 0.468 17.47
Mw = molecular weight of the compound; n = number of times compound was tested; var = variation in the results,
the standard deviation /mean\ toxicity reported as mmoles toxin for the IC50 for the test. The rat test is an LD50.
Rhizobium data are from this work. MicrotoxTM, HLD, and Daphnia data are from Calleja, (1993). The IC50 data
(pooled data from animal cell tests) is from Halle et al., 1993. Rat hepatocyte data is from Shrivastava (1992). The
IC50 samples include only 20 chemicals. The other methods involve about 34 chemicals.
In Table 15.2.2.3 the results of comparisons among these tests are summarized. Thedata from these 6 determinations were plotted, one assay versus another assay, the regres-sion coefficient noted and the correlation coefficient calculated. The Rhizobium assay wasthe most sensitive for 12 of 33 chemicals. The Microtox assay was most sensitive for 6 ofthe compounds. The IC50 assay was most sensitive for 6 of the compounds. The Daphniatest was most sensitive to 10 of the compounds. The average values for the toxicity of thechemicals was lowest for the IC50, but then it was also the test with the fewest values in-cluded.
15.2.2 A simple test to determine toxicity using bacteria 1105

Table 15.2.2.3. Comparisons for involving Rhizobium, MicrotoxTM, HLD, IC50, Daphnia
magna and rats
n r2
n r2
Rhizobium x MicrotoxTM 34 0.875 Rats x IC50 19 0.724
Rhizobium x rats 34 0.603 Rats x HLD 27 0.817
Rhizobium x IC50 20 0.906 Rats x Daphnia 32 0.685
Rhizobium x HLD 34 0.628 Rats x rat hepatocytes 34 0.748
Rhizobium x Daphnia 34 0.888 IC50 x HLD 16 0.732
Rhizobium x rat hepatocytes 34 0.764 IC50 x Daphnia 29 0.879
Microtox x rats 34 0.571 IC50 x rat hepatocytes 20 0.700
Microtox x IC50 24 0.840 HLD x rat hepatocytes 26 0.648
Microtox x HLD 31 0.728 HLD x Daphnia 29 0.702
Microtox x rat hepatocytes 33 0.700 Daphnia x rat hepatocytes 33 0.814
Microtox x Daphnia 34 0.846
n = number of samples in the test. One test was compared with another, the log of the values plotted, a regression
line fit and the correlation coefficient determined from the regression coefficient, r2.
The data for rats, Daphnia, HLD is from Calleja et al., 1994. The data for IC50 is from Halle et al., 1992. The data
for rat hepatocytes is from Shrivastava et al., 1992.
In Table 15.2.2.4, the results of these comparisons with the results of the Rhizobiumtest are presented. The Rhizobium test correlates well with MicrotoxTM, Daphnia, and par-ticularly well with the 20 samples in the IC50 test. The comparison of the Rhizobium assayswith other published results has been examined in detail (Botsford, 2000a). The Rhizobiumtest has been compared with values from several laboratories for the MicrotoxTM assay andcorrelation coefficients have varied from 0.750 to 0.893 indicating the two methods providecomparable results. Four comparisons with values for Daphnia have provided correlationcoefficients from 0.776 to 0.953 indicating that the Rhizobium assay agrees well with Daph-nia.
QSAR provides a method to predict the toxicity of a compound from the structure ofthe compound and the water/octanol partition coefficient (Nirmilkhandan and Speece,1988). This method has been compared with assays using sewage sludge and PolytoxTM
(Sun et al., 1993). The method compares well with both these other techniques. An exami-nation of the data provided by tests for toxic chemicals using these techniques suggestedthat they are not as sensitive as more direct methods for determining toxicity. It was foundthat MicrotoxTM, rat hepatocytes, the Rhizobium assay, and Daphnia all provided more sen-sitivity to toxic chemicals than did the QSAR estimates (Botsford, 2000a). The IC50 valuesfor these other techniques were lower than those computed using the QSAR method. QSARdata are not often found in the literature.
1106 James L. Botsford
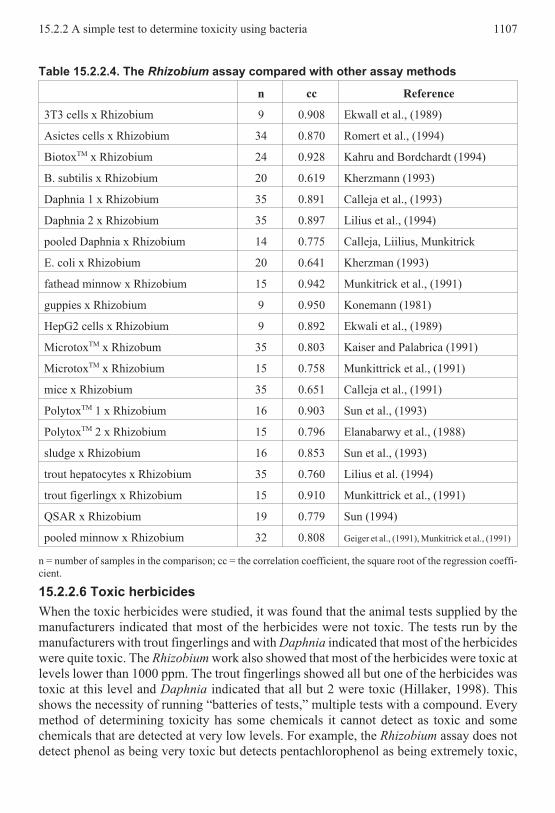
Table 15.2.2.4. The Rhizobium assay compared with other assay methods
n cc Reference
3T3 cells x Rhizobium 9 0.908 Ekwall et al., (1989)
Asictes cells x Rhizobium 34 0.870 Romert et al., (1994)
BiotoxTM x Rhizobium 24 0.928 Kahru and Bordchardt (1994)
B. subtilis x Rhizobium 20 0.619 Kherzmann (1993)
Daphnia 1 x Rhizobium 35 0.891 Calleja et al., (1993)
Daphnia 2 x Rhizobium 35 0.897 Lilius et al., (1994)
pooled Daphnia x Rhizobium 14 0.775 Calleja, Liilius, Munkitrick
E. coli x Rhizobium 20 0.641 Kherzman (1993)
fathead minnow x Rhizobium 15 0.942 Munkitrick et al., (1991)
guppies x Rhizobium 9 0.950 Konemann (1981)
HepG2 cells x Rhizobium 9 0.892 Ekwali et al., (1989)
MicrotoxTM x Rhizobum 35 0.803 Kaiser and Palabrica (1991)
MicrotoxTM x Rhizobium 15 0.758 Munkittrick et al., (1991)
mice x Rhizobium 35 0.651 Calleja et al., (1991)
PolytoxTM 1 x Rhizobium 16 0.903 Sun et al., (1993)
PolytoxTM 2 x Rhizobium 15 0.796 Elanabarwy et al., (1988)
sludge x Rhizobium 16 0.853 Sun et al., (1993)
trout hepatocytes x Rhizobium 35 0.760 Lilius et al. (1994)
trout figerlingx x Rhizobium 15 0.910 Munkittrick et al., (1991)
QSAR x Rhizobium 19 0.779 Sun (1994)
pooled minnow x Rhizobium 32 0.808 Geiger et al., (1991), Munkitrick et al., (1991)
n = number of samples in the comparison; cc = the correlation coefficient, the square root of the regression coeffi-
cient.
15.2.2.6 Toxic herbicides
When the toxic herbicides were studied, it was found that the animal tests supplied by the
manufacturers indicated that most of the herbicides were not toxic. The tests run by the
manufacturers with trout fingerlings and with Daphnia indicated that most of the herbicides
were quite toxic. The Rhizobium work also showed that most of the herbicides were toxic at
levels lower than 1000 ppm. The trout fingerlings showed all but one of the herbicides was
toxic at this level and Daphnia indicated that all but 2 were toxic (Hillaker, 1998). This
shows the necessity of running “batteries of tests,” multiple tests with a compound. Every
method of determining toxicity has some chemicals it cannot detect as toxic and some
chemicals that are detected at very low levels. For example, the Rhizobium assay does not
detect phenol as being very toxic but detects pentachlorophenol as being extremely toxic,
15.2.2 A simple test to determine toxicity using bacteria 1107

the test is at least an order of magnitude more sensitive to pentachlorophenol than any other
test found.
15.2.2.7 Toxicity of divalent cations
Reduction of the dye is inhibited by divalent cations in the Rhizobium system. Common
ions, calcium and magnesium, inhibit the reduction of the dye. The toxicity of the ions is
shown in Table 15.2.2.5. Mercury and cadmium, generally thought to be the most toxic
minerals were the most toxic with this assay. Calcium and magnesium are also toxic. Water
and soil samples typically contain calcium and magnesium so in order to analyze water and
soil samples for toxic organic chemicals, a method to eliminate this inhibition by metal ions
was sought.
Table 15.2.2.5. Toxicity of divalent cations
Minerals n var. m moles Minerals n var. m moles
Ba+2 6 33 0.109 Mg+2 9 20 0.404
Cd+2 12 41 0.004 Mn+2 11 35 0.045
Ca+2 11 33 0.05 Hg+2 10 23 0.0006
Co+2 11 46 0.009 Ni+2 11 11 0.452
Cu+2 13 19 0.007 Se+2 9 39 1.849
Fe+2 7 18 0.587 Zn+2 10 7 0.062
Fe+3 14 27 0.098
n = number of samples tested; var. = variation, standard deviation divided by the mean. Values reported as m moles
l-1. All minerals except ferrous ion as chloride salts. Several were tested as both chlorides and sulfates with little
difference. When ferrous sulfate was tested, it was made up fresh each day before the assay.
EDTA is used routinely in biochemistry to chelate divalent metal ions. It was thoughtthis might chelate the calcium and remove it from the system. EDDA and EGTA are alsoused and are thought to chelate calcium more effectively than EDTA. Neither of thesechelators affected the reaction, both were simply slightly toxic (about 3000 ppm). A seriesof experiments were run and it was found that the inhibition of reduction caused by 1.4 to1.6 µmoles of calcium was relieved by 1 µmoles EDTA. There is not a stoichiometric rela-tionship between EDTA and the metal ion. It is not simply chelating the metal ion.
It was found that 2.5µmoles EDTA would eliminate the toxicity of all the ions at theirIC50, the concentration of cation that inhibited reduction of the dye 50%. Thus 2.5 µmolesEDTA would eliminate toxicity from 5.5µmoles calcium but only 0.006µmoles mercury. Itwas observed initially that the toxicity of most organic chemicals could be determined in thepresence of 2.5 µmoles EDTA. This suggested there could be two mechanisms involved inthe reduction of MTT. One is inhibited by toxic organic chemicals and the second is inhib-ited by divalent cations.
15.2.2.8 Toxicity of organics in the presence of EDTA
A series of experiments were run looking at the toxicity of organic chemicals in the pres-
ence of 0.74 µmoles calcium (25 ppm, this concentration inhibits reduction of the dye com-
pletely) and 2.5 µmoles EDTA. Four of the 35 chemicals tested had greater toxicity with
EDTA and calcium than in the controls. Two chemicals were no longer toxic. The toxicity
of 16 of the chemicals was not affected by the calcium and EDTA. The toxicity of 13 chemi-
cals was decreased by at least 10% but was not eliminated by the addition of EDTA and cal-
1108 James L. Botsford

cium. The toxicity of 4 chemicals was enhanced, was greater, when the calcium and EDTA
were present.The addition of calcium and EDTA at these concentrations had no effect on the appar-
ent toxicity of: 1,4-dinitrobenzene, the herbicide 2,4-D, 2,4-dinitrotoluene, 4-chloro-benzo-ate, carbon tetrachloride, chloroform, cynazine, hexachlorophene, isonicotinic acid theinsecticide Lindane, o-nitrophenol, p-toluidine, the antibiotic Streptomycin,tetrachloroethylene and trichlorophenol.
The addition of calcium and EDTA reduced the toxicity at least 10% of2,6-dinitrocresol, 2,4-dinitrophenol, 2,6-dinitrophenol, 2,6-dinitrotoluene, 2-methylresourcinol, 3-phenoxybenzoate, 2,4-dinitrocresol, the detergent CTAB, the antibioticNeomycin, p-hydroxybenzoate, pentachlorophenol, salicylic acid, and trichloroethylene.
p-amino benzoic acid and p-hydroxy benzoate were no longer toxic with these levelsof calcium and EDTA.
3-chlorobenzoate, 3-methyl-4-nitro-phenol, and the detergents sodium lauryl sulfateand Tween 80 had increased toxicity with the addition of calcium and EDTA. No correla-tion between the structure of the chemical and the effect of EDTA and calcium could be as-certained. For example, streptomycin and neomycin are both amino glycoside antibiotics.Calcium and EDTA did not affect the toxicity of streptomycin but nearly eliminated the tox-icity of neomycin.
Several chemicals were tested with 25 µmoles EDTA and 7.4 µmoles of calcium, 10times the amount used in the experiments reported. The results of this experiment are shownin Table 15.2.2.6. In the presence of high levels of EDTA and calcium, isonicotinic acid isno longer toxic. Dinitrophenol and 3-phenoxy benzoate, in the presence of low levels ofEDTA and calcium were not as toxic, in the presence of high levels, it had the same toxicity.In presence of low levels of EDTA and calcium, Streptomycin was comparably toxic, thecalcium and EDTA did not affect the toxicity. In the presence of high levels, Streptomycinwas extremely toxic. Pentachlorophenol, a common soil contaminant, had reduced toxicitywith low levels of EDTA and calcium, had elevated levels of toxicity with high levels ofEDTA and calcium. This work shows that the effect of EDTA and specific toxins must beworked out before any conclusions as to the toxicity of the compound in the presence ofEDTA and calcium can be established.
Calcium and magnesium are commonly found in water. Obviously if this assay is to beused with water samples, EDTA must be added. It must be determined using water uncon-taminated with organic toxins how much EDTA must be used to compensate for the diva-lent cations. Often the concentration of divalent cations is determined by atomic absorptionspectroscopy. However, these values do not agree with the toxicity relieved by EDTA. Soilsamples with as much as 5 gm calcium (45 mM) per kg soil have been assayed using 2.5µmoles EDTA in each sample (Hillaker, 1996). The calcium is complexed with sulfate andphosphate ions and the calcium is not available to the cell, is not seen by the mechanism thatreduces the dye. Levels of soluble calcium and magnesium in water are very low. We havefound that 2.5 µmoles of EDTA relieves the inhibition caused by divalent cations in all wa-ter and soil samples tested thus far (Botsford, 2000b).
15.2.2 A simple test to determine toxicity using bacteria 1109

Table 15.2.2.6. Effect of high concentrations of EDTR and calcium on toxicity(Inhibition in %)
Compound2.5 µmole EDTA, 0.74 µmole Calcium 25 µmole EDTA, 7.4 µmole Calcium
Control + EDTA, + Ca Control + EDTA, + Ca
isonicotinic acid 27.0 25.4 30.9 105
2,4-dinitrophenol 44.7 63.0 58.2 50.0
Streptomycin 55.0 48.9 47.2 0.00
Neomycin 0.037 62.4 77.2 77.3
pentachlorophenol 48.0 63.7 26.0 13.3
3-phenoxybenzoate 54.3 74.0 34.5 37.8
15.2.2.9 Mechanism for reduction of the dye
It is not known how the dye is reduced. It is not known why toxic chemicals inhibit the re-
duction. It is thought that tetrazolium dyes are reduced by cytochromes (Altman, 1975). But
this has been questioned (Marshall et al., 1993). In eucaryotic cells, all the cytochromes are
in the mitochondria. Marshall’s group has found that the dyes are reduced in preparations
from cells with the mitochondria removed. It has been found that a mutant of Escherichia
coli lacking one of two major cytochromes found in this bacterium is unable to reduce MTT
(Botsford, unpublished). But in E. coli, reduction of the dye is not inhibited by toxic chemi-
cals. This may not be an analogous situation. The dye could be reduced by a different mech-
anism.R. meliloti, like most other bacteria, has many reductases. Some of these are mem-
brane associated and damage to the membrane could affect the reductase. One of these re-ductases could be responsible for reduction of the dye. It has been found that the MTT istransported into the cell before it is reduced. The reduced dye is inside the cells. Cells withthe dye can be concentrated by centrifugation, the dye appears in the cell pellet. None of thedye is in the supernatant. Toxic chemicals could interfere with the transport of dye into thecell prior to reduction.
Transposon insertion mutants unable to reduce the dye have been obtained and fivemutants have been isolated. All grow very slowly in minimal media supplement with 0.1 %casamino acids and obviously all have lost a critical function. With these mutants it shouldbe possible to clone and then to sequence the function responsible for reduction of the dye.From the sequence, the nature of the function can be determined.
In our studies comparing the Rhizobium assay with other assays, it was observed thattests using viable animals were almost always less sensitive to toxins. Tests using Daphnia,the various animal cell tests and MicrotoxTM and the Rhizobium test seemed to be most sen-sitive. Tests using fish (fathead minnow, trout fingerlings) give results comparable to testswith the bacterial indicators. PolytoxTM and QSAR were less sensitive, had higher IC50 val-ues, but were more sensitive than the tests using viable animals. Were the author asked torecommend a test procedure to indicate if a chemical were toxic, the author would recom-mend an animal cell test, probably using freshly isolated rat liver hepatocytes, theRhizobium test and the MicrotoxTM test. Tests with freshly isolated rat hepatocytes wouldnot require that the cells be grown in a laboratory situation and this would be much simpler.These three procedures are much more sensitive than tests involved live animals. Thesethree tests would be simpler than tests with Daphnia. This would provide a “battery of
1110 James L. Botsford

tests”, would not offend animal rights advocates and should indicate if the chemical is dan-gerous. All could be performed by personnel with chemical laboratory skills.
15.2.2.10 Summary
This work shows that the Rhizobium test provides results comparable to other tests. Tests
seem particularly comparable to work with Daphnia magna and with results from in vitro
tests with animal cells. The test is simple, unskilled laboratory workers can master it
quickly. The test is inexpensive, no specialized equipment is required, given cells, any labo-
ratory able to carry out simple chemical analysis should be able to perform the assay. The
test is rapid, a sample can be tested and analyzed in an hour, the test does not take several
days. It offers an ideal first test for toxic chemicals (Blaise, 1991)
References
Altman, F. P. 1976. Tetrazolium salts and formazans. Progress is Histochemistry and Cytochemistry 9:6-52.
Bitton, G., Dutka, B. J. (1986) Toxicity testing using microorganisms. CRC Press Inc. Boca Raton, Florida 163
pp.
Blaise, C. 1991. Microbiotests in aquatic toxicology. Environmental Toxicology and Water Quality. 6:145-151.
Botsford, J. L., Rivera, J., Navarez, J., Riley, R., Wright T., Baker, R. 1997. Assay for toxic chemicals using bacte-
ria. Bulletin of Environmental Contamination and Toxicology 59:1000-1008.
Botsford, J. L. 1998. A simple assay for toxic chemicals using a bacterial indicator. World Journal of Microbiology
and Biotechnology. 14:369-376.
Botsford, J. L. 1999. A simple method for determining toxicity of chemicals using a bacterial indicator organism.
Environmental Toxicology 99:285-290.
Botsford, J. L. 2000a. A comparison of alternative tests for toxic chemicals. To be submitted ATLA journal.
Botsford, J. L. 2000b. Role of EDTA in a simple method for determining toxicity using a bacterial indicator organ-
ism. World Journal Microbiology and Biotechnology, in press.
Brodie, B., Reid, W.D., 1967. Some pharmacological consequences of species variation in rates of metabolism.
Federation Proceedings 26:1062-1070.
Bullich, A. A., Tung, K-K, Scheiber, G. 1990. The luminescent bacteria toxicity test: Its potential as an in vitro al-
ternative. Journal of Bioluminesence and Chemiluminescenmce 5:71-77.
Calleja, M. C., Persoone, G., Geiadi, P. (1994) Comparative acute toxicity of the first 50 multicenter evaluation of
in vitro cytotoxicity chemicals to aquatic nonvertebrates. Archives Enviornmental Contamination and Toxicology
26:69-78.
Calleja, M. C., Persoone, G., Gelandi P. 1993. The predictive potential of a batter of exotoxilogical tests for human
acute toxicity, as evaluated with the first 50 MEIC chemicals. ATLA 21:330-349.
Clemendson, C., McFarlane-Abdulla, E., Andersson, M., Barile, FA., Calleja, M.G., Chesne, C., Clotheir, R.,
Cottin, M. Curren, R., Dierickx, P., Ferro, M., Fiskejo G, Garza-Ocanas, L., Gomez-Lecon, M.J., Golden, M.,
Isomaa, B, Janus, J., Judge, P., Kahru, A., Kemp, R.B., Kerszman, G., Kristen, U. Kunimoto, M., Kaarenlapi, S.,
Lavrijsen, K., Lewan, L., Lilius, H., Malmsten, A., Ohno, T., Persoone, G., Pettersson, R., Roguet, R., Romert, L.,
Sandberg, M., Sawyer, T.W., Seibert, H., Shrivastava, R., Sjostrom, Stammati, A., Tanaka, N., Torres-Alanis, O.,
Voss, J-U. Wakuri,S., Walum, E., Wang, X., Zucco, F., Ekwall, B. (1996). MEIC evaluation of acute systemic tox-
icity. ATLA 24:273-311.
Ekwall, B, Bondesson, 1, Catell, J.V., Gomez-Lechon, M. J., Heiberg, S., Hogberg, J. Jover, R., Ponsoda, X.,
Rommert, L., Stenberg, KL., Walum, E. (1989) Cytoxocity evaluation of the first ten MEIC chemicals: Acute le-
thal toxicity in man predicted by cytotoxicity in five cellular assays and by oral LD50 tests in rodents. ATLA
17:83-100.
Ekwall, B., Johansson, A. 1980. Preliminary studies on the validity of in vitro measurements of drug toxicity using
HeLa cells I. Comparative in vitro cytotoxicity of 27 drugs. Toxicology Letters 5:299-307.
Einabarawy, M. T., Robideau, R. R., Beach, S. A. (1988) Comparison of three rapid toxicity test procedures:
MicrotoxTM, PolytoxTM and activate sludge respiration inhibition. Toxicity Assessment 3:361-370.
Fresjog, G. 1985. The allium test as a standard in environmental monitoring. Hereditas, 102:99-112.
Gaggi, C., Sbrilli G., A.M. Hasab El Naby, Bucci, M., Duccini, M., and Bacci, E. 1994. Toxicity and hazard raking
of S-triazine herbicides using Microtox, 2 green algal systems and a marine crustacean. Environmental Toxicology
and Chemistry 14:1065-1069.
15.2.2 A simple test to determine toxicity using bacteria 1111

Geiger, D. L., Brooke, L. T., Call, D. J. editors (1990) Acute toxicities of organic chemicals to fathead minnows
(Pimphates promeias). Center for Lake Superior Environmental Studies. University of Wisconsin, Superior, Wis-
consin. 900 pp.
Gupta, G., Karuppiah, M. 1996. Toxicity identification of Pocomoke River porewater. Chemosphere 33:939-960.
Halle, W., Baeger, I., Ekwall, B., Spielmann, H. 1991. Correlation between in vitro cytotoxicity and octanol/water
partition coefficient of 29 substances from the MEIC program. ATLA 19:338-343.
Hillaker, T. L. 1996. An assay for toxic chemicals using Rhizobium method as the indicator: Use of this test with
agricultural herbicides. MS Thesis, Biology. New Mexico State University.
Jaffe, R. L., 1995. Rapid assay of cytotoxicity, using Teratamitus flagellates. Toxicology and Industrial Health
11:543-553.
Jung, K., Bitton, G. 1997. Use of CeriofastTM for monitoring the toxicity of industrial effluents: Comparison with
the 48-H acute Ceriodaphnia toxicity test and MicrotoxTM. Experimental Toxicology and Chemistry 16:2264-2267.
Kahru, A., Borchardt, B. 1994. Toxicity of 39 MEIC chemicals to Bioluminescent photobacteria (The BiotoxTM
test): Correlation with other test systems. ATLA 22:147160.
Kaiser, K.L.E., Palabrica, V. S., 1991. Photobacterium phosphoreum toxicity data index. Water Pollution Re-
search Journal of Canada. 26:361-431.
Kerszman, G. 1993. Toxicity of the first ten MEIC chemicals to bacteria. ATLA 21:151155.
Kerzman, G. 1993. Of bacteria and men: Toxicity of 30 MEIC chemicals to bacteria and humans. ATLA
21:233-238.
Konemann, H, 1981, Quantitative structure-activity relationship in fish toxicity studies. Toxiocology 19:209-221.
Lilius, H., Isomaa, B., Holstrom, T. A comparison of the toxicity of 50 reference chemicals to freshly isolated rain-
bow trout hepatocytes and Daphnia magna. Aquatic Toxicology 30:47-60.
Liu, D. 1989. A rapid and simple biochemical test for direct determination of chemical toxicity. Toxicity Assess-
ment 4:389-404.
Marshall, N. J., Goodwin, C. J., Holt, S. J. 1995. A critical assessment of the use of microculture tetrazolium assays
to measure cell growth and function. Growth Regulation 5:69-84.
Mossman, T . 1983. Rapid colorimetric assay for cellular growth and survival: Application to proliferation and
cytotoxicity assays. Journal of Immunological Methods 65:55-63.
Munkittrick K. R., Power, E. A., Sergy, G. A. 1991. The relative sensitivity of MicrotoxTM, Daphnia, rainbow trout,
fathead minnow acute lethality tests. Environmental Toxicology and Water Qualtity 6:35-62.
Nirmalakhandan, N. N., Speece, R. E. 1988. Prediction of aqueous solubility of organic chemicals based on molec-
ular structure. Environmnental Science and Technology. 22:328-338.
Robertson, B. 1996. Developing a technique to lyophilize Rhizobium mefloti MS thesis, Biology, New Mexico
State University.
Rodericks, J. V.1992. Calculated Risks. Cambridge, Cabridge University Press 256 pp
Romert, L., Jansson, T. Jenssen, D. 1994. The cytotoxicity of 50 chemicals from the NEIC study determined by
growth inhibition of Ascites Sarcoma BP8 cells: A comparison with acute toxicity data in man and rodents. Toxi-
cology Letters 71:39-46.
Rouguet, R., Cotovia, J. Gaetani, Q., Dossou K. G. Rougier, A. 1993. Cytotoxicity of 28 MEIC chemicals to rat
hepatocytes using two viability endpoints: correlation with acute toxicity data in rat and man. ATLA 1:216-224.
Ruelius, H. W. 1987. Extrapolation from animals to man: predictions, pitfalls and perspectives. Xenobiotica
17:255-265.
Shrivastava, R., Deiominie, C., Chevalier, A., John, G., Ekwall, B., Walum, E. Massingham, R. Comparison of in
vitro acute lethal potency and in vitro cytotoxicity of 48 chemicals. Cell Biology and Toxicology 8:157-167.
Snell, T. W., Personne, G. 1989. Acute bioassays using rotifers. II. A freshwater test with Brachionus rubens.
Aquatic Toxicology 14:81-92.
Stephenson, G. L., Kausik, N. K., Solomon, K. R. 1991. Chronic toxicity of a pure and technical grade
pentachlorophenol to Daphnia magna. Archives Environmental Contamination and Toxicology. 21:388-394
Sun, B., Nimalakhandan, N., Hall, E., Wang, X. H., Prakash, J., Maynes, R. (1994) Estimating toxicity of organic
chemicals to activated-sludge microorganisms. Journal of Environmental Engineering 120:1459-1469.
Sun, B. (1993). Comparison of interspecies toxicity of organic chemicals and evaluation of QSAR approaches in
toxicity prediction. MS Thesis, Environmental Engineering. New Mexico State University.
Thomulka, K. W., McGee, D. J., Lange, J. H. 1993. Detection of biohazzardous materials in water by measuring
bioluminescence with the marine organism Vibrio harveyi. Journal Environmental Science and Health. A28:
2153-2166.
Toussaint, M. W., Shedd, RT. R., van der Schalie, W. H., Leather, G. R. (1992) A comparison of standard acute
toxicity tests with rapid-screening toxicity tests. Environmental Toxicology and Chemistry 14:907-915.
1112 James L. Botsford

15.2.3 DESCRIPTION OF AN INNOVATIVE GC METHOD TO ASSESS THEINFLUENCE OF CRYSTAL TEXTURE AND DRYING CONDITIONS ONRESIDUAL SOLVENT CONTENT IN PHARMACEUTICAL PRODUCTS
Christine Barthélémy
Laboratoire de Pharmacie Galénique et BiopharmacieFaculté des Sciences Pharmaceutiques et Biologiques
Université de Lille II, Lille, France
Michel Bauer
International Analytical Sciences DepartmentSanofi-Synthélabo Recherche, Toulouse, France
The presence of residual solvents (RS) in pharmaceutical substances occurs for various rea-
sons. Solvents are involved in all steps of raw material synthesis and pharmaceutical pro-
ductions. The search for the presence of RS in a pharmaceutical product and their
concentrations are now mandatory in any new monographs (as detailed in Chapter 16.2).The RS remaining in the crystals of pharmaceutical products may be the cause of
health disorders because, when a drug is taken every day, chronic toxicity may occur.The presence of RS may have other consequences, such as modifying stability,
organoleptic characters, pharmacotechnical parameters (flow properties, crystalline form,compression ability) and biopharmaceutical characteristics, that may fluctuate according toRS content (as detailed in chapters 14.21.1 and 16.2). It is therefore necessary to reduce theresidual solvents contained in crystalline particles as much as possible.
It is well known that solvents can exist in three different states within the crystals:
• Solvents adsorbed on the crystal faces: these are generally easily desorbed during
conventional drying because the binding forces between solvents and crystals are
very weak.
• Occluded solvents such as microdroplets in the crystal: these are often difficult to
extract. Generally, they can escape when the crystal is being dissociated:- during grinding, potentially leading to clodding,- during storage leading to very compact aggregates.
• Solvents bound to drug molecules in the crystal and known as “solvates”. These
bound solvents escape at a characteristic temperature, producing desolvated forms;
the solvate and the desolvated forms are two different crystalline entities that can
exhibit very different mechanical behaviors.The main objective of any chemist crystallizing pharmaceutical raw materials should
be either the total elimination of the organic solvents or the significant reduction of RS levelin order to be below the regulatory limits.1
15.2.3.1 Description of the RS determination method
There are several analytical methods to assess the RS content of drugs. Among them, the
gas chromatography (GC) is largely preferred. We refer to the chapter 16.2 for more details.
In direct injection methods, the products in which RS are included are usually dissolved in
an appropriate solvent and then directly injected into a gas chromatograph (GC). The main
problem with these techniques is that non-volatile substances are gradually retained in the
column, causing a rapid decrease in its sensitivity and efficiency; this is one of the reasons
why headspace techniques are increasingly used instead.
15.2.3 An innovative GC method 1113

To avoid these problems, we have devel-oped a method consisting initially of the com-plete dissolution of the substance in anappropriate solvent followed by micro-distil-lation and then finally of the injection of thedistillate into the GC. This technique allowsfor the complete recovery of RS without thedrawbacks mentioned above.2,3
The operating conditions are as follows:the powders to be analyzed are poured into amicro-distilling flask. An appropriate solventis chosen to allow the product as well as theRS to be completely dissolved. The solventshould not interfere with the RS extracted; forexample, in the following studied cases:
methanol for dioxane, chloroform, tetrahydrofuran, hexane and dichloromethane determi-nations and 1-butanol for ethanol determination. Assay solutions were obtained by com-pletely dissolving 500 mg of the product to be tested in 5 ml of the appropriate solvent. Themicro-distillation is carried out until complete dryness and is followed by condensation ofthe solvent vapor. The distillate is collected in a gauge glass set on ice. The assembly of thesystem is photographed on Figure 15.2.3.1.
In this way the non-volatile substances stay entrapped in the micro-distilling flask andthe totality of the RS are recovered. The distillate is then directly injected into the GC. Themethod was validated (specificity, linearity, repeatability, reproducibility...) by distilling, inthe same operating conditions, defined standard solutions of solvents. The recovery of RS isvery good as can be seen in the example reported on Table 15.2.3.1.
15.2.3.2 Application: Influence of crystal texture and drying conditions onRS content
After washing the crystals, drying is the most effective way of lowering the content of or-
ganic volatile impurities. The required drying conditions differ greatly according to the sol-
vent state in the crystalline particles, to the thermodynamic events that can occur when the
substance is heated, and also to the texture of these particles.
Table 15.2.3.1. Example of a calibration curve and recovery calculations of dioxanedistilled in methanol
Dioxane standards Dioxane recovered after distillation
area under curve and varia-
tion coefficient (%)
area under curve and
variation coefficient (%)% and ppm recovered
44.8 ppm 17161.0±705.5, v.c: 4.11 % 16819.3±631.5, v.c: 3.75 % 98.01 %, 43.9 ppm
56 ppm 25904.7±1493.1, v.c: 5.76 % 25869.0±748.4, v.c: 2.89 % 99.86 %, 55.9 ppm
112 ppm 66147.3±1010.4, v.c: 1.53 % 66831.7±472.6, v.c: 0.71 % 101.03 %, 113.2 ppm
168 ppm 108157.7±2026.6, v.c: 1.53 % 107361.0±1546.4, v.c: 1.44 % 99.26 %, 166.8 ppm
224 ppm 146674.0±1490.4, v.c: 1.02 % 146722.7±2469.7, v.c: 1.68 % 100.03 %, 224.1 ppm
linear regression Y = 724.74 X - 14855.6 Y = 724.29 X - 14889.7 mean : 99.64±1.11 % v.c :
1.1 %correlation coeff. 0.9999 0.9999
1114 Christine Barthélémy, Michel Bauer
Figure 15.2.3.1. Photograph of the micro-distilling de-
vice.

Among all parameters influencing RS content, crystal texture is of utmost importance.It is evident that a crystal exhibiting a porous texture will enable the easy escape of a solventwhile a compact and dense crystal will retain the solvent inside its structure whatever thetype of particles: monocrystalline (i.e., monoparticular) or “polycrystalline”. The term“polycrystalline” particles will be employed to designate elementary particles that can becomposed of agglomerates, spherolites or “spherical crystals” according to Kawashima.4
To illustrate the importance of the texture of particles on RS content, we can considersome examples taken from our laboratory experiments. Several crystallization processeswere investigated on pharmaceutical products with different solvents leading either to com-pact monocrystalline particles or “sintered-like” (i.e., microcrystallites fitted into each otherand partially welded involving a porous texture) or polycrystalline particles which weremore or less dense.2,3 The physical study of these particles such as, optical microscopy, par-ticle size analysis, electron scanning microscopy and thermal analysis, have been used tolink the RS contents with the drying conditions of crystals and to demonstrate that the opti-mal drying conditions differ greatly according to the texture of the particles.
As we shall see in a first example of monocrystalline particles of paracetamolrecrystallized in dioxane, a wide open texture is generally favorable to a low RS content af-ter a progressive drying at a moderate temperature to avoid the formation of a superficialcrust. In fact, in this case, the drying conditions of crystals highly influence their residualsolvent content. Optimal drying conditions seem to be the progressive and moderate ones.In contrast, too drastic drying conditions may hinder the solvent escape by a “crust” effect.This crust is due to a drying temperature which is too high, leading to a melt and a dissolu-tion of the surface of the crystals. Finally, when a desolvation occurs during the drying, itcan modify the texture of crystals and form a crust. The intensity of the phenomenon de-pends on the solvent.
To remove the solvents efficiently, it is then necessary to exceed the desolvation tem-perature of the solvates that may be produced during crystallization.
With this example we can clearly point out that the crystal texture is a determining fac-tor in the complete escape of the solvent: when the crystalline texture is sintered-like, afterthe desolvation of solvate crystals, progressive drying is necessary to prevent the “crusting”phenomenon.
The drying conditions should also be adapted to the area offered to the evaporation ofsolvent, particularly in the case of polycrystalline particles presenting a high porosity and alarge surface to be dried. This important surface is due to the disordered rearrangement ofvery small crystals inside the particles. To illustrate this, we shall see in a second examplethe cases of spherical crystals of meprobamate and ibuprofen agglomerates. In both casesthe RS can escape easily from the large surface of polycrystalline particles.
Lastly, we shall see in a third example, that we must not forget that thermodynamicphenomenon can occur under drying. This is a very particular example because the pharma-ceutical product used (paracetamol) presents a polymorphic transition that can occur duringthe drying phase and lead to a new organization inside the crystal, allowing the escape of theRS. This can be very interesting in the case of products with a low transition temperature.The usual polymorphic form of commercialized paracetamol is the monoclinic form; but inparticular cases small amount of metastable orthorhombic form can be obtained. In the caseof paracetamol, at the transition temperature (156°C) we observe a brutal solvent escapethat could be due to the solid-solid transition undergone by the orthorhombic form into themonoclinic one. The disorder produced and the increase of the specific volume occurringduring this first order transition allow the occluded solvents to escape more easily.
15.2.3 An innovative GC method 1115

15.2.3.2.1 First example: monocrystalline particles of paracetamol
Preparation of monocrystalline particles
In this first example, paracetamol was recrystallized separately in three different types of
solvents (ethanol, water and dioxane) with different boiling points, molecular weights, di-
electric constants and paracetamol solubilising power. After the crystallization process,5
crystals were separated by filtration under vacuum and washed with the same crystallization
solvent. Each batch was divided into four fractions to be dried differently.Particle drying conditions
The paracetamol crystals were submitted to four different drying conditions2 (Table
15.2.3.2):Drastic: under vacuum at 100°C for 3 hours.Drastic: in a ventilated oven at 100°C for 3 hours.Progressive: in a ventilated oven at 60°C for 1 hour, at 80°C for 1 hour and finally at
100°C for 1 hour.Very moderate: under ventilated hood at 20°C for 24 hours and then in a ventilated
oven at 35°C for 48 hours.Morphological aspect of the particles
Dried crystals were observed by optical and scanning electron microscopy (SEM) in order
to measure their Ferret mean diameter and to determine their habit and texture. The mean di-
ameters of crystals obtained from different solvents and submitted to different drying condi-
tions are reported in Table 15.2.3.3.
Table 15.2.3.2. Drying conditions studied on the different particles
Type of particles Drugs Type of drying Temperature Time
monocrystalline paracetamol
drastic under vacuum 100°C 3 h
drastic under ventilation 100°C 3 h
progressive60°C
+ 80°C+ 100°C
1 h+ 1 h+ 1 h
very moderate20°C
+ 35°C24 h
+ 48 h
polycrystalline
meprobamate
drastic 90°C 2 h
progressive60°C
+ 75°C+ 90°C
30 min+ 30min
+ 1 h
ibuprofenmoderate 60°C 2 h
very moderate 40°C 2 h
paracetamol
drastic flash 156°C 10 min
drastic flash 156°C 30 min
drastic 100°C 2 h
drastic + flash100°C
+ 156°C2 h
+ 10 min
progressive60°C
+ 80°C+ 100°C
30 min+ 30 min
+ 1 h
progressive + flash
60°C+ 80°C+ 100°C+ 156°C
30 min+ 30 min
+ 1 h+ 10 min
1116 Christine Barthélémy, Michel Bauer

The optical microscopy investigationshows some significant differences in meandiameter and crystal habit due to crystalliza-tion conditions.
In the case of water and ethanol, thecrystals are transparent and rather regular,their habit is generally parallelepipedal. Theonly difference to be noted is the mean diam-eter of these particles; the particlesrecrystallized in water being 3 times larger.ESM reveals a surface that remains smoothin all drying conditions; their texture seemscompact and dense.
In contrast, crystals obtained fromdioxane are rather different to those obtainedfrom ethanol and water: they are opaque totransmitted light and their habit is irregular.Their mean diameter is slightly smaller thancrystals from ethanol.
It is to be noted that all the crystals ob-tained from the three solvents present the
same polymorphic form: the monoclinic form.
Table 15.2.3.3: Mean Ferret diameters of particles (Data from references2,3)
Monocrystallineparticles
Mean diameter,µm
Polycrystallineparticles
Mean diameter,µm
paracetamol / dioxane 122 meprobamate spherical crystals 145
paracetamol / ethanol 149 ibuprofen agglomerates 350
paracetamol / water 538 paracetamol spherolites 113
15.2.3 An innovative GC method 1117
Figure 15.2.3.2. SEM photograph of paracetamol
recrystallized in dioxane and submitted to moderate
drying (Photograph from reference2).
Figure 15.2.3.3. SEM photograph of paracetamol
recrystallized in dioxane and submitted to progressive
drying (Photograph from reference2).
Figure 15.2.3.4. SEM photograph of paracetamol
recrystallized in dioxane and submitted to drastic drying
(Photograph from reference2).

Scanning electron microscopy (SEM) carried out on these crystals reveals differentbehaviors according to the drying conditions tested. The crystals obtained from dioxane aresimilar to blocks of sintered particles since they consist of microcrystallites bound to eachother, as if partially welded.5 In fact, the measurement of mercury porosity indicated a veryhigh porosity. This sintered aspect concords with the non-transmission of light through thewhole crystal.
In fact, paracetamol forms a solvate with dioxane.5 Its departure does not modify thecrystal habit but the surface can be seen as perforated.
When the drying is very moderate, the crystal surface is perforated by numerous holesthrough which solvent escapes; these anfractuosities give the impression of a poroussintered-like texture (Figure 15.2.3.2). With progressive drying, the number of holes de-creases (Figure 15.2.3.3). On the contrary, when the drying is drastic, the surface is rela-tively smooth (Figure 15.2.3.4). This can be explained by the too drastic drying conditionsinvolving the formation of a crust at the surface of the crystal preventing the escape of thesolvent from the crystal.
Residual solvent determination
Gas Phase Chromatography (for dioxane and ethanol) was performed on a Varian 1440
Chromatograph with a Flame Ionization Detector; packed column Porapack Super Q
(Alltech, France), mesh range 80/100, length 1.8 m; internal diameter 2.16 mm; carrier gas
was nitrogen (40 ml/min); injector: 210°C; detector: 250°C.For dioxane: column temperature: isotherm at 170°C. Injection: 10µl. Retention
Times (RT): methanol 1.5 min; dioxane 16 min.For ethanol: column temperature: isotherm at 210°C. Injection: 5µl. RT: ethanol 1.5
min; 1-butanol 4 min.Determination of residual water on paracetamol crystallized in water: according to the
titrimetric direct method of Karl Fischer.The residual solvent concentrations of the crystals obtained are reported in Table
15.2.3.4.
Table 15.2.3.4. Residual solvent content of crystals obtained from different solventsand submitted to different drying conditions (Data from reference2)
Drastic Drastic under vacuum Progressive Moderate
Dioxane 126 ppm 183 ppm 25 ppm 53 ppm
Ethanol 2045 ppm 2501 ppm 1495 ppm 2072 ppm
Water 0.59 % 0.68 % 0.51 % 0.56 %
Whatever the drying conditions may be, the content of dioxane is always lower thanthe 380 ppm ICH limit1,6 (Table 15.2.3.5). Progressive drying always gives lower level re-sidual solvent. In fact, drastic drying, in a ventilated oven and under vacuum, leads to theformation of a superficial “crust” which hinders the solvent escape; this can be clearly visu-alized on the scanning electron photomicrograph (Figure 15.2.3.4); and can explain the rel-atively high content of residual solvents.
1118 Christine Barthélémy, Michel Bauer
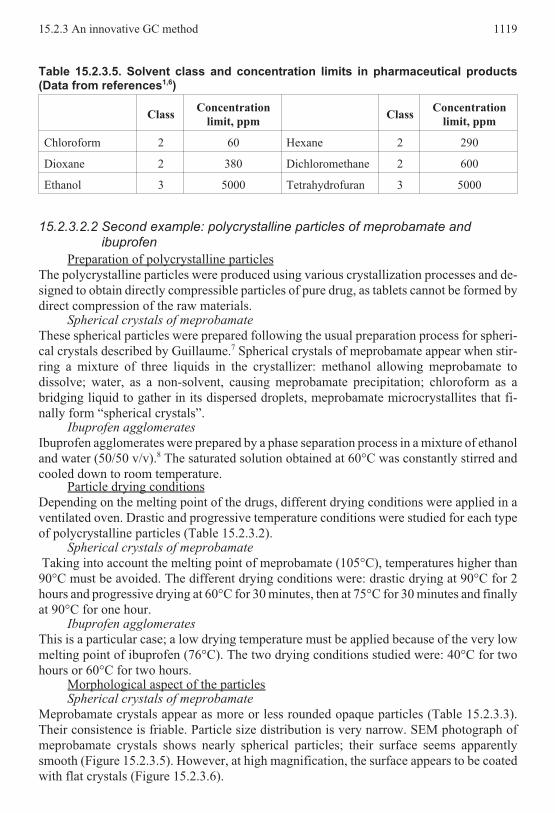
Table 15.2.3.5. Solvent class and concentration limits in pharmaceutical products(Data from references1,6)
ClassConcentration
limit, ppmClass
Concentration
limit, ppm
Chloroform 2 60 Hexane 2 290
Dioxane 2 380 Dichloromethane 2 600
Ethanol 3 5000 Tetrahydrofuran 3 5000
15.2.3.2.2 Second example: polycrystalline particles of meprobamate andibuprofen
Preparation of polycrystalline particles
The polycrystalline particles were produced using various crystallization processes and de-
signed to obtain directly compressible particles of pure drug, as tablets cannot be formed by
direct compression of the raw materials.Spherical crystals of meprobamate
These spherical particles were prepared following the usual preparation process for spheri-
cal crystals described by Guillaume.7 Spherical crystals of meprobamate appear when stir-
ring a mixture of three liquids in the crystallizer: methanol allowing meprobamate to
dissolve; water, as a non-solvent, causing meprobamate precipitation; chloroform as a
bridging liquid to gather in its dispersed droplets, meprobamate microcrystallites that fi-
nally form “spherical crystals”.Ibuprofen agglomerates
Ibuprofen agglomerates were prepared by a phase separation process in a mixture of ethanol
and water (50/50 v/v).8 The saturated solution obtained at 60°C was constantly stirred and
cooled down to room temperature.Particle drying conditions
Depending on the melting point of the drugs, different drying conditions were applied in a
ventilated oven. Drastic and progressive temperature conditions were studied for each type
of polycrystalline particles (Table 15.2.3.2).Spherical crystals of meprobamate
Taking into account the melting point of meprobamate (105°C), temperatures higher than
90°C must be avoided. The different drying conditions were: drastic drying at 90°C for 2
hours and progressive drying at 60°C for 30 minutes, then at 75°C for 30 minutes and finally
at 90°C for one hour.Ibuprofen agglomerates
This is a particular case; a low drying temperature must be applied because of the very low
melting point of ibuprofen (76°C). The two drying conditions studied were: 40°C for two
hours or 60°C for two hours.Morphological aspect of the particlesSpherical crystals of meprobamate
Meprobamate crystals appear as more or less rounded opaque particles (Table 15.2.3.3).
Their consistence is friable. Particle size distribution is very narrow. SEM photograph of
meprobamate crystals shows nearly spherical particles; their surface seems apparently
smooth (Figure 15.2.3.5). However, at high magnification, the surface appears to be coated
with flat crystals (Figure 15.2.3.6).
15.2.3 An innovative GC method 1119

The cross-section surface shows a dense tangling-up of flat crystals inside the particle(Figure 15.2.3.7). Flat crystals are concentrically disposed at the periphery of the roundedparticles, like a shell. The inside of the particle is a disordered arrangement of small flatcrystals. Thus, the surface offered to evaporation is very important and this should lead tothe easy escape of RS.
Ibuprofen agglomerates
Ibuprofen particles are large agglomerates of flat crystals with quite soft consistence and a
nearly rounded shape (Table 15.2.3.3).
1120 Christine Barthélémy, Michel Bauer
Figure 15.2.3.5. SEM photograph of “spherical crys-
tals” of meprobamate (Photograph from reference3).
Figure 15.2.3.6. SEM photograph of the surface (high
magnification) of “spherical crystals” of meprobamate
(Photograph from reference3).
Figure 15.2.3.7. SEM photograph of the cross-sec-
tion of “spherical crystals” of meprobamate (Photo-
graph from reference3).
Figure 15.2.3.8. SEM photograph of ibuprofen agglom-
erates (Photograph from reference3).

Ibuprofen crystals observed under SEM are in total disorder (Figure 15.2.3.8). Thisdisordered arrangement of microcrystallites inside the polycrystalline particles gives them ahigh isotropy of particles arrangement that should improve their compression capacity.
Residual solvent determinationFor organic solvents, gas phase chromatography was performed on a Shimadzu
GC-14B chromatograph fitted with a Flame Ionization Detector and a CR-6A Shimadzu in-tegrator.
The packed column was Porapack super Q (Alltech, France), mesh range 80/100,length 1.80 m, internal diameter 2.16 mm. Carrier gas: anhydrous nitrogen. Injector temper-ature: 200°C. Detector temperature: 220°C. The chromatographic conditions were:
• For chloroform in meprobamate crystals: isotherm at 150°C, injection: 5 µl,
RT: methanol 0.8 min, chloroform 6.7 min.
• For ethanol in ibuprofen crystals: isotherm at 170°C, injection: 5 µl, RT:
ethanol 1.1 min, 1-butanol 5.3 min.Determination of residual water was carried out using Karl Fischer’s titrimetric direct
method after calibration with natrium tartrate and dissolution of ibuprofen or meprobamatecrystals in methanol.
The residual solvent concentrations of the polycrystalline particles are reported in Ta-bles 15.2.3.6 and 15.2.3.7.
Table 15.2.3.6. Residual solvent concentration of meprobamate spherical crystalssubmitted to different drying conditions (Data from reference3)
Chloroform Water
Progressive drying* 345±22 ppm 0.71%±0.07%
Drastic drying** 321±8 ppm 0.21%±0.01%
*30 min at 60°C + 30 min at 75°C + 1 hour at 90°C; **2 hours at 90°C
Table 15.2.3.7. Residual solvent concentration of ibuprofen agglomerates submittedto different drying conditions (Data from reference3)
Ethanol Water
2 hours at 40°C 42±3 ppm 0.76%±0.12%
2 hours at 60°C 21±4 ppm 0.44%±0.06%
As far as meprobamate spherical crystals are concerned, no significant differences areto be observed between drastic and progressive drying. No crusting phenomenon appearson meprobamate spherical crystals due to the loose tangling up of crystals, and so the sol-vent may escape easily between them.
The residual ethanol content of ibuprofen agglomerates is very low because of theopen texture of agglomerates. Moreover, the crystallization phenomenon was relativelyslow, enabling the solvent to escape from crystals in formation. The higher the temperature,the lower the residual ethanol content.
Both these crystals have a very porous texture. It seems that progressive drying is notessential as far as the polycrystalline particles are concerned.
If we consider the official limits1,6 reported on Table 15.2.3.5 for residual solvent con-tents, we can note that the concentration of chloroform in meprobamate spherical crystals ismuch higher than the limit allowed in any drying conditions. Due to its inherent toxicity,this solvent should be avoided in the recrystallization process of meprobamate. The solvent
15.2.3 An innovative GC method 1121

content obtained for ethanol in ibuprofen agglomerates is very low, in all drying conditions;in all cases it is considerably lower than the tolerated limits.
15.2.3.2.3 Third example: polycrystalline particles of paracetamol
Preparation of polycrystalline particles
Paracetamol agglomerates were prepared by the spontaneous precipitation of paracetamol
into a mixture containing hexane, tetrahydrofuran and dichloromethane9 under stirring. All
the crystals obtained were filtered under vacuum.Particle drying conditions
The melting point of paracetamol being 169°C and the transition temperature being 156°C,
different drying conditions were tested (Table 15.2.3.2):
• Drastic flash drying: 156°C for either 10 or 30 minutes,
• Drastic drying: 100°C for 2 hours,
• Progressive drying: 60°C for 30 minutes, then 80°C for 30 minutes, and finally,
100°C for 1 hour.After drastic drying at 100°C and progressive drying, a test with complementary dry-
ing at 156°C was carried out for 10 minutes.All the recovered crystals were packaged in glass flasks before gas phase chromatog-
raphy and other analysis.Morphological aspect of particles
Several types of texture and morphology are
to be observed in polycrystalline particles,
according to solvent proportions. The most
interesting and particular example are
spherical polycrystalline particles which
have a radial texture (spherolites) and ap-
pear as urchin-like particles (Table
15.2.3.3). SEM reveals the very typical sur-
face crystallization of the agglomerates
(Figure 15.2.3.9). They are made up of
parallelepipedal flat crystals arranged per-
pendicularly to a central nucleus and they
are relatively strong.The implantation of peripherical crys-
tallites is perpendicular to the surface. As ithas been clearly demonstrated by Ettabia10 anucleus is formed first and then, in a secondstep, microcrystallites grow on it.
Residual solvent determination
For organic solvents, gas phase chromatog-
raphy was performed on a Shimadzu GC-14B chromatograph fitted with a Flame Ionization
Detector and a CR-6A Shimadzu integrator.The packed column was Porapack super Q (Alltech, France), mesh range 80/100,
length 1.80 m, internal diameter 2.16 mm. Carrier gas: anhydrous nitrogen. Injector temper-ature: 200°C. Detector temperature: 220°C. The chromatographic conditions were: Fordichloromethane, tetrahydrofuran and hexane in paracetamol crystals: isotherm at 150°C,injection: 5 µl, RT: methanol 0.8 min, dichloromethane 3 min, tetrahydrofuran 7.8 min,hexane 11.8 min.
1122 Christine Barthélémy, Michel Bauer
Figure 15.2.3.9. SEM photograph of paracetamol ag-
glomerates (Photograph from reference3).

The residual solvent concentrations ofthe polycrystalline particles are reported inTable 15.2.3.8.
The wide-open texture of paracetamolspherolites hinders the crusting phenome-non; it is therefore normal that there shouldbe no difference between the effectiveness ofthe two types of drying: progressive anddrastic (at 100°C for two hours). However, asurprisingly good result is observed when thedrying temperature is 156°C whereas a pro-longed time at 100°C does not improve thesolvent escape in spite of the low boilingpoints of solvents, all much lower than100°C (dichloromethane: 39.5°C;tetrahydrofuran: 66°C; hexane: 69°C). Usinga DSC method, it can be observed that aslight non constant exotherm at 85°C fol-
lowed by a small constant endotherm at nearly 156°C occurs before the melting endothermat 169°C (Figure 15.2.3.10). In fact, the paracetamol obtained by the crystallization processdescribed is mainly the usual monoclinic form. However, as has been demonstrated byEttabia10 the formation of a certain amount of the amorphous form, causes the slightexotherm. The amorphous form recrystallized at 85°C into the orthorhombic metastableform, which transits into monoclinic form at 156°C, causing the small endotherm observedat nearly 156°C.
The thermogravimetric analysis shows that no solvation occurs during crystallization.Furthermore, the sudden solvent escape is not specific to one definite solvent, whereas allthe contained solvent amounts dramatically decrease at 156°C. The loss of mass is high(about 0.7%) when the substance is about to melt (Figure 15.2.3.10).
Table 15.2.3.8. Residual solvent concentration of paracetamol agglomeratessubmitted to different drying conditions (Data from reference3)
Dichloromethane Tetrahydrofuran Hexane
"Flash drying" 156°Cfor 10 minfor 30 min
< 200 ppm< 200 ppm
1095±5 ppm630±24 ppm
167±1 ppm88±4 ppm
PD*PD*+ “flash” (10 min at 156°C)
315±3 ppm< 200 ppm
2066±1 ppm883±10 ppm
305±3 ppm145±5 ppm
DD **DD**+"flash" (10 min at 156°C)
309±3 ppm< 200 ppm
2014±30 ppm873±2 ppm
313±4 ppm140±1 ppm
*PD: Progressive drying (30 min at 60°C + 30 min at 80°C + 1 h at 100°C), **DD: Drastic drying (2 h at 100°C)
Paracetamol, containing three different solvents, exhibits low dichloromethane con-tent (200 to 320 ppm). The referencing limits remain higher than the experimental resultswhen these particles are submitted to different drying conditions (Table 15.2.3.5). The sameobservation is valid for tetrahydrofuran for which the allowed upper limit is 5000 ppm. Butthe residue in hexane is sometimes above the regulatory threshold. The only way to be defi-nitely below this limit is to heat paracetamol to 156°C; this confirms the advantage of flashdrying this substance. As previously described, this temperature is critical for paracetamolrecrystallization in the solvents used.
15.2.3 An innovative GC method 1123
Figure 15.2.3.10. DSC and thermogravimetry curves of
paracetamol agglomerates.

This study enables us to underline some considerations about the drying conditions ofcrystals. It is important to note that not only should the usual parameters be taken into ac-count, such as the melting point of the substances and the boiling point of the solvents, butalso the texture of the particles and the thermodynamic events that can occur when the sub-stance is heated.
The kinetic of temperature increase must be chosen with respect to crystalline particletexture to obtain optimal drying conditions for lowest RS content. Progressive drying cangive better solvent elimination when the texture is very finely sintered to avoid the crustingeffect, which hinders any ulterior solvent escape.2
When a solvate is formed, the drying temperature must be either equal to or higherthan the desolvation temperature.
Lastly, the knowledge of the existence of solid-solid transitions could be in this re-spect of great interest. Thermogravimetry and DSC analysis are, among others, very effi-cient tools to assess these phenomena.
References1 European Pharmacopoeia, 3rd edition, addendum 1999, pp. 216-224.2 C. Barthélémy, P. Di Martino, A-M. Guyot-Hermann, Die Pharmazie, 50, 609 (1995).3 A. Ettabia, C. Barthélémy, M. Jbilou, A-M. Guyot-Hermann, Die Pharmazie, 53, 565 (1998).4 Y. Kawashima, M. Okumura, H. Takenaka, Science, 216, 1127 (1982).5 J-M. Fachaux, A-M. Guyot-Hermann, J-C. Guyot, P. Conflant, M. Drache, S. Veesler, R. Boistelle,
Powder Techn., 82, 2, 123 (1995).6 Note for Guidance on impurities: Residual solvents, Drugs made in Germany, 41, 98 (1998).7 F. Guillaume, A-M. Guyot-Hermann, Il farmaco, 48, 473 (1993).8 M. Jbilou, A. Ettabia, A-M. Guyot-Hermann, J-C. Guyot , Drug Dev. & Ind. Pharm., 25, 3, 297 (1999).9 A. Ettabia, E. Joiris, A-M. Guyot-Hermann, J-C. Guyot, Pharm. Ind., 59, 625 (1997).10 A. Ettabia, European Thesis, Lille II University, France (8/10/1997).
1124 Christine Barthélémy, Michel Bauer
Copyright © 2022 FDOKUMEN