Solvent effects in the hydrogenation of 2-butanone
12
Solvent effects in the hydrogenation of 2-butanone B.S. Akpa a , C. D’Agostino a , L.F. Gladden a , K. Hindle b , H. Manyar b , J. McGregor a , R. Li a , M. Neurock c , N. Sinha c , E.H. Stitt d , D. Weber a , J.A. Zeitler a , D.W. Rooney b,⇑ a Department of Chemical Engineering and Biotechnology, University of Cambridge, New Museums Site, Pembroke Street, Cambridge, CB2 3RA, UK b CenTACat, School of Chemistry and Chemical Engineering, Queen’s University Belfast, David Keir Building, Stranmillis Road, Belfast BT9 5AG, UK c Departments of Chemical Engineering, University of Virginia, 102 Engineers’ Way, PO Box 400741, Charlottesville, VA 22904-4741, USA d Johnson Matthey Catalysts, PO Box 1, Belasis Avenue, Billingham, TS23 1LB, UK article info Article history: Received 16 August 2011 Revised 18 January 2012 Accepted 19 January 2012 Available online 27 March 2012 Keywords: Solvent effects Mixed solvents Mass transfer Heterogeneous catalysis Hydrogenation 2-Butanone Ru DFT abstract In liquid-phase reaction systems, the role of the solvent is often limited to the simple requirement of dis- solving and/or diluting substrates. However, the correct choice, either pure or mixed, can significantly influence both reaction rate and selectivity. For multi-phase heterogeneously catalysed reactions observed variations may be due to changes in mass transfer rates, reaction mechanism, reaction kinetics, adsorption properties and combinations thereof. The liquid-phase hydrogenation of 2-butanone to 2- butanol over a Ru/SiO 2 catalyst, for example, shows such complex rate behaviour when varying water/ isopropyl alcohol (IPA) solvent ratios. In this paper, we outline a strategy which combines measured rate data with physical property measurements and molecular simulation in order to gain a more fundamen- tal understanding of mixed solvent effects for this heterogeneously catalysed reaction. By combining these techniques, the observed complex behaviour of rate against water fraction is shown to be a com- bination of both mass transfer and chemical effects. Ó 2012 Elsevier Inc. All rights reserved. 1. Introduction The ability of a solvent to influence either the rate or selectivity of a reaction has been known within organic chemistry for 150 years [1]. Over that time there have been a number of attempts to understand the role of the solvent with methods including multiple linear regression analysis, factor analysis and principal component analysis all being used in an attempt to develop some level of understanding and predictability of these effects. Such analysis tends to rely on various free energy relationships, and de- spite the complicated nature of solvents and solutions, they have shown that they can provide some insight into many chemical processes [1]. Like the organic reactions above, many heterogeneously cata- lysed processes are carried out in a solvent for the simple purpose of dissolving the reactants and keeping the products in solution. Here too, solvents are known to influence both rate and selectivity although in such systems the multi-phase nature of the reactions increases their complexity. Therefore, in addition to factors such as solvent polarity, dielectric constant and acid/base properties of the reaction medium, factors such as the solvation of reactants and products, gas solubility and other mass transfer effects need to be considered as these can all significantly influence reaction rates and product selectivities [2]. Other important criteria for con- sideration include the potential for improved heat transfer and the influence on deactivation such as reduced carbon laydown on the catalyst surface [3]. Toukonitty et al. for example investigated solvent effects for the enantioselective hydrogenation of 1-phenyl-1,2-propanedione with a cinchonidine modified Pt/Al 2 O 3 catalyst [4]. When using a range of different solvents, including binary solvent mixtures, it was observed that while no correlation between the solvent dielec- tric constant and hydrogenation rate could be found the enantio- meric excesses decreased non-linearly with an increasing solvent dielectric constant. This dependence was partly attributed to the open (3) cinchonidine conformer, although it was primarily taken into account by applying transition state theory and the Kirkwood treatment with the result that a model was able to predict the behaviour of the system as a function of the solvent dielectric con- stant. Contrasting with this work, Mukherjee and Vannice later re- ported on solvent effects during the liquid-phase hydrogenation of citral using Pt/SiO 2 and eight nonreactive solvents [5]. Here it was observed that the rates were affected by the choice of solvent; however, differences in the product distribution were not signifi- cant. In this case, it was found that the variation in specific activity 0021-9517/$ - see front matter Ó 2012 Elsevier Inc. All rights reserved. http://dx.doi.org/10.1016/j.jcat.2012.01.011 ⇑ Corresponding author. E-mail address: [email protected] (D.W. Rooney). Journal of Catalysis 289 (2012) 30–41 Contents lists available at SciVerse ScienceDirect Journal of Catalysis journal homepage: www.elsevier.com/locate/jcat
Transcript of Solvent effects in the hydrogenation of 2-butanone

Journal of Catalysis 289 (2012) 30–41
Contents lists available at SciVerse ScienceDirect
Journal of Catalysis
journal homepage: www.elsevier .com/locate / jcat
Solvent effects in the hydrogenation of 2-butanone
B.S. Akpa a, C. D’Agostino a, L.F. Gladden a, K. Hindle b, H. Manyar b, J. McGregor a, R. Li a, M. Neurock c,N. Sinha c, E.H. Stitt d, D. Weber a, J.A. Zeitler a, D.W. Rooney b,⇑a Department of Chemical Engineering and Biotechnology, University of Cambridge, New Museums Site, Pembroke Street, Cambridge, CB2 3RA, UKb CenTACat, School of Chemistry and Chemical Engineering, Queen’s University Belfast, David Keir Building, Stranmillis Road, Belfast BT9 5AG, UKc Departments of Chemical Engineering, University of Virginia, 102 Engineers’ Way, PO Box 400741, Charlottesville, VA 22904-4741, USAd Johnson Matthey Catalysts, PO Box 1, Belasis Avenue, Billingham, TS23 1LB, UK
a r t i c l e i n f o
Article history:Received 16 August 2011Revised 18 January 2012Accepted 19 January 2012Available online 27 March 2012
Keywords:Solvent effectsMixed solventsMass transferHeterogeneous catalysisHydrogenation2-ButanoneRuDFT
0021-9517/$ - see front matter � 2012 Elsevier Inc. Ahttp://dx.doi.org/10.1016/j.jcat.2012.01.011
⇑ Corresponding author.E-mail address: [email protected] (D.W. Rooney
a b s t r a c t
In liquid-phase reaction systems, the role of the solvent is often limited to the simple requirement of dis-solving and/or diluting substrates. However, the correct choice, either pure or mixed, can significantlyinfluence both reaction rate and selectivity. For multi-phase heterogeneously catalysed reactionsobserved variations may be due to changes in mass transfer rates, reaction mechanism, reaction kinetics,adsorption properties and combinations thereof. The liquid-phase hydrogenation of 2-butanone to 2-butanol over a Ru/SiO2 catalyst, for example, shows such complex rate behaviour when varying water/isopropyl alcohol (IPA) solvent ratios. In this paper, we outline a strategy which combines measured ratedata with physical property measurements and molecular simulation in order to gain a more fundamen-tal understanding of mixed solvent effects for this heterogeneously catalysed reaction. By combiningthese techniques, the observed complex behaviour of rate against water fraction is shown to be a com-bination of both mass transfer and chemical effects.
� 2012 Elsevier Inc. All rights reserved.
1. Introduction
The ability of a solvent to influence either the rate or selectivityof a reaction has been known within organic chemistry for150 years [1]. Over that time there have been a number of attemptsto understand the role of the solvent with methods includingmultiple linear regression analysis, factor analysis and principalcomponent analysis all being used in an attempt to develop somelevel of understanding and predictability of these effects. Suchanalysis tends to rely on various free energy relationships, and de-spite the complicated nature of solvents and solutions, they haveshown that they can provide some insight into many chemicalprocesses [1].
Like the organic reactions above, many heterogeneously cata-lysed processes are carried out in a solvent for the simple purposeof dissolving the reactants and keeping the products in solution.Here too, solvents are known to influence both rate and selectivityalthough in such systems the multi-phase nature of the reactionsincreases their complexity. Therefore, in addition to factors suchas solvent polarity, dielectric constant and acid/base properties ofthe reaction medium, factors such as the solvation of reactants
ll rights reserved.
).
and products, gas solubility and other mass transfer effects needto be considered as these can all significantly influence reactionrates and product selectivities [2]. Other important criteria for con-sideration include the potential for improved heat transfer and theinfluence on deactivation such as reduced carbon laydown on thecatalyst surface [3].
Toukonitty et al. for example investigated solvent effects for theenantioselective hydrogenation of 1-phenyl-1,2-propanedionewith a cinchonidine modified Pt/Al2O3 catalyst [4]. When using arange of different solvents, including binary solvent mixtures, itwas observed that while no correlation between the solvent dielec-tric constant and hydrogenation rate could be found the enantio-meric excesses decreased non-linearly with an increasing solventdielectric constant. This dependence was partly attributed to theopen (3) cinchonidine conformer, although it was primarily takeninto account by applying transition state theory and the Kirkwoodtreatment with the result that a model was able to predict thebehaviour of the system as a function of the solvent dielectric con-stant. Contrasting with this work, Mukherjee and Vannice later re-ported on solvent effects during the liquid-phase hydrogenation ofcitral using Pt/SiO2 and eight nonreactive solvents [5]. Here it wasobserved that the rates were affected by the choice of solvent;however, differences in the product distribution were not signifi-cant. In this case, it was found that the variation in specific activity

B.S. Akpa et al. / Journal of Catalysis 289 (2012) 30–41 31
did not correlate with either the solvent dielectric constant or thedipole moment. Similarly, Gómez-Quero et al. studied solvent ef-fects during the liquid-phase hydrodehalogenation of haloarenesin methanol, THF, water/methanol and water/THF mixtures usinga Pd/Al2O3 catalyst [6]. Within this work they noted that higher ini-tial rates were observed with increasing water content in the sol-vent mixture and attributed this to an increase in the dielectricconstant of the medium. Such observations were consistent withan electrophilic mechanism in which the solvent helped to stabilisethe arenium intermediate. An overall dependence of rate on sol-vent for this reaction could then be established with approximately80% of the contribution being due to the dielectric constant withmolar volume being a secondary factor. Mixed alcohol/water sol-vents, the subject of this work, have also been investigated previ-ously. For example, a minimum in the rate of 2-butene-1,4-diolhydrogenation (the second step in the hydrogenation of 2-butyne-1,4-diol over Pd/Al2O3) occurred at 80–90 molH2O% in a2-propanol/water solvent [7]. Elsewhere, an enhancement in therate of reaction in mixed alcohol/water solvents as compared tothe pure alcohol has been observed in 2-butanone hydrogenationover Pd catalysts [8]; acetophenone hydrogenation over Raney-Ni[9]; and o-nitrotoluene hydrogenation over Pd/C [10]. In the latterexample, an increase of almost 50% in the reaction rate was re-ported upon changing solvent from pure methanol to a mixedmethanol/water solvent containing 18% water.
As mentioned above, other factors are also important, for exam-ple, polar solvents are known to enhance the adsorption of non-polar reactants and non-polar solvents the adsorption of polarreactants [11]. More recently, Vanoye et al. observed an interestinginflection in the initial rates obtained using a mixed ethanol/hep-tane solvent system for the liquid-phase dehydration of ethanolto diethylether over heterogeneous sulphonic-acid catalysts [12].In this case, the authors concluded that the observed inflection innon-polar solvents could be explained by the formation of a newliquid phase around the acid site indicating that local structure isalso important. It is quite clear from the above discussion thatthe role of the solvent is less well defined than in normal organicreactions with increases in rate being observed in some systems,and selectivity in others.
In briefly reviewing selective hydrogenation reactions overruthenium catalysts which relate to the work discussed herein, itis further noted that carbonyl hydrogenations are particularly ac-tive in the presence of water [13]. Conversely, in the hydrogenationof benzene over Ru/C, water was found to have an adverse effect onthe reaction rate [14]. Similar effects of water have also been ob-served by Vaidya and Mahajani in the hydrogenation of n-valeral-dehyde to n-amyl alcohol over Ru/Al2O3; however, no explanationwas given for its influence [15]. A possible reason for enhancedactivity in water may be due to its ability to dissociate over differ-ent metal surfaces. The dissociation of water over Ru is well knownin vapour phase studies as well as in aqueous solutions; this leadsto the formation of surface hydroxyl intermediates and protonswhich can subsequently influence the reaction [16,17].
While such effects are known, to our knowledge there are nostudies which extensively examine the role of water in a mixed sol-vent system covering its effect on mass transfer, diffusion and reac-tion kinetics. Therefore, a detailed study of the influence of waterover diffusion, adsorption, desorption and elementary reactionsteps is necessary to improve our current understanding of the roleplayed by the solvent in altering reaction activity and selectivity. Inthis paper, we attempt to investigate such effects and have probedthe role of water on the hydrogenation of 2-butanone (methylethyl ketone (MEK)) to 2-butanol using a combination of experi-ments and density functional theory. These results indicate thatthe rate of hydrogenation of MEK is strongly correlated to thesolvent composition and that water plays an important role in
altering energetics and kinetics of the elementary steps involvedin the overall hydrogenation.
2. Materials and methods
Catalysts comprised of 1% and 5% Ru/SiO2 and were prepared byincipient wetness using an aqueous ruthenium (III) chloride trihy-drate salt (density 2250 ± 100 kg m�3). They were dried at 393 K inair and subsequently reduced in 5% H2/95% He at 673 K for 3 h. Ki-netic experiments were carried out in a 380 ml Premex stainlesssteel reactor, equipped with a gas inducing impeller with onlinehydrogen consumption monitoring. The solvents used were ultra-pure water (distilled, deionised >18 MX) and/or 2-propanol (ReidelDe Haan >99.5%). Typically, 240 ml of solvent was charged to thereactor with the required mass of catalyst (0.1 g unless otherwisestated). After purging with N2, the solvent was heated to the de-sired temperature before injection of 7.5 ml 2-butanone (Aldrich99 + %) and 2.5 ml solvent (2-butanone concentration of0.33 mol l�1). After purging with H2, the reactor was pressurisedand monitored by hydrogen consumption or by sampling using aGC equipped with a DB-1 capillary column and FID detector. Allgases were BOC research grade. Mass balances performed on reac-tions were >95% in all cases.
Pulsed field gradient (PFG) NMR measurements of diffusioncoefficients were conducted using a Diff30 diffusion probe with a10 mm r.f. coil on a Bruker DMX 300 spectrometer, operating at a1H resonance frequency of 300.13 MHz. Samples were preparedusing 5 mm NMR tubes filled to a height of approximately20 mm. The PGSTE pulse sequence was employed with the diffu-sion encoding time D and gradient pulse duration d fixed at100 ms and 2 ms, respectively, with a maximum gradient strength,g, of up to 1 T/m [18]. All measurements were carried out at303.15 K.
THz Time-Domain Spectroscopy (THz-TDS) studies were carriedout using coherent pulses of broadband terahertz radiation(0.1–4 THz) generated by photoexcitation of a DC biased semi-insulating GaAs substrate by 12 fs pulses of a NIR laser (Femtola-sers, Femtosource cM1, Vienna, Austria, centre wavelength800 nm). In order to suppress the absorption of water vapour inthe air, the sealed sample chamber was purged by nitrogen gasto ensure a relative humidity below 2% for all measurements.Liquid samples were measured in a standard cell (PIKE Technolo-gies, Watertown, USA) comprising 3 mm z-cut quartz windowsand a 200 lm PTFE spacer. For each sample, 200 time-domainwaveforms were collected and averaged.
Periodic gradient-corrected density functional theoretical (DFT)[19] calculations as implemented in the Vienna ab initio SimulationPackage (VASP) [20] were used to follow the reaction energies andactivation barriers for different pathways involved in the hydroge-nation of MEK over a model Ru(0001) surface and to simulate theeffects of the solvent. The Kohn–Sham equations were solved usinga plane-wave basis set with a cut-off energy of 400 eV [21]. ThePerdew–Wang 91 exchange correlation functional was used to de-scribe non-local gradient corrections [22]. The core electrons andthe nuclei of the atoms were described by Vanderbilt ultrasoftpseudopotentials [23]. A 3 � 3 � 1 k-point grid was used to modelthe first Brillouin zone [24]. All the reported calculations were car-ried out spin-restricted. The wavefunctions were converged towithin 1 � 10�4 eV and the geometries were optimised until theforce on each atom was less than 0.05 eV/Å. In order to test the de-gree of accuracy, we tightened the electronic convergence criterionfrom 10�4 to 10�6 eV and the structural optimisation criterionfrom 0.05 to 0.01 eV/Å and found that the energies for the adsorp-tion of hydrogen and methyl ethyl ketone on Ru(0001) changed byless than 0.002 eV and 0.03 eV, respectively. As such, we have used

Table 1Comparison of reaction rate at 303.15 K, 3 bar H2 and 1400 rpm using 5 wt%Ru/SiO2 (a measured at 298.15 K).
Rate (mol min�1 g�1) � 104 Dielectric constant
Water 31.90 76.7IPA 4.55 19.9a
Methanol 0.95 31.6Heptane 1.25 1.9
2.0x10⁻⁴
4.0x10⁻⁴
6.0x10⁻⁴
8.0x10⁻⁴
1.0x10⁻³
1.2x10⁻³
1.4x10⁻³
1.6x10⁻³
1.8x10⁻³
2.0x10⁻³
2.2x10⁻³
T = 303K, P = 1 barg
rate
(mol
min
-1 g
-1)
5.0x10⁻³
1.0x10⁻²
1.5x10⁻²
2.0x10⁻²
2.5x10⁻²
3.0x10⁻²
T = 333K, P = 3 barg
rate (mol m
in-1 g
-1)
32 B.S. Akpa et al. / Journal of Catalysis 289 (2012) 30–41
the lower criterion to carry out the calculations reported herein.Transition states were isolated using the climbing nudged elasticband approach, which optimises the forces on all of the atomsfor a particular image and over a series of images chosen alongthe minimum energy path until the force perpendicular to thereaction coordinate was within 0.05 eV/Å [25]. Frequency calcula-tions were carried out for each transition state to ensure that therewas a single imaginary frequency corresponding to vibration modealong the reaction coordinate. In the transition state calculations inthe presence of a solvent, the solvent molecules are allowed tomove along the reaction coordinate. This enables us to model thepossible stabilisation of transition state by the solvent molecules.
The Ru(0001) surface was modelled by using a 3 � 3 unit cellcomprised of four metal layers along with 16 Å vacuum spacing nor-mal to the metal surface to separate the metal slabs. The aqueousmedium was simulated by filling the vacuum region within the unitcell with 24 water molecules in order to simulate a density of waterof 1 g/cm3. The initial starting structures were adapted from previ-ous long time (30 ps) ab initio molecular dynamic simulations car-ried out for water on Cu(111) and Pt(111) [45]. For the reactioncarried out in 2-propanol, 6 isopropyl alcohol (IPA) molecules wereused in order to create a density of 0.785 g/cm3. The initial structureof the solvent, represented by explicit solvent molecules, was ob-tained by carrying out a series of simulated annealing runs usingab initio molecular dynamics (AIMD) as implemented in VASP. TheAIMD simulations (at 400 K, Dt = 1 fs) were performed for both sys-tems within an NVT ensemble to obtain an optimised, low energystructure for the interface. The simulations were all run for 1200time steps or 1.2 ps. A Nose–Hoover thermostat was used to regu-late the temperature during the run [26,27]. The resulting solvent/metal interface structures established from AIMD simulations werethen fully optimised using the conjugate gradient methods until theforces on all of the atoms were all less than 0.05 eV/Å. The simula-tions represent a very simplified model of the solvent/metal inter-face carried out at 0 K. They do not capture the dynamic changesin the solvent structure that is present under actual catalytic condi-tions or the effects of temperature as this would require hundreds ofthousands of ab initio molecular dynamics simulations carried out tolong times to provide the appropriate sampling which is well be-yond what is currently possible. The simulations thus provide whatmay be a first-order effect that captures the role of explicit solventbut does not include the effects of dynamics or temperature.
The diffusion of MEK, IPA and water in IPA/water/MEK mixtureswas studied using classical molecular dynamics (MD) as imple-mented in the Discover module of Materials Studio [28]. The MDsimulations were performed on a system consisting of 64 water(for pure water) molecules in a cubic simulation cell with each sideequal to 12.74 Å, which yielded liquid densities of 0.925 g/cm3 forwater at 298 K. NVT simulations were carried out with periodicboundary conditions at 293.15 K in this work. Again the Nose–Hoover algorithm was used to maintain the temperature at thespecified set point [26,27]. All the simulations were run for10,000 time steps with each time step of 1 fs. Diffusion coefficientswere obtained by calculating the mean squared displacements(MSD) from the simulations using the Einstein relation [29]:
D ¼ 16t½rðtÞ � rð0Þ�2D E
ð1Þ
where r(t) denotes the coordinates of the centre-of-mass of the mol-ecules at time (t).
0 20 40 60 80 100
molH2O%
Fig. 1. Reaction rates for MEK hydrogenation in different water/IPA mixtures at �333.15 K, 3 barg j 303.15 K, 1 barg (on secondary axis).
3. Results and discussion
As shown in Table 1, tests using a range of four different sol-vents with 5 wt% Ru/SiO2 at 303.15 K and 1400 rpm demonstrate
a significant variation in initial rate with water clearly producinga value over 33 times larger than that observed in methanol. Suchresults indicate that under the conditions used here no correlationbetween the dielectric constant and initial rate exists. While it can-not be guaranteed that these experiments were carried out in thekinetic regime, the fact that water has both the highest rate andlowest hydrogen gas solubility suggests that removal of masstransfer resistance, as will be demonstrated later, would only exag-gerate this difference further.
When water/IPA mixtures of varying mole fractions were testedas solvents in the hydrogenation of MEK using 5 wt% Ru/SiO2, theresults showed that the observed rate increased with water molefraction (xH2O), until a maximum was attained after which it de-creased until xH2O � 0.9 when it again started to increase (Fig. 1).
This trend was confirmed at two different reaction conditionsand it is worthy of note that a similar trend was observed by Huet al. for the hydrogenation of 2-butyne-1,4-diol using the samesolvent mixture [30]. Again the mixture dielectric constant cannotbe used to correlate the rate behaviour as it is known to decreaselinearly with increasing IPA concentration [31].
3.1. Gas–liquid mass transfer
As mentioned previously, the observed effect may be due toexternal and/or internal mass transfer limitations and hence thesemust be taken into consideration. Estimation of the gas–liquidmass transfer efficiency (gG–L) can be expressed as:
gG—L ¼ 1� CaG—L ð1Þ
where CaG–L is the Carberry number for gas–liquid mass transferwhich is defined as the ratio between the observed reaction rateand the maximum transfer rate both based on the liquid volume.This value is determined from the measured volumetric gas–liquid

Table 2Calculated effectiveness factors for 5% Ru/SiO2.
xH2O gG–L gL–S (H2) gL–S (MEK) gpore (H2) gpore (MEK)
0 1.00 1.00 1.00 0.86 0.980.12 0.99 1.00 1.00 0.59 0.940.40 0.98 1.00 1.00 0.33 0.900.64 0.98 0.99 1.00 0.21 0.910.80 0.97 0.99 1.00 0.15 0.910.92 0.96 0.99 1.00 0.11 0.920.99 0.89 0.98 1.00 0.08 0.90
With 1% Ru/SiO2, all transport processes had calculated effectiveness factors >0.95.
B.S. Akpa et al. / Journal of Catalysis 289 (2012) 30–41 33
mass transfer coefficients (kLa) obtained via the pressure stepmethod and the hydrogen solubility [32,33]. While it can be seenthat there is a marked increase in the kLa at xH2O > 0.50 it decreasessharply as xH2O ? 1, (Fig. 2). A similar effect of IPA addition to wateron bubble size was observed by Hu et al. [30]; namely a minimumbubble diameter was observed at xH2O � 0.98.
Hu et al. attributed this observation to a surfactant type effectwith preferential adsorption of alcohol or diol at the gas–liquidinterface at low concentrations. It was considered that the hydro-phobic organic parts were directed into the gas phase with thehydrophilic OH groups being directed into the aqueous phaseresulting in polarisation of the interface which hindered drain-age/rupture of the film separating two bubbles [30]. This indicatesthat the changes in bubble size, which directly relate to the masstransfer rate, would be stronger functions of the surface excess en-ergy and solution viscosity rather than the traditional Weber num-bers used to estimate mean bubble diameters. Using the datapublished by Park et al. these can be compared with the kLa values,and as shown in Fig. 2 a reasonable correlation is observed [31].However, when these values were used to estimate the gas–liquidmass transfer efficiency using the methods reported by Dietrichet al., all values for the mixed water/IPA system were greater than95% except for the pure water system which yielded a value of 89%(Table 2) thereby indicating that external gas to liquid mass trans-fer did not account for the observed rate trends [32].
3.2. Liquid–solid mass transfer
Fishwick et al. showed that calculation of liquid to solid masstransfer rate is complicated by large local differences in the particleslip velocities within the reactor [34]. However, the liquid to solidCarberry number may be used to estimate such resistances [31].Here calculation of the liquid–solid mass transfer coefficient, kLs,is estimated via the dimensionless Sherwood number which is it-self calculated for laboratory stirred tank reactors using the follow-ing correlation [35]
Sh ¼ 2þ 0:4Re1=4Sc1=3 ð2Þ
with the dimensionless Reynolds and Schmidt numbers calculatedusing Eqs. (3) and (4), respectively.
Re ¼ d2i Nql
ð3Þ
Sc ¼ lqD
ð4Þ
0 20 40 60 80 1000.06
0.08
0.10
0.12
0.14
0.16
0.18
-0.5
0.0
0.5
1.0
1.5
2.0
2.5
3.0
3.5
4.0
4.5
5.0
5.5
Visc
osity
(CPS
)Su
rface
exc
ess
(*10
-6 m
ol m
-2)
k La(s
-1)
molH2O%
kLa Viscosity Surface excess
Fig. 2. Volumetric mass transfer coefficient for water/IPA mixtures. All have0.33 mol l�1 of MEK except xH2O = 1.0.
Prior to estimating the mass transfer rate, one must haveknowledge of both the bulk diffusion coefficient as well as hydro-gen solubility in the mixed solvents. Here the hydrogen concentra-tion in water/IPA mixtures was evaluated from the data andequations given by Nischhenkova [36] while the Wilke–Chang cor-relation [37] was used for hydrogen diffusivity estimation in waterand the Schiebel equation [38] for diffusivity in IPA. For mixed sol-vents the correlation developed by Perkins and Geankoplis [39]was used, where the viscosity of the mixture was calculated fromthe equation developed by Kendall and Monroe [40]. Despite theapproximations used for bulk diffusivity, the estimated and calcu-lated data were both used to determine the liquid–solid Carberrynumber which was then utilised to estimate the liquid–solid masstransfer efficiency according to Eq. (5)
gL�S ¼ ð1� CaL�SÞn ð5Þ
In each case, the external mass transfer efficiencies were shownto be P 0.98 for all solvent compositions when both H2 and MEK(Table 1) are treated as the limiting species and therefore liquid–solid mass transfer was not considered to be limiting in thissystem.
At present we are not aware of any experimental results forhydrogen diffusivity in mixed solvents which could be used to helpvalidate the aforementioned empirical equations; however, such acomparison can be made for 2-butanone using the data measuredby PFG-NMR across the entire solvent composition range, as shownin Fig. 3. A minimum in the rate of diffusion of 6.59 � 10�10 m2 s�1 isseen at �85 molH2O%. This minimum implies that molecular mobil-ity is hindered and hence liquid structuring is enhanced at this con-centration. The previously reported diffusion coefficient of 2-propanol in the binary 2-propanol/water system follows a similar
0.0 0.2 0.4 0.6 0.8 1.00
2
4
6
8
10
12
14
16
18
20
Diff
usio
n co
effic
ient
(* 1
0-10 m
2 s-1)
xH2O
PFG-NMR MD Calculation
Fig. 3. Diffusion coefficient of 2-butanone (0.33 mol l�1), in 2-butanone/2-propa-nol/water mixtures at 303.15 K using PFG-NMR, MD calculations and literaturecorrelations.

34 B.S. Akpa et al. / Journal of Catalysis 289 (2012) 30–41
trend [41]. Comparing the measured data to calculated values (alsoshown in Fig. 3) a significant difference between the calculatedand the experimental data is evident. However, even when usingthese calculated data, the results still indicate that liquid–solid masstransfer for MEK was not limiting. If similar errors are imposed onthe hydrogen diffusivity, the mass transfer efficiency is reducedbut is still high enough for it to be considered as not limiting. There-fore, while in this case it is unlikely that liquid–solid diffusion isimportant, this analysis does highlight deficiencies in the empiricalcorrelations employed here for diffusivity estimation.
There are of course a number of alternative correlations whichcould be used to estimate the diffusivity in pure or mixed solvents,although these will not be reported here as even an order of mag-nitude change here in diffusivity estimates does not alter the con-clusion that external mass transfer rates are not limiting in thiscase. The diffusivity of MEK in different ternary mixtures of IPA,water and MEK was, however, estimated using classical moleculardynamics simulations. The compositions of the ternary mixtureswere varied by changing the relative number of molecules in thesystem. Here we considered ternary mixtures with 0% (IPA 92.7%and MEK 7.3%), 41.2% (IPA 51.5% and MEK 7.3%), 74.2% (IPA18.5% and MEK 7.3%) and 96.9% (MEK 3.1%) water (mole fractions).The number of water, IPA and MEK molecules per unit cell in thesesystems were chosen as (0:38:3), (17:21:3), (30:8:3) and (62:0:2),respectively. The diffusivity of MEK in these mixtures was thencalculated based on the mean squared displacement of MEK mole-cules over 10 ps. As shown in Fig. 3, the diffusivity of MEK in theternary solution changes with the composition. It can be observedthat the molecular dynamics results for diffusivity are in agree-ment, at least qualitatively, with the PFG-NMR results and thatusing this method also suggests a minimum diffusivity of MEKwhen xH2O is close to 0.74.
3.3. Internal mass transfer
In Fig. 4, tests with varying catalyst particle sizes showed thatthe observed reaction rate increased with decreasing particle size,inferring pore diffusion limitations. Here the particle size wasdetermined using known sieve fractions and only the initial rateis reported as it is known that the particle size reduces duringthe experiment due to the shear forces from the impeller.
0-45 45-75 75-125 150-250
0.000
0.002
0.004
0.006
0.008
0.010
0.012
0.014
0.016
0.018
0.020
Rat
e (m
ol m
in-1 g
-1)
Particle Size ( µm)
Fig. 4. Observed initial rate with varying particle size.
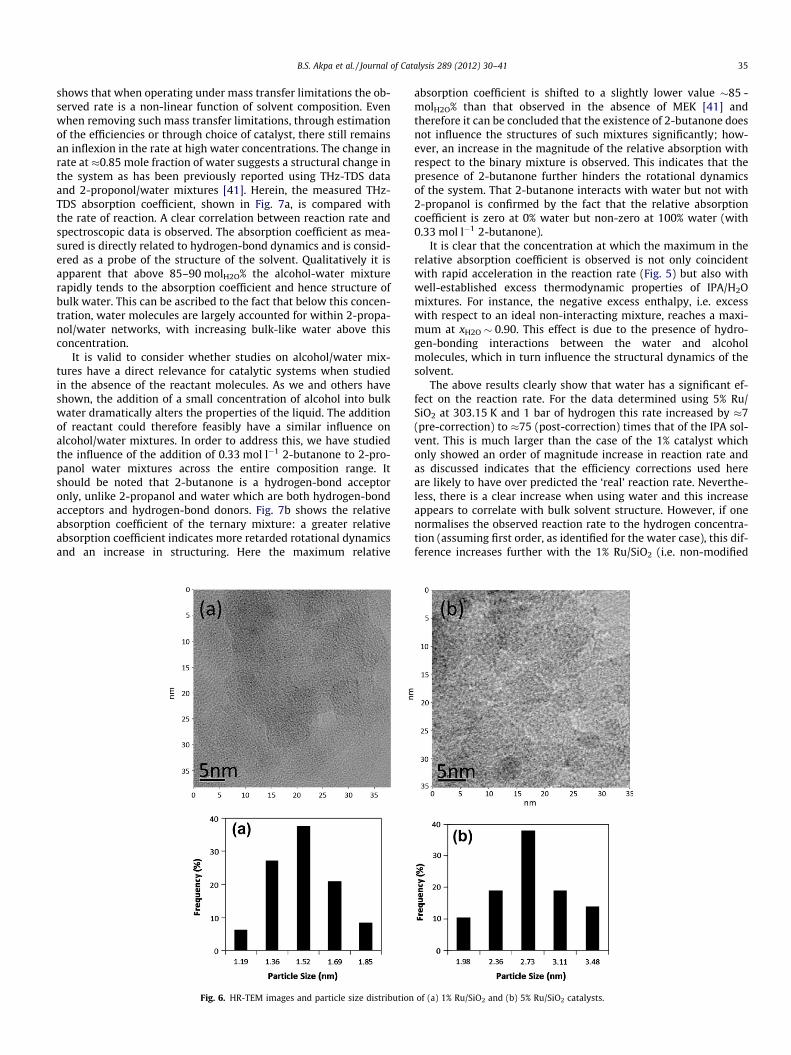
As it is known that the catalyst is not poisoned by product, theWeisz-Prater criteria were employed to calculate the effectivenessfactor, and subsequently used to give an estimate of the true reac-tion rates [42]. In general if the calculated value of /WP� 1, thenthe reaction is absent of internal mass transfer limitations. This va-lue changes depending on the order of the reaction and a very goodreview of this method and its application is given by Mukherjeeand Vannice [43]. Using the calculated efficiencies it is possibleto modify the observed reaction rates and to therefore estimate a‘true’ rate which is free from mass transfer effects. The result of thismanipulation is shown in Fig. 5 where it can be seen that the cor-rected reaction rate now increases with xH2O. This increase pro-ceeds linearly up to xH2O � 0.8, after which it increases muchmore rapidly until xH2O = 1.0. It is possible that the increasing rateover the lower water concentrations could now be attributed toprevious discussions, e.g. changes in the bulk dielectric constantor related to changes in the adsorption equilibria on the catalystsurface. Obviously the change at xH2O � 0.8 suggests that water isplaying a key role in enhancing the reaction rate above this con-centration. It should be noted that the result of this manipulationis, in this case, much more sensitive to estimated values of the dif-fusion constant and particle size. For example a 20% increase in thediffusion coefficient will contribute to approximately a 10% in-crease in the rate, whereas a 20% increase in the particle diameterwill result in a 17% decrease in the rate (Note, these sensitivitiesare evaluated when the efficiency was originally estimated at24%). This sensitivity is of course one of the main reasons for oper-ating in the mass transfer free region; and therefore, in order toconfirm that this effect was not an artefact of introducing the effi-ciency correction, the reactions were repeated using a catalyst witha lower loading and smaller particle size, i.e. 1% Ru/SiO2 and20 lm. In this case all the calculated mass transfer limitations,using the above correlations, were negligible and this catalystshowed the trend directly. It can also be observed that the 1% cat-alyst was an order of magnitude slower than the 5% catalyst, whichmay be attributed here to differences in the dispersion or errors inthe efficiency calculations. Transmission electron microscopy(TEM) studies were performed to obtain Ruthenium particle sizedistribution data for both 1% and 5% Ru/SiO2 catalysts. This TEMdata collected for both catalysts showed that the 1% Ru/SiO2 cata-lyst has a smaller ruthenium particle sizes (�1.5 nm) with a highermetal dispersion than the 5% Ru/SiO2 catalyst which showed aver-age particle sizes of �3 nm, as shown in Fig. 6. The above clearly
0.0 0.2 0.4 0.6 0.8 1.0
0.000
0.005
0.010
0.015
0.020
0.025
H2O
5%
Ru/
SiO
2 rat
e (m
ol m
in-1 g
-1)
0.0000
0.0005
0.0010
0.0015
0.0020
0.0025
1% R
u/SiO2 R
ate (mol m
in-1 g
-1)
X
Fig. 5. T = 303.15 K, P = 1 barg, corrected rate for 5% Ru/SiO2 using calculatedinternal mass transfer effectiveness for hydrogen as well as the uncorrected for 1%Ru/SiO2 .
B.S. Akpa et al. / Journal of Catalysis 289 (2012) 30–41 35
shows that when operating under mass transfer limitations the ob-served rate is a non-linear function of solvent composition. Evenwhen removing such mass transfer limitations, through estimationof the efficiencies or through choice of catalyst, there still remainsan inflexion in the rate at high water concentrations. The change inrate at �0.85 mole fraction of water suggests a structural change inthe system as has been previously reported using THz-TDS dataand 2-proponol/water mixtures [41]. Herein, the measured THz-TDS absorption coefficient, shown in Fig. 7a, is compared withthe rate of reaction. A clear correlation between reaction rate andspectroscopic data is observed. The absorption coefficient as mea-sured is directly related to hydrogen-bond dynamics and is consid-ered as a probe of the structure of the solvent. Qualitatively it isapparent that above 85–90 molH2O% the alcohol-water mixturerapidly tends to the absorption coefficient and hence structure ofbulk water. This can be ascribed to the fact that below this concen-tration, water molecules are largely accounted for within 2-propa-nol/water networks, with increasing bulk-like water above thisconcentration.
It is valid to consider whether studies on alcohol/water mix-tures have a direct relevance for catalytic systems when studiedin the absence of the reactant molecules. As we and others haveshown, the addition of a small concentration of alcohol into bulkwater dramatically alters the properties of the liquid. The additionof reactant could therefore feasibly have a similar influence onalcohol/water mixtures. In order to address this, we have studiedthe influence of the addition of 0.33 mol l�1 2-butanone to 2-pro-panol water mixtures across the entire composition range. Itshould be noted that 2-butanone is a hydrogen-bond acceptoronly, unlike 2-propanol and water which are both hydrogen-bondacceptors and hydrogen-bond donors. Fig. 7b shows the relativeabsorption coefficient of the ternary mixture: a greater relativeabsorption coefficient indicates more retarded rotational dynamicsand an increase in structuring. Here the maximum relative
Fig. 6. HR-TEM images and particle size distribution
absorption coefficient is shifted to a slightly lower value �85 -molH2O% than that observed in the absence of MEK [41] andtherefore it can be concluded that the existence of 2-butanone doesnot influence the structures of such mixtures significantly; how-ever, an increase in the magnitude of the relative absorption withrespect to the binary mixture is observed. This indicates that thepresence of 2-butanone further hinders the rotational dynamicsof the system. That 2-butanone interacts with water but not with2-propanol is confirmed by the fact that the relative absorptioncoefficient is zero at 0% water but non-zero at 100% water (with0.33 mol l�1 2-butanone).
It is clear that the concentration at which the maximum in therelative absorption coefficient is observed is not only coincidentwith rapid acceleration in the reaction rate (Fig. 5) but also withwell-established excess thermodynamic properties of IPA/H2Omixtures. For instance, the negative excess enthalpy, i.e. excesswith respect to an ideal non-interacting mixture, reaches a maxi-mum at xH2O � 0.90. This effect is due to the presence of hydro-gen-bonding interactions between the water and alcoholmolecules, which in turn influence the structural dynamics of thesolvent.
The above results clearly show that water has a significant ef-fect on the reaction rate. For the data determined using 5% Ru/SiO2 at 303.15 K and 1 bar of hydrogen this rate increased by �7(pre-correction) to �75 (post-correction) times that of the IPA sol-vent. This is much larger than the case of the 1% catalyst whichonly showed an order of magnitude increase in reaction rate andas discussed indicates that the efficiency corrections used hereare likely to have over predicted the ‘real’ reaction rate. Neverthe-less, there is a clear increase when using water and this increaseappears to correlate with bulk solvent structure. However, if onenormalises the observed reaction rate to the hydrogen concentra-tion (assuming first order, as identified for the water case), this dif-ference increases further with the 1% Ru/SiO2 (i.e. non-modified
of (a) 1% Ru/SiO2 and (b) 5% Ru/SiO2 catalysts.

0 20 40 60 80 100
50
100
150
200
250
0 20 40 60 80 1000
10
20
30
40
50(a)
Abso
rptio
n co
effic
ient
(cm
-1)
molH2O%
(b)
molH2O%
Fig. 7. (a) Absorption coefficient of 2-propanol/water mixtures at 1 THz [41]. (b) Relative absorption coefficient of 2-butanone/2-propanol/water mixtures (303 K) at 1 THz asevaluated from THz-TDS measurements.
36 B.S. Akpa et al. / Journal of Catalysis 289 (2012) 30–41
rate) now giving a normalised rate which is 63 times higher inwater when compared to IPA. Such a significant increase in reac-tion rate necessitates further investigation on how such structuraldifferences may relate to the observed rate changes betweensystems.
3.4. Role of solvent
In order to begin to understand the influence of water on the in-creased rates of reaction, we carried out density functional theoret-ical calculations to model the adsorption and hydrogenation ofMEK over Ru(0001) in the vapour phase as well as in 2-propanoland aqueous solvents. A detailed description of these and relatedsimulations is given elsewhere [44–46].
MEK hydrogenation follows Langmuir–Hinshelwood kineticswhere both MEK and hydrogen chemisorb on the metal surfaceand react via a series of hydrogen addition steps through a Hori-uti–Polanyi like mechanism [47]. MEK adsorbs atop of a Ru atomof the Ru(0001) surface through its oxygen atom in an g1 config-uration (Fig. 8a) with an adsorption energy of 33 kJ mol�1. Thehydrogenation of MEK can then proceed via two differentpathways.
In the first path (hydroxy route), an adsorbed hydrogen atomadds to the oxygen of MEK to form a hydroxybutyl intermediate(Fig. 9b) which is bound di-r to the surface through its carbonand oxygen atoms (Fig. 8b). This reaction proceeds via the additionof hydrogen to the Ru–O bond in the three centre transition stateas depicted (Fig. 9a). The Ru–O bond increases from 2.13 Å inMEK to 2.26 Å in the transition state as O–H bond begins to form(1.40 Å). The activation barrier for this step was calculated to be64 kJ mol�1 (Table 3a). The subsequent hydrogenation of thehydroxybutyl intermediate to form 2-butanol (Fig. 8d) was foundhave a barrier of 72 kJ mol�1. The transition state for this step in-volves the addition of hydrogen to the Ru–C bond as is shown inFig. 9d.
In the second path (alkoxy route), hydrogen first adds to thecarbon atom to form the 2-butoxy intermediate (Fig. 9c) which isbound to a three-fold hollow site through its oxygen atom(Fig. 8c). The transition state for this step involves the insertion
of hydrogen into the Ru–C bond as is shown in Fig. 9c. The transi-tion state is very similar to that shown in Fig. 9d for the C–H bondformation in the hydroxy route. The activation barrier for this stepwas calculated to be 58 kJ mol�1 (Table 3b). The subsequent hydro-genation of the butoxy intermediate to form 2-butanol proceedsvia the addition of hydrogen to the Ru–O bound. Again the transi-tion state for this reaction which is shown in Fig. 9d is very similarto that found for the first hydrogenation step in the hydroxy route(Fig. 9a) as both involve the formation of an O–H bond. The activa-tion barrier for this step, however, was calculated to be124 kJ mol�1 which is significantly higher than the other three ele-mentary steps discussed; as such, this may limit the reaction rate.While the activation barrier for the first hydrogenation step in thealkoxy route is lower than that found in the hydroxy route, the sec-ond step in the alkoxy route is significantly higher than that in thehydroxy route. We carried out kinetic Monte Carlo simulations forthe hydrogenation of MEK over Ru in the vapour phase and foundthat the product (2-butanol) is mainly formed via the alkoxy route[44].
In the presence of the solvent, the hydroxy route was found tobe more favourable than that the alkoxy route. The structures forall the reactants, products and transition states were calculatedto be very similar to those found for the vapour phase reaction.MEK adsorbs at the metal–water interface by displacing a watermolecule from the metal surface. Two of the water molecules with-in the first solvation shell of the adsorbed MEK form hydrogenbonds with the MEK (Fig. 10a). Similar to the results in the vapourphase, the hydroxybutyl intermediate, formed by the reaction ofMEK and hydrogen, binds through the carbon atom of its initialcarbonyl group. The hydroxyl group that results is directed to-wards the solution phase where it is stabilised by forming hydro-gen bonds with water molecules in solution, as is shown inFig. 10b. The Ru–O bond that forms between the hydroxybutyland the Ru surface is 2.19 Å as compared to 2.06 Å for MEK whichindicates a stronger interaction of the intermediate with the aque-ous solvent than with the surface [45].
The accessibility of the hydroxyl group to the bulk solventallows it to participate in hydrogen bonding with a water moleculein the bulk solution and leads to extra stabilisation over the

Fig. 8. DFT-optimised adsorption configurations for (a) MEK (b) hydroxybutyl intermediate (c) butoxy intermediate and (d) 2-butanol over Ru(0001) in the vapour phase.
Fig. 9. DFT-calculated transition state structures for the hydrogenation of (a) MEK to form the hydroxybutyl intermediate, (b) the hydroxybutyl intermediate to butanol, (c)MEK to butoxy intermediate and (d) the butoxy intermediate to 2-butanol over Ru(0001) in the vapour phase.
Table 3aDFT predicted reaction energy and activation barriers for the hydrogenation of MEK tohydroxybutyl and hydroxybutyl to 2-butanol in vapour, water and IPA.
Solvent R1R2C� ¼ O� þH� ? R1R2C�—OH R1R2C�—OHþ H� ? R1R2CH—O�H
DErxn (kJ/mol) Eact (kJ/mol) DErxn (kJ/mol) Eact (kJ/mol)
Vapour 21 64 �18 72Water �23 20 �20 68IPA �16 32 �20 70
R1 ¼ CH3CH2;R2CH3.
Table 3bDFT predicted reaction energy and activation barriers for the hydrogenation of MEK tobutoxy and butoxy to 2-butanol in vapour, water, and IPA.
Solvent R1R2C� ¼ O� þ H� ? R1R2CH—O� R1R2CH—O� þH ? R1R2CH—O�H
DErxn (kJ/mol) Eact (kJ/mol) DErxn (kJ/mol) Eact (kJ/mol)
Vapour �47 58 50 123Water �47 58 4 115IPA �42 62 6 116
R1 ¼ CH3CH2;R2CH3.
B.S. Akpa et al. / Journal of Catalysis 289 (2012) 30–41 37

Fig. 10. DFT-optimised adsorption configurations for (a) MEK, (b) hydroxybutyl intermediate, (c) butoxy intermediate and (d) 2-butanol over Ru(0001) in the aqueous phase.For clarity, the hydrogen atom involved in hydrogenation has been shown in yellow. (For interpretation of the references to color in this figure legend, the reader is referred tothe web version of this article.)
Fig. 11. DFT-calculated transition state structures for the hydrogenation of (a) MEK to hydroxybutyl intermediate, (b) the hydroxybutyl intermediate to 2-butanol, (c) MEK tobutoxy intermediate and (d) the butoxy intermediate to 2-butanol over Ru(0001) in the aqueous phase. For clarity, the hydrogen atom involved in hydrogenation has beenshown in yellow. (For interpretation of the references to color in this figure legend, the reader is referred to the web version of this article.)
38 B.S. Akpa et al. / Journal of Catalysis 289 (2012) 30–41
reactant state (MEK). In the reaction to form the hydroxybutylintermediate, the transition state takes on the classic three centreform with O–H, Ru–O and Ru–H bond lengths of 1.37, 2.18 and1.7 Å, respectively. Both the hydrogen and the oxygen in the tran-sition state (Fig. 11a) interact with water molecules within their lo-cal solvation sphere (including water molecules at the surface as
well as in the bulk solvent) which lowers the activation barrierto 20 kJ mol�1 from 64 kJ mol�1 in the vapour phase reaction. Thetransition state for the subsequent hydrogenation of the hydrox-ybutyl intermediate to form 2-butanol in water, which is shownin Fig. 11b, was also very similar to that in the vapour phase. Theactivation barrier in the solution phase was calculated to be

Fig. 12. A snapshot from ab initio molecular dynamics simulation of protondiffusion in pure water. Two water molecules participate in formation of an H5Oþ2intermediate as proton shuttles through the hydrogen-bonding network.
B.S. Akpa et al. / Journal of Catalysis 289 (2012) 30–41 39
65 kJ mol�1 which is also lower than that reported above for thevapour phase (72 kJ mol�1).
The hydrogenation of MEK to form the butoxy intermediate in-volves the formation of a C–H bond in the transition state (Fig. 11c)which is much less polar than the formation of the O–H bond forthe formation of the hydroxybutyl. As such, there is far less hydro-gen-bonding stabilisation of the transition state to form the butoxyas compared to that for the hydroxybutyl. The activation barrier forthis step in presence of the water was calculated to be 58 kJ mol�1,which is identical to that found for the vapour phase reaction. Thetransition state for the subsequent hydrogenation of the butoxyintermediate in water was calculated to be 120 kJ mol�1 which isvery similar to the value of 124 kJ mol�1 calculated for the vapourphase reaction (Fig. 12d). Unlike the adsorbed MEK, the alkoxidereactant is already quite polar and stabilised by water in the reac-tant state. The number of hydrogen bonds with water on thesurface and in solution remains the same between the reactantand the transition state. As such, there is only a very small stabili-sation (4 kJ mol�1) of the transition over the reactant state due tothe presence of water.
A comparison of both mechanisms in the vapour and thesolution phase reveals that the presence of water favours the for-mation of the O–H bond formation over that of the C–H bond, espe-cially in the hydroxy path. While both the alkoxy and hydroxyroutes have similar activation barriers for the reactions carriedout in the vapour phase, the hydroxy path is clearly favoured overthe alkoxy route when the reactions are carried out in solution as aresult of the stronger stabilisation of the lower barrier to form theO–H bond over the C–H bond and the increased stability of thehydroxybutyl intermediate over the butoxy intermediate.
Previously we have shown that the apparent barriers for thehydrogenation of ketones and aldehydes to alcohols can be de-scribed by the rate which depends on the intrinsic hydrogenationof either the hydroxyalkyl or the alkoxide intermediates [44]. Theresults presented here for both mechanisms reveal that waterclearly lowers the effective barrier for the hydrogenation of MEK.The solution phase also induces a change in the governing reactionpath over that found in the vapour phase.
The same reaction steps were studied using IPA as a solvent. Thecalculated activation barriers for the first hydrogenation step in IPAfor the hydroxy and alkoxy mechanisms were calculated to be32 kJ mol�1 and 68 kJ mol�1, respectively. As observed in the caseof water, the activation barrier is lower for the hydroxy route ascompared to the vapour phase reaction but there is very little dif-ference in barrier for the alkoxy route. The relative stabilisation oftransition state for the formation of hydroxybutyl intermediate inpresence of IPA is not as strong as in the case of water. Thus, the
activation barrier for this step is lower in water as compared toIPA by 12 kJ mol�1. This is the result of the loss of an additionhydrogen bond with the solution phase. A more detailed descrip-tion of the transition state structures is reported elsewhere [45].In summary, DFT predicts that the activation barriers for hydroge-nation of MEK follow the order of: vapour > IPA > water. Given thatheptane is the closest representation of the vapour phase, thistrend is in excellent agreement with the reported experimentaldata for the solvents (Table 1) particularly when normalised tohydrogen solubility. As reported here, hydrogenation rates at303 K were found to be an order of magnitude greater in waterthan in IPA. While this can be attributed to the lower activationbarrier for hydrogenation of MEK in water (20 kJ mol�1) than IPA(33 kJ mol�1), it does not, however, account for the rapid increasein reaction rate at xH2O � 0.8.
In addition to dissolving molecular hydrogen, it is known thatthe solvent is also capable of transporting charged reaction species.The ease of transport of these species can ultimately be decisive indetermining the rate of the reaction. In order to further explain thepeculiar behaviour in the hydrogenation rate of MEK at higher con-centrations of water (Fig. 1), we carried out ab initio moleculardynamics to monitor proton diffusivities in IPA-water solventswith different compositions (xH2O = 1 and 0.87). Proton transferwas chosen here as a very simple probe of the diffusion of polaror ionic species in aqueous media and in addition since somehydrogenation reactions in aqueous media have been suggestedto involve protons that form locally. The simulations were runout to 5 ps (using time step of 1 fs) in order to allow the protonto diffuse through the solution. It was observed that the protonreadily shuttles through a chain of water molecules by forming aZundel ion (H5Oþ2 ) like intermediate and a successive sequence ofproton transfer steps (Fig. 12). In pure water (xH2O = 1), the diffu-sivity of the proton was found to be 2 � 10�8 m2 s�1 which is inclose agreement with other molecular dynamics and experimentalstudies [48]. However, in the water–IPA mixture (xH2O = 0.87)the diffusivity was found to be over 27 times lower(7.52 � 10�10 m2 s�1). These simulations show that the presenceof IPA disrupts the highly interconnected hydrogen-bonding net-work between water molecules which subsequently inhibits facileproton transport and thus lowers the diffusivity. These results indi-cate that proton transfer increases considerably as solvent compo-sition changes from xH2O = 0.87 to xH2O = 1 and that this maysignificantly enhance hydrogenation activity. This is in agreementwith our experimental results for the hydrogenation of MEK inmixed solvents (Fig. 1) as well as the THz-TDS data (Fig. 7).
It is clear that hydrogen-bonding structure and dynamics canplay various roles in determining the catalytic behaviour of a sys-tem. The diffusion of protons through solution, a key step in cata-lytic hydrogenation described in the present work, and inelectrocatalytic reduction reactions such as those occurring in pro-ton exchange membrane fuel cells, is coupled to these dynamics[49,50]. Recent work has shown that the efficiency of this protondiffusion appears to be coupled to hydrogen-bonding dynamicsand structure of the liquid [51,52]. This diffusion or ‘proton-shut-tling’ is often described by the Grotthus mechanism [47], whichis discussed in detail elsewhere [47,53,54]. Briefly, it involves theeffective transfer of a proton through the breaking and formationof hydrogen bonds: specifically, isomerisation between H3O+ andH5Oþ2 which couples to hydrogen-bonding dynamics in the secondsolvation shell of the H3O+. Recent THz-TDS studies have, however,suggested that 15 water molecules may actually be involved in theproton diffusion process [55]. Bond-order analysis of moleculardynamics simulations has shown that the timescale of this protontransfer is of the order of a few ps [56]. This timescale also corre-sponds to the lifetime of the alcohol and water clusters in alco-hol-water mixtures observed by neutron diffraction studies [57]

40 B.S. Akpa et al. / Journal of Catalysis 289 (2012) 30–41
and the timescale of the processes probed by THz-TDS. The struc-ture of alcohol–water mixtures additionally dictates the diffusionof solvated electrons, a crucial step in both electrocatalytic andnon-catalytic electrochemical reactions [58]. For example, aqueoussolutions of methanol, ethanol, 1-propanol, 2-propanol and 1-butanol, 2-butanol and tert-butanol all show a maximum in thefree ion yield upon irradiation at alcohol concentrations of a fewmol% [54–63]. For aqueous 2-propanol, this maximum occurs at�97 molH2O% [54].
4. Conclusions
The results described herein have shown that there is a signifi-cant variation in the observed rate of the MEK hydrogenation reac-tion when using 5% Ru/SiO2 in different solvents. In particular, acomplex behaviour is observed for varying water/IPA mole frac-tions. Using experimental and estimated mass transfer rates wehave shown that while gas–liquid mass transfer also varies signif-icantly with water mole fraction, it, like the liquid–solid masstransfer, is not significant at the scale of the reactor used here.Internal mass transfer was, however, shown to be significant.Correcting the observed rate for the calculated internal effective-ness using literature correlations revealed that the rate increasedas the water mole fraction increased. This was confirmed by usinga lower loaded catalyst (1%), although a comparison with the 5%catalyst indicates that the mass transfer corrections used heredid appear to over predict the ‘true’ reaction rate. Results fromdensity functional theory calculations showed that water can sig-nificantly lower the activation energy for the reaction as comparedto the reactions in isopropyl alcohol or the vapour phase, and, inaddition, can alter the preferred hydrogenation mechanism. Theabove rationalises why water is a significantly better solvent thanIPA or indeed other alcohols and alkanes. This, however, did not ex-plain why the intrinsic rate is not ostensibly linear as a function ofsolvent composition, but rather goes through a sharp increase athigh water concentrations (>90 mol%). For gas liquid systems, Huet al. observed a significant effect at much lower IPA concentra-tions than this – a few mole% and this was explained by the sur-face-active behaviour of the alcohol at the gas liquid interface[30]. This explanation does not appear germane in this context.In order to explore the probable explanation, the structure of theIPA-water mixture was explored and a correlation observed butone which did not correspond completely to the composition ofminimum diffusivity or azeotrope. Therefore, ab initio moleculardynamics techniques were employed which showed that waterwas also found to facilitate diffusion of protons as well as the dif-fusion of MEK demonstrating significant enhancements for con-centration greater than 90% water.
The above discussions highlight the potential beneficial role ofwater in both lowering the activation barrier as well as increasingthe proton diffusion coefficient and combined these effects appearto correlate well with the experimental data reported. However, itshould also be noted that significant deactivation is observed in thepresence of water [64]. At high concentrations of water, this deac-tivation occurs at a sufficiently fast time scale so that it should beincluded in any reaction model. However, it did not affect the ini-tial rate data presented here.
The results reported herein therefore suggest that catalytic per-formance can be tailored through controlling the structuraldynamics of the solvent, e.g. through changing composition.
Overall, this work confirms and highlights the importance of thesolvent system in modifying the mass transfer, diffusion andreaction mechanism during the hydrogenation of MEK. Further-more, it demonstrates that it is possible to link DFT calculations,
spectroscopy and reaction kinetic data to better understand com-plex behaviour in catalytic systems.
Acknowledgments
The authors would like to thank the EPSRC under Grant NumberGR/S43702/01 and Johnson Matthey for funding this work. Themolecular modelling work was done using computational time atthe National Centre for Computational Sciences (NCCS) at OakRidge National Laboratory and the Environmental Molecular Sci-ences Laboratory (EMSL) at Pacific Northwest National Laboratory.Both of these are national scientific user facilities sponsored by theDepartment of Energy’s Office of Science. The authors are alsograteful for the helpful discussions with Professor Robert J. Davis(University of Virginia).
References
[1] M.H. Abraham, P. Grellier, J.M. Abboud, R.M. Doherty, R.W. Taft, Can. J. Chem.66 (1988) 2673.
[2] L. Gilbert, C. Mercier, in: M. Guisnet, J. Barbier, J. Barrault, G. Bouchoulo, D.Duprez, G. Pérot, C. Montassier (Eds.), Heterogeneous Catalysis and FineChemicals III, Elsevier, Amsterdam, 1993, p. 51.
[3] S. Asplund, C. Fornell, A. Holmgren, S. Irandoust, Catal. Today 24 (1995) 181.[4] E. Toukoniitty, P. Mäki-Arvela, J. Kuusisto, V. Nieminen, J. Päivärinta, M.
Hotokka, T. Salmi, D.Y. Murzin, J. Mol. Catal. A: Chem. 192 (2003) 135.[5] S. Mukherjee, A. Vannice, J. Catal. 243 (2006) 108.[6] S. Gómez-Quero, E. Díaz, F. Cárdenas-Lizana, M. Keane, Chem. Eng. Sci. 65
(2010) 3786.[7] B. Hu, R.P. Fishwick, A.W. Pacek, J.M. Winterbottom, J. Wood, E.H. Stitt, A.W.
Nienow, Chem. Eng. Sci. 62 (2007) 5392.[8] J. Wood, J.A. Bennett, N.J. Creamer, L.E. Macaskie, L. Bodeness, in: 8th World
Congress of Chem. Eng., Montreal, Canada, 2009.[9] J. Masson, P. Cividino, J. Court, Appl. Catal. A: Gen. 161 (1–2) (1997) 191.
[10] R.A. Rajadhyaksha, S.L. Karwa, Chem. Eng. Sci. 41 (7) (1986) 1765.[11] U.K. Singh, M.A. Vannice, Appl. Catal. A: Gen. 213 (2001) 1.[12] L. Vanoye, M. Zanota, A. Desgranges, A. Favre-Reguillon, C. De Bellefon, Appl.
Catal. A: Gen. 394 (2011) 276.[13] P. Kluson, L. Cerveny, Appl. Catal. A: Gen. 128 (1995) 13.[14] M. Hronec, Z. Cvengrošová, M. Králik, G. Palma, B. Corain, J. Mol. Catal. A:
Chem. 105 (1996) 25.[15] P.D. Vaidya, V.V. Mahajani, Chem. Eng. Sci. (60) (2005) 1881.[16] J. Weissenrieder, A. Mikkelsen, J.N. Andersen, P.J. Feibelman, G. Held, Phys. Rev.
Lett. 93 (19) (2004) 196102.[17] S.K. Desai, M. Neurock, Phys. Rev. B 68 (7) (2003) 075420.[18] J.E. Tanner, J. Chem. Phys. 52 (1970) 2523.[19] P. Hohenberg, W. Kohn, Phys. Rev. 136 (1964) B864 LP.[20] G. Kresse, J. Hafner, Phys. Rev. B 47 (1993) 558.[21] W. Kohn, L.J. Sham, Phys. Rev. 140 (1965) A1133 LP.[22] J.P. Perdew, J.A. Chevary, S.H. Vosko, K.A. Jackson, M.R. Pederson, D.J. Singh, C.
Fiolhais, Phys. Rev. B 46 (1992) 6671.[23] D. Vanderbilt, Phys. Rev. B 32 (1985) 8412.[24] H.J. Monkhorst, J.D. Pack, Phys. Rev. B 13 (1976) LP 5188.[25] G. Mills, H. Jonsson, G.K. Schenter, Surf. Sci. 324 (1995) 305.[26] W.G. Hoover, Phys. Rev. A 31 (1985) 1695.[27] S. Nose, J. Chem. Phys. 81 (1984) 511.[28] Materials Studio, v4.4.0.0 ed. Accelrys Software Inc., San Diego, CA, 2008.[29] M.P. Allen, D.J. Tildesley, Computer Simulation of Liquids, Oxford University
Press, Oxford, 1989.[30] B. Hu, A.W. Nienow, A.W. Pacek, E.H. Stitt, Ind. Eng. Chem. Res. 46 (13) (2007)
4451.[31] J.G. Park, S.H. Lee, J.S. Ryu, Y.K. Hong, T.G. Kim, A.A. Busnaina, J. Electrochem.
Soc. 153 (9) (2006) G811.[32] E. Dietrich, C. Mathieu, H. Delmas, J. Jenck, Chem. Eng. Sci 47 (1992) 3597.[33] F. Kapteijn, E. Crezee, B.W. Hoffer, R.J. Berger, M. Makkee, J.A. Moulijn, Appl.
Catal. A: Gen. 251 (2003) 1.[34] R.P. Fishwick, J.M. Winterbottom, E.H. Stitt, Catal. Today 79 (2003) 195.[35] Y. Sano, N. Yamaguchi, T. Adachi, J. Chem. Eng. Jpn. 7 (1974) 255.[36] L.G. Nischhenkova, M.V. Ulitin, V.N. Gorelov, Izv. Vys. Ucheb. Zaved. Khim. I
Khim. Tekhnol. 33 (1990) 22.[37] C.R. Wilke, P. Chang, Am. Inst. Chem. Eng. J. 1 (1955) 264.[38] E. Scheibel, Ind. Eng. Chem. 46 (1954) 2007.[39] L.R. Perkins, C.J. Geankoplis, Chem. Eng. Sci. 24 (1969) 1035.[40] J. Kendall, K. Monroe, J. Am. Chem. Soc. 39 (1917) 1787.[41] J. McGregor, R. Li, J.A. Zeitler, C. D’Agostino, J. Collins, M.D. Mantle, H.G.
Manyar, J.D. Holbrey, T. Youngs, C. Hardacre, E.H. Stitt, L.F. Gladden, Phys.Chem. Chem. Phys., submitted for publication.
[42] P.B. Weisz, C.D. Prater, Adv. Catal. 6 (1954) 144.[43] S. Mukherjee, M.A. Vannice, J. Catal. 243 (2006) 108.[44] N.K. Sinha, M. Neurock, J. Catal., submitted for publication.[45] N.K. Sinha, M. Neurock, Chem. Cat. Chem. submitted for publication.

B.S. Akpa et al. / Journal of Catalysis 289 (2012) 30–41 41
[46] N.K. Sinha, Ph.D. Thesis, Theoretical Insights into the Influence of Solvent onHeterogeneous Catalytic Hydrogenation and Hydrogenolysis Reactions,University of Virginia, 2011.
[47] J. Horiuti, M. Polanyi, Trans. Farad. Soc. 30 (1934) 1164.[48] B. Mauro, I. Tamio, T. Kiyoyuki, Chem. Phys. Chem. 6 (2005) 1775.[49] M.J. Janik, C.D. Taylor, M. Neurock, Top. Catal 46 (3–4) (2007) 306.[50] M.J. Janik, C.D. Taylor, M. Neurock, J. Electrochem. Soc. 156 (1) (2009) B126.[51] N. Agmon, Chem. Phys. Lett. 244 (5) (1995) 456.[52] C.D. Taylor, M. Neurock, Curr. Opin. Solid State Mater. Sci. 9 (1-2) (2005) 49.[53] D. Marx, M.E. Tuckerman, J. Hutter, M. Parrinello, Nature 397 (6720) (1999)
601.[54] M. Tuckerman, K. Laasonen, M. Sprik, M. Parrinello, J. Phys. Chem. 99 (16)
(2002) 5749.[55] K.J. Tielrooij, R.L.A. Timmer, H.J. Bakker, M. Bonn, Phys. Rev. Lett. 102 (19)
(2009) 198303.
[56] H. Lapid, N. Agmon, M.K. Petersen, G.A. Voth, J. Chem. Phys. 122 (2005) 1.[57] L. Dougan, S.P. Bates, R. Hargreaves, J.P. Fox, J. Crain, J.L. Finney, V. Reat, A.K.
Soper, J. Chem. Phys. 121 (13) (2004) 6456.[58] J. Cygler, G.R. Freeman, Can. J. Chem. – Revue Can. Chimie 62 (7) (1984) 1265.[59] A.D. Leu, K.N. Jha, G.R. Freeman, Can. J. Chem. – Revue Can. Chimie 60 (18)
(1982) 2342.[60] Y. Maham, G.R. Freeman, J. Phys. Chem. 89 (20) (1985) 4347.[61] Y. Maham, G.R. Freeman, J. Phys. Chem. 91 (6) (1987) 1561.[62] P.C. Senanayake, G.R. Freeman, J. Chem. Phys. 87 (12) (1987) 7007.[63] Y. Maham, G.R. Freeman, Can. J. Chem. – Revue Can. Chimie 66 (7) (1988) 1706.[64] H.G. Manyar, D. Weber, H. Daly, J.M. Thompson, D.W. Rooney, L.F. Gladden,
E.H. Stitt, J.J. Delgado, S. Bernal, C. Hardacre, J. Catal. 265 (1) (2009) 80.