Solid-state Fermentation for Chinese Liquor Production - WUR ...
190
Solid-state Fermentation for Chinese Liquor Production Guangyuan Jin Solid-state Fermentation for Chinese Liquor Production 2020 Guangyuan Jin
-
Upload
khangminh22 -
Category
Documents
-
view
1 -
download
0
Transcript of Solid-state Fermentation for Chinese Liquor Production - WUR ...
Solid-state Fermentation for Chinese Liquor Production
Guangyuan Jin
Solid-state Ferm
entation for Chinese Liquor P
roduction 2020 Guangyuan Jin

Propositions
1. Every traditional spontaneous food fermentation can be modernized and
standardized.
(this thesis)
2. A simple model can describe a complex Chinese liquor fermentation system.
(this thesis)
3. AI can only surpass human intelligence if it learns to recognize mistakes.
4. An improper assumption may lead to unexpected results.
5. Lazy thinking is much worse than lazy behavior.
6. Social distancing does not dissociate relationships.
Propositions belonging to the thesis entitled
Solid-state fermentation for Chinese liquor production
Guangyuan Jin
Wageningen, 4 December 2020

Solid-state Fermentation for Chinese Liquor Production
Guangyuan Jin
2
Thesis committee
Promotors Prof. Dr R. H. Wijffels Professor of Bioprocess Engineering Wageningen University & Research Prof. Dr Y. Xu Professor of School of Biotechnology Jiangnan University, China
Co-promotors Dr A. Rinzema Assistant professor, Bioprocess Engineering Wageningen University & Research Dr Y. Zhu Senior Scientist at Bioprocess Engineering Group, Wageningen University & Research Guest Professor at East China University of Science and Technology
Other members Prof. Dr E. Smid, Wageningen University & Research Prof. Dr V. Martins Dos Santos, Wageningen University & Research Prof. Dr H. Noorman, DSM & Delft University of Technology, Delft Dr H.V.M. Hamelers, Wetsus, Leeuwarden
This research was conducted under the auspices of the Graduate School VLAG (Advances studies in Food Technology, Agrobiotechnology, Nutrition and Health Sciences).
Solid-state Fermentation for Chinese Liquor Production
Guangyuan Jin
Thesis
Submitted in fulfilment of the requirements for the degree of doctor
at Wageningen University
by the authority of the Rector Magnificus,
Prof. Dr A.P.J. Mol,
in the presence of the
Thesis Committee appointed by the Academic Board
to be defended in public
on Friday 4 December 2020
at 4 P.M. in the Aula.
4
Guangyuan Jin
Solid-state Fermentation for Chinese Liquor Production
PhD thesis, Wageningen University, Wageningen, the Netherlands (2020) With references, with summary in English ISBN: 978-94-6395-518-8
DOI: 10.18174/529912

Contents
Chapter 1 General introduction and thesis outline 7
Chapter 2 Mystery behind Chinese liquor fermentation 17
Chapter 3 Water dynamics during solid-state fermentation by Aspergillus oryzae YH6
47
Chapter 4 Modeling of industrial-scale anaerobic solid-state fermentation for Chinese liquor production
71
Chapter 5 Identifying influential variables during Chinese liquor fermentation by statistical modelling
107
Chapter 6 General discussion: engineering aspects of traditional solid-state fermentation
129
References 145
Summary 169
Acknowledgement 175
About the author 181

6
Chapter 1
Introduction and thesis outline

8

Introduction and thesis outline
9
1.1 Traditional solid-state food fermentation Solid-state fermentation is defined as the growth of microorganisms on moist solid substrate without free-flowing water (Pandey, 2003; Rahardjo, Tramper, & Rinzema, 2006; Thomas, Larroche, & Pandey, 2013). Solid-state fermentation has been used for thousands of years in the Orient to produce foods and beverages such as soy sauce, miso, vinegar, Tempe and Chinese liquor (Jin, Zhu, & Xu, 2017; Liu, et al., 2004; Lu, et al., 2018; Nout & Kiers, 2005; Zhu & Tramper, 2013). Many traditional solid-state fermentations are spontaneous processes with mixture of yeasts, bacteria and molds from the natural flora, and run without process control. Poor understanding of these fermentation processes, especially of the engineering aspects, hampers the modernization needed to improve process safety, product quality and production efficiency. Chinese liquor (or Baijiu in Chinese) production is a typical example of traditional solid-state food fermentation. We use it as an example to study engineering principles of traditional solid-state fermentation and – of course – we hope we can improve it.
1.2 Chinese liquor production Most research on Chinese liquor production deals with either flavor formation (chemistry) or microbial communities, growth and metabolism (microbiology). We study engineering aspects. This area has been neglected until now, because the process has been developed by trial and error over a long period of time, and the industry is too reluctant to change because of the fear for unexpected surprises that changing anything in the design or operation might negatively affect the customarily accepted flavor of the liquor. Chinese liquor production process includes two fermentation steps: Qu starter (a sort of Koji) preparation (aerobic) (Zhu & Tramper, 2013) and alcohol formation (anaerobic). Both steps have their own problems. For

Chapter 1
10
starter preparation, a high temperature is necessary to ensure favorable microbes to grow, produce enzymes and form flavor precursors (Zheng, Tabrizi, Nout, & Han, 2011). However, the high temperature can cause rapid water loss and consequently hinder microbial growth. On the other hand, a low final water content is necessary for Qu conventionally preserved in the natural uncontrolled environment. Usually, water content is practically the first parameter to measure during starter preparation. Understanding how water content changes is the primary goal. In the subsequent anaerobic process, yeasts and lactic acid bacteria dominate the microbial population (Wang, Wu, Nie, Wu, & Xu, 2019). Yeasts form ethanol and lactic bacteria form lactic acid; both species may form flavor components. Both yeasts and lactic acid bacteria influence each other via their inhibitory products. In addition, the fermentation can be slowed down by overheating caused by microbial growth and metabolism. Microbial interactions and temperature dynamics must be studied. 1.3 Engineering aspects Studies on engineering principles of solid-state fermentation have been reviewed before (Arora, Rani, & Ghosh, 2018; Mazaheri & Shojaosadati, 2013; Mitchell & von Meien, 2000; Mitchell, von Meien, Krieger, & Dalsenter, 2004; Thomas, et al., 2013). Previous studies focus on temperature and moisture profiles in aerobic solid-state fermentation with pure culture of a single microorganism, mostly fungus. The core of these studies is the interdependence among water, temperature, and microbial growth and metabolism (Raghavarao, Ranganathan, & Karanth, 2003; Wang, Li, Tao, Geng, & Li, 2010). However, these studies were done with pure cultures (mainly filamentous fungi) and relatively simple substrate (wheat or wheat bran only). Although these studies provide important information to tackle the triangle association among water, temperature and microbial activity, they cannot be directly applied to complex spontaneous food fermentation like Chinese liquor. In mixed cultures, microbes can influence each other, for example via

Introduction and thesis outline
11
inhibitory products (including heat) or competition for utilizing nutrients.
Figure 1. The scheme of aerobic solid-state fermentation. Polymers (starch, protein) from raw materials are hydrolyzed by enzymes from microbes to monomers (glucose, amino acid). Then the microbes use the monomers, water and O2 to produce products and release CO2. Meanwhile, heat is produced by microbial growth and metabolism, and transferred from the center of substrate to the outer surface. The heat can accelerate water evaporation and increase the temperature inside the substrate and further influence the microbes.
The engineering principles of solid-state fermentation include mass transfer, heat transfer and biochemical reaction kinetics (Figure 1) (Chen & Qiu, 2010; Mitchell & von Meien, 2000; Nagel, Tramper, M. S. N. Bakker, & A. Rinzema, 2001b). The core problem is that microbial growth produces heat resulting in increased temperature that inhibits the microbes. In modern industrial aerobic processes, forced aeration is used to cool the culture. Although aeration is an efficient way to cool the system, it induces water evaporation, with the consequence of water content decrease that may then inhibit the microbes (Nagel, Tramper, M. S. N. Bakker, & Rinzema, 2001a; Weber, Oostra, Tramper, & Rinzema, 2002).
Biomass Evaporation O2
Water CO2
Enzyme
Monomer
Polymers Products
Heat Temperature
Chapter 1
12
In anaerobic processes, one might expect gas escape (carbon dioxide, nitrogen) from the substrate to remove heat, but this is not practically the case of Chinse liquor fermentation in a sealed fermentation pit or jar (see Chapter 2, Figure 2). Instead, cooling is achieved by heat conduction to the fermenter wall. Conduction requires temperature gradients, bigger distances require bigger temperature gradients, a problem for scaling-up. Especially if the wall temperature is not controlled and varies due to external factors, temperature control can be problematic. Although solid-state fermentation is believed difficult to control, large-scale modern composting facilities prove the feasible success (CNC, 2020; Jurak, 2015). Their control system is comparable to that in submerged fermentation plants or even in the chemical industry. The real problem is often that the process is insufficiently understood to implement a good control system. Therefore, we use Chinese liquor solid-state fermentation as an example system to reveal the engineering principles that can be used for process control. 1.4 Aim and thesis outline The aim of the study presented in this thesis is to address engineering aspect of traditional solid-state fermentation using Chinese liquor fermentation system as an example for quantitively understanding of both aerobic (starter preparation) and anaerobic (liquor fermentation) processes. Chapter 2 reviews Chinese liquor production and suggests important research directions including engineering aspects. We describe the traditional fermentation process and characteristics of Chinese liquor, summarize recent relevant studies on flavor chemistry and microbiology, and indicate the challenges that traditional Chinese liquor fermentation faces so far in the semi-controlled and empirical process. We emphasize that studying process engineering principles is an unmissable part for better controlled production

Introduction and thesis outline
13
processes. Water is crucial for microbial growth, heat transfer and substrate hydrolysis, and is considered one of most important factors for (solid) starter preparation (Li, et al., 2015). Water dynamically changes with time during the aerobic fermentation for starter preparation. Chapter 3 describes the study on measuring and understanding the water dynamics in Qu preparation with a model fermentation system. This model system enables in-situ and online measurement (NMR) of water content, migration and distribution during the fermentation by Aspergillus oryzae on squeezed wheat substrate. The outcomes give insight into the association of water with microbial growth and heat transfer. This insight is helpful to realize better process control and optimization of traditional solid-state food fermentations. Ethanol and flavors are formed during the anaerobic solid-state fermentation process. To better understand the traditional process, in Chapter 4 we present mathematical models developed based on the Han-Levenspiel equation for product inhibition, with parameters derived from measured data in the industry. The models accurately predict the concentrations of starch and dry matter. In addition, pit temperature in the heating and cooling phases can be accurately predicted by a model considering radial conduction into a small soil volume around the fermenter, and consecutive vertical conduction into the underlying soil. In order to identify the most influential variables in addition to what is found by the mechanistic model in the previous chapter, in Chapter 5 we use regression-based modelling based on a large data set obtained from year-round production in a Chinese liquor company. The result shows that the starting month was one of the most significant impact factors and the reason could be the inhibition from lactic acid (bacteria). This work provides an optional solution to identify the key variables during complex traditional fermentations.

Chapter 1
14
In Chapter 6 the achieved results are discussed, and further studies are proposed, based on the results described in previous chapters and recent advances reported in the literature. Still big space exists for further in-depth understanding of engineering and process control of Chinese liquor solid-state fermentation:
- better online detection should be applied for more detailed process monitoring and data collection;
- better robust models should be developed for further down-scale studies;
- better bioreactors should be designed based on the models, and - design of the whole system covers therefore starter Qu preparation,
pit fermentation and distillation. Furthermore, not only recommend we studies on ethanol production, but also on other flavor compounds, both at lab and industrial scale. Finally, we propose the need for down-stream process modeling including distillation.

15

16
17
Chapter 2
Mystery behind Chinese liquor fermentation This chapter is published as: G. Jin, Y. Zhu, Y. Xu, Mystery behind Chinese liquor fermentation, Trends Food Sci. Technol. 63 (2017) 18-28, https://doi.org/10.1016/j.tifs.2017.02.016.
Chapter 2
18
Abstract
Chinese liquor, a very popular fermented alcoholic beverage with thousands
of years’ history in China, though its flavor formation and microbial process
have only been partly explored, is facing the industrial challenge of
modernization and standardization for food quality and safety as well as
sustainability. Meanwhile, the hidden knowledge behind the complicated and
somehow empirical solid-state fermentation process of Chinese liquor can
enrich the food sector to improve our quality of life and benefit other industrial
sectors in the modern biomass-based technology, economy and society. This
review reveals the traditional fermentation process and characteristics of
Chinese liquor, summarizes the current study progress of flavor chemistry and
responsible microbial process, and addresses future improvement and
research needs. We provide here a detailed, systematic and critical review on
Chinese liquor to improve the current industrial practice and serve the modern
society with yet incompletely explored but useful principles. The hidden
knowledge behind the traditional Chinese liquor production is rich in useful
principles including flavor chemistry, microbial growth, solid-state
fermentation, enzyme production, biocatalysts, microbial community
metabolism and process engineering. Studies in a more in-depth, systematic
and practical way on this look-like empirical process to explore the scientific
principles behind will benefit the liquor industry in particular, and the (food)
biotechnology sector in general.
Mystery behind Chinese liquor fermentation
19
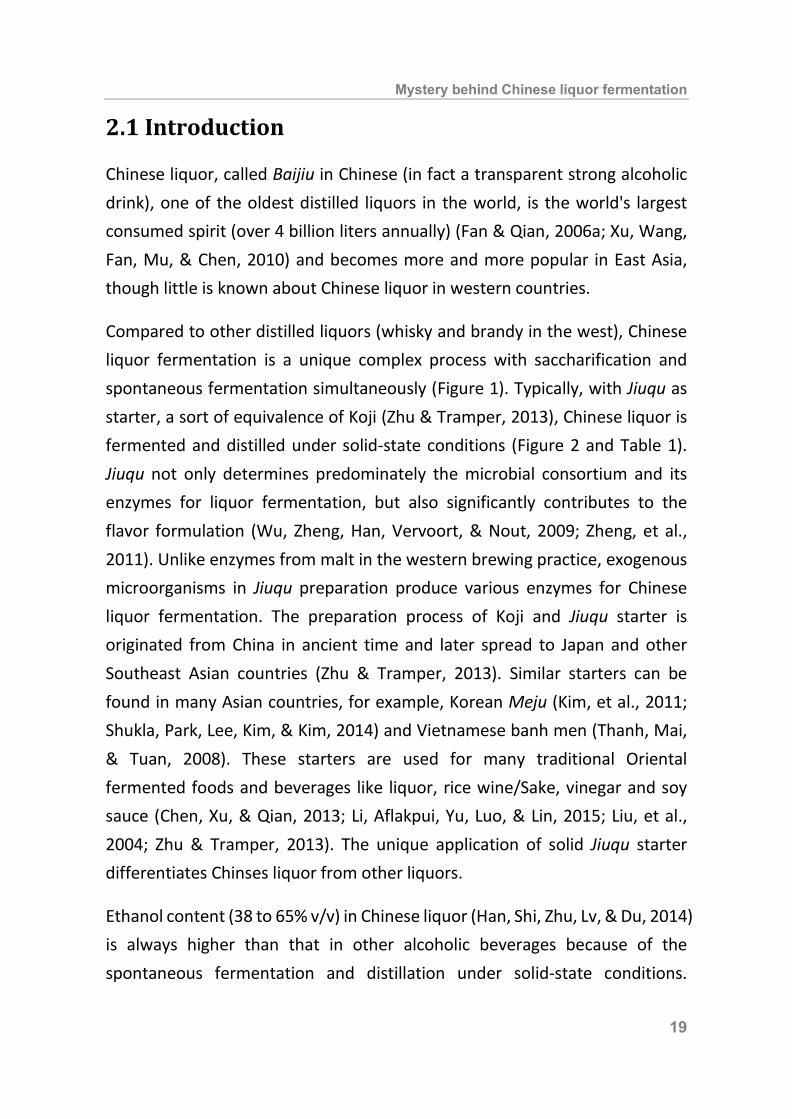
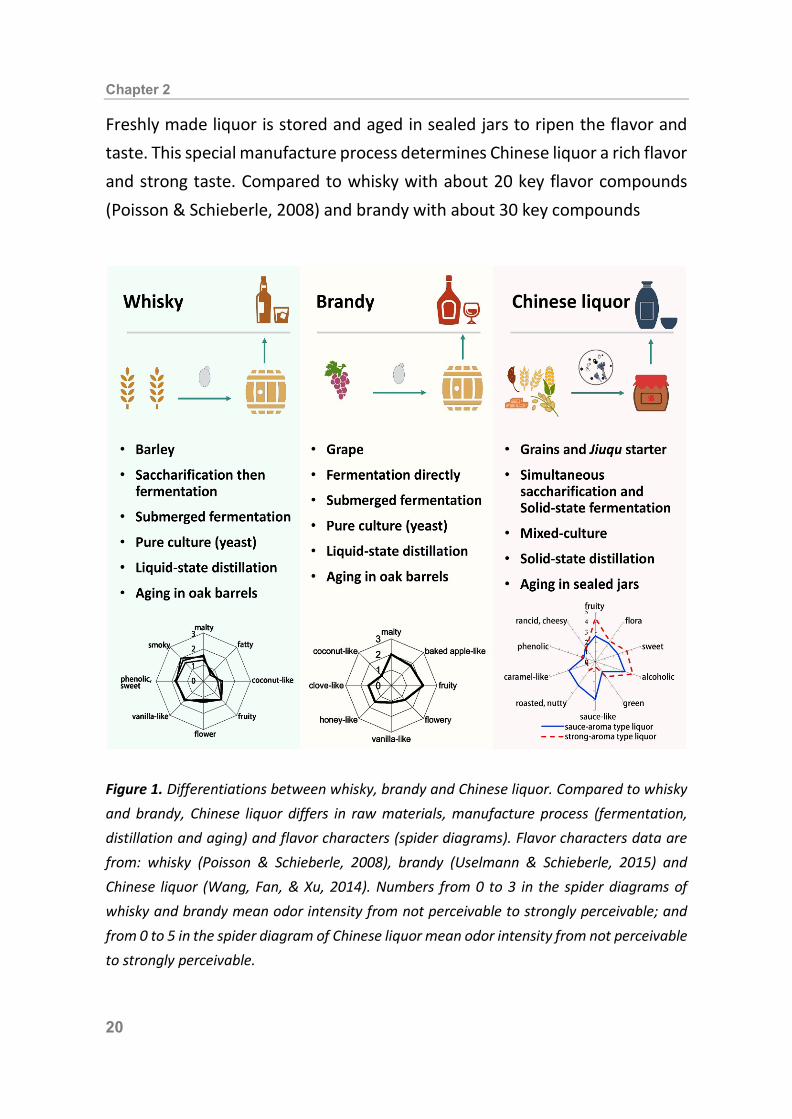
2.1 Introduction Chinese liquor, called Baijiu in Chinese (in fact a transparent strong alcoholic drink), one of the oldest distilled liquors in the world, is the world's largest consumed spirit (over 4 billion liters annually) (Fan & Qian, 2006a; Xu, Wang, Fan, Mu, & Chen, 2010) and becomes more and more popular in East Asia, though little is known about Chinese liquor in western countries. Compared to other distilled liquors (whisky and brandy in the west), Chinese liquor fermentation is a unique complex process with saccharification and spontaneous fermentation simultaneously (Figure 1). Typically, with Jiuqu as starter, a sort of equivalence of Koji (Zhu & Tramper, 2013), Chinese liquor is fermented and distilled under solid-state conditions (Figure 2 and Table 1). Jiuqu not only determines predominately the microbial consortium and its enzymes for liquor fermentation, but also significantly contributes to the flavor formulation (Wu, Zheng, Han, Vervoort, & Nout, 2009; Zheng, et al., 2011). Unlike enzymes from malt in the western brewing practice, exogenous microorganisms in Jiuqu preparation produce various enzymes for Chinese liquor fermentation. The preparation process of Koji and Jiuqu starter is originated from China in ancient time and later spread to Japan and other Southeast Asian countries (Zhu & Tramper, 2013). Similar starters can be found in many Asian countries, for example, Korean Meju (Kim, et al., 2011; Shukla, Park, Lee, Kim, & Kim, 2014) and Vietnamese banh men (Thanh, Mai, & Tuan, 2008). These starters are used for many traditional Oriental fermented foods and beverages like liquor, rice wine/Sake, vinegar and soy sauce (Chen, Xu, & Qian, 2013; Li, Aflakpui, Yu, Luo, & Lin, 2015; Liu, et al., 2004; Zhu & Tramper, 2013). The unique application of solid Jiuqu starter differentiates Chinses liquor from other liquors. Ethanol content (38 to 65% v/v) in Chinese liquor (Han, Shi, Zhu, Lv, & Du, 2014) is always higher than that in other alcoholic beverages because of the spontaneous fermentation and distillation under solid-state conditions.
Chapter 2
20
Freshly made liquor is stored and aged in sealed jars to ripen the flavor and taste. This special manufacture process determines Chinese liquor a rich flavor and strong taste. Compared to whisky with about 20 key flavor compounds (Poisson & Schieberle, 2008) and brandy with about 30 key compounds
Figure 1. Differentiations between whisky, brandy and Chinese liquor. Compared to whisky and brandy, Chinese liquor differs in raw materials, manufacture process (fermentation, distillation and aging) and flavor characters (spider diagrams). Flavor characters data are from: whisky (Poisson & Schieberle, 2008), brandy (Uselmann & Schieberle, 2015) and Chinese liquor (Wang, Fan, & Xu, 2014). Numbers from 0 to 3 in the spider diagrams of whisky and brandy mean odor intensity from not perceivable to strongly perceivable; and from 0 to 5 in the spider diagram of Chinese liquor mean odor intensity from not perceivable to strongly perceivable.
Mystery behind Chinese liquor fermentation
21
(Poisson & Schieberle, 2008) and brandy with about 30 key flavor compounds (Uselmann & Schieberle, 2015), Chinese liquor has over 60 key flavor compounds (Wang, et al., 2014).
Figure 2. Schema of traditional repeated-batch process of Chinese liquor. Grains, mainly sorghum (and/or wheat, corn, rice and sticky rice) are soaked in hot water (about 95 °C)
until the water content reaches 55% (w/w), mixed with fermented grains of the last batch
from the pit and previously steamed rice husk, and the ratio depends on different batch and
process, for example about 2:9:4 (w/w/w) during strong aroma liquor fermentation. The mixture is spade up to Zeng (special designed distiller) for alcohol distillation and cooking
the grains simultaneously. Fresh liquor is gathered in a pottery jar or stainless-steel vessel
for storage. After aged for years, liquors are rated for blending different grade of products. The distilled grains are cooled to 13 to 16 °C and mixed with the Daqu powder (new
inoculator), then fermented in the pit for the following batch. Alternatively, part of the
fermented grains is distilled without adding freshly soaked grains and the distilled grain is used as fertilizer or feed.
Chapter 2
22
Every region in China has its own local special liquor flavor style and brand (Wang, Li, Qi, Li, & Pan, 2015). Along with the progress of civilization and welfare, fermented alcoholic beverages act a pivotal role in human social activities and technology (Libkind, et al., 2011; McGovern, et al., 2004). Chinese liquor becomes an important aspect of Chinese culture for happiness and auspiciousness (Hao, Chen, & Su, 2005). Normally consumed “neat”, Chinese liquor can always be seen at many occasions like wedding, business occasions, parties and celebrations in our daily lives. The repeated-batch fermentation (Figure 2) is a complex process with saccharification and spontaneous fermentation simultaneously (Chen, Wu, & Xu, 2014). However, this rather old and some-how empirical fermentation process, though surprisingly still widely practiced in China, is facing the challenge of modification, standardization and optimization. Some issues are associated with food quality, safety, sustainability and modern industrial improvement. Therefore, it is necessary to completely study this process, move from poorly controlled spontaneous fermentation to an inoculated fermentation under process control. 2.2 Chinese liquor
2.2.1 Traditional process Traditional process of Chinese liquor includes starter (Jiuqu) preparation, substrate hydrolysis, liquor fermentation, solid-state distillation, aging and blending. These special long manufacture processes under semi-controlled conditions are unique compared with any other food and beverage fermentations. For centuries, operations are considered rather an art based on generations’ experience than a technology. We describe the traditional process below. Starter preparation Starter Jiuqu, is in the Chinese language composed of two characters, the first

Tabl
e 1.
Div
ersit
y of
Jiuq
u (s
tart
er)
Jiuqu
* Ty
pe
Raw
mat
eria
l (s)
Dom
inan
t mic
roor
gani
sms
Mai
n fla
vor
com
poun
ds o
r pr
ecur
sors
Refe
renc
es
Daqu
Hi
gh-
tem
pera
ture
(6
0-70
°C)
Whe
at
Mol
ds: T
herm
oasc
us c
rust
aceu
s, M
ucor
race
mos
us,
Ther
mom
yces
lanu
gino
sus.
Ye
asts
: Han
seni
aspo
ra u
varu
m, S
acch
arom
yces
ce
revi
siae,
Han
senu
la sp
., Ca
ndid
a sp
., Pi
chia
To
rula
spor
a.
Bact
eria
: Bac
illus
(B. s
ubtil
is, B
. lic
heni
form
is, B
. am
ylol
ique
faci
ens,
B. s
onor
ensis
), la
ctic
aci
d ba
cter
ia
(Wei
ssel
la c
ibar
ia, W
eiss
ella
thai
land
ensis
, La
ctob
acill
us b
uchn
eri,
Lact
ococ
cus l
actis
), M
icro
bact
eriu
m te
stac
eum
, Sac
char
opol
yspo
ra sp
., Th
erm
oact
inom
yces
sang
uini
s , R
ubel
limic
robi
um sp
.
Tetr
amet
hylp
yraz
ine,
gu
aiac
ol, 4
-vin
yl
guai
acol
, ph
enyl
etha
nol
prop
anoi
c ac
id, 1
,3-
buta
nedi
ol, a
cetic
ac
id, m
ethy
l est
er
etc.
(Gao
, Wan
g, &
Xu
, 201
0; L
i, Li
an,
Ding
, Nie
, &
Zhan
g, 2
014;
Liu
, Gu
o, &
Zha
ng,
2012
; Wan
g, S
hi,
& G
ong,
200
8;
Wu,
et a
l., 2
009;
Zh
eng,
et a
l.,
2015
)
Med
ium
-te
mpe
ratu
re
(50-
60°C
)
Whe
at, b
arle
y an
d pe
a M
olds
: Rhi
zom
ucor
mie
hei,
Absid
ia b
lake
sleea
na,
Aspe
rgill
us te
rreu
s.
Yeas
ts: S
acch
arom
ycop
sis fi
bulig
era,
Pic
hia
anom
ala,
Sa
ccha
rom
yces
exi
guou
s.
Bact
eria
: Bac
illus
lich
enifo
rmis,
Lic
hthe
imia
ram
ose,
W
eiss
ella
cib
aria
, Lac
toba
cillu
s hel
vetic
us,
Lact
obac
illus
ferm
entu
m, L
acto
baci
llus p
anis.
Tetr
adec
anoi
c ac
id
ethy
l est
er, e
thyl
9-
hexa
dece
noat
e,
pyra
zines
, gua
iaco
l, ca
ryop
hylle
ne, a
nd
phen
ylet
hyl a
lcoh
ol
etc.
(Gao
, et a
l., 2
010;
W
ang,
Gao
, Fan
, &
Xu,
201
1; W
u,
et a
l., 2
009;
Zh
eng,
et a
l.,
2015
)
Mystery behind Chinese liquor fermentation
23
* Type
def
initi
on is
bas
ed o
n Da
qu m
axim
um te
mpe
ratu
re c
ause
d by
mic
robi
al m
etab
olic
hea
t and
mea
sure
d in
side
in th
e Jiu
qu m
atrix
.
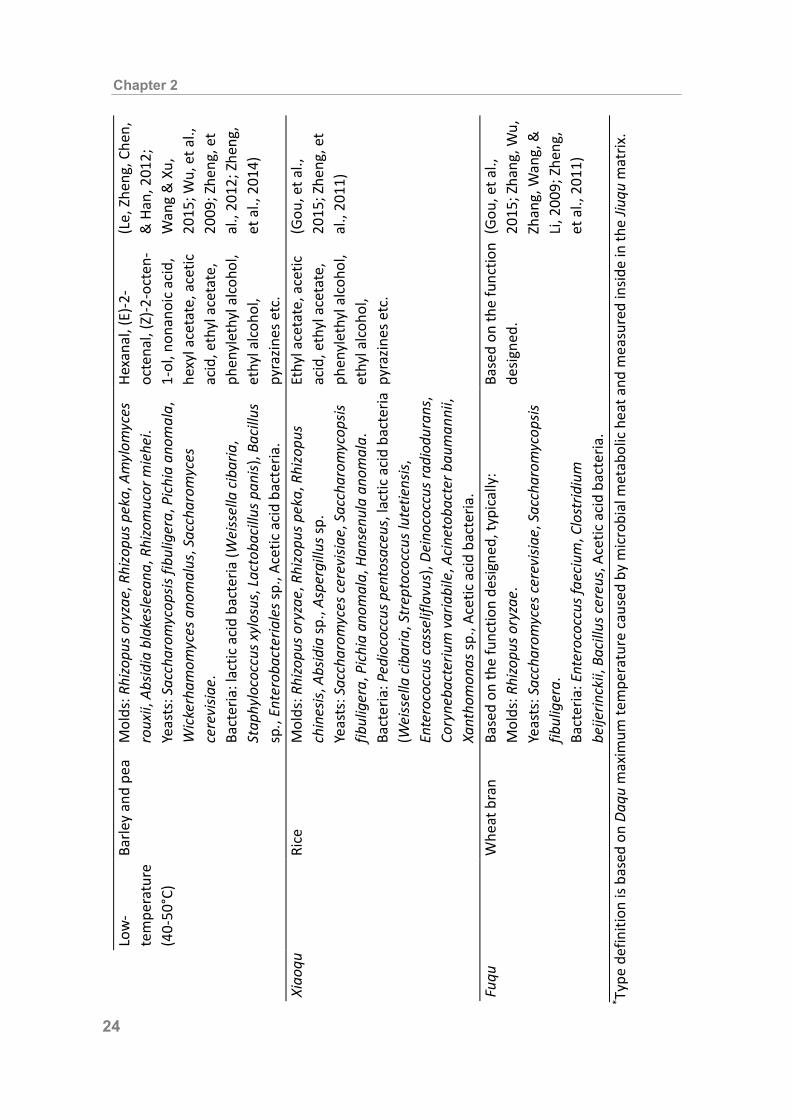
Low
-te
mpe
ratu
re
(40-
50°C
)
Barle
y an
d pe
a M
olds
: Rhi
zopu
s ory
zae,
Rhi
zopu
s pek
a, A
myl
omyc
es
roux
ii, A
bsid
ia b
lake
sleea
na, R
hizo
muc
or m
iehe
i. Ye
asts
: Sac
char
omyc
opsis
fibu
liger
a, P
ichi
a an
omal
a,
Wic
kerh
amom
yces
ano
mal
us, S
acch
arom
yces
ce
revi
siae.
Ba
cter
ia: l
actic
aci
d ba
cter
ia (W
eiss
ella
cib
aria
, St
aphy
loco
ccus
xyl
osus
, Lac
toba
cillu
s pan
is), B
acill
us
sp.,
Ente
roba
cter
iale
s sp.
, Ace
tic a
cid
bact
eria
.
Hexa
nal,
(E)-2
-oc
tena
l, (Z
)-2-o
cten
-1-
ol, n
onan
oic
acid
,he
xyl a
ceta
te, a
cetic
acid
, eth
yl a
ceta
te,
phen
ylet
hyl a
lcoh
ol,
ethy
l alc
ohol
,py
razin
es e
tc.
(Le,
Zhe
ng, C
hen,
&
Han
, 201
2;
Wan
g &
Xu,
20
15; W
u, e
t al.,
20
09; Z
heng
, et
al.,
2012
; Zhe
ng,
et a
l., 2
014)
Xiao
qu
Rice
M
olds
: Rhi
zopu
s ory
zae,
Rhi
zopu
s pek
a, R
hizo
pus
chin
esis,
Abs
idia
sp.,
Aspe
rgill
us sp
. Ye
asts
: Sac
char
omyc
es c
erev
isiae
, Sac
char
omyc
opsis
fib
ulig
era,
Pic
hia
anom
ala,
Han
senu
la a
nom
ala.
Ba
cter
ia: P
edio
cocc
us p
ento
sace
us, l
actic
aci
d ba
cter
ia
(Wei
ssel
la c
ibar
ia, S
trep
toco
ccus
lute
tiens
is,
Ente
roco
ccus
cas
selif
lavu
s), D
eino
cocc
us ra
diod
uran
s,
Cory
neba
cter
ium
var
iabi
le, A
cine
toba
cter
bau
man
nii,
Xant
hom
onas
sp.,
Acet
ic a
cid
bact
eria
.
Ethy
l ace
tate
, ace
tic
acid
, eth
yl a
ceta
te,
phen
ylet
hyl a
lcoh
ol,
ethy
l alc
ohol
, py
razin
es e
tc.
(Gou
, et a
l.,
2015
; Zhe
ng, e
t al
., 20
11)
Fuqu
W
heat
bra
n Ba
sed
on th
e fu
nctio
n de
signe
d, ty
pica
lly:
Mol
ds: R
hizo
pus o
ryza
e.
Yeas
ts: S
acch
arom
yces
cer
evisi
ae, S
acch
arom
ycop
sis
fibul
iger
a.
Bact
eria
: Ent
eroc
occu
s fae
cium
, Clo
strid
ium
be
ijerin
ckii,
Bac
illus
cer
eus,
Ace
tic a
cid
bact
eria
.
Base
d on
the
func
tion
desig
ned.
(G
ou, e
t al.,
20
15; Z
hang
, Wu,
Zh
ang,
Wan
g, &
Li
, 200
9; Z
heng
, et
al.,
201
1)
Chapter 2
24
Tabl
e 2.
Div
ersit
y of
Chi
nese
liqu
or
Type
Fl
avor
ch
arac
ter
Raw
m
ater
ials
Ferm
enta
tion
proc
ess
Dom
inan
t fun
ctio
nal
mic
roor
gani
sms
Mai
n fla
vor c
ompo
unds
Re
fere
nces
Sauc
e-ar
oma
Sauc
e-lik
e,
roas
ted
arom
a
High
-te
mpe
ratu
re
Daqu
, so
rghu
m
Heap
fe
rmen
tatio
n th
en
repe
ated
-bat
ch
ferm
enta
tion
in
pit
Mol
ds: P
aeci
lom
yces
var
iotii
, As
perg
illus
ory
zae,
Asp
ergi
llus
terr
eus.
Ye
asts
: Zyg
osac
char
omyc
es b
ailii
, Sa
ccha
rom
yces
cer
evisi
ae, P
ichi
a m
embr
anifa
cien
s,
Schi
zosa
ccha
rom
yces
pom
be.
Bact
eria
: Lac
toba
cillu
s sp.
, Ba
cillu
s sp.
Clo
strid
ium
klu
yver
i.
Ethy
l hex
anoa
te, h
exan
oic
acid
, 3-m
ethy
lbut
anoi
c ac
id,
3-m
ethy
lbut
anol
, pyr
azin
es,
ethy
l 2-p
heny
lace
tate
, 2-
phen
ylet
hyl a
ceta
te, e
thyl
3-ph
enyl
prop
anoa
te, 4
-m
ethy
lgua
iaco
l and
γ-
deca
lact
one
(Che
n, e
t al.,
20
14; C
heng
, Fa
n, &
Xu,
201
3;
Fan,
She
n, &
Xu,
20
11; F
an, X
u, &
Zh
ang,
200
7;
Wu,
Che
n, &
Xu,
20
13; W
u &
Xu,
20
12; W
u,
Zhan
g, P
eng,
&
Xu, 2
015;
Zhu
, et
al.,
200
7)
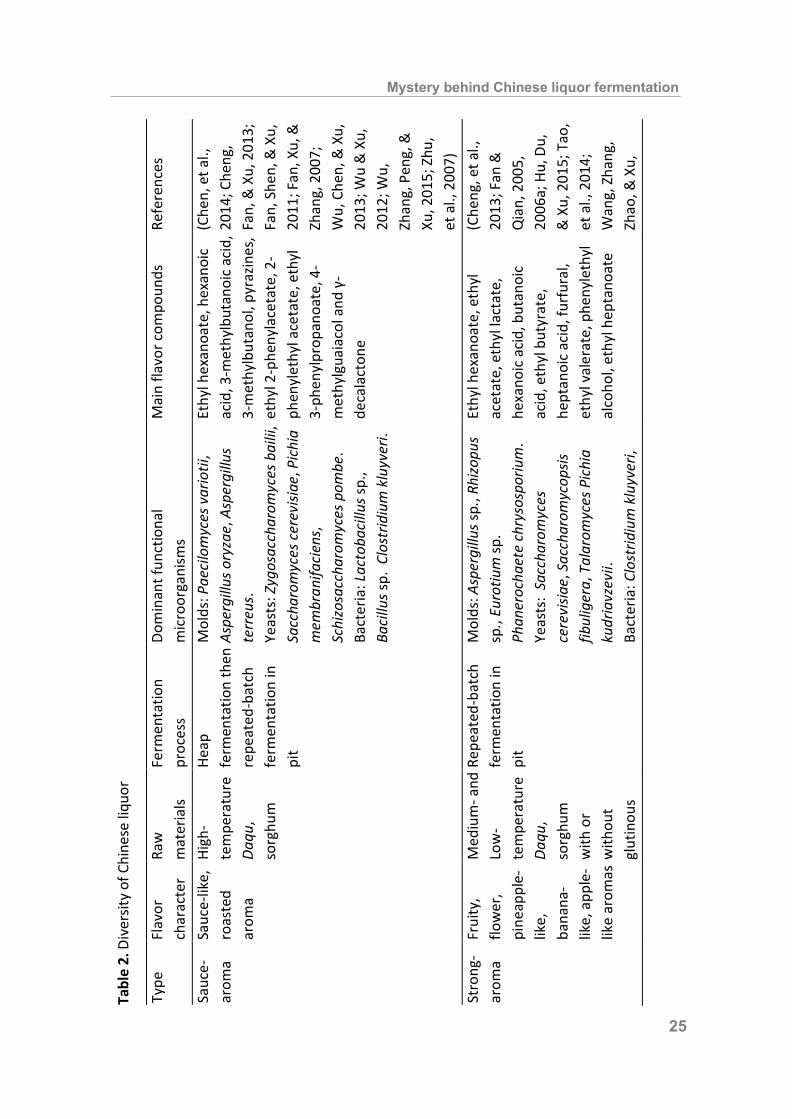
Stro
ng-
arom
a Fr
uity
, flo
wer
, pi
neap
ple-
like,
ba
nana
-lik
e, a
pple
-lik
e ar
omas
Med
ium
- and
Lo
w-
tem
pera
ture
Da
qu,
sorg
hum
w
ith o
r w
ithou
t gl
utin
ous
Repe
ated
-bat
ch
ferm
enta
tion
in
pit
Mol
ds: A
sper
gillu
s sp.
, Rhi
zopu
s sp
., Eu
rotiu
m sp
. Ph
aner
ocha
ete
chry
sosp
oriu
m.
Yeas
ts:
Sacc
haro
myc
es
cere
visia
e, S
acch
arom
ycop
sis
fibul
iger
a, T
alar
omyc
es P
ichi
a ku
dria
vzev
ii.
Bact
eria
: Clo
strid
ium
klu
yver
i,
Ethy
l hex
anoa
te, e
thyl
ac
etat
e, e
thyl
lact
ate,
he
xano
ic a
cid,
but
anoi
c ac
id, e
thyl
but
yrat
e,
hept
anoi
c ac
id, f
urfu
ral,
ethy
l val
erat
e, p
heny
leth
yl
alco
hol,
ethy
l hep
tano
ate
(Che
ng, e
t al.,
20
13; F
an &
Q
ian,
200
5,
2006
a; H
u, D
u,
& X
u, 2
015;
Tao
, et
al.,
201
4;
Wan
g, Z
hang
, Zh
ao, &
Xu,
Mystery behind Chinese liquor fermentation
25
rice,
rice
, w
heat
and
co
rn
Burk
hold
eria
sp.,
Stre
ptoc
occu
s sp
., La
ctob
acill
us sp
., La
ctob
acill
acea
e sp
.
2008
; Xia
ng, e
t al
., 20
13; Y
ao, e
t al
., 20
15; Z
hang
, et
al.,
200
7)
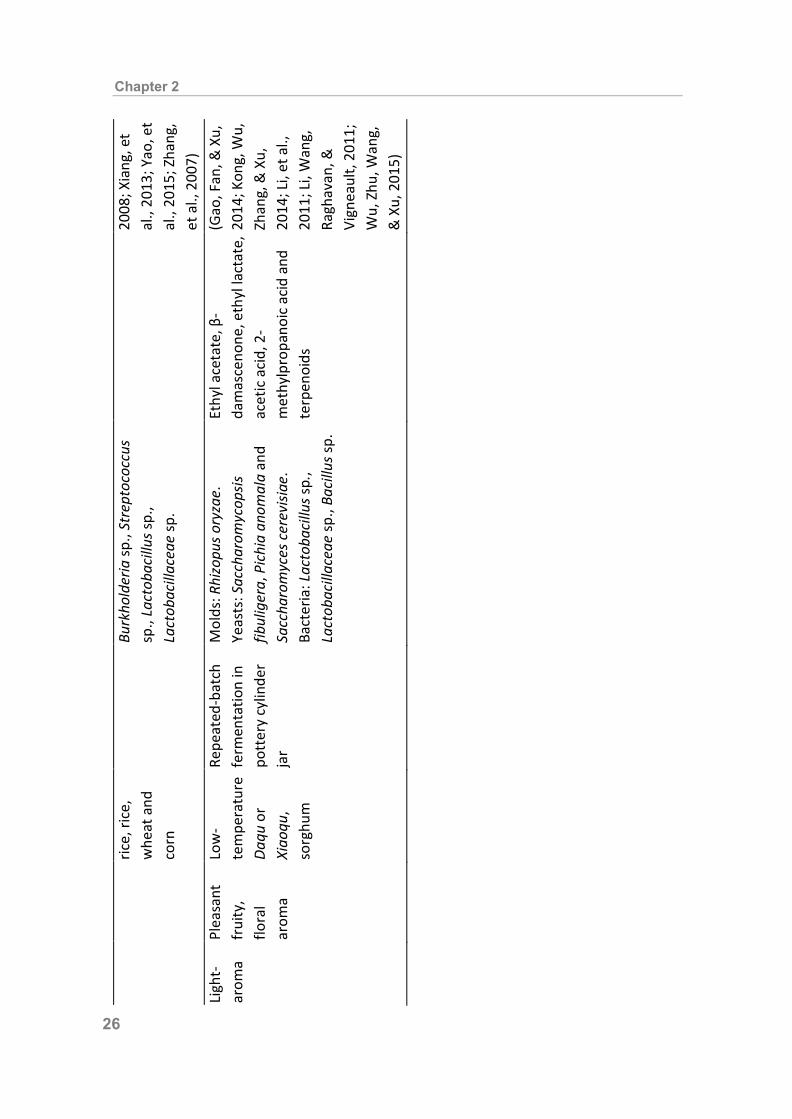
Ligh
t-ar
oma
Plea
sant
fr
uity
, flo
ral
arom
a
Low
-te
mpe
ratu
re
Daqu
or
Xiao
qu,
sorg
hum
Repe
ated
-bat
ch
ferm
enta
tion
in
pott
ery
cylin
der
jar
Mol
ds: R
hizo
pus o
ryza
e.
Yeas
ts: S
acch
arom
ycop
sis
fibul
iger
a, P
ichi
a an
omal
a an
d Sa
ccha
rom
yces
cer
evisi
ae.
Bact
eria
: Lac
toba
cillu
s sp.
, La
ctob
acill
acea
e sp
., Ba
cillu
s sp.
Ethy
l ace
tate
, β-
dam
asce
none
, eth
yl la
ctat
e,
acet
ic a
cid,
2-
met
hylp
ropa
noic
aci
d an
d te
rpen
oids
(Gao
, Fan
, & X
u,
2014
; Kon
g, W
u,
Zhan
g, &
Xu,
20
14; L
i, et
al.,
20
11; L
i, W
ang,
Ra
ghav
an, &
Vi
gnea
ult,
2011
; W
u, Z
hu, W
ang,
&
Xu,
201
5)
Chapter 2
26
Mystery behind Chinese liquor fermentation
27
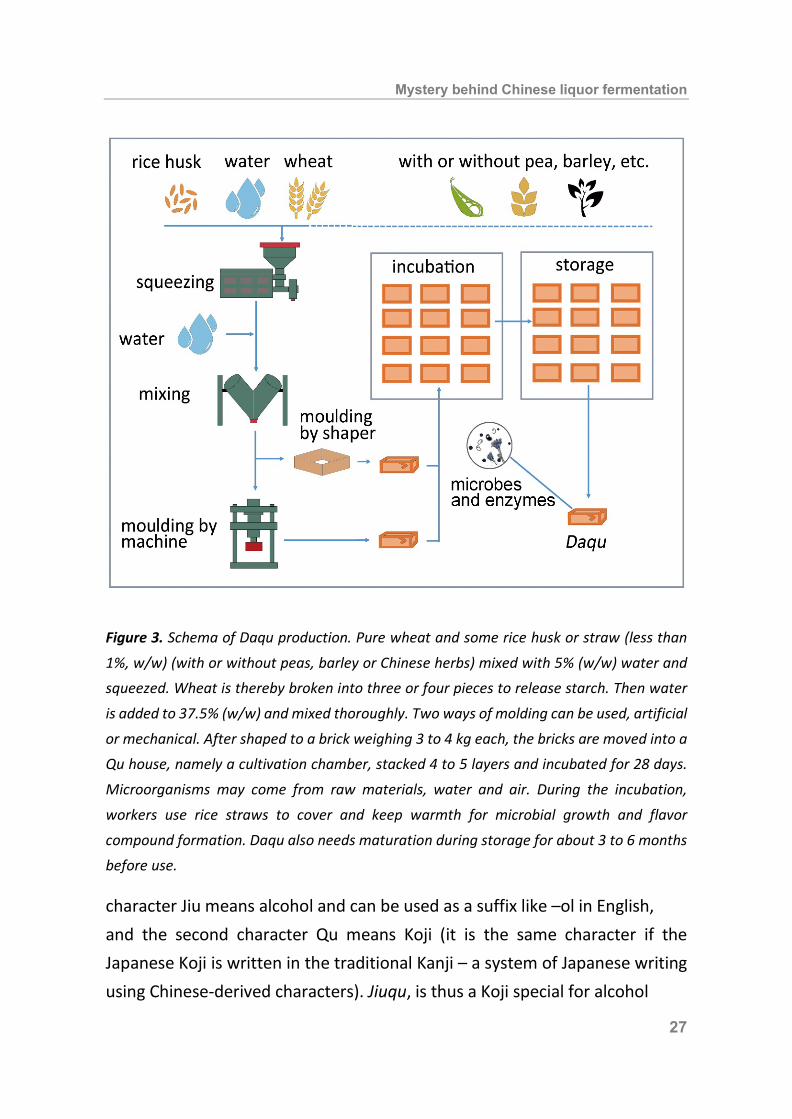
Figure 3. Schema of Daqu production. Pure wheat and some rice husk or straw (less than
1%, w/w) (with or without peas, barley or Chinese herbs) mixed with 5% (w/w) water and squeezed. Wheat is thereby broken into three or four pieces to release starch. Then water
is added to 37.5% (w/w) and mixed thoroughly. Two ways of molding can be used, artificial
or mechanical. After shaped to a brick weighing 3 to 4 kg each, the bricks are moved into a Qu house, namely a cultivation chamber, stacked 4 to 5 layers and incubated for 28 days.
Microorganisms may come from raw materials, water and air. During the incubation,
workers use rice straws to cover and keep warmth for microbial growth and flavor
compound formation. Daqu also needs maturation during storage for about 3 to 6 months before use. character Jiu means alcohol and can be used as a suffix like –ol in English, and the second character Qu means Koji (it is the same character if the Japanese Koji is written in the traditional Kanji – a system of Japanese writing using Chinese-derived characters). Jiuqu, is thus a Koji special for alcohol

Chapter 2
28
beverages, and serves as starter and part of raw material for liquor or rice wine (Figure 2 and Table 2) (Chen, et al., 2013; Xu, et al., 2010). Daqu, a typical derivate of Jiuqu, is the most commonly used Jiuqu starter and the preparation of Daqu is an important process to enrich microorganisms from the environment to produce enzymes for liquor fermentation (Zheng, et al., 2011; Zhu, Wu, Luo, & Gao, 2015; Zhu & Tramper, 2013). The production process of Daqu is a special solid-state fermentation process in an open system, which includes ingredient formulation, shaping, incubation in Qu-house (a cultivation chamber with controlled temperature and moisture if possible) and maturation during storage (Figure 3). Fermentation and distillation The actual alcoholic fermentation process happens in a special fermentation pit (about 3.4 m long, 1.8 m wide, and 2.0 m deep, and some manufacturers use pottery cylinder jars instead) between 28 and 32 °C for 60 days under anaerobic solid-state conditions (Xu, et al., 2010). Jiuqu, enriched with various microorganisms including molds, yeasts and bacteria, and various enzymes thereof, hydrolyses raw materials and converts them to ethanol and flavor compounds. Repeated-batch process is widely used for liquor production (Figure 2). Fermented grains are mixed with soaked fresh grains in proper ratio and directly distilled under solid-state condition. This distillation has in fact the double effect, namely (1) distil ethanol and flavor compounds from fermented grains and (2) cook the fresh grains to make them accessible for microorganisms and enzymes. Fresh liquor is collected from condensate pipe for further grading, storage and blending. Subsequently, a wide variety of liquor product is formed with different flavor characters and ready for consumption. 2.2.2 Diversity of Chinese liquor Various liquors have a wide range of diff-typical flavor characteristics and
Mystery behind Chinese liquor fermentation
29
tastes, due to differences in Jiuqu starters, raw materials (sorghum, wheat, corn, rice, sticky rice and rice hull, all can be influenced by season, weather, storage, transport and location), manufacture processes without strict control, locations that determine the natural microorganisms, and different consumers’ preferences (Fan & Qian, 2006b; Xu, et al., 2010) The starter Jiuqu can be sorted into Daqu, Xiaoqu and Fuqu, respectively with meaning in Chinese as big Koji, small Koji and bran Koji (Gou, et al., 2015). Daqu can be classified into different types based on different process parameters such as the maximum temperature caused by microbial metabolic heat accumulated inside the Jiuqu matrix (Table 1). As shown in Table 1, temperature can strongly affect the dominating microorganisms enriched. Enzymes in Jiuqu mainly include amylases, protease and glucoamylase (Su, et al., 2015; Zheng, et al., 2011). Based on flavor characters, the aroma types of Chinese liquor can be sorted into sauce-aroma type, strong-aroma type, light-aroma type, sweet honey type and miscellaneous types (Fan, Fan, & Xu, 2015; Fan & Qian, 2006a). Among these, the first three types dominate the market and they all have their own characters. Table 2 gives an overview of these three types of Chinese liquor. 2.3 Industrial challenge Chinese liquor has been consumed for millennia and old traditions of fermentation practices are well preserved. The consumption grows rapidly during last decades with ever increasing living standard and welfare. However, the existing challenges of food quality, safety and modern industrial development are receiving increasing attention. 2.3.1 Risks in quality and safety Food quality concern Insufficient standardization of raw materials and poorly controlled

Chapter 2
30
fermentation process may cause serious quality defect and instability even though the final liquor product might be treated with blending. For example, earthy-odor of geosmin from Streptomyces community in Daqu causes serious sensory defects (Du, Fan, & Xu, 2011), though this can be controlled by two Bacillus strains (Zhi, Wu, Du, & Xu, 2016). Off-flavor problems like musty and feculent odor (Du, et al., 2011), and bad tastes like bitter taste, are far from being solved. In addition, as one of the most widely consumed alcoholic beverages, the price of Chinese liquor might vary from several to hundreds of US dollars per liter. The extremely high price for commercial interest results in some inferior or even fake products to appear on the market that hurt consumers’ benefit and eventually also health when uncontrolled ingredients are added (Li, et al., 2014; Zhen, et al., 2013). Grade identification, authenticity and quality control are of great importance to protect the interests of producers and consumers. Therefore, volatiles-based discrimination methods were developed, including spectroscopy (Cheng, et al., 2013; Dong, et al., 2014; Li, et al., 2014; Z. Li, et al., 2014; Sun, Li, Wei, Zhou, & Noda, 2006; Zhu, Fan, Xu, & Zhou, 2016), electronic nose (Zhou, et al., 2011) and colorimetric artificial nose (Qin, et al., 2012; Ya, et al., 2012). Food traceability is also available for overall control (Badia-Melis, Mishra, & Ruiz-Garcia, 2015). The protection of geographically famous brand of Chinese liquor is receiving more and more attention to protect the interest of consumers and producers (Qin, et al., 2012). Though all these attempts are reliable and effective for identification, authentication and evaluation, these efforts cannot completely solve quality and forgery problems. Quality instability of traditional process needs to revolutionize for quality and safety by modern standard, validated and sustainable manufacture process.
Mystery behind Chinese liquor fermentation
31
Food safety risk Some toxins may be formed during storage of fresh liquor to affect food safety. Ethyl carbamate is genotoxic and carcinogenetic, widely spread in alcoholic beverages and fermented foods, very toxic and harmful to human health (Lim & Lee, 2011; Zhao, et al., 2013). Ethyl carbamate is formed by urea, cyanide and ethanol that all exist in liquor, and also found in some Chinese liquor (Wu, Pan, Wang, Shen, & Yang, 2012; Xia, et al., 2014). Fermentation techniques and chemical compounds all can be responsible for ethyl carbamate formation (Zhao, et al., 2013). An HPLC-FLD method detected and proved that ethyl carbamate is mainly produced during storage at higher storage temperature (Li, et al., 2015) with hydrocyanic acid as precursor and raw materials. Optimized storage condition as well as efficient detection and elimination techniques are needed to prevent the accumulation of ethyl carbamate in Chinese liquor. The open and spontaneous fermentation of Chinese liquor may risk the contamination of microbial toxin. For example, Ochratoxin A, a ubiquitous mycotoxin produced by certain filamentous species of Aspergillus and Penicillium that can be found in starter Jiuqu and Chinese liquor fermentation environment, was detected in 9 of 76 liquor samples with a maximum concentration of 0.17 μg/L (Zhu, Ren, Nie, & Xu, 2016). Another example is toxoflavin produced by Burkholderia in rice straw and Daqu for sauce-aroma liquor fermentation. Over 8 mg/kg was found in Daqu sample, though no toxoflavin was detected in distilled liquor (Zhu, et al., 2015). Rice straw is widely used in starter Daqu preparation to facilitate mass, heat and gas transfer. Contamination of rice straw used for Daqu may affect food safety of the final product. For safety reasons, it is essential to ensure quality of raw material without pathogenic microorganisms and to consider degrading toxic substances when they exist in the raw materials. Higher-alcohols like isobutanol and isoamyl exist in many alcoholic drinks and contribute to the flavor and taste of Chinese liquor, though they are potential
Chapter 2
32
health hazard in excess amount (Han, et al., 2014). The content of higher-alcohols in Chinese liquor is about 0.6 to 1.2 g/L (Zhang, et al., 2009). Attempts were made to reduce higher-alcohols, for example, enzymes extracted from Fuji SA-IEP apple peels can reduce higher alcohols in Chinese liquor very effectively (Han, et al., 2014). Study shows that mixed starter results in relatively lower higher-alcohols, but a thinner taste and flavor (Zhang, et al., 2009). Thus, the content of higher alcohol should be controlled within an appropriate range. 2.3.2 Environmental issues Environmental issues are increasingly important for the food industry concerning waste management, water consumption and energy efficiency (Alsaffar, 2016; Broadbent, 1973; Hall & Howe, 2012). Chinese liquor industry, as mentioned earlier, is still mainly a traditional and primitive process with poorly controlled fermentation, distillation, and blending. Chinese liquor industry recognizes the urgency of cleaner production, efficient water use and energy recycling but substantial change is still to realize (Huang, Sun, & Su, 2014). Furthermore, suspicions exist that local environment change might affect indigenous microorganisms thereby to affect product quality and safety as well as productivity. This conservative belief and practice can hardly be changed before convincible scientific principles behind the traditional process are released. Modernization of Chinese liquor industry needs advanced environment-friendly processes, especially energy and waste management to balance sustainability. 2.3.3 Valorization of wastes and by-product Waste and by-product from food industry can be renewable resources and have great potential to produce value-added product (Federici, Fava, Kalogerakis, & Mantzavinos, 2009; Koutinas, et al., 2014). Distilled grain residue is the main solid waste, consisting carbohydrates, proteins, lipids and some valuable microbial metabolites, though nowadays simply used as feed,

Mystery behind Chinese liquor fermentation
33
fertilizer or culture substrate for edible mushrooms (Xu, Xu, Tao, Yuan, & Gao, 2015). Bioethanol production can be one of the possibilities to valorize liquor distillation wastes (Liu, Wu, Yang, Yuan, & Zhang, 2014; Tan, et al., 2014). For example, after H2SO4 saccharification and fermentation, an ethanol yield of 91.9–98.9% based on glucose concentration was obtained (Tan, et al., 2014). Recovery of flavor compounds from distilled solid waste is also attractive. By using supercritical carbon dioxide extraction, 55.17 g ethyl (9Z)-9-octadecenoate per liter extract was obtained and can be used as solvent and food additive (Xu, et al., 2015). However, valorization of waste and by-product in Chinese liquor industry is still at a pioneering stage and the complex process causes inefficiency and embarrassment of the traditional industry. Modern industry, modern biotechnology, and sustainable development will enforce the progress in this sector. 2.3.4 Traditional process facing modern industrial challenge Many drawbacks in the traditional fermentation are directly or indirectly caused by lack of control and standardization. No exception also in this sector, modern industrial development is imperative. Traditional fermentation process evolution and modernization succeeded in many fermented foods, such as soy sauce in the East (Zhu & Tramper, 2013) and cheese in the West (Settanni & Moschetti, 2010; Tramper & Zhu, 2011). The traditional fermentation and manufacturing methods exist for centuries and strongly rely on personal operation skills and experience of individuals. Figure 4a gives a glimpse of an old producing site (over 400 years) from Luzhou Laojiao Museum. In an empirical manufacture process, individual capability and skills, as well as raw materials, environment and climate factors, can affect the productivity and quality consistency. In the last few decades, developments in modern biotechnology and related fields improved the traditional methods and led to numerous technological innovations. Many breweries in the Chinese liquor industry have transformed to semi-mechanized operations (Figure 4b), but still a considerable percentage remain
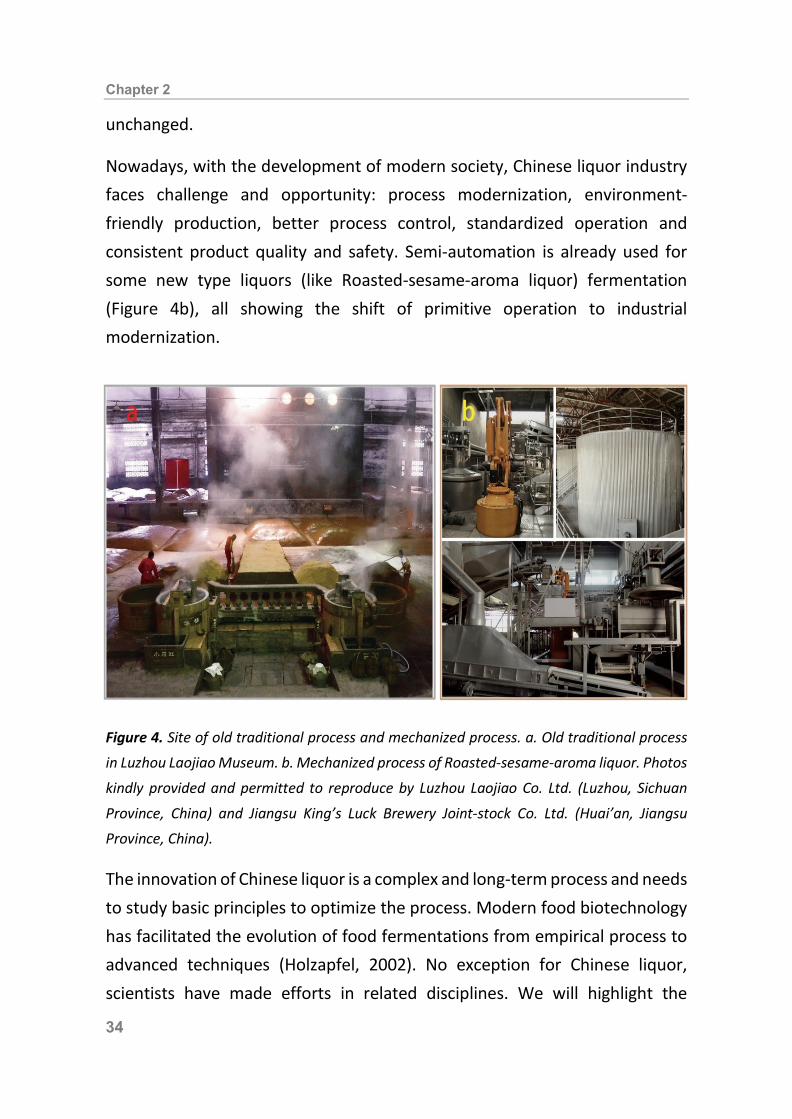
Chapter 2
34
unchanged. Nowadays, with the development of modern society, Chinese liquor industry faces challenge and opportunity: process modernization, environment-friendly production, better process control, standardized operation and consistent product quality and safety. Semi-automation is already used for some new type liquors (like Roasted-sesame-aroma liquor) fermentation (Figure 4b), all showing the shift of primitive operation to industrial modernization.
Figure 4. Site of old traditional process and mechanized process. a. Old traditional process in Luzhou Laojiao Museum. b. Mechanized process of Roasted-sesame-aroma liquor. Photos
kindly provided and permitted to reproduce by Luzhou Laojiao Co. Ltd. (Luzhou, Sichuan
Province, China) and Jiangsu King’s Luck Brewery Joint-stock Co. Ltd. (Huai’an, Jiangsu Province, China). The innovation of Chinese liquor is a complex and long-term process and needs to study basic principles to optimize the process. Modern food biotechnology has facilitated the evolution of food fermentations from empirical process to advanced techniques (Holzapfel, 2002). No exception for Chinese liquor, scientists have made efforts in related disciplines. We will highlight the
Mystery behind Chinese liquor fermentation
35
advances below and meanwhile address relevant perspectives. 2.4 Progresses and perspectives Chinese liquor production covers the processes of microbial growth, enzyme production, hydrolysis, bioconversion, flavor formation, fermentation, distillation, storage and blending, covering relevant disciplines of microbiology, biotechnology, biochemistry/enzymology, food chemistry, analytical chemistry, flavor chemistry, chemical engineering and bioprocess engineering. Study on Chinese liquor began in the 1960s and had many breakthroughs in past decades. Researchers’ interests in Chinese liquor can be categorized into two main directions: flavor chemistry and the associated microbial processes under solid-state fermentation conditions. 2.4.1 Recent advances Flavor chemistry Consumer flavor sensations is the key factor that defines a successful and acceptable food product (Carrau, Gaggero, & Aguilar, 2015), and so as to Chinese liquor (Wang, et al., 2015). The quality and value of Chinese liquor are critically related to complex flavor compounds that determine the organoleptic properties though they count for only about 1 to 2% (v/v) of whole liquor (Li, Wang, et al., 2012; Li, et al., 2011). Volatile and non-volatile compounds including their interactions constitute Chinese liquor complex flavor characteristics. The study on flavors of Chinese liquor began with the identification of flavor compounds. So far more than 1000 volatile compounds have been detected in Chinese liquor including alcohols, esters, fatty acids, pyrazines and polyphenols (Wu & Xu, 2013; Zhu, et al., 2007) and new compounds continue to emerge with more advanced analytical techniques. With gas chromatography−olfactometry, quantitative measurement and flavor contribution analysis, main flavor compounds are characterized in many diff-
Chapter 2
36
flavor-types Chinese liquor (Fan, et al., 2015; Gao, et al., 2014; Wang, et al., 2014). Table 2 lists the main flavor compounds in the three dominant-aroma-type liquors. Further studies focus more on the interactions of various flavor compounds and even that between volatile and non-volatile compounds, because volatile composition alone is not enough for overall flavor construction. For example, lichenysin, a non-volatile compound (molecular weight >1000 Da.) isolated from Chinese liquor, can significantly decrease volatile phenols whereas contributes significantly to the volatility of volatile flavor components in liquor (Zhang, Wu, & Xu, 2014; Zhang, Wu, Xu, & Qian, 2014). More recently, efforts are made to clarify where the flavor compounds come from. This opens theoretically the possibility to control the profile of various compounds, volatile or non-volatile. Flavor compounds may come from raw materials, microbial metabolism and chemical reaction during fermentation, storage and formulation, as illustrated in Figure 5, the association of all factors that can affect the final flavor profile. Jiuqu starter can also partly provide flavor compounds and precursors (Table 1 and Figure 5) including pyrazines (Wu, et al., 2009), glycerol, malate, trimethylamine, mannitol, lactate (Zhang, et al., 2009), β-damascenone and 2-phenylethanol (Gao, et al., 2014). However, microbial process under solid-state fermentation plays a key role and studies are going on continuously, which we will address below. Microbial process Microbial process under solid-state fermentation determines the unique outcomes of Chinese liquor. With Jiuqu as starter that is a complex mixture of various enriched microorganisms and enzymes thereof, and influenced by factors including raw materials (grains), pit mud and the open environment (natural microflora, air and water), Chinese liquor fermentation undergoes a microbial process where microbial diversity contributes to the delicate balance and functions for stability, quality and productivity.

Mystery behind Chinese liquor fermentation
37
From the 1960s and even till rather recently, studies have focused on the separation and identification of microorganisms from samples. Most dominant functional microorganisms in the production of Jiuqu starters and Chinese liquor have been identified (Table 1 and Table 2). With the development of modern molecular biology, a more comprehensive understanding of the microbial diversity realized in the last decade. A typical example is the detection of uncultured microorganisms like Clostridia in pit mud, revealed by an improved PCR-based denaturing gradient gel electrophoresis method (Hu, Wang, Wu, & Xu, 2014). More recently, several studies were done on the sequencing of key functional microbes including Saccharomyces cerevisiae MT1 (Lu, Wu, Zhang, & Xu, 2015), Bacillus amyloliquefaciens MT45 (Zhi, Wu, & Xu, 2017) and Bacillus licheniformis CGMCC3963 (Wu, Peng, Yu, Li, & Xu, 2013) etc. The microbial community may dynamically change during fermentation (Tao, et al., 2014). For example, by studying dominant bacterial community, Zhang et al. indicate (Zhang, et al., 2005; Zhang, et al., 2007) that bacterial diversity decreases with fermentation time and finally Lactobacillus acetotolerans becomes the predominant species during strong-aroma liquor fermentation (Wang, et al., 2008). Microbial diversity has various functions, in particular in a very complex microbial system like liquor fermentation. First, diversity of microbial community accomplishes industrial microbial ecosystem (Beyter, et al., 2016), thereby provides a stable micro-environment so that various functional microorganisms can exercise respective and/or synergic functions. Second, microorganisms release diverse enzymes that influence the microbial fermentation or bioconversion and liquor flavor (Huang, Wu, & Xu, 2014). More importantly, microorganisms generate directly flavor compounds that determine the fermentation result of liquor.

Chapter 2
38
Figure 5. Association of all factors influencing Chinese liquor flavor formation. Raw materials and microbial fermentation influence flavor formation of Chinese liquor (solid-line arrows), and interactions among various factors (dashed arrows). Raw materials (including starter Jiuqu) supply flavor compounds and precursors, enzymes and microorganisms for fermentation. Microbial community produces flavor compounds and ethanol and influenced by solid-state fermentation process. Flavor compounds interact with each other and with non-volatiles. Flavor profile may dynamically change during the whole manufacture process.

Mystery behind Chinese liquor fermentation
39
For example, in situ analysis of yeast flavor metabolisms showed that Pichia anomala is responsible for ethyl lactate, octanoic acid, and ethyl tetradecanoate in light-aroma liquor (Kong, et al., 2014). Evidence from biosynthetic mechanism reveals that Saccharomyces cerevisiae can form terpenoids by using cereals containing terpenoids precursors (Wu, Zhu, et al., 2015). Also, bacteria are important for flavor formation. Microarray profiling evidences proved that heat-resistant strain Bacillus licheniformis CGMCC3962 produces metabolites like tetramethylpyrazine and 2,3-butanediol that are likely related to sauce flavor of liquor (Wu & Xu, 2012). These findings give us useful information of flavor-producing microorganisms and their metabolisms that can be potentially controlled for enhancing desired metabolites (flavors) while eliminating undesired metabolites intermediates such as off-flavors and hazards. Microbial interactions are yet another primary factor that affects the success and safety of food fermentations to obtain desired product (Ivey, Massel, & Phister, 2013; Smid & Lacroix, 2013). The interactions among different microbial strains can have both positive and negative effects. For example, the intrinsic functional yeasts contribute to flavor formation, and the extrinsic strains can regulate and improve the growth and metabolisms (Meng, et al., 2015; Wu, Kong, & Xu, 2016). However, geosmin-producing (off-flavor) Streptomyces sp. inhibits the growth of functional yeasts and molds, decreasing the formation of flavor metabolites (Du, Lu, & Xu, 2015). Moreover, microbial community structure and metabolisms are strongly influenced by external factors like environment conditions. During solid-state fermentation process, microorganisms grow and metabolize in extreme environment (extremely high local temperature due to metabolic heat production with poor heat transfer, acidic and ethanol stresses due to acid and ethanol production, low oxygen due to the lack of agitation and aeration, low water-activity due to evaporation for heat transfer and inhomogeneous due

Chapter 2
40
to lack of agitation) and evolve to exhibit unique metabolic traits. For example, Saccharomyces cerevisiae MT1 isolated from sauce-aroma liquor fermentation can simultaneously use various sugars for alcohol production (Lu, et al., 2015). Studies on microbial process give us important information of the role of a single microorganism or a microbial community in flavor formation and associated factors to affect this role. For example, mixed–culture fermentation of different combination of five dominant species proved that they can be directly used for pure-culture starter preparation of sesame-aroma liquor production (Wu, Ling, & Xu, 2014). However, current studies are mainly theoretical, thus, comprehensive studies on the roles of individual microorganism and microbial community will provide more insights and prospects. Solid-state fermentation As one of the most important environmental factors that could be theoretically well controlled, solid-state fermentation is crucial for Chinese liquor production. Compared to submerged fermentation, it is eco-friendly, resource-saving and high yielding, but difficult in upscaling and control (Nagel, Tramper, M. S. N. Bakker, & A. Rinzema, 2001b; Thomas, et al., 2013). The unique solid-state fermentation favors the formation of distinguished enzymes, higher concentration of ethanol and flavors. However, the very complicated triangle association among microbial growth and metabolism, temperature and water activity is hardly studied, although similar studies are intensively done on lab-scale using model fungus (Aspergillus oryzae) and substrates (wheat) (te Biesebeke, et al., 2002). One of the pioneer studies on liquor solid-state fermentation is process simplification on lab-scale using artificial pit with online measurement to explore the association of temperature and gas change with alcohol content (Yue, Zhang, Yang, Zhang, & Liu, 2007). However, it was too simple for in-depth study though the system simulated the fermentation environment. In

Mystery behind Chinese liquor fermentation
41
particular, in a spontaneous solid-state fermentation process without strict process control, various dynamic changes including microbial growth, glucose and oxygen consumption, metabolites formation, temperature change and moisture loss, each of them is critical for the quality and productivity. Better understanding and control of the solid-state fermentation process, will help control an optimized environment for liquor flavor formation, as mentioned earlier (see also Figure 5). 2.4.2 Perspectives Although the traditional fermentation of Chinese liquor is rather successful for thousands of years, it faces critical challenges as we mentioned earlier (Part 3 of this article). The progresses in the past half century prove the possibility and necessity to uncover the hidden knowledge behind the process and to improve it in a scientific manner. Studies need to tackle the challenges and meanwhile the hidden principles may drive modern biotechnologies’ development conversely (Zhu & Tramper, 2013). Future research needs Any modernization and innovations cannot succeed without basic research. As we indicated earlier, liquor production covers the basic knowledge of microbiology, biochemistry, biotechnology, process engineering, among others. A very successful example to refer is the Sake production in Japan. High operational standards strictly based on scientific and technical principles define and standardize raw materials, microorganisms and manufacture process to assure quality and productivity, and even further promote associated laws to safeguard the interests of consumers and producers (Kanauchi, 2013). Although knowledge on Chinese liquor is rapidly accumulating, we are still far from completely understanding the principles behind this traditional product. Concerning microorganisms, an ideal manufacture process should undergo with starters of pure microbial cultures or at least defined microbial
Chapter 2
42
consortium, use consistent or relatively defined raw materials under controlled process conditions to maintain quality, safety and stability of final product (e.g. Japanese Sake and soy sauce(Zhu & Tramper, 2013)). The hidden knowledge behind flavor formation and microbial solid-state fermentation will be further explored and disclosed. Therefore, various aspects of further studies are imminent. Concerning flavor formation, modern advanced detection methods provide faster, cheaper and more precise high throughput analytical methods. Thus, to detect and identify should not be a crucial challenge in coming decades. We need more insights into trace substances, non-volatile compounds and the interactions contributing to flavor as well as taste. Concerning the role of microbial fermentation in flavor forming, the use of next-generation sequencing techniques, high-throughput “-omics” techniques including flavor-omics, genomics, transcriptomic, proteomics, metagenomics and metabolomics, and simulation and reconstruction fermentation can help open a window into the enormous taxonomic, evolution and in situ and in vitro functions in more details for potential control of the microbial metabolism. Last but not the least, as Chinese liquor uses solid-state fermentation, understanding process engineering aspect of the solid-state fermentation will enable process optimization (Thomas, et al., 2013). Simulation approach, mathematical modelling, and Big data-based techniques will provide efficient alternative solutions to better understand complex process dynamics, control and prediction. Perspectives beyond liquor production Food fermentation is an ancient bioprocessing and probably the simplest and most economical way to improve nutrients, sensory properties and functions of foods (Blandino, Al-Aseeri, Pandiella, Cantero, & Webb, 2003; Marsh, Hill, Ross, & Cotter, 2014). Exploring the mystery behind Chinese liquor production will provide both scientific and practical values.
Mystery behind Chinese liquor fermentation
43
Flavors are often the main characters of fermented foods (Carrau, et al., 2015) and essential for consumers’ criteria (Aprotosoaie, Luca, & Miron, 2016). Understanding chemical composition of flavors, interactions of various flavor compounds and factors influencing flavor formation gives us useful information for quality control and process optimization. Exploring, controlling and optimizing a complex microbial community involved in flavor generation and the associated biochemical pathways will provide insights into similar complex traditional food fermentation processes. Furthermore, exploring mystery behind traditional food fermentations can be valuable as a model for studying microbiome characteristics in less tractable ecosystems (Wolfe & Dutton, 2015). Ecological principles under this traditional food fermentation system give us useful advice to understand the evolution strategies of special function microbes and microbiotas, which can serve as a source for specific applications. For example, the repeated-batch fermentation technique can be served as reference for bioethanol or other value-added products that need to undergo multistep processing stages including pre-treatment, hydrolysis and bioconversion (Tan, et al., 2014; Xu, et al., 2015).

Chapter 2
44
2.5 Conclusion Traditional Chinese liquor fermentation remains so far semi-controlled and empirical. New challenges in food safety and quality, microbial technology and process engineering need to be tackled to meet the requirements of the modern society. Flavor formation and corresponding microbial fermentation, the application of pure cultures, better process control and standardization will be the key issue in near future. Meanwhile, exploring the principles behind the complex spontaneous process will not only benefit the liquor industry, but food and biotechnology sector in general. To achieve all these goals, a multidisciplinary approach is necessary.


46
47
Chapter 3
Water dynamics during solid-state fermentation by Aspergillus oryzae YH6
This chapter is published as: G. Jin, Y. Zhu, A. Rinzema, R. Wijffels, X. Ge, Y. Xu, Water dynamics during solid-state fermentation by Aspergillus oryzae YH6, Bioresour. Technol. 277 (2019) 68–76, https://doi.org/10.1016/j.biortech.2019.01.038
Chapter 3
48
Abstract
Water is crucial for microbial growth, heat transfer and substrate hydrolysis,
and dynamically changes with time in solid-state fermentation. However,
water dynamics in the solid substrate is difficult to define and measure. Here,
nuclear magnetic resonance was used to monitor water dynamics during the
pure culture of Aspergillus oryzae YH6 on wheat in a model system to mimic
solid starter (Qu or Koji) preparation. During fermentation, overall water
content gradually decreased from 0.84 to 0.36 g/g, and water activity
decreased from 0.99 to 0.93. Water content in different state (bound,
immobilized and free) changed differently and all moved to more “bound”
direction. The internal water distribution over the substrate matrix also
showed a faster reduction inward both in the radical and axial direction. Our
findings provide the prerequisites for optimal processes where water
dynamics in solid-state fermentation can be monitored and controlled.

Water dynamics during solid-state fermentation
49
3.1 Introduction Many of our daily food and beverages are produced by solid-state fermentations (Chen & Zhu, 2013; Zhu & Tramper, 2013). Solid-state fermentation can be crucially affected by water limitation of substrate because microorganisms need moisture for spore germination, hyphal extension and metabolism (Bellon-Maurel, Orliac, & Christen, 2003; Castilho, Medronho, & Alves, 2000; Gervais & Molin, 2003; Lenz, Hofer, Krasenbrink, & Holker, 2004; Nagel, Van As, Tramper, & Rinzema, 2002). Understanding the water dynamics is one of the prerequisites to monitor, control and optimize solid-state fermentations (Gervais & Molin, 2003; Mansour, et al., 2016; Nagel, et al., 2001a; Ooijkaas, Weber, Buitelaar, Tramper, & Rinzema, 2000; Pandey, 2003; Quiroz, et al., 2015; Ramesh & Lonsane, 1990). However, water dynamics in the solid substrate is difficult to measure. A typical solid-state fermentation is the preparation of Qu or Koji that is widely used in oriental food fermentations to produce traditional foods and beverages such as soy sauce, vinegar, Sake, rice wine and Chinese liquor (Jin, et al., 2017; Machida, Yamada, & Gomi, 2008; Mo, Xu, & Fan, 2010; Zhi, et al., 2017; Zhu & Tramper, 2013). Although the starter has been produced for thousands of years, traditional manual and rather primitive operations without strict control result in low productivity and instability, quality defects and even safety concerns (Jin, et al., 2017). Qu starters are prepared from grains or legumes, or a combination thereof, via solid-state fermentation under aerobic conditions and serve as part of raw materials as well as a source of enzymes and microbial inoculums for the subsequent fermentations (Wang, Wu, Xu, & Sun, 2018). Aspergillus oryzae is one of the most used and often dominant filamentous fungi in solid-state fermentation (Doumas, van den Broek, Affolter, & Monod, 1998; Pandey, 1992; Rahardjo, Weber, le Comte, Tramper, & Rinzema, 2002; te Biesebeke, et al., 2002; Zheng, et al., 2011). Water gradients can develop across the

Chapter 3
50
reactor or substrate matrix due to static fermentation process without mixing while evaporation causes substrate drying in an open environment. The dynamics of water is thus an important parameter affecting the quality of starter preparation. Water dynamic can be divided into three categories in solid-state fermentation, namely (1) overall water content change of the whole substrate matrix by evaporation and respiration (von Meien & Mitchell, 2002; Weber, et al., 2002), (2) different state (bound, immobilized and free) water migration (Li, et al., 2015; Sui & Chen, 2016), and (3) internal water distribution transfer over the substrate matrix due to gradients (Nagel, et al., 2002; Weber, et al., 2002). Studies were done on water dynamics (Liu & Tzeng, 1999; Nagel, et al., 2001a; von Meien & Mitchell, 2002; Weber, et al., 2002), but all these studies focused on the whole water change. Moreover, internal water transfer in substrate is often the limiting factor for overall water change (Hills, Takacs, & Belton, 1990; Kovrlija & Rondeau-Mouro, 2017), and different state water in solid substrates strongly affects the physical properties of the substrate, microbial physiology, enzymatic activities and then fermentation performance (Hills, et al., 1990; Kovrlija & Rondeau-Mouro, 2017). Several attempts have been made to define the water distribution, such as the modeling and measurement of water distribution (Nagel, et al., 2002), and monitoring water migration (Li, et al., 2015). However, these results were obtained in petri dishes or test tubes, rather different from the Qu or Koji preparation where an integrated effect must be considered among microbial physiology, water evaporation and substrate drying. The insight into water dynamics is a prerequisite to monitor, control and optimize such solid-state fermentation processes. Therefore, we used nuclear magnetic resonance (NMR) to measure the water dynamics in Qu/Koji preparation with a model fermentation system. The model system, namely a cylinder fermenter (Figure 1), was equipped with temperature and gas sensors (oxygen consumption as fungal growth
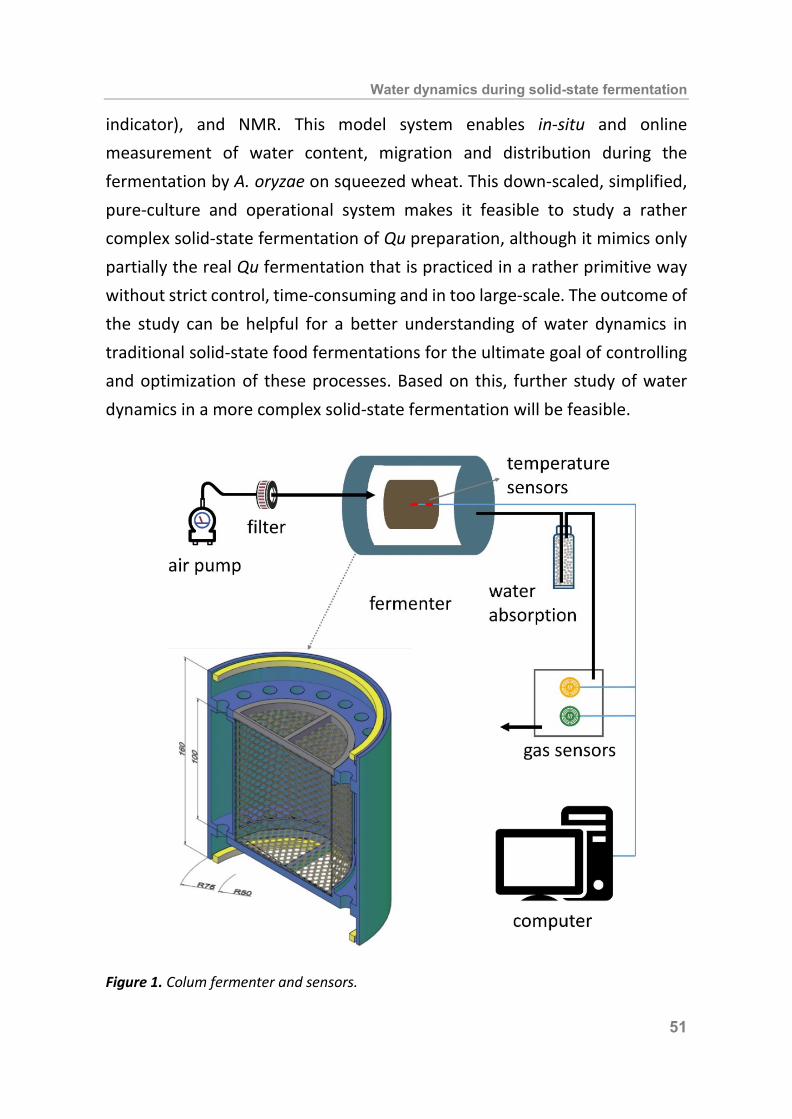
Water dynamics during solid-state fermentation
51
indicator), and NMR. This model system enables in-situ and online measurement of water content, migration and distribution during the fermentation by A. oryzae on squeezed wheat. This down-scaled, simplified, pure-culture and operational system makes it feasible to study a rather complex solid-state fermentation of Qu preparation, although it mimics only partially the real Qu fermentation that is practiced in a rather primitive way without strict control, time-consuming and in too large-scale. The outcome of the study can be helpful for a better understanding of water dynamics in traditional solid-state food fermentations for the ultimate goal of controlling and optimization of these processes. Based on this, further study of water dynamics in a more complex solid-state fermentation will be feasible.
Figure 1. Colum fermenter and sensors.
Chapter 3
52
3.2 Materials and methods 3.2.1 Microorganism A. oryzae YH6 was isolated from harvested Qu sample (Yanghe Co., Ltd., Suqian, Jiangsu Province, China) and maintained on Potato Dextrose Agar (Sinopharm Chemical Reagent Co., Ltd., Shanghai, China). The fungus was grown on Rose Bengal medium (Sinopharm Chemical Reagent Co., Ltd., Shanghai, China) at 30 °C for 7 days and spores were harvested by using 10 mL of 33% (w/w) sterile glycerol solution (approximately 106 spores/mL) to make a spore suspension. The spore suspension was stored in sterile 50-mL centrifuge tubes at -20 °C. Inoculation was done by a sterile sprayer with an inoculation size at about 104 spores/g wet substrate. 3.2.2 Column fermenter and in-situ measurement A column fermenter was designed to simulate the fermentation process of Qu starter (Jin, et al., 2017). It has an 800 mL working volume (100 mm in diameter and 100 mm long), surrounded by a sleeve (150 mm in diameter, 150 mm long and 5 mm thick). The column was filled with substrate and covered by a lining (about 2 mm thick) (Figure 1). The sleeve was covered by lids with holes for air and sensors. The material used for the column fermenter was polycarbonate plastic with a glass fiber lining. All the materials were insensitive to NMR. As shown in Figure 1, the device consisted of an air pump (AIR 1000, EHEIM GmbH & Co., Deizisau, Germany), a filter (Thermo Scientific Co, Ltd., Waltham, MA), a water absorption column (Activated Alumina AL2P3) (Huaming Alumina Technology Co, Ltd., Weifang, Shandong Province, China), a temperature sensor (Fiber Bragg Grating Sensor) (MicroDetect Co, Ltd., Tangshan, Hebei Province, China), an O2 sensor (Alphasense Co, Ltd., London, UK) and a CO2 sensor (Gas Sensing Solutions Co, Ltd., Cumbernauld, UK). The online data of temperature, O2 and CO2 were collected with computer

Water dynamics during solid-state fermentation
53
software based on LabVIEW 2016 (National Instruments Co, Ltd., Austin, TX) and recorded by Microsoft SQL Server 2012. 3.2.3 Fermentation The raw material (squeezed wheat) was obtained from a local distillery (Yanghe Co., Ltd., Suqian, Jiangsu Province, China) and dried to a moisture content of 10%, packed into a vacuum bag and stored at room temperature. The wheat (500 g) was mixed with deionized water in a ratio of 3:2 (w/w), covered with a plastic foil and stored at 4 °C for 4 hours, followed by autoclaving twice at 115 °C for 30 min each. After cooling to 25 °C, the substrate was sprayed with spore suspension (8 mL × 106 spores/mL) by using a sterile small watering can (Thermo Scientific Co, Ltd., Waltham, MA). Then 600 g inoculated substrate with a final moisture content of 0.84 kg w/kg dry substrate was loaded into a cylindrical tube (100 mm diameter and 100 mm long) and kept at 4 °C for 2 h to form a shape that would fit the fermenter (Figure 1). After the substrate was loaded, the column was sealed by lids at upper and lower ends. The whole device was kept in an incubator at 30 °C and 60% relative humidity (Boxun Biological Instrument Corp., Shanghai, China) for 15 days with a constant aeration rate (180 mL/min at 101.3 kPa). The respiration rate was measured based on oxygen content change. The same substrate without inoculation was used as the control whose moisture of spore suspension was compensated by sterile water. 3.2.4 Nuclear magnetic resonance measurements NMR measurements were acquired on an NMR analyzer MacroMR12-150H-I (Suzhou Niumag Analytical Instrument Corporation, Suzhou, Jiangsu province, China) with a magnetic field strength of 0.35 T and a corresponding resonance frequency of 12.8 MHz. The columnar probe diameter was 150 mm with 2 open ends, and the uniformed field was a spherical space (diameter 150 mm). The whole column fermenter (4 duplicates) and the control (also 4 duplicates)
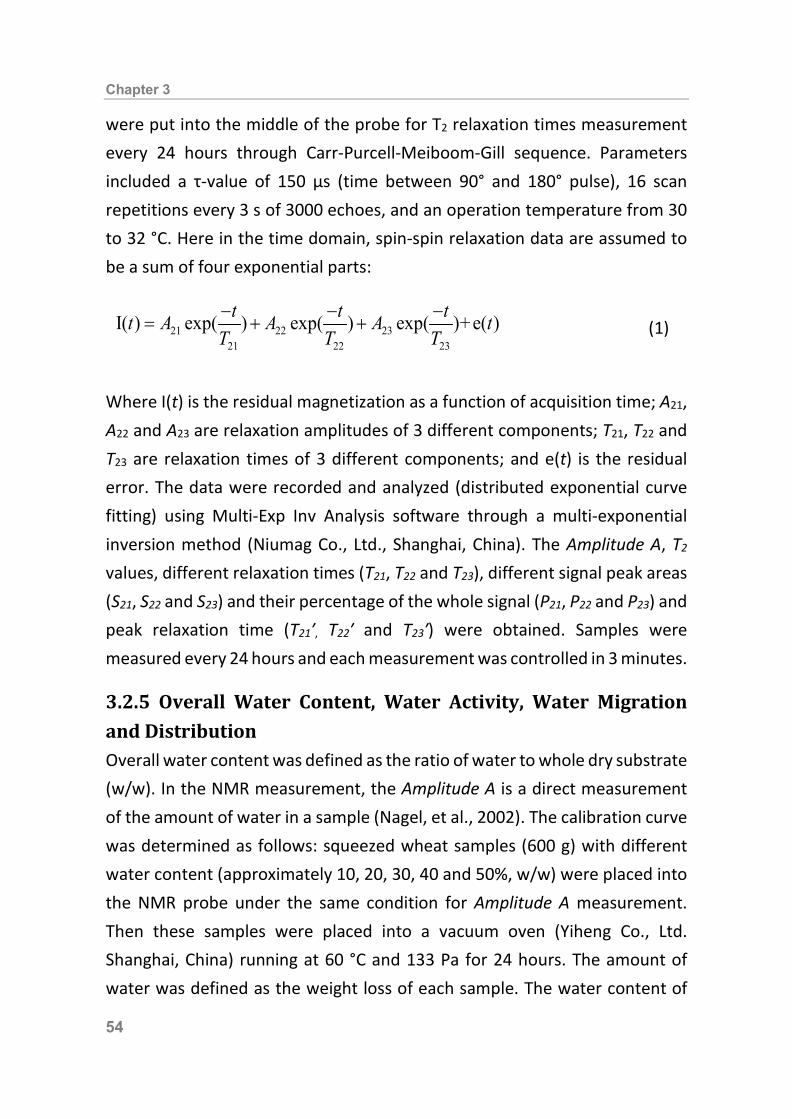
Chapter 3
54
were put into the middle of the probe for T2 relaxation times measurement every 24 hours through Carr-Purcell-Meiboom-Gill sequence. Parameters included a τ-value of 150 μs (time between 90° and 180° pulse), 16 scan repetitions every 3 s of 3000 echoes, and an operation temperature from 30 to 32 °C. Here in the time domain, spin-spin relaxation data are assumed to be a sum of four exponential parts:
21 22 2321 22 23
I( ) exp( ) exp( ) exp( )+e( )t t tt A A A tT T T− − −
= + + (1)
Where I(t) is the residual magnetization as a function of acquisition time; A21, A22 and A23 are relaxation amplitudes of 3 different components; T21, T22 and T23 are relaxation times of 3 different components; and e(t) is the residual error. The data were recorded and analyzed (distributed exponential curve fitting) using Multi-Exp Inv Analysis software through a multi-exponential inversion method (Niumag Co., Ltd., Shanghai, China). The Amplitude A, T2 values, different relaxation times (T21, T22 and T23), different signal peak areas (S21, S22 and S23) and their percentage of the whole signal (P21, P22 and P23) and peak relaxation time (T21′, T22′ and T23′) were obtained. Samples were measured every 24 hours and each measurement was controlled in 3 minutes. 3.2.5 Overall Water Content, Water Activity, Water Migration and Distribution Overall water content was defined as the ratio of water to whole dry substrate (w/w). In the NMR measurement, the Amplitude A is a direct measurement of the amount of water in a sample (Nagel, et al., 2002). The calibration curve was determined as follows: squeezed wheat samples (600 g) with different water content (approximately 10, 20, 30, 40 and 50%, w/w) were placed into the NMR probe under the same condition for Amplitude A measurement. Then these samples were placed into a vacuum oven (Yiheng Co., Ltd. Shanghai, China) running at 60 °C and 133 Pa for 24 hours. The amount of water was defined as the weight loss of each sample. The water content of

Water dynamics during solid-state fermentation
55
each sample can be calculated from the calibration curve. Water activity was estimated from the moisture content and the water desorption isotherm of the substrate (standard curve) at 30 °C. The desorption isotherm of the substrate was determined with a water activity meter (Aqualab TDL, Decagon Devices, Pullman, WA). The effects of fungal biomass, glucose and enzymes on water activity were neglected because of their relatively low concentrations (Agger, Spohr, Carlsen, & Nielsen, 1998; Lubertozzi & Keasling, 2009). The spin-spin relaxation time (T2) was measured to study the water migration during fermentation. Water migration was defined as different state (bound, immobilized and free) water dynamic including content migration, percentage and mobility change during fermentation, and the different state of water was defined by T2 values (He & Chen, 2015). As described above, different signal peak areas (S21, S22 and S23) represent different state water content, the percentages (P21, P22 and P23) represent the percentage of different state water content and the peak relaxation times (T21′, T22′ and T23′) represent the water mobility. Magnetic resonance imaging (MRI) images were used to demonstrate the internal water distribution over reactor and were obtained using the NMR analyzer described above under the same condition. The slices (18 layers) were chosen from bottom to top at axial direction with a thickness of 5 mm each. The raw images were converted to 8-bit graphics using Image J (version 1.50) and further converted to gray scale data using R (version 3.5.0). 3.2.6 Statistical Analysis. Statistical analyses were done with IBM SPSS statistics 22 for windows. Data differences of signal area and peak point were evaluated by ANOVA and Duncan’s multiple range test. Differences with p < 0.05 were considered statistically significant. The relationship between water content and NMR parameters (Amplitude A) was analyzed statistically using the general linear

Chapter 3
56
model procedure in Originpro 2016 (OriginLab, Northampton, MA). 3.3 Results and Discussion 3.3.1 Respiration and temperature A. oryzae was cultivated on squeezed wheat in the column fermenter (Figure 1). After a linear growth of about 24 hours, the CO2 production rate reached its maximum (54 mL/hour CO2 release) (Figure 2A) with a relative standard deviation of 5% among the 4 duplicates, and it is similar to the respiration rate (Figure 2B). Microbial growth and metabolism can significantly increase the temperature inside the solid substrate during fermentation (Nagel, et al., 2001b). The temperature curve also showed a linear increase from about 20 to 48 °C within 24 hours (Figure 2C), and reached the maximum temperature of the so-called medium-temperature Qu starter (Zheng, et al., 2011), a Qu category definition based on the maximum temperature reached. After being stable for about 10 hours, the respiration rate began to decrease, but the temperature showed a relatively slower decrease (Figure 2C) due to oxygen limitation in center and poor heat conductivity of the solid substrate (Rodriguez-Fernandez, et al., 2012). The reason could be that the fungus stopped growing in the center of the column, where the temperature sensor is, but continued to grow in the perimeter of the column. After 5 days fermentation, the respiration and temperature decreased until the end of fermentation. The horizontal cross-section images demonstrated that the fungal mycelium occupied over half of the radius from the edge of the substrate after 5 days, and the hyphae of A. oryzae observed in the middle of substrate at about 15 days. The inside temperature change influences the growth of microbes (Szewczyk & Myszka, 1994), and also influences directly the water evaporation, and finally, the further decrease of water content inhibits the microbial growth (Gervais & Molin, 2003).
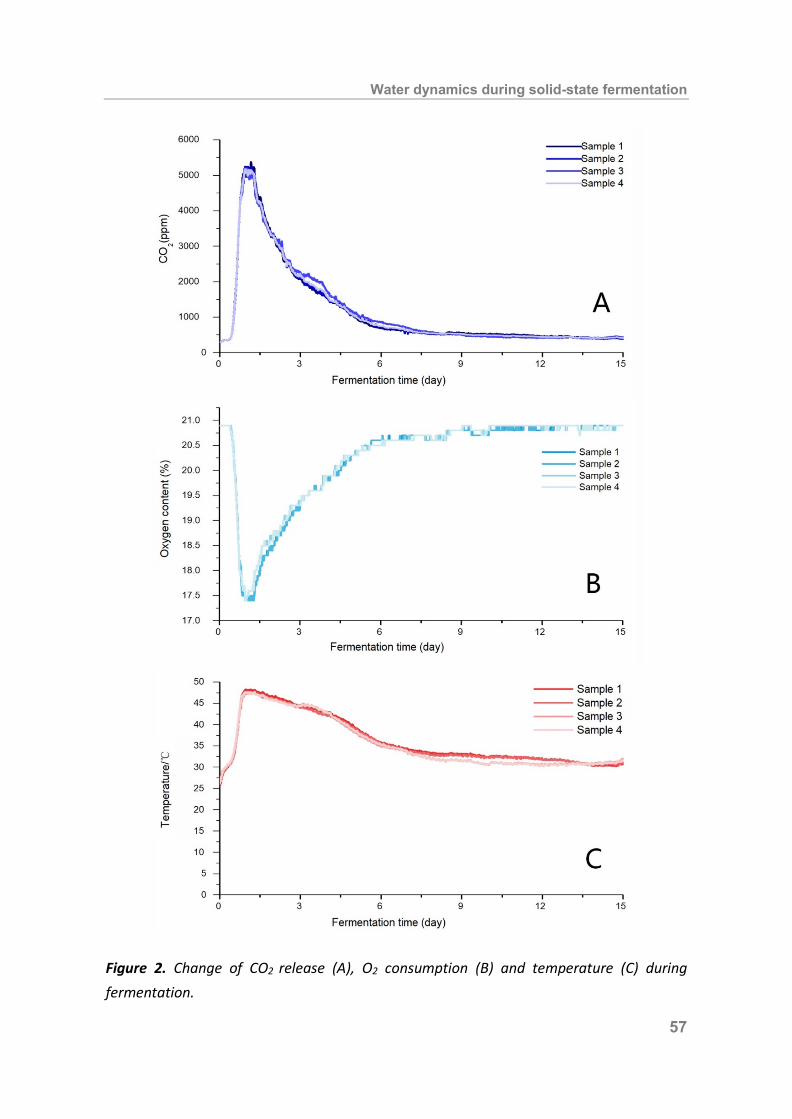
Water dynamics during solid-state fermentation
57
Figure 2. Change of CO2 release (A), O2 consumption (B) and temperature (C) during fermentation.
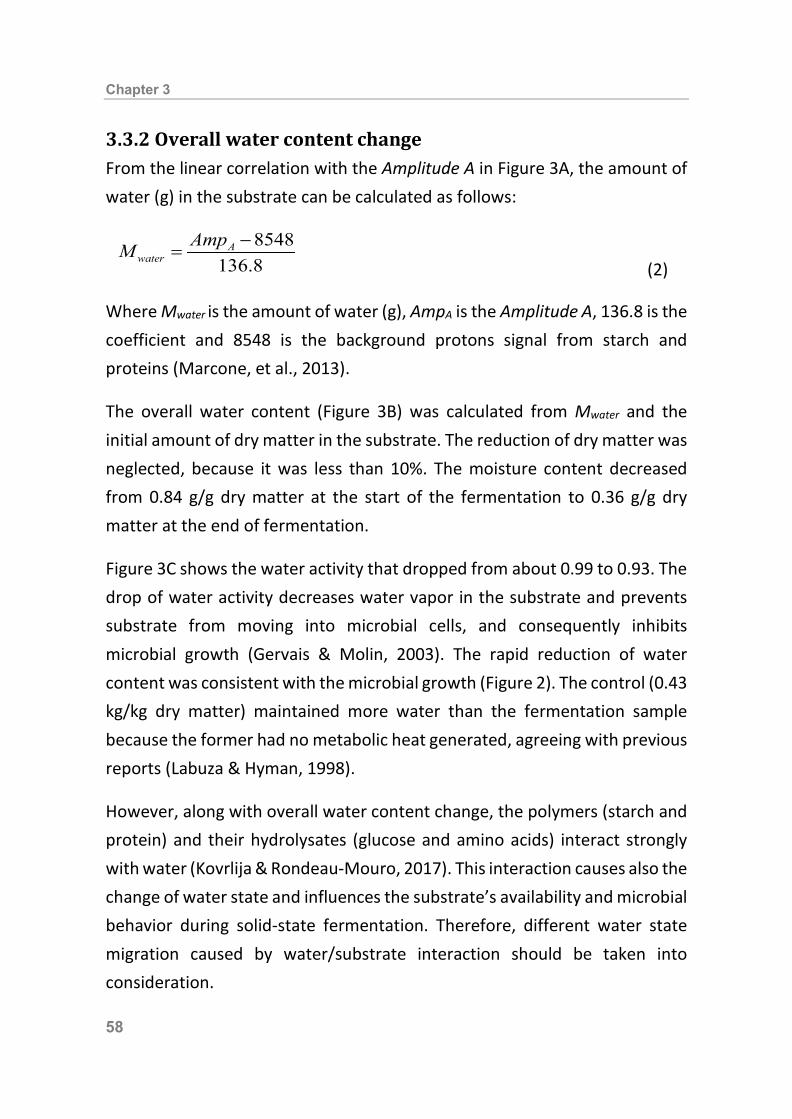
Chapter 3
58
3.3.2 Overall water content change From the linear correlation with the Amplitude A in Figure 3A, the amount of water (g) in the substrate can be calculated as follows:
8548136.8
Awater
AmpM −=
(2)
Where Mwater is the amount of water (g), AmpA is the Amplitude A, 136.8 is the coefficient and 8548 is the background protons signal from starch and proteins (Marcone, et al., 2013). The overall water content (Figure 3B) was calculated from Mwater and the initial amount of dry matter in the substrate. The reduction of dry matter was neglected, because it was less than 10%. The moisture content decreased from 0.84 g/g dry matter at the start of the fermentation to 0.36 g/g dry matter at the end of fermentation. Figure 3C shows the water activity that dropped from about 0.99 to 0.93. The drop of water activity decreases water vapor in the substrate and prevents substrate from moving into microbial cells, and consequently inhibits microbial growth (Gervais & Molin, 2003). The rapid reduction of water content was consistent with the microbial growth (Figure 2). The control (0.43 kg/kg dry matter) maintained more water than the fermentation sample because the former had no metabolic heat generated, agreeing with previous reports (Labuza & Hyman, 1998). However, along with overall water content change, the polymers (starch and protein) and their hydrolysates (glucose and amino acids) interact strongly with water (Kovrlija & Rondeau-Mouro, 2017). This interaction causes also the change of water state and influences the substrate’s availability and microbial behavior during solid-state fermentation. Therefore, different water state migration caused by water/substrate interaction should be taken into consideration.

Water dynamics during solid-state fermentation
59
Figure 3. Linear correlation of water content and Amplitude A (A), overall water content (B) and desorption isotherm of substrate (C).
Chapter 3
60
3.3.3 T2 relaxation and water migration Protons in different microenvironments exhibit different transverse relaxation (T2) properties, which can be used as good indicators for monitoring proton dynamic states and some physical properties of various food matrixes. Relaxation times in a given spin system depend not only on structure through the interactions themselves, but also on dynamic through the geometry and time scale of molecular motion (Hemdane, et al., 2017; Kovrlija & Rondeau-Mouro, 2017). The relaxation time (T2) correlates to the physical state of water, and linearly correlates to moisture content in a sample (Nagel, et al., 2002). Three proton fractions were occurred in solid substrate. T21 was the fastest fraction with a relaxation time of around 1 ms, and T22 was the intermediate fraction (relaxation time around 15 ms), whereas T23 was the slowest fraction with a relaxation time of around 100 ms (Table 1). According to the analysis of T2 inversion spectra, the water state within raw materials can usually be categorized into “bound water”, “immobilized water”, and “free water”, which correspond to different cell compartment: cell walls, cytoplasm and extracellular space and vacuoles, respectively (Shao & Li, 2013). The relaxation peak areas of S21, S22 and S23 are used to express the relative content of bound water, immobilized water and free water in the samples, respectively. Although the whole signal peak area showed a similar change, the peak areas of three fractions changed differently (Figure 4 and Figure 5). First, the fastest fraction (T21) peak area S21 increased from day 5 till the end of fermentation. This might be caused by water loss and small molecules like glucose accumulation in fermentation samples. The formation of S21 in control samples at the end of day 3 might be caused by the water content decrease to the glass transition level where water combined tightly with solid polymers (Figure 4B). Many physical and chemical changes resulting from moisture migration can be related to the glass transition (Labuza & Hyman, 1998). The
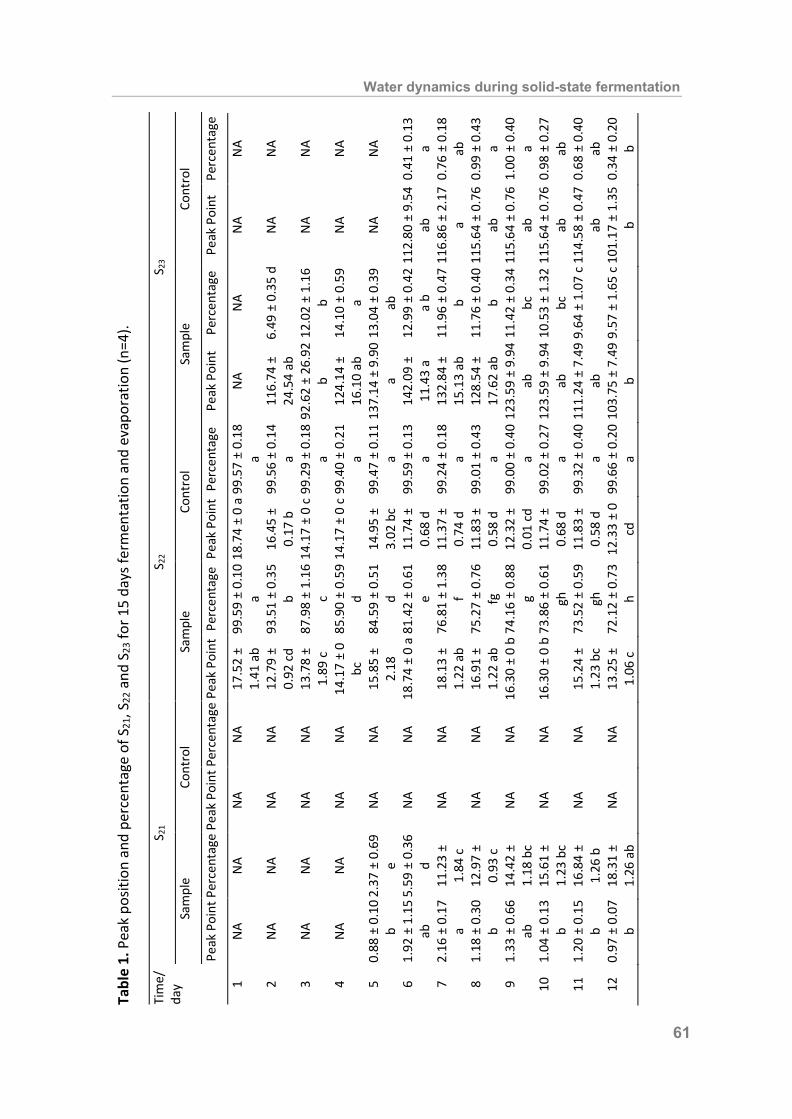
Tabl
e 1.
Pea
k po
sitio
n an
d pe
rcen
tage
of S
21, S
22 a
nd S
23 fo
r 15
days
ferm
enta
tion
and
evap
orat
ion
(n=4
).
Tim
e/da
y S 2
1 S 2
2 S 2
3
Sam
ple
Cont
rol
Sam
ple
Cont
rol
Sam
ple
Cont
rol
Peak
Poi
nt P
erce
ntag
e Pe
ak P
oint
Per
cent
age
Peak
Poi
nt P
erce
ntag
e Pe
ak P
oint
Per
cent
age
Peak
Poi
nt
Perc
enta
ge
Peak
Poi
nt
Perc
enta
ge
1 N
A N
A N
A N
A 17
.52
± 1.
41 a
b 99
.59
± 0.
10
a 18
.74
± 0
a 99
.57
± 0.
18
a N
A N
A N
A N
A
2 N
A N
A N
A N
A 12
.79
± 0.
92 c
d 93
.51
± 0.
35
b 16
.45
± 0.
17 b
99
.56
± 0.
14
a 11
6.74
±
24.5
4 ab
6.
49 ±
0.3
5 d
NA
NA
3 N
A N
A N
A N
A 13
.78
± 1.
89 c
87
.98
± 1.
16
c 14
.17
± 0
c 99
.29
± 0.
18
a 92
.62
± 26
.92
b 12
.02
± 1.
16
b N
A N
A
4 N
A N
A N
A N
A 14
.17
± 0
bc
85.9
0 ±
0.59
d
14.1
7 ±
0 c
99.4
0 ±
0.21
a
124.
14 ±
16
.10
ab
14.1
0 ±
0.59
a
NA
NA
5 0.
88 ±
0.1
0 b
2.37
± 0
.69
e N
A N
A 15
.85
± 2.
18
84.5
9 ±
0.51
d
14.9
5 ±
3.02
bc
99.4
7 ±
0.11
a
137.
14 ±
9.9
0 a
13.0
4 ±
0.39
ab
N
A N
A
6 1.
92 ±
1.1
5 ab
5.
59 ±
0.3
6 d
NA
NA
18.7
4 ±
0 a
81.4
2 ±
0.61
e
11.7
4 ±
0.68
d
99.5
9 ±
0.13
a
142.
09 ±
11
.43
a 12
.99
± 0.
42
a b
112.
80 ±
9.5
4 ab
0.
41 ±
0.1
3 a
7 2.
16 ±
0.1
7 a
11.2
3 ±
1.84
c
NA
NA
18.1
3 ±
1.22
ab
76.8
1 ±
1.38
f
11.3
7 ±
0.74
d
99.2
4 ±
0.18
a
132.
84 ±
15
.13
ab
11.9
6 ±
0.47
b
116.
86 ±
2.1
7 a
0.76
± 0
.18
ab
8 1.
18 ±
0.3
0 b
12.9
7 ±
0.93
c
NA
NA
16.9
1 ±
1.22
ab
75.2
7 ±
0.76
fg
11
.83
± 0.
58 d
99
.01
± 0.
43
a 12
8.54
±
17.6
2 ab
11
.76
± 0.
40
b 11
5.64
± 0
.76
ab
0.99
± 0
.43
a 9
1.33
± 0
.66
ab
14.4
2 ±
1.18
bc
NA
NA
16.3
0 ±
0 b
74.1
6 ±
0.88
g
12.3
2 ±
0.01
cd
99.0
0 ±
0.40
a
123.
59 ±
9.9
4 ab
11
.42
± 0.
34
bc
115.
64 ±
0.7
6 ab
1.
00 ±
0.4
0 a
10
1.04
± 0
.13
b 15
.61
± 1.
23 b
c N
A N
A 16
.30
± 0
b 73
.86
± 0.
61
gh
11.7
4 ±
0.68
d
99.0
2 ±
0.27
a
123.
59 ±
9.9
4 ab
10
.53
± 1.
32
bc
115.
64 ±
0.7
6 ab
0.
98 ±
0.2
7 ab
11
1.
20 ±
0.1
5 b
16.8
4 ±
1.26
b
NA
NA
15.2
4 ±
1.23
bc
73.5
2 ±
0.59
gh
11
.83
± 0.
58 d
99
.32
± 0.
40
a 11
1.24
± 7
.49
ab
9.64
± 1
.07
c 11
4.58
± 0
.47
ab
0.68
± 0
.40
ab
12
0.97
± 0
.07
b 18
.31
± 1.
26 a
b N
A N
A 13
.25
± 1.
06 c
72
.12
± 0.
73
h 12
.33
± 0
cd
99.6
6 ±
0.20
a
103.
75 ±
7.4
9 b
9.57
± 1
.65
c 10
1.17
± 1
.35
b 0.
34 ±
0.2
0 b
Water dynamics during solid-state fermentation
61

13
1.11
± 0
.08
b 19
.38
± 2.
17 a
b 2.
31 ±
0 a
1.7
7 ±
0.85
b
12.3
3 ±
0 cd
71
.88
± 1.
55
h 11
.53
± 0.
93 d
98
.03
± 0.
73
a 93
.49
± 7.
52 b
8.7
4 ±
1.37
c 1
06.1
6 ±
7.11
b
0.20
± 0
.12
b 14
1.
09 ±
0.1
9 b
20.1
0 ±
0.77
a
2.08
± 0
.08
a 11
.51
± 2.
75 a
12
.33
± 0
cd
71.0
3 ±
0.82
h
11.5
3 ±
0.93
d
88.4
9 ±
2.75
b
90.6
6 ±
11.7
4 b
8.87
± 0
.60
c N
A N
A
15
0.98
± 0
.20
b 20
.79
± 0.
64 a
1.
31 ±
0.5
1 b
12.1
1 ±
1.57
a
10.7
2 ±
0 d
70.7
2 ±
0.94
h
10.7
2 ±
0 d
87.8
9 ±
1.57
b
84.5
7 ±
11.5
9 b
8.49
± 1
.01
c N
A N
A
NA:
not
ava
ilabl
e. R
esul
ts in
clud
e m
ean
± st
anda
rd d
evia
tion.
Let
ter “
a–h”
indi
cate
sign
ifica
nt d
iffer
ence
s in
sam
e co
lum
n (p
< 0
.05)
.
Chapter 3
62
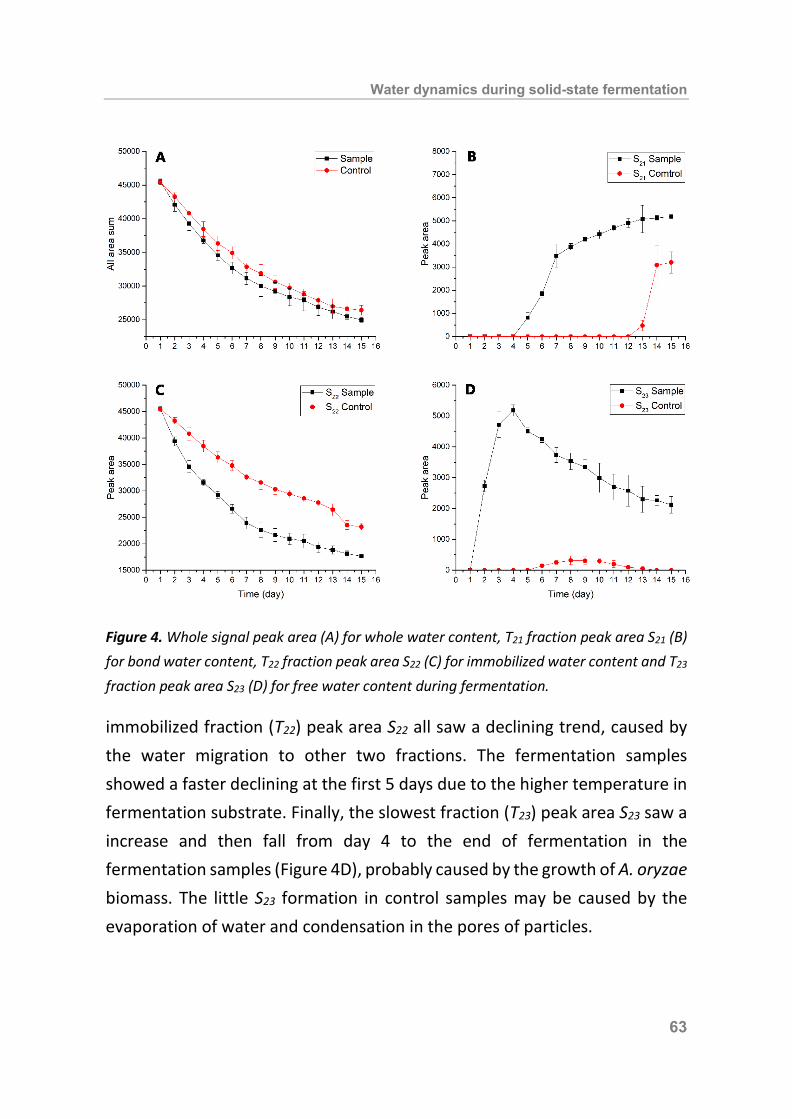
Water dynamics during solid-state fermentation
63
Figure 4. Whole signal peak area (A) for whole water content, T21 fraction peak area S21 (B) for bond water content, T22 fraction peak area S22 (C) for immobilized water content and T23 fraction peak area S23 (D) for free water content during fermentation. immobilized fraction (T22) peak area S22 all saw a declining trend, caused by the water migration to other two fractions. The fermentation samples showed a faster declining at the first 5 days due to the higher temperature in fermentation substrate. Finally, the slowest fraction (T23) peak area S23 saw a increase and then fall from day 4 to the end of fermentation in the fermentation samples (Figure 4D), probably caused by the growth of A. oryzae biomass. The little S23 formation in control samples may be caused by the evaporation of water and condensation in the pores of particles.
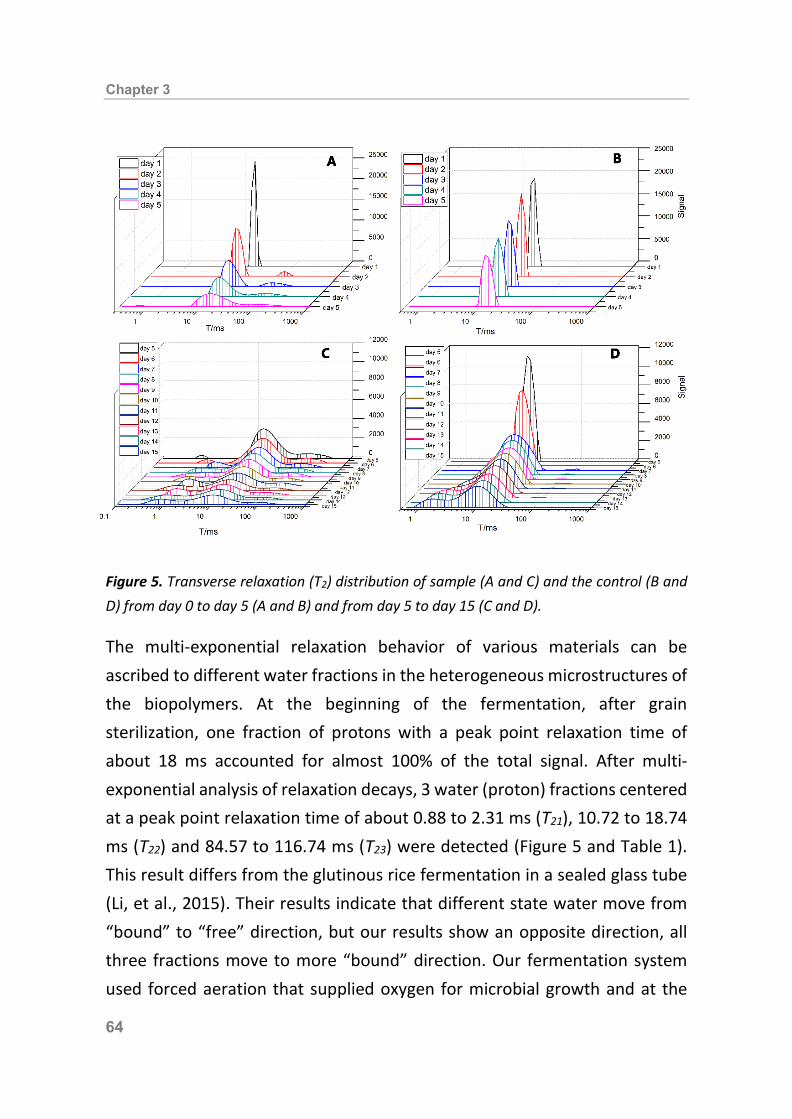
Chapter 3
64
Figure 5. Transverse relaxation (T2) distribution of sample (A and C) and the control (B and D) from day 0 to day 5 (A and B) and from day 5 to day 15 (C and D). The multi-exponential relaxation behavior of various materials can be ascribed to different water fractions in the heterogeneous microstructures of the biopolymers. At the beginning of the fermentation, after grain sterilization, one fraction of protons with a peak point relaxation time of about 18 ms accounted for almost 100% of the total signal. After multi-exponential analysis of relaxation decays, 3 water (proton) fractions centered at a peak point relaxation time of about 0.88 to 2.31 ms (T21), 10.72 to 18.74 ms (T22) and 84.57 to 116.74 ms (T23) were detected (Figure 5 and Table 1). This result differs from the glutinous rice fermentation in a sealed glass tube (Li, et al., 2015). Their results indicate that different state water move from “bound” to “free” direction, but our results show an opposite direction, all three fractions move to more “bound” direction. Our fermentation system used forced aeration that supplied oxygen for microbial growth and at the
Water dynamics during solid-state fermentation
65
same time transported water vapor out of the fermenter. After 24 hours of fermentation, the slowest T23 fraction occurred at about 120 ms and this fraction was detected until the end of fermentation, and on day 5, the fastest fraction T21 was detected (Figure 5). Compared to the fermentation samples, only 2 fractions (T21 and T22) were detected in the control, and a small proportion (less than 1%) of T23 appeared and disappeared from day 6 to day 13. Both T2 relaxation peak position showed a direction towards “shortest” time, and the percentage of T22 gradually decreased from over 99% to about 70%, and T21 increased from 2.37% to over 20% in the fermentation samples (Table 1). Water activity drives water transport and influences microbial growth. So far, different state water migration during solid-state fermentation was determined, relationship between water migration and water activity change still needs to be associated in future studies. Water migration is driven by the gradient of water content (Watanabe, Fukuoka, Tomiya, & Mihori, 2001), and also the microbial growth significantly influences water migration. Besides, the overall water content change and different state water migration are all at whole substrate level (micro-scale), but internal water distribution transfer is often the limiting factor for overall water transfer. 3.3.4 Internal water distribution transfer MRI is a widely used method to map the internal water distribution in solid matrix (Frias, Foucat, Bimbenet, & Bonazzi, 2002; Kovrlija & Rondeau-Mouro, 2017). A special form is the proton density image that visualizes the number of protons (almost from water) per volume. The images of the proton density inside the matrix provide transfer of the water distribution during fermentation. The scanned images were selected from bottom up at 2, 4, 6 and 8 cm depth during fermentation and drying. In general, the water inside the solid matrix clearly decreased both in fermentation and control samples. At the beginning, water distributed in both samples at different depth was

Chapter 3
66
even, demonstrating the feasibility of the methods. Water decreased outwards at radical direction, a phenomenon similar to drying process (Frias, et al., 2002). Compared to the control, the overall water decrease showed a similar result during fermentation (Figure 3B and Figure 4A). This can be caused by the growth of microbe with water consumption and metabolic heat. The lowest moisture content occurred at the bottom of the matrix at day 15, but there was clearly a bright circle at the outer layer of the fermentation substrate, probably caused by the mycelium of A. oryzae. Meanwhile, the gradient also occurred at axial direction. The water content gradually decreased from the center to both sides. 3.4 Conclusions Water dynamic is of crucial importance to monitor, control and optimize solid-state fermentation. Our experimental setup equipped with online NMR, although cannot completely represent yet the real but rather primi-tive Qu preparation process, provides the possibility to measure overall water change, different state water migration and internal water distribu-tion transfer phenomenon in a simulated Qu starter fermentation. These outcomes can be helpful to get further insight into the association of water with microbial growth and heat transfer, with the goal of better process control and optimization of traditional solid-state food fermentations.
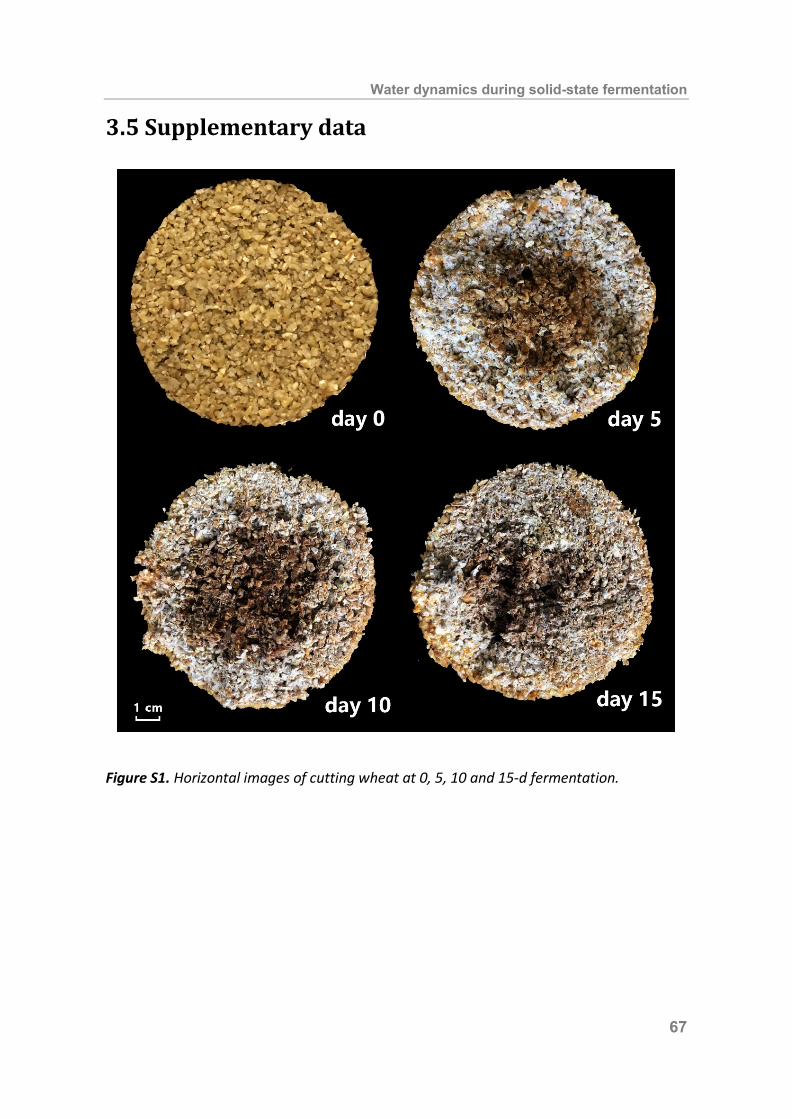
Water dynamics during solid-state fermentation
67
3.5 Supplementary data
Figure S1. Horizontal images of cutting wheat at 0, 5, 10 and 15-d fermentation.

Chapter 3
68
Figure S2. MRI images of experimental and control samples in different depths (2, 4, 6, 8 cm)
at day 0, 5, 10, 15.

69
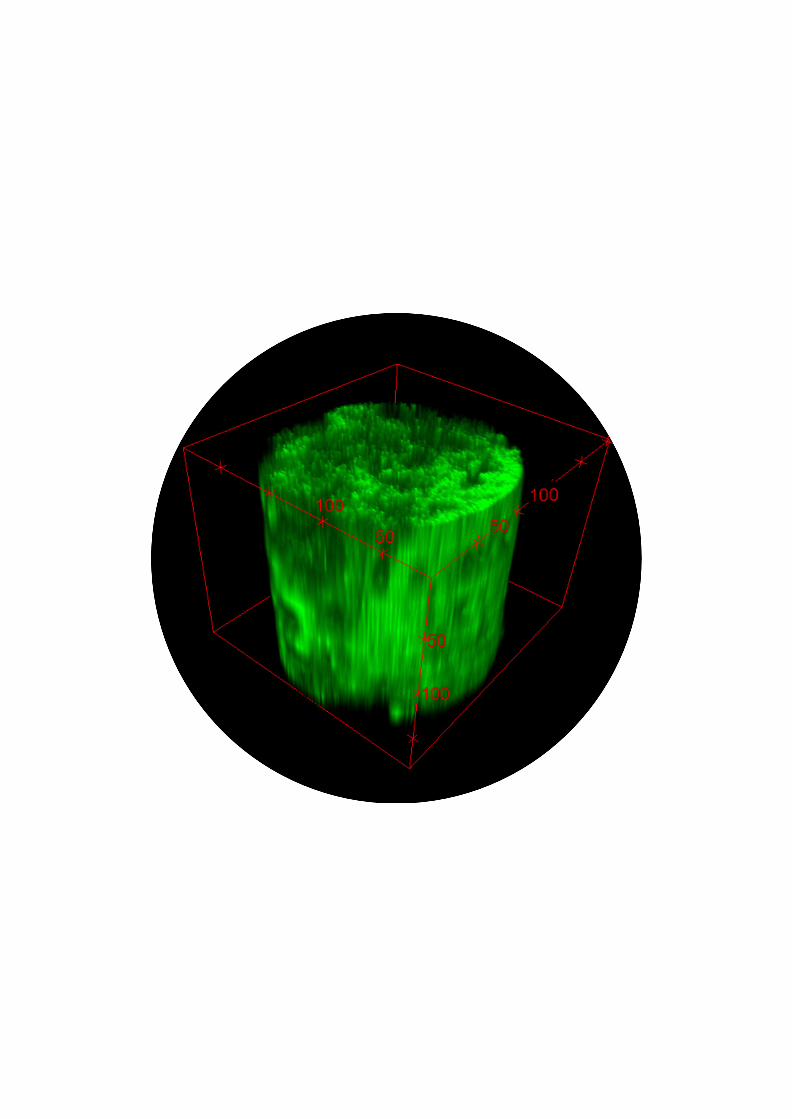
70
71
Chapter 4
Modeling of industrial scale anaerobic solid-state fermentation for Chinese liquor production
This chapter is published as: G. Jin, P. Uhl, Y. Zhu, R. Wijffels, Y. Xu, A. Rinzema. Modeling of industrial-scale anaerobic solid-state fermentation for Chinese liquor production, Chem. Eng. J. 394 (2020) 124942, https://doi.org/10.1016/j.cej.2020.124942.

Chapter 4
72
Abstract
Traditional solid-state fermentation processes always give fluctuating
product quality and quantity due to difficulties in control and scale up. This
paper describes an engineering study of an industrial-scale anaerobic solid-
state fermentation process for Chinese liquor (Baijiu) production, aimed at
better understanding of the traditional process, as an initial step for future
optimization. This mixed-culture fermentation is done in 0.44-m3 vessels
embedded in the soil. At this scale, the fermentation is limited by product
inhibition. We developed mathematical models based on the Han-Levenspiel
equation for product inhibition, with parameters derived from measured data.
The models accurately predicted the concentrations of starch and dry matter.
A model with radial conduction into a small soil volume around the fermenter
and consecutive vertical conduction into the underlying soil accurately
predicted the pit temperature in the heating and cooling phases. This model
is very sensitive to the values used for the enthalpies of combustion, meaning
that direct measurement of the heat production rate would be preferable. In
the industry practice, the fermenter volume can be from around 0.20 to 15.00
m3. The model predicts that overheating will occur not only in larger
fermenters, but also in the 0.44-m3 fermenters when the soil temperature is
high in summer. Our model predictions are consistent with observed behavior
in the industry. Our findings can be used to improve this traditional process,
as well as similar systems.

Modeling of anaerobic solid-state fermentation
73
4.1 Introduction Traditional solid-state fermentation is used to produce numerous valuable products (Taylor & Duodu, 2019; Xu, et al., 2010; Zhu & Tramper, 2013). Chinese liquor, or Baijiu, is one of these products (Jin, et al., 2017). In 2016, the Chinese consumed approximately 4 billion liters of Chinese liquor with a value of about $97 billion (Liu & Sun, 2018). Baijiu is produced by anaerobic solid-state fermentation in pits embedded in the soil (Figure 1), using a mixture of cooked sorghum and starter (Daqu) (Jin, et al., 2019; Taylor & Duodu, 2019). Fungal enzymes in the starter convert starch to glucose that is fermented to ethanol and lactic acid by yeasts and lactic acid bacteria (Wang, et al., 2019). Although the traditional fermentation technique has been used for millennia, the yield and quality of liquor fluctuate, and the process is time and labor consuming (Du, et al., 2011; Huang, et al., 2014; Jin, et al., 2017). Until now, research has focused on microbiology and flavor chemistry (Jin, et al., 2017; Liu & Sun, 2018). Process engineering studies are needed to understand and improve process design, monitoring and control. However, the industry does not want to change the traditional process drastically, because that has a high risk of changing the flavor of the liquor. In anaerobic solid-state fermentation, product inhibition is probably the first restriction: alcohols and acids inhibit all microbes (Janke, et al., 2019). However, overheating can be important as well. Compared to aerobic solid-state fermentation, which has efficient cooling by forced aeration and evaporation (Casciatori, Bueck, Thomeo, & Tsotsas, 2016; Casciatori, Laurentino, Taboga, Casciatori, & Thomeo, 2014; Nagel, et al., 2001b; Pandey, 2003; Perez, Casciatori, & Thomeo, 2019; Weber, et al., 2002), anaerobic solid-state fermentation has poor cooling. Heat production rates are much lower in anaerobic fermentation, but cooling rates are also lower without forced aeration. Anaerobic fermenters mainly rely on conductive cooling, which means they can still overheat if the fermenter is big or the surrounding soil
Chapter 4
74
temperature is high (Kabanova, Stulova, & Vilu, 2012; Ngadi & Correia, 1992). Several studies present models for production of ethanol or lactic acid in anaerobic solid-state fermentation (de Olmos, Bru, & Garro, 2015; Kirthiga & Rajendran, 2014; Li, et al., 2013; Mei, et al., 2011; Nannyonga, Tchuenbou-Magaia, Goode, Fryer, & Robbins, 2018; Wang, et al., 2010; Wang, Sharifzadeh, Templer, & Murphy, 2012; Yang, Li, Liu, Ren, & Xie, 2018). Some of these studies describe logistic models or other sigmoidal models for ethanol formation or yeast growth (de Olmos, et al., 2015; Kabanova, et al., 2012; Nannyonga, et al., 2018; Ngadi & Correia, 1992; Wang, et al., 2010). However, none of these papers addresses product inhibition directly, although their results indicate that it did occur. Furthermore, they describe pure culture studies at laboratory scale. Currently, the Chinese liquor industry uses the change in the temperature measured at the center of the pit over time as an indicator of liquor yield and quality. However, the temperature is the result of heat production by the mixed culture and conduction into the soil, where the temperature varies over the year. A mathematical model of the heat production and conduction losses could help to interpret the temperature measurements. Therefore, we aim at better understanding and at future optimization of the traditional process. Using the Han-Levenspiel model for the reaction kinetics, we built reactor models that simulate the starch conversion, the water loss and the temperature development. They can be used to understand the process, to simulate the effect of environmental factors and pit size, and to improve the process. We discuss the most important factors that influence temperature, possibilities for improvement of the model and needs for further studies. Our work can be useful to improve traditional anaerobic solid-state fermentations in the food industry and similar systems like anaerobic composting and anaerobic digestion for solid waste treatment and fuel alcohol production.

Modeling of anaerobic solid-state fermentation
75
4.2 Mathematical model 4.2.1 Approach We used measurements from an industrial pit fermenter for Chinese liquor production. Available measurement data are the temperature, concentra-tions of ethanol and lactic acid (g/100g wet substrate), and starch and dry matter contents (g/100g wet substrate) from 8 fermentation pits. All the measurements are measured at the center of the pit. We used these data to establish models for product formation and growth of yeast and lactic acid bacteria. An energy balance, component balances (for two types of microbial cell mass, products, glucose, protein, carbon dioxide, and water), atom balances (for C, H, and N), and an electron balance were used to predict the dry matter and starch content of the substrate, and the temperature measured at the center of the pit. These predictions were compared to measurements. A mathematical model for a fermentation pit requires many parameters. As far as possible, we used previously published values. Only kinetic parameters for microbial growth and product formation were determined in this study. Parameter definitions and values are given in Appendices A and B. 4.2.2 Assumptions This section lists the major assumptions; minor ones are mentioned with the balances. We assumed that the hydrolytic enzyme content of Daqu was so high that the hydrolysis of starch and protein was not rate limiting. The starter is very rich in enzymes (Wang, Ban, & Qiu, 2018), and 10% by weight is added to the substrate. Therefore, growth of yeast and lactic acid bacteria was assumed to be rate limiting. We assumed the composition of microbial biomass to be 𝐶𝐶𝐶𝐶2𝑂𝑂0.5𝑁𝑁0.2 and that of protein 𝐶𝐶𝐶𝐶1.7𝑂𝑂0.4𝑁𝑁0.3 (McKinlay, Zeikus, & Vieille, 2005; Shull, Watterson, & Kirleis, 1991). We assumed that ethanol production was inhibited only by ethanol, and lactic acid production only by lactic acid. Microbes were assumed not to be affected
Chapter 4
76
by lack of nutrients or water, too much carbon dioxide, or non-optimal temperature. Based on the last assumption, we used the same production rates everywhere in the fermenter, despite the temperature gradients in time and space. A cross-section of the fermentation pit is shown on the left in Figure 1. To simplify the model, the pit is assumed to be a perfect cylinder with the same volume and side wall area (Figure 1). We assume that radial conduction is the most important cooling mechanism, because the side wall area is 2.5 m2 whereas the bottom area is only 0.5 m2, and the radius is smaller than the height. Therefore, we divide the cylinder into 10 concentric cylindrical shells of equal volume (Figure 2). Each shell is assumed to be homogeneous with respect to temperature, but there are temperature differences between shells. We also take conduction via the bottom into account, but there are no vertical layers. We neglect conductive cooling at the top of the pit, because the gas in the headspace of the pit and the air above the lid are poor conductors. We do consider cooling by water evaporation. The water vapor is transported out of the pit by the produced carbon dioxide that escapes because the lid does not completely seal off the pit. We used two models for the soil around the pit. In Model 1 it is assumed to be infinitely deep and isothermal, while in Model 2 it is assumed to be an extra, non-isothermal layer with heat input from the pit and heat output to the soil below. In both models the soil below the pit is assumed to be infinitely deep and isothermal. The average temperature measured in the soil in the factory at a depth of 20 cm was 14 °C, the standard deviation was 2 °C, and there was no pattern connected to the pit temperature.
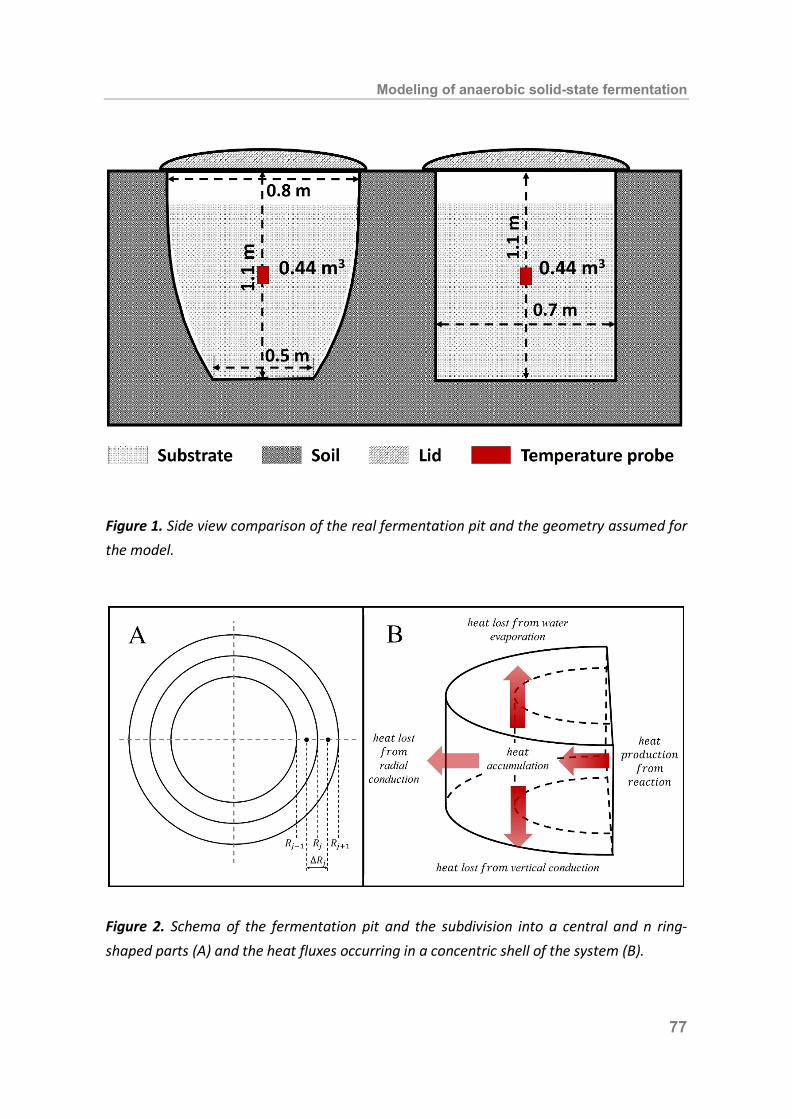
Modeling of anaerobic solid-state fermentation
77
Figure 1. Side view comparison of the real fermentation pit and the geometry assumed for the model.
Figure 2. Schema of the fermentation pit and the subdivision into a central and n ring-shaped parts (A) and the heat fluxes occurring in a concentric shell of the system (B).
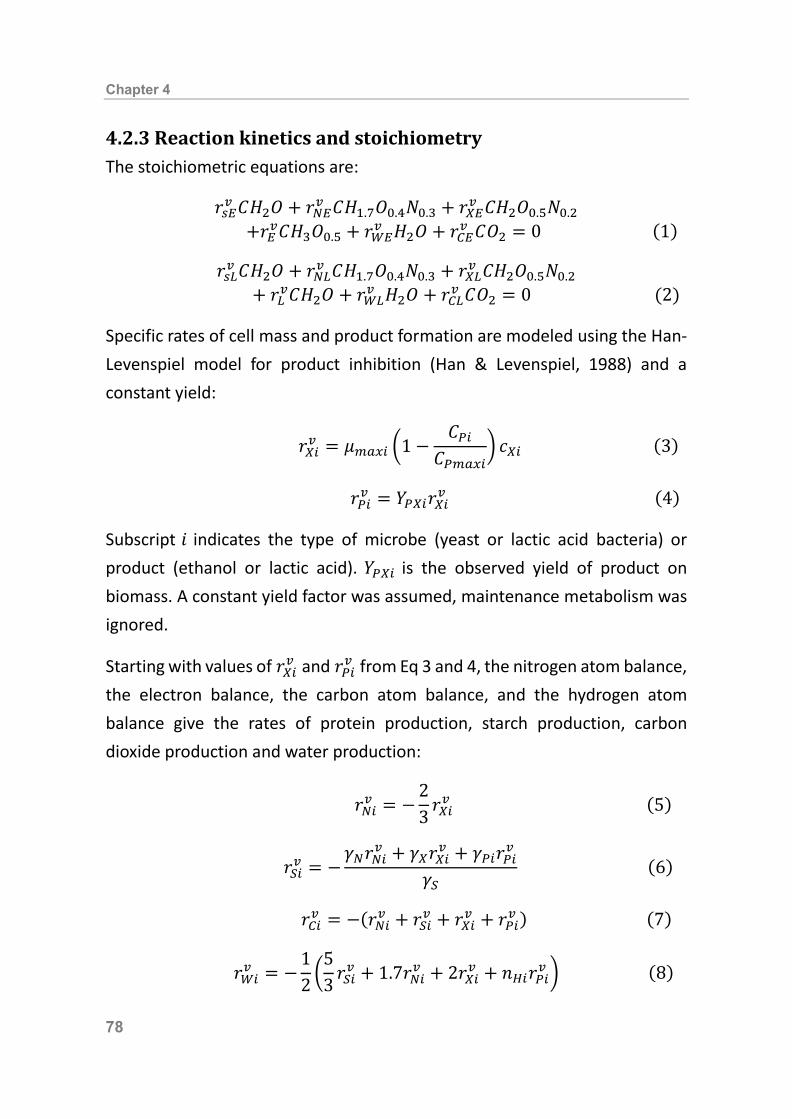
Chapter 4
78
4.2.3 Reaction kinetics and stoichiometry The stoichiometric equations are:
𝑟𝑟𝑠𝑠𝑠𝑠𝑣𝑣 𝐶𝐶𝐶𝐶2𝑂𝑂 + 𝑟𝑟𝑁𝑁𝑠𝑠𝑣𝑣 𝐶𝐶𝐶𝐶1.7𝑂𝑂0.4𝑁𝑁0.3 + 𝑟𝑟𝑋𝑋𝑠𝑠𝑣𝑣 𝐶𝐶𝐶𝐶2𝑂𝑂0.5𝑁𝑁0.2 +𝑟𝑟𝑠𝑠𝑣𝑣𝐶𝐶𝐶𝐶3𝑂𝑂0.5 + 𝑟𝑟𝑊𝑊𝑠𝑠
𝑣𝑣 𝐶𝐶2𝑂𝑂 + 𝑟𝑟𝐶𝐶𝑠𝑠𝑣𝑣 𝐶𝐶𝑂𝑂2 = 0 (1)
𝑟𝑟𝑠𝑠𝑠𝑠𝑣𝑣 𝐶𝐶𝐶𝐶2𝑂𝑂 + 𝑟𝑟𝑁𝑁𝑠𝑠𝑣𝑣 𝐶𝐶𝐶𝐶1.7𝑂𝑂0.4𝑁𝑁0.3 + 𝑟𝑟𝑋𝑋𝑠𝑠𝑣𝑣 𝐶𝐶𝐶𝐶2𝑂𝑂0.5𝑁𝑁0.2
+ 𝑟𝑟𝑠𝑠𝑣𝑣𝐶𝐶𝐶𝐶2𝑂𝑂 + 𝑟𝑟𝑊𝑊𝑠𝑠𝑣𝑣 𝐶𝐶2𝑂𝑂 + 𝑟𝑟𝐶𝐶𝑠𝑠𝑣𝑣 𝐶𝐶𝑂𝑂2 = 0 (2)
Specific rates of cell mass and product formation are modeled using the Han-Levenspiel model for product inhibition (Han & Levenspiel, 1988) and a constant yield:
𝑟𝑟𝑋𝑋𝑋𝑋𝑣𝑣 = 𝜇𝜇𝑚𝑚𝑚𝑚𝑚𝑚𝑋𝑋 �1 −𝐶𝐶𝑃𝑃𝑋𝑋
𝐶𝐶𝑃𝑃𝑚𝑚𝑚𝑚𝑚𝑚𝑋𝑋� 𝑐𝑐𝑋𝑋𝑋𝑋 (3)
𝑟𝑟𝑃𝑃𝑋𝑋𝑣𝑣 = 𝑌𝑌𝑃𝑃𝑋𝑋𝑋𝑋𝑟𝑟𝑋𝑋𝑋𝑋𝑣𝑣 (4)
Subscript 𝑖𝑖 indicates the type of microbe (yeast or lactic acid bacteria) or product (ethanol or lactic acid). 𝑌𝑌𝑃𝑃𝑋𝑋𝑋𝑋 is the observed yield of product on biomass. A constant yield factor was assumed, maintenance metabolism was ignored. Starting with values of 𝑟𝑟𝑋𝑋𝑋𝑋𝑣𝑣 and 𝑟𝑟𝑃𝑃𝑋𝑋𝑣𝑣 from Eq 3 and 4, the nitrogen atom balance, the electron balance, the carbon atom balance, and the hydrogen atom balance give the rates of protein production, starch production, carbon dioxide production and water production:
𝑟𝑟𝑁𝑁𝑋𝑋𝑣𝑣 = −23 𝑟𝑟𝑋𝑋𝑋𝑋
𝑣𝑣 (5)
𝑟𝑟𝑆𝑆𝑋𝑋𝑣𝑣 = −𝛾𝛾𝑁𝑁𝑟𝑟𝑁𝑁𝑋𝑋𝑣𝑣 + 𝛾𝛾𝑋𝑋𝑟𝑟𝑋𝑋𝑋𝑋𝑣𝑣 + 𝛾𝛾𝑃𝑃𝑋𝑋𝑟𝑟𝑃𝑃𝑋𝑋𝑣𝑣
𝛾𝛾𝑆𝑆 (6)
𝑟𝑟𝐶𝐶𝑋𝑋𝑣𝑣 = −(𝑟𝑟𝑁𝑁𝑋𝑋𝑣𝑣 + 𝑟𝑟𝑆𝑆𝑋𝑋𝑣𝑣 + 𝑟𝑟𝑋𝑋𝑋𝑋𝑣𝑣 + 𝑟𝑟𝑃𝑃𝑋𝑋𝑣𝑣 ) (7)
𝑟𝑟𝑊𝑊𝑋𝑋𝑣𝑣 = −
12 �
53 𝑟𝑟𝑆𝑆𝑋𝑋
𝑣𝑣 + 1.7𝑟𝑟𝑁𝑁𝑋𝑋𝑣𝑣 + 2𝑟𝑟𝑋𝑋𝑋𝑋𝑣𝑣 + 𝑛𝑛𝐻𝐻𝑋𝑋𝑟𝑟𝑃𝑃𝑋𝑋𝑣𝑣 � (8)
Modeling of anaerobic solid-state fermentation
79
Note that: In 𝑟𝑟𝑊𝑊𝑋𝑋
𝑣𝑣 we included the water for hydrolysis of starch to glucose. Hence the factor 5/3. 𝑛𝑛𝐻𝐻𝑋𝑋 is the number of hydrogen atoms per C mol product (3 for ethanol, 2 for lactic acid). The reaction heat is calculated via enthalpy of combustion balances for both products:
𝑟𝑟𝑄𝑄𝑋𝑋𝑣𝑣 = −(𝑟𝑟𝑆𝑆𝑋𝑋𝑣𝑣∆ℎ𝑐𝑐𝑆𝑆 + 𝑟𝑟𝑁𝑁𝑋𝑋𝑣𝑣 ∆ℎ𝑐𝑐𝑁𝑁 + 𝑟𝑟𝑋𝑋𝑋𝑋𝑣𝑣 ∆ℎ𝑐𝑐𝑋𝑋 + 𝑟𝑟𝑃𝑃𝑋𝑋𝑣𝑣 ∆ℎ𝑐𝑐𝑃𝑃) (9) Values for the combustion enthalpies are given in Appendix B. 4.2.4 Material balances and heat balances We assume that all carbon dioxide desorbs, and that the gas is saturated with water vapor. The reactor is not homogeneous for temperature and water vapor content, because radial conduction requires a radial temperature gradient, and this gives a radial gradient in 𝑦𝑦𝑊𝑊,𝑗𝑗. The carbon dioxide balance
gives the gas flow rate, and the water balance over the solids gives the water concentration in the solid phase (all terms in (𝐶𝐶)𝑚𝑚𝑚𝑚𝑚𝑚 𝑚𝑚−3 𝑑𝑑𝑑𝑑𝑦𝑦−1):
𝐹𝐹𝐺𝐺,𝑗𝑗𝑣𝑣 =
𝑟𝑟𝐶𝐶𝑣𝑣
1 − 𝑦𝑦𝑊𝑊,𝑗𝑗 (10)
𝑑𝑑𝑐𝑐𝑊𝑊,𝑗𝑗
𝑑𝑑𝑑𝑑 = 𝑟𝑟𝑊𝑊𝑣𝑣 − 𝐹𝐹𝐺𝐺,𝑗𝑗𝑣𝑣 𝑦𝑦𝑊𝑊,𝑗𝑗 (11)
The balances for the other components
(𝑘𝑘 ∈ {𝑆𝑆,𝑁𝑁,𝑋𝑋,𝐸𝐸, 𝐿𝐿}; in 𝐶𝐶𝑚𝑚𝑚𝑚𝑚𝑚 𝑚𝑚−3 𝑑𝑑𝑑𝑑𝑦𝑦−1) in the solids are:
𝑑𝑑𝑐𝑐𝑘𝑘𝑑𝑑𝑑𝑑 = 𝑟𝑟𝑘𝑘𝑣𝑣 (12)
For the comparison with measured starch and dry matter mass fractions, we need the mass concentrations of dry and wet matter. We assume that both
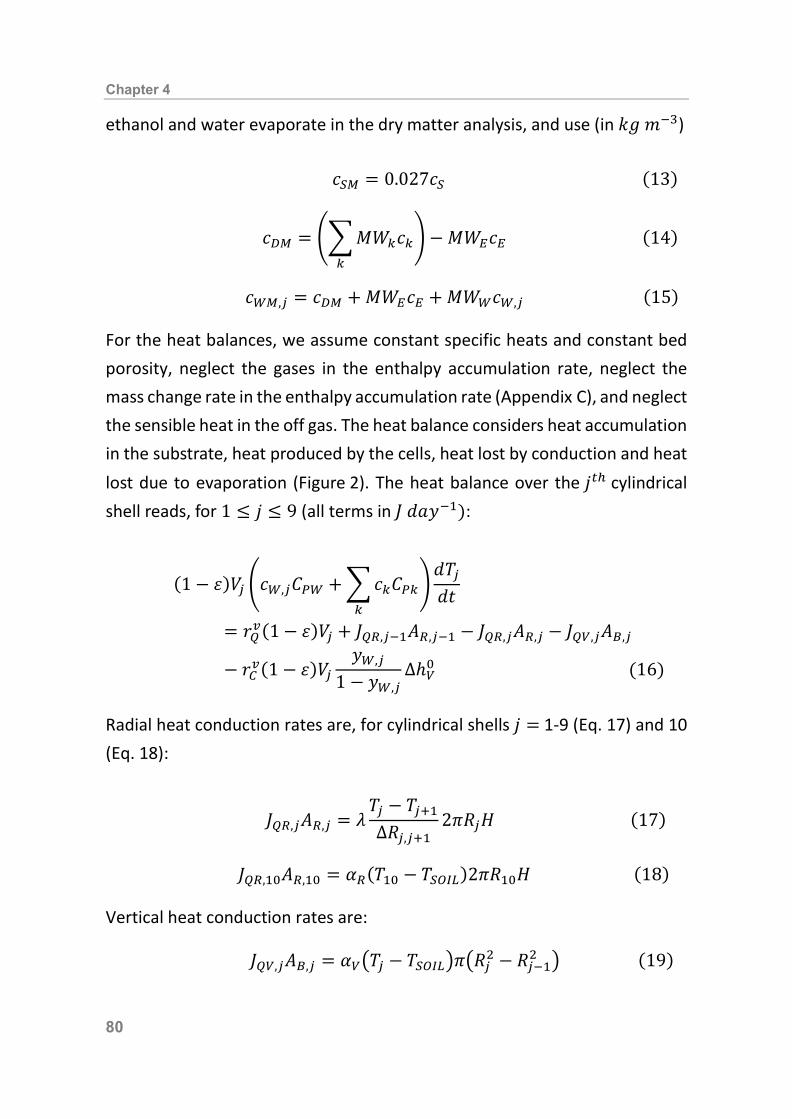
Chapter 4
80
ethanol and water evaporate in the dry matter analysis, and use (in 𝑘𝑘𝑘𝑘 𝑚𝑚−3)
𝑐𝑐𝑆𝑆𝑆𝑆 = 0.027𝑐𝑐𝑆𝑆 (13)
𝑐𝑐𝐷𝐷𝑆𝑆 = ��𝑀𝑀𝑊𝑊𝑘𝑘𝑐𝑐𝑘𝑘𝑘𝑘
� −𝑀𝑀𝑊𝑊𝑠𝑠𝑐𝑐𝑠𝑠 (14)
𝑐𝑐𝑊𝑊𝑆𝑆,𝑗𝑗 = 𝑐𝑐𝐷𝐷𝑆𝑆 + 𝑀𝑀𝑊𝑊𝑠𝑠𝑐𝑐𝑠𝑠 + 𝑀𝑀𝑊𝑊𝑊𝑊𝑐𝑐𝑊𝑊,𝑗𝑗 (15)
For the heat balances, we assume constant specific heats and constant bed porosity, neglect the gases in the enthalpy accumulation rate, neglect the mass change rate in the enthalpy accumulation rate (Appendix C), and neglect the sensible heat in the off gas. The heat balance considers heat accumulation in the substrate, heat produced by the cells, heat lost by conduction and heat lost due to evaporation (Figure 2). The heat balance over the 𝑗𝑗𝑡𝑡ℎ cylindrical shell reads, for 1 ≤ 𝑗𝑗 ≤ 9 (all terms in 𝐽𝐽 𝑑𝑑𝑑𝑑𝑦𝑦−1):
(1 − 𝜀𝜀)𝑉𝑉𝑗𝑗 �𝑐𝑐𝑊𝑊,𝑗𝑗𝐶𝐶𝑃𝑃𝑊𝑊 + �𝑐𝑐𝑘𝑘𝐶𝐶𝑃𝑃𝑘𝑘𝑘𝑘
�𝑑𝑑𝑇𝑇𝑗𝑗𝑑𝑑𝑑𝑑
= 𝑟𝑟𝑄𝑄𝑣𝑣(1− 𝜀𝜀)𝑉𝑉𝑗𝑗 + 𝐽𝐽𝑄𝑄𝑄𝑄,𝑗𝑗−1𝐴𝐴𝑄𝑄,𝑗𝑗−1 − 𝐽𝐽𝑄𝑄𝑄𝑄,𝑗𝑗𝐴𝐴𝑄𝑄,𝑗𝑗 − 𝐽𝐽𝑄𝑄𝑄𝑄,𝑗𝑗𝐴𝐴𝐵𝐵,𝑗𝑗
− 𝑟𝑟𝐶𝐶𝑣𝑣(1 − 𝜀𝜀)𝑉𝑉𝑗𝑗𝑦𝑦𝑊𝑊,𝑗𝑗
1 − 𝑦𝑦𝑊𝑊,𝑗𝑗∆ℎ𝑄𝑄0 (16)
Radial heat conduction rates are, for cylindrical shells 𝑗𝑗 = 1-9 (Eq. 17) and 10 (Eq. 18):
𝐽𝐽𝑄𝑄𝑄𝑄,𝑗𝑗𝐴𝐴𝑄𝑄,𝑗𝑗 = 𝜆𝜆𝑇𝑇𝑗𝑗 − 𝑇𝑇𝑗𝑗+1∆𝑅𝑅𝑗𝑗,𝑗𝑗+1
2𝜋𝜋𝑅𝑅𝑗𝑗𝐶𝐶 (17)
𝐽𝐽𝑄𝑄𝑄𝑄,10𝐴𝐴𝑄𝑄,10 = 𝛼𝛼𝑄𝑄(𝑇𝑇10 − 𝑇𝑇𝑆𝑆𝑆𝑆𝑆𝑆𝑠𝑠)2𝜋𝜋𝑅𝑅10𝐶𝐶 (18)
Vertical heat conduction rates are:
𝐽𝐽𝑄𝑄𝑄𝑄,𝑗𝑗𝐴𝐴𝐵𝐵,𝑗𝑗 = 𝛼𝛼𝑄𝑄�𝑇𝑇𝑗𝑗 − 𝑇𝑇𝑆𝑆𝑆𝑆𝑆𝑆𝑠𝑠�𝜋𝜋�𝑅𝑅𝑗𝑗2 − 𝑅𝑅𝑗𝑗−12 � (19)
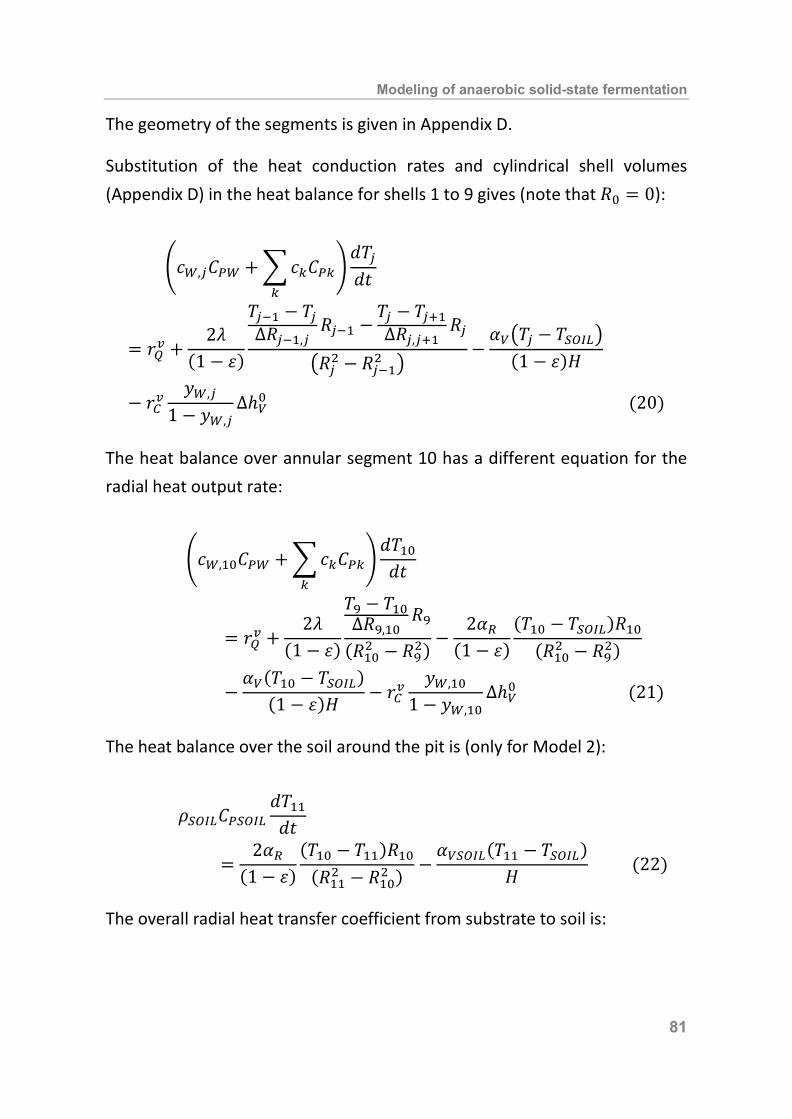
Modeling of anaerobic solid-state fermentation
81
The geometry of the segments is given in Appendix D. Substitution of the heat conduction rates and cylindrical shell volumes (Appendix D) in the heat balance for shells 1 to 9 gives (note that 𝑅𝑅0 = 0):
�𝑐𝑐𝑊𝑊,𝑗𝑗𝐶𝐶𝑃𝑃𝑊𝑊 + �𝑐𝑐𝑘𝑘𝐶𝐶𝑃𝑃𝑘𝑘𝑘𝑘
�𝑑𝑑𝑇𝑇𝑗𝑗𝑑𝑑𝑑𝑑
= 𝑟𝑟𝑄𝑄𝑣𝑣 +2𝜆𝜆
(1 − 𝜀𝜀)
𝑇𝑇𝑗𝑗−1 − 𝑇𝑇𝑗𝑗∆𝑅𝑅𝑗𝑗−1,𝑗𝑗
𝑅𝑅𝑗𝑗−1 −𝑇𝑇𝑗𝑗 − 𝑇𝑇𝑗𝑗+1∆𝑅𝑅𝑗𝑗,𝑗𝑗+1
𝑅𝑅𝑗𝑗
�𝑅𝑅𝑗𝑗2 − 𝑅𝑅𝑗𝑗−12 �−𝛼𝛼𝑄𝑄�𝑇𝑇𝑗𝑗 − 𝑇𝑇𝑆𝑆𝑆𝑆𝑆𝑆𝑠𝑠�
(1 − 𝜀𝜀)𝐶𝐶
− 𝑟𝑟𝐶𝐶𝑣𝑣𝑦𝑦𝑊𝑊,𝑗𝑗
1 − 𝑦𝑦𝑊𝑊,𝑗𝑗∆ℎ𝑄𝑄0 (20)
The heat balance over annular segment 10 has a different equation for the radial heat output rate:
�𝑐𝑐𝑊𝑊,10𝐶𝐶𝑃𝑃𝑊𝑊 + �𝑐𝑐𝑘𝑘𝐶𝐶𝑃𝑃𝑘𝑘𝑘𝑘
�𝑑𝑑𝑇𝑇10𝑑𝑑𝑑𝑑
= 𝑟𝑟𝑄𝑄𝑣𝑣 +2𝜆𝜆
(1 − 𝜀𝜀)
𝑇𝑇9 − 𝑇𝑇10∆𝑅𝑅9,10
𝑅𝑅9
(𝑅𝑅102 − 𝑅𝑅92) −2𝛼𝛼𝑄𝑄
(1− 𝜀𝜀)(𝑇𝑇10 − 𝑇𝑇𝑆𝑆𝑆𝑆𝑆𝑆𝑠𝑠)𝑅𝑅10
(𝑅𝑅102 − 𝑅𝑅92)
−𝛼𝛼𝑄𝑄(𝑇𝑇10 − 𝑇𝑇𝑆𝑆𝑆𝑆𝑆𝑆𝑠𝑠)
(1 − 𝜀𝜀)𝐶𝐶 − 𝑟𝑟𝐶𝐶𝑣𝑣𝑦𝑦𝑊𝑊,10
1 − 𝑦𝑦𝑊𝑊,10∆ℎ𝑄𝑄0 (21)
The heat balance over the soil around the pit is (only for Model 2):
𝜌𝜌𝑆𝑆𝑆𝑆𝑆𝑆𝑠𝑠𝐶𝐶𝑃𝑃𝑆𝑆𝑆𝑆𝑆𝑆𝑠𝑠𝑑𝑑𝑇𝑇11𝑑𝑑𝑑𝑑
=2𝛼𝛼𝑄𝑄
(1 − 𝜀𝜀)(𝑇𝑇10 − 𝑇𝑇11)𝑅𝑅10
(𝑅𝑅112 − 𝑅𝑅102 ) −𝛼𝛼𝑄𝑄𝑆𝑆𝑆𝑆𝑆𝑆𝑠𝑠(𝑇𝑇11 − 𝑇𝑇𝑆𝑆𝑆𝑆𝑆𝑆𝑠𝑠)
𝐶𝐶 (22)
The overall radial heat transfer coefficient from substrate to soil is:

Chapter 4
82
𝛼𝛼𝑄𝑄 =1
0.5(𝑅𝑅10 − 𝑅𝑅9)𝜆𝜆 + 𝑑𝑑𝑊𝑊
𝜆𝜆𝑊𝑊+ 1𝛼𝛼𝑄𝑄𝑆𝑆𝑆𝑆𝑆𝑆𝑠𝑠
(23)
The overall vertical heat transfer coefficient from substrate to soil is:
𝛼𝛼𝑄𝑄 =1
0.5𝐶𝐶𝜆𝜆 + 𝑑𝑑𝑊𝑊
𝜆𝜆𝑊𝑊+ 1𝛼𝛼𝑄𝑄𝑆𝑆𝑆𝑆𝑆𝑆𝑠𝑠
(24)
The radial heat transfer coefficient in the finite soil segment around the reactor (only in model 2) is:
𝛼𝛼𝑄𝑄𝑆𝑆𝑆𝑆𝑆𝑆𝑠𝑠 =𝜆𝜆𝑆𝑆𝑆𝑆𝑆𝑆𝑠𝑠
0.5(𝑅𝑅𝑆𝑆𝑆𝑆𝑆𝑆𝑠𝑠 − 𝑅𝑅10) (25)
For the heat transfer coefficient in infinite soil (for wall and bottom in model 1, for bottom only in model 2), we assume that the reactor is a sphere surrounded by infinite, stagnant material:
𝑁𝑁𝑁𝑁 ≡𝛼𝛼𝑄𝑄𝑆𝑆𝑆𝑆𝑆𝑆𝑠𝑠2𝑅𝑅10
𝜆𝜆𝑆𝑆𝑆𝑆𝑆𝑆𝑠𝑠=𝛼𝛼𝑄𝑄𝑆𝑆𝑆𝑆𝑆𝑆𝑠𝑠2𝑅𝑅10
𝜆𝜆𝑆𝑆𝑆𝑆𝑆𝑆𝑠𝑠= 2 (26)
𝑁𝑁𝑁𝑁 is the Nusselt number. We use a value of 2 for 𝑁𝑁𝑁𝑁, which is valid for a sphere in infinite, stagnant fluid. We use it as an approximation for the pit. The vapor pressure of water at given temperatures is modeled using the Clausius-Clapeyron equation and Avogadro’s law (Poyet & Charles, 2009), with parameters derived from tabulated water vapor pressures in the Dortmund Data Bank (Onken, Rareynies, & Gmehling, 1989). 4.3 Materials and methods 4.3.1 Fermentation, online measurement and sampling The fermentation was done as described elsewhere (Kong, et al., 2014). First, sorghum was soaked in fresh water at room temperature for 24 h and then
Modeling of anaerobic solid-state fermentation
83
steamed for 2 h with rice husk (1%, w/w). After cooling down to room temperature (20 °C), the steamed sorghum was mixed with 10% (w/w) of Daqu starter powder and the moisture content of the mixture was around 52% (w/w) of wet substrate. For each batch, 8 fermentation pits were filled with 300 kg solid substrate (steamed sorghum with Daqu starter) each and left to ferment for 28 days. A temperature sensor (MicroDetect Co, Ltd., Tangshan, Hebei Province, China) was placed in the vertical and horizontal center of the fermentation pit. The online temperature data were collected with computer software based on LabVIEW 2016 (National Instruments Co, Ltd., Austin, TX) and recorded by Microsoft SQL Server 2012. Fermentation samples (50 g) were collected in the vertical and horizontal center of fermentation pits at day 0, 3, 7, 11, 15, 21, and 28, and stored at -20 °C before analysis. 4.3.2 Chemical analysis The concentrations of ethanol, lactic acid and glucose were measured by high-performance liquid chromatography as described elsewhere (Hu, Du, Ren, & Xu, 2016). The starch content was defined as weight of starch in 100 g of wet substrate (w/w, %) and measured through near infrared spectroscopy (DS2500, Foss, Hilleroed, Denmark). The dry matter content was defined as dry matter weight in 100 g of wet substrate (w/w, %) measured through a vacuum oven (Yiheng Co., Ltd. Shanghai, China) at 60 °C and 133 Pa for 24 h. 4.3.3 Kinetic parameter estimation The kinetic parameters were estimated in two steps: (1) parameters for the standard logistic law (Eq. 27) were estimated from measured product concentrations with R (version 3.4.3), and (2) these parameters were converted to parameters for our model. The details are described below. The standard logistic law with 3 parameters (𝑑𝑑𝑎𝑎𝑦𝑦𝑚𝑚, 𝑥𝑥𝑚𝑚𝑖𝑖𝑑𝑑 and 𝑎𝑎𝑐𝑐𝑑𝑑𝑚𝑚) reads:
𝑓𝑓(𝑥𝑥) =𝑑𝑑𝑎𝑎𝑦𝑦𝑚𝑚
1 + 𝑒𝑒𝑚𝑚𝑚𝑚𝑋𝑋𝑥𝑥−𝑚𝑚𝑠𝑠𝑐𝑐𝑚𝑚𝑠𝑠
(27)

Chapter 4
84
The algebraic solution of the combined biomass and product balances (Eq. 3 through 4) is:
𝑐𝑐𝑃𝑃 = (𝑐𝑐𝑃𝑃0 − 𝑌𝑌𝑃𝑃𝑋𝑋𝑐𝑐𝑋𝑋0) +
𝑐𝑐𝑃𝑃𝑚𝑚𝑚𝑚𝑚𝑚 − (𝑐𝑐𝑃𝑃0 − 𝑌𝑌𝑃𝑃𝑋𝑋𝑐𝑐𝑋𝑋0)
1 + �𝑐𝑐𝑃𝑃𝑚𝑚𝑚𝑚𝑚𝑚 − 𝑐𝑐𝑃𝑃0𝑌𝑌𝑃𝑃𝑋𝑋𝑐𝑐𝑋𝑋0
� 𝑒𝑒−�𝑐𝑐𝑃𝑃𝑃𝑃𝑃𝑃𝑃𝑃−(𝑐𝑐𝑃𝑃0−𝑌𝑌𝑃𝑃𝑃𝑃𝑐𝑐𝑃𝑃0)
𝑐𝑐𝑃𝑃𝑃𝑃𝑃𝑃𝑃𝑃�𝜇𝜇𝑃𝑃𝑃𝑃𝑃𝑃𝑡𝑡
(28)
Assuming
𝑐𝑐𝑝𝑝0 − 𝑌𝑌𝑃𝑃𝑋𝑋𝑐𝑐𝑋𝑋0 = 0 (29) Gives
𝑐𝑐𝑃𝑃 =𝑐𝑐𝑃𝑃𝑚𝑚𝑚𝑚𝑚𝑚
1 + � 𝑐𝑐𝑃𝑃𝑚𝑚𝑚𝑚𝑚𝑚𝑌𝑌𝑃𝑃𝑋𝑋𝑐𝑐𝑋𝑋0
− 1� 𝑒𝑒−𝜇𝜇𝑃𝑃𝑃𝑃𝑃𝑃𝑡𝑡 (30)
Therefore, our model parameters are
𝑐𝑐𝑃𝑃𝑚𝑚𝑚𝑚𝑚𝑚 = 𝑑𝑑𝑎𝑎𝑦𝑦𝑚𝑚 (31)
𝜇𝜇𝑚𝑚𝑚𝑚𝑚𝑚 =1
𝑎𝑎𝑐𝑐𝑑𝑑𝑚𝑚 (32)
𝑐𝑐𝑃𝑃0 =
𝑐𝑐𝑃𝑃𝑚𝑚𝑚𝑚𝑚𝑚
1 + 𝑒𝑒𝑡𝑡𝑚𝑚𝑋𝑋𝑥𝑥𝑠𝑠𝑐𝑐𝑚𝑚𝑠𝑠
(33)
Due to the lack of biomass measurements, we cannot reliably estimate 𝑌𝑌𝑃𝑃𝑋𝑋 and 𝑐𝑐𝑋𝑋0 from the data. Therefore, the yield of product on biomass (𝑌𝑌𝑃𝑃𝑋𝑋) was taken from the literature (Table 1). 4.3.4 Sensitivity analysis The model introduced above has many parameters that can influence the accuracy of the simulation. Starting from published parameter values, the combination of parameter values giving the best fit of the model to data was achieved through trial and error (Appendix B). Starting from this best combination of parameter values, we varied the values of ∆ℎ𝑐𝑐𝑆𝑆, ∆ℎ𝑐𝑐𝑁𝑁, ∆ℎ𝑐𝑐𝑋𝑋,
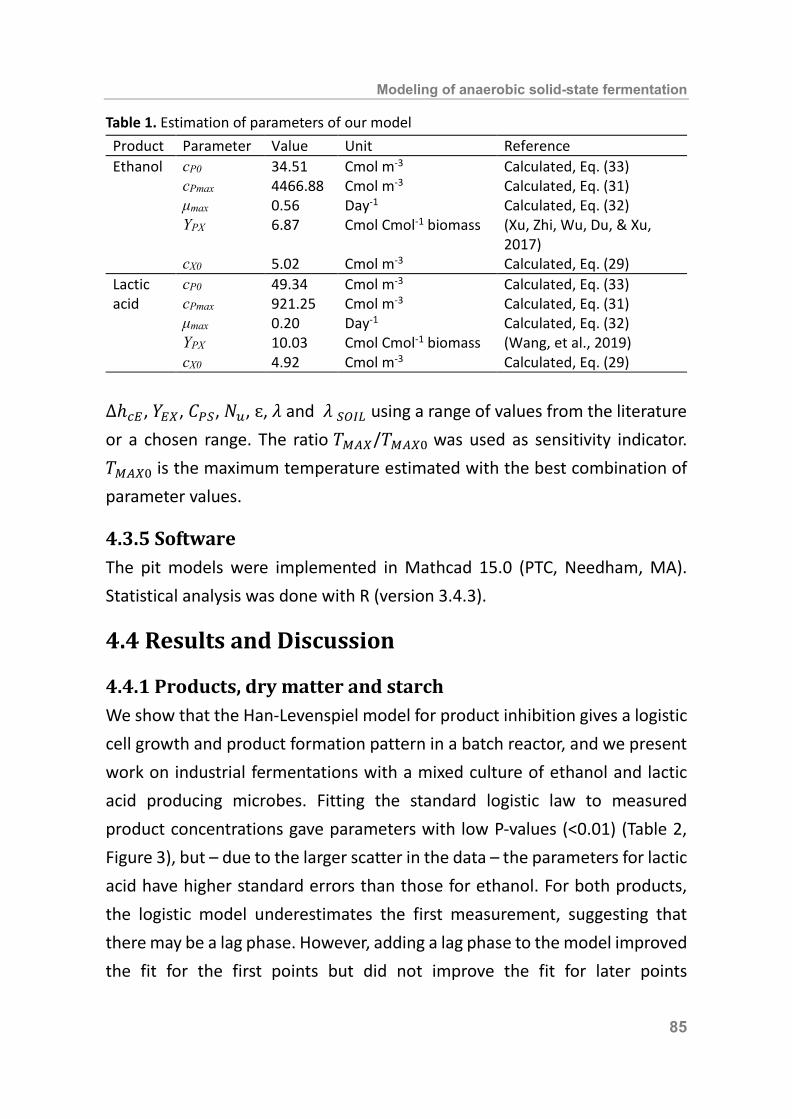
Modeling of anaerobic solid-state fermentation
85
Table 1. Estimation of parameters of our model
∆ℎ𝑐𝑐𝑠𝑠, 𝑌𝑌𝑠𝑠𝑋𝑋, 𝐶𝐶𝑃𝑃𝑆𝑆, 𝑁𝑁𝑢𝑢, ɛ, 𝜆𝜆 and 𝜆𝜆 𝑆𝑆𝑆𝑆𝑆𝑆𝑠𝑠 using a range of values from the literature or a chosen range. The ratio 𝑇𝑇𝑆𝑆𝑀𝑀𝑋𝑋 /𝑇𝑇𝑆𝑆𝑀𝑀𝑋𝑋0 was used as sensitivity indicator. 𝑇𝑇𝑆𝑆𝑀𝑀𝑋𝑋0 is the maximum temperature estimated with the best combination of parameter values. 4.3.5 Software The pit models were implemented in Mathcad 15.0 (PTC, Needham, MA). Statistical analysis was done with R (version 3.4.3). 4.4 Results and Discussion 4.4.1 Products, dry matter and starch We show that the Han-Levenspiel model for product inhibition gives a logistic cell growth and product formation pattern in a batch reactor, and we present work on industrial fermentations with a mixed culture of ethanol and lactic acid producing microbes. Fitting the standard logistic law to measured product concentrations gave parameters with low P-values (<0.01) (Table 2, Figure 3), but – due to the larger scatter in the data – the parameters for lactic acid have higher standard errors than those for ethanol. For both products, the logistic model underestimates the first measurement, suggesting that there may be a lag phase. However, adding a lag phase to the model improved the fit for the first points but did not improve the fit for later points
Product Parameter Value Unit Reference Ethanol cP0 34.51 Cmol m-3 Calculated, Eq. (33)
cPmax 4466.88 Cmol m-3 Calculated, Eq. (31) μmax 0.56 Day-1 Calculated, Eq. (32) YPX 6.87 Cmol Cmol-1 biomass (Xu, Zhi, Wu, Du, & Xu,
2017) cX0 5.02 Cmol m-3 Calculated, Eq. (29)
Lactic acid
cP0 49.34 Cmol m-3 Calculated, Eq. (33) cPmax 921.25 Cmol m-3 Calculated, Eq. (31) μmax 0.20 Day-1 Calculated, Eq. (32) YPX 10.03 Cmol Cmol-1 biomass (Wang, et al., 2019) cX0 4.92 Cmol m-3 Calculated, Eq. (29)

Chapter 4
86
significantly. Because the initial production does not generate a lot of heat, and the first measurements are the most inaccurate ones, we decided not to add a fourth parameter to the model. Table 2. Estimation of parameters of the standard logistic function
Product Parameter in logistic function
Value Std. Error P-value Significance
Ethanol asym 4466.88 94.15 1.2 × 10⁻⁶ *** tmid 8.74 0.25 4.1 × 10⁻⁶ *** scal 1.80 0.19 6.5 × 10⁻⁴ ***
Lactic acid
asym 921.25 115.59 1.3 × 10⁻³ *** xmid 14.13 2.00 2.1 × 10⁻³ ** scal 4.92 1.34 2.0 × 10⁻² *
Significant codes: ***: P < 0.001, **: P < 0.01, *: P < 0.05 The estimated values of the parameters of the model are shown in Table 1. The fitted 𝜇𝜇𝑚𝑚𝑚𝑚𝑚𝑚-values of 0.56 day-1 and 0.20 day-1 for the ethanol and lactic acid producing microorganisms, respectively, are comparable to those for microbes from a Chinese liquor fermentation system which were cultivated in liquid media (Liang, et al., 2015; Xu, et al., 2017). The fitted 𝑐𝑐𝑃𝑃𝑚𝑚𝑚𝑚𝑚𝑚 values were similar to those reported for ethanol tolerant S. cerevisiae (4978 Cmol/m3) (Luong, 1985) and lactic acid tolerant Lactobacillus amylophilus (713 Cmol/m3) (Mercier, Yerushalmi, Rouleau, & Dochain, 1992). The problem with this comparison is that our values are expressed per 𝑚𝑚3 of wet solid substrate and previously reported values are expressed per 𝑚𝑚3 of liquid broth. For a reliable comparison, we should use the chemical potentials (or activities) of the products in both systems, which we do not know. If we assume that all water in the solid substrate is available as solvent and the products are dissolved in the water, our 𝑐𝑐𝑃𝑃𝑚𝑚𝑚𝑚𝑚𝑚 values increase about 1.5-fold (the water content is about 65%), making them a lot higher than previously reported values. This is a point for further research. The kinetic model based on the Han-Levenspiel equation describes the measured product concentrations, but we did not test its ability to predict them. This would require, for example, varying the quantity or composition of

Modeling of anaerobic solid-state fermentation
87
Figure 3. Measured and predicted product profiles. Data show the average and standard deviation of 8 fermentation pits. the inoculum, or varying the initial product concentrations. It is not feasible to do such things in an industrial-scale production facility. Therefore, additional laboratory studies are needed to validate the kinetic model. To improve the predictive value of the kinetic model, first the parameters of microbial growth and product formation must be estimated more accurately. We used 7 data points (𝑐𝑐𝑃𝑃) from a fermentation run to estimate 3 parameters (𝜇𝜇𝑚𝑚𝑚𝑚𝑚𝑚, 𝑐𝑐𝑃𝑃𝑚𝑚𝑚𝑚𝑚𝑚, 𝑐𝑐𝑃𝑃0), took 1 parameter from the literature (𝑌𝑌𝑃𝑃𝑋𝑋), and estimated 1 parameter based on an assumption (𝑐𝑐𝑋𝑋0 ). It would be better to have independent experiments with more measurements, including measurements of microbial biomass concentrations. Initial and final amounts of materials in the pit could not be measured in the factory. Instead, the starch and dry matter contents of the substrate were measured in the horizontal and vertical center of the pit. In the model, initial
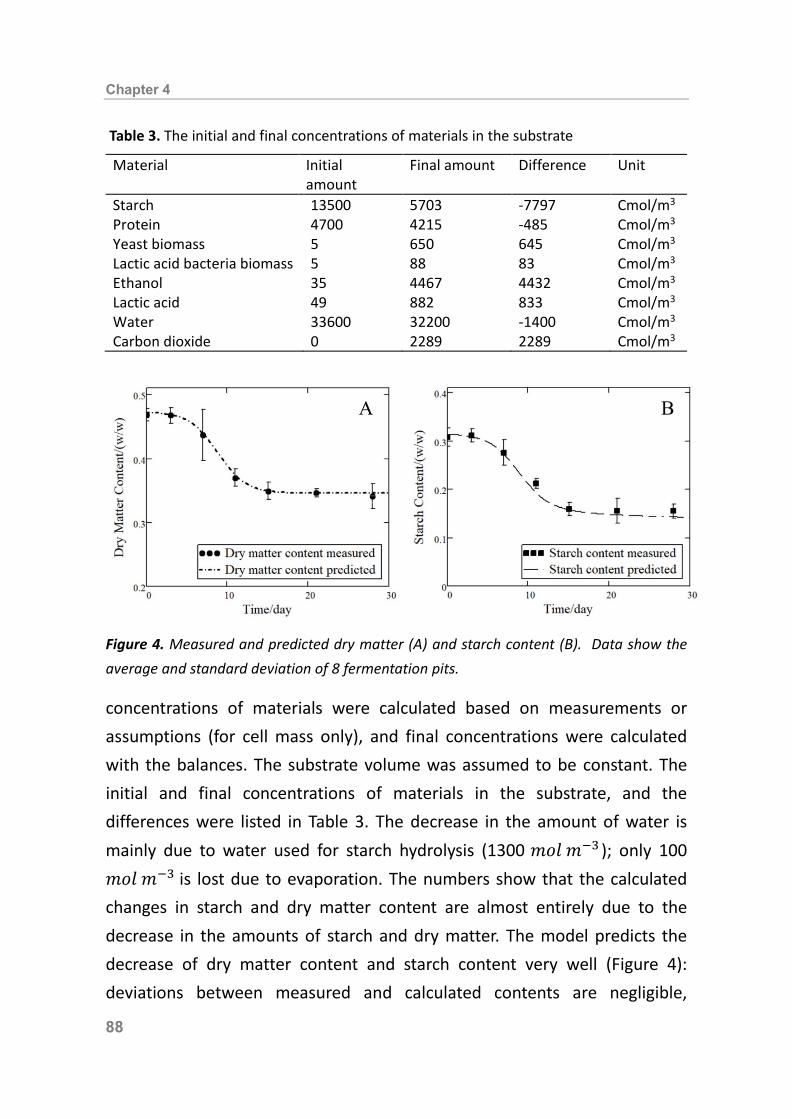
Chapter 4
88
Table 3. The initial and final concentrations of materials in the substrate
Figure 4. Measured and predicted dry matter (A) and starch content (B). Data show the average and standard deviation of 8 fermentation pits. concentrations of materials were calculated based on measurements or assumptions (for cell mass only), and final concentrations were calculated with the balances. The substrate volume was assumed to be constant. The initial and final concentrations of materials in the substrate, and the differences were listed in Table 3. The decrease in the amount of water is mainly due to water used for starch hydrolysis (1300 𝑚𝑚𝑚𝑚𝑚𝑚 𝑚𝑚−3 ); only 100 𝑚𝑚𝑚𝑚𝑚𝑚 𝑚𝑚−3 is lost due to evaporation. The numbers show that the calculated changes in starch and dry matter content are almost entirely due to the decrease in the amounts of starch and dry matter. The model predicts the decrease of dry matter content and starch content very well (Figure 4): deviations between measured and calculated contents are negligible,
Material Initial amount
Final amount Difference Unit
Starch 13500 5703 -7797 Cmol/m3 Protein 4700 4215 -485 Cmol/m3 Yeast biomass 5 650 645 Cmol/m3 Lactic acid bacteria biomass 5 88 83 Cmol/m3 Ethanol 35 4467 4432 Cmol/m3 Lactic acid 49 882 833 Cmol/m3 Water 33600 32200 -1400 Cmol/m3 Carbon dioxide 0 2289 2289 Cmol/m3
Modeling of anaerobic solid-state fermentation
89
considering the errors in the measurements. The changes in starch content and dry matter content are due to changes in the amounts of starch, protein, dry microbial cell mass and water. The problem with contents is that they depend on several component masses, and errors in the prediction of these masses could cancel out. Model parameters that affect the calculated changes in starch and dry matter content are 𝑌𝑌𝑃𝑃𝑋𝑋, 𝛾𝛾𝑋𝑋, 𝛾𝛾𝑁𝑁 and 𝑛𝑛𝐻𝐻𝑁𝑁. We found that over ranges reported in the literature in the values of these parameters did not give more than about 3% increase in −𝑟𝑟𝑆𝑆𝑣𝑣 and in the net decomposition rate of dry matter, because most of the starch is converted to fermentation products and 67% of the biomass carbon is derived from the substrate protein. Therefore, these model parameters are not critical for predicting the starch and dry matter contents. 4.4.2 Temperature The experimental data show that ethanol production is the main heat source during the first 12 days of the batch culture (Figure 3 and Figure 5), and the temperature peaks when ethanol has nearly reached its maximum concentration. After that, there is still heat produced by lactic acid bacteria, but the production rate declines, and the pit cools down. Models 1 and 2 both predict the increase in temperature in the center of the pit accurately (Figure 5). However, model 2 (pit surrounded by finite, non-isothermal soil) gives a better prediction of the peak temperature and the temperature decrease, resulting in a smaller average deviation from the measured temperature. Model 1 (pit surrounded by infinite, isothermal soil) always underestimates the pit temperature: the maximum deviation is 2 °C, which is 13% of the 16 °C temperature difference between the center of the pit and the soil (Figure 5). This shows that model 2 is more realistic. Heat production due to lactic acid formation is not very important. If we consider the heat production due to ethanol formation only, we expect a symmetrical temperature curve in the pit if the temperature of the soil around
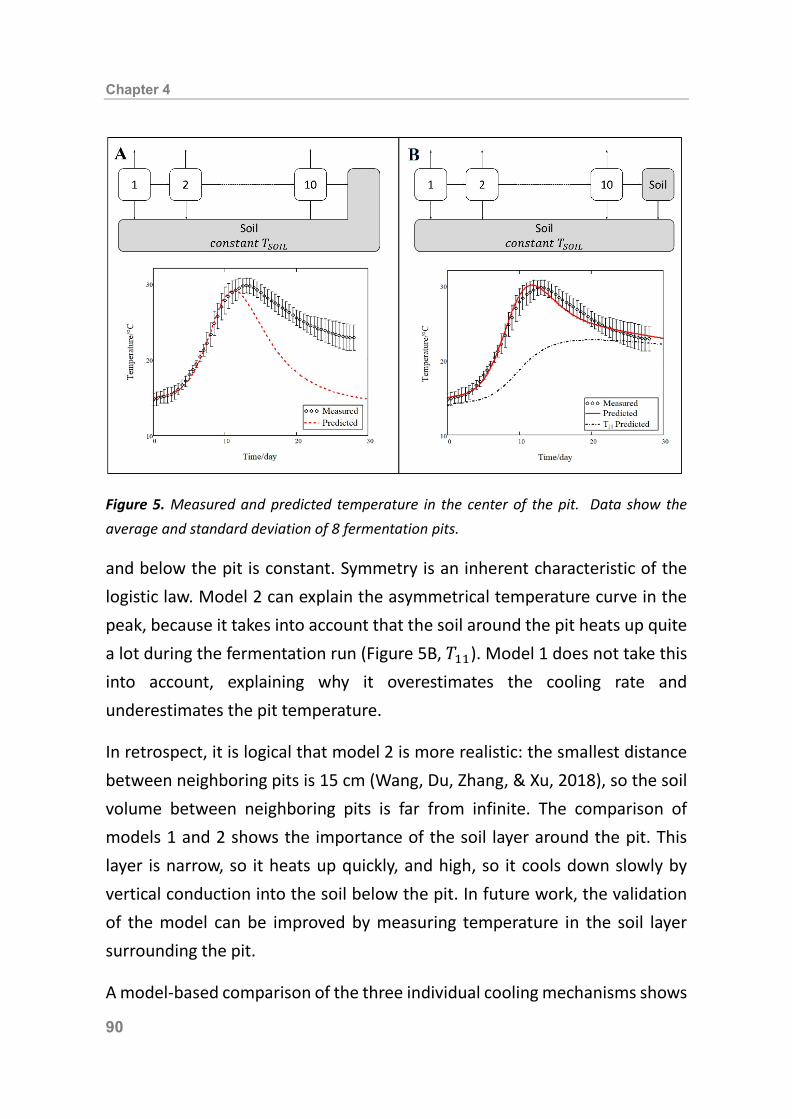
Chapter 4
90
Figure 5. Measured and predicted temperature in the center of the pit. Data show the average and standard deviation of 8 fermentation pits. and below the pit is constant. Symmetry is an inherent characteristic of the logistic law. Model 2 can explain the asymmetrical temperature curve in the peak, because it takes into account that the soil around the pit heats up quite a lot during the fermentation run (Figure 5B, 𝑇𝑇11). Model 1 does not take this into account, explaining why it overestimates the cooling rate and underestimates the pit temperature. In retrospect, it is logical that model 2 is more realistic: the smallest distance between neighboring pits is 15 cm (Wang, Du, Zhang, & Xu, 2018), so the soil volume between neighboring pits is far from infinite. The comparison of models 1 and 2 shows the importance of the soil layer around the pit. This layer is narrow, so it heats up quickly, and high, so it cools down slowly by vertical conduction into the soil below the pit. In future work, the validation of the model can be improved by measuring temperature in the soil layer surrounding the pit. A model-based comparison of the three individual cooling mechanisms shows

Modeling of anaerobic solid-state fermentation
91
that radial conduction is by far the most important mechanism (79% of the removed heat), vertical conduction is almost negligible (4%), and water evaporation has an important effect (16%). Removing the water evaporation mostly affects the peak temperature; this can be explained with the higher water vapor pressures at higher temperatures, which make this cooling mechanism more important at higher temperatures. We expect that adding vertical layers to the model will increase the importance of vertical cooling, as it allows for a higher temperature gradient near the bottom. However, vertical cooling will remain relatively unimportant due to the small bottom area and the height/radius ratio. We omitted heat production by microbes other than yeast and lactic acid bacteria. Obligate aerobes like Aspergillus spp. from the Daqu starter may also produce some heat in the beginning of the fermentation (Taylor & Duodu, 2019). However, the initial amount of oxygen in the pit is too small to generate an important amount of heat. 4.4.3 Sensitivity analysis of temperature prediction The results of the sensitivity analysis are shown in Figure 6. We focused on the yield of ethanol on cell mass for ethanol producing microbes (because ethanol production is the major source of heat production), combustion enthalpies of reactants and products, and the most important physical parameters. Their range of uncertainty was determined based on published values or on an arbitrary range from 0.5-2 times the value used in the calculations shown before (for 𝑁𝑁𝑁𝑁). Figure 6A shows that the biggest uncertainty in the model is associated with the heat production rate. Published values of the combustion enthalpies of starch and ethanol differ less than 1%, but this can give big differences in 𝑟𝑟𝑄𝑄𝑣𝑣.
The problem is that most of the heat of combustion of starch ends up in the fermentation product, and only 3.5% is converted to sensible heat. This means that errors of 1% in the used heats of combustion of starch and ethanol can –in the worst case – give 20% error in the calculated heat production rate.

Chapter 4
92
Figure 6. Sensitivity analysis of important and uncertain parameters: enthalpy of combustion (A) and others (B).

Modeling of anaerobic solid-state fermentation
93
Published values for the heats of combustion of protein and biomass differ up to 10%, and this uncertainty can also have a large effect on the heat production rate. The standard practice of calculating the heat production rate from published combustion enthalpies of reactants and products is unreliable for anaerobic fermentation. A measured heat production rate is required. The heat loss is calculated from the thermal conductivities and porosity of substrate and soil. The sensitivity analysis indicates that these parameters can significantly influence the prediction (Figure 6B), but not as much as combustion enthalpies do. For the heat transfer coefficient on the outside of the pit, we used a Nusselt equation for a sphere in an infinite, stagnant fluid. To the best of our knowledge, such an equation does not exist for cylinders or flat plates. This may have caused an underestimation of the heat transfer coefficient in the soil outside the pit, and therefore an overestimation of the pit temperature. However, the sensitivity analysis shows that it has a very small effect (Figure 6B). 4.4.4 Effects of scale and soil temperature The uncontrolled industrial pit-fermentation can be described accurately with the mathematical model. The model can now be used, for example, to study the influence of scale and soil temperature. Many industrial fermentation pits are much bigger than the pits in our study (around 10 to 20 times the volume) (Jin, et al., 2017) In practice, this gives higher pit temperatures, for example over 40 °C. Model 2 was used to simulate these industrial pits. The initial temperature increase is comparable to that in our pits, but the peak temperature is higher, and it is reached later in bigger pits. The predicted peak temperature is 43 °C in a 10-fold bigger pit (Figure 7 A), which can be an additional inhibiting factor that is not included in our model. This agrees with the industrial practice of much longer fermentation runs (70 days) in bigger pits (Xu, et al., 2010).
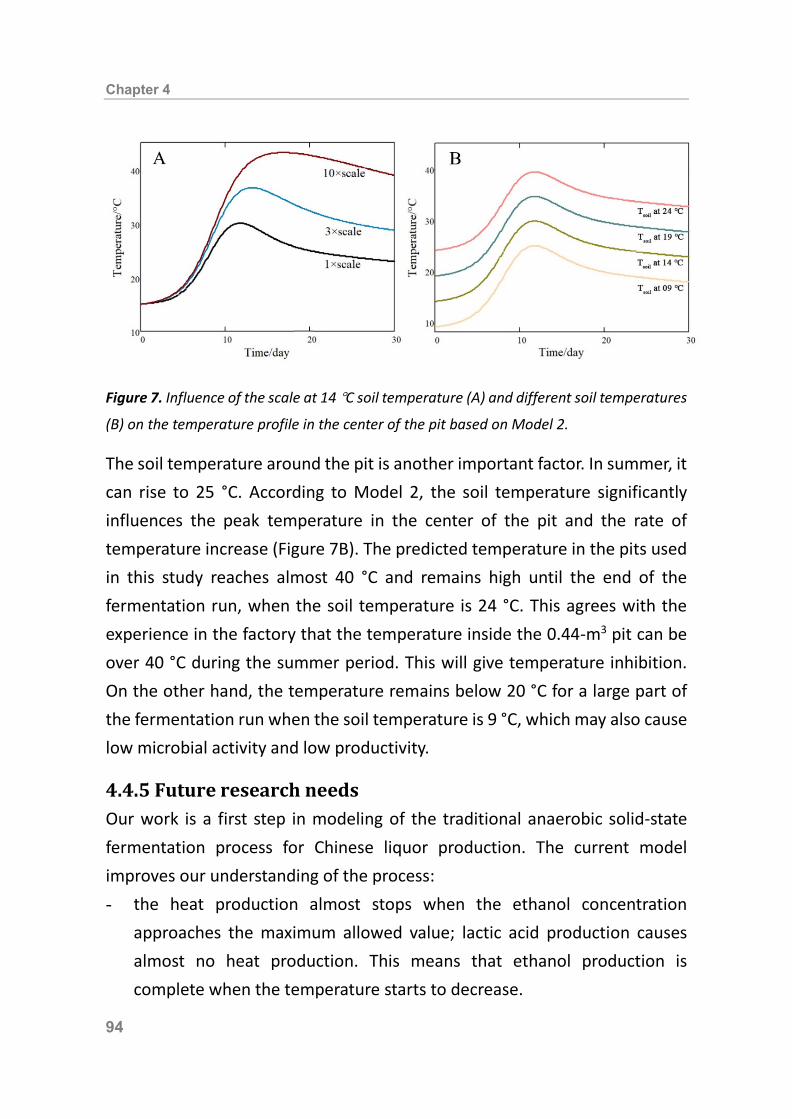
Chapter 4
94
Figure 7. Influence of the scale at 14 °C soil temperature (A) and different soil temperatures
(B) on the temperature profile in the center of the pit based on Model 2. The soil temperature around the pit is another important factor. In summer, it can rise to 25 °C. According to Model 2, the soil temperature significantly influences the peak temperature in the center of the pit and the rate of temperature increase (Figure 7B). The predicted temperature in the pits used in this study reaches almost 40 °C and remains high until the end of the fermentation run, when the soil temperature is 24 °C. This agrees with the experience in the factory that the temperature inside the 0.44-m3 pit can be over 40 °C during the summer period. This will give temperature inhibition. On the other hand, the temperature remains below 20 °C for a large part of the fermentation run when the soil temperature is 9 °C, which may also cause low microbial activity and low productivity. 4.4.5 Future research needs Our work is a first step in modeling of the traditional anaerobic solid-state fermentation process for Chinese liquor production. The current model improves our understanding of the process: - the heat production almost stops when the ethanol concentration
approaches the maximum allowed value; lactic acid production causes almost no heat production. This means that ethanol production is complete when the temperature starts to decrease.
Modeling of anaerobic solid-state fermentation
95
- the model explains why the fermentation takes so much longer in large pits during the whole year, and in small pits during the summer.
However, some assumptions and simplifications require further study. An obvious question is: Should more radial and vertical temperature measurements be done in the pit and in the soil around the pit, to better validate the heat conduction model? From a scientific point of view, this is necessary. However, the sensitivity analysis shows that large changes in the parameters of the conduction model do not give large changes in the peak temperature prediction. Furthermore, the physical part of the model is based on generally accepted engineering principles. Therefore, we believe that this is not the priority for future research. More important is the assumption that ethanol production is inhibited only by ethanol and lactic production only by lactic acid. Within certain limits, the main inhibitor is a microbe’s own metabolite (Gomes, et al., 2010; Horita, Kitamoto, Kawaide, Tachibana, & Shinozaki, 2015). Furthermore, our data show that ethanol was produced at the beginning of the fermentation process (days 1-12) and lactic acid after day 10. This implies that inhibition of ethanol producers by lactic acid was not relevant and inhibition of lactic acid producers by ethanol may have occurred. However, this might change if the inoculum size of ethanol producing and lactic acid producing microbe changes. The specific growth rate of the ethanol producers could be affected by lactic acid if a culture starts with more lactic acid producers or simply with more lactic acid coming from a previous batch via the standard recycling procedure used in industry, and the maximum specific growth rate of lactic acid producers could be higher than we found. This deserves further study in submerged cultures with microbes isolated from pits. It may give guidelines for inoculation and reuse of grain in the next batch. Of similar importance is the assumption that temperature does not affect the microbes. This was probably true during the production runs used for this study, because the model gave accurate predictions. However, if higher

Chapter 4
96
temperatures are reached than observed in our experiments, for example in larger pits or in periods with higher soil temperature, this assumption may no longer be valid. Lab-scale experiments must be done to study temperature effects. The predicted effects of scale and soil temperature should be validated by repeating the current study in larger pits and different seasons. If temperature becomes a problem, a cooling coil in the pit might be beneficial. The model can easily be extended and used to evaluate the effectiveness of a cooling coil. 4.5 Conclusions The temperature in a complex traditional pit fermentation for Chinese liquor production can be predicted accurately with simple mathematical models based on kinetic equations derived from measured product concentrations. The model with radial conduction to soil around the pit is more realistic than the model with radial conduction to infinite soil. The models can also accurately predict the starch consumption and dry matter content. The models and experiments give three key insights. First, most of the heat production is related to ethanol production and very little to lactic acid production. Second, the shell of soil around the pit plays a key role in cooling because it heats up quickly and cools down slowly which slows down cooling of the pit. Third, predicting heat production with published heats of combustion of reactants and products is very unreliable for anaerobic fermentation. In the 0.44-m3 pit used in this study, product inhibition is much more important than heat inhibition. However, the temperature depends on the pit size and soil temperature. In larger pits or in the summer period, temperature inhibition may become important and it may be beneficial to control temperature with a cooling coil. The model can also be used to explore and optimize the pit arrangement, inoculum size and composition, or temperature control via a cooling coil in the future.

Modeling of anaerobic solid-state fermentation
97
4.6 Appendices Appendix A. Description of parameters
Variable Description Unit AB Bottom surface area of the cylinder segment m2 AR Radial surface area of the cylinder segment m2 c Component concentration (C)mol m-3 C Specific heat capacity J kg-1 K-1 dWALL The width of the wall of pit m FG
v Gas flow rate mol s-1 m-3 H Height of the pit m JQR Radial heat flux W m-2 JQV Vertical heat flux W m-2 MWi Molar mass of component i kg (C)mol-1 nH Number of hydrogen atoms in a component per Cmol Nu Nusselt number R Radius m R11 Radius of soil layer around the pit (Model 2) m rv Production rate per unit volume of the pit (C)mol m-3 s-1 t Time s T Temperature K T11 Temperature in the soil layer around the pit (Model 2) K TSOIL Average temperature in isothermal soil K T0 Reference temperature for water evaporation K V Volume m3 yW Mole fraction of water in the gas phase mol mol-1 YPX Yield of biomass on product mol mol-1 α Heat transfer coefficient W m-2 K-1 αR Radial heat transfer coefficient W m-2 K-1 αV Vertical heat transfer coefficient W m-2 K-1 γ Degree of reduction emol Cmol-1 Δhc Enthalpy of combustion of component J mol-1 ΔhVW Enthalpy of vaporization of water at T0 J mol-1 λ Thermal conductivity of substrate W m-1 K-1 λWALL Thermal conductivity of the wall of the pit W m-1 K-1 μ Specific growth rate day-1 ρ Density of the substrate kg m-3

Chapter 4
98
Subscripts C Carbon dioxide or combustion E Ethanol i Type of microbe (yeast or lactic acid bacteria) or product (ethanol or
lactic acid) j Cylinder segment number (1 to 10) 𝑘𝑘 Component index L Lactic acid max Maximum N Nitrogen source P Product (ethanol or lactic acid) Q Heat production R Radial S Starch SOIL Soil around the pit V Vertical W Water X Biomass
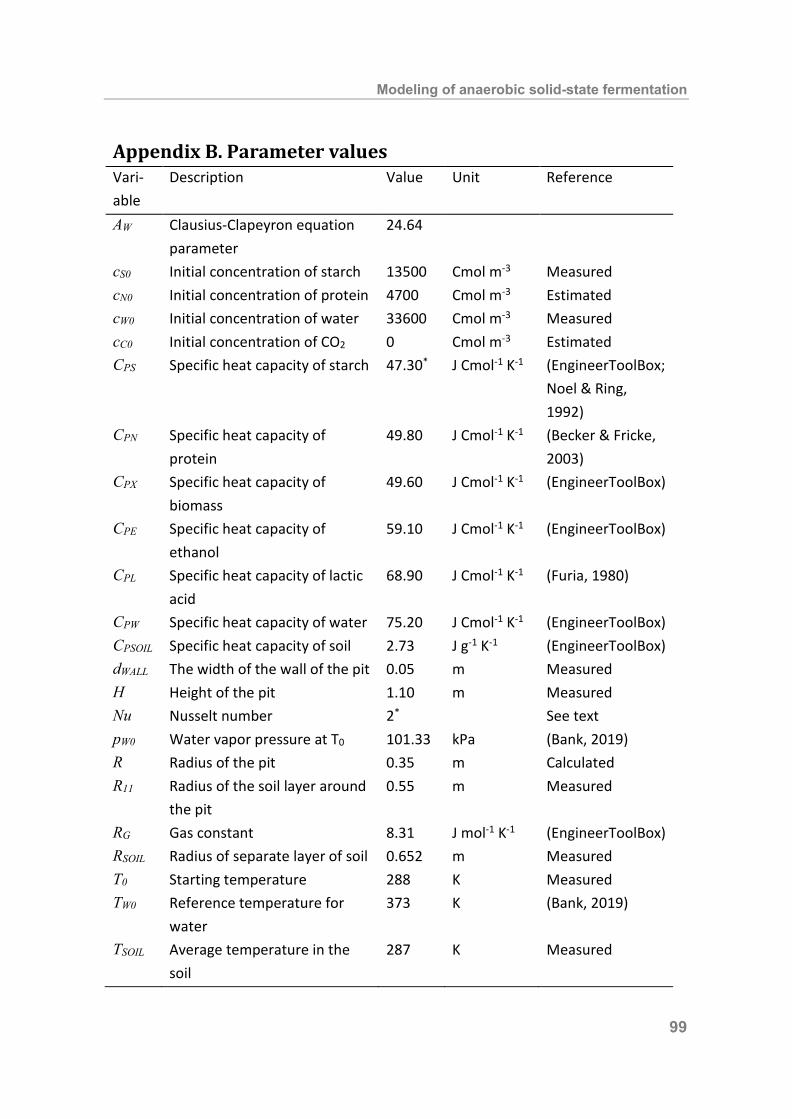
Modeling of anaerobic solid-state fermentation
99
Appendix B. Parameter values Vari-able
Description Value Unit Reference
AW Clausius-Clapeyron equation parameter
24.64
cS0 Initial concentration of starch 13500 Cmol m-3 Measured cN0 Initial concentration of protein 4700 Cmol m-3 Estimated cW0 Initial concentration of water 33600 Cmol m-3 Measured cC0 Initial concentration of CO2 0 Cmol m-3 Estimated CPS Specific heat capacity of starch 47.30* J Cmol-1 K-1 (EngineerToolBox;
Noel & Ring, 1992)
CPN Specific heat capacity of protein
49.80 J Cmol-1 K-1 (Becker & Fricke, 2003)
CPX Specific heat capacity of biomass
49.60 J Cmol-1 K-1 (EngineerToolBox)
CPE Specific heat capacity of ethanol
59.10 J Cmol-1 K-1 (EngineerToolBox)
CPL Specific heat capacity of lactic acid
68.90 J Cmol-1 K-1 (Furia, 1980)
CPW Specific heat capacity of water 75.20 J Cmol-1 K-1 (EngineerToolBox) CPSOIL Specific heat capacity of soil 2.73 J g-1 K-1 (EngineerToolBox) dWALL The width of the wall of the pit 0.05 m Measured H Height of the pit 1.10 m Measured Nu Nusselt number 2* See text pW0 Water vapor pressure at T0 101.33 kPa (Bank, 2019) R Radius of the pit 0.35 m Calculated R11 Radius of the soil layer around
the pit 0.55 m Measured
RG Gas constant 8.31 J mol-1 K-1 (EngineerToolBox) RSOIL Radius of separate layer of soil 0.652 m Measured T0 Starting temperature 288 K Measured TW0 Reference temperature for
water 373 K (Bank, 2019)
TSOIL Average temperature in the soil
287 K Measured

Chapter 4
100
αR Radial heat transfer coefficient 381.50 kW m-2 K-1 Calculated αV Vertical heat transfer
coefficient 27.66 kW m-2 K-1 Calculated
αVSOIL Vertical heat transfer coefficient to soil
100.60 kW m-2 K-1 Calculated
γS Degree of reduction of starch 4.0 emol Cmol-1 γE Degree of reduction of ethanol 6.0 emol Cmol-1 γX Degree of reduction of
biomass 4.4 emol Cmol-1
γN Degree of reduction of protein 4.0 emol Cmol-1 γL Degree of reduction of lactic
acid 4.0 emol Cmol-1
ΔhcS Enthalpy of combustion of starch
470.80* kJ Cmol-1 (Burnham, 2010; Kabo, et al., 2013; Lide., 2005)
ΔhcN Enthalpy of combustion of protein
528.20* kJ Cmol-1 (Benedict & Osborne, 1907; Burnham, 2010)
ΔhcX Enthalpy of combustion of biomass
560.00* kJ Cmol-1 (Duboc, Marison, & von Stockar, 1999; Roels, 1983)
ΔhcE Enthalpy of combustion of ethanol
683.50* kJ Cmol-1 (Bank, 2019; EngineerToolBox; Roels, 1983)
ΔhcL Enthalpy of combustion of lactic acid
446.00 kJ Cmol-1 (Emel'yanenko, et al., 2010)
ΔhVW Enthalpy of vaporization of water
40.67 kJ mol-1 (EngineerToolBox)
ε Porosity of the pit 0.40* Calculated λ Thermal conductivity of
substrate 0.20* W s-1 K-1 (Carson, Lovatt,
Tanner, & Cleland, 2006; EngineerToolBox; Tavman & Tavman, 1998)
λWALL Thermal conductivity of the wall of the pit
1.30 W s-1 K-1 (EngineerToolBox)

Modeling of anaerobic solid-state fermentation
101
* Best values.
λSOIL
Thermal conductivity of the soil
1.06*
W s-1 K-1
(EngineerToolBox; Lu, Ren, Gong, & Horton, 2007)
ρSOIL Density of the soil 1800 kg m-3 (EngineerToolBox)
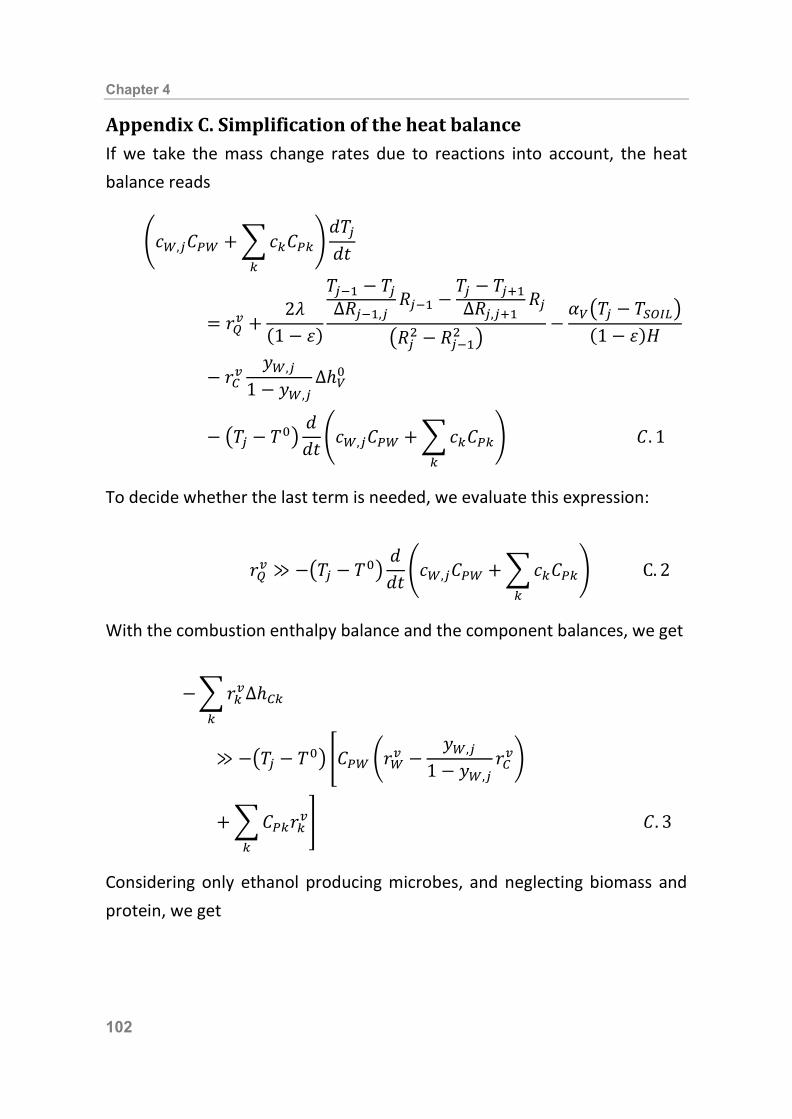
Chapter 4
102
Appendix C. Simplification of the heat balance If we take the mass change rates due to reactions into account, the heat balance reads
�𝑐𝑐𝑊𝑊,𝑗𝑗𝐶𝐶𝑃𝑃𝑊𝑊 + �𝑐𝑐𝑘𝑘𝐶𝐶𝑃𝑃𝑘𝑘𝑘𝑘
�𝑑𝑑𝑇𝑇𝑗𝑗𝑑𝑑𝑑𝑑
= 𝑟𝑟𝑄𝑄𝑣𝑣 +2𝜆𝜆
(1 − 𝜀𝜀)
𝑇𝑇𝑗𝑗−1 − 𝑇𝑇𝑗𝑗∆𝑅𝑅𝑗𝑗−1,𝑗𝑗
𝑅𝑅𝑗𝑗−1 −𝑇𝑇𝑗𝑗 − 𝑇𝑇𝑗𝑗+1∆𝑅𝑅𝑗𝑗,𝑗𝑗+1
𝑅𝑅𝑗𝑗
�𝑅𝑅𝑗𝑗2 − 𝑅𝑅𝑗𝑗−12 �−𝛼𝛼𝑄𝑄�𝑇𝑇𝑗𝑗 − 𝑇𝑇𝑆𝑆𝑆𝑆𝑆𝑆𝑠𝑠�
(1 − 𝜀𝜀)𝐶𝐶
− 𝑟𝑟𝐶𝐶𝑣𝑣𝑦𝑦𝑊𝑊,𝑗𝑗
1 − 𝑦𝑦𝑊𝑊,𝑗𝑗∆ℎ𝑄𝑄0
− �𝑇𝑇𝑗𝑗 − 𝑇𝑇0�𝑑𝑑𝑑𝑑𝑑𝑑 �𝑐𝑐𝑊𝑊,𝑗𝑗𝐶𝐶𝑃𝑃𝑊𝑊 + �𝑐𝑐𝑘𝑘𝐶𝐶𝑃𝑃𝑘𝑘
𝑘𝑘
� 𝐶𝐶. 1
To decide whether the last term is needed, we evaluate this expression:
𝑟𝑟𝑄𝑄𝑣𝑣 ≫ −�𝑇𝑇𝑗𝑗 − 𝑇𝑇0�𝑑𝑑𝑑𝑑𝑑𝑑 �𝑐𝑐𝑊𝑊,𝑗𝑗𝐶𝐶𝑃𝑃𝑊𝑊 + �𝑐𝑐𝑘𝑘𝐶𝐶𝑃𝑃𝑘𝑘
𝑘𝑘
� C. 2
With the combustion enthalpy balance and the component balances, we get
−�𝑟𝑟𝑘𝑘𝑣𝑣∆ℎ𝐶𝐶𝑘𝑘
𝑘𝑘
≫ −�𝑇𝑇𝑗𝑗 − 𝑇𝑇0� �𝐶𝐶𝑃𝑃𝑊𝑊 �𝑟𝑟𝑊𝑊𝑣𝑣 −𝑦𝑦𝑊𝑊,𝑗𝑗
1 − 𝑦𝑦𝑊𝑊,𝑗𝑗𝑟𝑟𝐶𝐶𝑣𝑣�
+ �𝐶𝐶𝑃𝑃𝑘𝑘𝑟𝑟𝑘𝑘𝑣𝑣
𝑘𝑘
� 𝐶𝐶. 3
Considering only ethanol producing microbes, and neglecting biomass and protein, we get
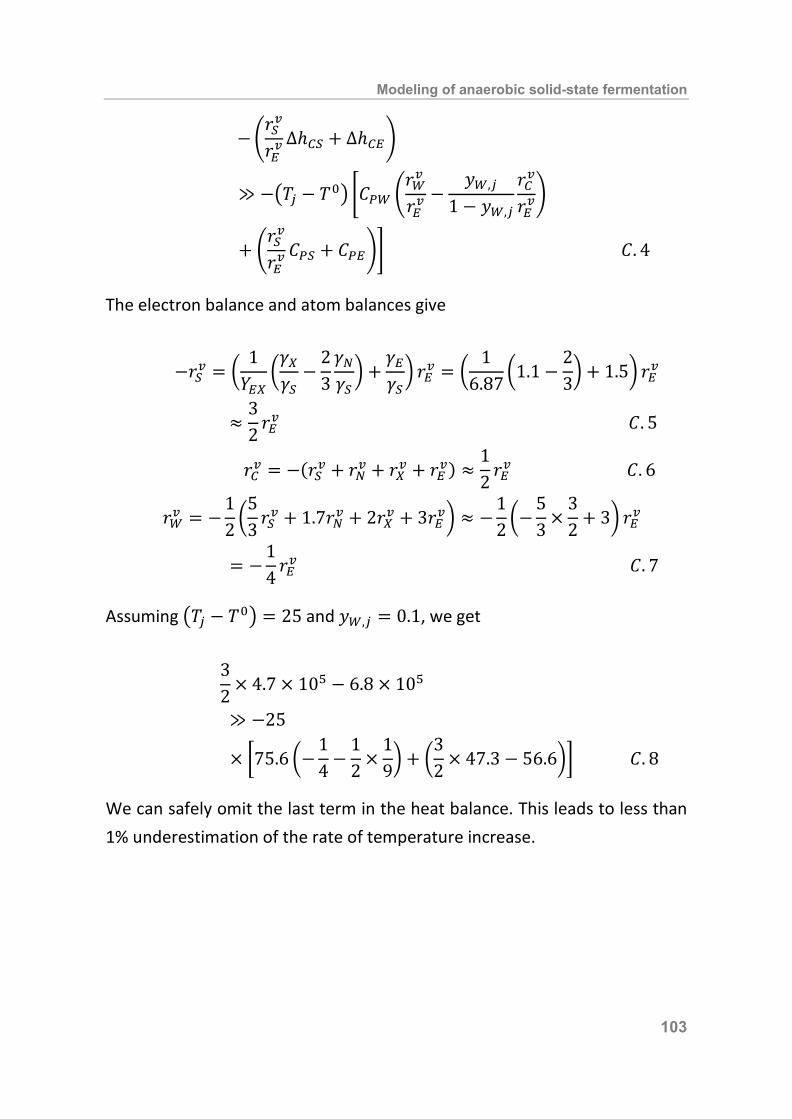
Modeling of anaerobic solid-state fermentation
103
−�𝑟𝑟𝑆𝑆𝑣𝑣
𝑟𝑟𝑠𝑠𝑣𝑣∆ℎ𝐶𝐶𝑆𝑆 + ∆ℎ𝐶𝐶𝑠𝑠�
≫ −�𝑇𝑇𝑗𝑗 − 𝑇𝑇0� �𝐶𝐶𝑃𝑃𝑊𝑊 �𝑟𝑟𝑊𝑊𝑣𝑣
𝑟𝑟𝑠𝑠𝑣𝑣−
𝑦𝑦𝑊𝑊,𝑗𝑗
1 − 𝑦𝑦𝑊𝑊,𝑗𝑗
𝑟𝑟𝐶𝐶𝑣𝑣
𝑟𝑟𝑠𝑠𝑣𝑣�
+ �𝑟𝑟𝑆𝑆𝑣𝑣
𝑟𝑟𝑠𝑠𝑣𝑣𝐶𝐶𝑃𝑃𝑆𝑆 + 𝐶𝐶𝑃𝑃𝑠𝑠�� 𝐶𝐶. 4
The electron balance and atom balances give
−𝑟𝑟𝑆𝑆𝑣𝑣 = �1𝑌𝑌𝑠𝑠𝑋𝑋
�𝛾𝛾𝑋𝑋𝛾𝛾𝑆𝑆−
23𝛾𝛾𝑁𝑁𝛾𝛾𝑆𝑆� +
𝛾𝛾𝑠𝑠𝛾𝛾𝑆𝑆� 𝑟𝑟𝑠𝑠𝑣𝑣 = �
16.87 �
1.1−23� + 1.5� 𝑟𝑟𝑠𝑠𝑣𝑣
≈32 𝑟𝑟𝑠𝑠
𝑣𝑣 𝐶𝐶. 5
𝑟𝑟𝐶𝐶𝑣𝑣 = −(𝑟𝑟𝑆𝑆𝑣𝑣 + 𝑟𝑟𝑁𝑁𝑣𝑣 + 𝑟𝑟𝑋𝑋𝑣𝑣 + 𝑟𝑟𝑠𝑠𝑣𝑣) ≈12 𝑟𝑟𝑠𝑠
𝑣𝑣 𝐶𝐶. 6
𝑟𝑟𝑊𝑊𝑣𝑣 = −12 �
53 𝑟𝑟𝑆𝑆
𝑣𝑣 + 1.7𝑟𝑟𝑁𝑁𝑣𝑣 + 2𝑟𝑟𝑋𝑋𝑣𝑣 + 3𝑟𝑟𝑠𝑠𝑣𝑣� ≈ −12 �−
53 ×
32 + 3� 𝑟𝑟𝑠𝑠𝑣𝑣
= −14 𝑟𝑟𝑠𝑠
𝑣𝑣 𝐶𝐶. 7 Assuming �𝑇𝑇𝑗𝑗 − 𝑇𝑇0� = 25 and 𝑦𝑦𝑊𝑊,𝑗𝑗 = 0.1, we get
32 × 4.7 × 105 − 6.8 × 10⁵
≫ −25
× �75.6 �−14 −
12 ×
19� + �
32 × 47.3 − 56.6�� 𝐶𝐶. 8
We can safely omit the last term in the heat balance. This leads to less than 1% underestimation of the rate of temperature increase.
Chapter 4
104
Appendix D. Geometry of the annular bed segments Specific surface areas for annular segment 𝑗𝑗 ∈ {1,2, … 10}:
𝐴𝐴𝑄𝑄,𝑗𝑗
𝑉𝑉𝑗𝑗=
2𝜋𝜋𝑅𝑅𝑗𝑗𝐶𝐶𝜋𝜋�𝑅𝑅𝑗𝑗2 − 𝑅𝑅𝑗𝑗−12 �𝐶𝐶
=2𝑅𝑅𝑗𝑗
�𝑅𝑅𝑗𝑗2 − 𝑅𝑅𝑗𝑗−12 � 𝐷𝐷. 1
𝐴𝐴𝐵𝐵,𝑗𝑗
𝑉𝑉𝑗𝑗=
1𝐶𝐶 𝐷𝐷. 2
Segment radii:
𝑅𝑅𝑗𝑗 = � 𝑗𝑗10𝑅𝑅10 𝐷𝐷. 3
Heat transport distances:
∆𝑅𝑅1,2 = 0.5(𝑅𝑅2 + 𝑅𝑅1) − 0 = 0.5��2
10 + � 110�𝑅𝑅10 𝐷𝐷. 4
For 3 ≤ 𝑗𝑗 ≤ 10:
∆𝑅𝑅𝑗𝑗−1,𝑗𝑗 = 0.5�𝑅𝑅𝑗𝑗+1 − 𝑅𝑅𝑗𝑗−1� = 0.5��𝑗𝑗 + 1
10 −�𝑗𝑗 − 110 �𝑅𝑅10 𝐷𝐷. 5
From the last segment to the wall:
∆𝑅𝑅10 = 0.5(𝑅𝑅10 − 𝑅𝑅9) = 0.5�1 −� 910�𝑅𝑅10 𝐷𝐷. 6
The sum of all ∆𝑅𝑅’s is 𝑅𝑅10.

105
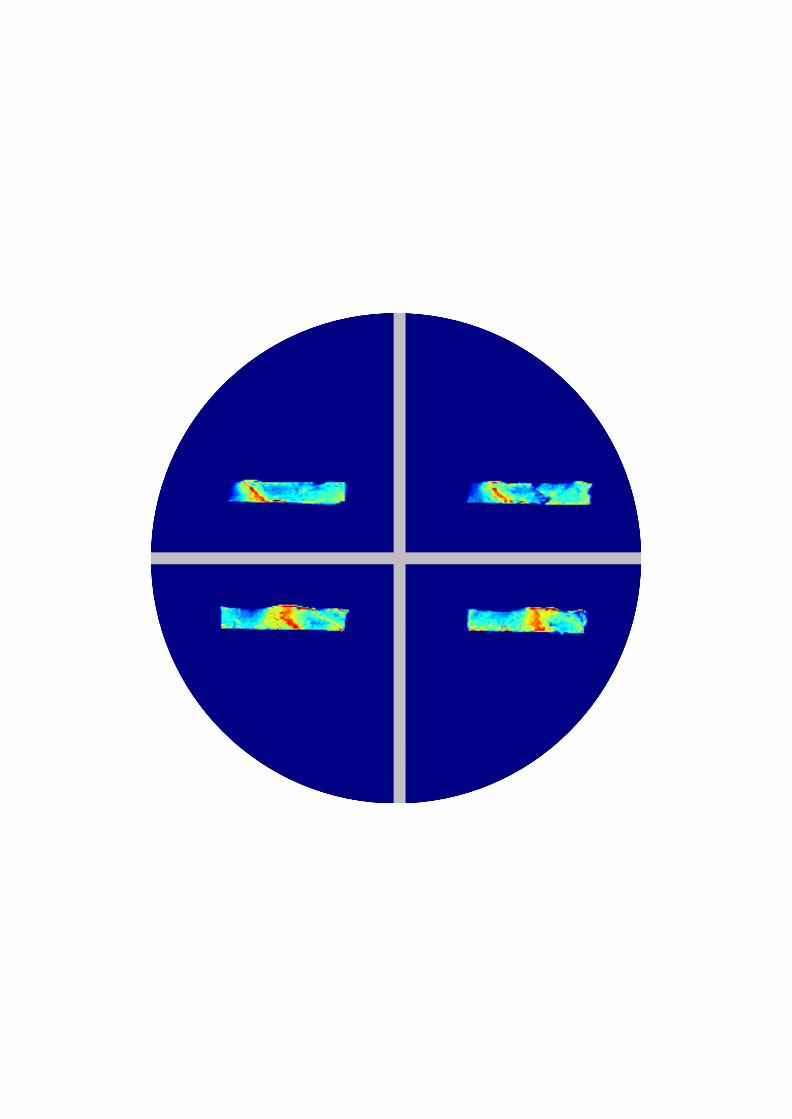
106

107
Chapter 5
Identifying influential variables during Chinese liquor fermentation by statistical modelling
Chapter 5
108
Abstract
Traditional solid-state fermentations are widely used, but the processes are
not designed and operated on a scientific basis. Often, the most important
process variables are unknown, so developing a control strategy is difficult.
Statistic methods can be an interesting and feasible option to solve the
problem. Therefore, we use liquor yield (60% ethanol content after distillation,
v/v) to correlate with possible influential variables (collected data as to input
and output) in a traditional solid-state fermentation process for Chinese
liquor production. Variables included in the statistical analysis are starting
concentrations of starch, water and acids, starting month, substrate
temperature profiles and air temperatures. Models based on starting
concentrations do not give reliable predictions of the liquor yield. A model
based on the temperature profile gives a better prediction, but that is
probably because the substrate temperature is a consequence of the ethanol
production. Overheating problems occurred in none of the batch runs. The
most important factor is the starting month: the coldest months (January,
February and March) resulted in significantly higher yield. This is not due to
the ambient temperature. It may be due to higher numbers of lactic acid
bacteria during the period between April and December. These would cause
an earlier rise in lactic acid concentration that would inhibit ethanol
production and lower the yield. Further research is needed to test this
hypothesis. This work shows that statistical models can identify key variables
during complex traditional fermentations, but it also shows that these models
must be combined with mechanistic models to explain observed correlations,
and it shows that measuring initial and final concentrations is not enough.
Identifying influential variables by statistical modeling
109
5.1 Introduction Solid-state fermentation is cultivation of microbes on moist solid substrates like grain or agro-industrial byproducts and it has been used for centuries to produce fermented foods and beverages (Holker & Lenz, 2005; Krishna, 2005; Pandey, 2003; Sindhu, et al., 2019; Wu, et al., 2018). Despite the long tradition, solid-state fermentation is still applied in a more traditional and empirical manner than submerged fermentation, with less process control (Jin, et al., 2017; Zhu & Tramper, 2013). A typical example is the Chinese liquor (Baijiu) fermentation process (Jin, et al., 2019). To improve our understanding of the process, we developed a mechanistic model (Jin, et al., 2020). The key assumption in the model is that ethanol production is only inhibited by ethanol, and not by (lactic) acid, temperature, lack of starch or water. Therefore, the model predicts that all batch runs stop at the same ethanol concentration and thus give the same amount of yield (60% ethanol content after distillation, v/v). However, industrial data show that the individual batch yield can differ by a factor of 3.5. Statistical analysis of process data can be used to identify variables that affect ethanol production and must be added to the mechanistic model. A practical solution is to extract information by statistical modelling of historical process data (Bicciato, Bagno, Solda, Manfredini, & Di Bello, 2002; Kennedy & Krouse, 1999; Laluce, Igbojionu, Silva, & Ribeiro, 2019). This has already been applied in several fermentation systems. For example, multivariate statistical analysis was used for process diagnosis and phase shift detection during fed-batch fermentation (Bicciato, et al., 2002; Doan, Srinivasan, Bapat, & Wangikar, 2007). A multivariate monitoring and control concept based on historical process data was demonstrated for monitoring and diagnosis of a small-scale fermentation process (Besenhard, Scheibelhofer, Francois, Joksch, & Kavsek, 2018). Recently, data-driven dynamic models were built to describe and monitor the dynamic behavior in an industrial batch fermentation process
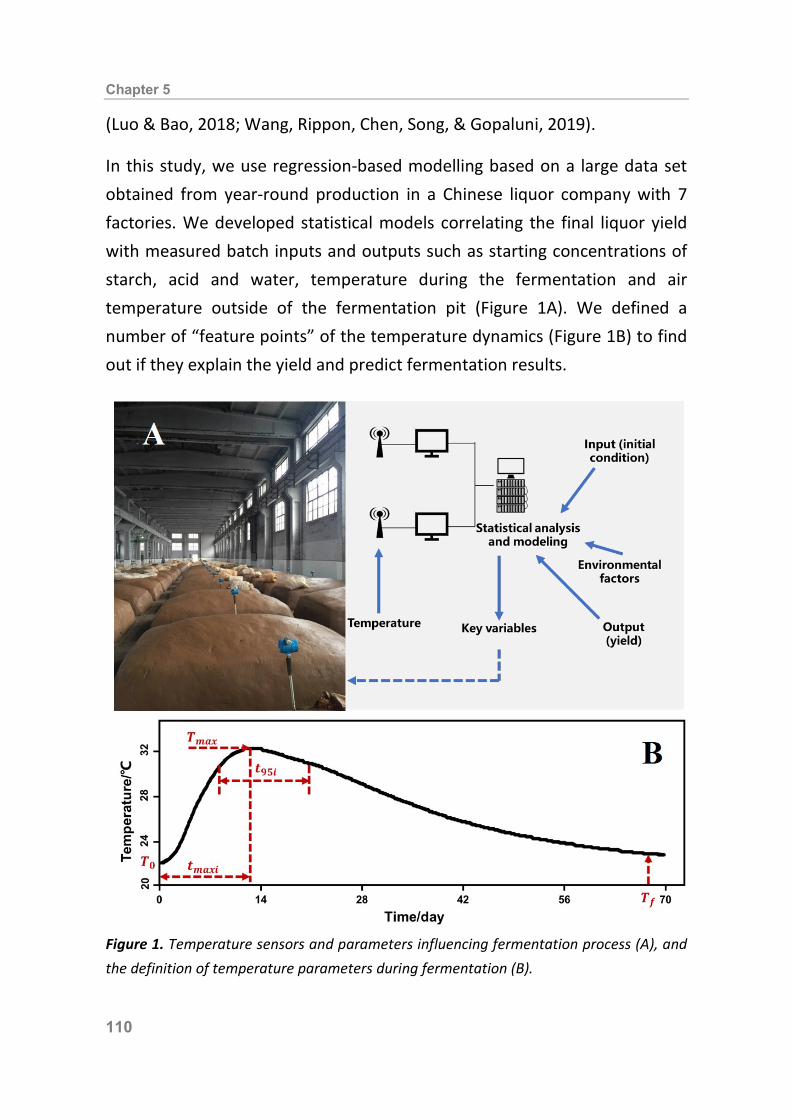
Chapter 5
110
(Luo & Bao, 2018; Wang, Rippon, Chen, Song, & Gopaluni, 2019). In this study, we use regression-based modelling based on a large data set obtained from year-round production in a Chinese liquor company with 7 factories. We developed statistical models correlating the final liquor yield with measured batch inputs and outputs such as starting concentrations of starch, acid and water, temperature during the fermentation and air temperature outside of the fermentation pit (Figure 1A). We defined a number of “feature points” of the temperature dynamics (Figure 1B) to find out if they explain the yield and predict fermentation results.
Figure 1. Temperature sensors and parameters influencing fermentation process (A), and the definition of temperature parameters during fermentation (B).

Identifying influential variables by statistical modeling
111
5.2 Materials and methods 5.2.1 Fermentation, online measurements, chemical analyses The traditional solid-state fermentation process was done as described elsewhere in a Chinese distillery with 7 factories (Jin, et al., 2017). First, sorghum was soaked in fresh water at room temperature for 24 h. Soaked sorghum was mixed with fermented substrate (1:1, w/w) and rice husk (1%, w/w) before steaming. After cooling down to the room temperature (20 °C), 1350 kg steamed materials were mixed with 1350 kg fermented substrate (from previous batches) and 300 kg Daqu starter, followed by being fermented in a pit 70 days. Fermentation temperature was measured hourly by a temperature sensor (MicroDetect Co, Ltd., Tangshan, Hebei Province, China) placed in the vertical and horizontal center of the fermentation pit. The environmental air temperature was measure by the same equipment. Temperature data were collected with computer software based on LabVIEW 2016 (National Instruments Co, Ltd., Austin, TX). Substrate samples (100 g) were collected before and after fermentation and stored at -20 °C for further analysis. Starting and final concentrations (contents) were measured for starch, water and acids (Table 1). The acid concentration was defined as the quantity of NaOH solution (0.1 M) for neutralization of 10 g of substrate-water suspension (w/w, 1:10) to a final pH of 7. The influence of CO2 was neglected because the pH of substrate extract is around 3 and hardly any CO2 can dissolve. The starch content was defined as the weight of starch in 100 g of wet substrate sample and measured through near infrared spectroscopy (DS2500, Foss, Hilleroed, Denmark). The water content was defined as weight of water in 100 g of wet substrate and measured by drying in a vacuum oven (Yiheng Co., Ltd. Shanghai, China) at 60 °C and 133 Pa for 24 h. The final yield was defined as the output of standard fresh liquor (60% ethanol content, v/v) after distillation. The ethanol content was measured using an
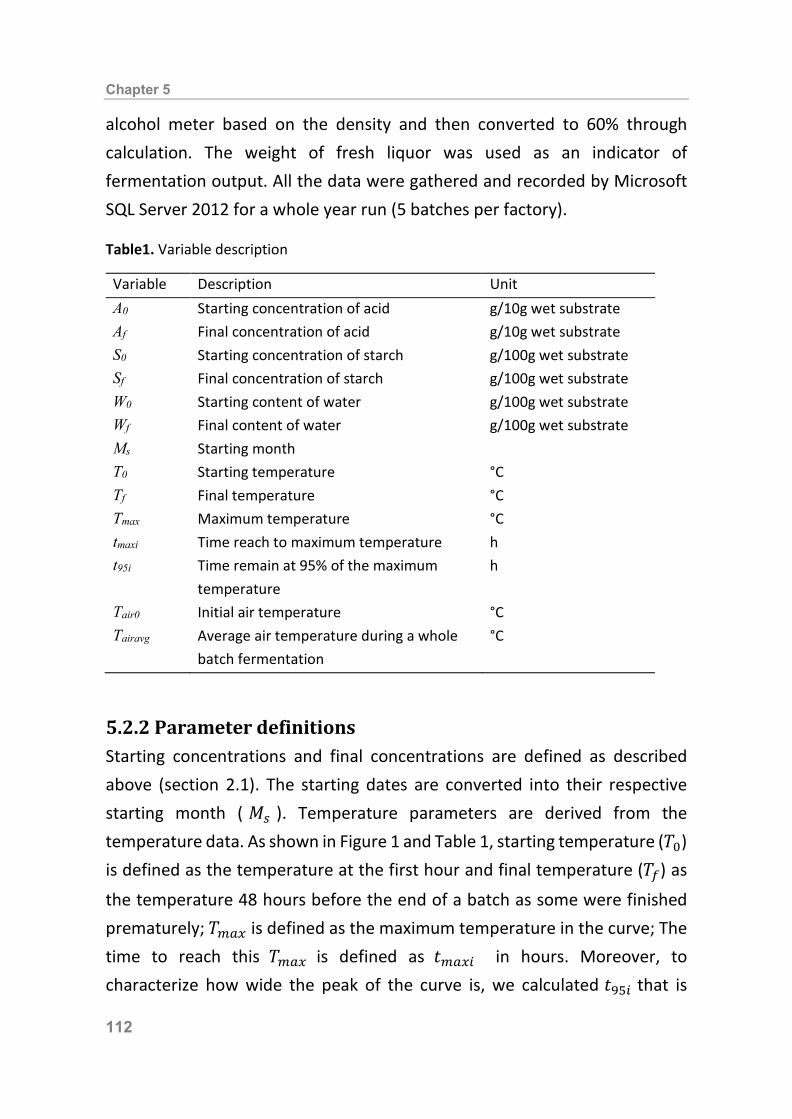
Chapter 5
112
alcohol meter based on the density and then converted to 60% through calculation. The weight of fresh liquor was used as an indicator of fermentation output. All the data were gathered and recorded by Microsoft SQL Server 2012 for a whole year run (5 batches per factory). Table1. Variable description
5.2.2 Parameter definitions Starting concentrations and final concentrations are defined as described above (section 2.1). The starting dates are converted into their respective starting month ( 𝑀𝑀𝑠𝑠 ). Temperature parameters are derived from the temperature data. As shown in Figure 1 and Table 1, starting temperature (𝑇𝑇0) is defined as the temperature at the first hour and final temperature (𝑇𝑇𝑓𝑓) as
the temperature 48 hours before the end of a batch as some were finished prematurely; 𝑇𝑇𝑚𝑚𝑚𝑚𝑚𝑚 is defined as the maximum temperature in the curve; The time to reach this 𝑇𝑇𝑚𝑚𝑚𝑚𝑚𝑚 is defined as 𝑑𝑑𝑚𝑚𝑚𝑚𝑚𝑚𝑋𝑋 in hours. Moreover, to characterize how wide the peak of the curve is, we calculated 𝑑𝑑95𝑋𝑋 that is
Variable Description Unit A0 Starting concentration of acid g/10g wet substrate Af Final concentration of acid g/10g wet substrate S0 Starting concentration of starch g/100g wet substrate Sf Final concentration of starch g/100g wet substrate W0 Starting content of water g/100g wet substrate Wf Final content of water g/100g wet substrate Ms Starting month T0 Starting temperature °C Tf Final temperature °C Tmax Maximum temperature °C tmaxi Time reach to maximum temperature h t95i Time remain at 95% of the maximum
temperature h
Tair0 Initial air temperature °C Tairavg Average air temperature during a whole
batch fermentation °C
Identifying influential variables by statistical modeling
113
defined as the time interval in hours around 𝑇𝑇𝑚𝑚𝑚𝑚𝑚𝑚 where the temperature is larger than 95% of the 𝑇𝑇𝑚𝑚𝑚𝑚𝑚𝑚. The air temperature (𝑇𝑇𝑚𝑚𝑋𝑋𝑎𝑎) was the same in 7 factories and was defined as the average temperature of a whole day (24 measurements). We used the average air temperature of 70 days fermentation (𝑇𝑇𝑚𝑚𝑋𝑋𝑎𝑎𝑚𝑚𝑣𝑣𝑎𝑎) for regression analysis. 5.2.3 Statistical analysis Two main approaches are used for analysis: multiple linear regression models and classifier models. The linear regression models are first order models as described in Eq. 1:
𝑌𝑌 = 𝛽𝛽0 + 𝛽𝛽1𝑥𝑥1 + 𝛽𝛽2𝑥𝑥2 + ⋯+ 𝛽𝛽𝑛𝑛𝑥𝑥𝑛𝑛 (1) Where 𝑌𝑌 is the dependent variable (yield), 𝑥𝑥1 , 𝑥𝑥2 ,…, 𝑥𝑥𝑛𝑛 are the variables, and 𝛽𝛽0, 𝛽𝛽1, 𝛽𝛽2, …, 𝛽𝛽𝑛𝑛 are the regression coefficients. Models were made using several combinations of variables (Table 2). Different model specifications were tried and include collinearity checks. Moreover, 10-fold cross validation is used to test the predictive capabilities for unknown observations. Hypothesis tests and variance inflation factors (VIF) were calculated for individual regression coefficients. Regression models were judged on their R2, Q2 and the omnibus F-test for the entire model. Higher R2 means more variance can be explained by the model using training data. Q2 values indicate if a model can predict unseen data well (Hageman, et al., 2017). Q2 is calculated using a 10-fold cross validation. This means that the data are split into 10 random but nearly equally sized subsets and then for every partition a model is fitted. This model is then used to calculate predicted values for the left-out part. These predicted values are used to calculate Q2 according to (Eq. 2).
𝑄𝑄2 = 1 − �𝑃𝑃𝑟𝑟𝑒𝑒𝑑𝑑𝑖𝑖𝑐𝑐𝑑𝑑𝑖𝑖𝑖𝑖𝑒𝑒 𝑟𝑟𝑒𝑒𝑎𝑎𝑖𝑖𝑑𝑑𝑁𝑁𝑑𝑑𝑚𝑚 𝑒𝑒𝑟𝑟𝑟𝑟𝑚𝑚𝑟𝑟 𝑎𝑎𝑁𝑁𝑚𝑚 𝑚𝑚𝑓𝑓 𝑒𝑒𝑒𝑒𝑁𝑁𝑑𝑑𝑟𝑟𝑒𝑒𝑎𝑎
𝑇𝑇𝑚𝑚𝑑𝑑𝑑𝑑𝑚𝑚 𝑎𝑎𝑁𝑁𝑚𝑚 𝑚𝑚𝑓𝑓 𝑎𝑎𝑒𝑒𝑁𝑁𝑑𝑑𝑟𝑟𝑒𝑒𝑎𝑎 � (2)
Good Q2 values should be close to their respective R2 with a maximum of 1.
Chapter 5
114
Multiple regression The omnibus F-test for the regression model will indicate whether a model has any statistical significance. Individual hypothesis tests and their resulting p-values for regression coefficients will indicate whether a coefficient has a significant positive or negative relationship in the model. A significance level of 0.05 is used throughout this study. VIF (variance inflation factors) are used to check collinearity. These are calculated with (Eq. 3):
𝑉𝑉𝑉𝑉𝐹𝐹𝑋𝑋 = 1
1 − 𝑅𝑅𝑋𝑋2(3)
Here 𝑉𝑉𝑉𝑉𝐹𝐹𝑋𝑋 indicates the VIF value for the 𝑖𝑖𝑡𝑡ℎ variable. 𝑅𝑅𝑋𝑋2 is the explained variance when predicting variable 𝑖𝑖 using all other variables. Collinearity occurs when two or more variables are heavily correlated with each other. This decreases interpretability of their coefficient estimates as one could be expressed as the other. Moreover, significant coefficients can be missed as well because otherwise significant p-values can be higher than 0.05 due to the collinearity. Therefore, it is important to deal with this by for example dropping some of these parameters. A VIF value higher than 5 indicates a problematic amount of collinearity (James, Witten, Hastie, & Tibshirani, 2013). Classifier model The classifier model is a decision tree model used to characterize different yield classes and to simplify representation of the data. This is done by manually assigning a class label to certain ranges of yield. The decision tree tries to find a set of rules based on selected parameters to split the data into their respective classes. Every rule is a true or false condition. For example, if a parameter value is over a certain threshold, then that observation is assigned to node 2 and otherwise node 3. This process repeats for every node until the algorithm ends. Nodes show what
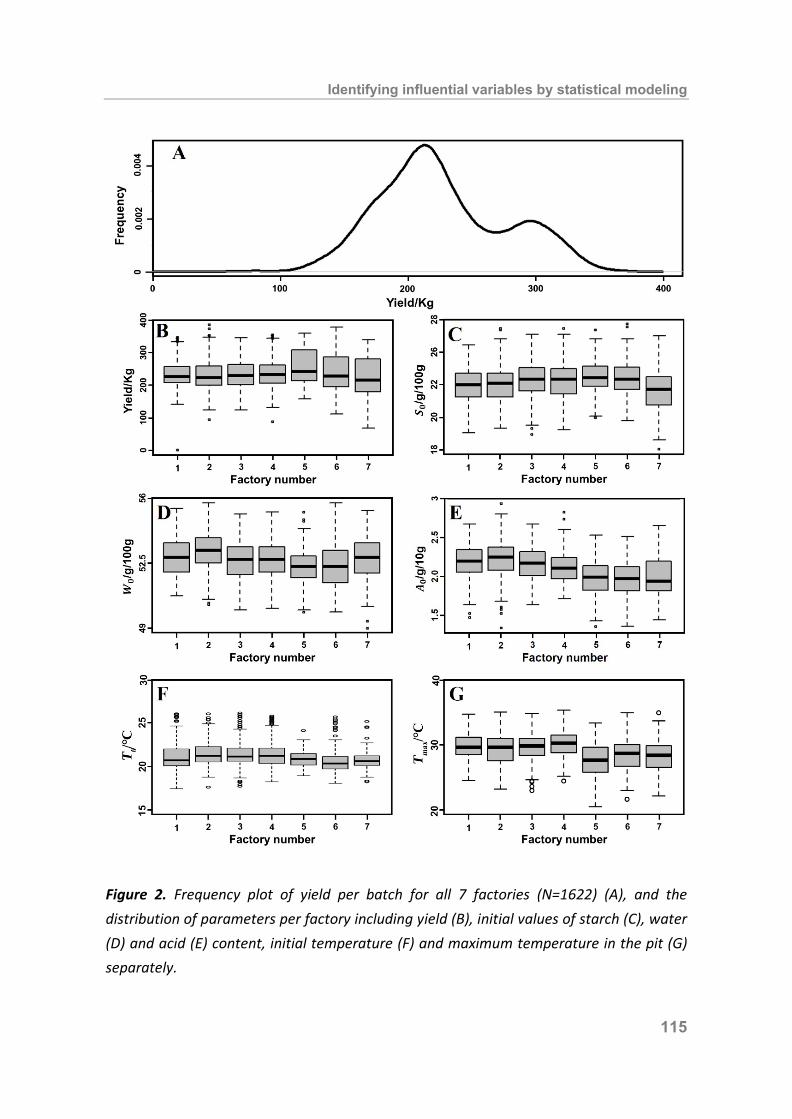
Identifying influential variables by statistical modeling
115
Figure 2. Frequency plot of yield per batch for all 7 factories (N=1622) (A), and the distribution of parameters per factory including yield (B), initial values of starch (C), water (D) and acid (E) content, initial temperature (F) and maximum temperature in the pit (G) separately.
Chapter 5
116
proportion of the original data they contain. The separation and percentage of original data in the nodes indicate how effective a rule is.
5.3 Results and discussion 5.3.1 Data distribution After removing outliers and incomplete entries, the data set contains 1622 batch runs. As shown in Figure 2A, the frequency distribution of the yield is bimodal instead of normal. The low-yield peak contains more data than the high-yield peak; the border between the peaks is around 280 kg liquor per batch. Figure 2 (B through G) also shows box plots for the distribution of the final yields, initial starting concentrations, initial temperatures, and peak temperatures for each factory. The medians and interquartile ranges of the factories align rather well, except for the yield. The medians of the yields are almost the same for all factories, but the 75% values (top of the boxes) differ: Factories 5, 6 and 7 have a skewed yield distribution with more high yield batches than factories 1 through 4. However, the high-yield peak in Figure 2A is not due to factories 5 through 7 only; all factories have the bimodal distribution. This suggests that all factories operate alike and have similar yield ranges. Note that starch and water contents do not add up to 100% because recycling of fermented material gives enrichment of non-degraded solid components, such as rice husk, and non-volatile solutes, such as acids. 5.3.2 Descriptive statistics Figure 3 shows correlations of the liquor yield to single variables. The thinner the ellipsoid, the stronger the correlation. The yield is correlated (R>0.5) to the initial starch content (𝑆𝑆0), the starting month (𝑀𝑀𝑠𝑠), the time needed to reach the maximum pit temperature ( 𝑑𝑑𝑚𝑚𝑚𝑚𝑚𝑚𝑋𝑋 ), the duration of the high temperature period (𝑑𝑑95𝑋𝑋), and the initial air temperature (𝑇𝑇𝑚𝑚𝑋𝑋𝑎𝑎0), but has no meaningful correlation to any other single variable.
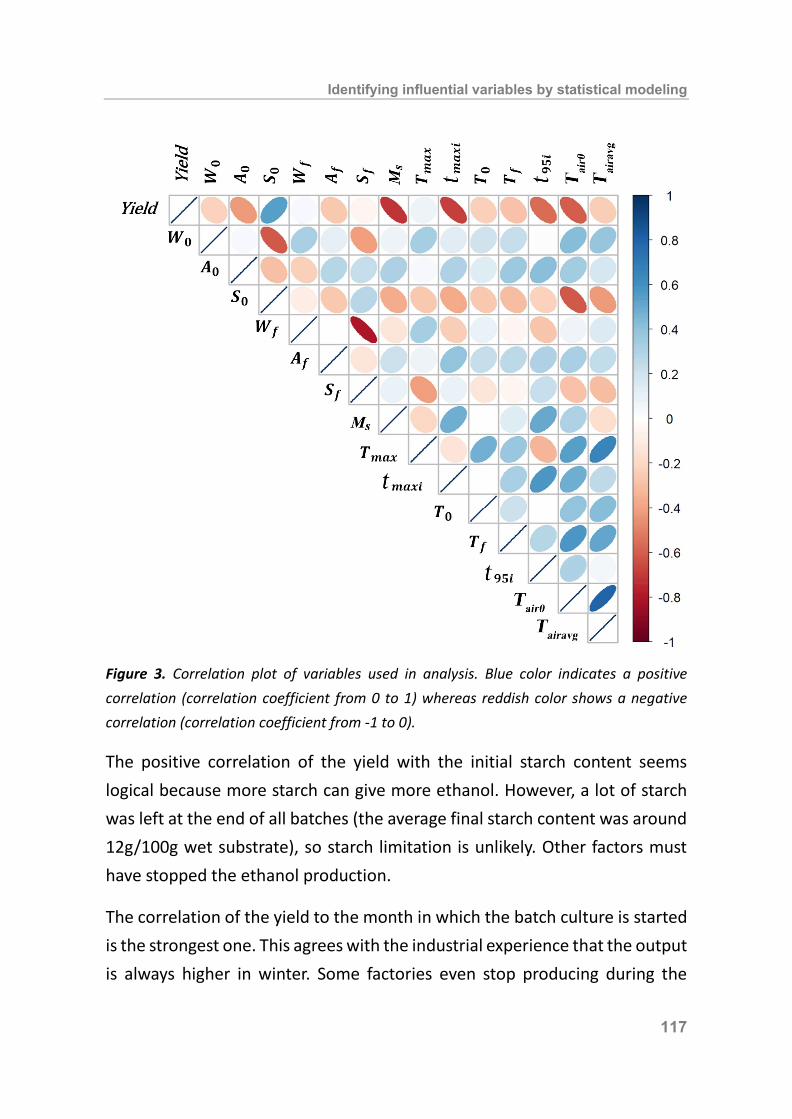
Identifying influential variables by statistical modeling
117
Figure 3. Correlation plot of variables used in analysis. Blue color indicates a positive correlation (correlation coefficient from 0 to 1) whereas reddish color shows a negative correlation (correlation coefficient from -1 to 0). The positive correlation of the yield with the initial starch content seems logical because more starch can give more ethanol. However, a lot of starch was left at the end of all batches (the average final starch content was around 12g/100g wet substrate), so starch limitation is unlikely. Other factors must have stopped the ethanol production. The correlation of the yield to the month in which the batch culture is started is the strongest one. This agrees with the industrial experience that the output is always higher in winter. Some factories even stop producing during the

Chapter 5
118
summer. Several factors associated with the starting month could be the reason: microbes, air temperature, raw material, etc. We come back to this later. A striking result is that the yield is not correlated to the maximum substrate temperature (𝑇𝑇𝑚𝑚𝑚𝑚𝑚𝑚). This agrees with the absence of any signs of overheating in the observed temperature profiles. Therefore, the correlation of the yield with the time needed to reach the peak temperature (𝑑𝑑𝑚𝑚𝑚𝑚𝑚𝑚𝑋𝑋) and the length of the high-temperature period (𝑑𝑑95𝑋𝑋) may be an inverse causal relation: Heat production depends mainly on ethanol production (Jin, et al., 2020). Consequently, any factor that slows down ethanol production will slow down heating of the pit. The yield is negatively correlated with initial and final acid contents, but not as strongly as expected. It is known that acids can inhibit yeast (Driehuis, Elferink, & Spoelstra, 1999), and the industry regards higher acidity as one of the primary reasons for process failure. However, initial and final acid contents have little variation – but do differ from one another – and this may have obscured the effect of acids. In addition, it is possible that there is a non-linear effect, or that the effect of the final acid content is related to the time that it is reached. We discuss this later. A higher initial air temperature gives a lower yield, but the yield is not significantly correlated to the average air temperature during the fermentation. The effect of the initial air temperature is hard to explain because heat exchange between the air and the substrate will be poor (Jin, et al., 2020). Cooling depends mainly on the temperature of the soil surrounding the pit, which follows the air temperature with a significant delay (Marquez, Bohorquez, & Melgar, 2016). Therefore, the effect of the initial air temperature is probably indirect. It could be a proxy for the starting month because the best months have the lowest air temperatures. We come back to the effect of the starting month later.

Identifying influential variables by statistical modeling
119
Despite some meaningless (i.e. 𝑇𝑇𝑚𝑚𝑋𝑋𝑎𝑎0 and 𝑆𝑆0) and weak correlations (i.e. 𝐴𝐴0 and 𝑊𝑊0), some of the correlations of different variables are also notable and logical. For example, the starch and water contents are linked because starch and water are the two main components in the wet substrate. The average air temperature (𝑇𝑇𝑚𝑚𝑋𝑋𝑎𝑎𝑚𝑚𝑣𝑣𝑎𝑎) is not correlated to the starting month because the
regression is based on linear correlation and the relation of average air temperature to starting month is not a linear correlation. 5.3.3 Correlation of yield to all variables except final contents If we take all variables into account except the final contents (𝑊𝑊𝑓𝑓, 𝑆𝑆𝑓𝑓 and 𝐴𝐴𝑓𝑓),
the measurements can explain 82% of the yield variance (Table 2). This model has a Q2 of 0.81 which is close to the R2 value, indicating that the model is reliable. We did not include the final contents because of their weak correlation to the yield (Figure 3), and because they cannot be modified during the fermentation. Note that the sign of the coefficients shows whether a variable has a positive or negative effect on the final yield (in the presence of the other variables in the model), but the absolute value of coefficients does not indicate the importance of a variable because the variables have very different numerical values. For most variables, the direction of their effect on the yield is the same as shown in Figure 3. However, there are two exceptions: - The initial acid content (𝐴𝐴0) has a very significant negative effect (p<0.001) in combination with other variables. -The maximum substrate temperature now has a significant positive coefficient. This indicates that no overheating occurred. As discussed before, it does not indicate that heating stimulates ethanol production. 5.3.4 Model based on initial conditions The starting contents of acids, starch and water (𝐴𝐴0, 𝑆𝑆0 and 𝑊𝑊0) and the initial temperature (𝑇𝑇0) are always adjusted before a fermentation batch starts in the liquor industry (Liu & Sun, 2018). Maybe that explains why a yield model using the starting contents could only explain a small proportion of the

Tabl
e 2.
Sum
mar
y of
mod
el re
sults
Varia
bles
Co
effic
ient
± st
anda
rd e
rror
β 0
114.
2 ±
5.0**
* -5
40.7
± 9
2.8**
* 52
6.5
± 13
.5**
* -5
6.3
± 13
.0*
290.
9 ±
2.3**
* 27
3.2
± 3.
8***
-46.
6± 6
.2*
W0
1.6
± 0.
3 8.
2 ±
1.3*
1.4
± 1.
1 2.
9 ±
1.0
A 0
-9.5
± 0
.6**
*-4
2.5
± 2.
3***
-10.
0 ±
0.9**
*-8
.5 ±
0.7
***
S 0
4.3
± 0.
3***
23.2
± 1
.2**
*14
± 0
.9**
*14
± 0
.9**
*
T 0
-5.0
± 0
.5*
-3.7
± 0
.8**
*-1
1.0
± 0.
6***
-7.0
± 0
.3**
*-7
.0 ±
0.5
***
t max
i -0
.1 ±
0.0
***
-0.2
± 0
.0**
*-0
.1±
0.0**
*-0
.1 ±
0.0
***
T max
4.
1 ±
0.5*
1.2±
0.3
*2.
5± 0
.6*
2.1
± 0.
6*
t 95i
-0.1
± 0
.0**
*-0
.1 ±
0.0
***
-0.1
± 0
.0**
*-0
.1 ±
0.0
*
T f
-0.5
± 0
.11
0.6
± 0.
30.
48 ±
0.2
0.2
± 0.
1
Ms
-37.
3 ±
2.0**
*-6
6.0
± 1.
9***
T air
0 -1
.3 ±
0.1
*-7
.8 ±
0.4
**-1
.6 ±
0.1
*
T air
avg
-0.3
± 0
.1-1
.6 ±
0.2
0.4
± 0.
2
R2
0.82
0.37
0.
56
0.63
0.
72
0.55
0.71
Q2
0.81
0.37
0.
56
0.63
0.
72
0.55
0.71
VIF
3.
051.
16
1.46
1.
66
2.08
1.
002.
01
Sign
ifica
nce
code
s: * : p
<0.0
5, **
: p<0
.01,
*** : p
<0.0
01.
Chapter 5
120
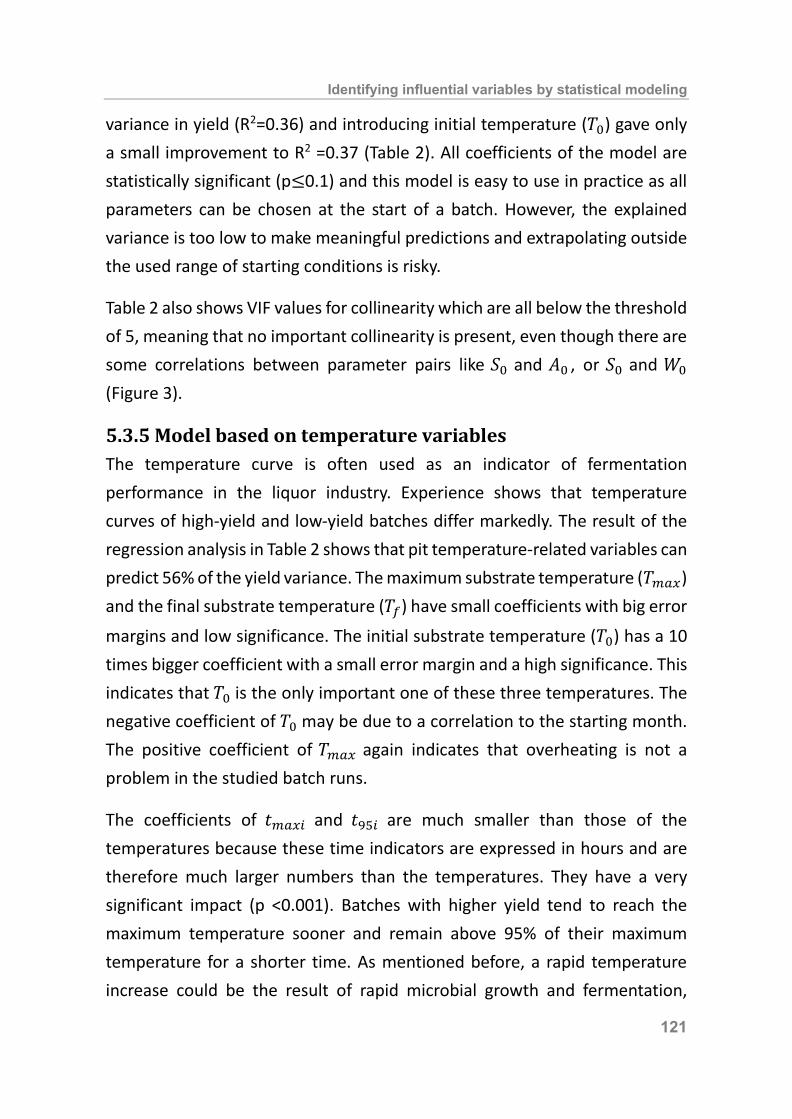
Identifying influential variables by statistical modeling
121
variance in yield (R2=0.36) and introducing initial temperature (𝑇𝑇0) gave only a small improvement to R2 =0.37 (Table 2). All coefficients of the model are statistically significant (p≤0.1) and this model is easy to use in practice as all parameters can be chosen at the start of a batch. However, the explained variance is too low to make meaningful predictions and extrapolating outside the used range of starting conditions is risky. Table 2 also shows VIF values for collinearity which are all below the threshold of 5, meaning that no important collinearity is present, even though there are some correlations between parameter pairs like 𝑆𝑆0 and 𝐴𝐴0 , or 𝑆𝑆0 and 𝑊𝑊0 (Figure 3). 5.3.5 Model based on temperature variables The temperature curve is often used as an indicator of fermentation performance in the liquor industry. Experience shows that temperature curves of high-yield and low-yield batches differ markedly. The result of the regression analysis in Table 2 shows that pit temperature-related variables can predict 56% of the yield variance. The maximum substrate temperature (𝑇𝑇𝑚𝑚𝑚𝑚𝑚𝑚) and the final substrate temperature (𝑇𝑇𝑓𝑓) have small coefficients with big error
margins and low significance. The initial substrate temperature (𝑇𝑇0) has a 10 times bigger coefficient with a small error margin and a high significance. This indicates that 𝑇𝑇0 is the only important one of these three temperatures. The negative coefficient of 𝑇𝑇0 may be due to a correlation to the starting month. The positive coefficient of 𝑇𝑇𝑚𝑚𝑚𝑚𝑚𝑚 again indicates that overheating is not a problem in the studied batch runs. The coefficients of 𝑑𝑑𝑚𝑚𝑚𝑚𝑚𝑚𝑋𝑋 and 𝑑𝑑95𝑋𝑋 are much smaller than those of the temperatures because these time indicators are expressed in hours and are therefore much larger numbers than the temperatures. They have a very significant impact (p <0.001). Batches with higher yield tend to reach the maximum temperature sooner and remain above 95% of their maximum temperature for a shorter time. As mentioned before, a rapid temperature increase could be the result of rapid microbial growth and fermentation,

Chapter 5
122
instead of the other way around. Previously, we found that the temperature peak occurs when the ethanol production stops due to product inhibition (Jin, et al., 2020). Therefore, if the temperature peaks and the yield vary, there must be other limiting factors involved. We discuss this later.
Figure 4. Classifier model result for typical high yield (>280 kg) and low yield (<280 kg) pits. The red lines indicate the time interval in which the pit temperature is at least 95% of the maximum temperature in the pit (t95i). The classifier model suggested a yield boundary of 280 kg per batch. Lower than 280 kg is classified as low yield and higher than 280 kg as high yield. The decision tree model confirms visual differences between typical temperature curves for both high-yield and low-yield fermentations (Figure 4). This agrees well with the industrial experience. For example, temperature can indicate fermentation performance including final yield. A slow temperature increases and a smaller temperature difference between 𝑇𝑇𝑚𝑚𝑚𝑚𝑚𝑚 and 𝑇𝑇0 correspond to slow ethanol production by logic. Furthermore, the decision tree model confirms that a quick reach to maximum temperature is important, as shown in Figure 4, a large portion of high yield batches reach their peak temperature early. This indicates that the temperature curve (𝑇𝑇0, 𝑑𝑑𝑚𝑚𝑚𝑚𝑚𝑚𝑋𝑋, 𝑇𝑇𝑚𝑚𝑚𝑚𝑚𝑚, 𝑑𝑑95𝑋𝑋, and 𝑇𝑇𝑓𝑓)
can be an indicator of fermentation performance, even though the R2 of regression model is only 0.56. As discussed above, the temperatures are not
Identifying influential variables by statistical modeling
123
the cause of low yield. 5.3.6 Model based on starting month Using the starting month of the batch as sole independent variable, the model gives an R2 value of 0.72 and a Q2 value of 0.72 (Table 2). Therefore, the starting month is by far the most important variable. To check the effect of starting month, the data set was separated into two groups based on the classifier model: one group with the months January, February, and March and the another with all other months. Figure 5 shows the yield frequency distributions of these two groups. Splitting the data based on high-yield months versus low-yield months results in two almost normal distributions. This may indicate that some (yet) unknown environmental or seasonal factor plays an important role.
Figure 5. Frequency plot of yield in January through March and in the rest of the year. Frequencies are based on the number of batches in the group. The decision tree model confirms that the starting month is an important factor for distinguishing high and low yield batches. All batches are assigned a class based on their yields. In the decision tree model, one simple rule in the top node, splits most of the data. This rule is based on the starting month:
Chapter 5
124
January, February or March indicates that it is probably a high-yield as 82% of this node is high-yield data. However, this node still contains 18% low-yield data which is a result of the overlap of the unimodal distributions. Therefore, there is still some variation left within these high-yield months. 5.3.7 Explaining the seasonal effect Figure 6 shows the variation in yield, average air temperature, initial acids content and initial starch content over the year. There are strong correlations between the monthly medians of the yield and the medians of average air temperature, initial acid content and initial starch content (Figure 6). However, the correlation with all values is poor (Figure 3). This is to be expected because higher and lower values cancel each other out if we look at the medians only. Air temperature is the most obvious variable that changes with the season (Figure 6B). The initial and average air temperatures together (𝑇𝑇𝑚𝑚𝑋𝑋𝑎𝑎0 and 𝑇𝑇𝑚𝑚𝑋𝑋𝑎𝑎𝑚𝑚𝑣𝑣𝑎𝑎) give an R2 of 0.55 (Table 2), but the average air temperature alone
gave an R2 of 0.05. Only the initial air temperature has an effect. The air temperature is associated to the cooling of the pits, either directly or indirectly via the soil temperature (Marquez, et al., 2016), which affects the cooling (Jin, et al., 2020). However, there are no signs of overheating during any of the fermentation runs. Therefore, the air temperature cannot explain the seasonal variation in yield. Lactic acid is one of the main products during Chinese liquor fermentation and the lactic acid content can reach high values (2.0g/100 g wet substrate) (Tao, et al., 2014; Yang, et al., 2019) while a lactic acid content of 0.2-0.8% (w/v) induces stress in yeasts (Narendranath, Thomas, & Ingledew, 2001). Lactic acid inhibition was demonstrated in Chinese liquor fermentation: if lactic acid bacteria are dominant at the beginning of the batch process, this can give inhibition during the whole fermentation process (Deng, Du, & Xu, 2020; Zhao, et al., 2020). It was also found that lactic acid bacteria form a higher percentage of the total microbial biomass in the pit during the summer,
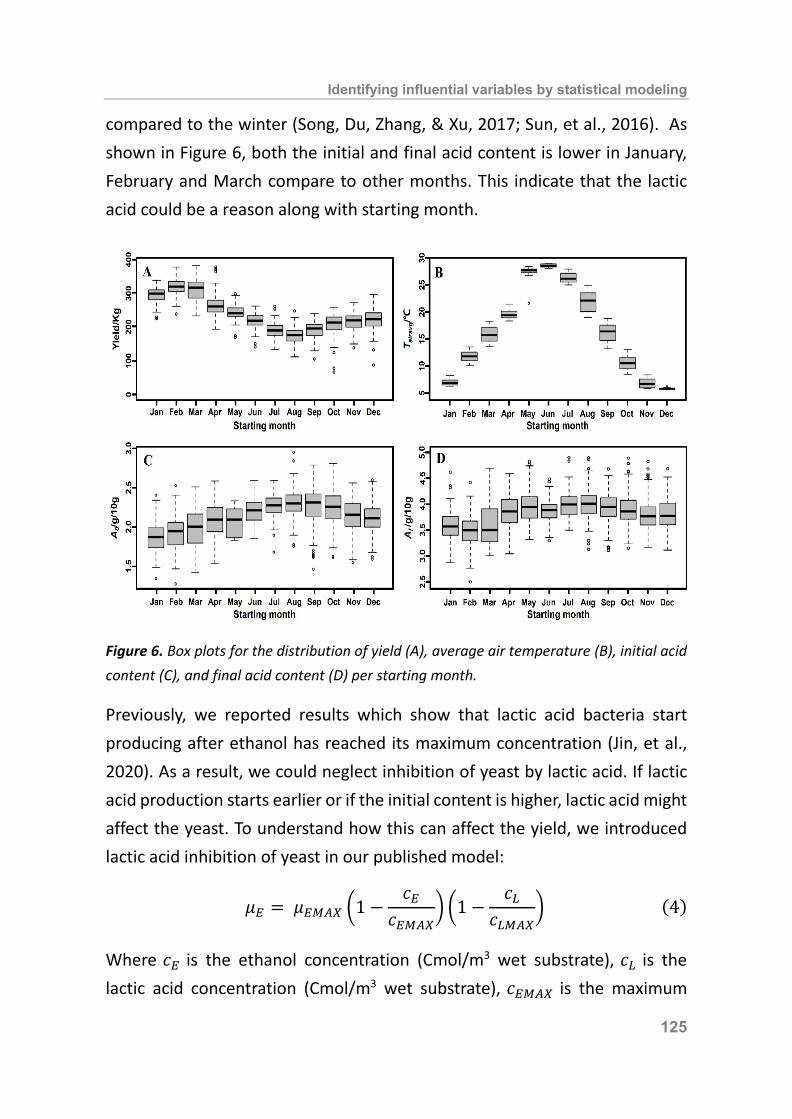
Identifying influential variables by statistical modeling
125
compared to the winter (Song, Du, Zhang, & Xu, 2017; Sun, et al., 2016). As shown in Figure 6, both the initial and final acid content is lower in January, February and March compare to other months. This indicate that the lactic acid could be a reason along with starting month.
Figure 6. Box plots for the distribution of yield (A), average air temperature (B), initial acid content (C), and final acid content (D) per starting month. Previously, we reported results which show that lactic acid bacteria start producing after ethanol has reached its maximum concentration (Jin, et al., 2020). As a result, we could neglect inhibition of yeast by lactic acid. If lactic acid production starts earlier or if the initial content is higher, lactic acid might affect the yeast. To understand how this can affect the yield, we introduced lactic acid inhibition of yeast in our published model:
𝜇𝜇𝑠𝑠 = 𝜇𝜇𝑠𝑠𝑆𝑆𝑀𝑀𝑋𝑋 �1 −𝑐𝑐𝑠𝑠
𝑐𝑐𝑠𝑠𝑆𝑆𝑀𝑀𝑋𝑋� �1 −
𝑐𝑐𝑠𝑠𝑐𝑐𝑠𝑠𝑆𝑆𝑀𝑀𝑋𝑋
� (4)
Where 𝑐𝑐𝑠𝑠 is the ethanol concentration (Cmol/m3 wet substrate), 𝑐𝑐𝑠𝑠 is the lactic acid concentration (Cmol/m3 wet substrate), 𝑐𝑐𝑠𝑠𝑆𝑆𝑀𝑀𝑋𝑋 is the maximum
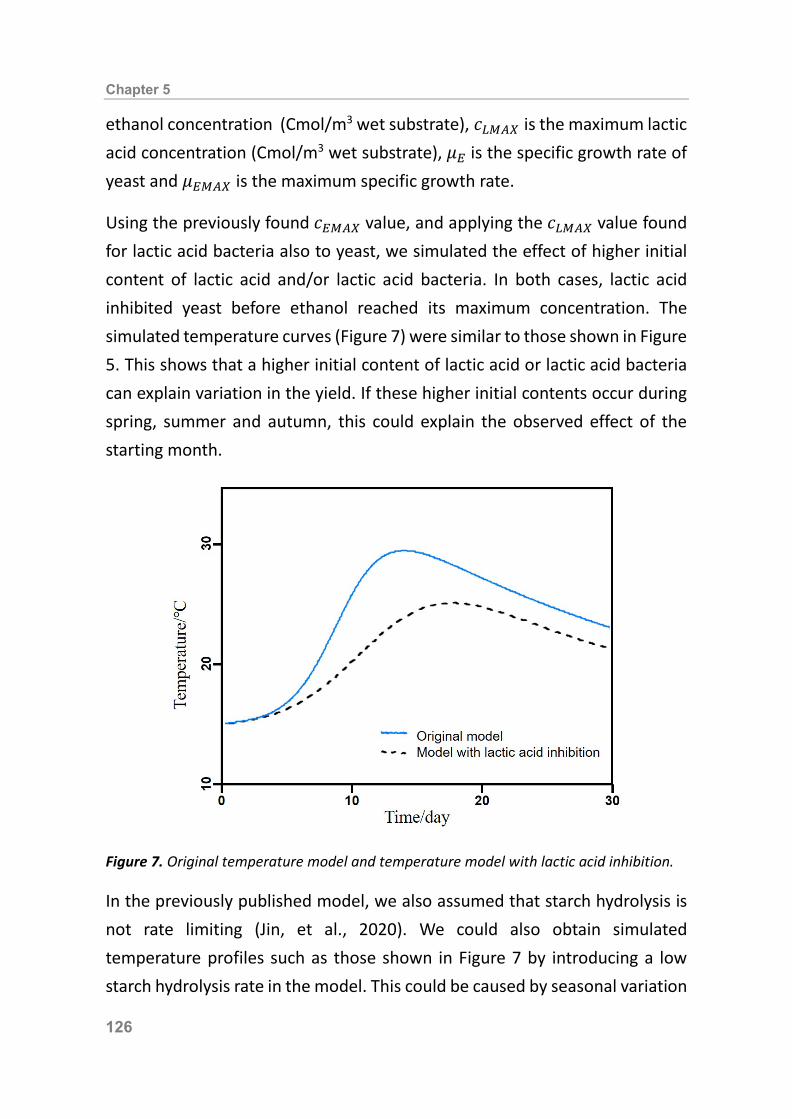
Chapter 5
126
ethanol concentration (Cmol/m3 wet substrate), 𝑐𝑐𝑠𝑠𝑆𝑆𝑀𝑀𝑋𝑋 is the maximum lactic acid concentration (Cmol/m3 wet substrate), 𝜇𝜇𝑠𝑠 is the specific growth rate of yeast and 𝜇𝜇𝑠𝑠𝑆𝑆𝑀𝑀𝑋𝑋 is the maximum specific growth rate. Using the previously found 𝑐𝑐𝑠𝑠𝑆𝑆𝑀𝑀𝑋𝑋 value, and applying the 𝑐𝑐𝑠𝑠𝑆𝑆𝑀𝑀𝑋𝑋 value found for lactic acid bacteria also to yeast, we simulated the effect of higher initial content of lactic acid and/or lactic acid bacteria. In both cases, lactic acid inhibited yeast before ethanol reached its maximum concentration. The simulated temperature curves (Figure 7) were similar to those shown in Figure 5. This shows that a higher initial content of lactic acid or lactic acid bacteria can explain variation in the yield. If these higher initial contents occur during spring, summer and autumn, this could explain the observed effect of the starting month.
Figure 7. Original temperature model and temperature model with lactic acid inhibition. In the previously published model, we also assumed that starch hydrolysis is not rate limiting (Jin, et al., 2020). We could also obtain simulated temperature profiles such as those shown in Figure 7 by introducing a low starch hydrolysis rate in the model. This could be caused by seasonal variation
Identifying influential variables by statistical modeling
127
in the quality of the Qu used as starter culture. Unfortunately, we do not have data to support the hypotheses that low yield is caused by lactic acid or by slow starch hydrolysis. Extended sampling and measurements are needed in the future to explain the influence of the starting month. 5.4 Conclusions To identify the influential variables during Chinese liquor solid-state fermentation process, we built statistical models based on multi linear regression and classifier models. Model based on starting concentrations and temperature profile cannot give reliable predictions. The starting month is the most important variable but not because of the ambient temperature. The reason could be the higher inhibition from lactic acid bacteria during April-December. Future study should focus on this inhibition through both statistical modeling and mechanistic modeling.
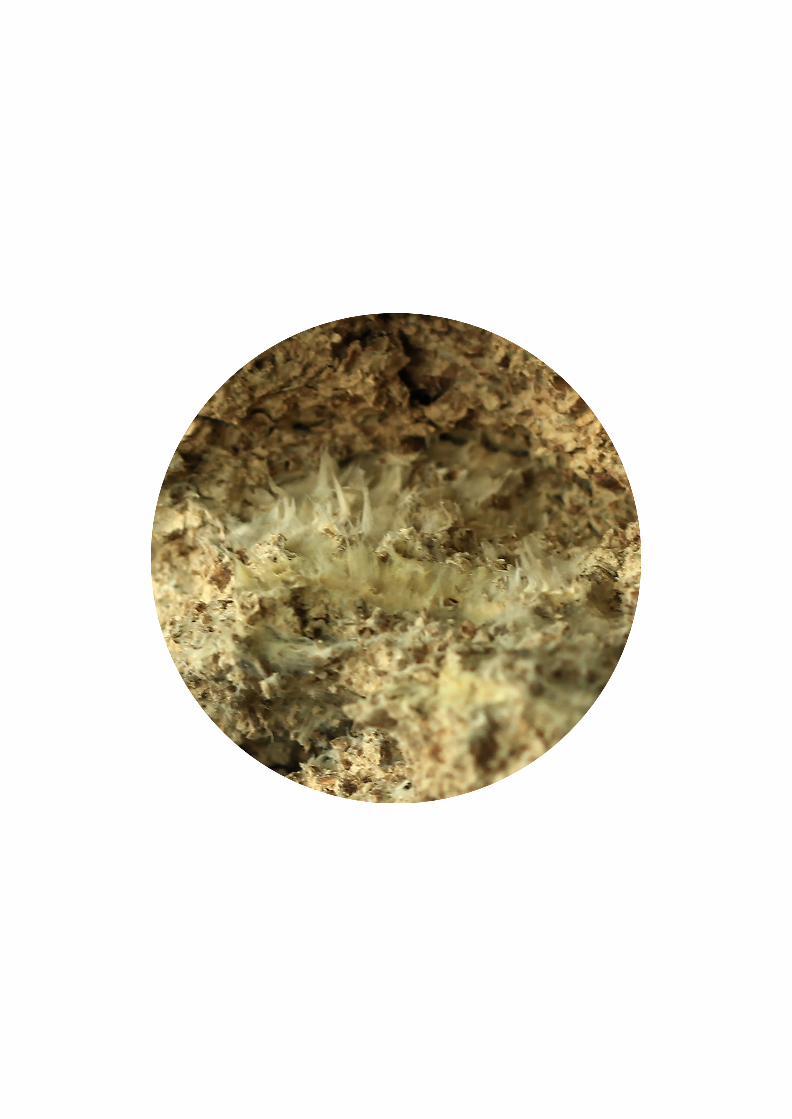
128

129
Chapter 6
General discussion: engineering aspects of traditional solid-state fermentation
Chapter 6
130
Abstract
Traditional spontaneous solid-state fermentations are complex multi-species
microbial processes that remain so far empirical and therefore difficult to
control. Due to the poor control, product quality and process efficiency may
fluctuate. Lack of engineering insights into the mysterious process hampers
the realization of process modernization. Therefore, we address here the
feasibility and prospects of process engineering studies for traditional solid-
state food fermentations, with Chinese liquor production as a case example
because it is a rather complex 2-step spontaneous solid-state fermentation
process (first aerobic for starter preparation and then anaerobic for ethanol
production) with multi-species of fungi, yeasts and bacteria. We summarize
successful approaches and drawbacks. Moreover, we propose new strategies
to further modernize and optimize traditional solid-state food fermentations.
General discussion
131
6.1 Introduction Traditional fermentations provide numerous products including food and beverages like beer, bread, cheese and wine in the west, and soy sauce, sake, miso, Tempe and vinegar in the east (Lund & Bohlmann, 2006; Soccol, et al., 2017; Wolfe & Dutton, 2015; Zhu & Tramper, 2013). These traditional fermentations have evolved through the human civilization in one way or other to modern biotechnological processes. A typical example is the very first industrial microbial enzyme production late 1800’s in the US by the Japanese scientist Dr. Takamine with a process derived from traditional Koji preparation (Zhu & Tramper, 2013), a historical milestone because nowadays we use mainly enzymes of microbial origin. In the last century, many similar traditional processes have been modernized with the rapid development of biotechnology, including wine, cheese, bread in the west and soy sauce, sake in Japan (Tramper & Zhu, 2011; Zhu & Tramper, 2013). However, still many traditional food fermentations, in particular those in the Orient, are operated in a very primitive and empirical manner as it was done centuries ago (Jin, et al., 2017; Takenaka, et al., 2020). These uncontrolled spontaneous fermentations raise increasingly concern about food safety, production quality and sustainability. It is undeniable that many efforts have been made to improve or modernize these traditional food fermentations, covering many disciplines including microbiology and chemistry. Unfortunately, hardly any breakthrough could be found concerning engineering aspects of these fermentations although this is crucial for process control and optimization. One would wonder how this could happen seeing the rapid large-scale industrialization and modernization of submerged fermentation since the discovery of penicillin. An obvious reason is that most traditional food fermentations are solid-state fermentations that have fundamentally different engineering characters to make the understanding, control, optimization and up-scaling even more difficult (Rahardjo, et al., 2006; Thomas, et al., 2013). Another reason is the industry itself behaves rather
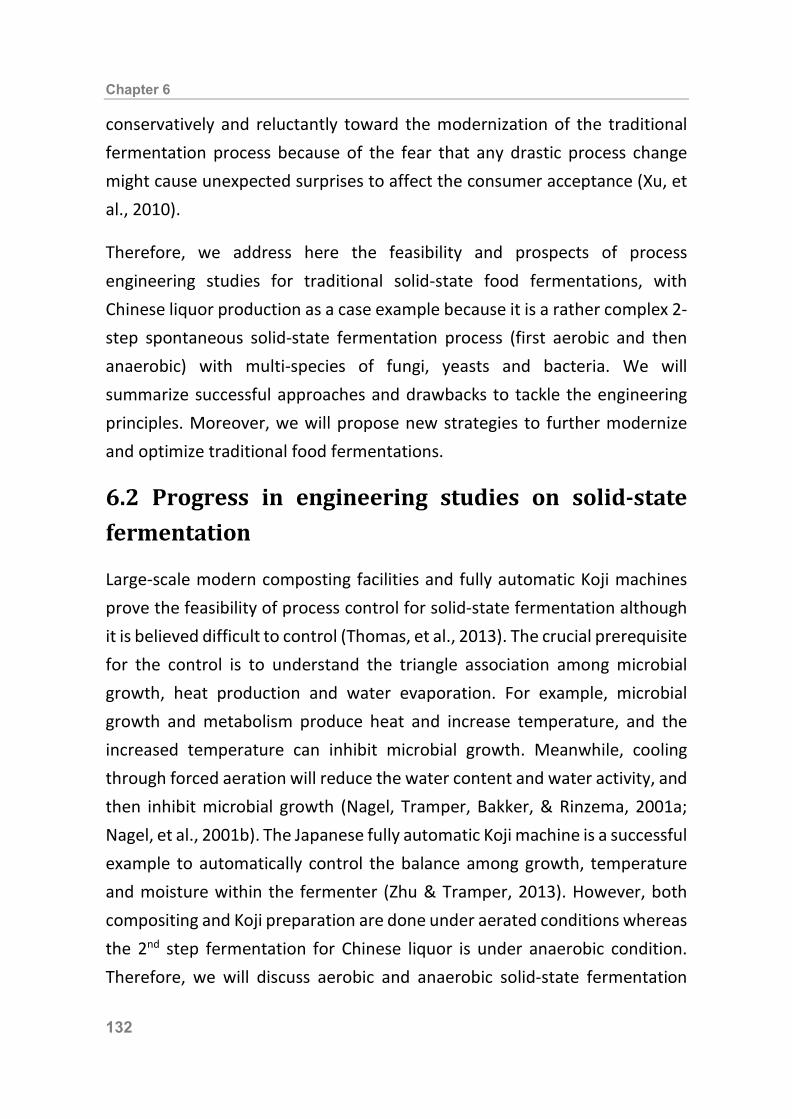
Chapter 6
132
conservatively and reluctantly toward the modernization of the traditional fermentation process because of the fear that any drastic process change might cause unexpected surprises to affect the consumer acceptance (Xu, et al., 2010). Therefore, we address here the feasibility and prospects of process engineering studies for traditional solid-state food fermentations, with Chinese liquor production as a case example because it is a rather complex 2-step spontaneous solid-state fermentation process (first aerobic and then anaerobic) with multi-species of fungi, yeasts and bacteria. We will summarize successful approaches and drawbacks to tackle the engineering principles. Moreover, we will propose new strategies to further modernize and optimize traditional food fermentations. 6.2 Progress in engineering studies on solid-state fermentation Large-scale modern composting facilities and fully automatic Koji machines prove the feasibility of process control for solid-state fermentation although it is believed difficult to control (Thomas, et al., 2013). The crucial prerequisite for the control is to understand the triangle association among microbial growth, heat production and water evaporation. For example, microbial growth and metabolism produce heat and increase temperature, and the increased temperature can inhibit microbial growth. Meanwhile, cooling through forced aeration will reduce the water content and water activity, and then inhibit microbial growth (Nagel, Tramper, Bakker, & Rinzema, 2001a; Nagel, et al., 2001b). The Japanese fully automatic Koji machine is a successful example to automatically control the balance among growth, temperature and moisture within the fermenter (Zhu & Tramper, 2013). However, both compositing and Koji preparation are done under aerated conditions whereas the 2nd step fermentation for Chinese liquor is under anaerobic condition. Therefore, we will discuss aerobic and anaerobic solid-state fermentation
General discussion
133
separately. 6.2.1 Aerobic solid-state fermentation To understand the crucial triangle association among microbial growth, heat transfer and water evaporation, mathematical models are developed to describe water dynamics (Gervais & Molin, 2003; Nagel, et al., 2002), temperature changes (Fanaei & Vaziri, 2009; Smits, et al., 1998), biomass productivity (Vargas-Moreno, Callejon-Ferre, Perez-Alonso, & Velazquez-Marti, 2012) and process control (Nagel, et al., 2001a, 2001b). In these studies, the fundamental engineering principles of solid-state fermentation have been thoroughly explored to provide us basic clue for further study of more complex systems like traditional solid-state fermentation for Chinese liquor. In contrast to most studies with pure culture of a single microorganism, traditional spontaneous solid-state fermentations are done with mixed cultures of fungi, yeasts and bacteria (Tamang, et al., 2020). For example, a mixture culture is used to produce red rice (Song, et al., 2019), Koji (Machida, et al., 2008), Furu (Han, Rombouts, & Nout, 2001) and Pu’er tea (Mo, Zhu, & Chen, 2008; Zhou, Zhang, Xu, & Yang, 2005). For Chinese liquor starter Qu (a sort of Koji), molds, yeasts and bacteria are spontaneously inoculated from the natural flora, each with their specific functions for the liquor production (Zheng, et al., 2011). Nevertheless, using mixed cultures or single species will not affect the basic engineering principles of the process, i.e. the triangle association among microbial growth, heat transfer and water evaporation that have the same crucial importance for all solid-state fermentations. The increased complexity for multi-species fermentation is the interaction among microorganisms and their metabolites. For example, some microbes or their metabolites can inhibit other microbes, or even the ratio between microbial populations can affect the process (Wu, et al., 2016). For Qu preparation, a higher fermentation temperature is needed to prevent the contamination of undesired microbes and meanwhile to enrich favorable microbes to produce enzymes and flavor precursors (Zheng, et al., 2011). For
Chapter 6
134
example, the maximum temperature can easily reach 50 ° C during Qu
preparation. Microbial growth and metabolism generate a lot of heat, leading to rapid water transport resulting in a rapid change in water content and steep water gradient. To prevent water form becoming a limiting factor for microbial growth, timely, or preferably online monitoring of water content in the substrate matrix is the prerequisite for control. NMR methods are explored to monitor water dynamics not only to determine the water content but also to determine the different water states and migration in a simulated Qu fermentation system (Jin, et al., 2019). Based on the NMR method, water activity can be measured online and in a non-destructive way. 6.2.2 Anaerobic solid-state fermentation Anaerobic solid-state fermentation is not that widely used compared to aerobic solid-state fermentation (Mumme, Linke, & Tolle, 2010) and in particular, hardly any studies could be found on engineering aspects thereof. The 2nd step fermentation for Chinese liquor is under anaerobic solid-state conditions (Jin, et al., 2017). Under anaerobic conditions, microbes will have less or lower heat production, but the absence of forced aeration will reduce the cooling rate. This leads to another deviation from the basic engineering principles valid for aerobic solid-state fermentations. However, as stated above, the major problems are the same: heat accumulation and heterogeneous distribution. Another issue is that heat is even harder to remove without forced aeration although less heat is produced without oxygen. A theoretical model describes the temperature profiles in a rotating drum bioreactor where the temperature can reach 40 °
C inside the fermentation matrix (Wang, et al., 2010). Under this circumstance, factors other than temperature might limit microbial growth, for example product inhibition. However, hardly any study can be found to consider product (ethanol) inhibition in an anaerobic solid-state fermentation.
General discussion
135
To better quantitatively understand the traditional anaerobic solid-state fermentation, we built a simple model based on Han-Levenspiel equation for product inhibition (Jin, et al., 2020). This simple model can accurately describe product formation, temperature profiles inside the fermentation pit and the heat flow from inside to outside. However, this first-step model is built based on a series of assumptions, especially that ethanol production is only inhibited by ethanol, and not by (lactic) acid, temperature, lack of starch or water. The model cannot explain why the amount of output (individual batch yield) can differ by a factor 3.5, a fact observed in industrial practice. Furthermore, industrial data suggest that overheating can occur, and that initial acids can be a problem. To find out the other influential variables, we used a statistical model based on linear regression analysis and a decision tree model. In contrast to the mechanistic model that misses some variables (factors) influencing ethanol production in the industry, the statistical analysis of industrial data can be a first step towards identifying critical process variables that must be added to the mechanism model established earlier (Jin, et al., 2020). The statistical model demonstrates that the starting month has the most significant impact on liquor yield. The air temperature is the most significant parameter that changes with starting month, which could increase the soil temperature and further influence the temperature inside the pit (Jin, et al., 2020). However, we could not find any overheating in the pit. Then the temperature factors like air temperature and soil temperature could not be the reason in this case, although phenomenally seems to be. The likely reason behind could be the seasonal effect on acid production by lactic acid bacteria and starch hydrolysis. To uncover this mystery, strategies will be proposed in the following section.
6.3 Challenges and perspectives 6.3.1 Challenges As described above, studies are still in the pioneering stage on engineering aspects of traditional solid-state fermentation particularly under anaerobic
Chapter 6
136
conditions. Our explorative work demonstrates the potential of various modelling methods but meanwhile exposes shortcomings or limitations for the application. Therefore, we address below the challenges and in the subsequent section propose future research needs for the ultimate control and optimization of this fermentation process. First, more online sensors and fast off-line assays are needed to detect process parameters. Temperature and gases (CO2 and O2) are parameters that are easy to measure and give a lot of information of the process. NMR can be used for online monitoring of water dynamic during fermentation. However, other important parameters like biomass, substrate (nutrient) concentrations and product (metabolite) concentrations are still difficult to monitor online. To understand the kinetics of these parameters, advanced online measurements need to be developed to measure the concentrations of glucose, ethanol, lactic acid, acetic acid, viable biomass of yeasts and lactic acid bacteria. Without knowing how these parameters change quantitively during the fermentation, control and optimization can only remain trial and error. Second, although simple mechanistic models and statistical models are developed to describe and predict the fermentation process, further improvements are needed to develop more robust models. For example, in the mechanistic models, product inhibition is included under the assumption that a given microorganism is only inhibited by its own metabolite, for instance yeasts are only inhibited by ethanol. However, in the reality of a complex spontaneous multi-species fermentation, microorganisms are not only inhibited by their own metabolites, but also by those from the co-existing microorganisms. For example, yeasts will be inhibited by lactic acid produced by lactic acid bacteria, and vice versa. Third, considering the transfer from theoretical study to practical application, the real challenge would be to predict flavor formation in the final liquor product, the most crucial quality criterion. For a complex multi-species food
General discussion
137
fermentation, one needs to know which microorganism makes what metabolites, how fast, and – maybe most important and difficult – how their concentration profiles in the final fermentation matrix or even after distillation, how process variables influence the final flavor profile, and even steam stripping. A model integrating flavor formation as a quality criterion would be interesting for the industry to predict the fermentation quality. Last but not least, the ultimate target of both theoretical and practical study includes process optimization, bioreactor design, up-scaling and process control. 6.3.2 Future research needs Most traditional solid-state fermentations are empirical processes without rationale design and control on a scientific basis. However, efforts are made to significantly improve process control and scale-up in some of solid-state fermentation practice, for example composting for the mushroom industry already uses process control in large scale composting (CNC, 2020; Jurak, 2015), and fully automatic Koji machines are used in Japan and Eastern Asia already for decades (Zhu & Tramper, 2013). The scale of a fermenter and level of sophisticated process control are comparable with a typical submerged fermentation plant or a chemical factory. These technologies have not yet adopted in most traditional solid-state food fermentations. The reluctant and resistant altitude toward process modernization by the industrial sector is because of the fear that quality might be reduced by drastic process changes. However, lack of engineering insights into the process is the real reason. To improve and modernize the traditional solid-state food fermentation such as Chinese liquor production, we need an integrated action with (bio)chemical engineers, microbiologists, flavor chemists, thus cross-disciplinary actions (Figure 1). Below we propose the most important steps needed to achieve this with the emphasis on process engineering though.

Chapter 6
138
Figure 1. Summary of future research need for engineering aspect of Chinese liquor fermentation. Industrial data collection and analysis Often, it is unclear what the most important process variables are for an empirical process. The initial step is to detect the influential variables in the industrial practice. Fortunately, most industries do record process data by online temperature measurement, offline analysis of samples for pH, ethanol, acids and water/dry matter. With the development of more advanced sensors and assays, more variables must become measurable including microbial diversity and quantity, concentrations of substrate nutrients and other microbial metabolites. The outcome of these measurements should enable more accurate and reliable predictions for the fermentation. Statistical tools (analysis and modeling) are an alternative to assess influential variables affecting the fermentation outcome, based on data available in the industry so far. Through correlation, influential variables can be defined, as

General discussion
139
described in our previous study (Chapter 5). However, to more accurately define the influential factor, as what we found the effect of the starting month of a fermentation (seasonal changing), we need additional data to explain the reason before further control and optimization can be done. For example, the effect of starting month in the winter can be the cooler air temperature that affects the initial microbial consortium entering the fermentation matrix with more yeast domination. In contrast, the summer month might have a bacterial domination that enables more acid production to inhibit ethanol production from yeasts. All these need to be confirmed in the future. Process models In close collaboration with microbiologists and food chemists, we can study kinetics of microbial growth and product formation (including enzymes in Qu and flavors in pits). For example, one of the first actions can be to confirm the hypothesis of lactic acid inhibition (Chapter 5). Once we can prove that lactic acid bacteria cause low ethanol yields, we can think of improving the system by preventing lactic acid bacteria from dominating the microbial consortium or by fortifying extra yeasts to dominate the microbial consortium. Within the same category we can also trace important enzymes from starter (microorganisms) based on ethanol yield and flavor profiles to design starters (Qu) and inoculum for ethanol fermentation (Wang, Wu, Xu, & Sun, 2020). Then process models can be established that combine kinetics and transport phenomenon of heat and mass (water, starch, flavor products etc.). This always starts with a simple model, like Han-Levenspiel model for product inhibition (Jin, et al., 2020), because we want to understand things first. Then we can expand or modify the model if it does not predict observed outcomes. For this complex fermentation system, the data-driven model is another option (Zieringer & Takors, 2018). For example, the statistical model correlates the final liquor yield with an aery of variables in Chapter 5. Rigorous mathematical descriptions of microbial cells and consortia thereof will enable
Chapter 6
140
deeper biological understanding and lead to powerful in silico cellular models (Straathof, et al., 2019). However, the data-driven model still needs combination of mechanistic model for test and application. Down-scaling approach Most fermentation optimization starts with lab-scale studies to define basic principles under controlled conditions (Durand, et al., 1993; Noorman, 2011). Lab-scale studies simplify complex system to enable easier monitoring and control as we used to study the water dynamics during the Qu starter preparation (Jin, et al., 2019). Similar approach can be applied to both aerobic and anaerobic conditions when appropriate facilities are available. To further simply in a down-scaled system, a defined microbial consortium can be adopted. Earlier studies reveal many key microbes in Chinese liquor fermentation (Du, Wu, & Xu, 2020; Wang, et al., 2019). This makes a designed and controlled inoculation possible if the microbes are culturable. The scaling-down approach is worth trying for both the (aerobic) starter preparation and (anaerobic) pit fermentation. The biggest challenge is if the down-scaled process can represent an industrial fermentation, especially for complex Chinese liquor fermentation process. This must be based on models to predict what will happen in the industrial scale. A series of studies in industrial practice are needed to completely understand the current fermentation process not only for process parameter dynamics, but also the microbes involved and their evolution and metabolism (flavor formation) during fermentation. In other words, scaling- down can be used to validate lab systems whereas in silico method can be used to estimate how an industrial plant will respond to modified systems developed on lab-scale (Wang, Haringa, Noorman, Chu, & Zhuang, 2020). More importantly, the test and application of suggested improvements is an important target for down-scale study (Heins, Lencastre Fernandes, Gernaey, & Lantz, 2015). For example, for aerobic solid-state fermentation,

General discussion
141
temperature, water supply and air flow are always important parameters used to control the fermentation after evaluation of measured water, CO2 and O2 content in off-gas, temperature in the bed. Also, it is much easier to apply these improvements at down-scaled process compared to industrial scale. Design of the whole system The design of the whole system covers therefore starter Qu preparation, pit fermentation and distillation. In the Chinese liquor industry, most of the operations are based on generations of craftsman’s experience with rough control of initial conditions. For starter preparation, controlled variables include ratio of raw materials, preparation season, and for the pit fermentation, controlled items include the initial content of starch, water and acids, initial substrate temperature and the starter inoculation size (without knowing detailed microbial distribution though). However, for a modern controlled process, control of parameters during fermentation process can be more important, in silico approach can play an important role here. For example, non-linear model predictive control and evolutionary computation are successfully used to optimize the bioethanol production in silico in a fed-batch bioreactor (de Freitas, Olivo, & Andrade, 2017). Bioreactor design for both the starter preparation and pit fermentation with process control is another desired breakthrough of process optimization because for most of the Chinese liquor industry, the ancient underground clay pit is still widely used. Scale-up work is necessary to develop new fermenters. The Koji machine is already widely used for soy sauce Koji production (Zhu & Tramper, 2013). Although a fermenter for Qu preparation might be different from Japanese Koji fermentation that is modernized and simplified with only one singular fungus Aspergillus oryzae, the development is no longer a mission impossible because of the development of modern biotechnology and chemical engineering. Similarly, for anaerobic fermenters, still much work needs to be done as described above. Both the mechanistic and data-driven

Chapter 6
142
models can help for scale-up and bioreactor design (Wang, et al., 2020; Zieringer & Takors, 2018). Downstream processes are yet another increasingly important concern of the Chinese liquor industry, here the distillation (Ye, et al., 2018; Zhi, et al., 2017). The Chinese liquor distillation process is running under rather primitive solid-state condition that is believed to have unique impact on the liquor flavor (Ding, Huang, Wu, & Zhou, 2017; Li, Huang, Shen, & Yi, 2012). Any attempt to analyze, evaluate and improve this process should be a useful integrating part to optimize the whole production system. 6.4 Conclusion Most traditional solid-state fermentations are still running without process control to produce our daily foods and beverages. Many efforts have been made in microbiological and chemical topics to improve these fermentations but much less in engineering to modernize, standardize and optimize this industrial sector. Pioneering attempts promisingly demonstrate the feasibility to realize engineering breakthroughs. With the confidence from successful industrial examples like compositing and Koji making and consorted actions from microbiologists and chemists, further engineering improvements are no longer a mission impossible for the traditional solid-state food fermentation sector.

143

144

145
References
References
146
References
Agger, T., Spohr, A. B., Carlsen, M., & Nielsen, J. (1998). Growth and product formation of Aspergillus oryzae during submerged cultivations: verification of a morphologically structured model using fluorescent probes. Biotechnology and Bioengineering, 57, 321-329.
Alsaffar, A. A. (2016). Sustainable diets: The interaction between food industry, nutrition, health and the environment. Food Science and Technology International, 22, 102-111.
Aprotosoaie, A. C., Luca, S. V., & Miron, A. (2016). Flavor chemistry of cocoa and cocoa products-an overview. Comprehensive Reviews in Food Science and Food Safety, 15, 73-91.
Arora, S., Rani, R., & Ghosh, S. (2018). Bioreactors in solid state fermentation technology: design, applications and engineering aspects. Journal of Biotechnology, 269, 16-34.
Badia-Melis, R., Mishra, P., & Ruiz-Garcia, L. (2015). Food traceability: new trends and recent advances. a review. Food Control, 57, 393-401.
Bank, D. D. (2019). [online] Available at: https://www.ddbst.com/. [Accessed March 2019].
Becker, B. R., & Fricke, B. A. (2003). FREEZING | Principles. In B. Caballero (Ed.), Encyclopedia of food sciences and nutrition (Second Edition) (pp. 2706-2711). Oxford: Academic Press.
Bellon-Maurel, W., Orliac, O., & Christen, P. (2003). Sensors and measurements in solid state fermentation: a review. Process Biochemistry, 38, 881-896.
Benedict, F. G., & Osborne, T. B. (1907). The heat combustion of vegetable proteins. Journal of Biological Chemistry, 3, 119-133.
Besenhard, M. O., Scheibelhofer, O., Francois, K., Joksch, M., & Kavsek, B. (2018). A multivariate process monitoring strategy and control concept for a small-scale fermenter in a PAT environment. Journal of Intelligent Manufacturing, 29, 1501-1514.
Beyter, D., Tang, P.-Z., Becker, S., Hoang, T., Bilgin, D., Lim, Y. W., Peterson, T. C., Mayfield, S., Haerizadeh, F., Shurin, J. B., Bafna, V., & McBride, R. (2016). Diversity, productivity, and stability of an industrial microbial ecosystem. Applied and Environmental Microbiology, 82, 2494-2505.
Bicciato, S., Bagno, A., Solda, M., Manfredini, R., & Di Bello, C. (2002). Fermentation diagnosis by multivariate statistical analysis. Applied Biochemistry and

References
147
Biotechnology, 102, 49-62.
Blandino, A., Al-Aseeri, M. E., Pandiella, S. S., Cantero, D., & Webb, C. (2003). Cereal-based fermented foods and beverages. Food Research International, 36, 527-543.
Broadbent, D. H. (1973). Environmental issues in the management of a public industry. Atmospheric Environment (1967), 7, 1199-1204.
Burnham, A. K. (2010). Estimating the heat of formation of foodstuffs and biomass. In (pp. Medium: ED; Size: 11 p.): Lawrence Livermore National Lab. (LLNL), Livermore, CA (United States).
Carrau, F., Gaggero, C., & Aguilar, P. S. (2015). Yeast diversity and native vigor for flavor phenotypes. Trends in Biotechnology, 33, 148-154.
Carson, J. K., Lovatt, S. J., Tanner, D. J., & Cleland, A. C. (2006). Predicting the effective thermal conductivity of unfrozen, porous foods. Journal of Food Engineering, 75, 297-307.
Casciatori, F. P., Bueck, A., Thomeo, J. C., & Tsotsas, E. (2016). Two-phase and two-dimensional model describing heat and water transfer during solid-state fermentation within a packed-bed bioreactor. Chemical Engineering Journal, 287, 103-116.
Casciatori, F. P., Laurentino, C. L., Taboga, S. R., Casciatori, P. A., & Thomeo, J. C. (2014). Structural properties of beds packed with agro-industrial solid by-products applicable for solid-state fermentation: experimental data and effects on process performance. Chemical Engineering Journal, 255, 214-224.
Castilho, L. R., Medronho, R. A., & Alves, T. L. M. (2000). Production and extraction of pectinases obtained by solid state fermentation of agroindustrial residues with Aspergillus niger. Bioresource Technology, 71, 45-50.
Chen, B., Wu, Q., & Xu, Y. (2014). Filamentous fungal diversity and community structure associated with the solid state fermentation of Chinese Maotai-flavor liquor. International Journal of Food Microbiology, 179, 80-84.
Chen, H. Z., & Qiu, W. H. (2010). Key technologies for bioethanol production from lignocellulose. Biotechnology Advances, 28, 556-562.
Chen, J., & Zhu, Y. (2013). Solid state fermentation for foods and beverages. Broken Sound Parkway, NW: CRC Press.
Chen, S., Xu, Y., & Qian, M. C. (2013). Aroma characterization of Chinese rice wine by gas chromatography-olfactometry, chemical quantitative analysis, and aroma reconstitution. Journal of Agricultural and Food Chemistry, 61, 11295-11302.
Cheng, P. Y., Fan, W. L., & Xu, Y. (2013). Quality grade discrimination of Chinese strong
References
148
aroma type liquors using mass spectrometry and multivariate analysis. Food Research International, 54, 1753-1760.
CNC. (2020). [online] Available at: https://www.cncgrondstoffen.nl/engels. [Accessed August 2020].
de Freitas, H. F. S., Olivo, J. E., & Andrade, C. M. G. (2017). Optimization of bioethanol in silico production process in a fed-batch bioreactor using non-linear model predictive control and evolutionary computation techniques. Energies, 10, 23.
de Olmos, A. R., Bru, E., & Garro, M. S. (2015). Optimization of fermentation parameters to study the behavior of selected lactic cultures on soy solid state fermentation. International Journal of Food Microbiology, 196, 16-23.
Deng, N., Du, H., & Xu, Y. (2020). Cooperative response of Pichia kudriavzevii and Saccharomyces cerevisiae to lactic acid stress in Baijiu fermentation. Journal of Agricultural and Food Chemistry, 68, 4903-4911.
Ding, X. F., Huang, J., Wu, C. D., & Zhou, R. Q. (2017). Effects of different distillation patterns on main compounds of Chinese Luzhou-flavour raw liquors. Journal of the Institute of Brewing, 123, 442-451.
Doan, X. T., Srinivasan, R., Bapat, P. M., & Wangikar, P. P. (2007). Detection of phase shifts in batch fermentation via statistical analysis of the online measurements: A case study with rifamycin B fermentation. Journal of Biotechnology, 132, 156-166.
Dong, D., Zheng, W., Wang, W., Zhao, X., Jiao, L., & Zhao, C. (2014). A new volatiles-based differentiation method of Chinese spirits using longpath gas-phase infrared spectroscopy. Food Chemistry, 155, 45-49.
Doumas, A., van den Broek, P., Affolter, M., & Monod, M. (1998). Characterization of the prolyl dipeptidyl peptidase gene (dppIV) from the koji mold Aspergillus oryzae. Applied and Environmental Microbiology, 64, 4809-4815.
Driehuis, F., Elferink, S., & Spoelstra, S. F. (1999). Anaerobic lactic acid degradation during ensilage of whole crop maize inoculated with Lactobacillus buchneri inhibits yeast growth and improves aerobic stability. Journal of Applied Microbiology, 87, 583-594.
Du, H., Fan, W. L., & Xu, Y. (2011). Characterization of geosmin as source of earthy odor in different aroma type Chinese liquors. Journal of Agricultural and Food Chemistry, 59, 8331-8337.
Du, H., Lu, H., & Xu, Y. (2015). Influence of geosmin-producing streptomyces on the growth and volatile metabolites of yeasts during Chinese liquor fermentation. Journal of Agricultural and Food Chemistry, 63, 290-296.
Du, R. B., Wu, Q., & Xu, Y. (2020). Chinese liquor fermentation: identification of key flavor-

References
149
producing Lactobacillus spp. by quantitative profiling with indigenous internal standards. Applied and Environmental Microbiology, 86, 14.
Duboc, P., Marison, I., & von Stockar, U. (1999). Chapter 6 - Quantitative calorimetry and biochemical engineering. In R. B. Kemp (Ed.), Handbook of Thermal Analysis and Calorimetry (Vol. 4, pp. 267-365): Elsevier Science B.V.
Durand, A., Renaud, R., Almanza, S., Maratray, J., Diez, M., & Desgranges, C. (1993). Solid-state fermentation reactors - from lab scale to pilot-plant. Biotechnology Advances, 11, 591-597.
Emel'yanenko, V. N., Verevkin, S. P., Schick, C., Stepurko, E. N., Roganov, G. N., & Georgieva, M. K. (2010). The thermodynamic properties of S-lactic acid. Russian Journal of Physical Chemistry A, 84, 1491-1497.
EngineerToolBox, [online] Available at: https://www.engineeringtoolbox.com, (2001) [Accessed March 2019].
Fan, H. Y., Fan, W. L., & Xu, Y. (2015). Characterization of key odorants in Chinese chixiang sroma-type liquor by gas chromatography-olfactometry, quantitative measurements, aroma recombination, and omission studies. Journal of Agricultural and Food Chemistry, 63, 3660-3668.
Fan, W. L., & Qian, M. C. (2005). Headspace solid phase microextraction and gas chromatography-olfactometry dilution analysis of young and aged Chinese "Yanghe Daqu" liquors. Journal of Agricultural and Food Chemistry, 53, 7931-7938.
Fan, W. L., & Qian, M. C. (2006a). Characterization of aroma compounds of Chinese "Wuliangye" and "Jiannanchun" liquors by aroma extract dilution analysis. Journal of Agricultural and Food Chemistry, 54, 2695-2704.
Fan, W. L., & Qian, M. C. (2006b). Identification of aroma compounds in Chinese 'Yanghe Daqu" liquor by normal phase chromatography fractionation followed by gas chromatography olfactometry. Flavour and Fragrance Journal, 21, 333-342.
Fan, W. L., Shen, H. Y., & Xu, Y. (2011). Quantification of volatile compounds in Chinese soy sauce aroma type liquor by stir bar sorptive extraction and gas chromatography-mass spectrometry. Journal of the Science of Food and Agriculture, 91, 1187-1198.
Fan, W. L., Xu, Y., & Zhang, Y. H. (2007). Characterization of pyrazines in some Chinese liquors and their approximate concentrations. Journal of Agricultural and Food Chemistry, 55, 9956-9962.
Fanaei, M. A., & Vaziri, B. M. (2009). Modeling of temperature gradients in packed-bed solid-state bioreactors. Chemical Engineering and Processing, 48, 446-451.
Federici, F., Fava, F., Kalogerakis, N., & Mantzavinos, D. (2009). Valorisation of agro-industrial by-products, effluents and waste: concept, opportunities and the case of
References
150
olive mill wastewaters. Journal of Chemical Technology and Biotechnology, 84, 895-900.
Frias, J. M., Foucat, L., Bimbenet, J. J., & Bonazzi, C. (2002). Modeling of moisture profiles in paddy rice during drying mapped with magnetic resonance imaging. Chemical Engineering Journal, 86, 173-178.
Furia, T. E. (1980). CRC handbook of food additives, Second edition: Taylor & Francis.
Gao, W. J., Fan, W. L., & Xu, Y. (2014). Characterization of the key odorants in light aroma type Chinese liquor by gas chromatography-olfactometry, quantitative measure-ments, aroma recombination, and omission studies. Journal of Agricultural and Food Chemistry, 62, 5796-5804.
Gao, Y., Wang, H., & Xu, Y. (2010). PCR-DGGE analysis of the bacterial community of Chinese liquor high and medium temperature Daqu. Microbiology, 37, 999-1004.
Gervais, P., & Molin, P. (2003). The role of water in solid-state fermentation. Biochemical Engineering Journal, 13, 85-101.
Gomes, F. C. O., Silva, C. L. C., Vianna, C. R., Lacerda, I. C. A., Borelli, B. M., Nunes, A. C., Franco, G. R., Mourao, M. M., & Rosa, C. A. (2010). Identification of lactic acid bacteria associated with traditional cachaça fermentations. Brazilian Journal of Microbiology, 41, 486-492.
Gou, M., Wang, H. Z., Yuan, H. W., Zhang, W. X., Tang, Y. Q., & Kida, K. (2015). Characterization of the microbial community in three types of fermentation starters used for Chinese liquor production. Journal of the Institute of Brewing, 121, 620-627.
Hageman, J. A., Engel, B., de Vos, R. C. H., Mumm, R., Hall, R. D., Jwanro, H., Crouzillat, D., Spadone, J. C., & van Eeuwijk, F. A. (2017). Robust and Confident Predictor Selection in Metabolomics. In S. Datta & B. J. A. Mertens (Eds.), Statistical analysis of proteomics, metabolomics, and lipidomics data using mass spectrometry (pp. 239-257). Cham: Springer International Publishing.
Hall, G. M., & Howe, J. (2012). Energy from waste and the food processing industry. Process Safety and Environmental Protection, 90, 203-212.
Han, B. Z., Rombouts, F. M., & Nout, M. J. R. (2001). A Chinese fermented soybean food. International Journal of Food Microbiology, 65, 1-10.
Han, K., & Levenspiel, O. (1988). Extended Monod kinetics for substrate, product, and cell inhibition. Biotechnology and Bioengineering, 32, 430-447.
Han, Q., Shi, J. L., Zhu, J., Lv, H. L., & Du, S. K. (2014). Enzymes extracted from apple peels have activity in reducing higher alcohols in Chinese liquors. Journal of Agricultural and Food Chemistry, 62, 9529-9538.
References
151
Hao, W., Chen, H. H., & Su, Z. H. (2005). China: alcohol today. Addiction, 100, 737-741.
He, Q., & Chen, H. Z. (2015). Comparative study on occurrence characteristics of matrix water in static and gas double-dynamic solid-state fermentations using low-field NMR and MRI. Analytical and Bioanalytical Chemistry, 407, 9115-9123.
Heins, A. L., Lencastre Fernandes, R., Gernaey, K. V., & Lantz, A. E. (2015). Experimental and in silico investigation of population heterogeneity in continuous Sachharomyces cerevisiae scale‐down fermentation in a two‐compartment setup. Journal of Chemical Technology & Biotechnology, 90, 324-340.
Hemdane, S., Jacobs, P. J., Bosmans, G. M., Verspreet, J., Delcour, J. A., & Courtin, C. M. (2017). Study of biopolymer mobility and water dynamics in wheat bran using time-domain H-1 NMR relaxometry. Food Chemistry, 236, 68-75.
Hills, B. P., Takacs, S. F., & Belton, P. S. (1990). A new interpretation of proton NMR relaxation time measurements of water in food. Food Chemistry, 37, 95-111.
Holker, U., & Lenz, J. (2005). Solid-state fermentation - are there any biotechnological advantages? Current Opinion in Microbiology, 8, 301-306.
Holzapfel, W. H. (2002). Appropriate starter culture technologies for small-scale fermentation in developing countries. International Journal of Food Microbiology, 75, 197-212.
Horita, M., Kitamoto, H., Kawaide, T., Tachibana, Y., & Shinozaki, Y. (2015). On-farm solid state simultaneous saccharification and fermentation of whole crop forage rice in wrapped round bale for ethanol production. Biotechnology for Biofuels, 8, 10.
Hu, X. L., Du, H., Ren, C., & Xu, Y. (2016). Ill uminating anaerobic microbial community and cooccurrence patterns across a quality gradient in Chinese liquor fermentation pit muds. Applied and Environmental Microbiology, 82, 2506-2515.
Hu, X. L., Du, H., & Xu, Y. (2015). Identification and quantification of the caproic acid-producing bacterium Clostridium kluyveri in the fermentation of pit mud used for Chinese strong-aroma type liquor production. International Journal of Food Microbiology, 214, 116-122.
Hu, X. L., Wang, H. Y., Wu, Q., & Xu, Y. (2014). Development, validation and application of specific primers for analyzing the clostridial diversity in dark fermentation pit mud by PCR-DGGE. Bioresource Technology, 163, 40-47.
Huang, Y. G., Wu, Q., & Xu, Y. (2014). Isolation and identification of a black Aspergillus strain and the effect of its novel protease on the aroma of Moutai-flavoured liquor. Journal of the Institute of Brewing, 120, 268-276.
Huang, Y. L., Sun, W., & Su, Q. Q. (2014). Environmental issues for the Chinese strong
References
152
aromatic liquor industry: an assessment for the brewing system. Environmental Modeling & Assessment, 19, 153-165.
Ivey, M., Massel, M., & Phister, T. G. (2013). Microbial interactions in food fermentations. In M. P. Doyle & T. R. Klaenhammer (Eds.), Annual Review of Food Science and Technology, Vol 4 (Vol. 4, pp. 141-162). Palo Alto: Annual Reviews.
James, G., Witten, D., Hastie, T., & Tibshirani, R. (2013). An Introduction to statistical learning. In Springer Texts in Statistics: Springer New York.
Janke, L., Weinrich, S., Leite, A. F., Strauber, H., Nikolausz, M., Nelles, M., & Stinner, W. (2019). Pre-treatment of filter cake for anaerobic digestion in sugarcane biorefineries: assessment of batch versus semi-continuous experiments. Renewable Energy, 143, 1416-1426.
Jin, G., Uhl, P., Zhu, Y., Wijffels, R. H., Xu, Y., & Rinzema, A. (2020). Modeling of industrial-scale anaerobic solid-state fermentation for Chinese liquor production. Chemical Engineering Journal, 394, 124942.
Jin, G. Y., Zhu, Y., Rinzema, A., Wijffels, R. H., Ge, X. Y., & Xu, Y. (2019). Water dynamics during solid-state fermentation by Aspergillus oryzae YH6. Bioresource Technology, 277, 68-76.
Jin, G. Y., Zhu, Y., & Xu, Y. (2017). Mystery behind Chinese liquor fermentation. Trends in Food Science & Technology, 63, 18-28.
Jurak, E. (2015). How mushrooms feed on compost: conversion of carbohydrates and linin in industrial wheat straw based compost enabling the growth of Agaricus bisporus. Wageningen University, Wageningen.
Kabanova, N., Stulova, I., & Vilu, R. (2012). Microcalorimetric study of the growth of bacterial colonies of Lactococcus lactis IL1403 in agar gels. Food Microbiology, 29, 67-79.
Kabo, G. J., Voitkevich, O. V., Blokhin, A. V., Kohut, S. V., Stepurko, E. N., & Paulechka, Y. U. (2013). Thermodynamic properties of starch and glucose. Journal of Chemical Thermodynamics, 59, 87-93.
Kanauchi, M. (2013). SAKE alcoholic beverage production in Japanese food industry. In M. Innocenzo (Ed.), Food Industry (pp. 39-63). Rijeka, Croatia: InTech.
Kennedy, M., & Krouse, D. (1999). Strategies for improving fermentation medium performance: a review. Journal of Industrial Microbiology & Biotechnology, 23, 456-475.
Kim, Y. S., Kim, M. C., Kwon, S. W., Kim, S. J., Park, I. C., Ka, J. O., & Weon, H. Y. (2011). Analyses of bacterial communities in Meju, a Korean traditional fermented soybean bricks, by cultivation-based and pyrosequencing methods. Journal of Microbiology,
References
153
49, 340-348.
Kirthiga, O. M., & Rajendran, L. (2014). Analytical expressions of the concentrations of substrate, biomass, and ethanol for solid-state fermentation in biofuel production. Energy Technology, 2, 574-578.
Kong, Y., Wu, Q., Zhang, Y., & Xu, Y. (2014). In situ analysis of metabolic characteristics reveals the key yeast in the spontaneous and solid-state fermentation process of Chinese light-style liquor. Applied and Environmental Microbiology, 80, 3667-3676.
Koutinas, A. A., Vlysidis, A., Pleissner, D., Kopsahelis, N., Garcia, I. L., Kookos, I. K., Papanikolaou, S., Kwan, T. H., & Lin, C. S. K. (2014). Valorization of industrial waste and by-product streams via fermentation for the production of chemicals and biopolymers. Chemical Society Reviews, 43, 2587-2627.
Kovrlija, R., & Rondeau-Mouro, C. (2017). Multi-scale NMR and MRI approaches to characterize starchy products. Food Chemistry, 236, 2-14.
Krishna, C. (2005). Solid-state fermentation systems - An overview. Critical Reviews in Biotechnology, 25, 1-30.
Labuza, T. P., & Hyman, C. R. (1998). Moisture migration and control in multi-domain foods. Trends in Food Science & Technology, 9, 47-55.
Laluce, C., Igbojionu, L. I., Silva, J. L., & Ribeiro, C. A. (2019). Statistical prediction of interactions between low concentrations of inhibitors on yeast cells responses added to the SD-medium at low pH values. Biotechnology for Biofuels, 12, 10.
Le, V. D., Zheng, X. W., Chen, J. Y., & Han, B. Z. (2012). Characterization of volatile compounds in Fen-Daqu - a traditional Chinese liquor fermentation starter. Journal of the Institute of Brewing, 118, 107-113.
Lenz, J., Hofer, M., Krasenbrink, J. B., & Holker, U. (2004). A survey of computational and physical methods applied to solid-state fermentation. Applied Microbiology and Biotechnology, 65, 9-17.
Li, G. H., Zhong, Q. D., Wang, D. B., Zhang, X. Y., Gao, H. B., & Shen, S. G. (2015). Determination and formation of Ethyl Carbamate in Chinese spirits. Food Control, 56, 169-176.
Li, H., Lian, B., Ding, Y. H., Nie, C. C., & Zhang, Q. M. (2014). Bacterial diversity in the central black component of Maotai Daqu and its flavor analysis. Annals of Microbiology, 64, 1659-1669.
Li, H. L., Huang, W. X., Shen, C. H., & Yi, B. (2012). Optimization of the distillation process of Chinese liquor by comprehensive experimental investigation. Food and Bioproducts Processing, 90, 392-398.

References
154
Li, H. L., Wang, C., Zhu, L., Huang, W. X., Yi, B., Zhang, L., Shen, C. H., Zhang, S. Y., & Xu, D. F. (2012). Variations of flavor substances in distillation process of Chinese Luzhou-flavor liquor. Journal of Food Process Engineering, 35, 314-334.
Li, J. J., Song, C. X., Hou, C. J., Huo, D. Q., Shen, C. H., Luo, X. G., Yang, M., & Fa, H. B. (2014). Development of a colorimetric sensor array for the discrimination of Chinese liquors based on selected volatile markers determined by GC-MS. Journal of Agricultural and Food Chemistry, 62, 10422-10430.
Li, P., Aflakpui, F. W. K., Yu, H., Luo, L. X., & Lin, W. T. (2015). Characterization of activity and microbial diversity of typical types of Daqu for traditional Chinese vinegar. Annals of Microbiology, 65, 2019-2027.
Li, S. Z., Li, G. M., Zhang, L., Zhou, Z. X., Han, B., Hou, W. H., Wang, J. B., & Li, T. C. (2013). A demonstration study of ethanol production from sweet sorghum stems with advanced solid state fermentation technology. Applied Energy, 102, 260-265.
Li, T., Tu, C. H., Rui, X., Gao, Y. W., Li, W., Wang, K., Xiao, Y., & Dong, M. S. (2015). Study of water dynamics in the soaking, steaming, and solid-state fermentation of glutinous rice by LF-NMR: a novel monitoring approach. Journal of Agricultural and Food Chemistry, 63, 3261-3270.
Li, X. R., Ma, E. B., Yan, L. Z., Meng, H., Du, X. W., Zhang, S. W., & Quan, Z. X. (2011). Bacterial and fungal diversity in the traditional Chinese liquor fermentation process. International Journal of Food Microbiology, 146, 31-37.
Li, Z., Wang, P. P., Huang, C. C., Shang, H., Pan, S. Y., & Li, X. J. (2014). Application of Vis/NIR spectroscopy for Chinese liquor discrimination. Food Analytical Methods, 7, 1337-1344.
Li, Z. F., Wang, N., Raghavan, G. S. V., & Vigneault, C. (2011). Volatiles evaluation and dielectric properties measurements of Chinese spirits for quality assessment. Food and Bioprocess Technology, 4, 247-253.
Liang, H. P., Li, W. F., Luo, Q. C., Liu, C. L., Wu, Z. Y., & Zhang, W. X. (2015). Analysis of the bacterial community in aged and aging pit mud of Chinese Luzhou-flavour liquor by combined PCR-DGGE and quantitative PCR assay. Journal of the Science of Food and Agriculture, 95, 2729-2735.
Libkind, D., Hittinger, C. T., Valerio, E., Goncalves, C., Dover, J., Johnston, M., Goncalves, P., & Sampaio, J. P. (2011). Microbe domestication and the identification of the wild genetic stock of lager-brewing yeast. Proceedings of the National Academy of Sciences of the United States of America, 108, 14539-14544.
Lide., D. R. (2005). CRC handbook of chemistry and physics, Internet version 2005 (Vol. 2261). Boca Raton, FL: CRC Press.

References
155
Lim, H. S., & Lee, K. G. (2011). Development and validation of analytical methods for ethyl carbamate in various fermented foods. Food Chemistry, 126, 1373-1379.
Liu, B. L., & Tzeng, Y. M. (1999). Water content and water activity for the production of cyclodepsipeptides in solid-state fermentation by Metarhizium anisopliae. Biotechnology Letters, 21, 657-661.
Liu, D. R., Zhu, Y., Beeftink, R., Ooijkaas, L., Rinzema, A., Chen, J., & Tramper, J. (2004). Chinese vinegar and its solid-state fermentation process. Food Reviews International, 20, 407-424.
Liu, H. L., & Sun, B. G. (2018). Effect of fermentation processing on the flavor of Baijiu. Journal of Agricultural and Food Chemistry, 66, 5425-5432.
Liu, X., Guo, K. L., & Zhang, H. X. (2012). Determination of microbial diversity in Daqu, a fermentation starter culture of Maotai liquor, using nested PCR-denaturing gradient gel electrophoresis. World Journal of Microbiology & Biotechnology, 28, 2375-2381.
Liu, Y. H., Wu, Z. Y., Yang, J., Yuan, Y. J., & Zhang, W. X. (2014). Step enzymatic hydrolysis of sodium hydroxide-pretreated Chinses liquor distillers' grains for ethanol production. Preparative Biochemistry & Biotechnology, 44, 464-479.
Lu, S., Ren, T. S., Gong, Y. S., & Horton, R. (2007). An improved model for predicting soil thermal conductivity from water content at room temperature. Soil Science Society of America Journal, 71, 8-14.
Lu, X., Wu, Q., Zhang, Y., & Xu, Y. (2015). Genomic and transcriptomic analyses of the Chinese Maotai-flavored liquor yeast MT1 revealed its unique multi-carbon co-utilization. BMC Genomics, 16, 1064.
Lu, Z. M., Wang, Z. M., Zhang, X. J., Mao, J., Shi, J. S., & Xu, Z. H. (2018). Microbial ecology of cereal vinegar fermentation: insights for driving the ecosystem function. Current Opinion in Biotechnology, 49, 88-93.
Lubertozzi, D., & Keasling, J. D. (2009). Developing Aspergillus as a host for heterologous expression. Biotechnology Advances, 27, 53-75.
Lund, S. T., & Bohlmann, J. (2006). The molecular basis for wine grape quality - A volatile subject. Science, 311, 804-805.
Luo, L. J., & Bao, S. Y. (2018). Knowledge-data-integrated sparse modeling for batch process monitoring. Chemical Engineering Science, 189, 221-232.
Luong, J. (1985). Kinetics of ethanol inhibition in alcohol fermentation. Biotechnology and Bioengineering, 27, 280-285.
Machida, M., Yamada, O., & Gomi, K. (2008). Genomics of Aspergillus oryzae: learning from

References
156
the history of Koji mold and exploration of its future. DNA Research, 15, 173-183.
Mansour, A. A., Arnaud, T., Lu-Chau, T. A., Fdz-Polanco, M., Moreira, M. T., & Rivero, J. A. C. (2016). Review of solid state fermentation for lignocellulolytic enzyme production: challenges for environmental applications. Reviews in Environmental Science and Bio-Technology, 15, 31-46.
Marcone, M. F., Wang, S., Albabish, W., Nie, S., Somnarain, D., & Hill, A. (2013). Diverse food-based applications of nuclear magnetic resonance (NMR) technology. Food Research International, 51, 729-747.
Marquez, J. M. A., Bohorquez, M. A. M., & Melgar, S. G. (2016). Ground thermal diffusivity calculation by direct soil temperature measurement: application to very low enthalpy geothermal energy systems. Sensors, 16, 13.
Marsh, A. J., Hill, C., Ross, R. P., & Cotter, P. D. (2014). Fermented beverages with health-promoting potential: Past and future perspectives. Trends in Food Science & Technology, 38, 113-124.
Mazaheri, D., & Shojaosadati, S. A. (2013). Mathematical models for microbial kinetics in solid-state fermentation: a Review. Iranian Journal of Biotechnology, 11, 156-167.
McGovern, P. E., Zhang, J. H., Tang, J. G., Zhang, Z. Q., Hall, G. R., Moreau, R. A., Nunez, A., Butrym, E. D., Richards, M. P., Wang, C. S., Cheng, G. S., Zhao, Z. J., & Wang, C. S. (2004). Fermented beverages of pre- and proto-historic China. Proceedings of the National Academy of Sciences of the United States of America, 101, 17593-17598.
McKinlay, J. B., Zeikus, J. G., & Vieille, C. (2005). Insights into Actinobacillus succinogenes fermentative metabolism in a chemically defined growth medium. Applied and Environmental Microbiology, 71, 6651-6656.
Mei, X. Y., Liu, R. H., Shen, F., Cao, W. X., Wu, H. J., & Liu, S. Y. (2011). Optimization of solid-state ethanol fermentation with the soluble carbohydrate in sweet sorghum stalk using response surface methodology. Journal of Biobased Materials and Bioenergy, 5, 532-538.
Meng, X., Wu, Q., Wang, L., Wang, D. Q., Chen, L. Q., & Xu, Y. (2015). Improving flavor metabolism of Saccharomyces cerevisiae by mixed culture with Bacillus licheniformis for Chinese Maotai-flavor liquor making. Journal of Industrial Microbiology & Biotechnology, 42, 1601-1608.
Mercier, P., Yerushalmi, L., Rouleau, D., & Dochain, D. (1992). Kinetics of lactic acid fermentation on glucose and corn by Lactobacillus amylophilus. Journal of Chemical Technology & Biotechnology, 55, 111-121.
Mitchell, D. A., & von Meien, O. F. (2000). Mathematical modeling as a tool to investigate the design and operation of the zymotis packed-bed bioreactor for solid-state

References
157
fermentation. Biotechnology and Bioengineering, 68, 127-135.
Mitchell, D. A., von Meien, O. F., Krieger, N., & Dalsenter, F. D. H. (2004). A review of recent developments in modeling of microbial growth kinetics and intraparticle phenomena in solid-state fermentation. Biochemical Engineering Journal, 17, 15-26.
Mo, H., Zhu, Y., & Chen, Z. (2008). Microbial fermented tea - a potential source of natural food preservatives. Trends in Food Science & Technology, 19, 124-130.
Mo, X. L., Xu, Y., & Fan, W. L. (2010). Characterization of aroma compounds in Chinese rice wine Qu by solvent-assisted flavor evaporation and headspace solid-phase microextraction. Journal of Agricultural and Food Chemistry, 58, 2462-2469.
Mumme, J., Linke, B., & Tolle, R. (2010). Novel upflow anaerobic solid-state (UASS) reactor. Bioresource Technology, 101, 592-599.
Nagel, F., Tramper, J., Bakker, M. S. N., & Rinzema, A. (2001a). Model for on-line moisture-content control during solid-state fermentation. Biotechnology and Bioengineering, 72, 231-243.
Nagel, F. J., Tramper, J., Bakker, M. S. N., & Rinzema, A. (2001a). Model for on-line moisture-content control during solid-state fermentation. Biotechnology and Bioengineering, 72, 231-243.
Nagel, F. J., Tramper, J., Bakker, M. S. N., & Rinzema, A. (2001b). Temperature control in a continuously mixed bioreactor for solid-state fermentation. Biotechnology and Bioengineering, 72, 219-230.
Nagel, F. J., Van As, H., Tramper, J., & Rinzema, A. (2002). Water and glucose gradients in the substrate measured with NMR imaging during solid-state fermentation with Aspergillus oryzae. Biotechnology and Bioengineering, 79, 653-663.
Nannyonga, S., Tchuenbou-Magaia, F., Goode, K., Fryer, P., & Robbins, P. (2018). Growth kinetics and modelling of Saccharomyces Cerevisiae (NCYC 431) during de-lignified waste banana fermentation and chemical characterization. Biochemical Engineering Journal, 137, 255-261.
Narendranath, N. V., Thomas, K. C., & Ingledew, W. M. (2001). Effects of acetic acid and lactic acid on the growth of Saccharomyces cerevisiae in a minimal medium. Journal of Industrial Microbiology & Biotechnology, 26, 171-177.
Ngadi, M. O., & Correia, L. R. (1992). Kinetics of solid-state ethanol fermentation from apple pomace. Journal of Food Engineering, 17, 97-116.
Noel, T. R., & Ring, S. G. (1992). A study of the heat capacity of starch/water mixtures. Carbohydrate Research, 227, 203-213.

References
158
Noorman, H. (2011). An industrial perspective on bioreactor scale-down: What we can learn from combined large-scale bioprocess and model fluid studies. Biotechnology Journal, 6, 934-943.
Nout, M. J. R., & Kiers, J. L. (2005). Tempe fermentation, innovation and functionality: update into the third millenium. Journal of Applied Microbiology, 98, 789-805.
Onken, U., Rareynies, J., & Gmehling, J. (1989). The Dortmund Data Bank: a computerized system for retrieval, correlation, and prediction of thermodynamic properties of mixtures. International Journal of Thermophysics, 10, 739-747.
Ooijkaas, L. P., Weber, F. J., Buitelaar, R. M., Tramper, J., & Rinzema, A. (2000). Defined media and inert supports: their potential as solid-state fermentation production systems. Trends in Biotechnology, 18, 356-360.
Pandey, A. (1992). Recent process developments in solid-state fermentation. Process Biochemistry, 27, 109-117.
Pandey, A. (2003). Solid-state fermentation. Biochemical Engineering Journal, 13, 81-84.
Perez, C. L., Casciatori, F. P., & Thomeo, J. C. (2019). Strategies for scaling-up packed-bed bioreactors for solid-state fermentation: The case of cellulolytic enzymes production by a thermophilic fungus. Chemical Engineering Journal, 361, 1142-1151.
Poisson, L., & Schieberle, P. (2008). Characterization of the key aroma compounds in an American Bourbon whisky by quantitative measurements, aroma recombination, and omission studies. Journal of Agricultural and Food Chemistry, 56, 5820-5826.
Poyet, S., & Charles, S. (2009). Temperature dependence of the sorption isotherms of cement-based materials: Heat of sorption and Clausius-Clapeyron formula. Cement and Concrete Research, 39, 1060-1067.
Qin, H., Huo, D. Q., Zhang, L., Yang, L. M., Zhang, S. Y., Yang, M., Shen, C. H., & Hou, C. J. (2012). Colorimetric artificial nose for identification of Chinese liquor with different geographic origins. Food Research International, 45, 45-51.
Quiroz, R. D., Roussos, S., Hernandez, D., Rodriguez, R., Castillo, F., & Aguilar, C. N. (2015). Challenges and opportunities of the Bio-pesticides production by solid-state fermentation: filamentous fungi as a model. Critical Reviews in Biotechnology, 35, 326-333.
Raghavarao, K., Ranganathan, T. V., & Karanth, N. G. (2003). Some engineering aspects of solid-state fermentation. Biochemical Engineering Journal, 13, 127-135.
Rahardjo, Y. S., Weber, F. J., le Comte, E. P., Tramper, J., & Rinzema, A. (2002). Contribution of aerial hyphae of Aspergillus oryzae to respiration in a model solid-state fermentation system. Biotechnology and Bioengineering, 78, 539-544.

References
159
Rahardjo, Y. S. P., Tramper, J., & Rinzema, A. (2006). Modeling conversion and transport phenomena in solid-state fermentation: A review and perspectives. Biotechnology Advances, 24, 161-179.
Ramesh, M. V., & Lonsane, B. K. (1990). Critical importance of moisture content of the medium in alpha-amylase production by Bacillus licheniformis M27 in a solid-state fermentation system. Applied Microbiology and Biotechnology, 33, 501-505.
Rodriguez-Fernandez, D. E., Rodriguez-Leon, J. A., de Carvalho, J. C., Karp, S. G., Sturm, W., Parada, J. L., & Soccol, C. R. (2012). Influence of airflow intensity on phytase production by solid-state fermentation. Bioresource Technology, 118, 603-606.
Roels, J. A. (1983). Energetics and kinetics in biotechnology (Vol. 330). Amsterdam: Elsevier Biomedical Press.
Settanni, L., & Moschetti, G. (2010). Non-starter lactic acid bacteria used to improve cheese quality and provide health benefits. Food Microbiology, 27, 691-697.
Shao, X. L., & Li, Y. F. (2013). Application of low-field NMR to analyze water characteristics and predict unfrozen water in blanched sweet corn. Food and Bioprocess Technology, 6, 1593-1599.
Shukla, S., Park, H. K., Lee, J. S., Kim, J. K., & Kim, M. (2014). Reduction of biogenic amines and aflatoxins in Doenjang samples fermented with various Meju as starter cultures. Food Control, 42, 181-187.
Shull, J. M., Watterson, J. J., & Kirleis, A. W. (1991). Proposed nomenclature for the alcohol-soluble proteins (kafirins) of Sorghum bicolor (L. Moench) based on molecular weight, solubility, and structure. Journal of Agricultural and Food Chemistry, 39, 83-87.
Sindhu, R., Gnansounou, E., Rebello, S., Binod, P., Varjani, S., Thakur, I. S., Nair, R. B., & Pandey, A. (2019). Conversion of food and kitchen waste to value-added products. Journal of Environmental Management, 241, 619-630.
Smid, E. J., & Lacroix, C. (2013). Microbe-microbe interactions in mixed culture food fermentations. Current Opinion in Biotechnology, 24, 148-154.
Smits, J. P., Rinzema, A., Tramper, J., vanSonsbeek, H. M., Hage, J. C., Kaynak, A., & Knol, W. (1998). The influence of temperature on kinetics in solid-state fermentation. Enzyme and Microbial Technology, 22, 50-57.
Soccol, C. R., Costa, E. S. F. d., Letti, L. A. J., Karp, S. G., Woiciechowski, A. L., & Vandenberghe, L. P. d. S. (2017). Recent developments and innovations in solid state fermentation. Biotechnology Research and Innovation, 1, 52-71.
Song, J. W., Luo, J., Ma, Z. B., Sun, Q., Wu, C. J., & Li, X. F. (2019). Quality and authenticity control of functional red yeast rice: a review. Molecules, 24, 25.

References
160
Song, Z. W., Du, H., Zhang, Y., & Xu, Y. (2017). Unraveling core functional microbiota in traditional Solid-state fermentation by high-throughput amplicons and metatranscriptomics Sequencing. Frontiers in Microbiology, 8, 14.
Straathof, A. J., Wahl, S. A., Benjamin, K. R., Takors, R., Wierckx, N., & Noorman, H. J. (2019). Grand research challenges for sustainable industrial biotechnology. Trends in Biotechnology, 37, 1042-1050.
Su, Y., Yang, L., Hui, L., Ge, Y. Y., Zhang, M. J., Xin, C. H., Ling, X., & Chi, C. (2015). Bacterial communities during the process of high-temperature Daqu production of roasted sesame-like flavour liquor. Journal of the Institute of Brewing, 121, 440-448.
Sui, W. J., & Chen, H. Z. (2016). Effects of water states on steam explosion of lignocellulosic biomass. Bioresource Technology, 199, 155-163.
Sun, S. Q., Li, C. W., Wei, J. P., Zhou, Q., & Noda, I. (2006). Discrimination of Chinese Sauce liquor using FT-IR and two-dimensional correlation IR spectroscopy. Journal of Molecular Structure, 799, 72-76.
Sun, W. N., Xiao, H. Z., Peng, Q., Zhang, Q. G., Li, X. X., & Han, Y. (2016). Analysis of bacterial diversity of Chinese Luzhou-flavor liquor brewed in different seasons by Illumina Miseq sequencing. Annals of Microbiology, 66, 1293-1301.
Szewczyk, K. W., & Myszka, L. (1994). The effect of temperature on the growth of Aspergillus niger in solid state fermentation. Bioprocess Engineering, 10, 123-126.
Takenaka, S., Nakabayashi, R., Ogawa, C., Kimura, Y., Yokota, S., & Doi, M. (2020). Characterization of surface Aspergillus community involved in traditional fermentation and ripening of katsuobushi. International Journal of Food Microbiology, 327, 9.
Tamang, J. P., Cotter, P. D., Endo, A., Han, N. S., Kort, R., Liu, S. Q., Mayo, B., Westerik, N., & Hutkins, R. (2020). Fermented foods in a global age: East meets West. Comprehensive Reviews in Food Science and Food Safety, 19, 184-217.
Tan, L., Sun, Z. Y., Zhang, W. X., Tang, Y. Q., Morimura, S., & Kida, K. (2014). Production of bio-fuel ethanol from distilled grain waste eluted from Chinese spirit making process. Bioprocess and Biosystems Engineering, 37, 2031-2038.
Tao, Y., Li, J. B., Rui, J. P., Xu, Z. C., Zhou, Y., Hu, X. H., Wang, X., Liu, M. H., Li, D. P., & Li, X. Z. (2014). Prokaryotic communities in pit mud from different-aged cellars used for the production of Chinese strong-flavored liquor. Applied and Environmental Microbiology, 80, 2254-2260.
Tavman, S., & Tavman, I. H. (1998). Measurement of effective thermal conductivity of wheat as a function of moisture content. International Communications in Heat and Mass Transfer, 25, 733-741.
References
161
Taylor, J. R. N., & Duodu, K. G. (2019). Traditional sorghum and millet food and beverage products and their technologies. In J. R. N. Taylor & K. G. Duodu (Eds.), Sorghum and Millets (Second Edition) (pp. 259-292): AACC International Press.
te Biesebeke, R., Ruijter, G., Rahardjo, Y. S. P., Hoogschagen, M. J., Heerikhuisen, M., Levin, A., van Driel, K. G. A., Schutyser, M. A. I., Dijksterhuis, J., Zhu, Y., Weber, F. J., de Vos, W. M., van den Hondel, K., Rinzema, A., & Punt, P. J. (2002). Aspergillus oryzae in solid-state and submerged fermentations - Progress report on a multi-disciplinary project. FEMS Yeast Research, 2, 245-248.
Thanh, V. N., Mai, L. T., & Tuan, D. A. (2008). Microbial diversity of traditional Vietnamese alcohol fermentation starters (banh men) as determined by PCR-mediated DGGE. International Journal of Food Microbiology, 128, 268-273.
Thomas, L., Larroche, C., & Pandey, A. (2013). Current developments in solid-state fermentation. Biochemical Engineering Journal, 81, 146-161.
Tramper, J., & Zhu, Y. (2011). Modern biotechnology: Panacea or new Pandora's box? Springer.
Uselmann, V., & Schieberle, P. (2015). Decoding the combinatorial aroma code of a commercial cognac by application of the sensomics concept and first insights into differences from a German brandy. Journal of Agricultural and Food Chemistry, 63, 1948-1956.
Vargas-Moreno, J. M., Callejon-Ferre, A. J., Perez-Alonso, J., & Velazquez-Marti, B. (2012). A review of the mathematical models for predicting the heating value of biomass materials. Renewable & Sustainable Energy Reviews, 16, 3065-3083.
von Meien, O. F., & Mitchell, D. A. (2002). A two-phase model for water and heat transfer within an intermittently-mixed solid-state fermentation bioreactor with forced aeration. Biotechnology and Bioengineering, 79, 416-428.
Wang, B. W., Wu, Q., Xu, Y., & Sun, B. G. (2020). Synergistic effect of multiple saccharifying enzymes on alcoholic fermentation for Chinese Baijiu production. Applied and Environmental Microbiology, 86, e00013-00020.
Wang, B. W., Wu, Q., Xu, Y., & Sun, B. G. (2018). Specific volumetric weight-driven shift in microbiota compositions with saccharifying activity change in starter for Chinese Baijiu fermentation. Frontiers in Microbiology, 9, 11.
Wang, C. L., Shi, D. J., & Gong, G. L. (2008). Microorganisms in Daqu: a starter culture of Chinese Maotai-flavor liquor. World Journal of Microbiology & Biotechnology, 24, 2183-2190.
Wang, E. Q., Li, S. Z., Tao, L., Geng, X., & Li, T. C. (2010). Modeling of rotating drum bioreactor for anaerobic solid-state fermentation. Applied Energy, 87, 2839-2845.

References
162
Wang, G., Haringa, C., Noorman, H., Chu, J., & Zhuang, Y. (2020). Developing a computational framework to advance bioprocess scale-up. Trends in Biotechnology.
Wang, H. Y., Gao, Y. B., Fan, Q. W., & Xu, Y. (2011). Characterization and comparison of microbial community of different typical Chinese liquor Daqus by PCR-DGGE. Letters in Applied Microbiology, 53, 134-140.
Wang, H. Y., & Xu, Y. (2015). Effect of temperature on microbial composition of starter culture for Chinese light aroma style liquor fermentation. Letters in Applied Microbiology, 60, 85-91.
Wang, H. Y., Zhang, X. J., Zhao, L. P., & Xu, Y. (2008). Analysis and comparison of the bacterial community in fermented grains during the fermentation for two different styles of Chinese liquor. Journal of Industrial Microbiology & Biotechnology, 35, 603-609.
Wang, K., Rippon, L., Chen, J. H., Song, Z. H., & Gopaluni, R. B. (2019). Data-driven dynamic modeling and online monitoring for multiphase and multimode batch processes with uneven batch durations. Industrial & Engineering Chemistry Research, 58, 13628-13641.
Wang, L., Sharifzadeh, M., Templer, R., & Murphy, R. J. (2012). Technology performance and economic feasibility of bioethanol production from various waste papers. Energy & Environmental Science, 5, 5717-5730.
Wang, P. P., Li, Z., Qi, T. T., Li, X. J., & Pan, S. Y. (2015). Development of a method for identification and accurate quantitation of aroma compounds in Chinese Daohuaxiang liquors based on SPME using a sol-gel fibre. Food Chemistry, 169, 230-240.
Wang, S. L., Wu, Q., Nie, Y., Wu, J. F., & Xu, Y. (2019). Construction of synthetic microbiota for reproducible flavor metabolism in Chinese light aroma type liquor produced by solid-state fermentation. Applied and Environmental Microbiology, AEM.03090-03018.
Wang, X. D., Ban, S. D., & Qiu, S. Y. (2018). Analysis of the mould microbiome and exogenous enzyme production in Moutai-flavor Daqu. Journal of the Institute of Brewing, 124, 91-99.
Wang, X. S., Du, H., Zhang, Y., & Xu, Y. (2018). Environmental microbiota drives microbial succession and metabolic profiles during Chinese liquor fermentation. Applied and Environmental Microbiology, 84.
Wang, X. X., Fan, W. L., & Xu, Y. (2014). Comparison on aroma compounds in Chinese soy sauce and strong aroma type liquors by gas chromatography-olfactometry, chemical quantitative and odor activity values analysis. European Food Research and Technology, 239, 813-825.
References
163
Watanabe, H., Fukuoka, M., Tomiya, A., & Mihori, T. (2001). A new non-Fickian diffusion model for water migration in starchy food during cooking. Journal of Food Engineering, 49, 1-6.
Weber, F. J., Oostra, J., Tramper, J., & Rinzema, A. (2002). Validation of a model for process development and scale-up of packed-bed solid-state Bioreactors. Biotechnology and Bioengineering, 77, 381-393.
Wolfe, B. E., & Dutton, R. J. (2015). Fermented foods as experimentally tractable microbial ecosystems. Cell, 161, 49-55.
Wu, C. Z., Zhang, F., Li, L. J., Jiang, Z. D., Ni, H., & Xiao, A. F. (2018). Novel optimization strategy for tannase production through a modified solid-state fermentation system. Biotechnology for Biofuels, 11, 15.
Wu, J. F., & Xu, Y. (2013). Comparison of pyrazine compounds in seven Chinese liquors using headspace solid-phase micro-extraction and GC-nitrogen phosphourus detection. Food Science and Biotechnology, 22, 1253-1258.
Wu, P. G., Pan, X. D., Wang, L. Y., Shen, X. H., & Yang, D. J. (2012). A survey of ethyl carbamate in fermented foods and beverages from Zhejiang, China. Food Control, 23, 286-288.
Wu, Q., Chen, L. Q., & Xu, Y. (2013). Yeast community associated with the solid state fermentation of traditional Chinese Maotai-flavor liquor. International Journal of Food Microbiology, 166, 323-330.
Wu, Q., Kong, Y., & Xu, Y. (2016). Flavor profile of Chinese liquor is altered by interactions of intrinsic and extrinsic microbes. Applied and Environmental Microbiology, 82, 422-430.
Wu, Q., Ling, J., & Xu, Y. (2014). Starter culture selection for making Chinese sesame-flavored liquor based on microbial metabolic activity in mixed-culture fermentation. Applied and Environmental Microbiology, 80, 4450-4459.
Wu, Q., Peng, S., Yu, Y., Li, Y., & Xu, Y. (2013). Genome sequence of Bacillus licheniformis CGMCC3963, a stress-resistant strain isolated in a Chinese traditional solid-state liquor-making process. Genome Announcements, 1.
Wu, Q., & Xu, Y. (2012). Transcriptome profiling of heat-resistant strain Bacillus licheniformis CGMCC3962 producing Maotai flavor. Journal of Agricultural and Food Chemistry, 60, 2033-2038.
Wu, Q., Zhang, R., Peng, S. Q., & Xu, Y. (2015). Transcriptional characteristics associated with lichenysin biosynthesis in Bacillus licheniformis from Chinese Maotai-flavor liquor making. Journal of Agricultural and Food Chemistry, 63, 888-893.
Wu, Q., Zhu, W. A., Wang, W., & Xu, Y. (2015). Effect of yeast species on the terpenoids
References
164
profile of Chinese light-style liquor. Food Chemistry, 168, 390-395.
Wu, X. H., Zheng, X. W., Han, B. Z., Vervoort, J., & Nout, M. J. R. (2009). Characterization of Chinese Liquor starter, "Daqu", by flavor type with H-1 NMR-based nontargeted analysis. Journal of Agricultural and Food Chemistry, 57, 11354-11359.
Xia, Q., Yuan, H. W., Wu, C. D., Zheng, J., Zhang, S. Y., Shen, C. H., Yi, B., & Zhou, R. Q. (2014). An improved and validated sample cleanup method for analysis of Ethyl Carbamate in Chinese liquor. Journal of Food Science, 79, T1854-T1860.
Xiang, W. L., Li, K., Liu, S., Xing, Y. G., Li, M. Y., & Che, Z. M. (2013). Microbial succession in the traditional Chinese Luzhou-flavor liquor fermentation process as evaluated by SSU rRNA profiles. World Journal of Microbiology & Biotechnology, 29, 559-567.
Xu, H. G., Xu, X., Tao, Y. D., Yuan, F., & Gao, Y. X. (2015). Optimization by response surface methodology of supercritical carbon dioxide extraction of flavour compounds from Chinese liquor vinasse. Flavour and Fragrance Journal, 30, 275-281.
Xu, Y., Wang, D., Fan, W. L., Mu, X. Q., & Chen, J. (2010). Traditional Chinese biotechnology. In G. T. Tsao, P. Ouyang & J. Chen (Eds.), Biotechnology in China II: Chemicals, Energy and Environment (Vol. 122, pp. 189-233). Berlin: Springer.
Xu, Y., Zhi, Y., Wu, Q., Du, R. B., & Xu, Y. (2017). Zygosaccharomyces bailii is a potential producer of various flavor compounds in Chinese Maotai-Flavor liquor fermentation. Frontiers in Microbiology, 8, 9.
Ya, Z., He, K., Lu, Z. M., Yi, B., Hou, C. J., Shan, S., Huo, D. Q., & Luo, X. G. (2012). Colorimetric artificial nose for Baijiu identification. Flavour and Fragrance Journal, 27, 165-170.
Yang, F., Chen, L. Q., Liu, Y. F., Li, J. H., Wang, L., & Chen, J. (2019). Identification of microorganisms producing lactic acid during solid-state fermentation of Maotai flavour liquor. Journal of the Institute of Brewing, 125, 171-177.
Yang, X. L., Li, M., Liu, H. H., Ren, L. T., & Xie, G. H. (2018). Technical feasibility and comprehensive sustainability assessment of sweet sorghum for bioethanol production in China. Sustainability, 10, 18.
Yao, F., Yi, B., Shen, C. H., Tao, F., Liu, Y. M., Lin, Z. X., & Xu, P. (2015). Chemical analysis of the Chinese liquor Luzhoulaojiao by comprehensive two-dimensional gas chromatography/time-of-flight mass spectrometry. Scientific Reports, 5, 6.
Ye, G. B., Luo, H. B., Ren, Z. Q., Ahmad, M. S., Liu, C. G., Tawab, A., Al-Ghafari, A. B., Omar, U., Gull, M., & Mehmood, M. A. (2018). Evaluating the bioenergy potential of Chinese liquor-industry waste through pyrolysis, thermogravimetric, kinetics and evolved gas analyses. Energy Conversion and Management, 163, 13-21.
Yue, Y. Y., Zhang, W. X., Yang, R., Zhang, Q. S., & Liu, Z. H. (2007). Design and operation of an artificial pit for the fermentation of Chinese liquor. Journal of the Institute of
References
165
Brewing, 113, 374-380.
Zhang, R., Wu, Q., & Xu, Y. (2014). Lichenysin, a cyclooctapeptide occurring in Chinese liquor Jiannanchun reduced the headspace concentration of phenolic off-flavors via hydrogen-bond interactions. Journal of Agricultural and Food Chemistry, 62, 8302-8307.
Zhang, R., Wu, Q., Xu, Y., & Qian, M. C. (2014). Isolation, identification, and quantification of Lichenysin, a novel nonvolatile compound in Chinese distilled spirits. Journal of Food Science, 79, C1907-C1915.
Zhang, W. X., Qiao, Z. W., Shigematsu, T., Tang, Y. Q., Hu, C., Morimura, S., & Kida, K. (2005). Analysis of the bacterial community in Zaopei during production of Chinese Luzhou-flavor liquor. Journal of the Institute of Brewing, 111, 215-222.
Zhang, W. X., Qiao, Z. W., Tang, Y. Q., Hu, C., Sun, Q., Morimura, S., & Kida, K. (2007). Analysis of the fungal community in Zaopei during the production of Chinese Luzhou-flavour liquor. Journal of the Institute of Brewing, 113, 21-27.
Zhang, W. X., Wu, Z. Y., Zhang, Q. S., Wang, R., & Li, H. (2009). Combination of newly developed high quality Fuqu with traditional Daqu for Luzhou-flavor liquor brewing. World Journal of Microbiology & Biotechnology, 25, 1721-1726.
Zhao, Q. S., Yang, J. G., Zhang, K. Z., Wang, M. Y., Zhao, X. X., Su, C., & Cao, X. Z. (2020). Lactic acid bacteria in the brewing of traditional Daqu liquor. Journal of the Institute of Brewing, 126, 14-23.
Zhao, X. R., Du, G. C., Zou, H. J., Fu, J. W., Zhou, J. W., & Chen, J. (2013). Progress in preventing the accumulation of ethyl carbamate in alcoholic beverages. Trends in Food Science & Technology, 32, 97-107.
Zhen, C., Zhou, Y. M., Zhang, N., Wang, J. Y., Xiong, C. Q., Chen, S. M., & Nie, Z. X. (2013). Differentiation of Chinese liquors by using ambient glow discharge ionization mass spectrometry. Analyst, 138, 3830-3835.
Zheng, X. W., Tabrizi, M. R., Nout, M. J. R., & Han, B. Z. (2011). Daqu - a traditional Chinese liquor fermentation starter. Journal of the Institute of Brewing, 117, 82-90.
Zheng, X. W., Yan, Z., Han, B. Z., Zwietering, M. H., Samson, R. A., Boekhout, T., & Nout, M. J. R. (2012). Complex microbiota of a Chinese "Fen" liquor fermentation starter (Fen-Daqu), revealed by culture-dependent and culture-independent methods. Food Microbiology, 31, 293-300.
Zheng, X. W., Yan, Z., Nout, M. J. R., Boekhout, T., Han, B. Z., Zwietering, M. H., & Smid, E. J. (2015). Characterization of the microbial community in different types of Daqu samples as revealed by 16S rRNA and 26S rRNA gene clone libraries. World Journal of Microbiology & Biotechnology, 31, 199-208.
References
166
Zheng, X. W., Yan, Z., Nout, M. J. R., Smid, E. J., Zwietering, M. H., Boekhout, T., Han, J. S., & Han, B. Z. (2014). Microbiota dynamics related to environmental conditions during the fermentative production of Fen-Daqu, a Chinese industrial fermentation starter. International journal of food microbiology, 182, 57-62.
Zhi, Y., Wu, Q., Du, H., & Xu, Y. (2016). Biocontrol of geosmin-producing Streptomyces spp. by two Bacillus strains from Chinese liquor. International Journal of Food Microbiology, 231, 1-9.
Zhi, Y., Wu, Q., & Xu, Y. (2017). Production of surfactin from waste distillers' grains by co-culture fermentation of two Bacillus amyloliquefaciens strains. Bioresource Technology, 235, 96-103.
Zhou, Q., Zhang, S. P., Li, Y. X., Xie, C. S., Li, H. Y., & Ding, X. H. (2011). A Chinese liquor classification method based on liquid evaporation with one unmodulated metal oxide gas sensor. Sensors and Actuators B-Chemical, 160, 483-489.
Zhou, Z. H., Zhang, Y. J., Xu, M., & Yang, C. R. (2005). Puerins A and B, two new 8-C substituted flavan-3-ols from Pu-er tea. Journal of Agricultural and Food Chemistry, 53, 8614-8617.
Zhu, D. W., Wu, Z. Y., Luo, A. M., & Gao, H. (2015). Characterization and detection of toxoflavin-producing Burkholderia in rice straws and Daqu for Chinese Maotai-flavour liquor brewing. Journal of the Institute of Brewing, 121, 290-294.
Zhu, M., Fan, W., Xu, Y., & Zhou, Q. (2016). 1,1-Diethoxymethane and methanethiol as age markers in Chinese roasted-sesame-like aroma and flavour type liquor. European Food Research and Technology, 1-8.
Zhu, S. K., Lu, X., Ji, K. H., Guo, K. F., Li, Y. L., Wu, C. Y., & Xu, G. W. (2007). Characterization of flavor compounds in Chinese liquor Moutai by comprehensive two-dimensional gas chromatography/time-of-flight mass spectrometry. Analytica Chimica Acta, 597, 340-348.
Zhu, W., Ren, C., Nie, Y., & Xu, Y. (2016). Quantification of ochratoxin A in Chinese liquors by a new solid-phase extraction clean-up combined with HPLC-FLD method. Food Control, 64, 37-44.
Zhu, Y., & Tramper, J. (2013). Koji - where East meets West in fermentation. Biotechnology Advances, 31, 1448-1457.
Zieringer, J., & Takors, R. (2018). In silico prediction of large-scale microbial production performance: constraints for getting proper data-driven models. Computational and structural biotechnology journal, 16, 246-256.

167
168
169
Summary
Summary
170
Summary Solid-state fermentation is defined as the growth of microorganisms on moist solid substrate without free-flowing water. Chinese liquor (Baijiu in Chinese) production is a typical example of traditional solid-state food fermentation. Traditional solid-state fermentation remains so far semi controlled and empirical. There is lack of understanding of the fermentation process, especially regarding process engineering. Basically, the fermentation is a spontaneous process with a mixture of microbes including yeasts, bacteria and molds. These microbes can influence each other during the fermentation to affect the quality of the final product: Baijiu. Although, the use of this mixed culture results in a product with rich flavor, it also makes the fermentation system very complex. In order to better control the quality of the final product the process should be better understood. In Chapter 1 we propose to study the process in a quantitative way to understand the basic engineering principles of the traditional solid-state fermentation and with the aim to improve it.
In Chapter 2 we introduce Chinese liquor and its traditional fermentation process (both aerobic and anaerobic). We explain how the rich flavors (commonly accepted criteria for product quality) are developed during production and address challenges due to lack of process control in quality, safety and productivity. In addition to study of identifying flavors and microbial process, a better understanding and control of the solid-state fermentation process will help control an optimized environment for liquor flavor formation.
Chinese liquor fermentation starts with starter (Qu) preparation. In practice of starter preparation, water content is the most important control parameter. High temperature caused by microbial growth can lead to rapid water loss and the water dynamics is thus an important variable affecting the

Summary
171
quality of starter preparation. In Chapter 3, we use NMR to determine the water dynamics during Qu starter fermentation process at lab scale with online temperature, CO2 and O2 monitoring. The overall water change, different state water migration and internal water distribution transfer phenomenon are discussed. The growth of microbes can significantly accelerate the water loss and decrease the water activity. This study provides a reliable method to detect the water dynamics, but the relations of water dynamics to fermentation performance still need more in-depth studies.
In Chapter 4 we present a simple mathematical model based on Han-Levenspiel equation for product inhibition, with parameters derived from measured data. The models accurately predict the concentrations of starch and dry matter. A model with radial conduction into a small soil volume around the fermenter and consecutive vertical conduction into the underlying soil accurately predicts the pit temperature in the heating and cooling phases. The model predicts that overheating will occur not only in larger fermenters, but also in the 0.44-m3 fermenters when the soil temperature is high in summer. However, the model in Chapter 4 is still at its pioneering stage, and various improvements are needed to develop a more robust model.
To better understand and identify the influential variables during Chinese liquor solid-state fermentation process, we present statistical models based on multi linear regression and classifier models in Chapter 5. The statistical analysis includes variables like starting concentrations of starch, water and acids, starting month, substrate temperature profiles and air temperatures. Models based on starting concentrations do not give reliable predictions of the liquor yield. A model based on the temperature profile gives a better prediction, but that is probably because the substrate temperature is a consequence of the ethanol production. The starting month is the most important variable but not because of the ambient temperature. The reason could be the inhibition from lactic acid bacteria between April and December.

Summary
172
Chapter 6 is the general discussion of the thesis, demonstrating that both mechanistic modeling and statistical modeling are useful tools to understand the engineering principles for traditional solid-state fermentation. However, challenges still exist with respect to detection methods, modeling and application. We suggest future research needs including developing new measurement methods, and covering more parameters in the statistical analysis to provide more detailed data. We also propose engineering principle-based scale-down and scale-up approaches based on both mechanistic models and data-driven models. A complete design of the whole process including both aerobic and anaerobic fermentation, and distillation, downstream process will enable a better production process.

173
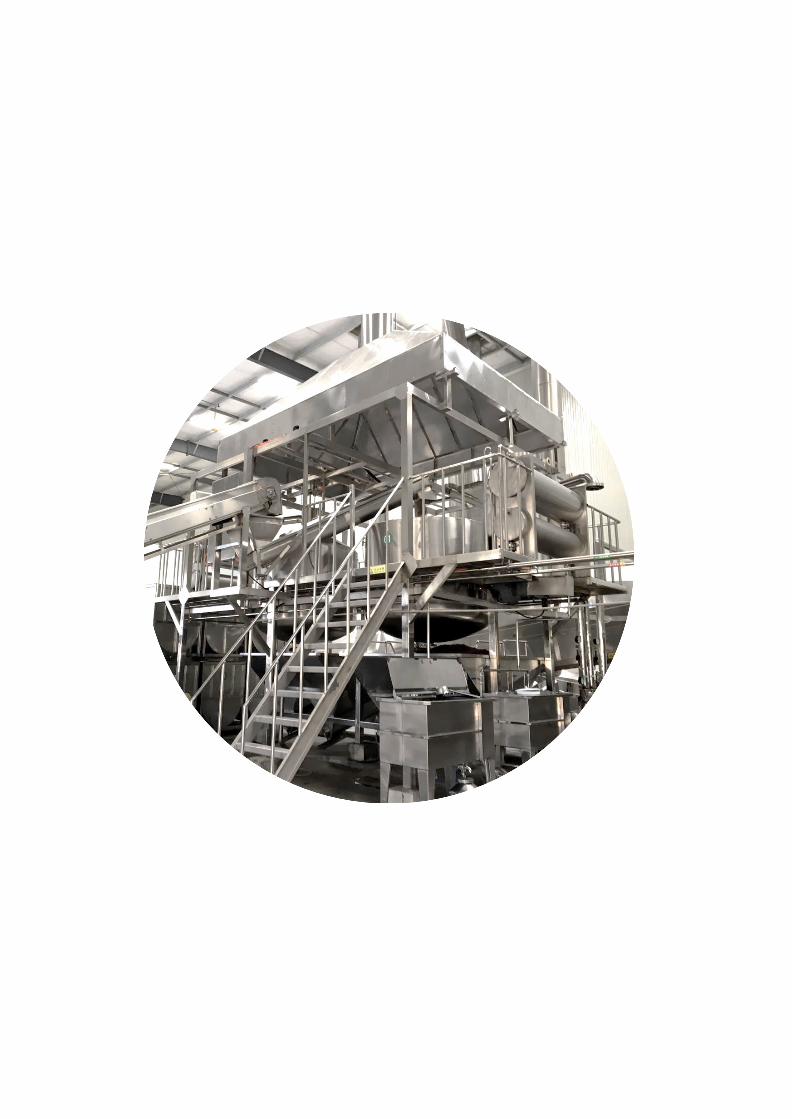
174

175
Acknowledgement

Acknowledgement
176
Acknowledgement We finally reached the most exciting part of this thesis! I would like to thank all the people who have worked with me and supported me during these years.
First, I would like to thank my promoters and supervisors for giving me the opportunity to work on this PhD project. Thank you all for your professional skills and patience, I learnt a lot from you! It is a great honor to be able to receive your guidance and help from the beginning of the project to the current state.
Yan, I still remember we met first in a beautiful spring of 2013 at Jiangnan University. We had a short discussion, and it lighted the interest of my current study. During the master study, you gave me a lot of chance and freedom to discover the research topic and convinced me to continue the engineering aspects study on traditional fermentations for a PhD project. Of course, we faced various challenges in the study, and you can always encourage me with your professional and optimistic attitude. Thank you for the care in my daily life. I learnt a lot from you about academic research, but more importantly how to think independently and work hard.
Rene, thank you for giving me the chance to study here in Wageningen and to learn from your immense experience and knowledge. I am grateful for your trust, patience and all the freedom you gave me while supervising my PhD. You can always give me great comments about the whole project and used all the sources you can find to help me. Thank you also for the relaxed atmosphere on our meetings and your direct, friendly and personal approach. Echt heel erg bedankt!

Acknowledgement
177
Arjen, you were my daily supervisor and a close friend at BPE. I learnt a lot from your charming mathematics. Your precise calculations and patience can always correct my faults. Despite your busy agenda, you always found some time for me when I had difficulties or needed your help. I still remember you called me when it was a little bit long time no see. Your optimistic, frank and direct character not only taught me to be a good scientist, but also to be a good man. Tige tank!
Yang, we first met in Yan’s office five year ago and we had a very pleasant discussion about my PhD project. Your kindness and wisdom encouraged me to continue my work and I could not study in Wageningen without your help. Starting with your writing course, simple and clear is not only my philosophy for paper writing, but also for daily life. You unreservedly helped me step by step to prepare the study and paper with enormous details. You are also the supervisor of my daily life and thank you for taking care of me. I had the best food from your family.
I would also like to thank Jos and my students Philipp and Sjoerd. You contributed a lot to the project with your skills and great ideas. It was my pleasure to work with you.
Second, my dear colleagues from BPE, thank you a lot for being with me these years. Jort, Kylie and Calvin, I am lucky to be your officemate and took pleasant no taboo discussion with you. My Chinese colleagues in BPE, Fengzheng and Chunzhe, thank you for sharing the sunshine, wind and rain on our way to “Double E”. Ana, Pauline, Camilo, Anna, Narcis, Renske, Barbara, Christian, Enrico, Pieter, Sabine, Iago, Iulian, Fabian, Robin and all the rest BPE colleagues, thank you for all the parties and BBQs. All the staff and technicians, thank you for your technical help!

Acknowledgement
178
I would also like to thank my colleagues and teachers from Jiangnan University. Shilei, Bowen, Yue, Jun, Wenbin, Youfeng, Yaohui, Lu, Huarong, Yalin, and Xinye, we spent a wonderful time together. I hope we can meet soon. Hai, Shuang, Cong, Qun, Ke, Yehui, Lijie, Cheng, Wenlai, Yao, Xiaowei, Rongzhen, Dong and Xiaoqing, thank you for your kind support during my study in the Lab of Brewing Microbiology and Applied Enzymology. Xiangyang, thank you for your supervision and help at the very beginning.
Big hug to my dearest friends, thank you a lot for making the everyday life colorful! Weiping and Bin, you are my enlightenment of my scientific study. We finished our first project together ten years ago during college time and I still benefit from it. I can still remember what we have boasted at that moment. Xiaojie and Bo, we have a lot in common and many differences, and we care about each other. Physical distance has not diminished our friendship. You are always listening, advising and supporting me.
Jort, we are the “naughty boys”. If we didn’t finish the task on time, it’s definitely because we talk too much. Thank you for letting me know more about Dutch culture and teaching me some Dutch. Thank you very much for being my paranymph and sharing the defense together. My other paranymph, Ruoxuan, I can still remember you invited me for the party and diner of the spring festival when I first came here in Wageningen. That was a tough and cold moment for me, but you warmed me up. Thank you for your trust. Qi, thank you for spending the festivals and holidays together with Xumin and Yidong. Special thanks to Min, we experienced the most wonderful time together in our life.
I would like to thank my roommates, Hao and Benjamin. Thank you guys for making my days enjoyable.

Acknowledgement
179
朋友们:能同途偶遇在这星球上, 燃亮飘渺人生, 我多么够运。
爸爸妈妈弟弟妹妹们,感谢你们一直以来的关心与支持,我爱你们!
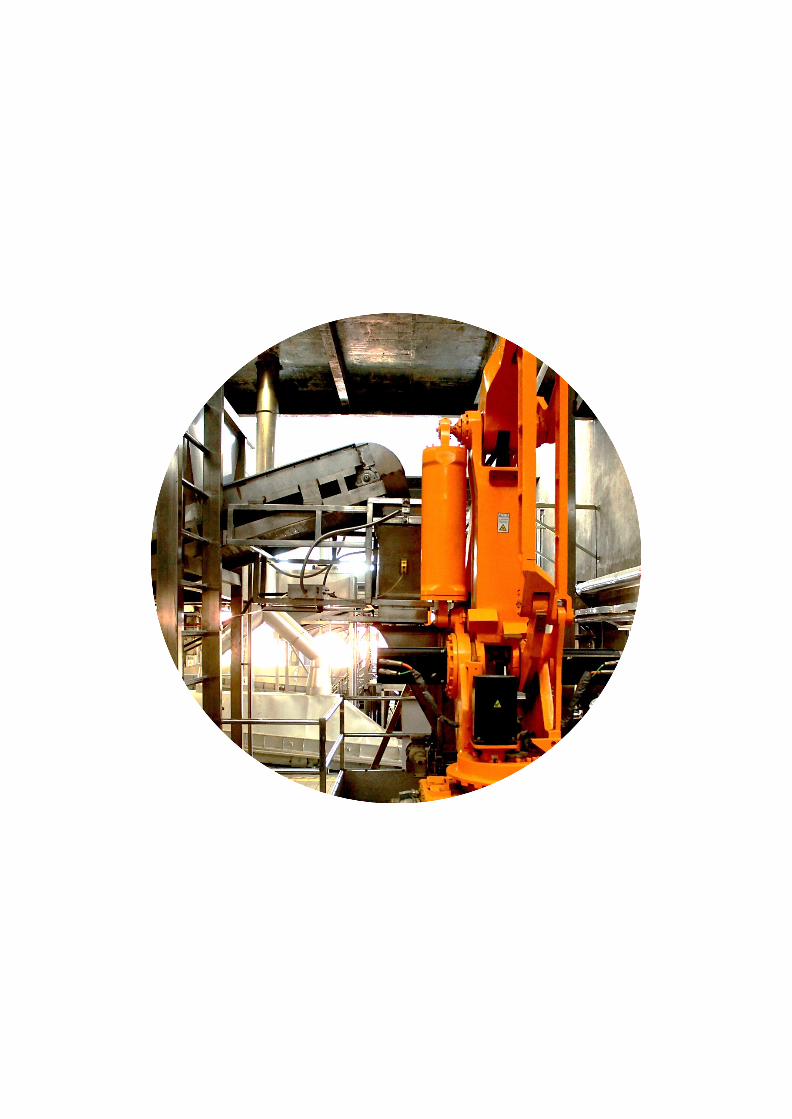
180

181
About the author

182

About the author
183
Curriculum Vitae Guangyuan Jin was born on January 10, 1990 in
Gansu Province, China, where he grew up and
attended schools before his university studies.
In 2008, he started his bachelor’s study majoring
in Biotechnology at Hefei University of
Technology in Hefei, China. He worked during his
bachelor thesis at the laboratory of microbiology on fermentation
optimization of lipid production from Lachnum mutants. He obtained his
bachelor’s and started his Master program in Fermentation Engineering in
2013 at Jiangnan University in Wuxi, China. His master program focused on
the dynamics of solid-state fermentation during solid starter preparation.
Two years later, he attended a Master-PhD joint program in the Laboratory of
Brewing Microbiology and Applied Enzymology of Jiangnan University. In
2017 he was financially supported by the China Scholarship Council to
continue his PhD study at Wageningen University & Research, Wageningen,
the Netherlands. His PhD research program was about engineering aspect
study on traditional solid-state fermentation, aiming to quantitively
understand both aerobic and anaerobic fermentation processes. The results
of his PhD research are described in this thesis.
About the author
184
List of publications
Jin, G., Boeschoten, S., Hageman, J., Zhu, Y., Wijffels, R. H., Xu, Y., & Rinzema,
A. (2020). Identifying influential variables during Chinese liquor fermentation
by statistical modelling. Submitted for publication.
Jin, G., Zhu, Y., Wijffels, R. H., Xu, Y., & Rinzema, A. (2020). Engineering aspects
of traditional solid-state fermentation. Submitted for publication.
Jin, G., Uhl, P., Zhu, Y., Wijffels, R. H., Xu, Y., & Rinzema, A. (2020). Modeling
of industrial-scale anaerobic solid-state fermentation for Chinese liquor
production. Chemical Engineering Journal, 394, 124942.
Jin, G., Zhu, Y., Rinzema, A., Wijffels, R. H., Ge, X., & Xu, Y. (2019). Water
dynamics during solid-state fermentation by Aspergillus oryzae YH6.
Bioresource Technology, 277, 68-76.
Jin, G., Zhu, Y., & Xu, Y. (2017). Mystery behind Chinese liquor fermentation.
Trends in Food Science & Technology, 63, 18-28.
List of patent applications Jin, G., Xu, Y. (2017). A nondestructive method based on low-field nuclear
magnetic resonance for Jiuqu starter’s moisture detection (in Chinese).
Application No.: 201710322294.3.
Jin, G., Xu, Y. (2019). A nondestructive method based on low-field nuclear
magnetic resonance for Jiuqu starter’s water activity detection (in Chinese).
Patent No.: ZL201910038710.6.
About the author
185
Overview of completed training activities Discipline specific activities
Conferences
6th Young Scientists Symposium on Malting, Brewing and Distilling (IBD, Bitburg/Trier, Germany)1
2018
NBC-18 Biotechnology in Harmony (NBC, Ede)2 2018
2nd HIT International Innovation and Entrepreneurship Competition on Chemistry and Chemical Engineering (HIT, Harbin, China)1
2018
2nd Euro-Global Conference on Food Science and Technology (MGC, London, UK)1
2019
Courses
Advanced Course Bioprocess Design (VLAG&BSDL, Wageningen) 2018
Reaction Kinetics in Food Science (VLAG, Wageningen) 2018
Summer School ZELCOR (VLAG, Wageningen) 2018
Big Data in the Life Sciences (VLAG, Wageningen) 2019
Microalgae Process Design (VLAG, Wageningen) 2019
Microalgae Biorefinery (VLAG, Wageningen) 2019
General courses
Efficient Writing Strategies (WGS, Wageningen) 2018
Scientific Writing (WGS, Wageningen) 2018
Introduction to R (PE&RC, Wageningen) 2018
Applied Statistics (PE&RC, Wageningen) 2018
The Essentials of Scientific Writing and Presenting (WGS, Wageningen) 2018
Presenting with Impact (WGS, Wageningen) 2018
Optionals
Preparation of Research Proposal (BPE, Wageningen) 2018
Online Group Meetings (JNU, Wuxi, China) 2018-2020
Weekly Group Meetings (BPE, Wageningen) 2018-2020
1 Oral presentation; 2 Poster presentation
186
This study was carried out at the department of Bioprocess Engineering Group of Wageningen University & Research, Wageningen, the Netherlands and Lab of Brewing Microbiology and Applied Enzymology of Jiangnan University, Wuxi, China. This thesis was financially supported by the National Natural Science Foundation of China (31530055), National Key Research and Development Plan of China (2018YFD0400402), Chinese Baijiu Industrial Technology Innovation Strategic Alliance and China Scholarship Council.
Cover designed by: Guangyuan Jin
Printed by: Digiforce || ProefschriftMaken
Guangyuan Jin, 2020

187

188
About the cover
Less is more. Inspired by Piet Mondriaan (a Dutch painter and theoretician), the lower half of the cover is a combination of basic color squares and black line that represent different components in solid-state fermentation system: water, starch, microbes and products, etc. In the very bottom, the orange square represents heat and then the different flavors (smaller color squares) formed after distillation. Our study is to discover the valuable knowledge of traditional fermentation techniques. This process has similar trend like extracting plentiful flavors from fermented solid substrate. The shiny colors (on the top) can be formed using the basic colors. The shine colors represent the flavors, and valuable knowledge or scientific principles from traditional fermentation technique. On the other hand, the shine colors are also an abstract of a colorful life from scientific study.