Soil resources and topography shape local tree community structure in tropical forests
8
, 20122532, published 19 December 2012 280 2013 Proc. R. Soc. B Somboon Kiratiprayoon, Adzmi Yaacob, Mohd N. Nur Supardi and James W. Dalling Thomas, Sumedha Madawala, Nimal Gunatilleke, Savitri Gunatilleke, Sarayudh Bunyavejchewin, Valencia, Hugo Navarrete, Stuart J. Davies, George B. Chuyong, David Kenfack, Duncan W. Claire A. Baldeck, Kyle E. Harms, Joseph B. Yavitt, Robert John, Benjamin L. Turner, Renato structure in tropical forests Soil resources and topography shape local tree community Supplementary data tml http://rspb.royalsocietypublishing.org/content/suppl/2012/12/17/rspb.2012.2532.DC1.h "Data Supplement" References http://rspb.royalsocietypublishing.org/content/280/1753/20122532.full.html#ref-list-1 This article cites 29 articles, 2 of which can be accessed free Subject collections (1587 articles) ecology Articles on similar topics can be found in the following collections Email alerting service here right-hand corner of the article or click Receive free email alerts when new articles cite this article - sign up in the box at the top http://rspb.royalsocietypublishing.org/subscriptions go to: Proc. R. Soc. B To subscribe to on March 12, 2014 rspb.royalsocietypublishing.org Downloaded from on March 12, 2014 rspb.royalsocietypublishing.org Downloaded from
-
Upload
independent -
Category
Documents
-
view
2 -
download
0
Transcript of Soil resources and topography shape local tree community structure in tropical forests

20122532 published 19 December 2012280 2013 Proc R Soc B Somboon Kiratiprayoon Adzmi Yaacob Mohd N Nur Supardi and James W DallingThomas Sumedha Madawala Nimal Gunatilleke Savitri Gunatilleke Sarayudh BunyavejchewinValencia Hugo Navarrete Stuart J Davies George B Chuyong David Kenfack Duncan W Claire A Baldeck Kyle E Harms Joseph B Yavitt Robert John Benjamin L Turner Renato structure in tropical forestsSoil resources and topography shape local tree community
Supplementary data
tml httprspbroyalsocietypublishingorgcontentsuppl20121217rspb20122532DC1h
Data Supplement
Referenceshttprspbroyalsocietypublishingorgcontent280175320122532fullhtmlref-list-1
This article cites 29 articles 2 of which can be accessed free
Subject collections (1587 articles)ecology
Articles on similar topics can be found in the following collections
Email alerting service hereright-hand corner of the article or click Receive free email alerts when new articles cite this article - sign up in the box at the top
httprspbroyalsocietypublishingorgsubscriptions go to Proc R Soc BTo subscribe to
on March 12 2014rspbroyalsocietypublishingorgDownloaded from on March 12 2014rspbroyalsocietypublishingorgDownloaded from
on March 12 2014rspbroyalsocietypublishingorgDownloaded from
rspbroyalsocietypublishingorg
ResearchCite this article Baldeck CA Harms KE Yavitt
JB John R Turner BL Valencia R Navarrete H
Davies SJ Chuyong GB Kenfack D Thomas DW
Madawala S Gunatilleke N Gunatilleke S
Bunyavejchewin S Kiratiprayoon S Yaacob A
Supardi MNN Dalling JW 2013 Soil resources
and topography shape local tree community
structure in tropical forests Proc R Soc B 280
20122532
httpdxdoiorg101098rspb20122532
Received 24 October 2012
Accepted 27 November 2012
Subject Areasecology
Keywordsbeta diversity community structure dispersal
soil topography tropical forest
Author for correspondenceClaire A Baldeck
e-mail baldeck2lifeillinoisedu
Electronic supplementary material is available
at httpdxdoiorg101098rspb20122532 or
via httprspbroyalsocietypublishingorg
amp 2012 The Author(s) Published by the Royal Society All rights reserved
Soil resources and topography shapelocal tree community structure intropical forests
Claire A Baldeck12 Kyle E Harms34 Joseph B Yavitt5 Robert John6Benjamin L Turner3 Renato Valencia7 Hugo Navarrete7 Stuart J Davies38George B Chuyong9 David Kenfack8 Duncan W Thomas10Sumedha Madawala11 Nimal Gunatilleke11 Savitri Gunatilleke11Sarayudh Bunyavejchewin12 Somboon Kiratiprayoon13 Adzmi Yaacob14Mohd N Nur Supardi15 and James W Dalling32
1Program in Ecology Evolution and Conservation Biology and 2Department of Plant Biology University ofIllinois 505 S Goodwin Ave Urbana IL 61801 USA3Smithsonian Tropical Research Institute Apartado Postal 0843-03092 Panama Republic of Panama4Department of Biological Sciences Louisiana State University 202 Life Sciences Building Baton RougeLA 70803 USA5Department of Natural Resources Cornell University 16 Fernow Hall Ithaca NY 14853 USA6Indian Institute of Science Education and Research PO BCKV Campus Main Office Mohanpur Nadia 741252West Bengal India7Escuela de Ciencias Biologicas Pontificia Universidad Catolica del Ecuador Apartado 17-01-2184 Quito Ecuador8Center for Tropical Forest Science Arnold Arboretum Asia Program Harvard University Cambridge MA USA9Department of Plant and Animal Sciences University of Buea PO Box 63 Buea Republic of Cameroon10Department of Botany and Plant Pathology Oregon State University Corvallis OR 97331-2902 USA11Department of Botany Faculty of Science University of Peradeniya Peradeniya 20400 Sri Lanka12Department of National Parks Wildlife and Plant Conservation Chatuchak Bangkok 10900 Thailand13Faculty of Science and Technology Thammasat University (Rangsit) Klongluang Patumtani 12121 Thailand14Faculty of Plantation and Agrotechnology University Technology MARA 40450 Shah Alam Selangor Malaysia15Forest Environment Division Forest Research Institute Malaysia 52109 Kepong Selangor Darul Ehsan Malaysia
Both habitat filtering and dispersal limitation influence the compositional
structure of forest communities but previous studies examining the relative
contributions of these processes with variation partitioning have primarily
used topography to represent the influence of the environment Here we
bring together data on both topography and soil resource variation within
eight large (24ndash50 ha) tropical forest plots and use variation partitioning to
decompose community compositional variation into fractions explained by
spatial soil resource and topographic variables Both soil resources and topo-
graphy account for significant and approximately equal variation in tree
community composition (9ndash34 and 5ndash29 respectively) and all environ-
mental variables together explain 13ndash39 of compositional variation within
a plot A large fraction of variation (19ndash37) was spatially structured yet
unexplained by the environment suggesting an important role for dispersal
processes and unmeasured environmental variables For the majority of
sites adding soil resource variables to topography nearly doubled the inferred
role of habitat filtering accounting for variation in compositional structure that
would previously have been attributable to dispersal Our results illustrated
using a new graphical depiction of community structure within these plots
demonstrate the importance of small-scale environmental variation in shaping
local community structure in diverse tropical forests around the globe
1 IntroductionA major challenge for community ecology is to understand the importance of
niche-assembly processes in shaping community structure This is of particular
rspbroyalsocietypublishingorgProcR
SocB28020122532
2
on March 12 2014rspbroyalsocietypublishingorgDownloaded from
interest in species-rich communities such as tropical forests
because niche partitioning is thought to facilitate species
coexistence and may therefore play an important role in bio-
diversity maintenance [12] Evidence for the role of habitat
partitioning among tropical forest tree species has been
found from local to landscape scales and comes from
observed non-random associations between species distri-
butions and environmental variables and observations of
species turnover along environmental gradients [3ndash10] How-
ever at local scales (less than 1 km2) limited dispersal also
plays an important role in determining species distributions
resulting in aggregated seedling and adult populations
[11ndash13] Disentangling the relative importance of niche and
dispersal mechanisms to local community structure is pro-
blematic because both contribute to spatial correlation in
species composition at this scale Dispersal processes lead
to spatially aggregated species distributions and therefore
spatially structured communities Additionally habitat parti-
tioning leads to spatial community structure owing to the
high spatial correlation of environmental variables
Despite substantial evidence for the importance of niche
partitioning in structuring communities surprisingly little is
known about the relative influence of different environmental
factors At local scales evidence for niche partitioning has
been based mostly on topographic variation [45714ndash17]
as topography is relatively easily measured and acts as a
useful proxy for habitat heterogeneity because it influences
water availability and soil biogeochemical processes How-
ever recently created fine-scale soil resource maps for
several tropical forest dynamics plots greatly enhance our
ability to directly examine the effects of resource variation on
tropical forest community structure In a previous analysis
using these soil maps for three neotropical forest plots John
et al [10] found that ca 30ndash40 of tree species were non-
randomly distributed with respect to soil nutrient variation
While these results indicate that soil resource variation influ-
ences the distributions of many individual species the
community-level effects of soil resource variation have not
yet been examined extensively nor has any study combined
soil resource and topographic data to examine their relative
contributions in shaping local species compositional variation
Variation partitioning [1819] via canonical redundancy
analysis (RDA [20]) provides one way to assess the relative
importance of habitat niche and dispersal-assembly pro-
cesses or of different sets of environmental variables on
community structure With variation partitioning the total
variation in community composition within a study area
(an expression of the beta diversity of the area [2122]) may
be decomposed into fractions explained by different sets of
variables (see fig 1 in Legendre et al [21]) To address the
relative contribution of habitat niche and dispersal processes
the geographical coordinates of the sampling sites may be
used to derive a set of spatial variables [23] and when
paired with environmental variables compositional variation
may be partitioned into fractions explained by pure spatial
variation pure environmental variation spatially structured
environmental variation and the unexplained remainder [21]
The component of compositional variation that is explained
by environmental variables (the pure environmental plus the
spatially structured environmental component) is generally
interpreted as resulting from species responses to measured
environmental variation whereas the component explained
by pure spatial variation is thought to result from the influence
of dispersal processes and species responses to unmeasured
environmental variation [152122]
Previous variation partitioning analyses of tropical forest
community compositional variation have used topographic
variables to estimate the contribution of the environment
[1517] The addition of soil resource measurements to such
analyses can reveal the importance of previously unmeasured
environmental variation If soil resources are relatively unim-
portant in shaping community structure or if soil resource
variation strongly covaries with topography then the pro-
portion of variation explained by the environment would
not greatly increase with the addition of soil resource vari-
ables Alternatively if soil resources exert an important
influence on community structure beyond what can be
explained by topography then in the absence of information
on soil resource variation the contribution of the environ-
ment is underestimated and the contribution of dispersal
processes is overestimated
We combine data on both topography and soil resource
variation for eight tropical forest plots to investigate the
relative contributions of spatial and total topo-edaphic vari-
ation as well as the relative contributions of topographic
and soil resource variation and the degree to which they
are redundant with one another in explaining the community
compositional variation of tropical forests By assembling a
more comprehensive battery of environmental variables we
may better resolve the relative contributions of environmental
variation and dispersal processes to tropical forest commu-
nity structure To visualize compositional variation within a
study site we adapted a technique from landscape and
regional mapping where an ordination of community compo-
sition is converted into a red-green-blue RGB image [24] We
use these lsquobeta diversityrsquo maps to inform our interpretation of
the variation partitioning results and illustrate that local habi-
tat heterogeneity may be more important to tropical forest
community structure than commonly thought
2 Material and methods(a) Study sites and environmental dataOur data come from eight long-term tropical forest dynamics
plots of the Center for Tropical Forest Science (CTFS) network
Barro Colorado Island (BCI) Panama Huai Kha Khaeng and
Khao Chong Thailand Korup Cameroon La Planada Colom-
bia Pasoh Peninsular Malaysia Sinharaja Sri Lanka and
Yasuni Ecuador The forest plots range from 24 to 50 ha in
size span a number of biogeographic regions and vary in soil
fertility and precipitation regimemdashfrom continuously wet to sea-
sonally dry Within each plot all free-standing trees larger than
1 cm dbh have been mapped identified to species and measured
for dbh according to a standard protocol [25] Plot sizes and
vegetation and soil characteristics are presented in table 1
Topographic variables consisted of elevation slope convex-
ity (the relative elevation of a quadrat with respect to its
immediate neighbours) and aspect Throughout each plot
elevation was recorded at the intersections of a 20 20 m grid
and used to calculate topographic variables at the 20 20 m
quadrat scale Mean elevation was calculated as the mean of
the elevation measurements at the four corners of a quadrat
Slope was calculated as the average slope of the four planes
formed by connecting three corners of a quadrat at a time Con-
vexity was the elevation of a quadrat minus the average elevation
of all immediate neighbour quadrats Finally aspect was the
Table 1 Study site characteristics BCI Barro Colorado Island
study sitesize(ha) forest type
no ofspecies
elevationrange (m)
soilorder soil variables used
BCI 50 semideciduous
lowland moist
298 38 oxisol Al B Ca Cu Fe K Mg Mn
N-min P Zn pH
Huai Kha
Khaeng
50 seasonal dry
evergreen
233 85 ultisol Al B Ca Cu Fe K Mg Mn
P Zn pH
Khao Chong 24 mixed evergreen 571 239 ultisol Al Ca Fe K Mg Mn P
Zn pH
Korup 50 lowland evergreen 452 95 oxisol
ultisol
Al Ca Fe K Mg Mn P Zn
La Planada 25 pluvial premontane 192 67 andisol Al Ca Cu Fe K Mg Mn
N-min P pH
Pasoh 50 lowland mixed
dipterocarp
790 24 ultisol
entisol
Al Ca Cu Fe K Mg Mn P
Sinharaja 25 mixed dipterocarp 199 145 ultisol Al Ca Fe K P pH
Yasuni 50 evergreen
lowland wet
1088 32 ultisol Al Ca Cu Fe K Mg Mn
N-min P Zn pH
rspbroyalsocietypublishingorgProcR
SocB28020122532
3
on March 12 2014rspbroyalsocietypublishingorgDownloaded from
direction of the steepest slope of a quadrat calculated in ARCMAP
v 93 (wwwesricom)
Soil samples were collected throughout each plot analysed
and the variables were kriged using comparable methods [10]
In each study site soil samples were taken at the intersections
of a 40 or 50 m grid across the study area with additional
samples taken near alternate grid points to estimate fine-scale
variation in soil variables The first 10 cm of topsoil was sampled
excluding the top organic horizon Non-nitrogen elements were
extracted with Mehlich-III solution and analysed on an atomic
emission-inductively coupled plasma (AE-ICP Perkin Elmer
Inc Massachusetts USA) with the exception of phosphorus at
the Yasuni study site which was extracted with Bray extract sol-
ution and analysed by automated colorimetry on a Quickchem
8500 Flow Injection Analyzer (Hach Ltd Loveland CO USA)
For the three neotropical study sites (BCI La Planada and
Yasuni) an estimate of the in situ N-mineralization rate was
taken at each sample location by measuring nitrogen before
and after a 28 day incubation period Nitrogen was extracted
as NHthorn4 and NO3 with 2M KCl and analysed with an auto ana-
lyzer (OI FS 3000 OI Analytical College Station TX USA)
Sample values were kriged to obtain estimated concentrations
of soil nutrients at the 20 20 m quadrat scale The set of soil
variables for each study site contained 6ndash12 variables generally
including Al Ca K Mg Mn P and pH but where available also
included the N-mineralization rate B Cu Fe and Zn (table 1)
(b) Partitioning beta diversitySpatial patterns in community compositional variation were
modelled with principal coordinates of neighbour matrices
(PCNM) according to the methods described in Borcard amp
Legendre [23] PCNM is a powerful technique that is able to
model spatial structure in a dataset at any spatial scale that can
be resolved by the sampling design (here the 20 20 m spatial
resolution) [15232627] The method for calculating PCNM
eigenfunctions [15] is briefly summarized as follows a truncated
geographical distance matrix was produced for all 20 20 m
quadrats in a study site In this matrix neighbouring quadrats
were determined using the queen criterion of contiguity (ie
each quadrat has up to eight neighbours) The geographical
distance between neighbours was retained but the distances
between all non-neighbour quadrats was replaced with a value
of four times the distance between diagonally contiguous quad-
rats A principal coordinates analysis was then performed on this
truncated geographical distance matrix and all eigenfunctions
with positive eigenvalues were retained These PCNM eigen-
functions made up the set of spatial variables used to model
spatial structure in the community data
We used canonical RDA [20] to partition the total compo-
sitional variation in a community into portions explained by
spatial soil and topographic variables at the 20 20 m scale
Throughout this study we refer to the set of soil and topographic
variables together as environmental variables Prior to analysis
we expanded the set of environmental variables according to
the method of Legendre et al [15] to increase model flexibility
adding the squared and cubed values of each variable with
the exception of aspect We included the sine and cosine of
aspect as the only aspect variables This created a set of 11 topo-
graphic variables and 18ndash36 soil variables for each study site
The proportion of variation explained by a set of variables is
given as the adjusted R2 of the explanatory variable set in the
RDA which is an unbiased estimator that corrects for the
number of variables in the set [28]
For a more detailed look at the contributions of different vari-
ables both the soil and topographic variable sets were separately
subjected to forward selection to extract the important variables
In this forward selection procedure new variables are added to
the model in order of importance using two stopping criteria
each additional variable must be significant at the a frac14 005 level
and the cumulative adjusted R2 of the variable set may not
exceed that of the adjusted R2 of the full variable set [29] The
resulting cumulative adjusted R2 values from the forward selection
procedure were nearly identical to the adjusted R2 values from
the full variable sets thus the adjusted R2 values from the full vari-
able sets were used represent the fraction of variation explained in
the variation partitioning analysis Variation partitioning with
RDAwas performed in the lsquoveganrsquo package [30] and forward selec-
tion was performed in the lsquopackforrsquo package [31] in the R statistical
programming language (v 2130 [32])
To check the robustness of our variation partitioning results
to the type of canonical analysis used we repeated the variation
ents
are
labell
edw
ithre
fere
nce
tofig
ure
1to
talfrac14
the
prop
ortio
nof
varia
tion
expl
ained
byall
spat
ialan
den
viron
men
talv
ariab
lesco
mbi
ned
riabl
es(athorn
dthorn
fthorn
g)e
nvfrac14
the
prop
ortio
nex
plain
edby
envir
onm
enta
lvar
iables
(bthorn
cthorn
dthorn
ethorn
fthorn
g)s
pacejen
vfrac14
the
pure
(dthorn
fthorn
g)e
nvjs
pacefrac14
the
pure
envir
onm
enta
lcom
pone
nt(bthorn
cthorn
e)s
oilfrac14
the
prop
ortio
nex
plain
edby
soil
varia
bles
(bthorn
dthorn
)so
iljtop
ofrac14
the
prop
ortio
nex
plain
edby
soil
after
acco
untin
gfo
rtop
ogra
phy
(bthorn
d)s
oilampt
opofrac14
the
topo
grap
hica
llystr
uctu
red
soil
ing
fors
oil(cthorn
f)
vsp
aceamp
env
envjsp
ace
soil
topo
so
iljtop
oso
ilampto
po
topo
jsoi
l
025
000
020
013
012
008
004
011
002
009
008
006
003
004
035
003
034
017
022
012
005
038
000
030
028
010
019
009
010
003
011
005
008
003
002
019
001
017
010
010
007
003
036
001
020
029
008
012
017
021
001
017
011
011
006
005
rspbroyalsocietypublishingorgProcR
SocB28020122532
4
on March 12 2014rspbroyalsocietypublishingorgDownloaded from
partitioning analysis with a distance-based RDA [33] based on
square-root transformed BrayndashCurtis distances among quadrats
Fractions of explained variation from the ordinary RDA were
compared with those from the distance-based RDA We also
checked our results for robustness to plot size Larger plots
may be expected to have a higher beta diversity owing to the
speciesndasharea relationship and they may encompass greater
environmental variation For the five 50-ha plots we compared
the variation partitioning results with those obtained from
their two 25-ha plot halves Methodological details results and
discussion of these analyses are presented in the electronic
supplementary material The relative sizes of the variation frac-
tions were found to be robust to the type of canonical analysis
used and to differences in plot size therefore only the results
of the ordinary RDA for original plot sizes are discussed here
With all constrained ordination techniques lack-of-fit of
model to data occurs because ecological data are messy and do
not perfectly match the species response model assumptions
[34] This lack-of-fit contributes to the unexplained portion of
variation and may be large (30ndash70 in simulated communities
[34]) but the size depends on the dataset Following the rec-
ommendations of Oslashkland [34] we avoid comparing the
fractions of variation explained among study sites and focus
on comparing the relative sizes of fractions of variation explained
by different variable sets within a single study site
(c) Beta diversity mapsTo produce a map of community composition within a study site
we first calculated the BrayndashCurtis distances among all 20 20 m
quadrats within a study site then this distance matrix was
subjected to non-metric multi-dimensional scaling on three ordina-
tion axes Each quadratrsquos position in three-dimensional ordination
space was then translated into an RGB colour by assigning quadrat
positions on ordination axes 1 2 and 3 to intensities of red green
and blue respectively [24] We applied the same translation from
axis position to colour intensity to all axes simultaneously so
that the variation shown by each of the colours is proportional to
the variation explained by its respective axis The red green and
blue components of each quadrat were combined to create RGB
colours that were then mapped This method of mapping commu-
nity structure displays a greater portion of community variation
than possible by displaying one species or ordination axis at a time
Tabl
e2
Varia
tion
parti
tioni
ngre
sults
fors
patia
lso
ilan
dto
pogr
aphi
cva
riabl
esC
ompo
n(athorn
bthorn
cthorn
dthorn
ethorn
fthorn
g)s
pacefrac14
the
prop
ortio
nex
plain
edby
spat
ialva
spat
ialco
mpo
nent
(a)
spac
eampen
vfrac14
the
spat
ially
struc
ture
den
viron
men
talc
ompo
nent
ethorn
g)t
opofrac14
the
prop
ortio
nex
plain
edby
topo
grap
hic
varia
bles
(cthorn
ethorn
fthorn
gco
mpo
nent
(ethorn
g)t
opojso
ilfrac14
the
prop
ortio
nex
plain
edby
topo
grap
hyaft
erac
coun
t
stud
ysit
eto
tal
spac
een
vsp
aceje
n
BCI
054
054
025
029
Huai
Kha
Khae
ng0
470
450
140
33
Khao
Chon
g0
610
570
390
22
Koru
p0
740
740
380
36
LaPl
anad
a0
320
290
130
19
Paso
h0
470
470
200
28
Sinha
raja
074
073
037
037
Yasu
ni0
500
490
220
28
3 Results(a) Niche and dispersal assemblyTotal explained variation from environmental and spatial vari-
ables together varied markedly among sites ranging from 32
per cent at La Planada to 74 per cent at Korup and Sinharaja
(table 2 refer to diagram of fractions in figure 1) Across
study sites nearly all the total explained variation was
accounted for by the spatial variables resulting in an effective
lack of pure environmental variation The proportion of vari-
ation explained by environmental variables also varied
widely from site to site from as little as 13 per cent at La
Planada to as much as 39 per cent at Khao Chong (table 2)
The proportion of variation explained by spatial variables
alone (after controlling for the effect of environmental vari-
ation) ranged from 19 to 37 similar in magnitude to the
variation explained by environmental variables
(b) Soil resource and topographic effectsThe sets of soil and topographic variables each explained a
statistically significant proportion of compositional variation
a bd
g
c
f e
spatial variables soil variables
topographic variables
Figure 1 Diagram of variation fractions for a three-way variation partitioningof the variable sets used in this study Letters correspond to those given forthe variation fractions in table 2
rspbroyalsocietypublishingorgProcR
SocB28020122532
5
on March 12 2014rspbroyalsocietypublishingorgDownloaded from
at every study site ( p 0001) Soil variables explained more
variation than topographic variables in seven of the eight
study sites (table 2) Additionally at six of the study sites
(excepting Korup and Sinharaja) the amount of additional
variation explained by soil resource variables after accounting
for topographic variables was similar to the amount
explained by topographic variables alone thus effectively
doubling the proportion of variation accounted for by the
environment
(c) Beta diversity mapsMaps of plot beta diversity are presented alongside site
elevation maps in figure 2 In the beta diversity maps quad-
rats of similar colour contain similar tree communities (lower
BrayndashCurtis dissimilarity) providing a visual interpretation
of both the turnover between any two quadrats within a
study site and the total variation in community composition
The maps for Korup and Sinharaja (figure 2bf ) where 74 per
cent of the variation in community composition is explained
by environmental and spatial variables clearly show far more
spatial structure than the La Planada map (figure 2e) where
only 32 per cent of variation is explained These maps also
reveal community responses to specific environmental fea-
tures such as the stream bed running east to west across
the Pasoh study site (figure 2c) and the swamp located
near the centre of the Barro Colorado Island study site
(figure 2a cf fig 1 in Harms et al [4])
4 DiscussionThe interpretation of the relative roles of niche and dispersal
processes is complicated by the fact that the purely spatial frac-
tion of compositional variation is attributed to the effects of
dispersal-assembly and species responses to unmeasured
environmental variation Our analysis demonstrates the impor-
tance of previously unmeasured environmental variation in
shaping community structure in tropical forests the inclusion
of soil resource data in the analysis nearly doubled the pro-
portion of variation explained by environmental variables
compared with topography alone at most sites Although the
soil and topographic variables covary neither the effect
of soil nor the effect of topography was entirely nested within
the other indicating that both soil resources and topography
have important and independent effects on community
structure in a wide variety of tropical forest communities
There is certainly still important unmeasured environ-
mental variation (ie light soil moisture and drainage) that
contributes to the community structure of these forests
Some variables such as soil moisture and drainage which
exhibit spatial variation over larger spatial scales (hundreds
of meters) may contribute to the portion of variation that is
spatially structured yet unexplained by our environmental
variable set Other important unmeasured environmen-
tal variables may exhibit spatial structure that is not
captured by the 20 20 m resolution of our study design
such as light availability which may vary dramatically over
distances less than 20 m [35] Species responses to such
environmental variables may contribute to the unexplained
portion of compositional variation along with stochasticity
in species distributions and model lack-of-fit [2234] However
our data for any one study site are among the most complete
environmental datasets for any tropical forest community
The large proportion of community variation that is spatially
structured and remains unaccounted for by either soil or
topographic variables suggests an important role for dis-
persal-assembly alongside habitat niche processes in shaping
community structure in these forests
The spatial resolution of our analysis is also expected to
affect the balance between the proportion of variation
explained by environmental and pure spatial variation [15]
and thus the inferred relative importance of habitat niche and
dispersal-assembly processes As the spatial resolution of the
analysis decreases (or quadrat size becomes larger) smaller
scale dispersal effects and environmental heterogeneity are
smoothed over causing the explanatory power of the environ-
ment to increase [15] For this analysis we chose the 20 20 m
resolution because this quadrat size best represents soil
resource variation as measured by our sampling scheme and
it is the scale at which elevation was measured Therefore
the sizes of the fractions of compositional variation that are
explained by environmental and pure spatial variation
are specific to the 20 20 m resolution of our analysis
The beta diversity maps we generated help inform the
interpretation of our variation partitioning results From
these maps one can see that the topographic signature on
community structure is strong at many of the sites even
though the set of topographic variables always accounts for
less than 30 per cent of compositional variation (figure 2
and table 2) The variable selection procedure identified
slope as the most important topographic variable at the BCI
study site explaining 34 per cent of compositional variation
(see the electronic supplementary material table S4) yet this
effect can be discerned from the RGB map (figure 2a cf fig 1
in Harms et al [4]) The four most important topographic
variables from the variable selection procedure (elevation
convexity slope and cosine of aspect) explain 96 per cent
of the community variation at the Yasuni study site (see the
electronic supplementary material table S4) and there is a
strong similarity between the beta diversity and topographic
maps for this site (figure 2d) The strongest effect of any
single environmental variable on community structure in
our study is elevation at Sinharaja explaining 147 per cent
(see the electronic supplementary material table S4) which
coincides with sharply defined features of the community
(figure 2f ) Therefore in the context of our analysis a vari-
able that explains 3 per cent of variation in community
composition may have a discernible but subtle effect on com-
munity structure whereas a variable that explains 15 per cent
Barro Colorado Island
Korup
Pasoh
Yasuni
La Planada Sinharaja
(a)
(b)
(c)
(d)
(e) ( f )
Figure 2 Beta diversity maps along with elevation maps for six of the eight study sites (a) Barro Colorado Island Panama (b) Korup Cameroon (c) PasohPenninsular Malaysia (d ) Yasuni Ecuador (e) La Planada Colombia and ( f ) Sinharaja Sri Lanka Beta diversity and elevation maps for Huai Kha Kheng and KhaoChong Thailand are in the electronic supplementary material figure S2 In elevation maps the colour scheme moves from dark green (low elevation) to white(high elevation) The colours of the community map have no absolute meaningmdashonly the colour differences between locations within the same study siteare meaningful
rspbroyalsocietypublishingorgProcR
SocB28020122532
6
on March 12 2014rspbroyalsocietypublishingorgDownloaded from
may have a very strong effect The fact that environmental
factors that appear to be quite ecologically important may
account for less than 5 per cent of compositional variation
in an RDA is unsurprising when one considers the great
deal of random noise in ecological data and the lack-of-fit
of model to data inherent in constrained ordination tech-
niques [34]
We found that the proportion of community compo-
sitional variation explained by the environment greatly
increased with the addition of soil resource variables to the
environmental variable set relative to topographic variables
alone The inclusion of a more comprehensive set of environ-
mental variables in our variation partitioning analysis shifts
our understanding of the relative importance of habitat filter-
ing and dispersal processes towards greater importance of
habitat filtering Additionally maps of beta diversity plotted
as an RGB image indicate that environmental factors that
account for a small proportion (less than 5) of compositio-
nal variation may nonetheless produce an important signal
in community structure For these reasons we argue that the
role of habitat filtering may have been underappreciated in
the past
Financial support for soils work was provided by the US NationalScience Foundation grants DEB 0211004 DEB 0211115 DEB0212284 DEB 0212818 and OISE 0314581 the soils initiative of theSmithsonian Tropical Research Institute and a CTFS grant to cover
rsp
7
on March 12 2014rspbroyalsocietypublishingorgDownloaded from
collection and extraction of soils from Korup We also thank JonathanMyers Editor Fangliang He and two anonymous reviewers for theirvaluable comments on the manuscript The tree census and
topographic data are maintained by CTFS and data enquiriesshould be made to Stuart Davies The soils data are maintained byJWD and enquires should be made to him
broyalsociet
References
ypublishingorgProcR
SocB28020122532
1 Weiher E Keddy P 1999 Ecological assembly rulesperspectives advances retreats Cambridge UKCambridge University Press
2 Chase JM Leibold MA 2003 Ecological nicheslinking classical and contemporary approachesChicago IL University of Chicago Press
3 Clark DB Clark DA Read JM 1998 Edaphic variationand the mesoscale distribution of tree species in aneotropical rain forest J Ecol 86 101 ndash 112(doi101046j1365-2745199800238x)
4 Harms KE Condit R Hubbell SP Foster RB 2001Habitat associations of trees and shrubs in a 50-haneotropical forest plot J Ecol 89 947 ndash 959(doi101111j1365-2745200100615x)
5 Potts MD Ashton PS Kaufman LS Plotkin JB 2002Habitat patterns in tropical rain forests acomparison of 105 plots in northwest borneoEcology 83 2782 ndash 2797 (doi1018900012-9658(2002)083[2782HPITRF]20CO2)
6 Phillips OL Vargas PN Monteagudo AL Cruz APZans MC Sanchez WG Yli-Halla M Rose S 2003Habitat association among Amazonian tree speciesa landscape-scale approach J Ecol 91 757 ndash 775(doi101046j1365-2745200300815x)
7 Valencia R et al 2004 Tree species distributions andlocal habitat variation in the Amazon large forestplot in eastern Ecuador J Ecol 92 214 ndash 229(doi101111j0022-0477200400876x)
8 Fine PA Daly DC Cameron KM 2005 Thecontribution of edaphic heterogeneity to theevolution and diversity of Burseraceae trees in thewestern Amazon Evolution 59 1464 ndash 1478
9 Paoli GD Curran LM Zak DR 2006 Soil nutrientsand beta diversity in the Bornean Dipterocarpaceaeevidence for niche partitioning by tropical rainforest trees J Ecol 94 157 ndash 170 (doi101111j1365-2745200501077x)
10 John R et al 2007 Soil nutrients influence spatialdistributions of tropical tree species Proc Natl AcadSci USA 104 864 ndash 869 (doi101073pnas0604666104)
11 Condit R et al 2000 Spatial patterns in thedistribution of tropical tree species Science 2881414 ndash 1418 (doi101126science28854701414)
12 Plotkin JB Potts MD Leslie N Manokaran NLaFrankie J Ashton PS 2000 Species-area curvesspatial aggregation and habitat specialization intropical forests J Theor Biol 207 81 ndash 99 (doi101006jtbi20002158)
13 Dalling JW Muller-Landau HC Wright SJ HubbellSP 2002 Role of dispersal in the recruitmentlimitation of neotropical pioneer species J Ecol 90714 ndash 727 (doi101046j1365-2745200200706x)
14 Gunatilleke CVS Gunatilleke IAUN Esufali S HarmsKE Ashton PMS Burslem DFRP Ashton PS 2006Species ndash habitat associations in a Sri Lankandipterocarp forest J Trop Ecol 22 371 ndash 384(doi101017S0266467406003282)
15 Legendre P Mi X Ren H Ma K Yu M Sun I He F2009 Partitioning beta diversity in a subtropicalbroad-leaved forest of China Ecology 90 663 ndash 674(doi10189007-18801)
16 Chuyong G Kenfack D Harms K Thomas DCondit R Comita L 2011 Habitat specificity anddiversity of tree species in an African wet tropicalforest Plant Ecol 212 1363 ndash 1374 (doi101007s11258-011-9912-4)
17 De Caceres M et al 2012 The variation of tree betadiversity across a global network of forest plotsGlobal Ecol Biogeogr 21 1191 ndash 1202 (doi101111j1466-8238201200770x)
18 Borcard D Legendre P Drapeau P 1992 Partiallingout the spatial component of ecological variationEcology 73 1045 ndash 1055 (doi1023071940179)
19 Borcard D Legendre P 1994 Environmental controland spatial structure in ecological communities anexample using oribatid mites (acari oribatei)Environ Ecol Stat 1 37 ndash 61 (doi101007BF00714196)
20 Rao CR 1964 The use and interpretation of principalcomponent analysis in applied research SankhyaaSer A 26 329 ndash 358
21 Legendre P Borcard D Peres-Neto PR 2005Analyzing beta diversity partitioning the spatialvariation of community composition data EcolMonogr 75 435 ndash 450 (doi10189005-0549)
22 Anderson MJ et al 2011 Navigating the multiplemeanings of b diversity a roadmap for thepracticing ecologist Ecol Lett 14 19 ndash 28(doi101111j1461-0248201001552x)
23 Borcard D Legendre P 2002 All-scale spatialanalysis of ecological data by means of principalcoordinates of neighbour matrices Ecol Model153 51 ndash 68 (doi101016S0304-3800(01)00501-4)
24 Thessler S Ruokolainen K Tuomisto H Tomppo E2005 Mapping gradual landscape-scale floristicchanges in Amazonian primary rain forests bycombining ordination and remote sensing Global
Ecol Biogeogr 14 315 ndash 325 (doi101111j1466-822X200500158x)
25 Condit R 1998 Tropical forest census plots methodsand results from Barro Colorado Island Panama anda comparison with other plots HeidelbergGermany Springer
26 Borcard D Legendre P Avois-Jacquet C Tuomisto H2004 Dissecting the spatial structure of ecologicaldata at multiple scales Ecology 85 1826 ndash 1832(doi10189003-3111)
27 Dray S Legendre P Peres-Neto PR 2006 Spatialmodelling a comprehensive framework for principalcoordinate analysis of neighbour matrices (PCNM)Ecol Model 196 483 ndash 493 (doi101016jecolmodel200602015)
28 Peres-Neto PR Legendre P Dray S Borcard D 2006Variation partitioning of species data matricesestimation and comparison of fractions Ecology 872614 ndash 2625 (doi1018900012-9658(2006)87[2614VPOSDM]20CO2)
29 Blanchet FG Legendre P Borcard D 2008 Forwardselection of explanatory variables Ecology 892623 ndash 2632 (doi10189007-09861)
30 Oksanan J Blanchet FG Kindt R Legendre POrsquoHara RB Simpson GL Solymos P Stevens MHHWagner H 2011 VEGAN community ecology packageR package version 117 ndash 9 See httpCRANR-projectorgpackage=vegan
31 Dray S Legendre P Blanchet G 2009 PACKFORforward selection with permutation (canoco p46)R package version 00-7r58 See httpR-ForgeR-projectorgprojectssedar
32 R Development Core Team 2011 R a language andenvironment for statistical computing ViennaAustriaL R Foundation for Statistical Computing(httpwwwR-projectorg)
33 Legendre P Anderson MJ 1999 Distance-basedredundancy analysis testing multispecies responsesin multifactorial ecological experiments EcolMonogr 69 1 ndash 24 (doi1018900012-9615(1999)069[0001DBRATM]20CO2)
34 Oslashkland RH 1999 On the variation explained byordination and constrained ordination axesJ Vegetation Sci 10 131 ndash 136 (doi1023073237168)
35 Baraloto C Couteron P 2010 Fine-scale microhabitatheterogeneity in a French Guianan forest Biotropica42 420 ndash 428 (doi101111j1744-7429200900620x)

on March 12 2014rspbroyalsocietypublishingorgDownloaded from
rspbroyalsocietypublishingorg
ResearchCite this article Baldeck CA Harms KE Yavitt
JB John R Turner BL Valencia R Navarrete H
Davies SJ Chuyong GB Kenfack D Thomas DW
Madawala S Gunatilleke N Gunatilleke S
Bunyavejchewin S Kiratiprayoon S Yaacob A
Supardi MNN Dalling JW 2013 Soil resources
and topography shape local tree community
structure in tropical forests Proc R Soc B 280
20122532
httpdxdoiorg101098rspb20122532
Received 24 October 2012
Accepted 27 November 2012
Subject Areasecology
Keywordsbeta diversity community structure dispersal
soil topography tropical forest
Author for correspondenceClaire A Baldeck
e-mail baldeck2lifeillinoisedu
Electronic supplementary material is available
at httpdxdoiorg101098rspb20122532 or
via httprspbroyalsocietypublishingorg
amp 2012 The Author(s) Published by the Royal Society All rights reserved
Soil resources and topography shapelocal tree community structure intropical forests
Claire A Baldeck12 Kyle E Harms34 Joseph B Yavitt5 Robert John6Benjamin L Turner3 Renato Valencia7 Hugo Navarrete7 Stuart J Davies38George B Chuyong9 David Kenfack8 Duncan W Thomas10Sumedha Madawala11 Nimal Gunatilleke11 Savitri Gunatilleke11Sarayudh Bunyavejchewin12 Somboon Kiratiprayoon13 Adzmi Yaacob14Mohd N Nur Supardi15 and James W Dalling32
1Program in Ecology Evolution and Conservation Biology and 2Department of Plant Biology University ofIllinois 505 S Goodwin Ave Urbana IL 61801 USA3Smithsonian Tropical Research Institute Apartado Postal 0843-03092 Panama Republic of Panama4Department of Biological Sciences Louisiana State University 202 Life Sciences Building Baton RougeLA 70803 USA5Department of Natural Resources Cornell University 16 Fernow Hall Ithaca NY 14853 USA6Indian Institute of Science Education and Research PO BCKV Campus Main Office Mohanpur Nadia 741252West Bengal India7Escuela de Ciencias Biologicas Pontificia Universidad Catolica del Ecuador Apartado 17-01-2184 Quito Ecuador8Center for Tropical Forest Science Arnold Arboretum Asia Program Harvard University Cambridge MA USA9Department of Plant and Animal Sciences University of Buea PO Box 63 Buea Republic of Cameroon10Department of Botany and Plant Pathology Oregon State University Corvallis OR 97331-2902 USA11Department of Botany Faculty of Science University of Peradeniya Peradeniya 20400 Sri Lanka12Department of National Parks Wildlife and Plant Conservation Chatuchak Bangkok 10900 Thailand13Faculty of Science and Technology Thammasat University (Rangsit) Klongluang Patumtani 12121 Thailand14Faculty of Plantation and Agrotechnology University Technology MARA 40450 Shah Alam Selangor Malaysia15Forest Environment Division Forest Research Institute Malaysia 52109 Kepong Selangor Darul Ehsan Malaysia
Both habitat filtering and dispersal limitation influence the compositional
structure of forest communities but previous studies examining the relative
contributions of these processes with variation partitioning have primarily
used topography to represent the influence of the environment Here we
bring together data on both topography and soil resource variation within
eight large (24ndash50 ha) tropical forest plots and use variation partitioning to
decompose community compositional variation into fractions explained by
spatial soil resource and topographic variables Both soil resources and topo-
graphy account for significant and approximately equal variation in tree
community composition (9ndash34 and 5ndash29 respectively) and all environ-
mental variables together explain 13ndash39 of compositional variation within
a plot A large fraction of variation (19ndash37) was spatially structured yet
unexplained by the environment suggesting an important role for dispersal
processes and unmeasured environmental variables For the majority of
sites adding soil resource variables to topography nearly doubled the inferred
role of habitat filtering accounting for variation in compositional structure that
would previously have been attributable to dispersal Our results illustrated
using a new graphical depiction of community structure within these plots
demonstrate the importance of small-scale environmental variation in shaping
local community structure in diverse tropical forests around the globe
1 IntroductionA major challenge for community ecology is to understand the importance of
niche-assembly processes in shaping community structure This is of particular
rspbroyalsocietypublishingorgProcR
SocB28020122532
2
on March 12 2014rspbroyalsocietypublishingorgDownloaded from
interest in species-rich communities such as tropical forests
because niche partitioning is thought to facilitate species
coexistence and may therefore play an important role in bio-
diversity maintenance [12] Evidence for the role of habitat
partitioning among tropical forest tree species has been
found from local to landscape scales and comes from
observed non-random associations between species distri-
butions and environmental variables and observations of
species turnover along environmental gradients [3ndash10] How-
ever at local scales (less than 1 km2) limited dispersal also
plays an important role in determining species distributions
resulting in aggregated seedling and adult populations
[11ndash13] Disentangling the relative importance of niche and
dispersal mechanisms to local community structure is pro-
blematic because both contribute to spatial correlation in
species composition at this scale Dispersal processes lead
to spatially aggregated species distributions and therefore
spatially structured communities Additionally habitat parti-
tioning leads to spatial community structure owing to the
high spatial correlation of environmental variables
Despite substantial evidence for the importance of niche
partitioning in structuring communities surprisingly little is
known about the relative influence of different environmental
factors At local scales evidence for niche partitioning has
been based mostly on topographic variation [45714ndash17]
as topography is relatively easily measured and acts as a
useful proxy for habitat heterogeneity because it influences
water availability and soil biogeochemical processes How-
ever recently created fine-scale soil resource maps for
several tropical forest dynamics plots greatly enhance our
ability to directly examine the effects of resource variation on
tropical forest community structure In a previous analysis
using these soil maps for three neotropical forest plots John
et al [10] found that ca 30ndash40 of tree species were non-
randomly distributed with respect to soil nutrient variation
While these results indicate that soil resource variation influ-
ences the distributions of many individual species the
community-level effects of soil resource variation have not
yet been examined extensively nor has any study combined
soil resource and topographic data to examine their relative
contributions in shaping local species compositional variation
Variation partitioning [1819] via canonical redundancy
analysis (RDA [20]) provides one way to assess the relative
importance of habitat niche and dispersal-assembly pro-
cesses or of different sets of environmental variables on
community structure With variation partitioning the total
variation in community composition within a study area
(an expression of the beta diversity of the area [2122]) may
be decomposed into fractions explained by different sets of
variables (see fig 1 in Legendre et al [21]) To address the
relative contribution of habitat niche and dispersal processes
the geographical coordinates of the sampling sites may be
used to derive a set of spatial variables [23] and when
paired with environmental variables compositional variation
may be partitioned into fractions explained by pure spatial
variation pure environmental variation spatially structured
environmental variation and the unexplained remainder [21]
The component of compositional variation that is explained
by environmental variables (the pure environmental plus the
spatially structured environmental component) is generally
interpreted as resulting from species responses to measured
environmental variation whereas the component explained
by pure spatial variation is thought to result from the influence
of dispersal processes and species responses to unmeasured
environmental variation [152122]
Previous variation partitioning analyses of tropical forest
community compositional variation have used topographic
variables to estimate the contribution of the environment
[1517] The addition of soil resource measurements to such
analyses can reveal the importance of previously unmeasured
environmental variation If soil resources are relatively unim-
portant in shaping community structure or if soil resource
variation strongly covaries with topography then the pro-
portion of variation explained by the environment would
not greatly increase with the addition of soil resource vari-
ables Alternatively if soil resources exert an important
influence on community structure beyond what can be
explained by topography then in the absence of information
on soil resource variation the contribution of the environ-
ment is underestimated and the contribution of dispersal
processes is overestimated
We combine data on both topography and soil resource
variation for eight tropical forest plots to investigate the
relative contributions of spatial and total topo-edaphic vari-
ation as well as the relative contributions of topographic
and soil resource variation and the degree to which they
are redundant with one another in explaining the community
compositional variation of tropical forests By assembling a
more comprehensive battery of environmental variables we
may better resolve the relative contributions of environmental
variation and dispersal processes to tropical forest commu-
nity structure To visualize compositional variation within a
study site we adapted a technique from landscape and
regional mapping where an ordination of community compo-
sition is converted into a red-green-blue RGB image [24] We
use these lsquobeta diversityrsquo maps to inform our interpretation of
the variation partitioning results and illustrate that local habi-
tat heterogeneity may be more important to tropical forest
community structure than commonly thought
2 Material and methods(a) Study sites and environmental dataOur data come from eight long-term tropical forest dynamics
plots of the Center for Tropical Forest Science (CTFS) network
Barro Colorado Island (BCI) Panama Huai Kha Khaeng and
Khao Chong Thailand Korup Cameroon La Planada Colom-
bia Pasoh Peninsular Malaysia Sinharaja Sri Lanka and
Yasuni Ecuador The forest plots range from 24 to 50 ha in
size span a number of biogeographic regions and vary in soil
fertility and precipitation regimemdashfrom continuously wet to sea-
sonally dry Within each plot all free-standing trees larger than
1 cm dbh have been mapped identified to species and measured
for dbh according to a standard protocol [25] Plot sizes and
vegetation and soil characteristics are presented in table 1
Topographic variables consisted of elevation slope convex-
ity (the relative elevation of a quadrat with respect to its
immediate neighbours) and aspect Throughout each plot
elevation was recorded at the intersections of a 20 20 m grid
and used to calculate topographic variables at the 20 20 m
quadrat scale Mean elevation was calculated as the mean of
the elevation measurements at the four corners of a quadrat
Slope was calculated as the average slope of the four planes
formed by connecting three corners of a quadrat at a time Con-
vexity was the elevation of a quadrat minus the average elevation
of all immediate neighbour quadrats Finally aspect was the
Table 1 Study site characteristics BCI Barro Colorado Island
study sitesize(ha) forest type
no ofspecies
elevationrange (m)
soilorder soil variables used
BCI 50 semideciduous
lowland moist
298 38 oxisol Al B Ca Cu Fe K Mg Mn
N-min P Zn pH
Huai Kha
Khaeng
50 seasonal dry
evergreen
233 85 ultisol Al B Ca Cu Fe K Mg Mn
P Zn pH
Khao Chong 24 mixed evergreen 571 239 ultisol Al Ca Fe K Mg Mn P
Zn pH
Korup 50 lowland evergreen 452 95 oxisol
ultisol
Al Ca Fe K Mg Mn P Zn
La Planada 25 pluvial premontane 192 67 andisol Al Ca Cu Fe K Mg Mn
N-min P pH
Pasoh 50 lowland mixed
dipterocarp
790 24 ultisol
entisol
Al Ca Cu Fe K Mg Mn P
Sinharaja 25 mixed dipterocarp 199 145 ultisol Al Ca Fe K P pH
Yasuni 50 evergreen
lowland wet
1088 32 ultisol Al Ca Cu Fe K Mg Mn
N-min P Zn pH
rspbroyalsocietypublishingorgProcR
SocB28020122532
3
on March 12 2014rspbroyalsocietypublishingorgDownloaded from
direction of the steepest slope of a quadrat calculated in ARCMAP
v 93 (wwwesricom)
Soil samples were collected throughout each plot analysed
and the variables were kriged using comparable methods [10]
In each study site soil samples were taken at the intersections
of a 40 or 50 m grid across the study area with additional
samples taken near alternate grid points to estimate fine-scale
variation in soil variables The first 10 cm of topsoil was sampled
excluding the top organic horizon Non-nitrogen elements were
extracted with Mehlich-III solution and analysed on an atomic
emission-inductively coupled plasma (AE-ICP Perkin Elmer
Inc Massachusetts USA) with the exception of phosphorus at
the Yasuni study site which was extracted with Bray extract sol-
ution and analysed by automated colorimetry on a Quickchem
8500 Flow Injection Analyzer (Hach Ltd Loveland CO USA)
For the three neotropical study sites (BCI La Planada and
Yasuni) an estimate of the in situ N-mineralization rate was
taken at each sample location by measuring nitrogen before
and after a 28 day incubation period Nitrogen was extracted
as NHthorn4 and NO3 with 2M KCl and analysed with an auto ana-
lyzer (OI FS 3000 OI Analytical College Station TX USA)
Sample values were kriged to obtain estimated concentrations
of soil nutrients at the 20 20 m quadrat scale The set of soil
variables for each study site contained 6ndash12 variables generally
including Al Ca K Mg Mn P and pH but where available also
included the N-mineralization rate B Cu Fe and Zn (table 1)
(b) Partitioning beta diversitySpatial patterns in community compositional variation were
modelled with principal coordinates of neighbour matrices
(PCNM) according to the methods described in Borcard amp
Legendre [23] PCNM is a powerful technique that is able to
model spatial structure in a dataset at any spatial scale that can
be resolved by the sampling design (here the 20 20 m spatial
resolution) [15232627] The method for calculating PCNM
eigenfunctions [15] is briefly summarized as follows a truncated
geographical distance matrix was produced for all 20 20 m
quadrats in a study site In this matrix neighbouring quadrats
were determined using the queen criterion of contiguity (ie
each quadrat has up to eight neighbours) The geographical
distance between neighbours was retained but the distances
between all non-neighbour quadrats was replaced with a value
of four times the distance between diagonally contiguous quad-
rats A principal coordinates analysis was then performed on this
truncated geographical distance matrix and all eigenfunctions
with positive eigenvalues were retained These PCNM eigen-
functions made up the set of spatial variables used to model
spatial structure in the community data
We used canonical RDA [20] to partition the total compo-
sitional variation in a community into portions explained by
spatial soil and topographic variables at the 20 20 m scale
Throughout this study we refer to the set of soil and topographic
variables together as environmental variables Prior to analysis
we expanded the set of environmental variables according to
the method of Legendre et al [15] to increase model flexibility
adding the squared and cubed values of each variable with
the exception of aspect We included the sine and cosine of
aspect as the only aspect variables This created a set of 11 topo-
graphic variables and 18ndash36 soil variables for each study site
The proportion of variation explained by a set of variables is
given as the adjusted R2 of the explanatory variable set in the
RDA which is an unbiased estimator that corrects for the
number of variables in the set [28]
For a more detailed look at the contributions of different vari-
ables both the soil and topographic variable sets were separately
subjected to forward selection to extract the important variables
In this forward selection procedure new variables are added to
the model in order of importance using two stopping criteria
each additional variable must be significant at the a frac14 005 level
and the cumulative adjusted R2 of the variable set may not
exceed that of the adjusted R2 of the full variable set [29] The
resulting cumulative adjusted R2 values from the forward selection
procedure were nearly identical to the adjusted R2 values from
the full variable sets thus the adjusted R2 values from the full vari-
able sets were used represent the fraction of variation explained in
the variation partitioning analysis Variation partitioning with
RDAwas performed in the lsquoveganrsquo package [30] and forward selec-
tion was performed in the lsquopackforrsquo package [31] in the R statistical
programming language (v 2130 [32])
To check the robustness of our variation partitioning results
to the type of canonical analysis used we repeated the variation
ents
are
labell
edw
ithre
fere
nce
tofig
ure
1to
talfrac14
the
prop
ortio
nof
varia
tion
expl
ained
byall
spat
ialan
den
viron
men
talv
ariab
lesco
mbi
ned
riabl
es(athorn
dthorn
fthorn
g)e
nvfrac14
the
prop
ortio
nex
plain
edby
envir
onm
enta
lvar
iables
(bthorn
cthorn
dthorn
ethorn
fthorn
g)s
pacejen
vfrac14
the
pure
(dthorn
fthorn
g)e
nvjs
pacefrac14
the
pure
envir
onm
enta
lcom
pone
nt(bthorn
cthorn
e)s
oilfrac14
the
prop
ortio
nex
plain
edby
soil
varia
bles
(bthorn
dthorn
)so
iljtop
ofrac14
the
prop
ortio
nex
plain
edby
soil
after
acco
untin
gfo
rtop
ogra
phy
(bthorn
d)s
oilampt
opofrac14
the
topo
grap
hica
llystr
uctu
red
soil
ing
fors
oil(cthorn
f)
vsp
aceamp
env
envjsp
ace
soil
topo
so
iljtop
oso
ilampto
po
topo
jsoi
l
025
000
020
013
012
008
004
011
002
009
008
006
003
004
035
003
034
017
022
012
005
038
000
030
028
010
019
009
010
003
011
005
008
003
002
019
001
017
010
010
007
003
036
001
020
029
008
012
017
021
001
017
011
011
006
005
rspbroyalsocietypublishingorgProcR
SocB28020122532
4
on March 12 2014rspbroyalsocietypublishingorgDownloaded from
partitioning analysis with a distance-based RDA [33] based on
square-root transformed BrayndashCurtis distances among quadrats
Fractions of explained variation from the ordinary RDA were
compared with those from the distance-based RDA We also
checked our results for robustness to plot size Larger plots
may be expected to have a higher beta diversity owing to the
speciesndasharea relationship and they may encompass greater
environmental variation For the five 50-ha plots we compared
the variation partitioning results with those obtained from
their two 25-ha plot halves Methodological details results and
discussion of these analyses are presented in the electronic
supplementary material The relative sizes of the variation frac-
tions were found to be robust to the type of canonical analysis
used and to differences in plot size therefore only the results
of the ordinary RDA for original plot sizes are discussed here
With all constrained ordination techniques lack-of-fit of
model to data occurs because ecological data are messy and do
not perfectly match the species response model assumptions
[34] This lack-of-fit contributes to the unexplained portion of
variation and may be large (30ndash70 in simulated communities
[34]) but the size depends on the dataset Following the rec-
ommendations of Oslashkland [34] we avoid comparing the
fractions of variation explained among study sites and focus
on comparing the relative sizes of fractions of variation explained
by different variable sets within a single study site
(c) Beta diversity mapsTo produce a map of community composition within a study site
we first calculated the BrayndashCurtis distances among all 20 20 m
quadrats within a study site then this distance matrix was
subjected to non-metric multi-dimensional scaling on three ordina-
tion axes Each quadratrsquos position in three-dimensional ordination
space was then translated into an RGB colour by assigning quadrat
positions on ordination axes 1 2 and 3 to intensities of red green
and blue respectively [24] We applied the same translation from
axis position to colour intensity to all axes simultaneously so
that the variation shown by each of the colours is proportional to
the variation explained by its respective axis The red green and
blue components of each quadrat were combined to create RGB
colours that were then mapped This method of mapping commu-
nity structure displays a greater portion of community variation
than possible by displaying one species or ordination axis at a time
Tabl
e2
Varia
tion
parti
tioni
ngre
sults
fors
patia
lso
ilan
dto
pogr
aphi
cva
riabl
esC
ompo
n(athorn
bthorn
cthorn
dthorn
ethorn
fthorn
g)s
pacefrac14
the
prop
ortio
nex
plain
edby
spat
ialva
spat
ialco
mpo
nent
(a)
spac
eampen
vfrac14
the
spat
ially
struc
ture
den
viron
men
talc
ompo
nent
ethorn
g)t
opofrac14
the
prop
ortio
nex
plain
edby
topo
grap
hic
varia
bles
(cthorn
ethorn
fthorn
gco
mpo
nent
(ethorn
g)t
opojso
ilfrac14
the
prop
ortio
nex
plain
edby
topo
grap
hyaft
erac
coun
t
stud
ysit
eto
tal
spac
een
vsp
aceje
n
BCI
054
054
025
029
Huai
Kha
Khae
ng0
470
450
140
33
Khao
Chon
g0
610
570
390
22
Koru
p0
740
740
380
36
LaPl
anad
a0
320
290
130
19
Paso
h0
470
470
200
28
Sinha
raja
074
073
037
037
Yasu
ni0
500
490
220
28
3 Results(a) Niche and dispersal assemblyTotal explained variation from environmental and spatial vari-
ables together varied markedly among sites ranging from 32
per cent at La Planada to 74 per cent at Korup and Sinharaja
(table 2 refer to diagram of fractions in figure 1) Across
study sites nearly all the total explained variation was
accounted for by the spatial variables resulting in an effective
lack of pure environmental variation The proportion of vari-
ation explained by environmental variables also varied
widely from site to site from as little as 13 per cent at La
Planada to as much as 39 per cent at Khao Chong (table 2)
The proportion of variation explained by spatial variables
alone (after controlling for the effect of environmental vari-
ation) ranged from 19 to 37 similar in magnitude to the
variation explained by environmental variables
(b) Soil resource and topographic effectsThe sets of soil and topographic variables each explained a
statistically significant proportion of compositional variation
a bd
g
c
f e
spatial variables soil variables
topographic variables
Figure 1 Diagram of variation fractions for a three-way variation partitioningof the variable sets used in this study Letters correspond to those given forthe variation fractions in table 2
rspbroyalsocietypublishingorgProcR
SocB28020122532
5
on March 12 2014rspbroyalsocietypublishingorgDownloaded from
at every study site ( p 0001) Soil variables explained more
variation than topographic variables in seven of the eight
study sites (table 2) Additionally at six of the study sites
(excepting Korup and Sinharaja) the amount of additional
variation explained by soil resource variables after accounting
for topographic variables was similar to the amount
explained by topographic variables alone thus effectively
doubling the proportion of variation accounted for by the
environment
(c) Beta diversity mapsMaps of plot beta diversity are presented alongside site
elevation maps in figure 2 In the beta diversity maps quad-
rats of similar colour contain similar tree communities (lower
BrayndashCurtis dissimilarity) providing a visual interpretation
of both the turnover between any two quadrats within a
study site and the total variation in community composition
The maps for Korup and Sinharaja (figure 2bf ) where 74 per
cent of the variation in community composition is explained
by environmental and spatial variables clearly show far more
spatial structure than the La Planada map (figure 2e) where
only 32 per cent of variation is explained These maps also
reveal community responses to specific environmental fea-
tures such as the stream bed running east to west across
the Pasoh study site (figure 2c) and the swamp located
near the centre of the Barro Colorado Island study site
(figure 2a cf fig 1 in Harms et al [4])
4 DiscussionThe interpretation of the relative roles of niche and dispersal
processes is complicated by the fact that the purely spatial frac-
tion of compositional variation is attributed to the effects of
dispersal-assembly and species responses to unmeasured
environmental variation Our analysis demonstrates the impor-
tance of previously unmeasured environmental variation in
shaping community structure in tropical forests the inclusion
of soil resource data in the analysis nearly doubled the pro-
portion of variation explained by environmental variables
compared with topography alone at most sites Although the
soil and topographic variables covary neither the effect
of soil nor the effect of topography was entirely nested within
the other indicating that both soil resources and topography
have important and independent effects on community
structure in a wide variety of tropical forest communities
There is certainly still important unmeasured environ-
mental variation (ie light soil moisture and drainage) that
contributes to the community structure of these forests
Some variables such as soil moisture and drainage which
exhibit spatial variation over larger spatial scales (hundreds
of meters) may contribute to the portion of variation that is
spatially structured yet unexplained by our environmental
variable set Other important unmeasured environmen-
tal variables may exhibit spatial structure that is not
captured by the 20 20 m resolution of our study design
such as light availability which may vary dramatically over
distances less than 20 m [35] Species responses to such
environmental variables may contribute to the unexplained
portion of compositional variation along with stochasticity
in species distributions and model lack-of-fit [2234] However
our data for any one study site are among the most complete
environmental datasets for any tropical forest community
The large proportion of community variation that is spatially
structured and remains unaccounted for by either soil or
topographic variables suggests an important role for dis-
persal-assembly alongside habitat niche processes in shaping
community structure in these forests
The spatial resolution of our analysis is also expected to
affect the balance between the proportion of variation
explained by environmental and pure spatial variation [15]
and thus the inferred relative importance of habitat niche and
dispersal-assembly processes As the spatial resolution of the
analysis decreases (or quadrat size becomes larger) smaller
scale dispersal effects and environmental heterogeneity are
smoothed over causing the explanatory power of the environ-
ment to increase [15] For this analysis we chose the 20 20 m
resolution because this quadrat size best represents soil
resource variation as measured by our sampling scheme and
it is the scale at which elevation was measured Therefore
the sizes of the fractions of compositional variation that are
explained by environmental and pure spatial variation
are specific to the 20 20 m resolution of our analysis
The beta diversity maps we generated help inform the
interpretation of our variation partitioning results From
these maps one can see that the topographic signature on
community structure is strong at many of the sites even
though the set of topographic variables always accounts for
less than 30 per cent of compositional variation (figure 2
and table 2) The variable selection procedure identified
slope as the most important topographic variable at the BCI
study site explaining 34 per cent of compositional variation
(see the electronic supplementary material table S4) yet this
effect can be discerned from the RGB map (figure 2a cf fig 1
in Harms et al [4]) The four most important topographic
variables from the variable selection procedure (elevation
convexity slope and cosine of aspect) explain 96 per cent
of the community variation at the Yasuni study site (see the
electronic supplementary material table S4) and there is a
strong similarity between the beta diversity and topographic
maps for this site (figure 2d) The strongest effect of any
single environmental variable on community structure in
our study is elevation at Sinharaja explaining 147 per cent
(see the electronic supplementary material table S4) which
coincides with sharply defined features of the community
(figure 2f ) Therefore in the context of our analysis a vari-
able that explains 3 per cent of variation in community
composition may have a discernible but subtle effect on com-
munity structure whereas a variable that explains 15 per cent
Barro Colorado Island
Korup
Pasoh
Yasuni
La Planada Sinharaja
(a)
(b)
(c)
(d)
(e) ( f )
Figure 2 Beta diversity maps along with elevation maps for six of the eight study sites (a) Barro Colorado Island Panama (b) Korup Cameroon (c) PasohPenninsular Malaysia (d ) Yasuni Ecuador (e) La Planada Colombia and ( f ) Sinharaja Sri Lanka Beta diversity and elevation maps for Huai Kha Kheng and KhaoChong Thailand are in the electronic supplementary material figure S2 In elevation maps the colour scheme moves from dark green (low elevation) to white(high elevation) The colours of the community map have no absolute meaningmdashonly the colour differences between locations within the same study siteare meaningful
rspbroyalsocietypublishingorgProcR
SocB28020122532
6
on March 12 2014rspbroyalsocietypublishingorgDownloaded from
may have a very strong effect The fact that environmental
factors that appear to be quite ecologically important may
account for less than 5 per cent of compositional variation
in an RDA is unsurprising when one considers the great
deal of random noise in ecological data and the lack-of-fit
of model to data inherent in constrained ordination tech-
niques [34]
We found that the proportion of community compo-
sitional variation explained by the environment greatly
increased with the addition of soil resource variables to the
environmental variable set relative to topographic variables
alone The inclusion of a more comprehensive set of environ-
mental variables in our variation partitioning analysis shifts
our understanding of the relative importance of habitat filter-
ing and dispersal processes towards greater importance of
habitat filtering Additionally maps of beta diversity plotted
as an RGB image indicate that environmental factors that
account for a small proportion (less than 5) of compositio-
nal variation may nonetheless produce an important signal
in community structure For these reasons we argue that the
role of habitat filtering may have been underappreciated in
the past
Financial support for soils work was provided by the US NationalScience Foundation grants DEB 0211004 DEB 0211115 DEB0212284 DEB 0212818 and OISE 0314581 the soils initiative of theSmithsonian Tropical Research Institute and a CTFS grant to cover
rsp
7
on March 12 2014rspbroyalsocietypublishingorgDownloaded from
collection and extraction of soils from Korup We also thank JonathanMyers Editor Fangliang He and two anonymous reviewers for theirvaluable comments on the manuscript The tree census and
topographic data are maintained by CTFS and data enquiriesshould be made to Stuart Davies The soils data are maintained byJWD and enquires should be made to him
broyalsociet
References
ypublishingorgProcR
SocB28020122532
1 Weiher E Keddy P 1999 Ecological assembly rulesperspectives advances retreats Cambridge UKCambridge University Press
2 Chase JM Leibold MA 2003 Ecological nicheslinking classical and contemporary approachesChicago IL University of Chicago Press
3 Clark DB Clark DA Read JM 1998 Edaphic variationand the mesoscale distribution of tree species in aneotropical rain forest J Ecol 86 101 ndash 112(doi101046j1365-2745199800238x)
4 Harms KE Condit R Hubbell SP Foster RB 2001Habitat associations of trees and shrubs in a 50-haneotropical forest plot J Ecol 89 947 ndash 959(doi101111j1365-2745200100615x)
5 Potts MD Ashton PS Kaufman LS Plotkin JB 2002Habitat patterns in tropical rain forests acomparison of 105 plots in northwest borneoEcology 83 2782 ndash 2797 (doi1018900012-9658(2002)083[2782HPITRF]20CO2)
6 Phillips OL Vargas PN Monteagudo AL Cruz APZans MC Sanchez WG Yli-Halla M Rose S 2003Habitat association among Amazonian tree speciesa landscape-scale approach J Ecol 91 757 ndash 775(doi101046j1365-2745200300815x)
7 Valencia R et al 2004 Tree species distributions andlocal habitat variation in the Amazon large forestplot in eastern Ecuador J Ecol 92 214 ndash 229(doi101111j0022-0477200400876x)
8 Fine PA Daly DC Cameron KM 2005 Thecontribution of edaphic heterogeneity to theevolution and diversity of Burseraceae trees in thewestern Amazon Evolution 59 1464 ndash 1478
9 Paoli GD Curran LM Zak DR 2006 Soil nutrientsand beta diversity in the Bornean Dipterocarpaceaeevidence for niche partitioning by tropical rainforest trees J Ecol 94 157 ndash 170 (doi101111j1365-2745200501077x)
10 John R et al 2007 Soil nutrients influence spatialdistributions of tropical tree species Proc Natl AcadSci USA 104 864 ndash 869 (doi101073pnas0604666104)
11 Condit R et al 2000 Spatial patterns in thedistribution of tropical tree species Science 2881414 ndash 1418 (doi101126science28854701414)
12 Plotkin JB Potts MD Leslie N Manokaran NLaFrankie J Ashton PS 2000 Species-area curvesspatial aggregation and habitat specialization intropical forests J Theor Biol 207 81 ndash 99 (doi101006jtbi20002158)
13 Dalling JW Muller-Landau HC Wright SJ HubbellSP 2002 Role of dispersal in the recruitmentlimitation of neotropical pioneer species J Ecol 90714 ndash 727 (doi101046j1365-2745200200706x)
14 Gunatilleke CVS Gunatilleke IAUN Esufali S HarmsKE Ashton PMS Burslem DFRP Ashton PS 2006Species ndash habitat associations in a Sri Lankandipterocarp forest J Trop Ecol 22 371 ndash 384(doi101017S0266467406003282)
15 Legendre P Mi X Ren H Ma K Yu M Sun I He F2009 Partitioning beta diversity in a subtropicalbroad-leaved forest of China Ecology 90 663 ndash 674(doi10189007-18801)
16 Chuyong G Kenfack D Harms K Thomas DCondit R Comita L 2011 Habitat specificity anddiversity of tree species in an African wet tropicalforest Plant Ecol 212 1363 ndash 1374 (doi101007s11258-011-9912-4)
17 De Caceres M et al 2012 The variation of tree betadiversity across a global network of forest plotsGlobal Ecol Biogeogr 21 1191 ndash 1202 (doi101111j1466-8238201200770x)
18 Borcard D Legendre P Drapeau P 1992 Partiallingout the spatial component of ecological variationEcology 73 1045 ndash 1055 (doi1023071940179)
19 Borcard D Legendre P 1994 Environmental controland spatial structure in ecological communities anexample using oribatid mites (acari oribatei)Environ Ecol Stat 1 37 ndash 61 (doi101007BF00714196)
20 Rao CR 1964 The use and interpretation of principalcomponent analysis in applied research SankhyaaSer A 26 329 ndash 358
21 Legendre P Borcard D Peres-Neto PR 2005Analyzing beta diversity partitioning the spatialvariation of community composition data EcolMonogr 75 435 ndash 450 (doi10189005-0549)
22 Anderson MJ et al 2011 Navigating the multiplemeanings of b diversity a roadmap for thepracticing ecologist Ecol Lett 14 19 ndash 28(doi101111j1461-0248201001552x)
23 Borcard D Legendre P 2002 All-scale spatialanalysis of ecological data by means of principalcoordinates of neighbour matrices Ecol Model153 51 ndash 68 (doi101016S0304-3800(01)00501-4)
24 Thessler S Ruokolainen K Tuomisto H Tomppo E2005 Mapping gradual landscape-scale floristicchanges in Amazonian primary rain forests bycombining ordination and remote sensing Global
Ecol Biogeogr 14 315 ndash 325 (doi101111j1466-822X200500158x)
25 Condit R 1998 Tropical forest census plots methodsand results from Barro Colorado Island Panama anda comparison with other plots HeidelbergGermany Springer
26 Borcard D Legendre P Avois-Jacquet C Tuomisto H2004 Dissecting the spatial structure of ecologicaldata at multiple scales Ecology 85 1826 ndash 1832(doi10189003-3111)
27 Dray S Legendre P Peres-Neto PR 2006 Spatialmodelling a comprehensive framework for principalcoordinate analysis of neighbour matrices (PCNM)Ecol Model 196 483 ndash 493 (doi101016jecolmodel200602015)
28 Peres-Neto PR Legendre P Dray S Borcard D 2006Variation partitioning of species data matricesestimation and comparison of fractions Ecology 872614 ndash 2625 (doi1018900012-9658(2006)87[2614VPOSDM]20CO2)
29 Blanchet FG Legendre P Borcard D 2008 Forwardselection of explanatory variables Ecology 892623 ndash 2632 (doi10189007-09861)
30 Oksanan J Blanchet FG Kindt R Legendre POrsquoHara RB Simpson GL Solymos P Stevens MHHWagner H 2011 VEGAN community ecology packageR package version 117 ndash 9 See httpCRANR-projectorgpackage=vegan
31 Dray S Legendre P Blanchet G 2009 PACKFORforward selection with permutation (canoco p46)R package version 00-7r58 See httpR-ForgeR-projectorgprojectssedar
32 R Development Core Team 2011 R a language andenvironment for statistical computing ViennaAustriaL R Foundation for Statistical Computing(httpwwwR-projectorg)
33 Legendre P Anderson MJ 1999 Distance-basedredundancy analysis testing multispecies responsesin multifactorial ecological experiments EcolMonogr 69 1 ndash 24 (doi1018900012-9615(1999)069[0001DBRATM]20CO2)
34 Oslashkland RH 1999 On the variation explained byordination and constrained ordination axesJ Vegetation Sci 10 131 ndash 136 (doi1023073237168)
35 Baraloto C Couteron P 2010 Fine-scale microhabitatheterogeneity in a French Guianan forest Biotropica42 420 ndash 428 (doi101111j1744-7429200900620x)

rspbroyalsocietypublishingorgProcR
SocB28020122532
2
on March 12 2014rspbroyalsocietypublishingorgDownloaded from
interest in species-rich communities such as tropical forests
because niche partitioning is thought to facilitate species
coexistence and may therefore play an important role in bio-
diversity maintenance [12] Evidence for the role of habitat
partitioning among tropical forest tree species has been
found from local to landscape scales and comes from
observed non-random associations between species distri-
butions and environmental variables and observations of
species turnover along environmental gradients [3ndash10] How-
ever at local scales (less than 1 km2) limited dispersal also
plays an important role in determining species distributions
resulting in aggregated seedling and adult populations
[11ndash13] Disentangling the relative importance of niche and
dispersal mechanisms to local community structure is pro-
blematic because both contribute to spatial correlation in
species composition at this scale Dispersal processes lead
to spatially aggregated species distributions and therefore
spatially structured communities Additionally habitat parti-
tioning leads to spatial community structure owing to the
high spatial correlation of environmental variables
Despite substantial evidence for the importance of niche
partitioning in structuring communities surprisingly little is
known about the relative influence of different environmental
factors At local scales evidence for niche partitioning has
been based mostly on topographic variation [45714ndash17]
as topography is relatively easily measured and acts as a
useful proxy for habitat heterogeneity because it influences
water availability and soil biogeochemical processes How-
ever recently created fine-scale soil resource maps for
several tropical forest dynamics plots greatly enhance our
ability to directly examine the effects of resource variation on
tropical forest community structure In a previous analysis
using these soil maps for three neotropical forest plots John
et al [10] found that ca 30ndash40 of tree species were non-
randomly distributed with respect to soil nutrient variation
While these results indicate that soil resource variation influ-
ences the distributions of many individual species the
community-level effects of soil resource variation have not
yet been examined extensively nor has any study combined
soil resource and topographic data to examine their relative
contributions in shaping local species compositional variation
Variation partitioning [1819] via canonical redundancy
analysis (RDA [20]) provides one way to assess the relative
importance of habitat niche and dispersal-assembly pro-
cesses or of different sets of environmental variables on
community structure With variation partitioning the total
variation in community composition within a study area
(an expression of the beta diversity of the area [2122]) may
be decomposed into fractions explained by different sets of
variables (see fig 1 in Legendre et al [21]) To address the
relative contribution of habitat niche and dispersal processes
the geographical coordinates of the sampling sites may be
used to derive a set of spatial variables [23] and when
paired with environmental variables compositional variation
may be partitioned into fractions explained by pure spatial
variation pure environmental variation spatially structured
environmental variation and the unexplained remainder [21]
The component of compositional variation that is explained
by environmental variables (the pure environmental plus the
spatially structured environmental component) is generally
interpreted as resulting from species responses to measured
environmental variation whereas the component explained
by pure spatial variation is thought to result from the influence
of dispersal processes and species responses to unmeasured
environmental variation [152122]
Previous variation partitioning analyses of tropical forest
community compositional variation have used topographic
variables to estimate the contribution of the environment
[1517] The addition of soil resource measurements to such
analyses can reveal the importance of previously unmeasured
environmental variation If soil resources are relatively unim-
portant in shaping community structure or if soil resource
variation strongly covaries with topography then the pro-
portion of variation explained by the environment would
not greatly increase with the addition of soil resource vari-
ables Alternatively if soil resources exert an important
influence on community structure beyond what can be
explained by topography then in the absence of information
on soil resource variation the contribution of the environ-
ment is underestimated and the contribution of dispersal
processes is overestimated
We combine data on both topography and soil resource
variation for eight tropical forest plots to investigate the
relative contributions of spatial and total topo-edaphic vari-
ation as well as the relative contributions of topographic
and soil resource variation and the degree to which they
are redundant with one another in explaining the community
compositional variation of tropical forests By assembling a
more comprehensive battery of environmental variables we
may better resolve the relative contributions of environmental
variation and dispersal processes to tropical forest commu-
nity structure To visualize compositional variation within a
study site we adapted a technique from landscape and
regional mapping where an ordination of community compo-
sition is converted into a red-green-blue RGB image [24] We
use these lsquobeta diversityrsquo maps to inform our interpretation of
the variation partitioning results and illustrate that local habi-
tat heterogeneity may be more important to tropical forest
community structure than commonly thought
2 Material and methods(a) Study sites and environmental dataOur data come from eight long-term tropical forest dynamics
plots of the Center for Tropical Forest Science (CTFS) network
Barro Colorado Island (BCI) Panama Huai Kha Khaeng and
Khao Chong Thailand Korup Cameroon La Planada Colom-
bia Pasoh Peninsular Malaysia Sinharaja Sri Lanka and
Yasuni Ecuador The forest plots range from 24 to 50 ha in
size span a number of biogeographic regions and vary in soil
fertility and precipitation regimemdashfrom continuously wet to sea-
sonally dry Within each plot all free-standing trees larger than
1 cm dbh have been mapped identified to species and measured
for dbh according to a standard protocol [25] Plot sizes and
vegetation and soil characteristics are presented in table 1
Topographic variables consisted of elevation slope convex-
ity (the relative elevation of a quadrat with respect to its
immediate neighbours) and aspect Throughout each plot
elevation was recorded at the intersections of a 20 20 m grid
and used to calculate topographic variables at the 20 20 m
quadrat scale Mean elevation was calculated as the mean of
the elevation measurements at the four corners of a quadrat
Slope was calculated as the average slope of the four planes
formed by connecting three corners of a quadrat at a time Con-
vexity was the elevation of a quadrat minus the average elevation
of all immediate neighbour quadrats Finally aspect was the
Table 1 Study site characteristics BCI Barro Colorado Island
study sitesize(ha) forest type
no ofspecies
elevationrange (m)
soilorder soil variables used
BCI 50 semideciduous
lowland moist
298 38 oxisol Al B Ca Cu Fe K Mg Mn
N-min P Zn pH
Huai Kha
Khaeng
50 seasonal dry
evergreen
233 85 ultisol Al B Ca Cu Fe K Mg Mn
P Zn pH
Khao Chong 24 mixed evergreen 571 239 ultisol Al Ca Fe K Mg Mn P
Zn pH
Korup 50 lowland evergreen 452 95 oxisol
ultisol
Al Ca Fe K Mg Mn P Zn
La Planada 25 pluvial premontane 192 67 andisol Al Ca Cu Fe K Mg Mn
N-min P pH
Pasoh 50 lowland mixed
dipterocarp
790 24 ultisol
entisol
Al Ca Cu Fe K Mg Mn P
Sinharaja 25 mixed dipterocarp 199 145 ultisol Al Ca Fe K P pH
Yasuni 50 evergreen
lowland wet
1088 32 ultisol Al Ca Cu Fe K Mg Mn
N-min P Zn pH
rspbroyalsocietypublishingorgProcR
SocB28020122532
3
on March 12 2014rspbroyalsocietypublishingorgDownloaded from
direction of the steepest slope of a quadrat calculated in ARCMAP
v 93 (wwwesricom)
Soil samples were collected throughout each plot analysed
and the variables were kriged using comparable methods [10]
In each study site soil samples were taken at the intersections
of a 40 or 50 m grid across the study area with additional
samples taken near alternate grid points to estimate fine-scale
variation in soil variables The first 10 cm of topsoil was sampled
excluding the top organic horizon Non-nitrogen elements were
extracted with Mehlich-III solution and analysed on an atomic
emission-inductively coupled plasma (AE-ICP Perkin Elmer
Inc Massachusetts USA) with the exception of phosphorus at
the Yasuni study site which was extracted with Bray extract sol-
ution and analysed by automated colorimetry on a Quickchem
8500 Flow Injection Analyzer (Hach Ltd Loveland CO USA)
For the three neotropical study sites (BCI La Planada and
Yasuni) an estimate of the in situ N-mineralization rate was
taken at each sample location by measuring nitrogen before
and after a 28 day incubation period Nitrogen was extracted
as NHthorn4 and NO3 with 2M KCl and analysed with an auto ana-
lyzer (OI FS 3000 OI Analytical College Station TX USA)
Sample values were kriged to obtain estimated concentrations
of soil nutrients at the 20 20 m quadrat scale The set of soil
variables for each study site contained 6ndash12 variables generally
including Al Ca K Mg Mn P and pH but where available also
included the N-mineralization rate B Cu Fe and Zn (table 1)
(b) Partitioning beta diversitySpatial patterns in community compositional variation were
modelled with principal coordinates of neighbour matrices
(PCNM) according to the methods described in Borcard amp
Legendre [23] PCNM is a powerful technique that is able to
model spatial structure in a dataset at any spatial scale that can
be resolved by the sampling design (here the 20 20 m spatial
resolution) [15232627] The method for calculating PCNM
eigenfunctions [15] is briefly summarized as follows a truncated
geographical distance matrix was produced for all 20 20 m
quadrats in a study site In this matrix neighbouring quadrats
were determined using the queen criterion of contiguity (ie
each quadrat has up to eight neighbours) The geographical
distance between neighbours was retained but the distances
between all non-neighbour quadrats was replaced with a value
of four times the distance between diagonally contiguous quad-
rats A principal coordinates analysis was then performed on this
truncated geographical distance matrix and all eigenfunctions
with positive eigenvalues were retained These PCNM eigen-
functions made up the set of spatial variables used to model
spatial structure in the community data
We used canonical RDA [20] to partition the total compo-
sitional variation in a community into portions explained by
spatial soil and topographic variables at the 20 20 m scale
Throughout this study we refer to the set of soil and topographic
variables together as environmental variables Prior to analysis
we expanded the set of environmental variables according to
the method of Legendre et al [15] to increase model flexibility
adding the squared and cubed values of each variable with
the exception of aspect We included the sine and cosine of
aspect as the only aspect variables This created a set of 11 topo-
graphic variables and 18ndash36 soil variables for each study site
The proportion of variation explained by a set of variables is
given as the adjusted R2 of the explanatory variable set in the
RDA which is an unbiased estimator that corrects for the
number of variables in the set [28]
For a more detailed look at the contributions of different vari-
ables both the soil and topographic variable sets were separately
subjected to forward selection to extract the important variables
In this forward selection procedure new variables are added to
the model in order of importance using two stopping criteria
each additional variable must be significant at the a frac14 005 level
and the cumulative adjusted R2 of the variable set may not
exceed that of the adjusted R2 of the full variable set [29] The
resulting cumulative adjusted R2 values from the forward selection
procedure were nearly identical to the adjusted R2 values from
the full variable sets thus the adjusted R2 values from the full vari-
able sets were used represent the fraction of variation explained in
the variation partitioning analysis Variation partitioning with
RDAwas performed in the lsquoveganrsquo package [30] and forward selec-
tion was performed in the lsquopackforrsquo package [31] in the R statistical
programming language (v 2130 [32])
To check the robustness of our variation partitioning results
to the type of canonical analysis used we repeated the variation
ents
are
labell
edw
ithre
fere
nce
tofig
ure
1to
talfrac14
the
prop
ortio
nof
varia
tion
expl
ained
byall
spat
ialan
den
viron
men
talv
ariab
lesco
mbi
ned
riabl
es(athorn
dthorn
fthorn
g)e
nvfrac14
the
prop
ortio
nex
plain
edby
envir
onm
enta
lvar
iables
(bthorn
cthorn
dthorn
ethorn
fthorn
g)s
pacejen
vfrac14
the
pure
(dthorn
fthorn
g)e
nvjs
pacefrac14
the
pure
envir
onm
enta
lcom
pone
nt(bthorn
cthorn
e)s
oilfrac14
the
prop
ortio
nex
plain
edby
soil
varia
bles
(bthorn
dthorn
)so
iljtop
ofrac14
the
prop
ortio
nex
plain
edby
soil
after
acco
untin
gfo
rtop
ogra
phy
(bthorn
d)s
oilampt
opofrac14
the
topo
grap
hica
llystr
uctu
red
soil
ing
fors
oil(cthorn
f)
vsp
aceamp
env
envjsp
ace
soil
topo
so
iljtop
oso
ilampto
po
topo
jsoi
l
025
000
020
013
012
008
004
011
002
009
008
006
003
004
035
003
034
017
022
012
005
038
000
030
028
010
019
009
010
003
011
005
008
003
002
019
001
017
010
010
007
003
036
001
020
029
008
012
017
021
001
017
011
011
006
005
rspbroyalsocietypublishingorgProcR
SocB28020122532
4
on March 12 2014rspbroyalsocietypublishingorgDownloaded from
partitioning analysis with a distance-based RDA [33] based on
square-root transformed BrayndashCurtis distances among quadrats
Fractions of explained variation from the ordinary RDA were
compared with those from the distance-based RDA We also
checked our results for robustness to plot size Larger plots
may be expected to have a higher beta diversity owing to the
speciesndasharea relationship and they may encompass greater
environmental variation For the five 50-ha plots we compared
the variation partitioning results with those obtained from
their two 25-ha plot halves Methodological details results and
discussion of these analyses are presented in the electronic
supplementary material The relative sizes of the variation frac-
tions were found to be robust to the type of canonical analysis
used and to differences in plot size therefore only the results
of the ordinary RDA for original plot sizes are discussed here
With all constrained ordination techniques lack-of-fit of
model to data occurs because ecological data are messy and do
not perfectly match the species response model assumptions
[34] This lack-of-fit contributes to the unexplained portion of
variation and may be large (30ndash70 in simulated communities
[34]) but the size depends on the dataset Following the rec-
ommendations of Oslashkland [34] we avoid comparing the
fractions of variation explained among study sites and focus
on comparing the relative sizes of fractions of variation explained
by different variable sets within a single study site
(c) Beta diversity mapsTo produce a map of community composition within a study site
we first calculated the BrayndashCurtis distances among all 20 20 m
quadrats within a study site then this distance matrix was
subjected to non-metric multi-dimensional scaling on three ordina-
tion axes Each quadratrsquos position in three-dimensional ordination
space was then translated into an RGB colour by assigning quadrat
positions on ordination axes 1 2 and 3 to intensities of red green
and blue respectively [24] We applied the same translation from
axis position to colour intensity to all axes simultaneously so
that the variation shown by each of the colours is proportional to
the variation explained by its respective axis The red green and
blue components of each quadrat were combined to create RGB
colours that were then mapped This method of mapping commu-
nity structure displays a greater portion of community variation
than possible by displaying one species or ordination axis at a time
Tabl
e2
Varia
tion
parti
tioni
ngre
sults
fors
patia
lso
ilan
dto
pogr
aphi
cva
riabl
esC
ompo
n(athorn
bthorn
cthorn
dthorn
ethorn
fthorn
g)s
pacefrac14
the
prop
ortio
nex
plain
edby
spat
ialva
spat
ialco
mpo
nent
(a)
spac
eampen
vfrac14
the
spat
ially
struc
ture
den
viron
men
talc
ompo
nent
ethorn
g)t
opofrac14
the
prop
ortio
nex
plain
edby
topo
grap
hic
varia
bles
(cthorn
ethorn
fthorn
gco
mpo
nent
(ethorn
g)t
opojso
ilfrac14
the
prop
ortio
nex
plain
edby
topo
grap
hyaft
erac
coun
t
stud
ysit
eto
tal
spac
een
vsp
aceje
n
BCI
054
054
025
029
Huai
Kha
Khae
ng0
470
450
140
33
Khao
Chon
g0
610
570
390
22
Koru
p0
740
740
380
36
LaPl
anad
a0
320
290
130
19
Paso
h0
470
470
200
28
Sinha
raja
074
073
037
037
Yasu
ni0
500
490
220
28
3 Results(a) Niche and dispersal assemblyTotal explained variation from environmental and spatial vari-
ables together varied markedly among sites ranging from 32
per cent at La Planada to 74 per cent at Korup and Sinharaja
(table 2 refer to diagram of fractions in figure 1) Across
study sites nearly all the total explained variation was
accounted for by the spatial variables resulting in an effective
lack of pure environmental variation The proportion of vari-
ation explained by environmental variables also varied
widely from site to site from as little as 13 per cent at La
Planada to as much as 39 per cent at Khao Chong (table 2)
The proportion of variation explained by spatial variables
alone (after controlling for the effect of environmental vari-
ation) ranged from 19 to 37 similar in magnitude to the
variation explained by environmental variables
(b) Soil resource and topographic effectsThe sets of soil and topographic variables each explained a
statistically significant proportion of compositional variation
a bd
g
c
f e
spatial variables soil variables
topographic variables
Figure 1 Diagram of variation fractions for a three-way variation partitioningof the variable sets used in this study Letters correspond to those given forthe variation fractions in table 2
rspbroyalsocietypublishingorgProcR
SocB28020122532
5
on March 12 2014rspbroyalsocietypublishingorgDownloaded from
at every study site ( p 0001) Soil variables explained more
variation than topographic variables in seven of the eight
study sites (table 2) Additionally at six of the study sites
(excepting Korup and Sinharaja) the amount of additional
variation explained by soil resource variables after accounting
for topographic variables was similar to the amount
explained by topographic variables alone thus effectively
doubling the proportion of variation accounted for by the
environment
(c) Beta diversity mapsMaps of plot beta diversity are presented alongside site
elevation maps in figure 2 In the beta diversity maps quad-
rats of similar colour contain similar tree communities (lower
BrayndashCurtis dissimilarity) providing a visual interpretation
of both the turnover between any two quadrats within a
study site and the total variation in community composition
The maps for Korup and Sinharaja (figure 2bf ) where 74 per
cent of the variation in community composition is explained
by environmental and spatial variables clearly show far more
spatial structure than the La Planada map (figure 2e) where
only 32 per cent of variation is explained These maps also
reveal community responses to specific environmental fea-
tures such as the stream bed running east to west across
the Pasoh study site (figure 2c) and the swamp located
near the centre of the Barro Colorado Island study site
(figure 2a cf fig 1 in Harms et al [4])
4 DiscussionThe interpretation of the relative roles of niche and dispersal
processes is complicated by the fact that the purely spatial frac-
tion of compositional variation is attributed to the effects of
dispersal-assembly and species responses to unmeasured
environmental variation Our analysis demonstrates the impor-
tance of previously unmeasured environmental variation in
shaping community structure in tropical forests the inclusion
of soil resource data in the analysis nearly doubled the pro-
portion of variation explained by environmental variables
compared with topography alone at most sites Although the
soil and topographic variables covary neither the effect
of soil nor the effect of topography was entirely nested within
the other indicating that both soil resources and topography
have important and independent effects on community
structure in a wide variety of tropical forest communities
There is certainly still important unmeasured environ-
mental variation (ie light soil moisture and drainage) that
contributes to the community structure of these forests
Some variables such as soil moisture and drainage which
exhibit spatial variation over larger spatial scales (hundreds
of meters) may contribute to the portion of variation that is
spatially structured yet unexplained by our environmental
variable set Other important unmeasured environmen-
tal variables may exhibit spatial structure that is not
captured by the 20 20 m resolution of our study design
such as light availability which may vary dramatically over
distances less than 20 m [35] Species responses to such
environmental variables may contribute to the unexplained
portion of compositional variation along with stochasticity
in species distributions and model lack-of-fit [2234] However
our data for any one study site are among the most complete
environmental datasets for any tropical forest community
The large proportion of community variation that is spatially
structured and remains unaccounted for by either soil or
topographic variables suggests an important role for dis-
persal-assembly alongside habitat niche processes in shaping
community structure in these forests
The spatial resolution of our analysis is also expected to
affect the balance between the proportion of variation
explained by environmental and pure spatial variation [15]
and thus the inferred relative importance of habitat niche and
dispersal-assembly processes As the spatial resolution of the
analysis decreases (or quadrat size becomes larger) smaller
scale dispersal effects and environmental heterogeneity are
smoothed over causing the explanatory power of the environ-
ment to increase [15] For this analysis we chose the 20 20 m
resolution because this quadrat size best represents soil
resource variation as measured by our sampling scheme and
it is the scale at which elevation was measured Therefore
the sizes of the fractions of compositional variation that are
explained by environmental and pure spatial variation
are specific to the 20 20 m resolution of our analysis
The beta diversity maps we generated help inform the
interpretation of our variation partitioning results From
these maps one can see that the topographic signature on
community structure is strong at many of the sites even
though the set of topographic variables always accounts for
less than 30 per cent of compositional variation (figure 2
and table 2) The variable selection procedure identified
slope as the most important topographic variable at the BCI
study site explaining 34 per cent of compositional variation
(see the electronic supplementary material table S4) yet this
effect can be discerned from the RGB map (figure 2a cf fig 1
in Harms et al [4]) The four most important topographic
variables from the variable selection procedure (elevation
convexity slope and cosine of aspect) explain 96 per cent
of the community variation at the Yasuni study site (see the
electronic supplementary material table S4) and there is a
strong similarity between the beta diversity and topographic
maps for this site (figure 2d) The strongest effect of any
single environmental variable on community structure in
our study is elevation at Sinharaja explaining 147 per cent
(see the electronic supplementary material table S4) which
coincides with sharply defined features of the community
(figure 2f ) Therefore in the context of our analysis a vari-
able that explains 3 per cent of variation in community
composition may have a discernible but subtle effect on com-
munity structure whereas a variable that explains 15 per cent
Barro Colorado Island
Korup
Pasoh
Yasuni
La Planada Sinharaja
(a)
(b)
(c)
(d)
(e) ( f )
Figure 2 Beta diversity maps along with elevation maps for six of the eight study sites (a) Barro Colorado Island Panama (b) Korup Cameroon (c) PasohPenninsular Malaysia (d ) Yasuni Ecuador (e) La Planada Colombia and ( f ) Sinharaja Sri Lanka Beta diversity and elevation maps for Huai Kha Kheng and KhaoChong Thailand are in the electronic supplementary material figure S2 In elevation maps the colour scheme moves from dark green (low elevation) to white(high elevation) The colours of the community map have no absolute meaningmdashonly the colour differences between locations within the same study siteare meaningful
rspbroyalsocietypublishingorgProcR
SocB28020122532
6
on March 12 2014rspbroyalsocietypublishingorgDownloaded from
may have a very strong effect The fact that environmental
factors that appear to be quite ecologically important may
account for less than 5 per cent of compositional variation
in an RDA is unsurprising when one considers the great
deal of random noise in ecological data and the lack-of-fit
of model to data inherent in constrained ordination tech-
niques [34]
We found that the proportion of community compo-
sitional variation explained by the environment greatly
increased with the addition of soil resource variables to the
environmental variable set relative to topographic variables
alone The inclusion of a more comprehensive set of environ-
mental variables in our variation partitioning analysis shifts
our understanding of the relative importance of habitat filter-
ing and dispersal processes towards greater importance of
habitat filtering Additionally maps of beta diversity plotted
as an RGB image indicate that environmental factors that
account for a small proportion (less than 5) of compositio-
nal variation may nonetheless produce an important signal
in community structure For these reasons we argue that the
role of habitat filtering may have been underappreciated in
the past
Financial support for soils work was provided by the US NationalScience Foundation grants DEB 0211004 DEB 0211115 DEB0212284 DEB 0212818 and OISE 0314581 the soils initiative of theSmithsonian Tropical Research Institute and a CTFS grant to cover
rsp
7
on March 12 2014rspbroyalsocietypublishingorgDownloaded from
collection and extraction of soils from Korup We also thank JonathanMyers Editor Fangliang He and two anonymous reviewers for theirvaluable comments on the manuscript The tree census and
topographic data are maintained by CTFS and data enquiriesshould be made to Stuart Davies The soils data are maintained byJWD and enquires should be made to him
broyalsociet
References
ypublishingorgProcR
SocB28020122532
1 Weiher E Keddy P 1999 Ecological assembly rulesperspectives advances retreats Cambridge UKCambridge University Press
2 Chase JM Leibold MA 2003 Ecological nicheslinking classical and contemporary approachesChicago IL University of Chicago Press
3 Clark DB Clark DA Read JM 1998 Edaphic variationand the mesoscale distribution of tree species in aneotropical rain forest J Ecol 86 101 ndash 112(doi101046j1365-2745199800238x)
4 Harms KE Condit R Hubbell SP Foster RB 2001Habitat associations of trees and shrubs in a 50-haneotropical forest plot J Ecol 89 947 ndash 959(doi101111j1365-2745200100615x)
5 Potts MD Ashton PS Kaufman LS Plotkin JB 2002Habitat patterns in tropical rain forests acomparison of 105 plots in northwest borneoEcology 83 2782 ndash 2797 (doi1018900012-9658(2002)083[2782HPITRF]20CO2)
6 Phillips OL Vargas PN Monteagudo AL Cruz APZans MC Sanchez WG Yli-Halla M Rose S 2003Habitat association among Amazonian tree speciesa landscape-scale approach J Ecol 91 757 ndash 775(doi101046j1365-2745200300815x)
7 Valencia R et al 2004 Tree species distributions andlocal habitat variation in the Amazon large forestplot in eastern Ecuador J Ecol 92 214 ndash 229(doi101111j0022-0477200400876x)
8 Fine PA Daly DC Cameron KM 2005 Thecontribution of edaphic heterogeneity to theevolution and diversity of Burseraceae trees in thewestern Amazon Evolution 59 1464 ndash 1478
9 Paoli GD Curran LM Zak DR 2006 Soil nutrientsand beta diversity in the Bornean Dipterocarpaceaeevidence for niche partitioning by tropical rainforest trees J Ecol 94 157 ndash 170 (doi101111j1365-2745200501077x)
10 John R et al 2007 Soil nutrients influence spatialdistributions of tropical tree species Proc Natl AcadSci USA 104 864 ndash 869 (doi101073pnas0604666104)
11 Condit R et al 2000 Spatial patterns in thedistribution of tropical tree species Science 2881414 ndash 1418 (doi101126science28854701414)
12 Plotkin JB Potts MD Leslie N Manokaran NLaFrankie J Ashton PS 2000 Species-area curvesspatial aggregation and habitat specialization intropical forests J Theor Biol 207 81 ndash 99 (doi101006jtbi20002158)
13 Dalling JW Muller-Landau HC Wright SJ HubbellSP 2002 Role of dispersal in the recruitmentlimitation of neotropical pioneer species J Ecol 90714 ndash 727 (doi101046j1365-2745200200706x)
14 Gunatilleke CVS Gunatilleke IAUN Esufali S HarmsKE Ashton PMS Burslem DFRP Ashton PS 2006Species ndash habitat associations in a Sri Lankandipterocarp forest J Trop Ecol 22 371 ndash 384(doi101017S0266467406003282)
15 Legendre P Mi X Ren H Ma K Yu M Sun I He F2009 Partitioning beta diversity in a subtropicalbroad-leaved forest of China Ecology 90 663 ndash 674(doi10189007-18801)
16 Chuyong G Kenfack D Harms K Thomas DCondit R Comita L 2011 Habitat specificity anddiversity of tree species in an African wet tropicalforest Plant Ecol 212 1363 ndash 1374 (doi101007s11258-011-9912-4)
17 De Caceres M et al 2012 The variation of tree betadiversity across a global network of forest plotsGlobal Ecol Biogeogr 21 1191 ndash 1202 (doi101111j1466-8238201200770x)
18 Borcard D Legendre P Drapeau P 1992 Partiallingout the spatial component of ecological variationEcology 73 1045 ndash 1055 (doi1023071940179)
19 Borcard D Legendre P 1994 Environmental controland spatial structure in ecological communities anexample using oribatid mites (acari oribatei)Environ Ecol Stat 1 37 ndash 61 (doi101007BF00714196)
20 Rao CR 1964 The use and interpretation of principalcomponent analysis in applied research SankhyaaSer A 26 329 ndash 358
21 Legendre P Borcard D Peres-Neto PR 2005Analyzing beta diversity partitioning the spatialvariation of community composition data EcolMonogr 75 435 ndash 450 (doi10189005-0549)
22 Anderson MJ et al 2011 Navigating the multiplemeanings of b diversity a roadmap for thepracticing ecologist Ecol Lett 14 19 ndash 28(doi101111j1461-0248201001552x)
23 Borcard D Legendre P 2002 All-scale spatialanalysis of ecological data by means of principalcoordinates of neighbour matrices Ecol Model153 51 ndash 68 (doi101016S0304-3800(01)00501-4)
24 Thessler S Ruokolainen K Tuomisto H Tomppo E2005 Mapping gradual landscape-scale floristicchanges in Amazonian primary rain forests bycombining ordination and remote sensing Global
Ecol Biogeogr 14 315 ndash 325 (doi101111j1466-822X200500158x)
25 Condit R 1998 Tropical forest census plots methodsand results from Barro Colorado Island Panama anda comparison with other plots HeidelbergGermany Springer
26 Borcard D Legendre P Avois-Jacquet C Tuomisto H2004 Dissecting the spatial structure of ecologicaldata at multiple scales Ecology 85 1826 ndash 1832(doi10189003-3111)
27 Dray S Legendre P Peres-Neto PR 2006 Spatialmodelling a comprehensive framework for principalcoordinate analysis of neighbour matrices (PCNM)Ecol Model 196 483 ndash 493 (doi101016jecolmodel200602015)
28 Peres-Neto PR Legendre P Dray S Borcard D 2006Variation partitioning of species data matricesestimation and comparison of fractions Ecology 872614 ndash 2625 (doi1018900012-9658(2006)87[2614VPOSDM]20CO2)
29 Blanchet FG Legendre P Borcard D 2008 Forwardselection of explanatory variables Ecology 892623 ndash 2632 (doi10189007-09861)
30 Oksanan J Blanchet FG Kindt R Legendre POrsquoHara RB Simpson GL Solymos P Stevens MHHWagner H 2011 VEGAN community ecology packageR package version 117 ndash 9 See httpCRANR-projectorgpackage=vegan
31 Dray S Legendre P Blanchet G 2009 PACKFORforward selection with permutation (canoco p46)R package version 00-7r58 See httpR-ForgeR-projectorgprojectssedar
32 R Development Core Team 2011 R a language andenvironment for statistical computing ViennaAustriaL R Foundation for Statistical Computing(httpwwwR-projectorg)
33 Legendre P Anderson MJ 1999 Distance-basedredundancy analysis testing multispecies responsesin multifactorial ecological experiments EcolMonogr 69 1 ndash 24 (doi1018900012-9615(1999)069[0001DBRATM]20CO2)
34 Oslashkland RH 1999 On the variation explained byordination and constrained ordination axesJ Vegetation Sci 10 131 ndash 136 (doi1023073237168)
35 Baraloto C Couteron P 2010 Fine-scale microhabitatheterogeneity in a French Guianan forest Biotropica42 420 ndash 428 (doi101111j1744-7429200900620x)
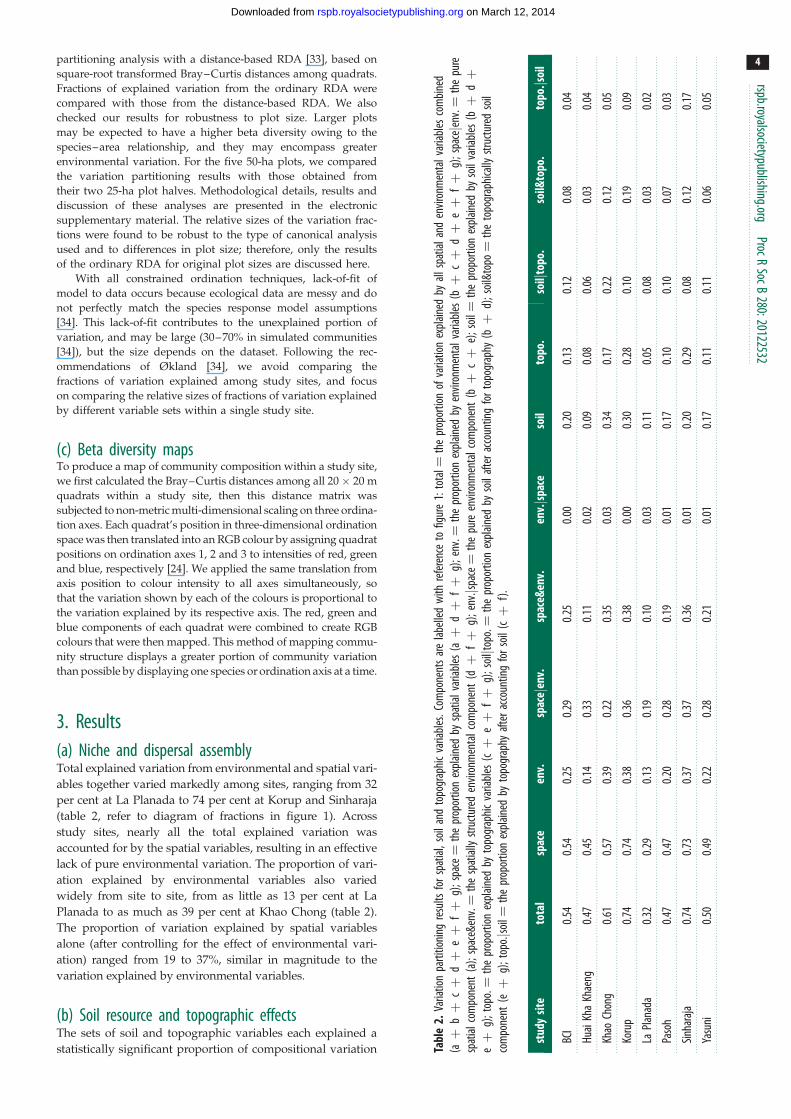