Defect analysis in crystals using X-ray topography
16
Defect Analysis in Crystals Using X-ray Topography BALAJI RAGHOTHAMACHAR,* GOVINDHAN DHANARAJ, JIE BAI, AND MICHAEL DUDLEY Department of Materials Science and Engineering, SUNYat Stony Brook, Stony Brook, New York 11794-2275 KEY WORDS dislocations; precipitates/inclusions; X-ray topography; contrast; direct dis- location image; dynamical dislocation image; synchrotron X-ray topography ABSTRACT A brief review of X-ray topography—a nondestructive method for direct observation and characterization of defects in single crystals—is presented here. The origin and development of this characterization method and the different techniques derived from it are described. Emphasis is placed on synchrotron X-ray topography and its application in studying various crystal imperfec- tions. Mechanisms of contrast formation on X-ray topographs are discussed, with emphasis on con- trast associated with dislocations. Determination of Burgers vectors and line directions of disloca- tions from analysis of X-ray topographs is explained. Contrast from inclusions is illustrated, and their differentiation from dislocations is demonstrated with the aid of simulated topographs. Con- trast arising from the deformation fields associated with cracks is also briefly covered. Microsc. Res. Tech. 69:343–358, 2006. V V C 2006 Wiley-Liss, Inc. INTRODUCTION The industrial demand for high quality single crys- tals has increased manyfold, following the inventions of the transistor and the laser that have led to a wide range of applications (Scheel, 2003). In semiconductor technology, the increasing density of devices on individ- ual integrated circuits requires a high level of homoge- neity in chemical composition and structural perfection in crystals (Claeys and Deferm, 1993). The presence of imperfections in crystals used in solid state lasers, including semiconductor lasers, nonlinear and electro- optical devices, negatively impacts their reliable opera- tion (Hurle, 1994). The study of such imperfections or defects is also important from the point of view of understanding the influence of imperfections on crys- tal-growth processes, and conversely, feedback can be used to develop higher quality crystals (Dhanaraj et al., 1991). Hence, it is essential for process engineers and crystal growers to characterize and have knowl- edge of the amount, distribution, and nature of defects present in crystals. Even though there are several techniques based on optical, electron, and atomic force microscopy or X-ray imaging to reveal dislocations and other defects, none of these methods are ideal. These characterization methods have different ranges of capabilities and limitations, and hence should nor- mally be used complementarily. However, compared to all other techniques, X-ray topography is powerful enough to image extended defects in the entire volume of the crystal, and in some cases, in wafers with devices fabricated on them. The capability of this technique to image both defects, intersecting the wafer surface as well as those located in the bulk, combines features specific to chemical etching and transmission electron microscopy (TEM), respectively. Using synchrotron ra- diation, the X-ray topography technique can be applied to study large wafers up to 300 mm diameter (Kawado et al., 2002), crystal plates, and even as-grown boules weighing several kilograms (Raghothamachar B, Chen H, and Dudley M, 1998, unpublished results). Pres- ently, X-ray topography has become a very important tool in fundamental research as well as in industrial applications, and the details are described in recent lit- erature (Dhanaraj et al., 2003; Dudley and Huang, 2003). X-ray topography is the general term for a family of X-ray diffraction imaging techniques, which is capable of providing information on the nature and distribution of structural defects in single crystal materials. The complete name ‘‘X-ray diffraction topography’’ is a little more informative, indicating that this technique is con- cerned with the topography of the internal diffracting planes, i.e., local changes in spacing and rotations of these planes, rather than with external surface topog- raphy. Even though the name ‘‘X-ray topography’’ does not articulate the correct meaning of the technique, it is commonly used by researchers, perhaps for conven- *Correspondence to: Balaji Raghothamachar, Department of Materials Science and Engineering, SUNY at Stony Brook, Stony Brook, NY 11794-2275, USA. E-mail: [email protected] Received 11 March 2005; accepted in revised form12 May 2005 Contract grant sponsor: Defense Advanced Research Projects Agency (DARPA)/ Air Force Research Laboratory (Wright-Patterson, AFB); Contract grant number: F33615-95-C-5426; Contract grant sponsor: US Army Research Office; Contract grant numbers: DAAH04-94-G-0091, DAAH04-94-G-0121, DAAG55-98-1-0392, DAAG55-98-1-0392, and DAAD190110688 (monitored by Dr. J. Prater), and DARPA Order E111/3 (monitored by Dr. D. Radack); Contract grant sponsor: NASA; Contract grant numbers: NAS8-38147, NAG8-891, NCC8-53, NCC8-48, and NCC8-164; Contract grant sponsor: Universities Space Research Associa- tion; Contract grant numbers: 3536-03, 3537-04; Contract grant sponsor: DARPA/Air Force Office of Scientific Research (AFOSR) Consortium of Crystal Growth Research; Contract grant number: F496209510407; Contract grant spon- sor: National Science Foundation; Contract grant number: DMR9903702 (sub- contract 54406855242); Contract grant sponsor: ONR; Contract grant numbers: N0001140010348, N000140110302, and N000140211014 (contract monitor Dr. Colin Wood); Contract grant sponsor: U.S. Department of Energy; Contract grant number: DE-AC02-76CH00016. DOI 10.1002/jemt.20290 Published online in Wiley InterScience (www.interscience.wiley.com). V V C 2006 WILEY-LISS, INC. MICROSCOPY RESEARCH AND TECHNIQUE 69:343–358 (2006)
-
Upload
independent -
Category
Documents
-
view
0 -
download
0
Transcript of Defect analysis in crystals using X-ray topography

Defect Analysis in Crystals Using X-ray TopographyBALAJI RAGHOTHAMACHAR,* GOVINDHAN DHANARAJ, JIE BAI, AND MICHAEL DUDLEYDepartment of Materials Science and Engineering, SUNYat Stony Brook, Stony Brook, New York 11794-2275
KEY WORDS dislocations; precipitates/inclusions; X-ray topography; contrast; direct dis-location image; dynamical dislocation image; synchrotron X-ray topography
ABSTRACT A brief review of X-ray topography—a nondestructive method for direct observationand characterization of defects in single crystals—is presented here. The origin and development ofthis characterization method and the different techniques derived from it are described. Emphasis isplaced on synchrotron X-ray topography and its application in studying various crystal imperfec-tions. Mechanisms of contrast formation on X-ray topographs are discussed, with emphasis on con-trast associated with dislocations. Determination of Burgers vectors and line directions of disloca-tions from analysis of X-ray topographs is explained. Contrast from inclusions is illustrated, andtheir differentiation from dislocations is demonstrated with the aid of simulated topographs. Con-trast arising from the deformation fields associated with cracks is also briefly covered. Microsc. Res.Tech. 69:343–358, 2006. VVC 2006 Wiley-Liss, Inc.
INTRODUCTION
The industrial demand for high quality single crys-tals has increased manyfold, following the inventionsof the transistor and the laser that have led to a widerange of applications (Scheel, 2003). In semiconductortechnology, the increasing density of devices on individ-ual integrated circuits requires a high level of homoge-neity in chemical composition and structural perfectionin crystals (Claeys and Deferm, 1993). The presence ofimperfections in crystals used in solid state lasers,including semiconductor lasers, nonlinear and electro-optical devices, negatively impacts their reliable opera-tion (Hurle, 1994). The study of such imperfections ordefects is also important from the point of view ofunderstanding the influence of imperfections on crys-tal-growth processes, and conversely, feedback can beused to develop higher quality crystals (Dhanarajet al., 1991). Hence, it is essential for process engineersand crystal growers to characterize and have knowl-edge of the amount, distribution, and nature of defectspresent in crystals. Even though there are severaltechniques based on optical, electron, and atomic forcemicroscopy or X-ray imaging to reveal dislocations andother defects, none of these methods are ideal. Thesecharacterization methods have different ranges ofcapabilities and limitations, and hence should nor-mally be used complementarily. However, compared toall other techniques, X-ray topography is powerfulenough to image extended defects in the entire volumeof the crystal, and in some cases, in wafers with devicesfabricated on them. The capability of this technique toimage both defects, intersecting the wafer surface aswell as those located in the bulk, combines featuresspecific to chemical etching and transmission electronmicroscopy (TEM), respectively. Using synchrotron ra-diation, the X-ray topography technique can be appliedto study large wafers up to 300 mm diameter (Kawadoet al., 2002), crystal plates, and even as-grown boules
weighing several kilograms (Raghothamachar B, ChenH, and Dudley M, 1998, unpublished results). Pres-ently, X-ray topography has become a very importanttool in fundamental research as well as in industrialapplications, and the details are described in recent lit-erature (Dhanaraj et al., 2003; Dudley and Huang,2003).
X-ray topography is the general term for a family ofX-ray diffraction imaging techniques, which is capableof providing information on the nature and distributionof structural defects in single crystal materials. Thecomplete name ‘‘X-ray diffraction topography’’ is a littlemore informative, indicating that this technique is con-cerned with the topography of the internal diffractingplanes, i.e., local changes in spacing and rotations ofthese planes, rather than with external surface topog-raphy. Even though the name ‘‘X-ray topography’’ doesnot articulate the correct meaning of the technique, itis commonly used by researchers, perhaps for conven-
*Correspondence to: Balaji Raghothamachar, Department of Materials Scienceand Engineering, SUNYat Stony Brook, Stony Brook, NY 11794-2275, USA.E-mail: [email protected]
Received 11 March 2005; accepted in revised form12 May 2005
Contract grant sponsor: Defense Advanced Research Projects Agency (DARPA)/Air Force Research Laboratory (Wright-Patterson, AFB); Contract grant number:F33615-95-C-5426; Contract grant sponsor: US Army Research Office; Contractgrant numbers: DAAH04-94-G-0091, DAAH04-94-G-0121, DAAG55-98-1-0392,DAAG55-98-1-0392, and DAAD190110688 (monitored by Dr. J. Prater), andDARPA Order E111/3 (monitored by Dr. D. Radack); Contract grant sponsor:NASA; Contract grant numbers: NAS8-38147, NAG8-891, NCC8-53, NCC8-48,and NCC8-164; Contract grant sponsor: Universities Space Research Associa-tion; Contract grant numbers: 3536-03, 3537-04; Contract grant sponsor:DARPA/Air Force Office of Scientific Research (AFOSR) Consortium of CrystalGrowth Research; Contract grant number: F496209510407; Contract grant spon-sor: National Science Foundation; Contract grant number: DMR9903702 (sub-contract 54406855242); Contract grant sponsor: ONR; Contract grant numbers:N0001140010348, N000140110302, and N000140211014 (contract monitor Dr.Colin Wood); Contract grant sponsor: U.S. Department of Energy; Contract grantnumber: DE-AC02-76CH00016.
DOI 10.1002/jemt.20290
Published online inWiley InterScience (www.interscience.wiley.com).
VVC 2006 WILEY-LISS, INC.
MICROSCOPY RESEARCH AND TECHNIQUE 69:343–358 (2006)

ience or as a continuation from its first usage in earlyliterature (Ramachandran, 1944). This technique isusually nondestructive and suitable for studying singlecrystals of large cross-section, with thickness rangingfrom hundreds of microns to several millimeters. It issuperior to the complementary TEM technique inimaging the entire crystal and displaying the defects,particularly at dislocation densities lower than 104 mm�2.In X-ray diffraction topography, a collimated area-fillingribbon of X-rays is incident on the single crystal sample ata set Bragg angle, and the corresponding area-filling dif-fracted beam is projected onto a high resolution X-ray filmor detector. The two-dimensional diffraction spot thusobtained constitutes an X-ray topograph, and it preciselydisplays the variation of the diffracted intensity as a func-tion of position, depending upon the local diffractingpower as well as the prevailing overall diffraction condi-tions. Local diffracting power is affected by the distortedregions surrounding a defect, leading to differences inintensities between these regions and the surroundingmore perfect regions. This intensity variation gives rise tocontrast and different defect types, as can be character-ized from the specific contrast produced by the way theydistort the local crystal lattice, and thereby the local dif-fracting power. The absence of magnification enables thecorrelation of the relative position of the image of a defect,with its location inside the crystal. Quantitative informa-tion, such as the line direction and Burgers vector of a dis-location, can be obtained by detailed interpretation of thevariations in contrast, obtained under different diffractionconditions. Such interpretation requires an understand-ing of the mechanisms of contrast formation. These mech-anisms are sensitive functions of the diffraction conditionsand are derived from the kinematical and dynamical theo-ries of X-ray diffraction (Authier, 1978).
BASIC PRINCIPLES OF X-RAY TOPOGRAPHYContrast
In general, the individual spots obtained from Lauediffraction patterns from crystals do not have uniformcontrast. The localized variations in the intensitywithin any individual diffracted spot arise from thedeviations in structural uniformity in the lattice planescausing the spot, and this forms the basis for the X-raytopographic technique. The real information availablein an X-ray topograph is manifested in the form of con-trast, within the projected diffraction spot. This topo-graphic contrast arises from differences in the inten-sity of the diffracted beam as a function of spatial coor-dinate inside the crystal. The diffracted intensity is asensitive function of local crystal perfection. For exam-ple, under the correct diffraction conditions, highlymosaic regions of a crystal (i.e., those regions compris-ing small subgrains which are slightly tilted withrespect to the perfect crystal) will diffract kinemati-cally, whereas nearly perfect regions of the crystal willdiffract dynamically. Kinematical diffraction is charac-terized by an absence of the primary extinction effects,which are the essence of dynamical diffraction. Theseprimary extinction effects, created by the interferencebetween diffracted waves and incident waves insidethe crystal, lead to an overall reduction in diffracted in-tensity for a perfect crystal over the mosaic crystal.
Conversely, there is an increase in diffracted intensityas the degree of mosaicity increases, eventually reach-ing the limit of the ‘‘ideally imperfect crystal’’ (White,1950). The difference between the intensities diffractedfrom one region of the crystal which diffracts kinemati-cally, and another which diffracts dynamically is one ofthe ways through which dislocations can be renderedvisible in topography. However, the situation is not assimple as stated here. Even for a crystal which diffractsdynamically, the diffracted intensity is a sensitive func-tion of the local distortion in the crystal. In addition,the type of contrast, which arises from a particulartype of distortion, is also a function of the absorptionconditions in the crystal. The effects of such condi-tions on contrast mechanism will be discussed underthe Section ‘‘Interpretation of X-ray Topographs,’’ withemphasis on mechanisms that give rise to dislocationimages.
Resolution
The contrast from individual defects will only beclearly discernible if the spatial resolution is adequate.There is no magnification involved in topography, andspatial resolution is controlled solely by geometricalfactors. The Bragg Law is defined as follows:
k ¼ 2d sin hB ð1Þ
where k is the X-ray wavelength, d is the spacingbetween the diffracting planes, and hB is the Braggangle, which is the angle between the incident raysand the diffracting planes. When the Bragg conditionis satisfied, possible incident and diffracted beam direc-tions lie, diametrically opposed, on the surface of a conewith a semiapex angle 90 � hB, the axis of which is theactive reciprocal lattice vector, g (i.e., the normal to thediffracting planes). Therefore, if an X-ray source has afinite size, which it always does, the possibility arisesthat at a given point in the crystal the diffractingplanes will receive radiation, at the correct Braggangle, from several different points located at differentpositions on the source (which produce rays lying onthe surface of the Bragg cone). The locus of these pointson the source is the arc defined by the intersectionbetween the operative Bragg cone and the source sur-face. This acceptance of rays with a finite verticaldivergence imparts a finite vertical divergence to thediffracted beam, which emanates from the point of in-terest in the crystal, and hence gives rise to a blurringeffect in the resultant ‘‘image’’ of the point. In fact, thediffracted rays emanating from the point of interest inthe crystal will lie on the arc defined by the intersec-tion between the same Bragg cone and the detectorplane (the length of this arc will, of course, be definedby the divergence angle of the accepted rays from thearc on the source). This is illustrated in Figure 1, whichshows how an image of a point P in the crystal,recorded with rays that emanate from points lying onthe arc abc on the source and is spread over the arca0b0c0 on the detector. Therefore, the angle subtendedby the longest dimension of the source in the directionperpendicular to the plane of incidence (defined by theincident and diffracted beam directions, and the active
344 B. RAGHOTHAMACHAR ET AL.

reciprocal lattice vector) is the crucial parameter,which should be minimized. The amount of blurring isproportional to the distance between the crystal anddetector, and can be approximately written as follows:
R ¼ SD
Cð2Þ
where R is the blurring (or the effective resolution),S is the maximum source dimension in the directionperpendicular to the plane of incidence, D is the speci-men-film distance, and C is the source specimen dis-tance. In the plane of incidence, diffraction occurs overa finite range of angles, determined by acceptanceangle of the crystal in that plane or the rocking curvewidth. This finite acceptance angle means that a givenpoint in the crystal receives radiation from a finitewidth on the source (for the case of a horizontal planeof incidence). This width can be determined by back-projecting the fan of incident rays accepted at a pointin the crystal to the source itself. Again a finite di-vergence, this time in the horizontal plane, can beattributed to the diffracted beam, and again a blurringeffect will be evident. However, as can be verified bysimple calculation, the limiting factor in determiningspatial resolution is the finite source height (i.e., thesource dimension perpendicular to the incidence plane),rather than the finite effective source width (i.e., thedimension parallel to the incidence plane).
Since the spatial resolution is proportional to the dis-tance between the crystal and detector, this distanceshould be minimized. However, the optimum spatialresolution of the photographic detectors typically uti-lized in topography is limited, by photoelectron track-ing between adjacent grains in the emulsion of thefilm, to around 1 lm. The specimen-film distance isusually set to yield a calculated spatial resolution, whichapproximately coincides with this. It should be notedthat while this spatial resolution is greatly inferior tothat of electron microscopy, it is more than sufficientfor the high quality crystals of many materials cur-rently grown.
CONVENTIONAL X-RAYTOPOGRAPHIC TECHNIQUES
Even though the first topographic image of a singlecrystal was recorded as early as 1931 (Berg, 1931), thereal potential of the technique was understood only in1958 when Lang (1958) demonstrated the imaging ofindividual dislocations in a silicon crystal. Differenttopographic geometries were developed independentlyduring this period. There are three main types of X-raytopographic geometries for studying defects, i.e., (1)the Berg–Barrett reflection technique (Barrett, 1945;Berg, 1931), (2) the double-crystal technique (Bond andAndrus, 1952), and (3) the Lang technique (Lang, 1958)and its variant—the scanning oscillator technique(Schwuttke, 1965).
In 1931, Berg carried out X-ray diffraction imagingon crystal surfaces using characteristic radiation, fall-ing at a very low angle to the crystal surface, andobtained point-to-point variation of the reflected inten-sity, resulting in a striated image on a photographicplate placed near the crystal. The striated images pro-duced were attributed to plastic deformation in thecrystals. Even though it was realized that X-rays couldbe used as a powerful tool for studying inhomogeneitiesin crystals, no further attempt was made to use thistool, until Barrett (1945) recorded defect structureimages from single crystals of silicon ferrite. Barrettimproved Berg’s reflection technique, by minimizingthe distance between the crystal and photographicemulsion plate, and also by using fine grain high-re-solution X-ray film. This technique is commonly knownas Berg–Barrett reflection topography, and is used tostudy large-size crystals. Wooster and Wooster (1945)obtained topographic images, revealing the defectstructure from diamond surfaces, using characteristiccopper radiation. With further improvement in thistechnique, Newkirk (1958) showed that individual dis-locations could be resolved, and their Burgers vectorscould be experimentally determined. The Schulz tech-nique (Schulz, 1954) is another reflection topographictechnique that uses white radiation from a point focusX-ray generator. The divergent X-ray beam diffractedby the crystal is recorded on a film. The white beamensures diffraction from all the misoriented regionsin the crystal. This simple technique can be used toquickly reveal misorientations in the form of separa-tions and overlaps in the image.
Bond and Andrus (1952) have developed a high-reso-lution double-crystal technique for studying structuralimperfections on the habit faces of natural quartz crys-tals. In this technique, X-rays from a line focus sourceare Bragg-reflected from a highly perfect monochro-mator crystal, and then diffracted from the specimencrystal in either reflection or transmission mode. Highsensitivity is achieved in this technique, because thefirst crystal further narrows the divergence of the slit-collimated beam, which subsequently probes the speci-men crystal. This technique is highly sensitive to lat-tice misorientations: lattice tilts and lattice parameterchanges, down to 10�8, can be detected. The sensitivitycan be increased further by introducing another mono-chromator or beam conditioner crystal, and rockingcurve measurements can also be carried out to assessthe crystal quality.
Fig. 1. Schematic diagram showing the effect of finite sourcedimension on resolution. g is the active reciprocal lattice vector. Theangle bPg, which is the semiapex angle of the Bragg cone, is 908�hB,where hB is the Bragg angle.
345DEFECT ANALYSIS IN CRYSTALS

Ramachandran (1944) studied cleaved plates of dia-mond crystals, using a white X-ray beam from a tung-sten target in the transmission Laue geometry. He wasthe first to use the term ‘‘X-ray topograph,’’ to describethe image contrast of full-size diffracted spots. TheLaue spots were recognized as a topographic map ofthe crystal plate, exhibiting variations in structure. Hefelt that the X-ray topographic technique might pro-vide information on lattice perfection, and comparedthe topographs with luminescence images. The term‘‘X-ray topograph’’ became established in the literaturewhen Wooster and Wooster (1945) used the same termin describing diffraction images obtained from diamondsurfaces revealing the defect structure. Guinier andTennevin (1949) studied both orientation and extinctioncontrast effects in aluminum in transmission mode,using polychromatic X-ray beam. Tuomi et al. (1974)used a similar geometry and performed the first X-raytopography experiments using synchrotron radiation onsilicon samples.
Important developments in X-ray topography tookplace between 1957 and 1958, when Lang developed atransmission technique to image the defects in crystals(Lang, 1957, 1958). He examined crystal sections usinga narrow collimated characteristic radiation beam, atechnique that is referred to as section topography.Linear and planar defects could be mapped with thistechnique, by translating the specimen to known posi-tions and taking a series of section topographs. Usingthis technique, low angle boundaries in melt-grownmetallic crystals were imaged (Lang, 1957). By incor-porating a linear traverse mechanism to translate thecrystal plate and the film cassette synchronously, Langwas able to image individual dislocations in an entiresilicon crystal sample, using projection topography; amilestone in the field of X-ray topography. In the Langtechnique (Fig. 2), an incident beam of narrow width
and low horizontal divergence (about 4–5 arc min) isobtained using a slit. The secondary slit, placed on theother side of the sample, blocks the direct beam whileallowing the diffracted beam to pass through. It is pos-sible to obtain an image on the film using Ka1 only.This technique can permit up to 1 lm resolution underoptimized conditions. Coincidentally, during the sameyear, individual dislocations in silicon as well as ger-manium crystals were imaged by Newkirk (1958),using the Berg–Barrett technique, and by Bonse andKappler (1958) using double-crystal topography, re-spectively. The tremendous development in X-raytopography during this period, leading to resolvingindividual dislocations, was due to the better quality ofsemiconductor crystals, such as silicon and germanium,which were becoming available due to improved crys-tal-growth technology. After Lang’s work (1957, 1958)in imaging of individual dislocations, X-ray topographyhas become an important quality control tool for as-sessment of semiconductor wafers, before and afterdevice fabrication. However, using this technique it isdifficult to record topographs of crystals having elasticstrains. Using the scanning oscillator technique devel-oped by Schwuttke (1965), it is possible to record trans-mission topographs of large-size wafers up to 150 mmin diameter, containing appreciable amount of elasticor frozen-in strain. This technique is based on the Langtechnique, with the provision to oscillate the crystaland film simultaneously when the crystal is scanned(Fig. 3). The oscillation is chosen to cover the wholereflecting range of the crystal, to obtain the completeimage of the crystal. This technique was widely used toimage dislocations in transmission mode in large-sizesilicon wafers.
In general, the reflection topograph geometry isemployed for thick crystals or when absorption condi-tions or defect densities are too high to permit the useof transmission geometry. Only defects within a certaindepth below the surface are recorded in the reflectiongeometry. This depth is determined by the absorptionand extinction of X-rays. This is useful for the charac-terization of surface defect structures within semi-conductor heterostructures and epitaxial thin films. Intransmission topography, all the defects within the
Fig. 2. Schematic diagram of the Lang projection technique. Thetopograph image due to Ka1 alone is recorded on the film. The second-ary slit blocks the direct beam while allowing the diffracted beam topass through. Crystal and the film are translated synchronously, andthe whole image of the crystal is recorded.
Fig. 3. Schematic representation of the scanning oscillator tech-nique. The crystal and the film cassette are oscillated while they aresynchronously scanned.
346 B. RAGHOTHAMACHAR ET AL.

crystal volume are recorded, provided the absorption islow enough to permit sufficient transmission throughthe crystal. The back-reflection technique, commonlyused for orienting single crystals, can also be used torecord X-ray topographs of crystals containing specificdefects, such as superscrew dislocations (micropipes)in SiC (Dudley et al., 1995). The grazing Bragg–Lauegeometry (Dudley et al., 1989) can be used for depthprofiling studies of epitaxial thin films.
Although photographic films continue to be the de-tectors of choice for recording X-ray topographs, largearea charge coupled device (CCD) detectors can be usedwhen high resolution is not paramount. Nuclear emul-sions (Ilford plates), which have a grain size below 1lm, are the best materials to record X-ray topographs,but they are expensive and require special handling anddeveloping procedures. Single-side coated high resolu-tion X-ray films (Kodak SR-45, Fuji IX20, etc.), whichhave a grain size of the order of 1 lm, are usuallyadequate for recording most X-ray topographs. Thesehave sufficient contrast and resolution, and can bedeveloped fast enough to allow real-time observationand feedback for recording multiple topographs. CCDdetectors are used instead of films, when quick imagingis needed in some dynamic studies; however, the resultsare somewhat limited because of the poor resolution(25–40 lm).
SYNCHROTRON RADIATION TECHNIQUES
The advent of dedicated sources of synchrotron radi-ation has enabled the development of a new realm oftopography known as synchrotron topography. It hasnumerous advantages over conventional radiation tech-niques. These advantages derive from the high bright-ness, tunability, and natural collimation of synchrotronradiation.
One of the most important synchrotron topographictechniques developed is white radiation topography(Tuomi et al., 1974; Miltat, 1980). This technique is ba-sically analogous to the Laue transmission technique,except with greatly enhanced capabilities, which derivefrom the aforementioned natural collimation and highintensity of the synchrotron beam. The natural colli-mation (typically �2 3 10�4 rad in the vertical planecoupled with an acceptance angle of typically a few
milliradians in the horizontal plane) allows the use ofvery long beamlines (�25 m) to maximize the area ofthe beam delivered at the sample, without incurringsignificant losses in the total intensity originally avail-able at the tangent point. This situation contrasts withthat which would hold for the isotropic emission from aconventional source. The large beam area delivered atthe sample location allows studies to be carried out onrelatively large scale single crystals, and crystals aslarge as 150 mm or even 300 mm in diameter can beimaged by using precision translation stages, similarto those used in the Lang technique (although exposuretimes are much shorter). Long beamlines also lead tosmall angles subtended by the source at points in thespecimen, which in turn leads to excellent geometricalresolution capabilities. For example, at the Stony BrookTopography Station, on beamline X-19C at the NationalSynchrotron Light Source, the optimum theoreticallyattainable spatial resolution is �0.04 lm per centimeterof specimen-film distance.
If a single crystal is oriented in the beam, and thediffracted beams are recorded on a photographic detec-tor, each diffraction spot on the resultant Laue patternwill constitute a map of the diffracting power from aparticular set of planes as a function of position in thecrystal, with excellent point-to-point resolution (typi-cally of the order of less than 1 lm). In other words,each diffraction spot will be an X-ray topograph (seeFigs. 4a and 4b). The excellent geometrical resolutioncapability has another important consequence, since itrelaxes to a certain extent the requirement of havingvery small specimen-film distances (<1 cm) so as toachieve good resolution. Thus, crystals can be surroundedwith elaborate environmental chambers, necessitatingconsiderable increases in specimen detector distances(which would lead to intolerable resolution losses inconventional systems), without significant loss of reso-lution. The high intensity over the wide spectral rangeof the radiation emitted has several important advan-tages. Not only are exposure times necessary to recorda topograph drastically reduced from the order ofdays on conventional systems to seconds on a synchro-tron, but since we have a white beam, a multiplicityof images is recorded simultaneously (see Fig. 4c).This leads to a great enhancement in the rate of data
Fig. 4. (a) Schematic diagramof the white-beam diffraction pat-tern recorded in (a) transmissiongeometry, and (b) back-reflectiongeometry. (c) Actual transmissionX-ray diffraction pattern recordedfrom a (0001) AlN single crystal ona SR-45 8 3 10 inch X-ray film.
347DEFECT ANALYSIS IN CRYSTALS

acquisition. The multiplicity of images also enablesextensive characterization of strain fields present inthe crystal. For example, instantaneous dislocationBurgers vector analysis can become possible by com-parison of dislocation images obtained on several dif-ferent Laue spots. Similarly, lattice rotation in thespecimen can be characterized by analysis of the aster-ism (the spreading of a Laue spot), observed on severaldifferent Laue spots. In addition, the good signal-to-noise ratios obtained associated with the high intensityalso open up the possibility of direct imaging of topo-graphs. Thus, it becomes possible to conduct trulydynamic, quasi real-time studies of crystals, subjectedto some kind of external stimulus, such as appliedfields, applied stress, heating, cooling, etc.
Synchrotron topography can also be used to imagethe surfaces of the as-grown boules or large-size crystalplates in reflection geometry. It can reveal the overalldistribution of defects and distortion around the cylin-drical surface of these crystals. Investigating as-grownboules enables observation of the true microstructuresand striations developed during growth, and it cansubstantially reduce time and process costs in cuttingand polishing. Figure 5 shows reflection topographicimages recorded from an as-grown large-size boule,grown using Czochralski pulling. Topographs could berecorded covering the entire length of the boule instrips, using the synchrotron beam. A series of sequen-tial topographs could be recorded by suitably rotatingalong the axis of the boule. It is possible to reconstructthe defect map around the boule, revealing certaininhomogeneities, such as striations and inclusions.
Synchrotron X-ray topography in the reflection ge-ometry can also be used to examine substrate/epilayersystems that have devices fabricated upon them. Thefeatures that make up the device topology typicallyprovide contrast on X-ray topographs. The contrastusually originates from the strain experienced by thecrystal at the edges of growth mesas or metallizationlayers, although some absorption contrast may alsosuperimpose on this. Topographs recorded from suchstructures provide an image of the defect microstruc-ture superimposed on the backdrop of the device topol-ogy. Direct comparisons can be drawn between the per-formance of specific devices and the distribution ofdefects within their active regions. This has made itpossible to determine the influence of threading screwdislocations (closed and hollow-core) on device perform-ance (Neudeck et al., 1998, 2000). The back-reflectiongeometry is particularly useful here, since it gives aclear image of the distribution of screw dislocationson the background-device topology, which is imagedwith sufficient clarity to unambiguously identify thedevice. An example of a back-reflection image recordedfrom a crystal, with devices fabricated on it, is shownin Figure 6.
Another important advantage of the white-beamtopographic technique over conventional topographictechnique is its enhanced tolerance of lattice distortion.The wide spectrum available in the synchrotron beamallows crystals, which either exhibit a uniform range oflattice orientation (for example are uniformly bent by asmall amount) or which contain several regions of dis-tinctly different orientation (for example contain sub-grains, grains, or twinned regions) or regions of differ-
ent lattice parameter (for example contain more thanone phase or polytype), to be imaged in a single expo-sure. Analysis of Laue spot shape or Laue spot aster-ism (the deviation from the shape expected from anundistorted crystal) enables quantitative analysis oflattice rotation. Simultaneous measurement of the var-iation in diffracted wavelength as a function of positionin the Laue spot, for example, using a solid state detec-tor, also enables determination of any variation in dspacing of the particular diffracting planes. For thosecrystals which contain several regions of distinctly dif-ferent orientations, the so-called orientation contrast
Fig. 5. (a) Series of synchrotron X-ray topographs recorded from asection of the cylindrical surface of a langatate single crystal boule,shown along with an optical picture of the corresponding section. (b)Magnified topograph showing the defects observed (K, striations; P,precipitate/inclusion; A, surface artifacts).
348 B. RAGHOTHAMACHAR ET AL.

becomes evident, whereby the two neighboring regionsof crystal, separated by the boundary (twin boundaryor grain boundary, for example), give rise to diffractedbeams which travel in different directions in space,leading to image shifts on the detector. Analysis of thedirections of these diffracted beams from the measuredimage shifts can enable the orientation relationshipsbetween the two regions of crystal to be established,leading to, for example, the determination of twin laws.An example of a diffraction pattern recorded from anominally (111) CdZnTe single crystal containing twinsis shown in Figure 7. Detailed analysis of the orienta-tion relationships between the segments of the variousdiffraction spots enables the twin operation to bedefined as a 1808 rotation about [1�11].
By comparison, in the conventional topographic case,the maximum tolerable range of misorientation isdefined by the convolution of characteristic line widthwith the beam divergence. Since both of these quanti-ties are small (typical line widths are of the order of10�3 A, equivalent to an angular divergence of �100arc seconds, and typically, beam divergences must beless than �20 arc seconds so as to obtain the necessaryangular resolution in the plane of incidence), misorien-
tations greater than a few arc seconds lead to the situa-tion, where only a part of the crystal fulfils the diffract-ing condition at a given time. In other words, Braggcontours are produced. These contours delineate thoseregions of the crystal, which are in the diffracting con-dition from those which are not. Since their presencemeans that there are regions not set for diffractioneffectively, there are blind spots in the crystal. Clearly,this is a very undesirable situation if dynamic typestudies in large single crystals are to be conducted.Similar problems are encountered in monochromaticsynchrotron radiation topography.
Contrast mechanisms operative in white beam to-pography are largely similar to those which are opera-tive in Lang topography, with some notable subtle dif-ferences (Hart, 1975). However, it has recently beendemonstrated that many of the differences are attrib-utable to the large difference in typical specimen-filmdistances for the two techniques (10 cm for white beamtopography and �1 cm for Lang, see Huang et al.,1999a for details). Some differences are also attributa-ble to the added complication of harmonic contamina-tion (the presence of several orders of diffraction in asingle diffraction spot), which becomes apparent inwhite beam topography, potentially leading to a situa-tion where more than one contrast mechanism oper-ates in a single topograph. Harmonic contaminationcan, however, be avoided by a judicious choice ofdiffraction geometry. In the Section ‘‘Interpretation ofX-ray Topography,’’ a review of basic contrast mecha-nisms, pertinent to both Lang and white beam topogra-phy, is presented.
Fig. 6. Back-reflection white-beam X-ray topograph recorded froma 6H��SiC single crystal, with thyristors fabricated upon it (devicesfabricated at US Army Research Laboratory). The small white spotsdistributed over the image are 1c and larger screw dislocations. Thelocation of these dislocations with respect to the device topology canbe clearly discerned, enabling the influence of the defects on deviceperformance to be determined. The large white feature corresponds todamage inflicted by a probe.
Fig. 7. Transmission X-ray diffraction pattern recorded from aCdZnTe crystal, showing the presence of a twin. Detailed analysis ofthe orientation relationships between the segments of the various dif-fraction spots enables the twin operation to be defined as a 1808 rota-tion about [1�11].
349DEFECT ANALYSIS IN CRYSTALS

IN SITU STUDIES USING SYNCHROTRONX-RAY TOPOGRAPHY
The high intensity of synchrotron radiation sourcesand consequent short exposure times and low signal-to-noise ratio in synchrotron white-beam X-ray topog-raphy open up new avenues for conducting experi-ments in dynamic conditions and achieving real-timeobservation. For example, images can be recordedsequentially, while crystals are being subjected to somekind of external stimulus, such as heat, magnetic field,electric field, supersaturation, etc. Alternatively, suchimages can be captured using high-speed CCD detec-tors. Using high speed data collection capability, quasireal-time in situ studies have been carried out whilecrystals were undergoing, for example plastic deforma-tion (Dudley and Yao, 1993; Wu and Dudley, 1993),chemical reactions (for review, see Dudley et al., 1991),or phase transitions (Dudley and Yao, 1993). In situX-ray topographic studies were also carried out using alaboratory X-ray source on low absorbing ammoniumdihydrogen phosphate crystal, and dislocation struc-tures were analyzed (Chernov et al., 1980). However,this is far from real-time study, because of the longexposure times required due to the weak diffractedbeam intensity. An in situ study carried out during SiCgrowth (Kato et al., 2001), using traditional X-raysource, suffered from poor resolution due to the lowresolution CCD detector used. Using synchrotronradiation, Cunningham et al. (1990) have investigatedthe solution growth process by in situ high resolutionX-ray diffraction, to reveal some kind of ordering in themother liquor near the growing face. X-ray topographywith the high intensity synchrotron source is an excel-lent in situ tool suitable for gaining insights into real-time transformations.
INTERPRETATION OF X-RAY TOPOGRAPHS
Information from an X-ray diffraction topograph isobtained in the form of topographic contrast. As de-scribed earlier, local changes in orientation and spac-ing of crystal lattice planes give rise to local differencesin either diffracted beam direction or intensity, which,under appropriate experimental conditions, are mani-fested as observable contrast on an X-ray topograph.There are two fundamental mechanisms for contrast inX-ray topographs: (i) orientation contrast and (ii) ex-tinction contrast. Extinction contrast can be furtherclassified into three types: (1) direct image contrast (2)dynamical contrast, and (3) intermediary contrast.
Orientation Contrast FromSubgrains and Twins
Orientation contrast is explicitly defined as resultingfrom inhomogeneous intensity distributions, arisingpurely from the overlap or separation of diffracted X-rays, with varying directions. Orientation contrast isobserved in crystals containing regions of different ori-entations, such as grains, subgrains, and twins. Misori-entations caused by dilations as well as rotations of thelattice can also lead to orientation contrast. Occurrenceof orientation contrast depends on the nature of X-raysas well as on the nature of the misorientation, as illus-trated in Figure 8. If either the incident beam diver-gence or the range of wavelengths available in the inci-
dent X-ray spectrum is smaller than the misorientationbetween the blocks projected onto the incidence plane(Fig. 8a), then, only one of the blocks can diffract at agiven time. This produces one form of orientation con-trast, i.e., the presence or absence of diffracted in-tensity. Under such conditions, one can adjust the dif-fraction geometry to bring the other block into the dif-fraction condition, and thus obtain information on themutual misorientation. However, if either the incidentbeam divergence or the range of wavelengths availablein the incident spectrum allows each block to diffractindependently (Fig. 8b or 8c), then the diffracted beamsemanating from the individual blocks will then travelin slightly different directions and will give rise toimage overlap if they converge or separation if theydiverge. This produces another form of orientation con-trast. The degree of misorientation can be determinedby measuring the image shifts (the amount of overlapor separation) as a function of specimen-detector dis-tance on several different reflections. A white-beamX-ray topograph (Fig. 8d), recorded from a HgCdTecrystal that shows the overlap and separation of thesubgrain images, clearly demonstrates orientationcontrast.
Extinction Contrast
Extinction contrast arises when the scattering poweraround the defects differs from that in the rest of thecrystal. Interpretation of this contrast requires under-standing of the dynamical diffraction effects occurringin thick (�2–10 mm), highly perfect crystals (for e.g.,see Tanner, 1976). In this review, extinction contrastformation mechanisms are addressed with respect toimages of dislocations on topographs, since dislocationsare among the most common defects studied by X-raytopography. Topographic contrast of dislocations (aswell as other defects) consists of direct, dynamic, andintermediary images, corresponding to the three differ-ent types of extinction contrast. In transmission geom-etry, of the three types of images the images that canbe observed is determined by the absorption conditions.Absorption conditions are usually defined by the prod-uct of the linear absorption coefficient l and the thick-ness of the crystal t, traversed by the X-ray beam i.e.,lt. For topographs recorded under low absorption con-ditions (lt < 1), the dislocation image is dominated bythe direct image contribution. Under intermediateabsorption conditions, i.e., 5 > lt > 1, all three compo-nents can contribute, while for high absorption cases(lt > 6), the dynamical contribution (in this case, knownas the Borrmann image) dominates.
The Direct Dislocation Image. The direct disloca-tion image is formed when the angular divergence orwavelength bandwidth of the incident beam is largerthan the angular or wavelength acceptance of the per-fect crystal (Tanner, 1996). Under this condition, onlya small proportion of the given incident beam willactually undergo diffraction, with most of the incidentbeam passing straight through the crystal and simplyundergoing normal photoelectric absorption. How-ever, it is possible that the deformed regions aroundstructural defects, such as dislocations and precipi-tates present inside the crystal, are set at the correct
350 B. RAGHOTHAMACHAR ET AL.
orientation for diffraction, provided that their misorien-tation is larger than the perfect crystal rocking curvewidth and not greater than the incident beam diver-gence. The effective misorientation dh around a defect isthe sum of the tilt component in the incidence plane duand the change in the Bragg angle hB due to dilation dd,and is given by the following equation:
dh ¼ � tan hBdd
d� du ð3Þ
Therefore, the distorted region will give rise to a newdiffracted beam. Further, if the distorted region issmall in size, then, this region will diffract kinemati-cally, and will not suffer effective enhanced absorptionassociated with extinction effects, to which the dif-fracted beams from the perfect regions of the crystalare subjected. The enhanced diffracted intensity fromthe distorted regions compared to the rest of the crystalgives rise to topographic contrast. This is known asdirect or kinematical image formation, and this form ofcontrast dominates under low absorption conditions (lt< 1–2). Generally, the direct dislocation image formedby this extinction contrast model has been used toexplain observed contrast features. Although the inten-sity increase for the direct image was in most casesqualitatively interpreted in a correct way (for e.g., seeTanner, 1996), detailed measurements of dislocationimage width made previously sometimes do not strictlycoincide with the predictions of this theory (Miltat andBowen, 1975).
From studies of the direct dislocation images ofgrowth dislocations with large Burgers vectors (super-screw dislocations or micropipes) in X-ray topographsrecorded from SiC single crystals, it was recentlyshown by Huang et al. (1998, 1999a,b,c) that the ex-tinction contrast theory alone is incapable of explain-
ing the contrast features associated with superscrewdislocations on synchrotron topographs. By using asimple simulation method, it was demonstrated thatthe direct images of superscrew dislocations consistmainly of orientation contrast. Moreover, it was shownthat this method is also applicable to elementary dislo-cations, indicating that it is a general phenomenonthat orientation contrast makes a significant contribu-tion to the direct dislocation image.
In the orientation contrast model, the mosaic regionaround the dislocation is divided into a large number ofcubic diffraction units, with their local misorientationscoinciding with the long-range displacement field ofthe dislocation. These units diffract X-rays kinemati-cally, according to their local lattice orientation. Tracesof the inhomogeneously diffracted X-rays are projectedonto the recording plate to obtain the direct image.Thus, the direct image here is due to the orientationcontrast arising from the overlap and separation ofinhomogeneously diffracted X-rays, with continuouslyvarying directions. Figure 9a shows several images ofgiant screw dislocations in SiC recorded in transmis-sion geometry. The Burgers vector of dislocation 1 wasindependently measured (using optical phase contrastmicroscopy, AFM, and other X-ray topography techni-ques) to be 5c (|b| ¼ 75.85A). The full width, w, of theimage is around 40 lm, and the separation betweenthe maximum intensity peaks, L0, is around 24 lm.The conventional misorientation contour model pre-dicts an image width of several hundred microns,which is clearly not the case. On the other hand, a goodcorrelation is clearly evident between the observedimage and the image simulated using the orientationcontrast model (Fig. 9b). The simulated image consistsof pure orientation contrast, resulting from the separa-tion or overlap of the inhomogeneously diffracted X-rays. In a similar way, images of superscrew disloca-tions recorded in back-reflection geometry can be suc-
Fig. 8. Orientation contrastarising from misoriented regions:(a) monochromatic radiation (beamdivergence < misorientation); (b)monochromatic radiation (beam diver-gence > misorientation); and (c) con-tinuous radiation. (d) Reflection topo-graph from an HgCdTe single crystal.The white bands correspond to sepa-ration between images of adjacentsubgrains, while the dark bands corre-spond to image overlap. The tilt angleis estimated at 1–4 s of arc.
351DEFECT ANALYSIS IN CRYSTALS

cessfully simulated, as shown in Figure 10. It has alsobeen shown, that under low absorption conditions, theaforementioned orientation contrast formation mecha-nism also applies to ordinary dislocations, with Bur-gers vectors smaller than that of micropipes (Dudleyand Huang, 2003).
Origins of Dynamical Contrast From Disloca-tions. The dynamical theory of X-ray diffraction ob-
tains solutions to Maxwell’s equations in a periodicmedium (i.e., the crystal) matched to solutions that areplane waves (the incident and diffracted X-ray beams).The wave equations satisfying Maxwell’s equations canbe represented geometrically by the dispersion surface(Batterman and Cole, 1964), and a wavefield propagat-ing in the crystal is represented by a tie point on thedispersion surface, and comprises two waves corre-sponding to the incident and diffracted X-ray beams.Dynamical contrast arises from the interaction of thiswavefield with the dislocation distortion field (forreview see Tanner, 1996). Under low absorption condi-tions, this dynamical contribution to the dislocationcontrast is mostly unobservable, because the image isdominated by the ‘‘Direct Image’’ contribution. Dynam-ical contrast becomes more observable as absorptionincreases, thereby attenuating the ‘‘Direct Image’’ con-tribution (the kinematically diffracted rays contribut-ing to this image do not survive the absorption). Underthese conditions, only wavefields associated with onebranch of the dispersion surface (usually branch 1),which are close to the exact Bragg condition, survivebecause of the Borrmann effect (Borrmann, 1941).These wavefields can survive absorption even whenthe value of lt is significantly greater than unity.
For a perfect crystal, the incident boundary condi-tions determine the position of the tie point on the dis-persion surface. However, for an imperfect crystal, thelocal lattice distortion can modify the position of the tiepoint of a wavefield as it passes through the crystal.This can occur by two mechanisms, depending on thenature of the distortion field. Tie point migration alongthe dispersion surface occurs when the wavefieldencounters a shallow misorientation gradient uponpassing through the crystal (e.g., regions away fromthe dislocation line). The variation of the misorienta-tion should be less than the rocking curve width overan extinction distance:
Rc � g n2g ð4Þ
where Rc is the radius of the curvature of the reflectingplane and ng is the extinction distance. Under theseconditions, both the direction of propagation of thewavefield and the ratio of the amplitudes of its compo-nents are changed. This phenomenon can be treatedusing the so-called Eikonal theory (Penning and Pol-der, 1961), analogous to its counterpart in geometricaloptics, formulated for the case of light travelingthrough a region of varying refractive index. As thewavefield approaches the long-range distortion field ofa dislocation, rays will bend in opposite directions oneither side of the core, potentially producing oppositecontrast. However, if the dislocation is not located closeto the crystal surface, the ray bending experiencedabove the defect may be compensated for by that expe-rienced below the defect, suggesting that the contrasteffects should cancel out. Net contrast is neverthelessobserved, since any deviation of the wavefields fromthe direction of propagation, corresponding to the per-fect crystal region, forces them to experience enhancedabsorption, thereby producing a loss of intensity. Un-der these conditions, the dislocation image will appearwhite and diffuse. In cases where the dislocation is
Fig. 9. (a) Synchrotron transmission topograph of superscrew dis-locations in 6H��SiC (g ¼ 0006, uB ¼ 8.58, sample-film distance d ¼20 cm); (b) Simulation of pure orientation contrast of a 5c superscrewdislocation. The simulation parameters are chosen to coincide withthe experimental conditions of (a).
352 B. RAGHOTHAMACHAR ET AL.

close to the exit surface of the crystal, the lattice curva-ture above and below the defect is asymmetric becauseof the requirements of surface relaxation. This meansthat the ray bending experienced above the defect is nolonger compensated by that experienced below, withthe result that opposite contrast is observed fromregions either side of the defect.
On the other hand, when the wavefield encounters asharp misorientation gradient upon passing throughthe crystal (e.g., regions close to dislocation core), thestrain field would completely destroy the conditions forpropagation and force the wavefield to decouple into itscomponent waves. When these component waves reachthe perfect crystal on the other side of the defect, theywill excite new wavefields (the so-called phenomenonof interbranch scattering). These newly created wave-fields will have tie points, which are distributed acrossthe dispersion surface, and since only those wavefieldswith tie points close to the exact Bragg condition sur-vive, they will be heavily attenuated, leading to a lossof intensity from the region surrounding the disloca-tion. Such images, known as Borrmann images, appearwhite on a dark background. An example is shown inFigure 11, which is a detail from a white-beam X-raytopograph, recorded from an AlN single crystal.
The Intermediary Image. The intermediary imagearises from interference effects at the exit surfacebetween the new wavefields created below the defect
(as described under the Section ‘‘Origins of DynamicalContrast From Dislocations’’) and the undeviated origi-nal wavefield propagating in the perfect regions ofcrystal. Usually, these images often appear as a bead-like contrast along ‘‘Direct’’ dislocation images onprojection topographs. Under moderate absorption con-ditions when the defect (e.g., dislocation line) is in-clined to the surface, the intermediary image forms afan within the intersections of the exit and entrancesurface of the dislocation, and has an oscillatory con-trast with depth periodicity of an extinction distanceng. Again, this is illustrated on Figure 11.
BASIC DISLOCATION ANALYSIS
Topography, both synchrotron and conventional, iswell suited for analysis of low densities (<106cm�2) ofdislocations in crystals. The restriction to low densitiesarises because topographic dislocation images can beanywhere from around 5–15 lm wide, so that greaterdensities would lead to image overlap, and thereforeloss of information.
Determination of Line Direction
For dislocations created by slip processes, knowledgeof the line direction as well as detailed information onthe Burgers vector of the dislocations is required tofully assign the active slip system. Knowledge of bothline direction and Burgers vector of crystal-growthinduced dislocations is also very important in under-
Fig. 10. (a) Back-reflection syn-chrotron topograph of a (0001)6H��SiC wafer, showing the circularimages of superscrew dislocations(g ¼ 00024, k ¼ 1.25 A, sample-filmdistance d ¼ 20 cm); (b) Enlarge-ment of one of the circular images in(a); (c) Computer-simulated white-beam back-reflection X-ray sectiontopograph of a screw dislocation(Burgers vector magnitude b ¼ 3c)simulated under the diffraction con-ditions of (a); (d) Back-reflection X-ray section topograph of a screw dis-location (b¼ 3c).
353DEFECT ANALYSIS IN CRYSTALS

standing their origin and for the development of strat-egies to reduce the density of such dislocations. Theprojected directions of Direct images of growth disloca-tions have also been used very successfully to comparewith line energy calculations, designed to determinewhy particular line directions are preferred by suchdislocations in crystals (for review see Klapper, 1980).The line direction of a dislocation can be obtained byanalyzing its direction of projection on two or moretopographs recorded with different reciprocal lat-tice vectors. The use of analytical geometry enables theline direction to be determined either directly from themeasured direction of projection (Yuan and Dudley,1992) or indirectly by comparing calculated projecteddirections of expected dislocation line directions for thematerial of interest with the measured projection direc-tions (Miltat and Dudley, 1980). Such analysis is mostreadily carried out on Direct images of dislocations,since they are the most well defined, although similaranalysis can be performed on dynamical or intermedi-ary images.
Determination of Burgers Vector Direction
For sufficiently low dislocation densities, standardBurgers vector analysis, which enables the determina-tion of the direction of the Burgers vector, is readilycarried out in the low absorption regime, using the g �b ¼ 0 criterion for invisibility of screw dislocations, andthe combination of g � b ¼ 0 and g � b 3 l ¼ 0 criterion
for invisibility of edge or mixed dislocations (where b isthe dislocation Burgers vector, and l is the dislocationline direction). These criteria are also used in the anal-ysis of TEM images of dislocations. An example of dis-location analysis in a single crystal of aluminum ni-tride (AlN) is presented in Figure 9. These dislocationswere formed by deformation process during postgrowthcooling. These dislocations lie in the basal plane of the2H crystal structure of AlN and are visible in Figure12a (g ¼ 1�101) and invisible on the 10�10 (Fig. 12b) andthe �101�1 (Fig. 12c) reflections although weak contrastis observed. Application of the g � b ¼ 0 criterion topossible 1/3h11�20i Burgers vectors, which lie in the ba-sal plane, shows that the dislocations have Burgersvector 1/3[1�210].
Determination of Burgers VectorSense and Magnitude
The determination of the actual sense and magnitudeof the Burgers vector of a dislocation, once the Burgersvector direction has been determined by g � b analysis,requires more detailed analysis. Chikawa (1965) devel-oped a conventional radiation, divergent beam techni-ques for the determination of the sense of both edge andscrew dislocations through measurement of the sense oftilt of lattice planes surrounding the dislocation core.For the case of screw dislocations, Mardix et al. (1971)subsequently further developed Chikawa’s divergentbeam technique to enable the magnitude of this tilt tobe measured as a function of distance from the core.This could then be fitted to the corresponding theoreti-cal expression, enabling the Burgers vector magnitudeto be determined. Si et al. (1996) recently developed twomethods, one section and one projection, which are anal-ogous to those of Chikawa (1965), and Mardix et al.(1971), but which make use of synchrotron white radia-tion. In these techniques, the lattice tilt surroundingdislocations of mainly screw character was measuredwith an accuracy that was significantly improved due tothe relaxation of the requirement for short specimen-film distances, which is inevitable in conventional radia-tion techniques.
CONTRAST FROM INCLUSIONS
Individual point defects are not visible on X-ray topo-graphs, but when such defects cluster to form a precipi-tate or inclusion, contrast can be observed. Under lowabsorption conditions, ‘‘Direct’’ or kinematical imagesof precipitates are formed on X-ray topographs, andthese typically consist of two dark half-circles sepa-rated by a line of no-contrast perpendicular to the pro-jection of the diffracted vector. This is simply becausedistortions parallel to a given set of atomic planes arenot discernible. An example is shown in Figure 13,which is a transmission SWBXT image recorded froma CdZnTe crystal. Under higher absorption conditions,dynamical contrast can be observed. When the precipi-tate is close to the X-ray exit surface, opposite contrasteither side of the defect can usually be observed. Thiscontrast will usually reverse with reversal of the signof the reflection vector. The contrast is produced by tiepoint migration in the region above the defect. Sincethe defect is close to the exit surface, the reflectingplanes rotate very sharply to meet the surface at thepreferred angle, and so the curvature becomes too large
Fig. 11. SWBXT transmission topograph (g ¼ 10�10, k ¼ 0.75A)recorded from an AlN single crystal under intermediate absorptionconditions (lt ¼ 8), showing the direct (1), intermediary (3), and dy-namical (2) images of a dislocation (PF, Pendellosung fringes).
354 B. RAGHOTHAMACHAR ET AL.

for the Eikonal theory to handle. Consequently, thecontrast developed above the defect is ‘‘frozen-in.’’ Theblack–white contrast not only reverses with the senseof the reflection vector, but also with the sense of thestrain in the lattice. This can be used to determine thenature of the precipitate. If the contrast is enhanced onthe side of positive g, then the lattice is under compres-sion, if reduced, it is under tension. This empirical rulewas first determined by Meieran and Blech (1965).
Precipitates/inclusions may also be imaged using theback-reflection geometry, as shown in Figure 14a, for a3C��SiC platelet containing inclusions near the sur-face (Vetter and Dudley, 2004). The circular spots ofinclusions are similar to the images of superscrew(micropipes) in 6H��SiC (Fig. 10), except that thescrew dislocation images have more distinct white con-trast than the inclusion images, there being some dif-fracted intensity inside the inclusion spots, makingthem appear gray rather than white. The images of in-
clusions in back-reflection topographs can be under-stood by considering ray-tracing computer simulations,based on the displacement field of a spherical inclusion.The ray-tracing concept is the same as the orientationcontrast model (see Section ‘‘The Direct DislocationImage’’). Figure 14b shows a simulated image of aninclusion with a diameter comparable to the whitespots in Figure 14a. The simulation a 3c axial screwdislocation in Figure 10b and that of an inclusion inFigure 14b are similar, in which the intensity reflectedfrom the area centered on their defects is concentratedinto a dark ring. This occurrence is complete for thecase of the screw dislocation of Figure 10b, with inten-sity being absent from the ring whereas for the case ofthe inclusion, the intensity within its dark ring ismerely depleted.
The difference between the mechanisms of image for-mation in the back-reflection topography of axial screwdislocations and inclusions can be analyzed more inti-mately with section topographs. Simulated sectiontopographs may be obtained by utilizing only the dif-fracting elements of the crystal that fall within the pro-jected path of a narrow strip of incident rays. For ascrew dislocation (Fig. 10c), on the section topograph,the strip of diffracted intensity is displaced downwardand upward at either side of the white, circular centerof the simulated screw dislocation image, to break intotwo tails. The upper tail originates from the left half ofthe illuminated dislocation core, while the lower tailcorresponds to the right half. The presence of the tailsstretching in directions out of their illuminated sidesindicates that the diffracted rays are twisted from theincident beam direction. The twisting direction of therays is opposite to the dislocation sense. Back-reflec-tion section topography is then capable of discerning thesenses of axial screw dislocations. The section topographof an inclusion (Fig. 14d) lacks this two-tailedness.
Like the traverse topograph of Figure 14a, the defectimage again shows a gray center of depleted intensitybracketed by a dark perimeter. The diffracting planesin the vicinity of a spherical inclusion lack the helicaltwist that those in the core of a screw dislocation have.A spherical inclusion’s strain field bulges the diffract-ing planes above it into convex curvatures, tilting themradially outward from the defect’s center. In the simu-lated section topograph of an inclusion in Figure 14c,the absence of a twist is evident, as the image is sym-metrical about a line drawn through the center of thedefect parallel to the g vector. Diffracted intensity is
Fig. 12. Synchrotron white-beam topographs recorded intransmission geometry from anAlN single crystal containing slipdislocations: (a) g ¼ 1�101, k ¼0.58A; (b) g ¼ 10�10, k ¼ 0.75A; (c)g ¼ �101�1, k ¼ 0.68A. Note the dis-appearance of dislocation seg-ments on (b) and the weak con-trast on (c). Burgers vector of thesedislocations is determined to be 1/3[1�210].
Fig. 13. Detail from a synchrotron white beam topograph recordedin transmission from a CdZnTe single crystal, showing precipitatecontrast under low absorption conditions.
355DEFECT ANALYSIS IN CRYSTALS

depleted from the central area of the defect image andconcentrated at its edges, forming two curved bars ofdark contrast. This is roughly what is seen in the sec-tion topograph of an inclusion in Figure 14d.
CONTRASTASSOCIATED WITH CRACKS
X-ray topography is also capable of discerning the de-formation fields associated with cracks in single crys-tals. Michot et al. (1982) have used XRT to measurethe extent of the plastic zone associated with the stressconcentrations that can arise at the tip of a crack.Raghothamachar et al. (2003) have reported on defor-mation initiated at cracks in AlN crystals. This wasachieved both in static mode, using Lang topography(Michot et al., 1980) and synchrotron white-beamX-ray topography (Raghothamachar et al., 2003), anddynamic mode, using monochromatic synchrotron radi-ation topography (Michot and George, 1982). In a simi-lar way, the elastic deformation field associated withcrack tips can also be characterized. For example, forthe case of ‘‘mud cracks,’’ which are often observed inGaN films grown on either SiC or sapphire substrates,the elastic field of the cracks can penetrate down intothe substrate and be observable by X-ray topography.Itoh and Rhee (1985) published an early report of suchtopographic observations in GaN films grown on sap-phire. The presence of these mud cracks is evidence forthe existence of tensile stresses in the films. For thecase of SiC substrates, these tensile stresses may arisefrom thermal expansion mismatch, although this can-
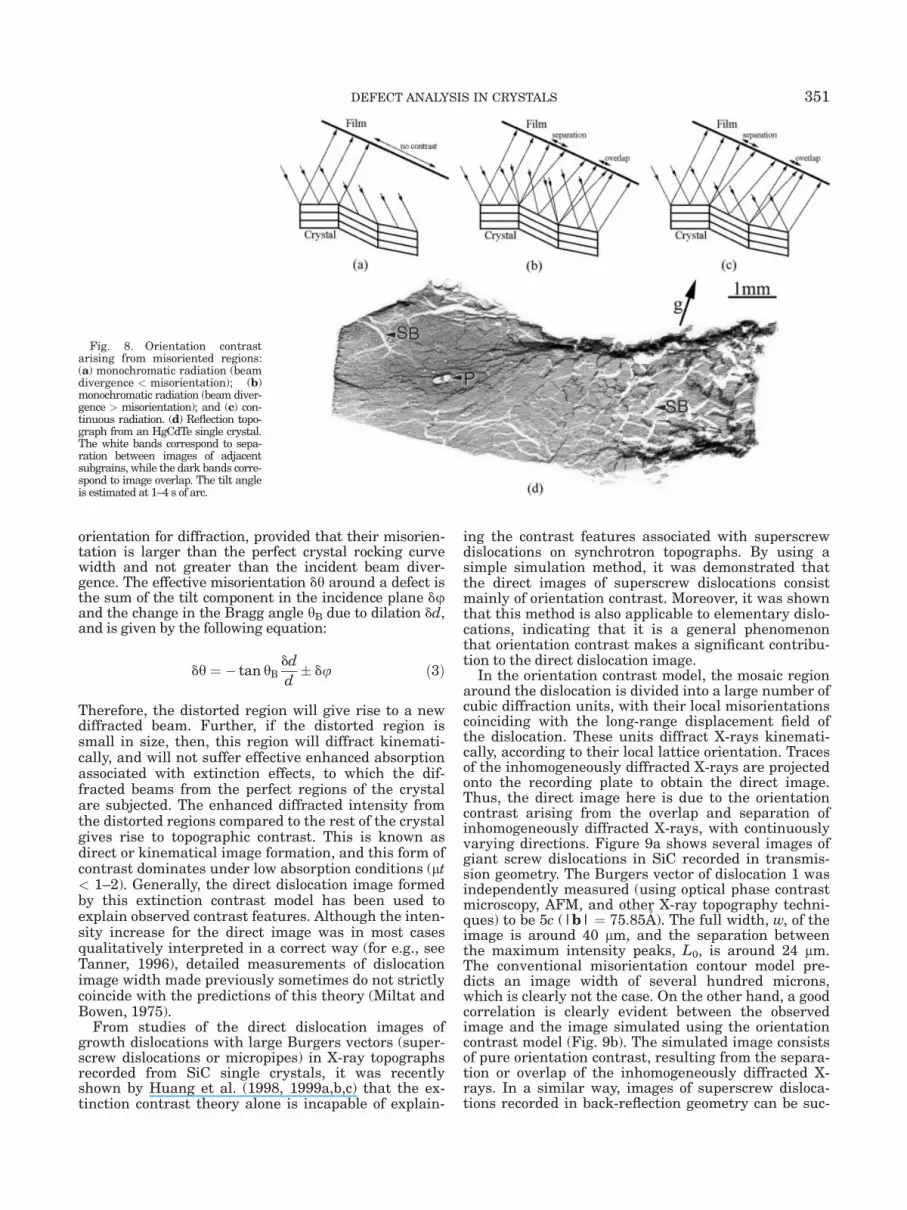
not explain their existence for the case of sapphire sub-strates. For the latter case, the tensile stresses arebelieved to be associated with grain coalescence (Etz-korn and Clarke, 2001). TEM observation of the inter-face regions in the GaN/sapphire system indicates theabsence of plastic deformation associated with thecrack tips, rather just the presence of an elastic defor-mation field. This elastic deformation field (for bothSiC and sapphire cases) behaves with respect to X-raytopographic observation like an edge dislocation, i.e.,one can define a displacement vector (u) associatedwith the crack, which is oriented in the plane of theinterface and normal to the long axis (l) of the crack.This means that the crack image disappears when theconditions g � u ¼ 0 and g � u 3 l ¼ 0 are simultane-ously satisfied. Fig. 15 shows topographs of a crackedGaN/SiC sample, recorded under various diffractionconditions: (a) g ¼ �2110, d ¼ 10 cm (d is the sample-film distance); (b) g ¼ �12�10, d ¼ 10 cm; (c) g ¼ �12�10,d ¼ 24.7 cm. All the topographs were taken with theGaN film on the X-ray exit surface. From these figures,we can see that all the cracks running along [�2110]that have u along [01�10] are invisible in (a) while allthe cracks along [�12�10] that have u along [�1010] are in-visible in (b), because of the aforementioned invisibilitycriteria. Ray tracing, carried out by recording SWBXTimages of the crack deformation fields at differentspecimen-film distances, enables determination of the‘‘sense’’ of the lattice rotation (i.e., which side of theinterface the ‘‘extra half-plane’’ would lie) as well as
Fig. 14. (a) Synchrotron white-beam back-reflection X-ray topo-graphs from a 3C��SiC platelet(g ¼ 12 12 12, k ¼ 1.24 A) showinginclusions; (b) Computer-simulatedback-reflection white-beam X-raytopograph (hB ¼ 808) of an inclu-sion 14 lm beneath the surface ofa 3C��SiC sample; (c) Computer-simulated white-beam back-reflec-tion X-ray section topograph of aninclusion; (d) Recorded synchro-tron white-beam back-reflectionX-ray section topograph of an in-clusion 14 lm beneath the surface(g ¼ 12 12 12, k ¼ 1.24 A).
356 B. RAGHOTHAMACHAR ET AL.
the exact location of the misoriented volume withrespect to the core of the crack. This is demonstrated inFigures 15b and 15c. The separation between the par-allel components of the images in (c) is larger than thatin (b), indicating that the cracks open-up toward theGaN film surface. Further quantitative ray tracinganalysis reveals that the misoriented volumes arelocated at a distance of 30 lm from the crack core, andthe lattice rotations are of the order of 20 arc seconds.
ACKNOWLEDGMENTS
AlN crystals for X-ray topographs were provided byCrystal IS, Inc. (Dr. Leo Schowalter). Topographyexperiments were carried out at the Stony Brook Syn-chrotron Topography Facility (Beamline X-19C) at theNational Synchrotron Light Source, BrookhavenNational Laboratory. M.D. acknowledges the assis-tance of the following graduate students and Postdocs(present and former) in the recording of the X-rayimages presented here: Drs. W.M. Vetter, X.-R. Huang,H. Chung, and W. Huang.
REFERENCES
Authier A. 1978. Contrast of images in X-ray topography. In: AmelinckxS, Gevers R, van Landuyt J, editors. Diffraction and imaging techni-ques in materials science. Amsterdam: North Holland. pp. 715–757.
Barrett CS. 1945. A new microscopy and its potentialities. Trans AmInst Min Eng 161:15–65.
Batterman BW, Cole H. 1964. Dynamical diffraction of X-rays by per-fect crystals. Rev Mod Phys 36:681–717.
Berg VW. 1931. Uber eine rontgenographische methode zur unter-suchung von gitterstorungen an kristallen. Naturwissenschaften19:391–396.
Bond WL, Andrus J. 1952. Structural imperfections in quartz crys-tals. Am Mineral 37:622–632.
Bonse U, Kappler E. 1958. Rontgenographische abbildung des verzer-rungsfeldes einzelner versetzungen in germanium-einkristallen.Z Naturforsch A: Phys Sci 13:348.
Borrmann G. 1941. Uber Extinktionsdiagramme vonq Uarz. Phys Z42:157–162.
Chernov AA, Smolski IL, Parvov VF, Kuznetsov YG, Rozhansky VN.1980. An X-ray topographic study of ADP crystal growth. Kristal-lografiya 25:821–828.
Chikawa JI. 1965. X-ray topographic observation of dislocation con-trast in thin CdS crystals. J Appl Phys 36:3496–3502.
Claeys C, Deferm L. 1993. Trends and challenges for advanced silicontechnologies. Sol St Phen 47/48:1–16.
Cunningham D, Davey RJ, Roberts KJ, Sherwood JN, Shripathi T.1990. Structural studies of the crystal solution interface using syn-chrotron radiation. J Cryst Growth 99:1065–1069.
Dhanaraj G, Shripathy T, Bhat HL. 1991. Growth and defect charac-terization of L-arginine phosphate monohydrate. J Cryst Growth113:456–464.
Dhanaraj G, Huang XR, Dudley M, Prasad V, Ma RH. 2003. Siliconcarbide crystals. Part I: Crystal growth and characterization. In:Byrappa K, Ohachi T, editors. Crystal growth technology. Norwich,NY: William Andrew/Springer-Verlag. pp. 181–232.
Dudley M, Huang X. 2003. X-ray topography. In: Jimenez J, editor.Microprobe characterization of optoelectronic materials (Optoelec-tronic properties of semiconductors and superlattices, Vol. 17). Am-sterdam: Gordon and Breach/Harwood Academic. pp. 531–594.
Dudley M, Yao GD. 1993. Synchrotron topography of phase-transi-tions in perovskite-like crystals. J Phys D: Appl Phys 26:A120–A125.
Dudley M, Wu J, Yao G-D. 1989. Determination of penetration depthsand analysis of strains in single crystals by white beam synchrotronX-ray topography in grazing Bragg–Laue geometries. Nucl InstrumMethods B40/41:388–392.
Dudley M, Sherwood JN, Bloor D. 1991. X-ray topographic studies ofsolid state reactions. II Solid-state polymerization of 2,4-hexadiyne-diol bis (para-toluene sulfonate). Proc R Soc Lond A 434:243–261.
Dudley M, Wang S, Huang W, Carter CH Jr, Tsvetkov VF, Fazi C.1995. White beam synchrotron topographic studies of defects in6H��SiC single crystals. J Phys D: Appl Phys 28:A63–A68.
Dudley M, Huang XR, Huang W. 1999. Assessment of orientation andextinction contrast contributions to the direct dislocation image.J Phys D: Appl Phys 32:A139–A144.
Etzkorn EV, Clarke DR. 2001. Cracking of GaN films. J Appl Phys89:1025–1034.
Guinier A, Tennevin J. 1949. Sur deux variantes de la methode deluae et leurs applications. Acta Crystallogr 2:133–138.
Hart M. 1975. Synchrotron radiation—its application to high speed,high resolution X-ray diffraction topography. J Appl Crystallogr8:436–44.
Huang XR, Dudley M, Vetter WM, Huang W, Carter CH Jr. 1998.Contrast mechanism in superscrew dislocation images on synchro-tron back reflection topographs. In: Mini SM, Perry DL, Stock SR,Terminello LJ, editors. Applications of synchrotron radiation tech-niques to materials science IV (Mat Res Soc Sym Proc, Vol. 524).Warrendale, PA: Materials Research Society. pp. 71–76.
Huang XR, Dudley M, Zhao JY, Raghothamachar B. 1999a. Dependenceof the direct dislocation image on sample-to-film distance in X-ray to-pography. Philos Trans R Soc London Ser A 357:2659–2670.
Huang XR, Dudley M, Vetter WM, Huang W, Wang S, Carter CH Jr.1999b. Direct evidence of micropipe-related pure superscrew dislo-cations in SiC. Appl Phys Lett 74:353–355.
Huang XR, Dudley M, Vetter WM, Huang W, Si W, Carter CH Jr.1999c. Superscrew dislocation contrast on synchrotron white-beamtopographs: an accurate description of the direct dislocation image.J Appl Crystallogr 32:516–524.
Hurle DTJ. 1994. Handbook of crystal growth: thin films and epitaxy.New York: Elsevier. 1086 pp.
Fig. 15. SWBXT images recorded from a SiC substrate with GaNepilayers. (a) g ¼ �2110, d ¼ 10 cm; (b) g ¼ �12�10, d ¼ 10 cm; (c) g ¼�12�10, d ¼ 24.7 cm. The pairs of dark parallel lines arise from the elas-tic deformation associated with ‘‘mud cracks’’ in the GaN film, whichpenetrates into the SiC substrate (intensity from the GaN film is toolow to be visible on this image). Crack images ‘‘A’’ are visible in (a) but
invisible in (b). while the reverse is true for crack images ‘‘B.’’ Thisdemonstrates the applicability of the g � u ¼ 0 and g � u3 l ¼ 0 crite-ria. The arrows on (b) and (c) highlight the increase in the separationbetween the two parallel components of the crack images, as the spec-imen-film distance is increased.
357DEFECT ANALYSIS IN CRYSTALS

Itoh N, Rhee JC. 1985. Study of cracking mechanism in GaN/a-Al2O3
structure. J Appl Phys 58:1828–1837.Kato T, Oyanagi N, Yamaguchi H, Nishizawa S, Khan MN, Kitou Y,
Arai K. 2001. In-situ observation of silicon carbide sublimationgrowth by X-ray topography. J Cryst Growth 222:579–585.
Kawado S, Iida S, Yamaguchi Y, Kimura S, Kimura S, Hirose Y, Kaji-wara K, Chikaura Y, Umeno M. 2002. Synchrotron-radiation X-raytopography of surface strain in large-diameter silicon wafers. J Syn-chrotron Radiat 9:166–168.
Klapper H. 1980. Defects in non-metal crystals. In: Tanner BK,Bowen DK, editors. Characterization of crystal growth defects by X-ray methods, NATO ASI B63. New York: Plenum. pp. 133–160.
Lang AR. 1957. Point-by-point X-ray diffraction studies of imperfec-tions in melt-grown crystals. Acta Crystallogr 10:839.
Lang AR. 1958. Direct observation of individual dislocations. J ApplPhys 29:597–598.
Mardix S, Lang AR, Blech I. 1971. Giant screw dislocations in ZnSpolytype crystals. Philos Mag 24:683–693.
Meieran ES, Blech IA. 1965. X-ray extinction contrast topography ofsilicon strained by thin surface films. J Appl Phys 36:3162–3167.
Michot G, George A. 1982. In situ observation by X-ray synchrotrontopography of the growth of plastically deformed regions aroundcrack tips in silicon under creep conditions. Scr Metall 16:519–524.
Michot G, Badawi K, Halim AR, George A. 1980. X-ray topographicstudy of crack-tip dislocation patterns in silicon. Philos Mag A42:195–214.
Miltat J. 1980. White beam synchrotron radiation. In: Tanner BK,Bowen DK, editors. Characterization of crystal growth defects byX-ray methods, NATO ASI B63. New York: Plenum. pp. 401–420.
Miltat J, Dudley M. 1980. Projective properties of Laue topographs.J Appl Crystallogr 13:555–562.
Miltat JEA, Bowen DK. 1975. On the widths of dislocation images inX-ray topography under low-absorption conditions. J Appl Crystal-logr 8:657–669.
Neudeck PG. 2000. Electrical impact of SiC structural defects on highelectric field devices. Mater Sci Forum 338–342:1161–1166.
Neudeck PG, Huang W, Dudley M. 1998. Breakdown degradationassociated with elementary screw dislocations in 4H��SiC PþNjunction rectifiers. In: Pearton SJ, Shul RJ, Wolfgang E, Ren F,Tenconi S, editors. Power semiconductor materials and devices(Mat Res Soc Symp Proc, Vol. 483). Warrendale, PA: MaterialsResearch Society. pp. 285–294.
Newkirk JB. 1958. Method for the detection of dislocations in siliconby X-ray extinction contrast. Phys Rev 110:1465–1466.
Penning P, Polder D. 1961. Anomalous transmission of X-rays in elas-tically deformed crystals. Philips Res Rep 16:419–440.
Raghothamachar B, Dudley M, Rojo JC, Morgan K, Schowalter LJ.2003. X-ray characterization of bulk AlN single crystals grown bythe sublimation technique. J Cryst Growth 250:244–250.
Ramachandran GN. 1944. X-ray topographs from diamond. Proc In-dian Acad Sci A 19:280–294.
Scheel HJ. 2003. The development of crystal growth technology.Scheel HJ, Fukuda T, editors. In: Crystal growth technology. NewYork: Wiley. pp. 1–14.
Schulz LG. 1954. Method of using a fine-focus X-ray tube for examin-ing the surfaces of single crystals. J Met 6:1082–1083.
Schwuttke GH. 1965. New X-ray diffraction microscopy techniquefor study of imperfections in semiconductor crystals. J Appl Phys36:2712–2714.
Si W, Dudley M, Carter CH Jr, Glass R, Tsvetkov VF. 1996. Determi-nation of Burgers vectors of screw dislocations in 6H��SiC singlecrystals by synchrotron white beam X-ray topography. In: Termi-nello L, Mini S, Perry DL, Ade H, editors. Applications of synchro-tron radiation to materials science (Mat Res Soc Symp Proc, Vol.437). Warrendale, PA: Materials Research Society. pp. 129–134.
Tanner BK. 1976. X-ray diffraction topography. Pergamon: Oxford.174 pp.
Tanner BK. 1996. Contrast of defects in X-ray diffraction topographs.In: Authier A, Lagomarsino S, Tanner BK, editors. X-ray and neu-tron dynamical diffraction: theory and applications. New York: Ple-num. pp. 147–166.
Tuomi T, Naukkarinen K, Rabe P. 1974. Use of synchrotron radiationin X-ray-diffraction topography. Phys Status Solidi A 25:93–106.
Vetter WM, Dudley M. 2004. The contrast of inclusions comparedwith that of micropipes in back-reflection synchrotron white-beamtopographs of SiC. J Appl Crystallogr 37:200–203.
White JE. 1950. X-ray diffraction by elastically deformed crystals.J Appl Phys 21:855–859.
Wooster W,Wooster WA. 1945. X-ray topographs. Nature 155:786–787.Wu J, Dudley M. 1993. Synchrotron white radiation X-ray topo-
graphic investigation of dislocation configurations developed in in-dium antimonide single crystals by plastic bending. In: Perry DL,Stockbauer R, Shinn N, D’Amico K, Terminello L, editors. Applica-tion of synchrotron radiation techniques to materials science(Mater Res Soc Symp Proc, Vol. 307). Pittsburgh, PA: MaterialsResearch Society. pp. 231–236.
Yuan D, Dudley M. 1992. Dislocation line direction determination inpyrene single crystals. Mol Cryst Liq Cryst 211:51–58.
358 B. RAGHOTHAMACHAR ET AL.