2.3 Topography and Geology 2.3.1 Topography
64
Main Report I (Master Plan) The Study on Flood and Debris Flow in the Caspian Coastal Area Chapter 2 focusing on the Flood-hit Region in Golestan Province 2 - 34 JICA CTI Engineering International Co., Ltd. 2.3 Topography and Geology 2.3.1 Topography Topographical Classification The main regional topography in the Study Area is summarized below. (1) Alluvial Plain to Inundation Region The Alluvial plain and inundation area are evidenced by a flat feature with a regular seaward slope and widely distributed in Nardin basin (sub-basin S-1) with an elevation of about 1,415 - 1,430 m, Cheshmeh Nay to Sefid Daly basin (S-1) with 1,300 – 1,400 m, Cheshmeh Khan to Robat Gharabil basin (S-2) with 1,200 – 1,500 m, Dasht basin (S-3) with 1,000 – 1,200 m, and downstream from Tangrah (S-6 to S-8) with 65 – 500 m. It consists of various topographical elements of riverbed, floodplain, fan, and natural levee. This region has been widely utilizing for farming. (2) Hilly Region (and undulating region) Hilly region extends between alluvial plain to mountainous region, and at the middle western part of drainage border near Sudaran Village, Goldin Village, Kolanke Village, Dastshad Village, and locally here and there where talus deposit, Tertiary formation, and heavily weathered rocks are distributed. This topography is characterized as a gentle and smooth relief on river terrace and old age topography. The drainage pattern is parallel and it forms a gentle valley with a riverbed gradient of 1/10 to 1/20. Gully erosion is dominant in this region because of soft or fragile characteristics of these rocks. This region has been utilizing for dry farming and grazing. (3) Mountainous Region It is distributed mainly in the middle stream reaches from Dasht Village to Terjenly Village (S-5) with an elevation of about 500 m in the riverbed to the border of the study area with an elevation of about 1,700 to 2,300 m. It shows rugged and very steep slope with cliff in the distribution area of Cretaceous limestone. Small traces of collapse are distributed here and there. The drainage pattern is dendritic and it forms a steep to very steep valley. The vegetation coverage is generally low excluding “Golestan National Park”, especially in the headwaters of Nardein basin and Robat Gharabil basin. The Golestan National Park is located in the middle stream reaches of Madarsoo River with natural forest. Slope Condition Slope condition is one of the essential factors for debris flow occurrence in topography. It is well known debris flow may occur in the steep slope stream. (1) Slope and Sediments The steep slope, which is composed of rocks, yields mainly rock and sand by gravity fall and rainfall. They will accumulate at the mountain foot of gentle slope and will be named “talus deposit”. On the other hand, the gentle slope, which is dominantly composed of clay with sand, will mainly yield soil. The slope condition and sediments is presented in the following table.
-
Upload
khangminh22 -
Category
Documents
-
view
2 -
download
0
Transcript of 2.3 Topography and Geology 2.3.1 Topography

Main Report I (Master Plan) The Study on Flood and Debris Flow in the Caspian Coastal Area Chapter 2 focusing on the Flood-hit Region in Golestan Province
2 - 34 JICA CTI Engineering International Co., Ltd.
2.3 Topography and Geology
2.3.1 Topography Topographical Classification
The main regional topography in the Study Area is summarized below.
(1) Alluvial Plain to Inundation Region
The Alluvial plain and inundation area are evidenced by a flat feature with a regular seaward slope and widely distributed in Nardin basin (sub-basin S-1) with an elevation of about 1,415 - 1,430 m, Cheshmeh Nay to Sefid Daly basin (S-1) with 1,300 – 1,400 m, Cheshmeh Khan to Robat Gharabil basin (S-2) with 1,200 – 1,500 m, Dasht basin (S-3) with 1,000 – 1,200 m, and downstream from Tangrah (S-6 to S-8) with 65 – 500 m.
It consists of various topographical elements of riverbed, floodplain, fan, and natural levee. This region has been widely utilizing for farming.
(2) Hilly Region (and undulating region)
Hilly region extends between alluvial plain to mountainous region, and at the middle western part of drainage border near Sudaran Village, Goldin Village, Kolanke Village, Dastshad Village, and locally here and there where talus deposit, Tertiary formation, and heavily weathered rocks are distributed.
This topography is characterized as a gentle and smooth relief on river terrace and old age topography. The drainage pattern is parallel and it forms a gentle valley with a riverbed gradient of 1/10 to 1/20. Gully erosion is dominant in this region because of soft or fragile characteristics of these rocks.
This region has been utilizing for dry farming and grazing.
(3) Mountainous Region
It is distributed mainly in the middle stream reaches from Dasht Village to Terjenly Village (S-5) with an elevation of about 500 m in the riverbed to the border of the study area with an elevation of about 1,700 to 2,300 m. It shows rugged and very steep slope with cliff in the distribution area of Cretaceous limestone. Small traces of collapse are distributed here and there.
The drainage pattern is dendritic and it forms a steep to very steep valley. The vegetation coverage is generally low excluding “Golestan National Park”, especially in the headwaters of Nardein basin and Robat Gharabil basin.
The Golestan National Park is located in the middle stream reaches of Madarsoo River with natural forest.
Slope Condition
Slope condition is one of the essential factors for debris flow occurrence in topography. It is well known debris flow may occur in the steep slope stream.
(1) Slope and Sediments
The steep slope, which is composed of rocks, yields mainly rock and sand by gravity fall and rainfall. They will accumulate at the mountain foot of gentle slope and will be named “talus deposit”. On the other hand, the gentle slope, which is dominantly composed of clay with sand, will mainly yield soil. The slope condition and sediments is presented in the following table.

The Study on Flood and Debris Flow in the Caspian Coastal Area Main Report I (Master Plan)focusing on the Flood-hit Region in Golestan Province Chapter 2
JICA CTI Engineering International Co., Ltd. 2 - 35
Table 2.21 Slope Condition and Sediment Transport Slope Main Lithology Yielding Cause of
movementTopography Debris flow
Steep Sound with loosened rocks
Rocks & sand Gravity, rainfall
Medium Soft rocks Weathered rocks Loosened rocks
Rocks and sand with clay
Gravity, rainfall
Talus
Gentle Heavily weathered & loosened rocks, Gravel, Sand, Clay
Gravel, sand, clay
Rainfall Talus, Terrace, Fan
Debris Deposit
Plain Gravel, sand with clay
Fan Debris Deposit
Plain Gravel, sand, clay Flood plain
(2) Slope Classification
The slope coverage will be estimated as the following table on the basis of GIS topographical database with a scale of 1/50,000 in the Study Area. Fig. 2.37 shows the slope classification.
Table 2.22 Slope Coverage in the Study Area Description Degree (o) Area (Km2) Ratio (%)
1 Level to nearly level 0-3 560 24 2 Gently sloping to undulating 3-10 766 32 3 Moderately sloping to rolling 10-15 405 17 4 Strongly sloping to moderately sloping 15-20 286 12 5 Steep mountains 20-30 271 12 6 Very steep mountains >30 76 3 Total 2,364 100
It is also classified in the each sub-basin area in the following tables.
Table 2.23 Slope Coverage by Sub-Basin Gradient Sub-Basin Area (Km2) Description(Degree) S-1 S-2 S-3 S-4 S-5 S-6 S-7 S-8
Total
1.Level 0-3o 227 135 27 15 6 47 22 80 5602.Gentle 3-10 319 163 61 59 44 70 40 9 7663.Moderate 10-15 124 70 23 22 63 66 34 3 4054.Strong 15-20 67 45 9 13 81 46 21 1 2865.Steep 20-30 42 35 3 15 119 40 16 0 2716.Very steep >30 8 3 0 2 50 11 2 0 76Total - 787 452 125 126 362 281 136 95 2,364
Rain

Main Report I (Master Plan) The Study on Flood and Debris Flow in the Caspian Coastal Area Chapter 2 focusing on the Flood-hit Region in Golestan Province
2 - 36 JICA CTI Engineering International Co., Ltd.
Table 2.24 Slope Coverage Ratio by Sub-Basin Gradient Slope Coverage Ratio in the Sub-Basin Area (%) Description (Degree) S-1 S-2 S-3 S-4 S-5 S-6 S-7 S-8
1.Level 0-3o 28.8 30.0 22.0 12.0 1.6 16.7 16.3 85.0 2.Gentle 3-10 40.6 36.1 49.1 46.9 1.3 25.0 29.2 10.0 3.Moderate 10-15 15.7 15.4 18.5 17.6 17.3 23.5 25.1 3.6 4.Strong 15-20 8.5 10.0 7.6 10.6 22.8 16.5 15.7 1.3 5.Steep 20-30 5.4 7.8 2.8 11.6 32.8 14.4 12.0 0.2 6.Very steep >30 1.0 0.7 0.0 1.3 13.8 3.9 1.8 0.0 Total 100 100 100 100 100 100 100 100
Sub-basins of S-1, S-2, and S-3 are located in the headwaters of Madarsoo River. Gentle slopes are dominant and almost 70% of slope will be level to gentle in these basins.
Sub-basin S-5, which covers the middle stream of Madarsoo River and Golestan National Park is located in, has the most steep and very steep slope with a ratio of 46.6% while their slope gradient in the whole Study Area are about 14.7%. If streams had riverbed deposits and slope covered by the talus deposit and other unconsolidated materials, strong rainfall will triggers off a debris flow at streams in the sub-basin S-5 area.
(3) Stream Gradient and Debris Flow
According to the result of the debris flow investigation in Japan, debris flow will occur in the slope gradient with more than 15 degree and will be piled up at the place with a gradient of less than 15 degrees in general. Of course, it depends on the rainfall strength with rainfall accumulation, and other natural condition of geology, vegetation, and land use.
The relation between stream gradient and debris flow is applied in the following classification based on the experimental works in Japan. In this case, drainage area will be required more than 5 hectares with a slope gradient of more than 15 degrees.
Table 2.25 Stream Gradients (S) and Debris Flow
Gradient Classification of debris flow S > 20º Location of debris occurrence 20º >S> 15º Location of debris occurrence and passing area 15º >S> 10º 1. Piled-up area of debris flow.
2. Passing area of mudflow. 10º >S> 3º Piled-up area of both debris flow and mud flow 3º <S Piled-up area of both debris flow and mud flow
Source: Experimental Classification in Japan
(4) Collapse and Landslide
Collapses are distributed here and there that were confirmed by the field reconnaissance and aerial photo interpretation. But most of them are marks of old collapse in the middle to lower reaches on the basis of aerial photo taken in 1966. New collapses are distributed only in mountain streams. Large-scale collapses and landslides were formed in the sub-basin S-1 to S-4 in the headwaters of Madarsoo River where unconsolidated deposit and soft rocks are widely distributed. They are easily eroded and have supplied the soil and rocks to the riverbed.
Most of debris flow in 2001 or 2002 might occur eroding the riverbed deposits that had been transported by old collapse and deposited the riverbed in Tangrah and Terjenly villages in the middle reaches with steep and very steep slope.
The Study on Flood and Debris Flow in the Caspian Coastal Area Main Report I (Master Plan)focusing on the Flood-hit Region in Golestan Province Chapter 2
JICA CTI Engineering International Co., Ltd. 2 - 37
Fan
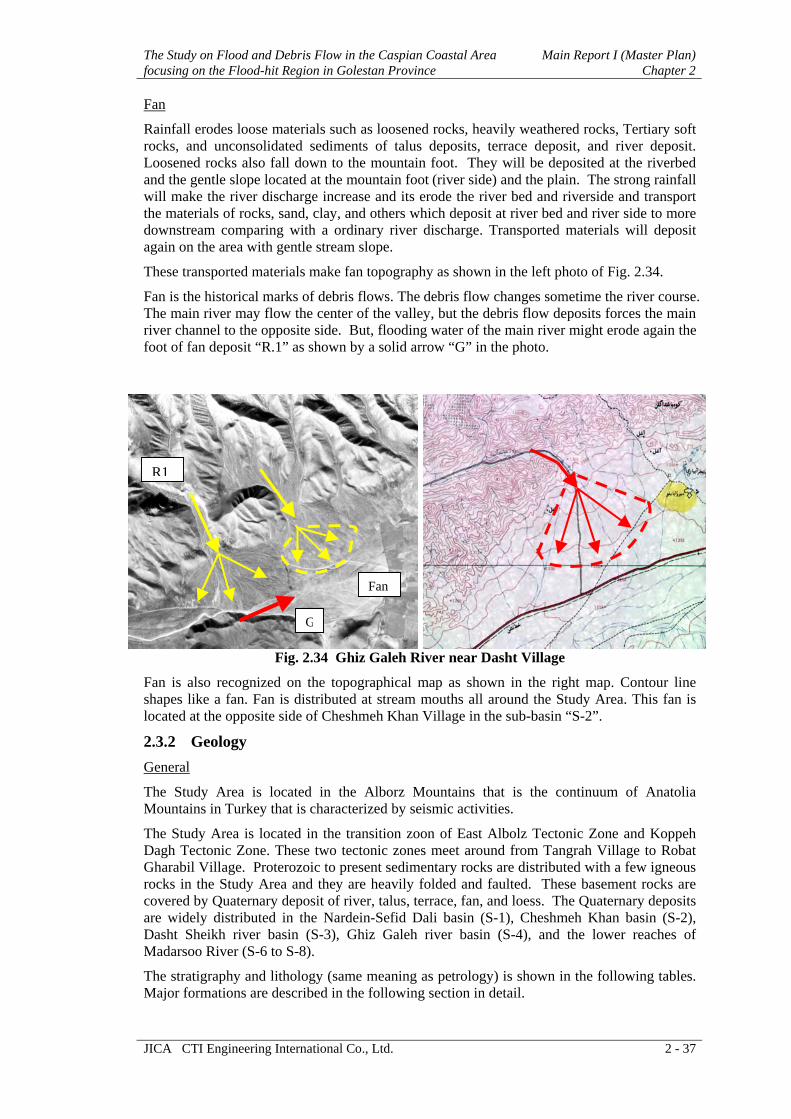
Rainfall erodes loose materials such as loosened rocks, heavily weathered rocks, Tertiary soft rocks, and unconsolidated sediments of talus deposits, terrace deposit, and river deposit. Loosened rocks also fall down to the mountain foot. They will be deposited at the riverbed and the gentle slope located at the mountain foot (river side) and the plain. The strong rainfall will make the river discharge increase and its erode the river bed and riverside and transport the materials of rocks, sand, clay, and others which deposit at river bed and river side to more downstream comparing with a ordinary river discharge. Transported materials will deposit again on the area with gentle stream slope.
These transported materials make fan topography as shown in the left photo of Fig. 2.34.
Fan is the historical marks of debris flows. The debris flow changes sometime the river course. The main river may flow the center of the valley, but the debris flow deposits forces the main river channel to the opposite side. But, flooding water of the main river might erode again the foot of fan deposit “R.1” as shown by a solid arrow “G” in the photo.
Fig. 2.34 Ghiz Galeh River near Dasht Village
Fan is also recognized on the topographical map as shown in the right map. Contour line shapes like a fan. Fan is distributed at stream mouths all around the Study Area. This fan is located at the opposite side of Cheshmeh Khan Village in the sub-basin “S-2”.
2.3.2 Geology General
The Study Area is located in the Alborz Mountains that is the continuum of Anatolia Mountains in Turkey that is characterized by seismic activities.
The Study Area is located in the transition zoon of East Albolz Tectonic Zone and Koppeh Dagh Tectonic Zone. These two tectonic zones meet around from Tangrah Village to Robat Gharabil Village. Proterozoic to present sedimentary rocks are distributed with a few igneous rocks in the Study Area and they are heavily folded and faulted. These basement rocks are covered by Quaternary deposit of river, talus, terrace, fan, and loess. The Quaternary deposits are widely distributed in the Nardein-Sefid Dali basin (S-1), Cheshmeh Khan basin (S-2), Dasht Sheikh river basin (S-3), Ghiz Galeh river basin (S-4), and the lower reaches of Madarsoo River (S-6 to S-8).
The stratigraphy and lithology (same meaning as petrology) is shown in the following tables. Major formations are described in the following section in detail.
Fan
R1
G

Main Report I (Master Plan) The Study on Flood and Debris Flow in the Caspian Coastal Area Chapter 2 focusing on the Flood-hit Region in Golestan Province
2 - 38 JICA CTI Engineering International Co., Ltd.
Table 2.26 Stratigraphy in the Study Area (East Alborz Zone)
Era Period/Epoch Formation Sym. Lithology*1 Quaternary
Alluvial Qal Sand & gravel with clay River deposit rd Sand & gravel Talus deposit td Clay, sand, gravel including debris flow
Holocene
0.01*2 Fan deposit fd Sand & gravel with clay Terrace Q1 Sand & gravel with clay Loess Qle Silt, sand with clay
Pleistocene
2 Basal conglo. Qpl Conglomerate Tertiary
- Ngc Conglomerate - Ngv Andesitic basalt, Basalt - Ngr Reddish shale, Marl, Sandstone, Conglomerate
Neogene
25 - Ngm Marl, gypsiferous-basal colored conglomerate. - Pgl Limestone, Sandy limestone with Nummulites - Pgm Nummulitic Marl, Sandstone
Cenozoic
65
Paleogene
65 Fajan Pgf reddish Conglomerate, Sandstone - K2 Limestone, detritic glouconitic Sandstone, MarlCretaceous Kartasch K1 grey Medium-bedded Limestone, Orbitolina Lar Jl Limestone, oolitic-porous dolomitic Limestone
- Jlm fine Limestone, grey, Ammonite, with Marl (lower)
Jurassic
Shemshak Js Upper: Shale, Marl, Sandstone, nodular Ls, Ammonite, Blemnite
Lower: Shale, Sandstone with thin-bedded limestone
Elika TRe2 thick-bedded Dolomite
Mesozoic
247 Triassic
Elika TRe1 Limestone, Marl, Shale, Ss in thin-bedded Permian Ruteh Pr grey medium-bedded Limestone, Fusulinid Carboniferous Mobarak Cm Limestone, medium-bedded massive Dolomite,
Lower part: calcareous shale Dkn Undivided sediments Dkn3 Limestone, Shale partly nodular & fossiliferousDkn2 white & red Gypsum Dkn1 Limestone intercalated with dark Shale
Khoshyeilagh
g white Gypsum
Devonian
Padeha Dp white & red Quartzitic sandstone, Upper part: intercalated with red Shale
Sn Shale, shaly Sandstone, Limestone. Upper part: nodular & fossiliferous
Sv2 Andesite lava
Silurian Niur
Sv1 Andesite lava & shale Ordovician Shirgesht O Limestone, Shale, sandy Shale
Mila εm Limestone, Dolomite with Brachiopoda & Trilobite
Paleozoic
575
Cambrian
- εs White Quartzitic sandstone. Upper: Quartzite Zaigun-Lalun Pεzl Shale, reddish quartzitic Sandstone Proterozoic Pre-Cambrian Baruf Pε Dolomite, dolomitic Ss, Shale, quartzitic Ss
*1: Ss: Sandstone, Ls: Limestone. Italic word: fossil name. *2: Geological age (x 106)
Source: Geological Quadrangle Map of Iran No.13. 1/250,000. Cartography by IRAN GEOGRAPH Co.
The Study on Flood and Debris Flow in the Caspian Coastal Area Main Report I (Master Plan)focusing on the Flood-hit Region in Golestan Province Chapter 2
JICA CTI Engineering International Co., Ltd. 2 - 39
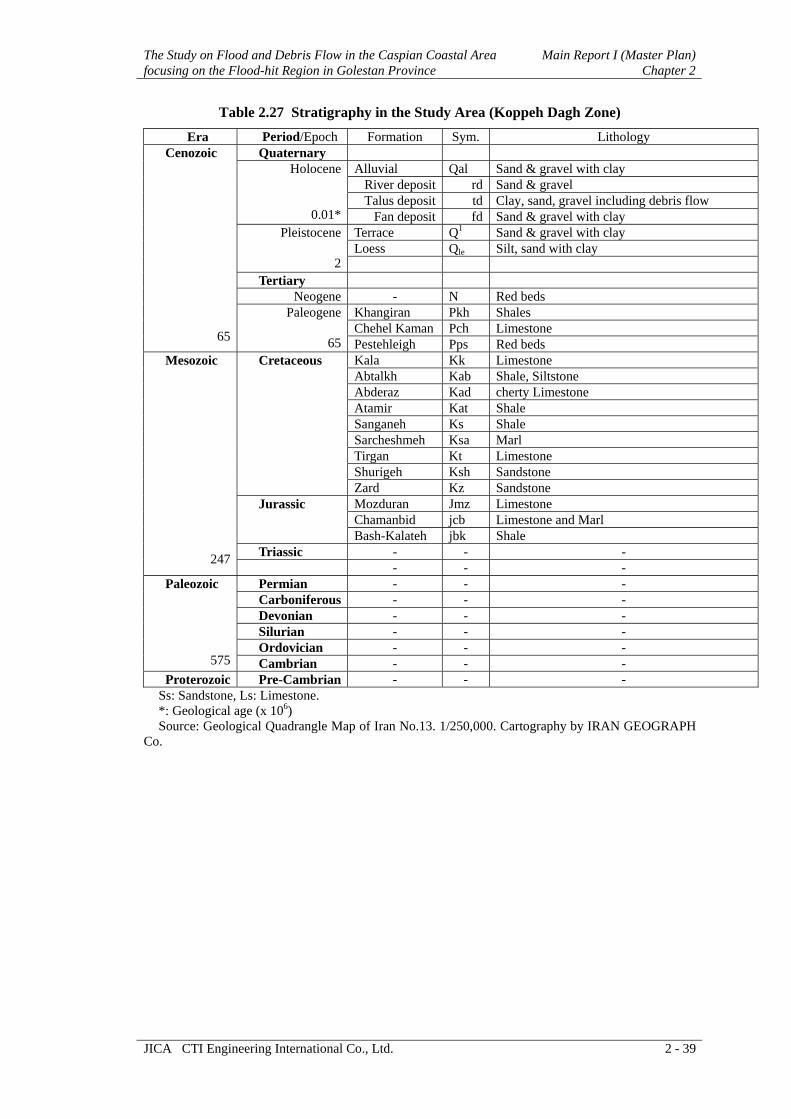
Table 2.27 Stratigraphy in the Study Area (Koppeh Dagh Zone)
Era Period/Epoch Formation Sym. Lithology Quaternary
Alluvial Qal Sand & gravel with clay River deposit rd Sand & gravel Talus deposit td Clay, sand, gravel including debris flow
Holocene
0.01* Fan deposit fd Sand & gravel with clay Terrace Q1 Sand & gravel with clay Loess Qle Silt, sand with clay
Pleistocene
2 Tertiary
Neogene - N Red beds Khangiran Pkh Shales Chehel Kaman Pch Limestone
Cenozoic
65
Paleogene
65 Pestehleigh Pps Red beds Kala Kk Limestone Abtalkh Kab Shale, Siltstone Abderaz Kad cherty Limestone Atamir Kat Shale Sanganeh Ks Shale Sarcheshmeh Ksa Marl Tirgan Kt Limestone Shurigeh Ksh Sandstone
Cretaceous
Zard Kz Sandstone Mozduran Jmz Limestone Chamanbid jcb Limestone and Marl
Jurassic
Bash-Kalateh jbk Shale Triassic - - -
Mesozoic
247 - - - Permian - - - Carboniferous - - - Devonian - - - Silurian - - - Ordovician - - -
Paleozoic
575 Cambrian - - - Proterozoic Pre-Cambrian - - -
Ss: Sandstone, Ls: Limestone. *: Geological age (x 106) Source: Geological Quadrangle Map of Iran No.13. 1/250,000. Cartography by IRAN GEOGRAPH
Co.

Main Report I (Master Plan) The Study on Flood and Debris Flow in the Caspian Coastal Area Chapter 2 focusing on the Flood-hit Region in Golestan Province
2 - 40 JICA CTI Engineering International Co., Ltd.
Tectonics
(1) Alborz Zone
Alborz Mountains has not monotonous stratigraphical specification and geological structure and also the length of geological periods.
The most area of northern slope in Alborz Mountains is lack of Palaeocene sediments and green tuff of Eocene epoch in Tertiary period. It shows that northern slope of Alborz went out of water because of orogeny in the beginning of Cenozoic era and also Alborz region separated from central Iran because of Aral-Caspian depression. General trend of east to west of Alborz is ancient extension and related to Alps stage.
The folding movement occurred in Palaeocene epoch and changed environmental condition that depression in north changed to dry and formed Alborz Mountains. Southern depression in Alborz Mountains developed quickly and resulted in vast depression of central Iran and generated the volcanic activity in the sea that formed volcanic formation in southern slope of Alborz. But volcanic formation was not distributed in northern slope of Alborz. The central part of southern Caspian block has subsided and is known as south Caspian depression at present. The second stage of orogeny happened in the beginning or middle of Eocene epoch. It causes to height and later erosion of central part of Alborz that quickly subsided and continuously deposited thick sediments of Molasses. Formation of Molasses in north of Alborz slope started in Vindobonian age of Miocene epoch. It is reported that thousands meter of marine molasses are related to Miocene to Pliocene epoch and Quaternary period. Marine sediments are also distributed in southern Caspian after orogeny (post-orogeny).
The last movements of Alborz orogeny occurred in late Pliocene or early Pleistocene epoch. These movements resulted in fault and gentle erosion.
It can be defined that northern border of Alborz is between small hills of northern slope and coastal field of Caspian Sea which are the part of relatively stable region of southern Caspian block. The east border between Alborz and Koppeh Dagh did not specified.
(2) Koppeh Dagh Zone
Ineshtoklin reported in 1968, Koppeh Dagh Zone is one of geological units that are located in the eastern part of the Study Area. Koppeh Dagh zone was formed by the uplift at the south of Caspian Sea in Precambrian period. Accomplished studies shows that Koppeh Dagh basin had been distributed up to the end of Triassic and after late Jurassic period sediments had changed to marine sediments. The most part of Koppeh Dagh basin went out from water in Paleogene of Tertiary period because of sea regression. Accordingly, Koppeh Dagh zone has no sediments after Paleogene epoch. Folds have the trend of northwest to southeast formed by Alps orogeny. On the other hand, faults have the trend of northeast to southwest that had been active in the Cretaceous period. Volcanic activity is rare. Border of Alborz and Koppeh Dagh zone will be the Korkhord Fault located in the northern part of middle to headwaters of Madarsoo River.
Stratigraphy
(1) Alluvial Deposits (Qal)
Alluvial Deposits include recent river deposit, talus deposit, and fan deposit.
These deposits are widely distributed in Alluvial plain at Cheshmeh Khan to Robat Gharabil Village (S-2), Dasht Village (S-3), Cheshmeh Nay to Hagholkhajeh Village (S-1), Nardein Village (S-1), and the lower reaches of Madarsoo River (S-6 to S-8).

The Study on Flood and Debris Flow in the Caspian Coastal Area Main Report I (Master Plan)focusing on the Flood-hit Region in Golestan Province Chapter 2
JICA CTI Engineering International Co., Ltd. 2 - 41
Main compositions are sediments of the numerous watercourses that flow in the plain and mountain foot.
Recent river deposit and floodplain deposit (rd)
Recent river deposits are distributed along the permanent and seasonal mainstream, flood way, its tributaries, and mountain stream. It generally consists of well-sorted silt, sand, and sand with rounded gravel layers in mainstream, flood way, and its tributaries. The thickness of this deposit is estimated a few ten meters in the headwaters to more than 50 meters in the lower reaches of Madarsoo River.
It mainly consists of sand and gravel with fine materials of silt and clay in the steep middle stream reaches of Madarsoo River, floodway, and steep mountain stream. They are eroded and transported again and again by every floodwater to downward.
Talus deposit (td)
It is distributed at mountain foot caused by the gravity fall and rainfall. It consists of all materials of clay, silt, sand, and gravel depending on the geology of the slope. Gravel and sand are dominant at the mountain foot of steep slope with sound rocks. But, sand and fine materials are distributed at the mountain foot of middle to gentle slope with heavily weathered rocks and or soft rocks.
Fan deposit (fd)
It is distributed at the mouth of mountain stream here and there and mainly consists of sand and gravel. The fan deposit will play an important role in the debris flow investigation that it is the trace of debris flow in the past.
Almost stream mouths at the mountain foot have the fan deposit. It is supposed to have occurred in any number of times in the past on the basis of depth of deposit and its stratigraphy. The thickness of one debris deposit may be a few meters in an average and 5 to 6 meters in maximum on the data of Japan. Debris flows in the Study Area have the thickness of about 10 to 30 meters in an average composed of a few layers that some layer is abounding with boulder and other layer is abounding with pebble to cobble. The river discharge or flooding scale may regulate transported gravel size.
Terrace deposit (Q1)
Terrace deposit is distributed bordering the sub-basin of Cheshmeh Khan to Robat Gharabil Village (S-2), Dasht Village (S-3), Cheshmeh Nay to Hagholkhajeh Village (S-1), Nardein Village (S-1), and the lower reaches of Madarsoo River. Main compositions are sediments of the old river courses or old floodplain that flow in the plain. It generally consists of well-sorted silt, sand, or sand and rounded gravel with silt. The thickness of this deposit is estimated a few ten meters.
(2) Loess Formation (Qle)
Loess is widely distributed in hilly region at the lower reaches of Madarsoo River and scattered here and there in the Study Area. Loess is the terrestrial sediment formed by the wind transportation and lack of layer deferring from aqueous and marine sediments. It is mainly composed of silt with a little clay and sand. It also consists of a kind of minerals such as quartz, feldspar, calcite, dolomite, mica, and iron. Its color is yellow to brown because of chemical weathering of iron and iron oxide. It is classified into “ML” or “ML-CL” and “ML-SP” in the Unified Soil Classification.
(3) Basal Conglomerate Formation (Qpl)
This formation is the basal conglomerate in Quaternary period. The conglomerate is weak in consolidation because of a few cementations and easily weathered and broken. It is distributed around Cheshmeh Khan to Robat Gharabil Village, north of

Main Report I (Master Plan) The Study on Flood and Debris Flow in the Caspian Coastal Area Chapter 2 focusing on the Flood-hit Region in Golestan Province
2 - 42 JICA CTI Engineering International Co., Ltd.
Hagholkhajeh Village, and southwest of Nardein Village. These distributions are utilized for pasture land or leave devastated land.
(4) Neogene Formation
Ngc
This is conglomerate of the Late Neogene epoch and distributed in Cheshmeh Khan to Robat Gharabil Village, west of Dasht Village, southern ridge of Hagholkhajeh Village, and southwest of Nardein Village. It is weak in consolidation and easily broken and eroded. It becomes easily the source of debris flow.
Ngm
Ngm is composed of reddish alternation of siltstone, sandstone, and conglomerate and widely distributed on the hilly region of around Dasht to Nardein Village, Hagholkhajeh Village, and Cheshmeh Khan to Robat Gharabil Village. It becomes also the source of debris flow because of weak consolidation and easily broken. It is the bed with a strike and dip of N30oE/80oSE to N50oE50oSE in the Ghiz Galeh River basin.
(5) Paleogene Formation (Pgm)
This formation consists of marl with fossil of nummulites and sandstone. They are not well consolidated and distributed in local at the south of Cheshmeh Nay Village and north of Nardein Village.
(6) Fajan Formation
It is the formation of reddish conglomerate and sandstone distributed at Peighambar Mountains located the north of Haghol Khajeh Village and north of Nardein Village.
(7) K2 Formation (K2)
It is mainly composed of limestone with a glauconite sandstone and marl in latest Cretaceous period. They are distributed with the direction of south-west to north-east from Nardein to Cheshmeh Khan Village, northern to western heights of Nardein Village with a strike and dip of N75oE/20oNW, Dasht Shad Village in local with a strike and dip of N45oE/40oNW, Peighambar mountains located the north of Haghol Khajeh Village with a strike and dip of N45oE/50oNW, and south of Cheshmeh Khan Village.
(8) K1 Formation (K1)
It is the sediment of lower Cretaceous period and mainly composed of grey medium-bedded limestone with a fossil of orbitolina. It is distributed locally at west of Cheshmeh Nay Village with a strike and dip of N30oE/45oSE.
(9) Lar Formation (J1) (Jl: East Alborz Zone)
It is the sediment of upper Jurassic period and compared with Mozduran Formation (Jmz) in the Koppeh Grah Tectonic Zone. This formation is composed of hard limestone forming strongly steep slope and cliff and porous dolomitic limestone. It is distributed in the lower to middle stream reaches of Madarsoo River with a direction of southwest to northeast covering almost territory of Golestan National Park.
Mozduran Formation (Jmz: Koppeh Gagh Zone)
It is composed of very hard grey limestone and distributed only in the eastern edge of the Study Area.
(10) Jlm Formation (Jlm: East Alborz Zone)
This formation is composed of grey fine-grained limestone with a fossil of ammonite and marl in the lower part. It is distributed in the southwest of Dast Shad Village

The Study on Flood and Debris Flow in the Caspian Coastal Area Main Report I (Master Plan)focusing on the Flood-hit Region in Golestan Province Chapter 2
JICA CTI Engineering International Co., Ltd. 2 - 43
with a strike and dip of N45oE/25oNW, Khonbi Mountains located south of Cheshmeh Khan Village with a strike and dip of N65oE/25oNE, and west of Dasht Village with a strike and dip of N80oW/20oNE.
Chamanbid Formation (Jcb: Koppeh Gagh Zone)
It is the sediment of middle Jurassic period and compared with “Jlm” Formation in the East Alborz Tectonic Zone. It is composed of limestone and marl and widely distributed from the headwaters to lower reaches of Madarsoo River in the Study Area, especially in the northern slope of Tangrah Village.
(11) Shemshak Formation (Js)
It is the sediment of lower Jurassic period and mainly composed of shale, marl, sandstone, and nodular limestone with a fossil of ammonite and blemnite. It is scattered only in the south of Robat Gharabil Village, south of Dasht Village, near Dast Shad Village with a strike and dip of N20oW/40oNE, around Cheshmeh Nay Village and northwest of Nardein Village.
(12) Khoshyeilagh (Dkn)
It is the sediment of Devonian period and mainly composed of limestone and shale with a lot of fossil. It is distributed in the lower reaches of Madarsoo River at the south of Pasang Village with a strike and dip of N70oW/10oNE and locally distributed in the southeast of Sefid Dali Village.
(13) Niur Formation (Sn)
It is the sediment of Silurian period and mainly composed of shale, sandstone, and limestone with a lot of fossil in the upper part. It is scattered near Dasht Village with a strike and dip of N45oW/25oNE and distributed accompanied by andesite lavas in the north of Robat Gharabil Village. Rocks of this formation are weathered in general.
(14) Baruf Formation (Pε)
It is the one of the oldest formation of Pre-Cambrian period in Proterozoic era in the Study Area. It is composed of dolomite, dolomitic sandstone, shale, and quartzitic sandstone and distributed around the Golestan forest tunnel and around Nardein Village in local. Rocks of this formation and other Pre-Cambrian formation (Pε-εm) are weathered in general.
2.3.3 Consideration on Debris Flow Sediment Source
Topographical feature has important information of geological distribution. In other word, topography is sure to reflect the characteristic of geology. The objectives of this clause are to clarify the sediment sources for debris flow on the basis of topographical and geological conditions in the Study area. That is why, geological characteristic, especially unconsolidated deposit and soft rock will be classified by the field survey, aerial and satellite image interpretation. The results are compiled in Fig. 2.38.
Table 2.28 Correlations between Topography and Geology Slope Lithology
Level – Gentle Unconsolidated deposits: river, talus, fan, terrace Moderate Soft rocks: Tertiary formations,
Weathered, sheared, altered rocks Silurian and Pre-Cambrian formations (heavily weathered)
Steep to very steep Sound rocks

Main Report I (Master Plan) The Study on Flood and Debris Flow in the Caspian Coastal Area Chapter 2 focusing on the Flood-hit Region in Golestan Province
2 - 44 JICA CTI Engineering International Co., Ltd.
For example, Sub-basin S-5, which covers the middle stream of Madarsoo River and Golestan National Park is located, has the most steep and very steep slope with a ratio of these slope gradient about 47%. It is composed of sound rocks. On the other hand, Sub-Basin S-1, S-2, S-3, and S-4 have level to gentle slope with a ratio of these slope gradients about 70%. They are mainly composed of unconsolidated deposits and soft rocks. They have the possibility of more sediment supply comparing with Sub-Basin 5.
Erosion and Deposit
There are some types of erosion by rainfall and river flow as follows:
Downward and side erosion for river bed deposits with side erosion by river flow,
Slope erosion for talus deposit, terrace deposit, soft rocks, and loosened rocks, and
Sheet erosion for topsoil, terrace deposit, and heavily weathered rocks on dry farm land.
The slope erosion and sheet erosion will constantly supply the materials to the riverbed. The accumulated riverbed materials will be sometimes transported to the downstream by flooding water. The downward erosion in the river or mountain stream is the strongest comparing with other erosion types when flooding water comes. Then, debris flow investigation should focus on the distribution of riverbed deposit to establish the hazardous area in the first place. Secondly, the distribution of unconsolidated deposits, which have the potential sources of sedimentation to the river, will be investigated.
In the 2001 Flood, downward erosion (channel incision) was remarkable and side erosion (bank erosion) and sheet erosion were not serious in the river basin of Terjenly and Tangrah Villages and Ghiz Galeh river basin. In these rivers, river bed deposit might have the thickness of about 2 meters in Terjenly str Photos on Dasht-e-Sheikh No.1 Dam eam, 5 to 10 meters in Tangrah stream, and more than 20 meters in Ghiz Galeh river. These had deposited on the gentle slope in the stream and river. Ordinary river flow will not erode this river deposit on gentle sloping area and erodes and transport the riverbed materials on only steep slope to the downward. That is why; this 2002 rainfall is unusually heavy. But, the study will be recommended to take measures for next unusual rainfall for streams and river, which have thick (more than 2 meters) river deposit.
Fig. 2.35 Typical Geological Conditions in the Madarsoo Basin
Left photo is the view of Terjenly stream basin. Tributaries are not devastated. The center-left exposure (brownish) is sound and stable that does not supply a lot of soil and gravel to the river. Debris flow occurred eroding existing riverbed deposit at Terjenly Village.
Right photo shows that slope erosion (gully erosion) for Tertiary soft rocks (Ngm) and downward erosion for riverbed deposit at Ghiz Galeh River.

The Study on Flood and Debris Flow in the Caspian Coastal Area Main Report I (Master Plan)focusing on the Flood-hit Region in Golestan Province Chapter 2
JICA CTI Engineering International Co., Ltd. 2 - 45
Criteria for Debris Flow Occurrence
The element of occurrence for debris flow consists of various conditions such as rainfall, topography, geology, vegetation, and land use as summarized below.
Table 2.29 Occurrence Factors of Debris Flow
Rank Related Factors 1 2 3 4 5
Vegetation Bare Scattered grass
Grass Shrub Forest
Land use Bare Dry farm Range Fruit plant. Forest Channel gradient θ >20o 20º>θ> 15º 15º>θ> 10º 10º>θ> 3º < 3º Slope gradient θ >20o 20º>θ> 15º 15º>θ> 10º 10º>θ> 3º < 3º Channel deposit thickness
>2m 2>T>1m <1m
Geology Volcanic ash, sand (dune)
River, terrace, talus deposits
Weathered, sheared, loosen rocks. Tertiary soft rocks
Jointy rocks Sound rock
Deposit thickness >5m 5-2m 2-1m <1m - Fault/Alteration Large >5m Medium 5-
1m Small <1m Non -
Spring Yes Yes in rainy Wet ground Non - Landslide volume >1000m3 1000-500m3 500-100m3 <100m3 Non Collapse volume >100m3 100-10m3 <10m3 Non - Rainfall Both Continuous and hourly rainfall are important Earthquake One of the trigger of debris flow
The above-mentioned related factors could be divided into two causal factors of debris flow: predisposing causes and triggers. The relationship among them could be illustrated in the following figure.
Basin Geology Usual Intensive Rainfall
Sediment Yield
Channel Deposits
Channel Gradients
Predisposing Causes
Land use and Vegetation
Triggers
Excessive Intensive RainfallLandslide/Slope CollapseEarthquakeChannel DepositsChannel Deposits
Debris FlowTransitional FlowBed and Suspended Load Transport
Fig. 2.36 Relationship among the Causal Factors of Debris Flow

Main Report I (Master Plan) The Study on Flood and Debris Flow in the Caspian Coastal Area Chapter 2 focusing on the Flood-hit Region in Golestan Province
2 - 46 JICA CTI Engineering International Co., Ltd.
Based on the experiences in Japan, debris flow will be easy to occur empirically at a stream, overlapping with the following conditions:
Excessive intensive rainfall,
Steep stream gradient with more than 15 degrees,
Existence of thick riverbed deposit with more than 2m,
Drainage area of more than 5 hectares, and
Thick unconsolidated deposit in the slope (talus deposit, terrace deposit, landslide) with Bare land.
On the other hand, debris flow will rarely occur on the combination of gentle stream gradient, a few river deposits, sound rocks on slope, and forest.

The Study on Flood and Debris Flow in the Caspian Coastal Area Main Report I (Master Plan)focusing on the Flood-hit Region in Golestan Province Chapter 2
JICA CTI Engineering International Co., Ltd. 2 - 47
Fig. 2.37 Slope Classification

Main Report I (Master Plan) The Study on Flood and Debris Flow in the Caspian Coastal Area Chapter 2 focusing on the Flood-hit Region in Golestan Province
2 - 48 JICA CTI Engineering International Co., Ltd.
Fig. 2.38 Engineering Geological Map

The Study on Flood and Debris Flow in the Caspian Coastal Area Main Report I (Master Plan)focusing on the Flood-hit Region in Golestan Province Chapter 2
JICA CTI Engineering International Co., Ltd. 2 - 49
2.4 Land Use
2.4.1 Definitions of Land Use Land
Land is a delineated area of earth surface embracing all attributes of biosphere above and below it, including climate, soil, geological materials, flora, fauna, as well results of human activity, such as pond/reservoir and afforestation.
Land Resources
Land Resources are of two categories: 1) Natural land- constitutes natural elements such as climate, soil and vegetation. 2) Artificial land- includes products of human activity such as dam/dike, roads, canal and terraces.
Land Use
Land Use is any kind of permanent or cyclic human intervention to satisfy human needs, either material or spiritual or both, from the complex of natural (climate, soil, vegetation) and artificial (dike, road, canal) resources, which together are called land.
Land Use Planning
Land Use Planning is the development of plans for uses of land that will, over a long period, best serve the general welfare, together with the formulation of means/measures for achieving such uses. Land use planning is important in enhancing the living condition of people, by increasing productivity of resources, and preserving natural assets for future generations through proper management and sustainable utilization.
Land Use Plan
Land Use Plan for Study Area has been formulated based on the following concept/ assumption:
(1) Target year for the project is 2025, and its implementation is commenced just after completion of feasibility study and submission of relevant reports by JICA (Japan International Cooperation Agency) study team.
(2) Average annual population growth rate is fixed at 1.8 % per year, assuming all factors on population growth remain constant. This figure has been estimated by Iranian experts, based on growth rate for the last 10 years, and mentioned in Reports provided by MOJA (Ministry of Jihad-e-Agriculture).
(3) Area (space) expansion for residential purposes is set at 119 m2 per person, including spaces for road network, commercial, educational, sanitary and other facilities, in line with figures provided by Housing Foundation of Islamic Revolution, Golestan province.
(4) Desert area is vegetated at a rate of 2% per year, considering water scarcity and harassed climate, more than this is not expected.
(5) Only 40% of bare land is converted to agricultural and pasture lands at an average rate of 2% per year, due to limitations such as presence of rocks/gravel, and scarcity of water.
(6) Structures such as dam/dike and relevant facilities to be constructed for flood/debris flow control are of small scale and require limited space.
(7) About 85% of scattered, small and unproductive dry farms established in rangelands are abolished, and 15 % remain for self-subsistence of persons associated with livestock pens.

Main Report I (Master Plan) The Study on Flood and Debris Flow in the Caspian Coastal Area Chapter 2 focusing on the Flood-hit Region in Golestan Province
2 - 50 JICA CTI Engineering International Co., Ltd.
(8) Area of existing lake/pond is kept unchanged, since the study team does not purpose construction of any reservoirs.
(9) Afforestation (artificial forest) is not significantly expanded, but existing natural forestlands are rehabilitated/improved and properly managed. Natural forest area is expanded by about 4%, to bring the situation back to that of 1960s.
(10) Rangeland area is rehabilitated/improved and expanded by about 4.5% over the next 20 years, to get a situation somewhat near to that of 1960s.
(11) Area for irrigated agriculture is not expanded, but farms are modernized and properly managed to attain higher yield in unit area, in accordance with MOJA policy.
(12) To avoid overgrazing and ensure sustainable utilization of natural resources, reduction in number of livestock (even up to 50 %) is carried out, and domestic animals are dismissed from forest, as stressed in 3rd and 4th development plans of the country, and emphasized by the Ministry of Jihad-e-Agriculture (MOJA).
(13) Sufficient and timely fuel is made available to inhabitants to discourage illegal harvest of forest resources, as stipulated in 3rd and 4th development plans of the country.
(14) Inhabitants are educated on importance of natural resources and concept of sustainable utilization, as well encouraged to participate in development activities (MOJA policy).
2.4.2 Guidelines/Procedures for Execution of Land Use Planning However this land use plan is spatial in nature, it should be implemented by referring to the following maps/materials inserted in the report of the JICA study team or available with MOJA.
Table 2.30 Map Utilized for Land Use Planning
Thematic Map Available Data/Information/Map Map of present land use Precipitation isohyets map/material Map of land capability classification Long-term climatic data/information Map of slope classification Map showing location of historical and cultural assets Geology map Map showing location of existing and proposed
structural measures Soil map Soil classification map/materials
The plan should be implemented by paying attention to the following points:
(1) Area allocated for afforestation is gradually planted by fast growing trees in localities susceptible to (massive/gully) erosion, and subjected to frequent flood/debris flow. Forestry experts of MOJA are expected to provide technical details and cooperate in afforestation works.
(2) Bare land shown on present land use map is carefully surveyed and suitable parts (having no rock/gravel limitation) are identified and gradually vegetated. Rangeland experts of MOJA, and staff of NRGO (Natural Resources General Office) of relevant provinces would cooperate on this matter.
(3) Part of desert-land is gradually converted to pasture by introducing drought resistant vegetation, starting from localities with most favorable conditions.
(4) Over the past 30 years area of dry farming has largely increased by being expanded in rangeland and on slopes nearby villages. Most of expanded farms are unproductive, and cause soil erosion. To prevent further land degradation, gradual reduction in dry farming is recommended. Farms on slopes are converted to olive/nut yards. Soil and

The Study on Flood and Debris Flow in the Caspian Coastal Area Main Report I (Master Plan)focusing on the Flood-hit Region in Golestan Province Chapter 2
JICA CTI Engineering International Co., Ltd. 2 - 51
Water Research Division of Golestan Provincial Jihad-e-Agriculture Organization has good field experiences and is expected to cooperate in execution tasks.
(5) In last decades, the area of irrigated farming has doubled, thus no further expansion of irrigated area is proposed. Instead improvement in irrigation facility/method and proper utilization of water and management of water resources are recommended.
2.4.3 Past Land Use To grasp land use situation in the past decades, the available data/materials were thoroughly examined, result of which is briefly presented below.
Data for land use in 1960s indicates that larger areas have been under rangeland and forest, and lesser areas under irrigated and dry farming (Table 2.31). This could be attributed to lower population, and biological densities in the area, and thus less pressure on natural resources. Area of bare land was significantly high, indicating less competition for land occupation, and more choices in selecting favorable location for economic activities. Large area of forest occurred in territory of Golestan province, while rangelands were distributed mostly in Khorasan and Semnan province. Irrigated farming was mainly practiced in lower reaches of Madarsoo river basin in plains of Golestan province.
Table 2.31 Past (1960s) Land Use in the Madarsoo River Basin
Land Use Area (ha) % of Total Afforestation 1,814 0.77 Bare Lands 5,502 2.33 Desert 1,067 0.45 Dry Farming 30,748 13.01 Forest 67,473 28.54 Irrigated Farming 14,865 6.29 Lake 115 0.05 Rangeland 114,552 48.45 Mixed Dry Farming and Rangeland 10 0.00 Residential (Urban) 254 0.11 Others (limits of sites for structures, roads, observatory stations, etc)
- -
Total 236,400 100.00 Source: Ministry of Jihad-e-Agriculture (MOJA), GIS Division.
2.4.4 Present Land Use Present land use map (2005) was prepared based on the latest (2002) satellite imagery of the area, checked through field survey and revised based on experience and knowledge of MOJA experts, with collaboration of the JICA study team. Final output of this work is presented in Table 2.32 as well as shown in Fig. 2.39.
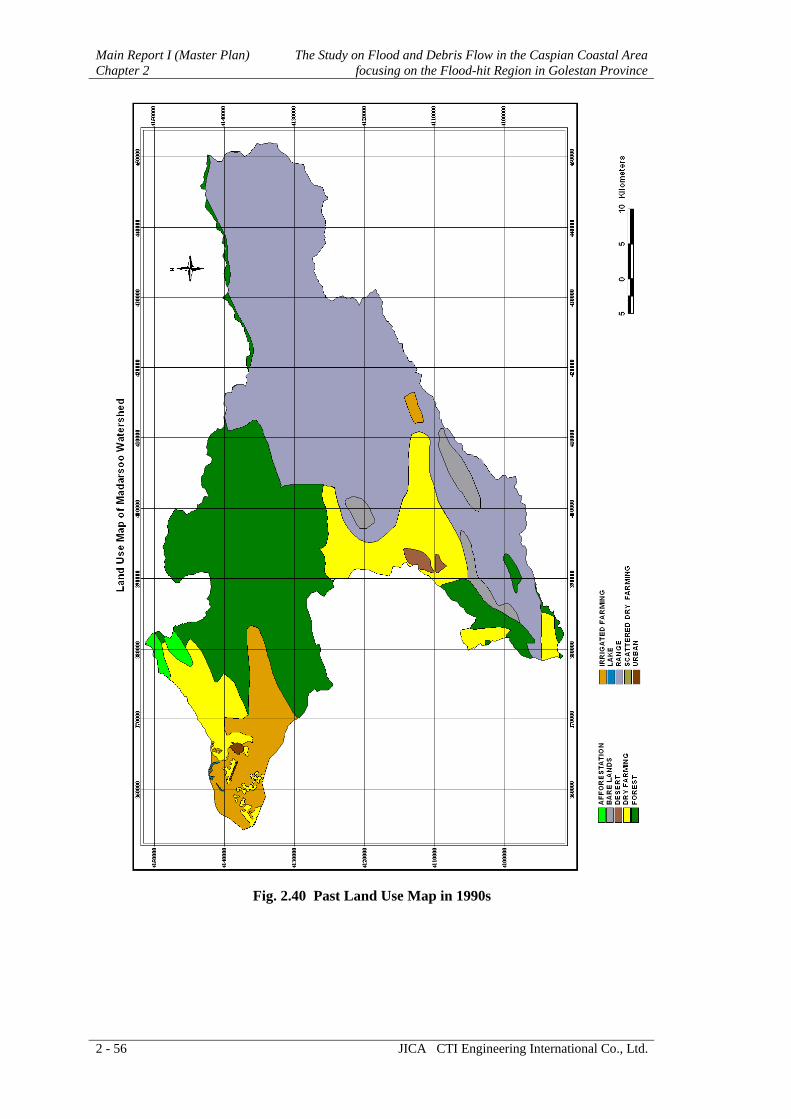
Careful examination of present land use and comparing it to that of 1990s, as shown in Fig. 2.40 as reference, reveal that:
The area of bare land has decreased by about 51%, and mainly converted to dry farms.
Area of dry farming has increased by about 22 %, and the increment is more significant in those parts of the basin occurring in Semnan and Khorasan provinces.
Forest area has decreased by about 4%, particularly in less elevated area nearby villages.
Area of irrigated farming has increased by 51%, and the increment is more pronounced in those parts of the basin occurring in Khorasan and Semnan provinces.
Area of rangeland has reduced by 21%, and mostly converted to dry farms.

Main Report I (Master Plan) The Study on Flood and Debris Flow in the Caspian Coastal Area Chapter 2 focusing on the Flood-hit Region in Golestan Province
2 - 52 JICA CTI Engineering International Co., Ltd.
Table 2.32 Present (2005) Land Use in the Madarsoo River Basin Land Use Area (ha) % of Total
Afforestation 1,830 0.77 Bare Lands 2,693 1.14 Desert 1,078 0.46 Dry Farming 39,276 16.61 Forest 64,781 27.40 Irrigated Farming 30,703 12.99 Lake 126 0.05 Rangeland 94,709 40.06 Mixed Dry Farming and Rangeland 938 0.41 Residential (Urban) 266 0.11 Others (limits of sites for structures, roads, observatory stations, etc)
- -
Total 236,400 100.00 Source: Golestan Provincial Jihad-e-Agriculture Organization, GIS Section, with collaboration of JICA Study Team- September 2005.
2.4.5 Future Land Use In formulating the future land use plan by paying attention to following points:
(1) Noting chronic changes in land use during the past decades by examining relevant documents and materials
(2) Predicting the future population till target year of 2025
(3) Realizing the biological capability and environmental condition of the area
(4) Paying attention to concept of sustainable development and wise/efficient utilization of natural resources
(5) Avoiding any harm to national natural reserves or historical/cultural heritages
(6) The plan is a back to future approach, means attempt is made to bring the status of natural resources more or less near to that of 1960s, which reflects the biological capability of the area on that period. And in planning biological capability should be highly considered.
(7) Emphasizing on crop yield increment in existing irrigated fields by enhancing water use efficiency and improvement in farm practice, rather area expansion
Table 2.33 Future (2025) Land use in the Madarsoo River Basin
Land Use Area (ha) % of Total Afforestation 1,840 0.79 Bare Lands 1,616 0.68 Desert 647 0.27 Dry Farming 34,095 14.42 Forest 67,371 28.50 Irrigated Farming 30,703 12.99 Lake 126 0.05 Rangeland 98,970 41.87 Mixed Dry Farming and Rangeland 141 0.06 Residential (Urban) 741 0.31 Others (limits of sites for structures, roads, observatory stations, etc)
150 0.06
Total 236,400 100.00 Source: Golestan Provincial Jihad-e-Agriculture Organization, GIS Section, with collaboration of JICA Study Team- September 2005.

The Study on Flood and Debris Flow in the Caspian Coastal Area Main Report I (Master Plan)focusing on the Flood-hit Region in Golestan Province Chapter 2
JICA CTI Engineering International Co., Ltd. 2 - 53
Land Capability is the capacity/fitness of a piece of land for a defined use. In expressing land capability two terms are used:
(1) Current capability refers to land capability for a defined use at its present condition (without improvement measures).
(2) Potential capability is capability of land for a defined use at some future date (after completion of improvement measures).
Data/information on land capability in the Madarsoo River basin is presented in Table 2.34, as well as shown in Fig. 2.41. MOJA experts may refer to these materials while executing the land use plan.

Main Report I (Master Plan) The Study on Flood and Debris Flow in the Caspian Coastal Area Chapter 2 focusing on the Flood-hit Region in Golestan Province
2 - 54 JICA CTI Engineering International Co., Ltd.
Land
Cap
abili
ty in
the
Mad
arso
o R
iver
Bas
in
Cod
e A
rea
(ha)
%
of T
otal
Pr
esen
t Situ
atio
n Im
prov
emen
t Mea
sure
s nee
ded
Situ
atio
n af
ter I
mpr
ovem
ent
12
7,01
2 3.
0 M
ount
aino
us a
rea
with
shal
low
soils
, pas
tura
l veg
etat
ion
and
woo
dy p
lant
s. U
sed
for s
easo
nal g
razi
ng. P
rone
to e
rosi
on
and
degr
adat
ion.
Eros
ion
and
runo
ff c
ontro
l, ca
re
for r
ange
land
(con
trol g
razi
ng
and
re-v
eget
atio
n)
Ran
gela
nd w
ith b
ette
r soi
l con
ditio
n an
d hi
gher
pro
duct
ion.
La
nd w
ith
mor
e re
liabi
lity
and
high
er v
alue
13
17
,906
7.
6 M
ount
ains
with
30
to 6
0% sl
ope,
mod
erat
ely
deep
soils
with
ro
ck o
utcr
ops,
pron
e to
ero
sion
and
land
slid
e. P
oor
rang
elan
d, w
ith fo
rest
tree
s in
som
e lo
calit
ies.
Proh
ibiti
on o
f gra
zing
and
tree
cu
tting
, for
est a
nd ra
ngel
and
reha
bilit
atio
n, c
ount
erm
easu
re
for e
rosi
on a
nd la
ndsl
ide.
Can
be
used
for g
razi
ng w
ith p
rope
r m
anag
emen
t. C
ontri
bute
in
enha
ncem
ent o
f eco
syst
em o
f the
bas
in
15
117,
526
49.7
M
ount
ains
with
shar
p sl
ope
(50
to 1
00%
), M
oder
ate
to d
eep
and
rela
tivel
y he
avy
soils
, for
est l
and,
pro
ne to
deb
ris fl
ow/
eros
ion
and
subj
ect t
o la
ndsl
ide
in so
me
loca
litie
s. D
ry
farm
ing
is p
ract
iced
in so
me
flat p
atch
es.
Mea
sure
s for
ero
sion
, deb
ris
flow
and
land
slid
e co
ntro
l. A
band
on o
f dry
farm
ing
and
intro
duct
ion
of w
oody
pla
nts.
Fore
st m
aint
enan
ce w
orks
.
Prop
er si
te fo
r pro
mot
ion
of
Eco-
tour
ism
, and
con
serv
atio
n of
bi
o-di
vers
ity. W
ood
prod
uctio
n un
der
prop
er m
anag
emen
t.
22
4,43
2 1.
9 H
ills w
ith20
to 4
0% sl
ope,
dee
p he
avy
soils
, poo
r pas
tura
l ve
geta
tion,
subj
ecte
d to
seve
re e
rosi
on. L
ow-d
ensi
ty fo
rest
w
ith d
ry fa
rmin
g.
Aba
ndon
of d
ry fa
rmin
g.
Intro
duct
ion
of c
omm
erci
al
trees
. Mea
sure
s for
ero
sion
and
ru
noff
cont
rol.
Suita
ble
plac
e fo
r woo
d an
d fr
uit
prod
uctio
n, su
ch a
s oliv
e an
d nu
ts.
32
4,23
4 1.
8 A
lluvi
um te
rrac
es w
ith g
rave
lly so
ils, p
rone
to fl
ood
and
sedi
men
ts. P
rese
ntly
are
und
er ir
rigat
ed fa
rmin
g
Mea
sure
s for
floo
d an
d se
dim
ent c
ontro
l.
Land
with
bet
ter q
ualit
y an
d hi
gher
re
liabi
lity
for g
rain
pro
duct
ion.
42
81
,708
34
.5
Pied
mon
t pla
ins w
ith 1
to 3
% sl
ope,
dee
p he
avy
soils
, hig
h gr
ound
wat
er ta
ble
in m
ost p
arts
, sub
ject
ed to
floo
d/de
bris
. La
rgel
y oc
cupi
ed b
y irr
igat
ed fa
rms.
Mea
sure
s for
floo
d/de
bris
flow
co
ntro
l. Pr
ovis
ion
of d
rain
age,
pr
oper
farm
ing
prac
tices
.
Land
with
hig
her v
alue
and
mor
e pr
oduc
tivity
. Sui
tabl
e fo
r int
rodu
cing
va
riety
of c
rops
in ir
rigat
ed fi
elds
.
53
3,58
2 1.
5 A
lluvi
al (s
edim
enta
ry) p
lain
s with
gen
tle sl
ope,
dee
p he
avy
soils
, hig
h w
ater
tabl
e, p
rone
to fl
ood,
and
salin
ity. P
rese
ntly
m
ost p
arts
are
occ
upie
d by
dry
farm
s.
Mea
sure
s for
floo
d an
d er
osio
n co
ntro
l, pr
ovis
ion
of ir
rigat
ion
and
drai
nage
faci
litie
s.
Cre
atio
n of
suita
ble
arab
le la
nds,
expa
nsio
n of
in ir
rigat
ed a
rea
and
incr
emen
t in
agric
ultu
ral p
rodu
ctio
n.
Suita
ble
plac
e fo
r pro
duci
ng fo
rage
To
tal
236,
400
100.
00
So
urce
s: G
oles
tan
Prov
inci
al J
ihad
-e-A
gric
ultu
re O
rgan
izat
ion,
GIS
Sec
tion;
Soi
l and
Wat
er R
esea
rch
Sect
ion.
JI
CA
Stu
dy T
eam
, Fie
ld S
urve
y on
Lan
d us
e- O
ctob
er 2
004 ~
June
200
5.
Table 2.34 Land Capability in the Madarsoo River Basin

The Study on Flood and Debris Flow in the Caspian Coastal Area Main Report I (Master Plan)focusing on the Flood-hit Region in Golestan Province Chapter 2
JICA CTI Engineering International Co., Ltd. 2 - 55
Fig. 2.39 Present Land Use Map in 2005
Main Report I (Master Plan) The Study on Flood and Debris Flow in the Caspian Coastal Area Chapter 2 focusing on the Flood-hit Region in Golestan Province
2 - 56 JICA CTI Engineering International Co., Ltd.
Fig. 2.40 Past Land Use Map in 1990s

The Study on Flood and Debris Flow in the Caspian Coastal Area Main Report I (Master Plan)focusing on the Flood-hit Region in Golestan Province Chapter 2
JICA CTI Engineering International Co., Ltd. 2 - 57
Fig. 2.41 Land Capability Map in the Madarsoo River Basin

Main Report I (Master Plan) The Study on Flood and Debris Flow in the Caspian Coastal Area Chapter 2 focusing on the Flood-hit Region in Golestan Province
2 - 58 JICA CTI Engineering International Co., Ltd.
2.5 Meteorology
2.5.1 Climate The study area, Madarsoo River basin, is stretch in-between longitude 55o 21’ to 56o 28’ E and latitude 36o 58’ to 37o 30’ N. Rainfall distribution patterns in the basin were analyzed. Study shows semi-arid type of climate is prevalent in the basin. The monthly and annual rainfalls amounts at stations in the basin are quite variable. For instance, annual rainfalls are: 695 mm (Tangrah), 357 mm (Dasht Shad) and 198 mm (Robat Gharebil). Similarly, monthly rainfalls in March are: 99 mm (Tangrah), 45 mm (Dasht Shad) and 30 mm (Robat Gharebil). March is the highest rainfall month in the basin. After analyzing the annual and monthly rainfalls at stations in the basin; it shows that November to May are wet months; and June to October are dry months (Fig. 2.42). As usual, convectional, orographic, cyclonic and monsoon rains occur in the basin.
Wet and dry months in basin(Based on:1975-2002 rainfalls records of Tangrah)
0
20
40
60
80
100
Jan Feb Mar Apr May Jun Jul Aug Sep Oct Nov Dec
Rai
nfal
l (m
m) Average Line
WetMonthsWet Months Dry Months
Fig. 2.42 Wet and Dry Months in the Madarsoo Basin
(1) Convectional Rain
Clouds developed over the Mediterranean Sea by convection process during hot or summer season are transported to Iran by seasonal winds. Those clouds make rainfalls all over the country during summer season after being condensed as usual.
(2) Orographic Rain
While transporting clouds developed over the Mediterranean Sea and others, cold moist air laden clouds come in contact with warm air layer over Alborz and Zagros mountains; and the clouds are raised up and make rainfalls in and around the mountainous regions because of condensation. Similarly, cold and dry air from Siberia (anti-cyclone) when passes over the Caspian Sea gets moist; and makes rainfalls over the areas along the Sea due to condensation and orographic effect of Alborz mountain. The orographic effect Alborz Mountain is clearly presented in annual rainfalls isohyets. Contours of annual rainfalls isohyets are developed in the North-South direction as the Alborz Mountain stretches.

The Study on Flood and Debris Flow in the Caspian Coastal Area Main Report I (Master Plan)focusing on the Flood-hit Region in Golestan Province Chapter 2
JICA CTI Engineering International Co., Ltd. 2 - 59
(3) Cyclonic Rain
Cyclones or Typhoons developed over the Mediterranean Sea make rainfalls in Iran while passing through the country.
(4) Monsoon Rain
The monsoon developed over the Bay of Bengal and Indian Ocean sometimes cause rainfalls in Iran. Creation of Sub-Tropical High Pressure (STHP) belt is one of the impeding factors for not getting enough monsoon rainfalls. The study of monthly rainfalls distribution in the Madarsoo basin also shows that June to October are dry months, although, monsoon is prevalent during May to September.
2.5.2 Meteorological Network Meteorological network is mainly managed by Meteorological Organization (MO) of Islamic Republic of Iran. However, Ministry of Energy (MOE) has also their own rain-gauge station network to measure rainfalls.
Meteorological Organization (MO)
This organization is managing meteorological network to observe meteorological parameters like, rainfall, humidity, evaporation, air temperature, air pressure, wind speed and direction, sunshine hours, solar radiation, visibility, etc. For these purposes, there are four types of stations: online, synoptic, climatological and rain-gauge stations. The inventory of meteorological stations is presented in Table A2.1 (ANNEX II) and location map is presented in Fig. 2.43.
Fig. 2.43 Location of Meteorological Stations of Met Organization

Main Report I (Master Plan) The Study on Flood and Debris Flow in the Caspian Coastal Area Chapter 2 focusing on the Flood-hit Region in Golestan Province
2 - 60 JICA CTI Engineering International Co., Ltd.
(1) Online Stations
The online stations are operating to get real time data on rainfalls, air temperature, humidity, etc. at 10 minutes intervals. At present, there are three online stations which are located at Dasht, Tangrah and Farsian Farang. Meteorological Organization (MO) is planning to install additional four online stations in near future at Hosseinabad Kalpoush, Ghaleh Ghapeh, Bidak and Dasht Shad. According to officials of MO, online stations of Dasht and Tangrah are not working well due to problems in radio communication and telephone line. These two online stations lie in the Madarsoo River basin. The MO has installed these online stations for flood warning purpose and setting some threshold values of rainfalls at stations to warn. Thies Clima Tipping Bucket Type automatic precipitation transmitters, made in Germany, are used for online rainfalls recording. The online system was developed by technical assistance of French Company.
(2) Synoptic Stations
At these stations, meteorological parameters like, wind speed, dry and wet bulb temperatures, relative humidity, amount of cloud, and atmospheric pressures are measured at 0:00, 3:00, 6:00, 9:00, 12:00, 15:00, 18:00 and 21:00 hrs (GMT). But rainfalls are measured daily (only one time). There is no any synoptic station in the basin.
(3) Climatological Stations
These stations measure dry and wet bulbs temperatures and humidity at 3:00, 9:00 and 15:00 hrs (GMT), however, rainfall is measured only one time in a day. There are 5 climatological stations in the basin they are: Dasht (Kalpoush), Golestan National Park (Tangrah), Kalaleh, Soodaghlene and Nardin.
(4) Rain-gauge Stations
These stations record only daily rainfall amounts. There are some rain-gauge stations in the basin. i.e. Robat Gharebil, Tang Gol, etc.
Ministry of Energy (MOE)
Two types of rain-gauge stations are operated by MOE: online and ordinary. The inventory of rain-gauge stations is presented in Table A2.2 (ANNEX II) and location map is presented in Fig. 2.44.
(1) Online Stations
The online rain-gauge stations are installed at Dasht Shad, Dasht, Galikesh and Narab. Moreover, Dasht Shad and Dasht online stations lie in Madarsoo river basin. At Dasht, LAMBRECHT (Type: 00.15183.002200) precipitation transmitter is used for online rainfalls recordings. The online stations are operating through telephone line and performing well.
(2) Ordinary Stations
The ordinary rain-gauge stations records daily rainfalls. There are some rain-gauge stations in the basin. Some of the stations in the basin are: Robat Gharebil, Chesmeh Khan and Tangrah.

The Study on Flood and Debris Flow in the Caspian Coastal Area Main Report I (Master Plan)focusing on the Flood-hit Region in Golestan Province Chapter 2
JICA CTI Engineering International Co., Ltd. 2 - 61
Fig. 2.44 Location of Rain-Gauge Stations of MOE
2.5.3 Weather Conditions during 2001 and 2002 Floods The meteorological parameters like rainfall, relative humidity (RH), air temperature, and wind speed at various stations in the basin were analyzed on the day of flood and a day before during 2001 and 2002 floods.
Rainfall
Daily rainfall isohyets of one day before and on the day of floods in 2001 and 2002 are developed. The isohyets show during 2001 disastrous flood there was considerable amount of rainfall (50 mm) only at Dasht Kalpoush on previous day of flood (10 August) in the basin (Fig. 2.45). However, on the day of the flood (11 August), heavy rainfall occurred at Dasht Shad (176 mm), Tangrah (150 mm), Soodaghlene (117 mm), Dasht Kalpoush (100 mm) and Chesmeh Khan (84 mm) as present in isohyets (Fig. 2.46). Rainfall isohyets of the flood day show that 80-176 mm rainfall occurred on about 50% of basin area at central part of the basin (with peak rainfall at Dasht Shad). In other areas of the basin, amount of rain was in-between 20–80 mm on the flood day. It has been said that high intensity rain has occurred for sometime which caused the 2001 disastrous flood. The intensity of rainfall could not be analyzed due to not having hourly rainfalls data of the stations. Moreover, flood hydrograph of the Madarsoo River at Tangrah also indicates possibility of high intensity rain occurrence in the basin during 2001 flood, because flood hydrograph is rising sharply. Similarly, debris flow and gully formation at Terjenly also indicates possibility of high intensity rain occurrence during the flood.
During 2002 flood, on previous day of flood (12 August) there was 24 mm rainfall at Tangrah but no rainfall at other stations in the basin (Fig. 2.47). But on the day of the flood (13 August), heavy rainfall occurred at Dasht Shad (108 mm) and Dasht Kalpoush (60 mm). Furthermore, considerable amount of rainfalls occurred at other stations like Soodaghlene (33.4 mm), Nardin (25 mm), Chesmeh Khan (16 mm) and Tangrah (30 mm). The rainfalls distribution in the basin on the day of flood is presented by isohyets (Fig. 2.48). Rainfall

Main Report I (Master Plan) The Study on Flood and Debris Flow in the Caspian Coastal Area Chapter 2 focusing on the Flood-hit Region in Golestan Province
2 - 62 JICA CTI Engineering International Co., Ltd.
isohyets of the flood day show that there was 40–108 mm rain on about 35% of basin area at central part of the basin (with peak rainfall at Dasht Shad). In other parts of the basin, only 10–40 mm rainfall occurred on the day of flood.
Other parameters
Maximum relative humidity (RH), maximum air temperature and maximum wind speed at stations in the basin were analyzed since 2 days before to one day after of the floods. During 2001 flood, values of maximum relative humidity were higher on the day of flood (11 August) than on previous days at Soodaghlene, Nardin and Dasht Kalpoush, however, value of maximum relative humidity was lower than on previous day at Kalaleh station (Fig. 2.49). The values of maximum relative humidity on the day of flood were: 94% (Soodaghlene), 96% (Nardin), 81% (Dasht Kalpoush) and 52% (Kalaleh). On the other hand, values of maximum air temperature have dropped gradually since 2 days before and reached the lowest values at all stations in the basin on the day of flood (Fig. 2.50). The maximum air temperatures on the day flood at stations were: 20.5 oC (Soodaghlene), 19.5 oC (Nardin), 22 oC (Dasht Kalpoush) and 23 oC (Kalaleh). Moreover, the values of maximum wind speed of the stations in the basin do not show any trend (Fig. 2.51). The maximum wind speeds on the day of flood were: 2.7 m/s (Soodaghlene) and 0.5 m/s (Nardin).
During 2002 flood, values of maximum relative humidity were higher on the day of flood (13 August) than on previous days at Nardin and Kalaleh stations, but the values were lower at Soodaghlene and Dasht Kalpoush stations (Fig. 2.49). The values of maximum relative humidity at stations on the day of flood were: 94% (Soodaghlene), 84% (Nardin), 69 % (Dasht Kalpoush) and 82% (Kalaleh). However, values of maximum air temperature at stations in the basin have shown the exactly same trend as in the 2001 flood time (Fig. 2.50). The daily maximum air temperature gradually decreased since 2 days before and attained the lowest values of 20 oC (Soodaghlene), 19.5 oC (Nardin), 21 oC (Dasht Kalpoush) and 31 oC (Kalaleh) on the day of flood. Further, values of maximum wind speed were more or less similar with previous days values on the day of flood at stations (Fig. 2.51). The maximum wind speeds at stations were 2.2 m/s (Soodaghlene) and 3.1 m/s (Nardin) on the day of flood.
Note: Although, it is quite difficult to say exactly, due to having complicated atmospheric phenomenon, how such heavy rainfalls occurred in 2001 and 2002 in the basin. However, while analyzing the weather conditions since 2 days before of 2001 and 2002 floods indicate rainfalls at those times might have occurred due to Cold Breeze from the Siberia. Because, the Cold Breeze got moist while passing through the Caspian Sea and made rainfalls due to orographic effect of Alborz mountain over the basin. It is justifiable because daily maximum air temperatures in the basin were gradually decreased since 2 days before of the floods.

The Study on Flood and Debris Flow in the Caspian Coastal Area Main Report I (Master Plan)focusing on the Flood-hit Region in Golestan Province Chapter 2
JICA CTI Engineering International Co., Ltd. 2 - 63
Fig. 2.45 Rainfall Isohyets (10 August 2001)
Fig. 2.46 Rainfall Isohyets (11 August 2001)

Main Report I (Master Plan) The Study on Flood and Debris Flow in the Caspian Coastal Area Chapter 2 focusing on the Flood-hit Region in Golestan Province
2 - 64 JICA CTI Engineering International Co., Ltd.
Fig. 2.47 Rainfall Isohyets (12 August 2002)
Fig. 2.48 Rainfall Isohyets (13 August 2002)

The Study on Flood and Debris Flow in the Caspian Coastal Area Main Report I (Master Plan)focusing on the Flood-hit Region in Golestan Province Chapter 2
JICA CTI Engineering International Co., Ltd. 2 - 65
Maximum relative humidity at stations in basin (during 2001 and 2002 floods)
0
20
40
60
80
100
9-Aug 10-Aug 11-Aug 12-Aug 11-Aug 12-Aug 13-Aug 14-Aug
RH
(%)
SoodaghleneNardinDasht KalpoushKalaleh
2001 2002
Fig. 2.49 Maximum Relative Humidity at Stations in the Basin
Maximum air temperature at stations in basin (during 2001 and 2002 floods)
0.0
10.0
20.0
30.0
40.0
9-Aug 10-Aug 11-Aug 12-Aug 11-Aug 12-Aug 13-Aug 14-Aug
Tem
pera
ture
(o C)
SoodaghleneNardinDasht KalpoushKalaleh
2001 2002
Fig. 2.50 Maximum Air Temperature at Stations in the Basin

Main Report I (Master Plan) The Study on Flood and Debris Flow in the Caspian Coastal Area Chapter 2 focusing on the Flood-hit Region in Golestan Province
2 - 66 JICA CTI Engineering International Co., Ltd.
Maximum wind speed at stations in basin (during 2001 and 2002 floods)
0
1
2
3
4
9-Aug 10-Aug 11-Aug 12-Aug 11-Aug 12-Aug 13-Aug 14-Aug
Spe
ed (m
/s)
SoodaghleneNardin
2001 2002
Fig. 2.51 Maximum Wind Speed at Stations in the Basin
2.5.4 Monthly and Annual Rainfall Distribution Monthly and annual rainfalls are analyzed by developing isohyets as well as at points (stations) in the basin. For developing monthly and annual rainfalls isohyets, data of meteorological stations which lie in-between 36o to 38o N and 54o to 58o E and have more than 10 years daily or monthly rainfall records were used. Mean monthly and mean annual rainfalls for the stations were computed and used for developing rainfall isohyets. Altogether 71 stations mean monthly and mean annual rainfalls data are used for developing rainfall isohyets (Figs. 2.52 and 53). Therefore, accuracy of the developed rainfall isohyets is quite high. For instance, rainfall isohyets developed by one office shows annual rainfall of Noodeh, Pas Poshteh and Tangrah are within the range of 400 mm, however, study shows annual rainfalls of Pas Poshteh (974 mm), Noodeh (822 mm) and Tangrah (695 mm). Monthly and annual rainfalls distributions in the basin are described individually.
Isohyets
Monthly rainfall isohyets show March is the highest rainfall month. In this month, over the lower to middle part of Madarsoo river basin (Golestan Dam to Tangrah), 80-99 mm rainfall occurs (Fig. 2.52(3/12)). The amount of rain decreases as we go to the middle part from the lower part of the basin (from Golestan Dam to Tangrah). The isohyets show on the upper (Nardin and Robat Gharebil) to middle (Tangrah) part of the basin 20-99 mm rain occurs in March. The amount of rain increases as we go to the middle part from the upper most parts of the basin. Furthermore, annual rainfall isohyets indicate Tangrah and its vicinity get the highest rainfalls in the basin (Fig. 2.53). Annual rainfall at the lower most part of the basin is 500 mm and amount gradually increases as we go to the middle part of the basin and reaches 695 mm at Tangrah. When we go further upstream part of the basin from Tangrah then annual rainfall amount declines and reaches up to 198 mm (Robat Gharebil) and 139 mm (Dasht Kalpoush).

The Study on Flood and Debris Flow in the Caspian Coastal Area Main Report I (Master Plan)focusing on the Flood-hit Region in Golestan Province Chapter 2
JICA CTI Engineering International Co., Ltd. 2 - 67
Point Rainfalls
Mean monthly rainfalls at various stations in the basin are presented (Fig. 2.54). Tangrah gets higher rainfalls in every month and is followed by Kalaleh and Soodaghlene. Moreover, Nardin and Dasht Kalpoush get lower rainfalls in every month. As mentioned in previous section, March is the highest rainfall month in the basin. Therefore, mean monthly rainfalls in March at stations in the basin are discussed. Mean monthly rainfalls in March at stations are: 89 mm (Kalaleh), 99 mm (Tangrah), 33 mm (Chesmeh Khan), 30 mm (Robat Gharebil), 16 mm (Dasht Kalpoush), 58 mm (Soodaghlene) and 29 mm (Nardin). Similarly, mean annual rainfalls at different stations in the basin are also presented for reference (Fig. 2.55). Mean annual rainfalls at stations in the basin are: 516 mm (Kalaleh), 695 mm (Tangrah), 406 mm (Soodaghlene), 231 mm (Chesmeh Khan), 198 mm (Robat Gharebil), 148 mm (Nardin) and 139 mm (Dasht Kalpoush). It indicates that Dasht Kalpoush gets the lowest and Tangrah gets the highest rainfalls in the basin.
Fig. 2.52(1/12) Monthly Rainfall Isohyets (January)

Main Report I (Master Plan) The Study on Flood and Debris Flow in the Caspian Coastal Area Chapter 2 focusing on the Flood-hit Region in Golestan Province
2 - 68 JICA CTI Engineering International Co., Ltd.
Fig. 2.52(2/12) Monthly Rainfall Isohyets (February)
Fig. 2.52(3/12) Monthly Rainfall Isohyets (March)

The Study on Flood and Debris Flow in the Caspian Coastal Area Main Report I (Master Plan)focusing on the Flood-hit Region in Golestan Province Chapter 2
JICA CTI Engineering International Co., Ltd. 2 - 69
Fig. 2.52(4/12) Monthly Rainfall Isohyets (April)
Fig. 2.52(5/12) Monthly Rainfall Isohyets (May)

Main Report I (Master Plan) The Study on Flood and Debris Flow in the Caspian Coastal Area Chapter 2 focusing on the Flood-hit Region in Golestan Province
2 - 70 JICA CTI Engineering International Co., Ltd.
Fig. 2.52(6/12) Monthly Rainfall Isohyets (June)
Fig. 2.52(7/12) Monthly Rainfall Isohyets (July)

The Study on Flood and Debris Flow in the Caspian Coastal Area Main Report I (Master Plan)focusing on the Flood-hit Region in Golestan Province Chapter 2
JICA CTI Engineering International Co., Ltd. 2 - 71
Fig. 2.52(8/12) Monthly Rainfall Isohyets (August)
Fig. 2.52(9/12) Monthly Rainfall Isohyets (September)

Main Report I (Master Plan) The Study on Flood and Debris Flow in the Caspian Coastal Area Chapter 2 focusing on the Flood-hit Region in Golestan Province
2 - 72 JICA CTI Engineering International Co., Ltd.
Fig. 2.52(10/12) Monthly Rainfall Isohyets (October)
Fig. 2.52(11/12) Monthly Rainfall Isohyets (November)

The Study on Flood and Debris Flow in the Caspian Coastal Area Main Report I (Master Plan)focusing on the Flood-hit Region in Golestan Province Chapter 2
JICA CTI Engineering International Co., Ltd. 2 - 73
Fig. 2.52(12/12) Monthly Rainfall Isohyets (December)
Fig. 2.53 Annual Rainfall Isohyets

Main Report I (Master Plan) The Study on Flood and Debris Flow in the Caspian Coastal Area Chapter 2 focusing on the Flood-hit Region in Golestan Province
2 - 74 JICA CTI Engineering International Co., Ltd.
Monthly rainfalls in basin
0
20
40
60
80
100
120
Jan Feb Mar Apr May Jun Jul Aug Sep Oct Nov Dec
Rai
nfal
l (m
m)
Tangrah
Kalaleh
Soodaghlene
Chesmeh Khan
Robat Gharebil
Nardin
Dasht Kalpoush
Fig. 2.54 Monthly Rainfall Variation of Stations in the Basin
Annual rainfalls in basin
0
100
200
300
400
500
600
700
800
Kal
aleh
Tang
rah
Che
smeh
Kha
n
Rob
atG
hare
bil
Das
htK
alpo
ush
Soo
dagh
lene
Nar
din
Rai
nfal
l (m
m)
Fig. 2.55 Annual Rainfall of Stations in the Basin

The Study on Flood and Debris Flow in the Caspian Coastal Area Main Report I (Master Plan)focusing on the Flood-hit Region in Golestan Province Chapter 2
JICA CTI Engineering International Co., Ltd. 2 - 75
2.6 Hydrology
2.6.1 Hydrological Network There are two hydrological stations in the Madarsoo River basin which are located at Dasht and Tangrah. The station at Dasht is a newly built station after past two disastrous floods. Station at Tangrah was also destroyed by the 2001 flood and repaired in 2002. However, there are other stations like Galikesh, Tamar and Hoji Ghousan in Golestan Dam basin (Fig. 2.56). Two types of hydrological stations, namely, online and ordinary are managed by Ministry of Energy (MOE). Real time water levels data are being recorded through online telecommunication network at intervals of 10 minutes.
Fig. 2.56 Location of Hydrological Stations
(1) Dasht Station
This station was established in 2003; and has staff gauge and water levels recorder installed. Station is located downstream of the confluence of Chesmeh Khan and Madarsoo rivers. The location of station is suitable for flow measurement due to having foundation of bridge to converge flows. But it seems, especially during low flow season, proper care should be given to have always river water connected with stilling well to measure water levels. Because, the bridge is quite wide so during low flow season river flow may not be connected with stilling well having very low discharge in the river. At present, Ministry of Energy (MOE) is getting online water levels data from this station with automatic water levels recorder (Thalimedes OTT, Germany).
(2) Tangrah Station
Station is in the Madarsoo River and was destroyed by the 2001 flood, so data could not be recorded in 2002. Staff gauge, water level recorder and cable way are installed at the station. Presently, Ministry of Energy (MOE) and Ministry of Road and Transport (MORT) jointly are conducting riverbank protection works, it helps to converge flows in river thereby can record water levels more precisely. At present,

Main Report I (Master Plan) The Study on Flood and Debris Flow in the Caspian Coastal Area Chapter 2 focusing on the Flood-hit Region in Golestan Province
2 - 76 JICA CTI Engineering International Co., Ltd.
MOE is getting online water levels data with automatic water levels recorder (AKIM Elektronik Lymnygraph PSTN, Turkey).
(3) Galikesh Station
This station is in the Oghan River at gorge. Staff gauge, float type water level recorder and cable way (to measure flow discharge) are installed. The location of the station seems suitable for stream flow measurements. The 2001 disastrous flood did not destroy this station.
(4) Tamar Station
Station is located in the Gorgan River. Staff gauge, float type water levels recorder and cableway are installed at the station. The station was destroyed by the 2001 flood and repaired later. River bed seems deepened at site of the station, because base of stilling well was not so much dipped inside river water level, therefore, maintenance of the station is advised.
(5) Hoji Ghousan Station
Station situated at bridge in the Gorgan River just upstream of the Golestan Dam. The location of the station seems good for stream flow measurements. Staff gauge and float type water level recorder are installed; and cable way is under construction for flow measurements. This station was also destroyed by the 2001 flood.
2.6.2 Hydrological Data in the 2001 and 2002 Floods Water Level in the 2001 and 2002 Floods
Hourly water levels of Tangrah (Madarsoo River), Galikesh (Oghan River), Hoji Ghousan (Gorgan River) and Golestan Dam during the 2001 flood were analyzed (Figs. 2.57 and 58). The maximum water levels at stations on the day of flood (11 August) were: 4.95 m (Galikesh at 2:00), 5.25 m (Tangrah at 6:00), 8.58 m (Hoji Ghousan at 10:00) and 62.94 m (Golestan Dam at 24:00). However, graph of water levels indicates possibility of occurrence of high intensity rainfalls in the basin, because water levels at Tangrah rose and fell sharply during the flood. Unfortunately, it is not possible to compare the water levels differences between stations and Golestan Dam due to unavailability of zero gauge elevations of staff gauges installed at the stations. At Tangrah, water levels were at peak levels for 4 hours from 4:00 to 8:00 o’clock on flood day. Flow travel time between Tangrah and Golestan Dam will be discussed in next section. Similarly, in the 2002 flood, the maximum water levels at stations on the day of flood (13 August) were: 4.80 m (Tamar at 6:00) and 10.00 m (Hoji Ghousan at 6:00), however, data of other stations were not available (Fig. 2.59).
0
100
200
300
400
500
600
700
800
900
1000
Wat
er L
evel
(cm
)
GalikeshTangrahHoji Ghousan
11 - Aug 12 - Aug 13 - Aug10 - Aug
Fig. 2.57 Hourly Water Levels at Stations during the 2001 Flood

The Study on Flood and Debris Flow in the Caspian Coastal Area Main Report I (Master Plan)focusing on the Flood-hit Region in Golestan Province Chapter 2
JICA CTI Engineering International Co., Ltd. 2 - 77
57
58
59
60
61
62
63
64
Wat
er le
vel (
m)
11 - Aug 12 - Aug 13 - Aug10 - Aug
Fig. 2.58 Hourly Water Levels of Golestan Reservoir during the 2001 Flood
0
200
400
600
800
1000
1200
Wat
er L
evel
(cm
)
TamarHoji Ghousan
12 - Aug 13 - Aug 14 - Aug
Fig. 2.59 Hourly Water Levels at Stations during the 2002 Flood
Discharge in the 2001 and 2002 Floods
During the 2001 flood, the maximum hourly discharges at stations on the day of flood (11 August) were: 468 m3/s (Galikesh at 2:00), 1,650 m3/s (Tangrah at 6:00), and 241 m3/s (Hoji Ghousan at 10:00). Further, the maximum hourly inflow into Golestan Dam was 2,736 m3/s at 10:00 o’clock (Fig. 2.60). Having quite fluctuating values of hourly inflows into the Golestan Dam computed from reservoir storage curve and water levels, moving average of 5 consecutive inflows were taken to minimize error. If we sum up the maximum discharges at stations and compare with the maximum inflow of the Golestan Dam it seems all right. Because, difference between sum of stations maximum discharges and Golestan Dam’s maximum inflow is about 400 m3/s, which is quite reasonable. Because, the less amount in inflow of the Golestan Dam is contributed from the Madarsoo River catchment between Tangrah and Golestan Dam. Moreover, flow travel time between Tangrah and Golestan Dam is about 4 hours.
On the other hand, in the 2002 flood, the maximum hourly discharges at stations on the day of flood (13 August) were: 58 m3/s (Tamar) and 300 m3/s (Hoji Ghousan) at 6:00 o’clock (Fig. 2.61). Hourly discharges data of other stations were not available.
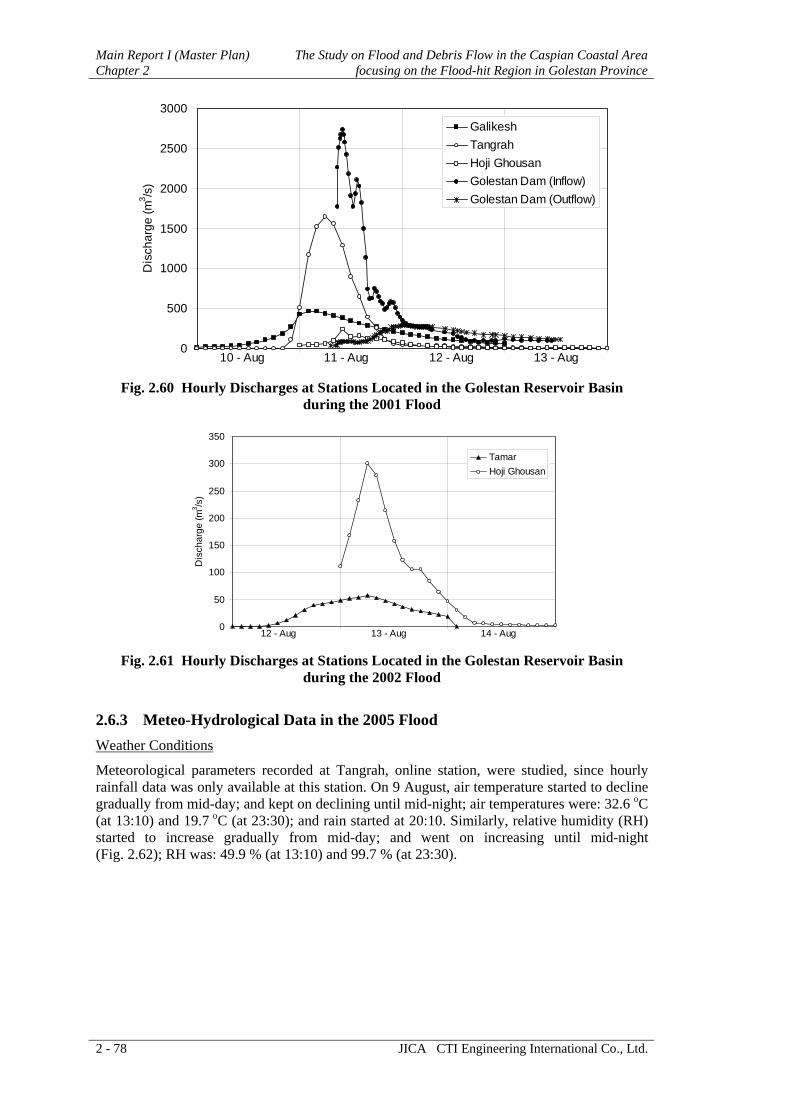
Main Report I (Master Plan) The Study on Flood and Debris Flow in the Caspian Coastal Area Chapter 2 focusing on the Flood-hit Region in Golestan Province
2 - 78 JICA CTI Engineering International Co., Ltd.
0
500
1000
1500
2000
2500
3000
Dis
char
ge (m
3 /s)
GalikeshTangrahHoji GhousanGolestan Dam (Inflow)Golestan Dam (Outflow)
11 - Aug 12 - Aug 13 - Aug10 - Aug Fig. 2.60 Hourly Discharges at Stations Located in the Golestan Reservoir Basin
during the 2001 Flood
0
50
100
150
200
250
300
350
Dis
char
ge (m
3 /s)
TamarHoji Ghousan
12 - Aug 13 - Aug 14 - Aug Fig. 2.61 Hourly Discharges at Stations Located in the Golestan Reservoir Basin
during the 2002 Flood
2.6.3 Meteo-Hydrological Data in the 2005 Flood Weather Conditions
Meteorological parameters recorded at Tangrah, online station, were studied, since hourly rainfall data was only available at this station. On 9 August, air temperature started to decline gradually from mid-day; and kept on declining until mid-night; air temperatures were: 32.6 oC (at 13:10) and 19.7 oC (at 23:30); and rain started at 20:10. Similarly, relative humidity (RH) started to increase gradually from mid-day; and went on increasing until mid-night (Fig. 2.62); RH was: 49.9 % (at 13:10) and 99.7 % (at 23:30).

The Study on Flood and Debris Flow in the Caspian Coastal Area Main Report I (Master Plan)focusing on the Flood-hit Region in Golestan Province Chapter 2
JICA CTI Engineering International Co., Ltd. 2 - 79
0.0
10.0
20.0
30.0
40.0
50.0
60.0
70.0
80.0
90.0
100.0
5:00
7:00
9:00
11:0
013
:00
15:0
017
:00
19:0
021
:00
23:0
01:
003:
005:
007:
009:
0011
:00
13:0
015
:00
17:0
019
:00
21:0
023
:00
Rela
tive
Hum
idity
(%)
0.0
4.0
8.0
12.0
16.0
20.0
24.0
28.0
32.0
36.0
40.0
Air T
empe
ratu
re (
o C)
Relative humidityAir temperature
08/09/2005 08/10/2005
Fig. 2.62 Air Temperature and Relative Humidity (RH) at Tangrah
Spatial Distribution of Rain
The point rainfall data at different stations in the basin on the day of the flood (10 August) and on one day before the flood (09 August) were collected. There was no rainfall at any stations in the basin on one day before the flood. But, on the day of the flood heavy rainfall occurred in the basin. The point rainfall amounts in and around the basin on the day of flood (10 August) were: 14 mm (Tilabad), 12 mm (Nardin), 110 mm (Soodaghlene), 113 mm (Dasht Shad), 98 mm (Dasht), 137 mm (Tangrah), 33 mm (Pishkamar), 7 mm (Galikesh), 85 mm (Chesmeh Khan) and 17.5 mm (Robat Gharebil). The spatial distribution of rain over the basin on the day of the flood is presented by developing rainfall isohyets (Fig. 2.63). It shows that 80–137 mm of rainfall occurred on about 55% of basin area.
Rainfall Pattern
Rainfall recorded at Tangrah, online station, during the 2005 flood event was analyzed. Rain started at 20:10 (09 August) and continued till 07:10 (10 August). Therefore, rainfall duration was 11 hours, however, in-between 3 hours have nominal rainfall. The total amount of rainfall was 136.8 mm; and the highest intensity rain occurred at 23:00 of 09 August. The maximum 10, 30 and 60 minutes rainfall intensities were 18.5, 46.3 and 80.8 mm, respectively (Fig. 2.64). It shows quite high intensity rainfall occurred, which caused violent flash flood in the basin. Moreover, rainfall distribution pattern was analyzed, about 76% of total rainfall occurred within the first 4 hours of rain (Fig. 2.65). Similarly, about 43.93% of total rainfall amount was occurred in the third hour of rain; about 20.91% of total rainfall amount was occurred in the fourth hour of rain. The lowest amount of rainfall (0.22% of total rainfall amount) was occurred in the sixth hour of rain (Fig. 2.66).

Main Report I (Master Plan) The Study on Flood and Debris Flow in the Caspian Coastal Area Chapter 2 focusing on the Flood-hit Region in Golestan Province
2 - 80 JICA CTI Engineering International Co., Ltd.
Fig. 2.63 Rainfall Isohyets (10 August 2005)
0.0
10.0
20.0
30.0
40.0
50.0
60.0
70.0
80.0
90.0
0:00
3:00
6:00
9:00
12:0
0
15:0
0
18:0
0
21:0
0
0:00
3:00
6:00
9:00
12:0
0
15:0
0
18:0
0
21:0
0
0:00
Time (Hr)
Rai
nfal
l Int
ensi
ty (
mm
)
10 min30 min60 min
08/09/2005 08/10/2005
Fig. 2.64 Rainfall Intensity at Tangrah
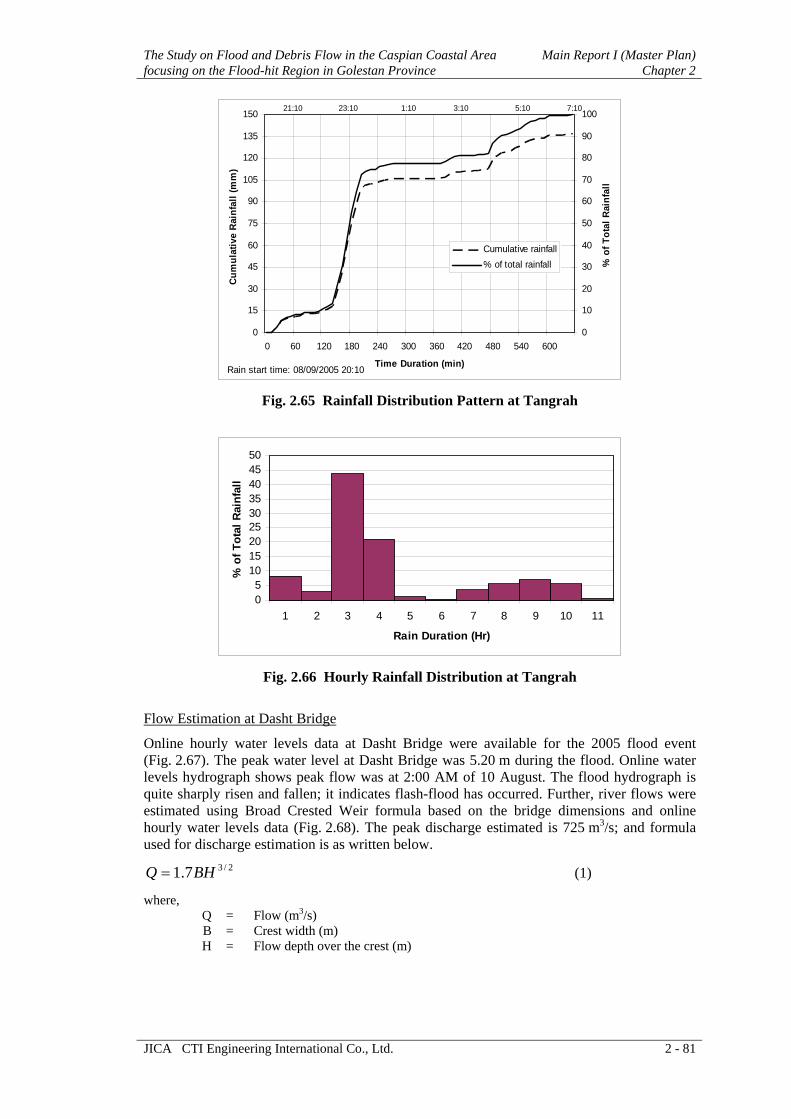
The Study on Flood and Debris Flow in the Caspian Coastal Area Main Report I (Master Plan)focusing on the Flood-hit Region in Golestan Province Chapter 2
JICA CTI Engineering International Co., Ltd. 2 - 81
0
15
30
45
60
75
90
105
120
135
150
0 60 120 180 240 300 360 420 480 540 600
Time Duration (min)
Cum
ulat
ive
Rai
nfal
l (m
m)
0
10
20
30
40
50
60
70
80
90
100
% o
f Tot
al R
ainf
all
Cumulative rainfall% of total rainfall
21;10 23;10 1;10 3;10 5;10 7;10
Rain start time: 08/09/2005 20:10
Fig. 2.65 Rainfall Distribution Pattern at Tangrah
05
101520253035404550
1 2 3 4 5 6 7 8 9 10 11
Rain Duration (Hr)
% o
f Tot
al R
ainf
all
Fig. 2.66 Hourly Rainfall Distribution at Tangrah
Flow Estimation at Dasht Bridge
Online hourly water levels data at Dasht Bridge were available for the 2005 flood event (Fig. 2.67). The peak water level at Dasht Bridge was 5.20 m during the flood. Online water levels hydrograph shows peak flow was at 2:00 AM of 10 August. The flood hydrograph is quite sharply risen and fallen; it indicates flash-flood has occurred. Further, river flows were estimated using Broad Crested Weir formula based on the bridge dimensions and online hourly water levels data (Fig. 2.68). The peak discharge estimated is 725 m3/s; and formula used for discharge estimation is as written below.
2/37.1 BHQ = (1)
where, Q = Flow (m3/s) B = Crest width (m) H = Flow depth over the crest (m)

Main Report I (Master Plan) The Study on Flood and Debris Flow in the Caspian Coastal Area Chapter 2 focusing on the Flood-hit Region in Golestan Province
2 - 82 JICA CTI Engineering International Co., Ltd.
050
100150200250300350400450500550
0:00
3:00
6:00
9:00
12:0
015
:00
18:0
021
:00
0:00
3:00
6:00
9:00
12:0
015
:00
18:0
021
:00
0:00
3:00
6:00
9:00
12:0
015
:00
18:0
021
:00
0:00
3:00
6:00
9:00
12:0
015
:00
18:0
021
:00
0:00
Time (Hr)
WL
(cm
)08/09/2005 08/10/2005 08/11/2005 08/12/2005
Fig. 2.67 Water Levels at Dasht Bridge in the 2005 Flood
050
100150200250300350400450500550600650700750
0:00
3:00
6:00
9:00
12:0
015
:00
18:0
021
:00
0:00
3:00
6:00
9:00
12:0
015
:00
18:0
021
:00
0:00
3:00
6:00
9:00
12:0
015
:00
18:0
021
:00
0:00
3:00
6:00
9:00
12:0
015
:00
18:0
021
:00
0:00
Time (Hr)
Q (m
3 /s)
08/09/2005 08/10/2005 08/11/2005 08/12/2005
Fig. 2.68 River Flows at Dasht Bridge in the 2005 Flood
2.6.4 Basin (Aerial) Rainfall Estimation Representative rainfall stations selection, calculating weighting factors for those stations and determining basis of estimation are pre-requisites for basin rainfall estimations. After this, basin rainfalls can be calculated.
Selection of Representative Rainfall Stations
Stations were selected based on spatial coverage and availability of daily rainfall time series. With the criteria, from inside basin, Tangrah, Chesmeh Khan, Robat Gharebil, Dasht Kalpoush, Dasht Shad, Soodaghleen and Nardin stations were selected. From outside the basin, Pishkamar, Galikesh and Tilabad stations were selected with looking spatial coverage and nearness from the basin. Altogether 10 representative rainfall stations were selected to get good spatial coverage.
Weighting Factors for Stations
Among the selected 10 representative stations, for Soodaghleen and Nardin stations, 2001-05 years rainfall records are available. Similarly, for Dasht Shad and Dasht Kalpoush stations, 1997-2005 years daily rainfall records are available. For other 6 stations, 1974-2005 years

The Study on Flood and Debris Flow in the Caspian Coastal Area Main Report I (Master Plan)focusing on the Flood-hit Region in Golestan Province Chapter 2
JICA CTI Engineering International Co., Ltd. 2 - 83
daily rainfall records are available. Because of this, three combinations of the selected representative stations were made for Thiessen polygons development.
Combination (1): Six representative stations with long time series of daily rainfall available for 1974-96 years are used in Thiessen polygons development (Fig. 2.69(1)).
Combination (2): Eight representative stations with time series of daily rainfall available for 1997-2000 years are used in Thiessen polygons development (Fig. 2.69(2)).
Combination (3): All 10 representative stations with daily rainfall records available for 2001-05 years are used to develop Thiessen polygons (Fig. 2.69(3)).
In this way three sets of weighting factors for stations have been computed for the entire basin and sub-basin rainfall calculations (Tables 2.35 and 2.36).
Fig. 2.69(1) Thiessen Polygon used for 1974-96 Years
Fig. 2.69(2) Thiessen Polygon used for 1997-2000 Years

Main Report I (Master Plan) The Study on Flood and Debris Flow in the Caspian Coastal Area Chapter 2 focusing on the Flood-hit Region in Golestan Province
2 - 84 JICA CTI Engineering International Co., Ltd.
Fig. 2.69(3) Thiessen Polygon used for 2001-05 Years
Table 2.35 Thiessen Weight of Stations for Basin Rainfall Computation Item Robat-Gharebil Chesmeh-Khan Tangrah Pishkamar Galikesh Tilabad Dasht-Shad Dasht-Kalpoush Soodaghleen Nardin
Long time series data (1975-96) 0.128 0.331 0.347 0.058 0.079 0.058 0.000 0.000 0.000 0.000Short time series data - 1(1997-00) 0.130 0.126 0.134 0.059 0.075 0.024 0.255 0.197 0.000 0.000Short time series data - 2 (2001-02) 0.129 0.125 0.133 0.058 0.075 0.000 0.088 0.154 0.134 0.104
Table 2.36 Thiessen Weight of Stations for Sub-Basin Rainfall Computation Item Robat-Gharebil Chesmeh-Khan Tangrah Pishkamar Galikesh Tilabad Dasht-Shad Dasht-Kalpoush Soodaghleen Nardin
Sub-basin 1 0.000 0.513 0.313 0.000 0.000 0.175 0.000 0.000 0.000 0.000Sub-basin 2 0.674 0.326 0.000 0.000 0.000 0.000 0.000 0.000 0.000 0.000Sub-basin 3 0.000 0.846 0.154 0.000 0.000 0.000 0.000 0.000 0.000 0.000Sub-basin 4 0.000 0.231 0.769 0.000 0.000 0.000 0.000 0.000 0.000 0.000Sub-basin 5 0.000 0.270 0.730 0.000 0.000 0.000 0.000 0.000 0.000 0.000Sub-basin 6 0.000 0.000 0.655 0.069 0.276 0.000 0.000 0.000 0.000 0.000Sub-basin 7 0.000 0.000 0.071 0.786 0.143 0.000 0.000 0.000 0.000 0.000Sub-basin 8 0.000 0.000 0.000 0.100 0.900 0.000 0.000 0.000 0.000 0.000
Sub-basin 1 0.000 0.211 0.000 0.000 0.000 0.104 0.502 0.183 0.000 0.000Sub-basin 2 0.668 0.301 0.000 0.000 0.000 0.000 0.000 0.031 0.000 0.000Sub-basin 3 0.000 0.000 0.000 0.000 0.000 0.000 0.111 0.889 0.000 0.000Sub-basin 4 0.000 0.000 0.000 0.000 0.000 0.000 0.619 0.381 0.000 0.000Sub-basin 5 0.000 0.027 0.459 0.000 0.000 0.000 0.163 0.351 0.000 0.000Sub-basin 6 0.000 0.000 0.500 0.071 0.250 0.000 0.179 0.000 0.000 0.000Sub-basin 7 0.000 0.000 0.071 0.786 0.143 0.000 0.000 0.000 0.000 0.000Sub-basin 8 0.000 0.000 0.000 0.100 0.900 0.000 0.000 0.000 0.000 0.000
Sub-basin 1 0.000 0.208 0.000 0.000 0.000 0.000 0.019 0.078 0.372 0.323Sub-basin 2 0.668 0.301 0.000 0.000 0.000 0.000 0.000 0.031 0.000 0.000Sub-basin 3 0.000 0.000 0.000 0.000 0.000 0.000 0.001 0.706 0.293 0.000Sub-basin 4 0.000 0.000 0.000 0.000 0.000 0.000 0.591 0.381 0.028 0.000Sub-basin 5 0.000 0.027 0.459 0.000 0.000 0.000 0.163 0.351 0.000 0.000Sub-basin 6 0.000 0.000 0.500 0.071 0.250 0.000 0.179 0.000 0.000 0.000Sub-basin 7 0.000 0.000 0.071 0.786 0.143 0.000 0.000 0.000 0.000 0.000Sub-basin 8 0.000 0.000 0.000 0.100 0.900 0.000 0.000 0.000 0.000 0.000
C. Short time series data - 2 (2001-02)
A. Long time series data (1975-96)
B. Short time series data - 1 (1997-00)
Basis of Estimation
Annual maximum 2-day rainfall data at stations in the basin were used for generating series of estimated basin and sub-basin rainfall. The distribution of annual maximum 2-day basin rainfalls is quite good, and probability distribution function could be good-fit.
Estimation of Basin and Sub-basin Rainfalls
For estimation of 2-day basin and sub-basin rainfalls, weighting factors for the selected stations with respect to basin as a whole and sub-basins individually are determined (Tables 2.35 and 2.36). Series of 2-day basin and sub-basin rainfalls were estimated for days of annual maximum 2-day rainfalls at 5 stations inside basin. If two or more stations have annual maximum 2-day rainfalls on the same days then only one series was considered. In

The Study on Flood and Debris Flow in the Caspian Coastal Area Main Report I (Master Plan)focusing on the Flood-hit Region in Golestan Province Chapter 2
JICA CTI Engineering International Co., Ltd. 2 - 85
this way series of estimated 2-day basin and sub-basin rainfalls were generated. The relation used for estimation of aerial rainfalls (2-day basin and sub-basin rainfalls) is as presented below.
i
N
ii RWP ∑
=
=1
(2)
Where, P = Basin or sub-basin rainfall (mm/2day)
W = Thiessen weight factor for ith station (0 – 1.0) R = Rainfall at ith station (mm/2day) N = Number of rainfall stations considered i = Index for station
Using the cited relation, the annual maximum 2-day aerial rainfall series for the basin and sub-basins was computed (Table 2.37).
Table 2.37 Annual Maximum 2-Day Basin Rainfall
Year Date Basin1 2 3 4 5 6 7 8
1974 27-28 Nov 36 34 11 31 54 53 50 49 211975 29-30 Nov 30 27 15 20 36 35 46 33 571976 24-25 Apr 20 18 2 9 38 36 35 24 61977 21-22 Apr 26 23 12 20 42 41 41 8 271978 2-3 May 33 33 12 33 53 51 49 9 321979 13-14 Sep 23 23 4 18 40 39 36 18 131980 29-30 Dec 15 15 3 13 27 27 22 8 11981 6-7 Oct 20 19 3 15 37 36 31 7 51982 24-25 Jun 20 20 5 19 33 32 28 9 91983 12-13 Dec 28 33 17 38 21 22 29 29 591984 6-7 Oct 34 37 19 36 52 51 41 10 101985 11-12 Oct 26 20 5 12 43 41 51 25 481986 3-4 Aug 37 31 15 24 58 55 59 51 351987 20-21 Mar 41 33 8 20 65 62 75 57 631988 1-2 Apr 54 46 4 24 100 95 98 56 401989 5-6 Jan 30 40 27 56 30 32 15 8 41990 15-16 Mar 30 28 19 23 37 36 42 22 461991 4-5 May 38 42 34 41 35 35 37 34 481992 13-14 May 77 62 28 45 105 101 131 102 1461993 15-16 Feb 18 13 7 6 29 28 36 13 351994 5-6 Jan 30 23 7 14 46 44 53 45 421995 22-23 Jun 34 30 17 25 45 44 50 43 451996 25-26 Jun 31 27 5 18 57 55 56 15 271997 6-7 Nov 16 11 17 1 8 18 31 9 411998 18-19 Mar 13 16 23 2 11 7 9 11 51999 12-13 Jul 20 24 10 10 25 14 27 13 532000 7-8 Feb 17 17 0 10 22 23 31 21 292001 10-11 Aug 97 94 41 147 165 152 115 53 222002 12-13 Aug 45 36 8 56 88 64 73 25 962003 24-25 May 44 32 22 41 51 75 75 51 272004 19-20 Sep 21 8 4 13 5 50 55 27 182005 9-10 Aug 75 72 40 102 107 118 93 37 10
Sub - basins

Main Report I (Master Plan) The Study on Flood and Debris Flow in the Caspian Coastal Area Chapter 2 focusing on the Flood-hit Region in Golestan Province
2 - 86 JICA CTI Engineering International Co., Ltd.
Rainfall Distribution Pattern Analysis
The distribution patterns of 2-day basin rainfalls over sub-basins were analyzed. For this, relative coefficients (Rsub-basin/Rbasin) were calculated for all generated series of 2-day sub-basin rainfall with respect to 2-day basin rainfall. Frequency analysis of the relative coefficients of each sub-basin has performed and frequency histograms of relative coefficients were developed for all sub-basins (Fig. 2.70). After developing the frequency histogram of relative coefficients, top-most 5 heavy rainfall years have been selected from generated 2-day basin rainfall series. Hence, 1988, 1992, 2001, 2002 and 2005 heavy rainfall years were selected to use rainfall distribution patterns of these flood years as probable types of rainfall which may cause disastrous floods in future in the basin. The spatial distribution of 2-day aerial rainfall over sub-basins during those 5 types of floods was analyzed (Fig. 2.71) and distribution factors for 2-day basin rain into 2-day sub-basin rains were determined (Table 2.38). Results show that sub-basins 4, 5 and 6 got much rainfall than other sub-basins during the past floods, therefore, much attention should be paid on these sub-basins for debris flow and flood control activities.
0 0.5 1 1.5 2 2.5 3
RSub-basin/RBasin
Sub-basin 1
Sub-basin 2
Sub-basin 3
Sub-basin 4
Sub-basin 5
Sub-basin 6
Sub-basin 7
Sub-basin 8
Freq
uenc
y
0
10
0(10)
0(10)
0(10)
0(10)
0(10)
0(10)
0(10)
Based on: 1974 - 2005 rainfall records
Fig. 2.70 Rainfall Distribution Pattern over Sub-Basins

The Study on Flood and Debris Flow in the Caspian Coastal Area Main Report I (Master Plan)focusing on the Flood-hit Region in Golestan Province Chapter 2
JICA CTI Engineering International Co., Ltd. 2 - 87
0.0 0.5 1.0 1.5 2.0 2.5 3.0
RSub-basin/RBasin
Sub-basin 1
Sub-basin 2
Sub-basin 3
Sub-basin 4
Sub-basin 5
Sub-basin 6
Sub-basin 7
Sub-basin 8
Freq
uenc
y
0
10
0(10)
0(10)
0(10)
0(10)
0(10)
0(10)
0(10)19921988
Flood events: 1988 and 1992
Fig. 2.71(1) Rainfall Distribution over Sub-Basins in the Past Floods
0.0 0.5 1.0 1.5 2.0 2.5 3.0
RSub-basin/RBasin
Sub-basin 1
Sub-basin 2
Sub-basin 3
Sub-basin 4
Sub-basin 5
Sub-basin 6
Sub-basin 7
Sub-basin 8
Freq
uenc
y
0
10
0(10)
0(10)
0(10)
0(10)
0(10)
0(10)
0(10)2005
2001
2002
Flood events: 2001, 2002 and 2005
Fig. 2.71(2) Rainfall Distribution over Sub-Basins in the Past Floods

Main Report I (Master Plan) The Study on Flood and Debris Flow in the Caspian Coastal Area Chapter 2 focusing on the Flood-hit Region in Golestan Province
2 - 88 JICA CTI Engineering International Co., Ltd.
Table 2.38 Conversion Factors for 2-Day Basin Rainfall into Sub-Basin Rainfall Flood Type Basin Sub-basin 1 Sub-basin 2 Sub-basin 3 Sub-basin 4 Sub-basin 5 Sub-basin 6 Sub-basin 7 Sub-basin 8
1988 1.00 0.85 0.07 0.45 1.86 1.77 1.83 1.05 0.741992 1.00 0.80 0.36 0.58 1.36 1.31 1.71 1.32 1.902001 1.00 0.96 0.42 1.51 1.70 1.57 1.18 0.54 0.232002 1.00 0.78 0.18 1.24 1.93 1.40 1.61 0.56 2.112005 1.00 0.97 0.54 1.36 1.44 1.58 1.24 0.49 0.13
2.6.5 Computation of Probable Basin and Sub-Basin Rainfall The series of annual maximum 2-day basin rainfall (1974-2005) was analyzed using different types of probability distribution function (Fig. 2.72). As mentioned earlier, the probability distribution functions are fitting well with the estimated annual maximum 2-day basin rainfall series. However, Log Pearson 3 (Log P3) probability distribution function has the best fit with the rainfall series. The probable 2-day basin rain with different return periods are derived from the Log P3 distribution function (Table 2.39). The probable 2-day basin rains with 25, 50 and 100 years return periods are 76.1, 94.4 and 115.4 mm, respectively. Using these probable 2-day basin rains of 25-, 50- and 100-year return periods, probable 2-day sub-basins rains have been computed using distribution or multiplier factors (Table 2.40). These probable 2-day sub-basins rains with 25-, 50- and 100-year return periods were used in MIKE SHE hydrological model to estimate flows in river system in the basin.
As a result of the probability computation, recurrences of the recent three floods could be evaluated using 2-day basin rainfall as tabulated in Table 2.39. These are:
2001 Flood (97 mm): 55-year
2002 Flood (45 mm): 5-year
2005 Flood (75 mm): 25-year
Immediately after the 2001 Flood, this flood was evaluated as an extraordinary magnitude like more than several thousands year recurrence, since such large-scale floods had never been experienced and recorded as tabulated in Table 2.37. After experienced in succeeding two floods in 2002 and 2005, the accumulated hydrological data revealed that even the 2001 Flood could not be considered such extraordinary floods. Thus the hydrological design parameters such as rainfall intensity and probability relations had to be changed drastically before and after this half-decade of 2001 to 2005. It is not still clear whether such drastic changes in hydrology were induced by so-called global climatic change or not.
Table 2.39 Probable 2-Day Basin Rainfall
2 - Years 5 - Years 10 - Years 20 - Years 25 - Years 30 - Years 50 - Years 80 - Years 100 - Years 200 - YearsProbable 2-daybasin rainfalls(mm/2day)
28.3 43.6 56.5 71.2 76.1 80.9 94.4 108.3 115.4 139.8
Return PeriodsItem
Table 2.40 Probable 2-Day Basin and Sub-Basin Rainfall
Return Period Flood TypeBasin Sub-basin 1 Sub-basin 2 Sub-basin 3 Sub-basin 4 Sub-basin 5 Sub-basin 6 Sub-basin 7 Sub-basin 8
1988 65 6 34 141 134 139 80 561992 61 28 44 104 100 130 101 1452001 73 32 115 129 119 90 41 172002 60 14 94 147 106 122 42 1612005 74 41 104 109 120 95 37 101988 81 7 42 175 167 172 99 691992 76 34 55 128 124 161 125 1802001 91 39 143 160 148 112 51 222002 74 17 117 183 132 152 53 2002005 92 51 129 136 149 117 46 121988 99 9 51 214 204 211 121 851992 93 42 67 157 151 197 152 2202001 111 48 174 196 181 136 63 262002 90 21 143 223 161 186 64 2442005 112 62 157 166 182 144 57 15
100 Years 115.4
25 Years
50 Years
76.1
94.4
Probable Aerial Rainfalls (mm/2day)

The Study on Flood and Debris Flow in the Caspian Coastal Area Main Report I (Master Plan)focusing on the Flood-hit Region in Golestan Province Chapter 2
JICA CTI Engineering International Co., Ltd. 2 - 89
Fig. 2.72 Probability Distribution Functions and 2-Day Basin Rainfall
2.6.6 Time Distribution of Rainfall Time distribution of rainfall is one of the most important factors as well as spatial distribution of rainfall, to generate flows precisely in river system. Therefore, the study team requested Meteorological Organization (MO), Tehran to provide hourly rainfall data of Gonbade Kawoos during the past floods. This station is the only synoptic station that lies near from the Madarsoo River basin. But 6 hourly rainfalls data were available of the station for the past 2001-02 floods that could not be used as time distributed rainfall data. Similarly, rainfall intensity curve was also not available for Gonbade Kawoos. Thus, as an alternative measure, rainfall intensity curve of Gorgan, which is the next nearest synoptic station from the basin, was used to develop hourly distribution pattern of rainfall. The 20- and 100-year return period rainfall intensity curves of Gorgan (Fig. 2.73) were used to derive hourly distribution pattern of rainfall. The rainfall intensity relations of Gorgan station are as follows:

Main Report I (Master Plan) The Study on Flood and Debris Flow in the Caspian Coastal Area Chapter 2 focusing on the Flood-hit Region in Golestan Province
2 - 90 JICA CTI Engineering International Co., Ltd.
For 20-Year Return Period
6.0)47.5(43.338
+=
ti
For 100-Year Return Period
57.0)24.2(95.339
+=
ti
where, i = Rainfall intensity (mm/hr) t = Time duration (min)
On the other hand, the rainfall records of Gonbade Kawoos show that in one-day there were: less than 6 hours rainfall on 1996 flood day, a bit greater than 6 hours rainfall on 2001 flood day; and less than 6 hours rainfall on 2002 flood day. Further, on line rainfall data of Tangrah for the 2005 Flood were available. The online data show total rain duration was 11 hours at Tangrah during the 2005 Flood. But in-between 11 hours rain duration 3 hours have nominal rainfalls. Considering these facts, 2-day sub-basins rainfalls were distributed in 9 hours. Thus, based on the rainfall intensity curves, symmetric or centralized hourly rainfalls distribution patterns up to 9 hours were developed for 20- and 100-year return periods (Fig. 2.74). While analyzing the rainfall intensity at Tangrah during the 2005 Flood, it also shows that rain was distributed in more or less symmetric manner. Moreover, percentages of rain occurred on the first and second days during the past 5 major flood events were analyzed (Tables 2.41 and 2.42). Based on these percentages, rain was distributed between the first and second days to develop time distribution of rain. In this way, 9 hours time distribution patterns of rainfalls were developed to distribute 2-day sub-basin rains to be used in MIKE SHE for river flows estimations with 25-, 50- and 100-year return periods.
For time distribution of rainfall during the 2005 Flood, online rainfall data of Tangrah with 10 minutes intervals were used. Using the online rainfall data of 10 minutes intervals at Tangrah, river flows are estimated for the 2005 Flood.
0
5
10
15
20
25
30
35
1 2 3 4 5 6 7 8 9Duration (Hrs)
Rai
nfal
l Int
ensi
ty (m
m/h
r)
100 Years 20 Years
I = 339.95 / (t + 2.24) 0.57
I = 338.43 / (t + 5.47) 0.60
Fig. 2.73 Rainfall Intensity Curves of Gorgan (20- and 100-Year Return Periods)

The Study on Flood and Debris Flow in the Caspian Coastal Area Main Report I (Master Plan)focusing on the Flood-hit Region in Golestan Province Chapter 2
JICA CTI Engineering International Co., Ltd. 2 - 91
0.00
0.05
0.10
0.15
0.20
0.25
0.30
0.35
0.40
0.45
8 6 4 2 1 3 5 7 9
Hour of Rainfall (Hr)
Frac
tion
of T
otal
Rai
nfal
l
20 Years Return Period
0.00
0.05
0.10
0.15
0.20
0.25
0.30
0.35
0.40
0.45
8 6 4 2 1 3 5 7 9
Hour of Rainfall (Hr)
Frac
tion
of T
otal
Rai
nfal
l
100 Years Return Period
Fig. 2.74 Rainfall Distribution Pattern of Gorgan (20- and 100- Year Return Periods)
Table 2.41 Daily Rainfall at Stations during the Past Floods
FloodYear Day Tangrah
ChesmehKhan
RobatGharebil Pishkamar Galikesh Tilabad
DashtShad
DashtKalpoush Soodaghleen Nardin
1-Apr 72.0 0.0 0.0 41.0 0.0 8.52-Apr 56.0 5.0 3.5 12.0 38.0 10.0
13-May 46.0 23.0 16.0 0.0 68.0 32.514-May 81.0 7.0 11.0 90.0 84.5 4.510-Aug 0.0 0.0 4.5 0.0 4.0 9.5 0.0 50.0 21.2 0.011-Aug 150.0 84.0 11.5 50.3 15.0 8.0 176.0 100.0 117.0 30.012-Aug 23.5 0.0 0.0 8.1 32.0 4.5 0.0 0.0 13.6 0.013-Aug 30.0 16.0 2.5 0.0 74.0 11.0 108.0 60.0 33.4 25.09-Aug 0.0 0.0 0.0 0.0 0.0 13.0 0.0 0.0 0.0 0.0
10-Aug 136.9 85.0 17.5 32.8 7.0 14.0 113.0 98.0 110.0 12.0
Rainfall (mm/d)
1988
1992
2001
2002
2005
Table 2.42 Daily Basin and Sub-Basin Rainfall during the Past Floods
Flood Day BasinYear 1 2 3 4 5 6 7 8
1-Apr 28 24 0 11 55 53 50 37 42-Apr 26 22 4 13 44 42 48 19 35
13-May 33 32 18 27 41 40 49 13 6114-May 44 30 10 18 64 61 83 89 8510-Aug 11 12 5 42 20 18 1 1 411-Aug 86 82 36 105 145 135 114 52 1912-Aug 8 5 0 4 0 11 20 13 3013-Aug 38 31 8 52 88 53 53 13 679-Aug 0 0 0 0 0 0 0 0 0
10-Aug 75 72 40 102 107 118 93 37 10
2001
2002
Basin and Sub - Basin Rainfalls (mm/d)Sub-Basin
1988
2005
1992
Comparison of Time Distribution Patterns of Rainfall
The general 9 hours time distribution pattern of rainfall, developed with the help of rainfall intensity curves of Gorgan for 20- and 100-year return periods, is compared with time distribution pattern of rainfall at Tangrah during the 2005 Flood (Fig. 2.75). Non-dimensional comparison of rainfall patterns show in the 2005 Flood quite intense rain has occurred at third hour of rainfall at Tangrah; and about 76% of total rainfall has occurred within first 4 hours of rainfall. Meanwhile the developed 9 hours rainfall distribution patterns for 20- and 100-year return periods show intense rain occurs at fifth hour of rainfall; and about 78% of total rain occurs within 5.5 hours.

Main Report I (Master Plan) The Study on Flood and Debris Flow in the Caspian Coastal Area Chapter 2 focusing on the Flood-hit Region in Golestan Province
2 - 92 JICA CTI Engineering International Co., Ltd.
0.00.10.20.30.40.50.60.70.80.91.0
1 2 3 4 5 6 7 8 9 10 11
Rain Duration (Hr)
Frac
tion
of T
otal
Rai
nfal
lTangrah 2005Gorgan 100 yrsGorgan 20 yrs
Fig. 2.75 Comparison of Rainfall Distribution Pattern
2.6.7 Analysis of River Discharge The time series data of river discharge was only available for Tangrah station in the basin. The annual maximum discharges at Tangrah were derived from daily time series discharge data (Table 2.43). The annual maximum discharges of 33 years (1970-2002) at Tangrah were analyzed by various probability distribution functions. However, it is quite difficult to get good-fit functions for the time series data of the annual maximum discharge at Tangrah. It indicates that observed data are not consistent with one year to others and reliability of data is not so good. Generalized Extreme Value (GEV) probability distribution function has only better good-fit with time series than other distribution functions (Fig. 2.76). The probable discharges estimated by the GEV at various return periods are presented (Table 2.44). The estimated probable discharges at 25-, 50-, 100-, 200- and 400-year return periods are 222, 398, 731, 1,336 and 2,440 m3/s, respectively.
Table 2.43 Annual Maximum Discharge at Tangrah Station
DateMax Q(m3/s)
DateMax Q(m3/s)
DateMax Q(m3/s)
1970/03/24 1 1981/09/27 129 1992/05/13 1131971/04/21 13 1982/04/09 12 1993/03/09 301972/04/20 9 1983/04/09 8 1994/03/28 311973/04/04 19 1984/05/02 12 1995/04/25 191974/11/01 20 1985/03/21 10 1996/04/16 171975/03/28 29 1986/04/03 10 1997/05/06 111976/04/27 19 1987/04/05 27 1998/03/19 201977/03/21 6 1988/04/02 43 1999/03/25 181978/04/16 10 1989/04/30 43 2000/03/25 101979/05/11 5 1990/05/14 10 2001/08/11 1,6501980/10/21 15 1991/05/25 23 2002/08/13 700

The Study on Flood and Debris Flow in the Caspian Coastal Area Main Report I (Master Plan)focusing on the Flood-hit Region in Golestan Province Chapter 2
JICA CTI Engineering International Co., Ltd. 2 - 93
Fig. 2.76 Probability Analysis of Annual Maximum Discharge at Tangrah
Table 2.44 Probable Discharge at Tangrah Station
2 - Yrs 5 - Yrs 10 - Yrs 20 - Yrs 25 - Yrs 50 - Yrs 100 - Yrs 150 - Yrs 200 - Yrs 400 - YrsProbale Q (m3/s) 17 48 94 177 222 398 731 1041 1336 2440
Return PeriodItem
Discrepancies and Clarification
When the 2001 flood event is analyzed from the annual maximum discharge series at Tangrah, it shows that the flood event has about 250-year return period. However, if the 2001 flood event is analyzed from the annual maximum basin rainfalls series, it shows that the flood event has about 55-year return period. Therefore, it shows that rainfall and discharge data of the basin are not consistent with each other. The one of the reasons originating the big differences is differences of recorded periods; rainfall data from 1974 to 2005, and discharge data from 1970 to 2002. Thus discharge data exclude the latest 2005 Flood due to lack of observed or estimated peak discharge.
As mentioned before, distribution functions are good–fit with the annual maximum basin rainfalls series. It indicates rainfall data of stations in the basin are consistent and more

Main Report I (Master Plan) The Study on Flood and Debris Flow in the Caspian Coastal Area Chapter 2 focusing on the Flood-hit Region in Golestan Province
2 - 94 JICA CTI Engineering International Co., Ltd.
reliable. Similarly, if we input 2-day sub- basins rainfalls data of the 2001 and 2005 flood events into MIKE SHE model and generate river flows, then we get estimated and model generated flow hydrographs as well as peak flows match well at Golestan Dam, Tangrah and Dasht Bridge. It also verifies that rainfall data are reliable. Therefore, sub-basins rainfalls data are used in the model for estimation of design discharges in river system in the basin to be used in flood control master plan development.
2.6.8 Hydrological Modeling Introduction
An integrated and distributed MIKE SHE hydrological model is used to evaluate rainfall-runoff process in the Madarsoo River basin. The model is able to analyze impacts of watershed management practices, land use, soil types, topographic features, flow regulation structures, etc. over the basin on river flows. For this, MIKE SHE model was coupled with MIKE 11 river modeling system to simulate flows in the river system. Inflows and hydrodynamic processes in rivers are taken into consideration for model development. The model computes river flows taking account of overland flow, interflow and base-flow.
An integrated and distributed hydrological model MIKE SHE was set up for the Madarsoo River basin for the following reasons:
(1) To generate probable or design discharges precisely in the river system to assist on flood control master plan development,
(2) To analyze the impacts of watershed management practices and biological measures of flood mitigation by quantifying river flows under these circumstances, and
(3) To analyze the impact of incorporation of flood regulation structures like dam in the river system to reduce peak flows.
Model Calibration
The purpose of calibration is to achieve an acceptable agreement between measured and model estimated values by adjusting model parameters within the acceptable range because describing physical processes in nature by means of mathematical equations is a difficult job. Therefore, the model is calibrated with adjusting model parameters to get best-fit estimations with observed ones. In this project, MIKE SHE hydrological model is calibrated with taking reference of observed hourly discharges in the Madarsoo River at Dasht Bridge during the 2005 flood event. The hourly discharges at the bridge were estimated based on online water levels and Broad Crested Weir formula. However, the more hydrological stations available in the basin for using observed data of those stations as references in the model calibration the better model parameters can be established at sub-basin level. Calibration results show peak flow as well as shape of hydrographs of observed and MIKE SHE simulated flows are matching quite well. Peak flow simulated by model is 744 m3/s where as observed is 725 m3/s at Dasht Bridge in the 2005 flood event (Fig. 2.77). Slight shift between observed and model simulated hydrographs is due to not aligned time distribution pattern of rainfall. Simulated peak flows in river system by model for the 2005 flood event are: 430 m3/s in Gelman Dareh; 127 m3/s in Dasht-e-Sheikh; 165 m3/s in Ghiz Ghale; 43 m3/s in Chesmeh Khan; 1,060 m3/s at Tangrah (Fig. 2.78).

The Study on Flood and Debris Flow in the Caspian Coastal Area Main Report I (Master Plan)focusing on the Flood-hit Region in Golestan Province Chapter 2
JICA CTI Engineering International Co., Ltd. 2 - 95
Fig. 2.77 Observed and Model Simulated Discharges at Dasht Bridge (10 August 2005)
Fig. 2.78 Peak Flows Simulated by Model in River System (10 August 2005)
Parameters were optimized in calibration process to get best-fit river flow generation with the observed flows. The optimized values of parameters are presented in previous section. Some of the optimized parameters were:
Infiltration rate: It controls percolation of water from upper soil surface to sub-soil.
Interflow time constant: It is used to control shape of flood hydrograph, small values of time constant gives fast response (steep hydrograph) to rainfall, while large values of time constant gives slow response to rainfall, thereby, gives a much more widened hydrograph.
Percolation time constant: It controls water percolation to the baseflow reservoir. Lower percolation time constant gives lower peak and widens the hydrograph as water is allowed to percolate faster and will be stored in the baseflow reservoir.
Baseflow time constant: It controls the percolation of water from baseflow reservoir to rivers.

Main Report I (Master Plan) The Study on Flood and Debris Flow in the Caspian Coastal Area Chapter 2 focusing on the Flood-hit Region in Golestan Province
2 - 96 JICA CTI Engineering International Co., Ltd.
Overland roughness coefficient: Smooth surface allows more water to flow down gradient as overland flow, whereas a rough surface allows more water to infiltrate. Therefore, roughness coefficient is closely related to the land use.
Model Verification
The estimated hourly discharges at Tangrah and estimated hourly inflows into the Golestan Dam from the Madarsoo River in the 2001 flood are used for model verification.
(1) Tangrah Station’s Discharges as Reference
The hourly discharges at Tangrah station were estimated for the 2001 flood event. The estimated discharges seem not so bad, because the estimated discharges at station were cross checked with inflows into the Golestan Dam during the flood event and also cross checked with computing runoff coefficient. Therefore, the estimated hourly discharges at the station are taken as reference for model verification. Result shows shape of estimated and model generated discharge hydrographs are matching quite well to each other. The slight discrepancies between estimated and model generated peak flows is due to including some error in estimated discharge, and slight shift between estimated and model generated discharge hydrographs is due to not aligned time distribution pattern of rainfall (Fig. 2.79). Result shows estimated peak discharge is 1,650 m3/s where as model generated is 1,873 m3/s.
Fig. 2.79 Estimated and MIKE SHE Generated Flows at Tangrah (11 August 2001)
(2) Golestan Dam Reservoir Inflows as Reference
Hourly inflows into the Golestan Dam reservoir from the Madarsoo River were estimated for the 2001 flood event from reservoir storage curve and water levels changes in the reservoir. The estimated inflows into the reservoir were crosschecked with discharges at Tangrah (Madarsoo River), Galikesh (Oghan River) and Hojigoushan (Gorgan River). The estimated hourly inflows into the Golestan Dam reservoir from the Madarsoo River were also taken as reference for model verification. Result shows that estimated (from reservoir storage curve) and model generated peak inflows into the reservoir as well as shape of hydrographs are matching well to each other. The estimated peak inflow is 2,116 m3/s whereas peak inflow generated by MIKE SHE model is 2,095 m3/s (Fig. 2.80). As mentioned above, slight shift between the estimated and model generated hydrographs is due to not aligned time distribution pattern of rainfalls.

The Study on Flood and Debris Flow in the Caspian Coastal Area Main Report I (Master Plan)focusing on the Flood-hit Region in Golestan Province Chapter 2
JICA CTI Engineering International Co., Ltd. 2 - 97
Fig. 2.80 Estimated and MIKE SHE Generated Inflows into Golestan Dam Reservoir from Madarsoo River (11 August 2001)
MIKE SHE generated peak flows in river system during the 2001 flood events are presented in Fig. 2.81. The model simulated peak flows in the river system are: 654 m3/s in Gelman Dareh; 226 m3/s in Dasht-e-Sheikh; 289 m3/s in Ghiz Ghale; 60 m3/s in Cheshmeh Khan; 1,266 m3/s at the entrance of Golestan Forest, 1,873 m3/s at Tangrah; 2,195 m3/s at Dar Abad; 2,095 m3/s at Golestan Dam.
Fig. 2.81 Peak Flows Simulated by Model in River System (11 August 2001)